1. Introduction
Given the intermittent nature of renewable energy sources (RESs) such as solar and wind energy, coupled with the growing electrification of various sectors including mobility, heating, and industry, achieving a substantial RES capacity necessitates several key strategies [
1]. These strategies involve enhancing energy efficiency measures in demand and supply sectors, implementing negative emissions technologies to mitigate future RES expansion emissions [
2], establishing flexible dispatchable power generation for balancing needs, and deploying energy storage solutions [
3] to meet both short-term and long-term flexibility requirements.
Producing green hydrogen from the surplus power originating from RESs and utilizing them for seasonal storage represents a viable pathway to achieve carbon neutrality [
4]. It functions by storing otherwise unusable electricity in the form of hydrogen generated due to weather fluctuations and temperature variations, such as increased wind speeds in winter and higher solar radiation levels in summer. Furthermore, seasonal storage contributes to grid resilience by securing ample long-term energy reserves to address unexpected emergencies, such as sudden spikes in demand.
Green hydrogen generated through the electrolysis of surplus renewable energy, serves as a clean, carbon-neutral fuel with the potential to decarbonize not only the energy sector but also challenging-to-decarbonize sectors like heavy duty transportation and industry. However, its physical characteristics pose challenges for large-scale storage and transportation in grid-scale energy storage applications due to its low molecular weight, boiling point, and volumetric density. Current infrastructure limitations hinder the widespread transport of hydrogen within existing gas grids. Although hydrogen can be injected into natural gas pipelines, blending mandates (i.e., maximum allowable percentage of hydrogen in the gas grid) remain relatively low, such as 10 vol.% in Germany and 6 vol.% in France [
5].
An alternative approach involves converting excess renewable energy into synthetic fuels, leveraging established production processes, and infrastructure for transportation, storage, and distribution. Methane and methanol [
6] stand out as primary synthetic fuels under evaluation as secondary energy carriers, widely utilized by both the energy and industrial sectors.
Synthetic natural gas (SNG) is generated through either thermochemical methanation (known as the Sabatier reaction) or bio-methanation utilizing hydrogenotrophic methanogenic archaea [
7]. Both methods rely on renewable hydrogen and carbon dioxide as input materials. The Sabatier reaction entails a two-step process conducted in a catalytic reactor, operating at temperatures ranging from 150 to 550 °C and pressures of up to 100 bar [
8]. This highly exothermic reaction is notably sensitive to thermodynamic variations, with lower temperatures preferred for maximizing methane yield.
Methanol emerges as a compelling option for energy storage due to its liquid state under ambient conditions, enhancing cost-effectiveness in transportation and distribution. Research indicates its potential for higher overall efficiency compared to SNG. Methanol synthesis involves a catalytic reaction utilizing hydrogen, carbon dioxide, or carbon monoxide as inputs. This exothermic process occurs at pressures of 60–80 bar and high temperatures ranging from 200 to 450 °C in commercial settings [
9].
Recently, Moioli et al. [
6] conducted a techno-economic analysis of seasonal storage using methane or methanol. The study examined the valorization of biogas for long-term seasonal storage in the form of methane or methanol for electricity generation or hydrogen end users. It was assessed that methane could be employed for electricity generation in a combined heat and power (CHP), with an efficiency of 55%. Conversely, for methanol, direct methanol fuel cells (DMFCs) were evaluated with an efficiency of 45%. It was concluded that methane is the preferred option for energy storage aimed at electricity production, whereas methanol is more suitable for hydrogen production. DMFCs are primarily utilized in portable devices and auxiliary power applications ranging from milliwatts to watts due to their ability to operate at low temperatures and their simple construction. Although there are efforts to develop high-power stacked DMFCs at a scale of some 100 kWs, currently there is no supplier offering DMFCs at MW scales. Consequently, DMFCs are not considered a viable option for grid balancing applications.
Supercritical carbon dioxide (sCO
2) power generation gas turbines represent a cutting-edge advancement in energy technology, offering enhanced efficiency and environmental benefits. These turbines operate using CO
2 at supercritical conditions, where it exhibits unique properties that combine the density of a liquid with the viscosity of a gas, improving thermal efficiency and heat transfer capabilities [
10]. In the sCO
2 cycle, CO
2 is pressurized and heated to supercritical state, then expanded through a turbine to generate power. This process can achieve higher thermal efficiencies compared to traditional steam cycles, while also reducing greenhouse gas emissions and water usage. The compact size and operational flexibility of sCO
2 turbines make them suitable for various applications, including waste heat recovery and integration with renewable energy sources. Gaseous and liquid fuels such as hydrogen, methane, and methanol can be fed directly into these gas turbines. Brown et al. [
11] conducted a comparative analysis of various seasonal storage scenarios involving methanol and hydrogen in the UK, Germany, and Spain. Hydrogen storage was assumed to utilize H
2 pressure vessels and H
2 salt caverns, with power generation achieved through a combined cycle gas turbine. The average system electricity costs ranged from 62 to 165 EUR/MWh. The levelized cost of electricity via the Methanol Allam GT was estimated at 77, 86, and 94 EUR/MWh in Spain, the UK, and Germany, respectively.
Baak et al. [
10] conducted a comprehensive assessment of the viability of a methanol-fed supercritical carbon dioxide gas turbine (sCO
2-GT) CHP system for grid-balancing energy storage applications, with an input power capacity of 50 MW
el. The evaluated system included a PEM electrolyzer for hydrogen production, followed by a recirculating catalytic synthesis reactor for methanol generation, and a supercritical carbon dioxide gas turbine. The theoretical analysis revealed a system energy efficiency of 26.5% and a levelized cost of storage estimated at 250 USD/MWh.
The EU project HERMES [
12] aims to develop a closed-loop supercritical zero-emission gas turbine (s-GT) CHP system with high electrical efficiency of up to 65%. This innovative system relies on locally produced renewable liquid and gaseous fuels, such as hydrogen, methane, methanol, or a blend of the liquid and gaseous fuels. The project is also developing an innovative low-pressure (≤30 bar) methanol synthesis processes, which can be coupled with the power system. In large-scale methanol synthesis, high pressure is traditionally employed to overcome thermodynamic limitations. However, when scaling down for local closed-loop energy systems, maintaining such pressures becomes unfavorable due to increased costs and energy efficiency losses. This integration promises renewable, highly efficient, and zero-emission combustion, providing a flexible and decentralized energy generation system for heating and cooling applications.
This article assesses a case study wherein PV and wind turbines are deployed to fulfill the electricity demand for a community of 5000–6000 inhabitants, with surplus electricity directed towards a seasonal storage system. This system comprises an electrolysis unit responsible for hydrogen production, a methanol synthesis plant utilizing hydrogen from the electrolysis system and carbon dioxide assumed to be sourced from a biogas plant in the vicinity. The generated methanol is stored and subsequently utilized in the HERMES supercritical gas turbine to satisfy electricity demand as needed. The principal emphasis of this study lies in assessing the feasibility and cost associated with hydrogen, methanol, and electricity generation through the seasonal energy storage (SES) system. The sizes of the units are calculated, and the dynamic behavior of each unit is evaluated, followed by a comprehensive techno-economic analysis. Furthermore, a sensitivity analysis explores the influence of various boundary conditions (CAPEX, OPEX, electricity price, etc.) on the energy flux management system. Three pivotal values emerge as the comparative values of our assessment: the optimal sizing of different components, the extent of energy coverage achieved and the overarching efficiency of the systems.
2. Methodology
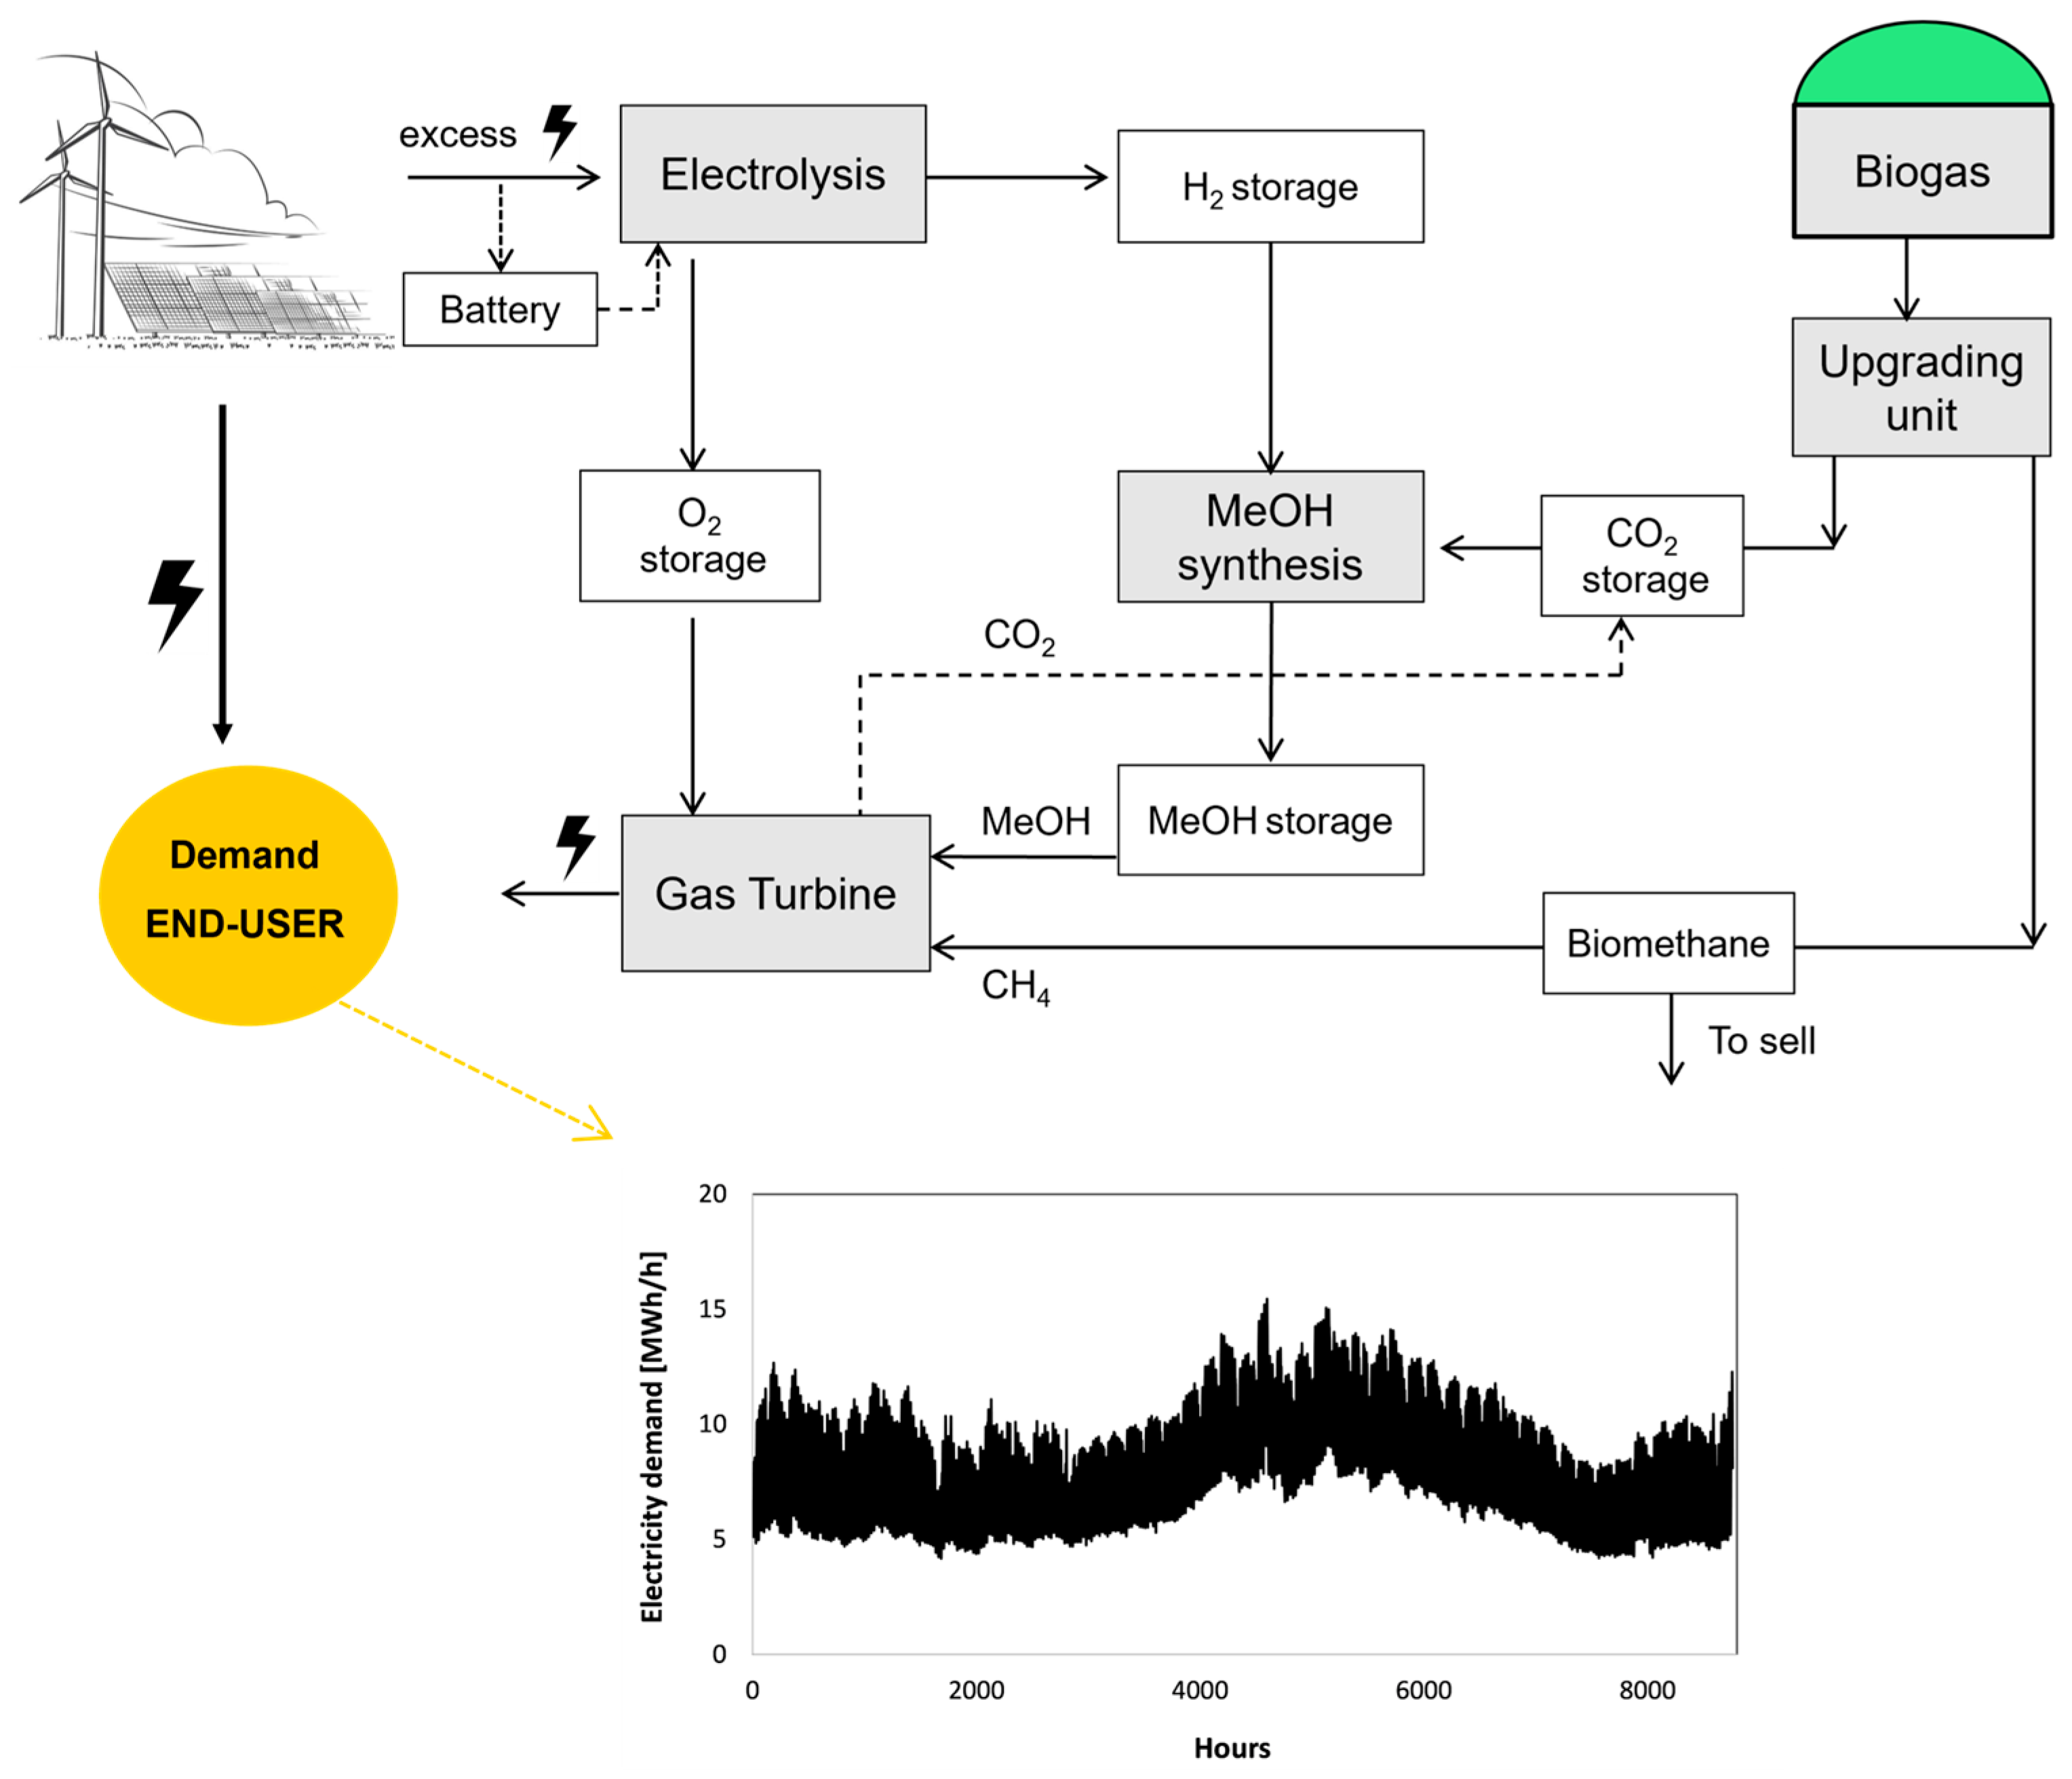
The selected case study was designed for a community of 5–6 thousand residents on the island of Crete, Greece with the consumption of 5–15 MWh/h. The conceptualization of the energy system and the electricity demand profile are illustrated in
Figure 1. Renewable electricity is primarily allocated for end-user consumption, with any surplus directed to a chemical synthesis unit. Within this unit, excess electricity powers an electrolysis process to produce hydrogen. The generated hydrogen is then channeled into a methanol synthesis unit, where it reacts with CO
2 to form methanol (MeOH).
Biogas was evaluated as a source of CO
2, capitalizing on the economic recovery of CO
2 through power-to-X coupling integrated with biogas upgrading for biomethane production [
13]. Methanol, biomethane, or a combination thereof is employed for electricity generation in a s-GT CHP system to fill the gap in the electricity demand. Biomethane is produced by converting the biogas in the upgrading unit, where the CO
2 is removed from the biogas. The biomethane is subsequently employed as a fuel for the s-GT system, and any surplus is sold to the market. The biogas plant is sized based on the CO
2 demand. In addition, to better exploit the PV and wind system and reduce the electrical energy imported from the grid, a battery storage system is also considered.
2.1. System Modeling
The algorithm for the calculation is depicted in
Figure 2. Utilizing hourly weather data, the load factor and total renewable electricity production (referred to as E
el in the figure) can be calculated, given the installed capacities of PV and wind. Concurrently, the algorithm labels the hourly electricity demand as E
demand.
Should the electricity generated surpass on-site demand, the surplus (Eexcess) is directed towards the SES system. Subsequently, an assessment is made to determine if the excess electricity exceeds the minimum load required for electrolysis operation. Should this condition be met, the surplus electricity is utilized to produce hydrogen. In instances where the excess electricity surpasses the electrolysis capacity, the surplus is stored in the battery and discharged when demand exceeds the minimum load for electrolysis operation. Hydrogen is stored in a buffer tank before undergoing MeOH synthesis. Once there is a sufficient amount of hydrogen to operate MeOH synthesis above its minimum load, the synthesis process commences. The produced MeOH is then stored in a designated tank for future utilization.
In scenarios where the electricity demand from the community exceeds that generated by renewable sources (PV + wind), electricity is produced by the s-GT CHP system. The required energy in the form of MeOH (E
MeOH,req) is determined accordingly. Subsequently, the MeOH tank’s level is assessed and compared to the required MeOH amount. Should the MeOH quantity fall short, biomethane from the biogas upgrading unit is utilized to supplement the remaining demand. Both MeOH and biomethane can be concurrently employed in the s-GT CHP system. However, if MeOH is unavailable, biomethane becomes the primary fuel source. Additionally, if a blend is utilized, the methane-to-MeOH ratio must not exceed 50 wt.% or adhere to the energy content ratio E
CH4/E
MeOH < 2.4, a constraint stipulated by the gas turbine specifications [
14].
2.1.1. Methanol Synthesis Unit
For this analysis, a catalytic methanol synthesis reactor is considered, specifically the one analyzed Moioli et al. [
15]. The main reaction that takes place is the hydrogenation of carbon dioxide over the commercial Cu/ZnO/Al
2O
3 catalyst:
The conversion of CO
2 into MeOH is traditionally operated at around 250 °C and pressures between 50 and 100 bars to overcome thermodynamic constraints, especially when using CO
2 as a feedstock, leading to low conversion rates per pass [
16,
17,
18]. However, the requirement for high-pressure (OPEX), the necessary equipment (CAPEX), and the associated costs limit the economic feasibility of smaller-scale processes for decentralized methanol synthesis, coupling CO
2 biogenic gasses and green hydrogen. In the standard process for methanol synthesis, the latter are produced using fossil fuels, e.g., from the steam reforming of natural gas. This allows for low-cost compression when hot gasses coming from the reforming unit are cooled which raises steam that is fed into a turbine [
17]. The absence of this step for the synthesis of renewable methanol results in energy efficiency losses because electricity has to be used for the compression work. Therefore, in the innovative system, pressure is limited to 30 bars, representing the common pressure at which green H
2 is supplied from the electrolyzer [
18]. Nonetheless, effective reactor design can overcome these limitations at 30 bar, resulting in high overall MeOH yields through methods like intermediate condensation [
19], multistage reactors [
20], or in situ product removal through integration of membranes [
21] or sorbents with batch-wise regeneration [
22] in fixed-bed reactors.
An alternative approach involves the continuous addition and removal of sorbents, bypassing the sealing and material stability challenges of membrane reactors. This technique enables a more compact design compared to fixed-bed reactors, with regeneration in a separate vessel. The continuous sorbent entrainment through the catalyst bed (that is kept in bubbling fluidization) allows smaller reactors as no volume for saturated sorbent is needed (unlike in fixed-bed configurations). Therefore, further, continuous, and thus facilitated, operation is achieved. In the simulation, we assume a stoichiometric ratio of 3 moles of H2 to CO2. For simplicity, the full conversion of the reactants to the product is considered, i.e., the number of mols for CO2 and MeOH are equal. The minimum load of MeOH synthesis is considered to be 20%.
2.1.2. Electrolysis Unit
The hydrogen needed for the MeOH reaction is produced through the electrolysis of water. Two commercially available electrolyzer systems are the alkaline electrolysis system (AEL) and the proton exchange membrane (PEM) system. Presently, they offer comparable efficiencies, with the PEM system holding greater potential for future efficiency improvements. A PEM electrolyzer capable of operating under pressures of up to 35 bar for hydrogen production is used. The rapid dynamic response characteristics of PEM electrolysers render them an appropriate selection, particularly when dealing with power supply fluctuations, such as those associated with variable renewable energy sources.
The electricity consumption of an electrolyzer can be characterized as the electrical power requirement per unit of hydrogen generated. This metric is influenced by the operational state of the electrolyzer. It is important to note that this maximum efficiency is achieved when the electrolyzer operates at partial load [
23]. At peak power, the efficiency can be up to 20% lower. In this study, a performance curve is incorporated into the model to represent the specific electricity consumption of the electrolyzer, with the operating power serving as the determining factor [
24]. The minimum load of electrolysis is considered to be 15% and the maximum load of 100%.
2.1.3. Supercritical Gas Turbine
Gas turbine systems are power generation systems that operate based on the principles of the Brayton cycle. The primary components of these systems include a compressor, combustor, and turbine. Traditionally, gas turbine systems utilize air as the working fluid. However, there has been notable research interest in supercritical carbon dioxide (sCO
2) gas turbine systems due to their superior thermal efficiency, streamlined and compact design, and operational versatility, enabling them to efficiently accommodate the intermittency of renewable energy sources. Gas turbine efficiency varies based on type and size. According to Boyce [
25] heavy-duty gas turbines (up to 480 MW) achieve 48% efficiency in simple-cycle and 60% in combined cycle configurations. Aircraft-derivative gas turbines (2.5 to 50 MW) reach 35% to 45% efficiency. Industrial-type gas turbines (2.5 to 15 MW) achieve 30% efficiency, up to 40% with a regenerator. Small gas turbines (0.5 to 2.5 MW) range from 15% to 25% in simple-cycle and 30% to 35% in regenerated cycle applications.
Gas turbine cycles can be categorized into open and closed configurations. In an open cycle, fuel combustion occurs directly, and the resulting exhaust gases are released into the environment. Conversely, in a closed cycle, the working fluid goes through a heat exchanger, utilizing an external heat source like an external combustor or concentrated solar energy. Open cycles facilitate the attainment of high gas turbine inlet temperatures, whereas closed cycles are capable of operating at elevated pressures.
Various working fluids, including air, CO2, and Xe, can be utilized in closed cycle gas turbines. CO2 is particularly advantageous due to its high density at the critical point (467.6 kg/m3) which occurs at a pressure of 73.8 bar and a temperature of 31 °C. In the supercritical region, CO2 exhibits high density, with no distinct boundary between liquid and gas phases. Compression in a CO2 power cycle occurs near the critical point, resulting in reduced compression work and increased cycle thermal efficiency. Additionally, the compactness of the system is enhanced by CO2’s high density, making CO2 power systems approximately ten times smaller in size compared to conventional air gas turbines, for the same power output.
Various sCO
2 gas turbine research initiatives are underway. The STEP 10 MWe pilot demo project, located at the Southwest Research Institute’s San Antonio campus, showcases indirectly fired sCO
2 cycles with temperatures reaching 700 °C and pressures of 250 bar, achieving over 50% efficiency and advancing from TRL 3 to 7 [
26,
27]. NET Power demonstrated sCO
2 gas turbines with oxy-fuel combustion on a 50 MWth test facility and is progressing to a 300 MWe utility-scale natural gas-fired sCO
2 turbine, achieving 59% efficiency [
28]. This cycle operates between 30 bar and 300 bar with an inlet temperature of 1150 °C.
The implementation of the supercritical CO
2 gas turbine within the HERMES system operates on the following principle. Supercritical CO
2 undergoes recirculation throughout the compressor, regenerator, combustor, and turbine stages. Renewable fuels such as MeOH or H
2, along with oxygen, are introduced into the system, while combustion byproducts, including water vapor and CO
2, are expelled. Within the compressor, supercritical CO
2 at 75 bar and 45 °C is elevated to high-pressure conditions, approximately 200 bar, with minimal work required due to the small pressure ratio and utilization of highly dense supercritical fluid. The regenerator utilizes heat from the turbine exit to preheat the supercritical CO
2 to high temperatures. In the combustion chamber, renewable fuels and oxygen are combined, resulting in high gas turbine inlet temperatures reaching around 1200 °C. The heated supercritical CO
2 and combustion products then undergo expansion in the turbine, reducing the pressure to 75 bar. Heat transfer via the regenerator occurs, transferring heat from the compressor’s outlet flow. Water is subsequently condensed and removed from the system at 75 bar and 40 °C. Excess CO
2 is separated, leaving pure supercritical CO
2 to be compressed under high-pressure conditions for the continuation of the cycle. The HERMES system offers numerous advantages, including zero pollutant emissions, complete carbon recovery, high efficiency (65%), compact design, rapid response time, and operational flexibility. Further information on the HERMES s-GT can be found here [
29].
2.1.4. Photovoltaic and Wind Systems
The capacity factors are calculated based on that described in references [
30,
31] and iprovided by the internet site
www.renewables.ninja (accessed on 10 November 2024). The hourly PV and wind profiles are then evaluated for the year 2019 at the specified locations (Crete island). According to the reference, the Full Load hours (FLh) of PV and wind are 1974 h and 3770 h, respectively.
The approach of Madi et al. [
32] was used to calculate the size of the PV and wind turbine. Several variables were taken into account including annual solar irradiation profile, annual wind profile, demand electricity profile hourly base, purchase electricity price, and CAPEX and OPEX of the PV and wind turbine. The model employs Mixed-Integer Linear Programming (MILP), a method commonly utilizing linear constraints but also accommodating binary and integer variables. In optimizing installed technologies, binary variables are employed to choose the most suitable options. MILP enables the rapid calculation of energy demand and supply for an entire year within a few minutes. The commercial Gurobi Optimizer v10.0.0 is used as the solver. For further details about the MILP model, see
Appendix A.
2.1.5. Battery Storage Unit
To effectively control the electrical energy generated by the PV plant, a Li-ion (lithium-ion) battery storage system is introduced. The calculation of the stored energy in the battery is determined using Equation (2). To safeguard against premature battery wear, there are constraints on the amount of energy that can be stored, defined by the minimum and maximum State of Charge (SOC). These SOC limits are expressed as a percentage of the battery’s rated capacity. In this work, the minimum SOC set at 20% and the maximum at 100%.
where
(in MWh) is the stored energy,
(in MWh) is the battery input power (charging),
(in MWh) the battery output power (discharging),
is the battery charging efficiency, and
is the battery discharging efficiency. Both charging and discharging efficiencies are set at 0.92 in this study [
33].
The summary of technical parameters used for the integrated energy system is shown in
Table 1.
2.2. Economic Analysis
Techno-economic analysis is conducted to assess the feasibility of the plant under investigation. Key economic indicators used to evaluate the energy system’s economic performance include the Levelized Cost Of Product (LCOP) and Levelized Cost Of Electricity (LCOE).
The initial total investment cost (CAPEX, in EUR) at the commencement of the analysis period is derived from the sum of investment costs for each
i-th component, each component’s specific investment costs being detailed in
Table 2. The annual net operating cost (OPEX, in EUR/y) encompasses the cumulative expenses incurred during the operational lifespan of the plant. For each
i-th component, annual Operation and Maintenance (O&M) costs are calculated as a percentage of their respective investment costs. Replacement costs are similarly determined as a percentage of the initial investment costs, accounting for the periodic replacement of key components such as the electrolysis stack over the plant’s operational life.
LCOE calculation involves consideration of financial parameters, including CAPEX, OPEX, project lifetime, and the Weighted Average Cost of Capital (WACC). The total discounted cost over the project’s lifespan (N) is determined, integrating both CAPEX and OPEX while factoring in the time value of money through discounting with the WACC via the term Capital Recovery Factor (crf), Equation (3). This culminates in the derivation of an annualized CAPEX (Equation (4)), elucidating the equivalent yearly payment required to amortize the initial investment with interest. Subsequently, the total annual cost, encompassing both OPEX and annualized CAPEX, is computed.
To derive the LCOE for PV and wind systems, Equation (5) is applied. By inputting the dimensions of the PV and wind installations along with their respective full load hours, one can compute the LCOE for each system. The average LCOE encompassing both PV and wind systems is subsequently determined and reported.
The LCOE
SES for the integrated system encompasses electricity generation from both PV and wind sources, as well as seasonal energy storage. This metric considers the CAPEX and OPEX of the entire system and is computed utilizing Equation (6).
The LCOP
H2 and LCOP
MeOH indicators represent the average cost per unit of the hydrogen and MeOH, respectively. To calculate the LCOP for hydrogen and MeOH, only the CAPEX and OPEX of the involved systems in the process are considered (Equations (7) and (9)). Hydrogen and methanol serve as an intermediate product within the integrated system. According to the algorithm, a constraint must be established for the methanol storage capacity. Any excess methanol produced beyond this storage limit is sold on the market at the LCOP, generating additional revenue.
To assess the economic viability of electricity production using the proposed seasonal energy storage system in future scenarios, we authors projected the costs of key technologies based on the data provided in
Table 3. Anticipated reductions in specific investment costs for these units are expected over the coming decades. We authors delineate the short-term perspective as 2030 and the long-term perspective as 2050.
3. Results and Discussions
3.1. Energy System Assessment
The dimensions and the results of the energy simulation are shown in
Table 4. The nominal sizes of the PV and wind installations are calculated based on the approach of Madi et al. [
32], resulting in values of 20.6 and 16.6, respectively.
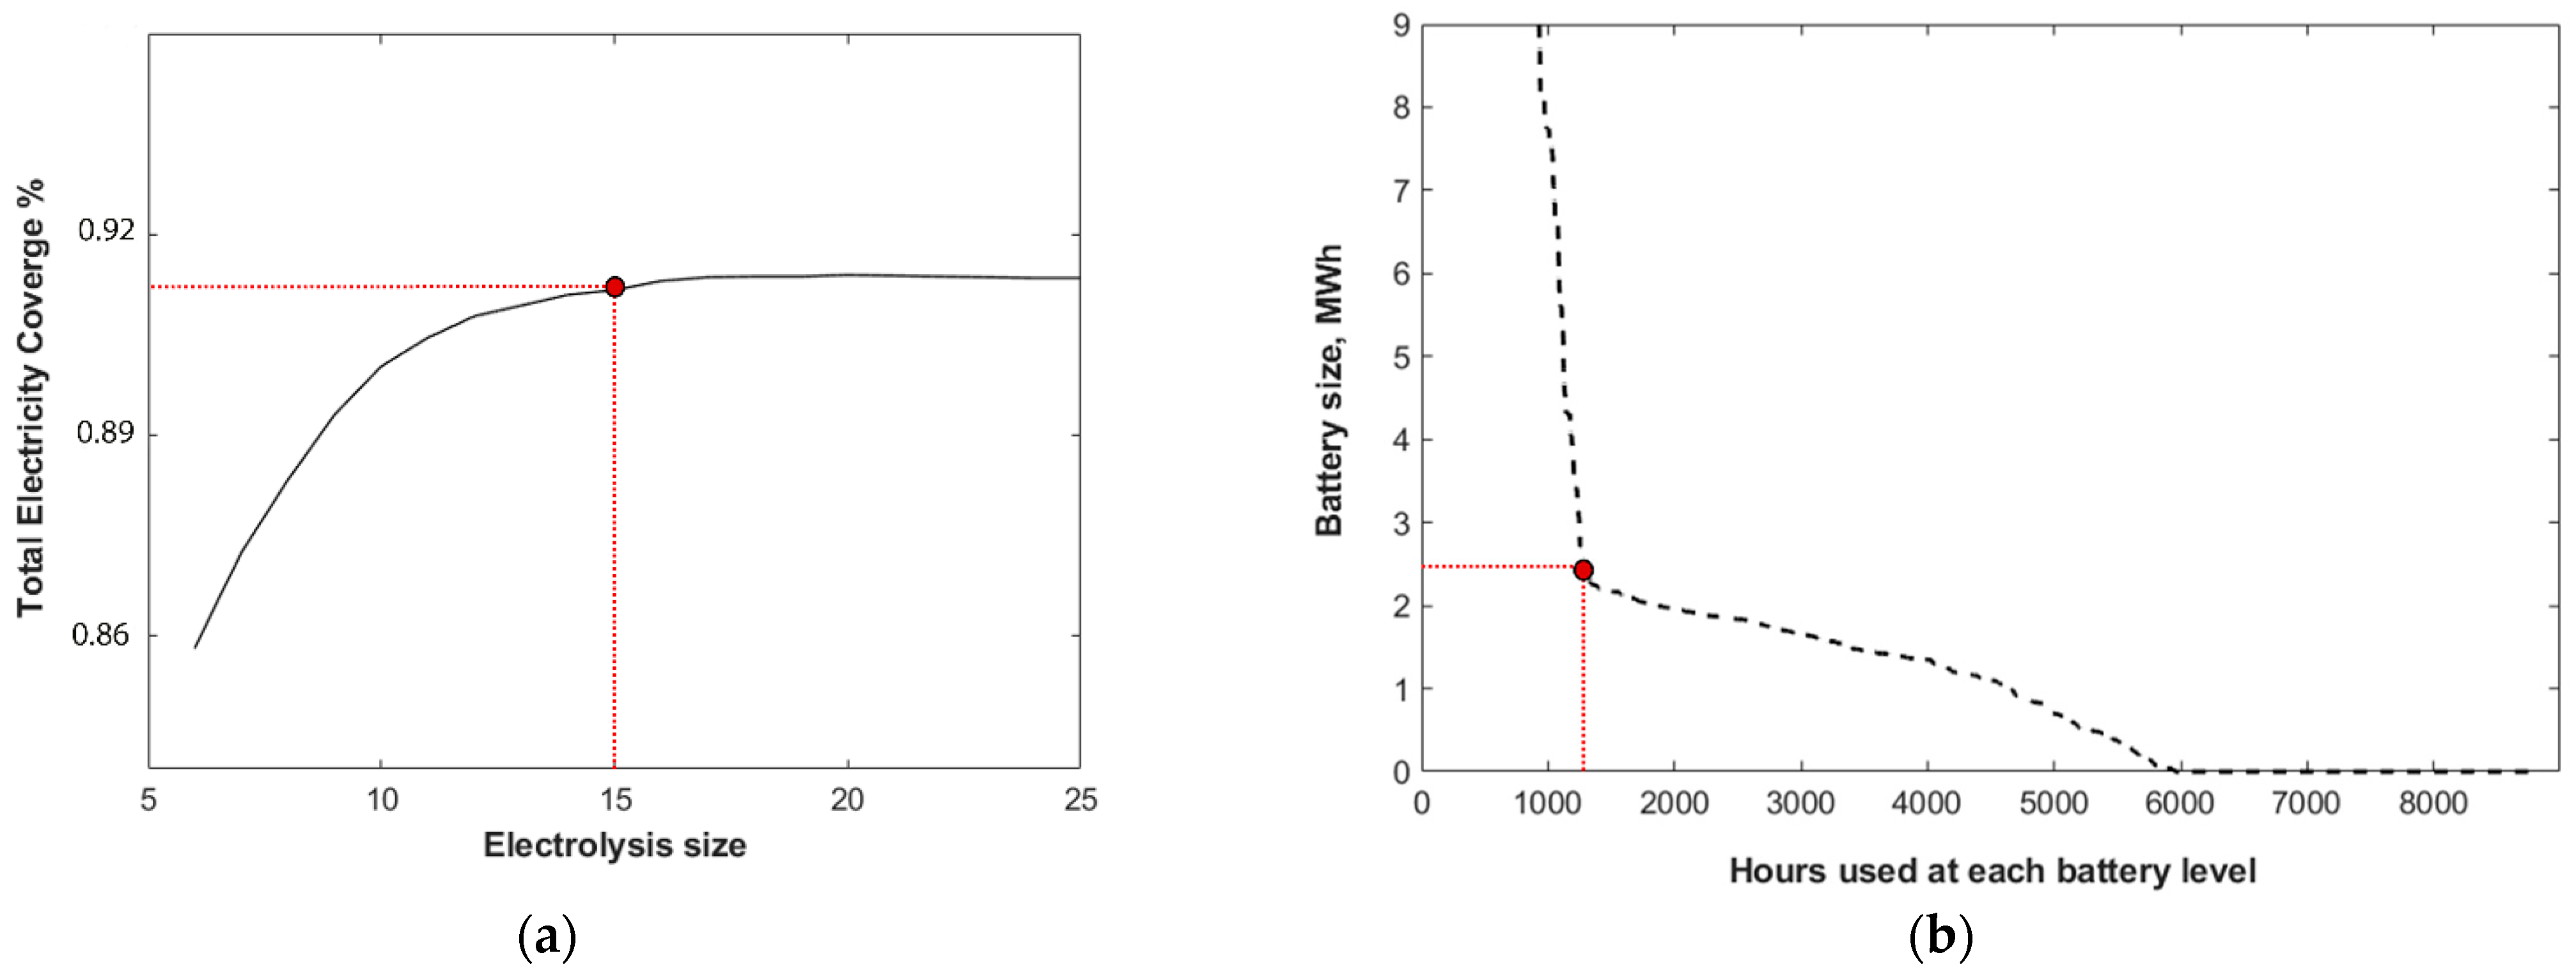
The determination of the optimal electrolysis size involved a sensitivity analysis encompassing various electrolysis capacities and the corresponding total electricity coverage from the storage system, PV and wind system. As depicted in
Figure 3a, the optimal electrolysis size is determined to be 15 MW. Expanding the size of the electrolysis system offers only marginal gains in the annual electricity coverage for the community. Larger electrolysis capacities yield excess hydrogen production, which surpasses the storage system’s requirements. Evaluating the excess electricity profile shown in the next section, only 9% of the time throughout the year does the excess electricity exceed 15 MW. These higher levels of excess electricity can be temporarily stored in the battery. Additionally, considering minimum load requirements adds complexity to the decision-making process. A system size that is too large may result in suboptimal operation during periods of low excess, leading to inefficiencies and resource wastage. Conversely, a size that is too small may struggle to meet demand during peak periods, compromising the overall effectiveness of the system.
The battery serves as a crucial buffer, smoothing out fluctuations in electricity generation and enhancing the overall stability and reliability of the system. Dimensioning the battery storage system necessitated a sensitivity analysis concerning battery size and the duration of battery utilization at different capacity levels. According to
Figure 3b, a battery storage system with a capacity of 2.5 MWh is deemed optimal for the studied case. Larger batteries are found to be inefficient for the system, as the entirety of their capacity is seldom utilized throughout the year, resulting in significant unused capacity for extended periods.
The sizing of the s-GT is a key element as the gas turbine represents a critical component of the overall system design. A similar approach to the electrolysis sizing, i.e., maximizing electricity coverage over the whole year, was used. The size-dependent coverage percentage value is reached at a capacity of 14 MW for the s-GT, considering a 60% efficiency rate, which equals 8.4 MWh/h of maximal electricity that can be provided.
3.2. Dynamic Behavior
Electricity production from the combined 20.6 MW PV and 16.6 MW wind power system is directly utilized to fulfill the demand profile delineated in
Figure 1. Any surplus electricity, herein referred to as “excess electricity”, is directed towards electrolysis. Owing to the inherent fluctuations and occasional peaks in the surplus electricity profile, a battery system is integrated to mitigate these peaks. Additionally, the battery serves the purpose of storing electricity during periods when the available electricity falls below the minimum operational load threshold of the electrolysis, which is set at 15%.
Figure 4a–d illustrates the surplus electricity generated from the PV and wind system, the battery storage system dynamic behavior, and the H
2 production and H
2 storage tank during the year.
The hydrogen generated through the electrolysis process is stored within an intermediary buffer tank before being utilized in MeOH synthesis. This intermediary step is necessitated by the operational constraints of the MeOH synthesis unit, which cannot effectively operate at loads lower than 20%. Consequently, the storage of hydrogen serves as a buffer, ensuring a consistent and reliable supply for the MeOH synthesis process. Based on the data presented in
Figure 5a, it is determined that the hydrogen storage tank must possess a capacity of 280 kg to adequately fulfill the requirements of the system.
Figure 5 illustrates the dynamic behavior of the MeOH storage tank, the electricity generated from the s-GT, and the electricity coverage from the grid. In the initial half of the year, the MeOH storage tank tends to remain predominantly full. This is attributed to the comprehensive coverage provided by the PV and wind systems, effectively meeting the electricity demand, with infrequent reliance on the seasonal storage system for supplemental coverage. However, as presented by the electricity demand profile in
Figure 1, demand peaks during the summer and autumn seasons exceed the capacity of the PV and wind systems. Consequently, the seasonal storage system becomes increasingly utilized to meet the heightened demand, leading to occasional depletion of the MeOH storage tank. The determined size of the MeOH tank stands at 313 m
3. In our previous study [
42], where hydrogen was considered as the storage medium, achieving the same level of electricity coverage required more than 100 H
2 tanks, each with a capacity of 527 kg of H
2. Through further optimization, it was determined that 26 of these reference tanks were sufficient; however, this resulted in reduced electricity coverage from the energy storage system, leading to greater dependency on grid electricity.
The efficiency of the s-GT exhibits a significant decline during low-load operations, prompting the introduction of a minimum load operation threshold set at 10%. Consequently, during periods when the electricity demand falls below the operational capacity of the s-GT, the grid intervenes to provide supplementary support.
The implementation of the proposed seasonal storage system proves highly effective, covering over 90% of the annual electricity demand. In the absence of this storage system, the PV and wind systems generate a substantial surplus of electricity, particularly during the summer. Overall, without the storage system, these renewable sources fulfill 62% of the electricity demand on average.
3.3. CO2 Supply
The CO2 emitted from the s-GT can be captured and stored in a dedicated storage tank, with an assumed capture rate of 80%. This captured CO2 serves as a feedstock for the MeOH synthesis process. However, the quantity of CO2 generated from the s-GT alone may not suffice to meet the requirements of the synthesis process. Consequently, an external source of CO2 is necessitated. In this case study, biogas is considered a supplementary CO2 source. To extract CO2 from biogas, a biogas upgrading unit is employed. The extracted CO2 is then accumulated in a designated CO2 tank, while the methane can either be utilized as fuel for the s-GT to generate electricity or sold on the market.
To ascertain the optimal CO
2 flow rate from biogas and the additional CO
2 required for MeOH synthesis, a sensitivity analysis was conducted. The CO
2 flow rate from biogas was varied from 0 to 500 Nm
3/h, while the corresponding demand for additional CO
2 procurement over the year was calculated.
Figure 6 shows the results from the sensitivity analysis. Considering a storage tank with a maximum capacity of 60 tons (equivalent to 33,000 Nm
3) of CO
2, a commercial product provided by Linde, the analysis revealed that without CO
2 from the biogas stream, ca. 1500 tons of CO
2 would need to be purchased annually. However, with integration of biogas at a flow rate of ca. 400 Nm
3/h of CO
2, there would be no requirement for additional purchased CO
2.
In this analysis, a CO2 flow rate of 200 Nm3/h is considered, which corresponds to a biogas plant maintaining a constant production of 500 Nm3/h, assuming a CO2 concentration of 40 vol% in biogas.
3.4. Economic Assessment
Figure 7 shows the breakdown of both investment and operational costs, presenting the composition of each unit within the evaluated energy system. The total investment outlay for the energy system amounts to 105 M EUR, with annual operational and maintenance costs totaling 3.1 M EUR. Investment costs are distributed across various components, with the electricity production system accounting for 34% of the total investment, comprising 18.8% for PV and 22.3% for wind power. Subsequently, the s-GT represents 24.2% of the investment, followed by the MeOH synthesis plant at 13.5%, electrolysis at 17.3%, battery storage at 2.2%, and the remainder allocated to storage tanks.
The electricity generated by the PV and wind systems primarily supplies the end user’s demand, resulting in a calculated LCOE of 43 EUR/MWh. However, due to the oversized design of the PV and wind systems, about 38% of the generated electricity remains unused by the end user.
The surplus electricity, equivalent to 38% of the total generation from the PV and wind systems, is directed to the SES system. Initially, this surplus electricity powers electrolysis for hydrogen production. The produced hydrogen is then stored in an intermediate tank, and subsequently utilized in the MeOH synthesis process. The size of this storage tank is relatively modest at 10 MWh (based on higher heating value) or 3000 Nm3. The annual MeOH production capacity is calculated to be 3000 tons/year, with an LCOPMeOH of 2.7 EUR/kg. The average LCOE, encompassing both direct utilization from PV and wind and the SES system, is determined to be 94 EUR/MWh.
Taking into account the anticipated future investment cost trajectories for the technologies, as delineated in
Table 3, the LCOE is projected to potentially decrease by 43% in the short term (by 2030) and by 69% in the long term (by 2050). Concurrently, the corresponding LCOP values for MeOH are computed and illustrated in
Figure 8.
In addition to CAPEX and OPEX, the discount rate plays a crucial role in economic evaluations. In our current study, a discount rate of 5% was considered. However, due to future uncertainties, a sensitivity analysis around this parameter was conducted. The discount rate varied from 4 to 8%, and the results are depicted in
Figure 8. As illustrated, the LCOE would increase by 32% (reaching 124 EUR/MWh) at a discount rate of 8%, while it could decrease by 11% to 84 EUR/MWh if the discount rate were lowered to 4%. Consequently, the LCOP for MeOH would increase by 21% at a discount rate of 8%.
4. Conclusions
This study has evaluated the technical and economic feasibility of integrating the HERMES s-GT and novel methanol synthesis into an energy storage system. By utilizing excess renewable electricity for chemical synthesis, including hydrogen production via electrolysis and subsequent methanol synthesis using carbon dioxide from a biogas plant, the system demonstrates a promising approach for grid-balancing energy storage.
The study identifies a 15 MW electrolysis system and a 2.5 MWh battery storage as optimal for balancing electricity generation and storage. These configurations minimize resource wastage while ensuring stability and reliability, particularly during periods of fluctuating electricity production from renewable sources. The s-GT, with a capacity of 14 MW, also plays a significant role in meeting electricity demand, especially during peak periods.
The intermediate hydrogen storage tank with a capacity of 280 kg, alongside a MeOH storage tank of 313 m3, ensures that excess renewable energy is effectively utilized. The study demonstrates that the proposed system can meet over 90% of the annual electricity demand, reducing dependency on grid electricity and optimizing the use of renewable resources. The combination of PV, wind, and seasonal storage systems proves to be an effective solution for managing seasonal variations in electricity demand.
To realize the project, an initial investment of 105 MEUR is necessary, accompanied by annual operational and maintenance expenses of 3.8 MEUR. The levelized cost of electricity was estimated at 94 EUR/MWh. Moreover, considering future investment cost trajectories, the anticipated decreases in the LCOE by 43% in the short term (2030) and 69% by 2050, underscore the system’s potential for long-term cost reduction.


 ,
, 


