


Offshore Wind Farm Impact Assessment on Radio Systems Operating in the MF Band

Abstract
1. Introduction
2. Methods
- Measurement of the signal level at a point near the wind farm in a location where it does not obscure the incoming MF signal.
- Measurement of the signal level at a point near the wind farm where the incoming signal is obscured by the wind farm.
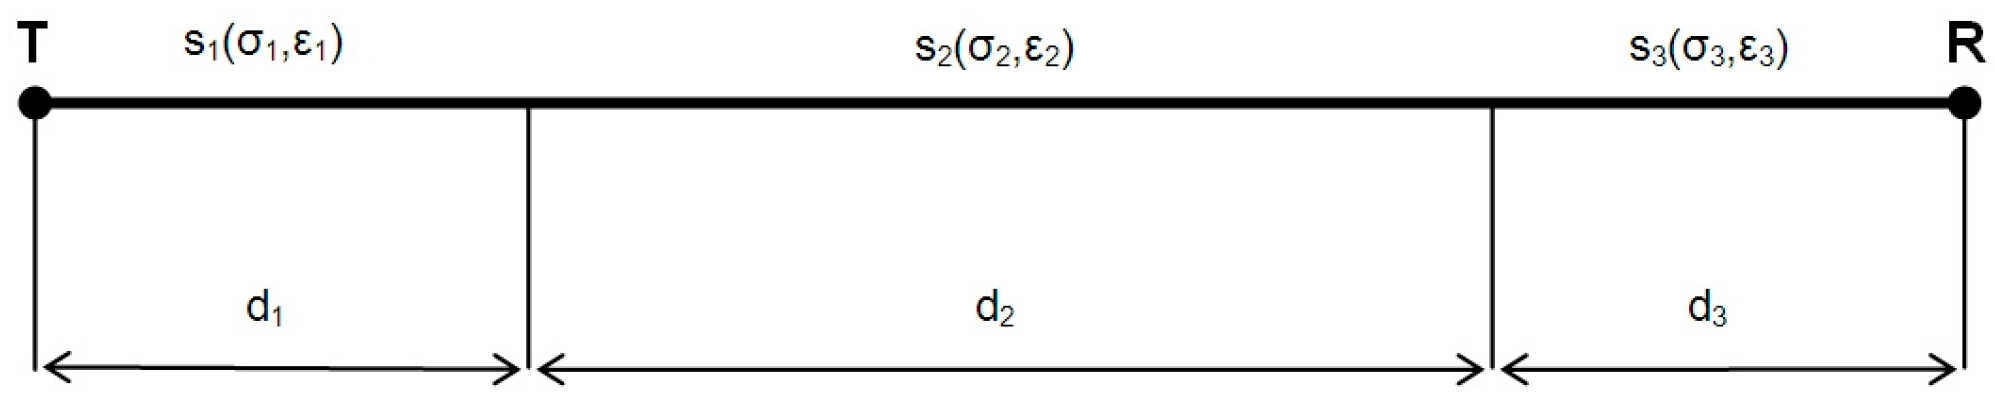
- Calculation of propagation loss between these points.
3. Results and Discussion
3.1. DGPS System Measurements
- “North”—25 turbines with a tower height of 117 m,
- “South”—14 turbines with a tower height of 137 m.
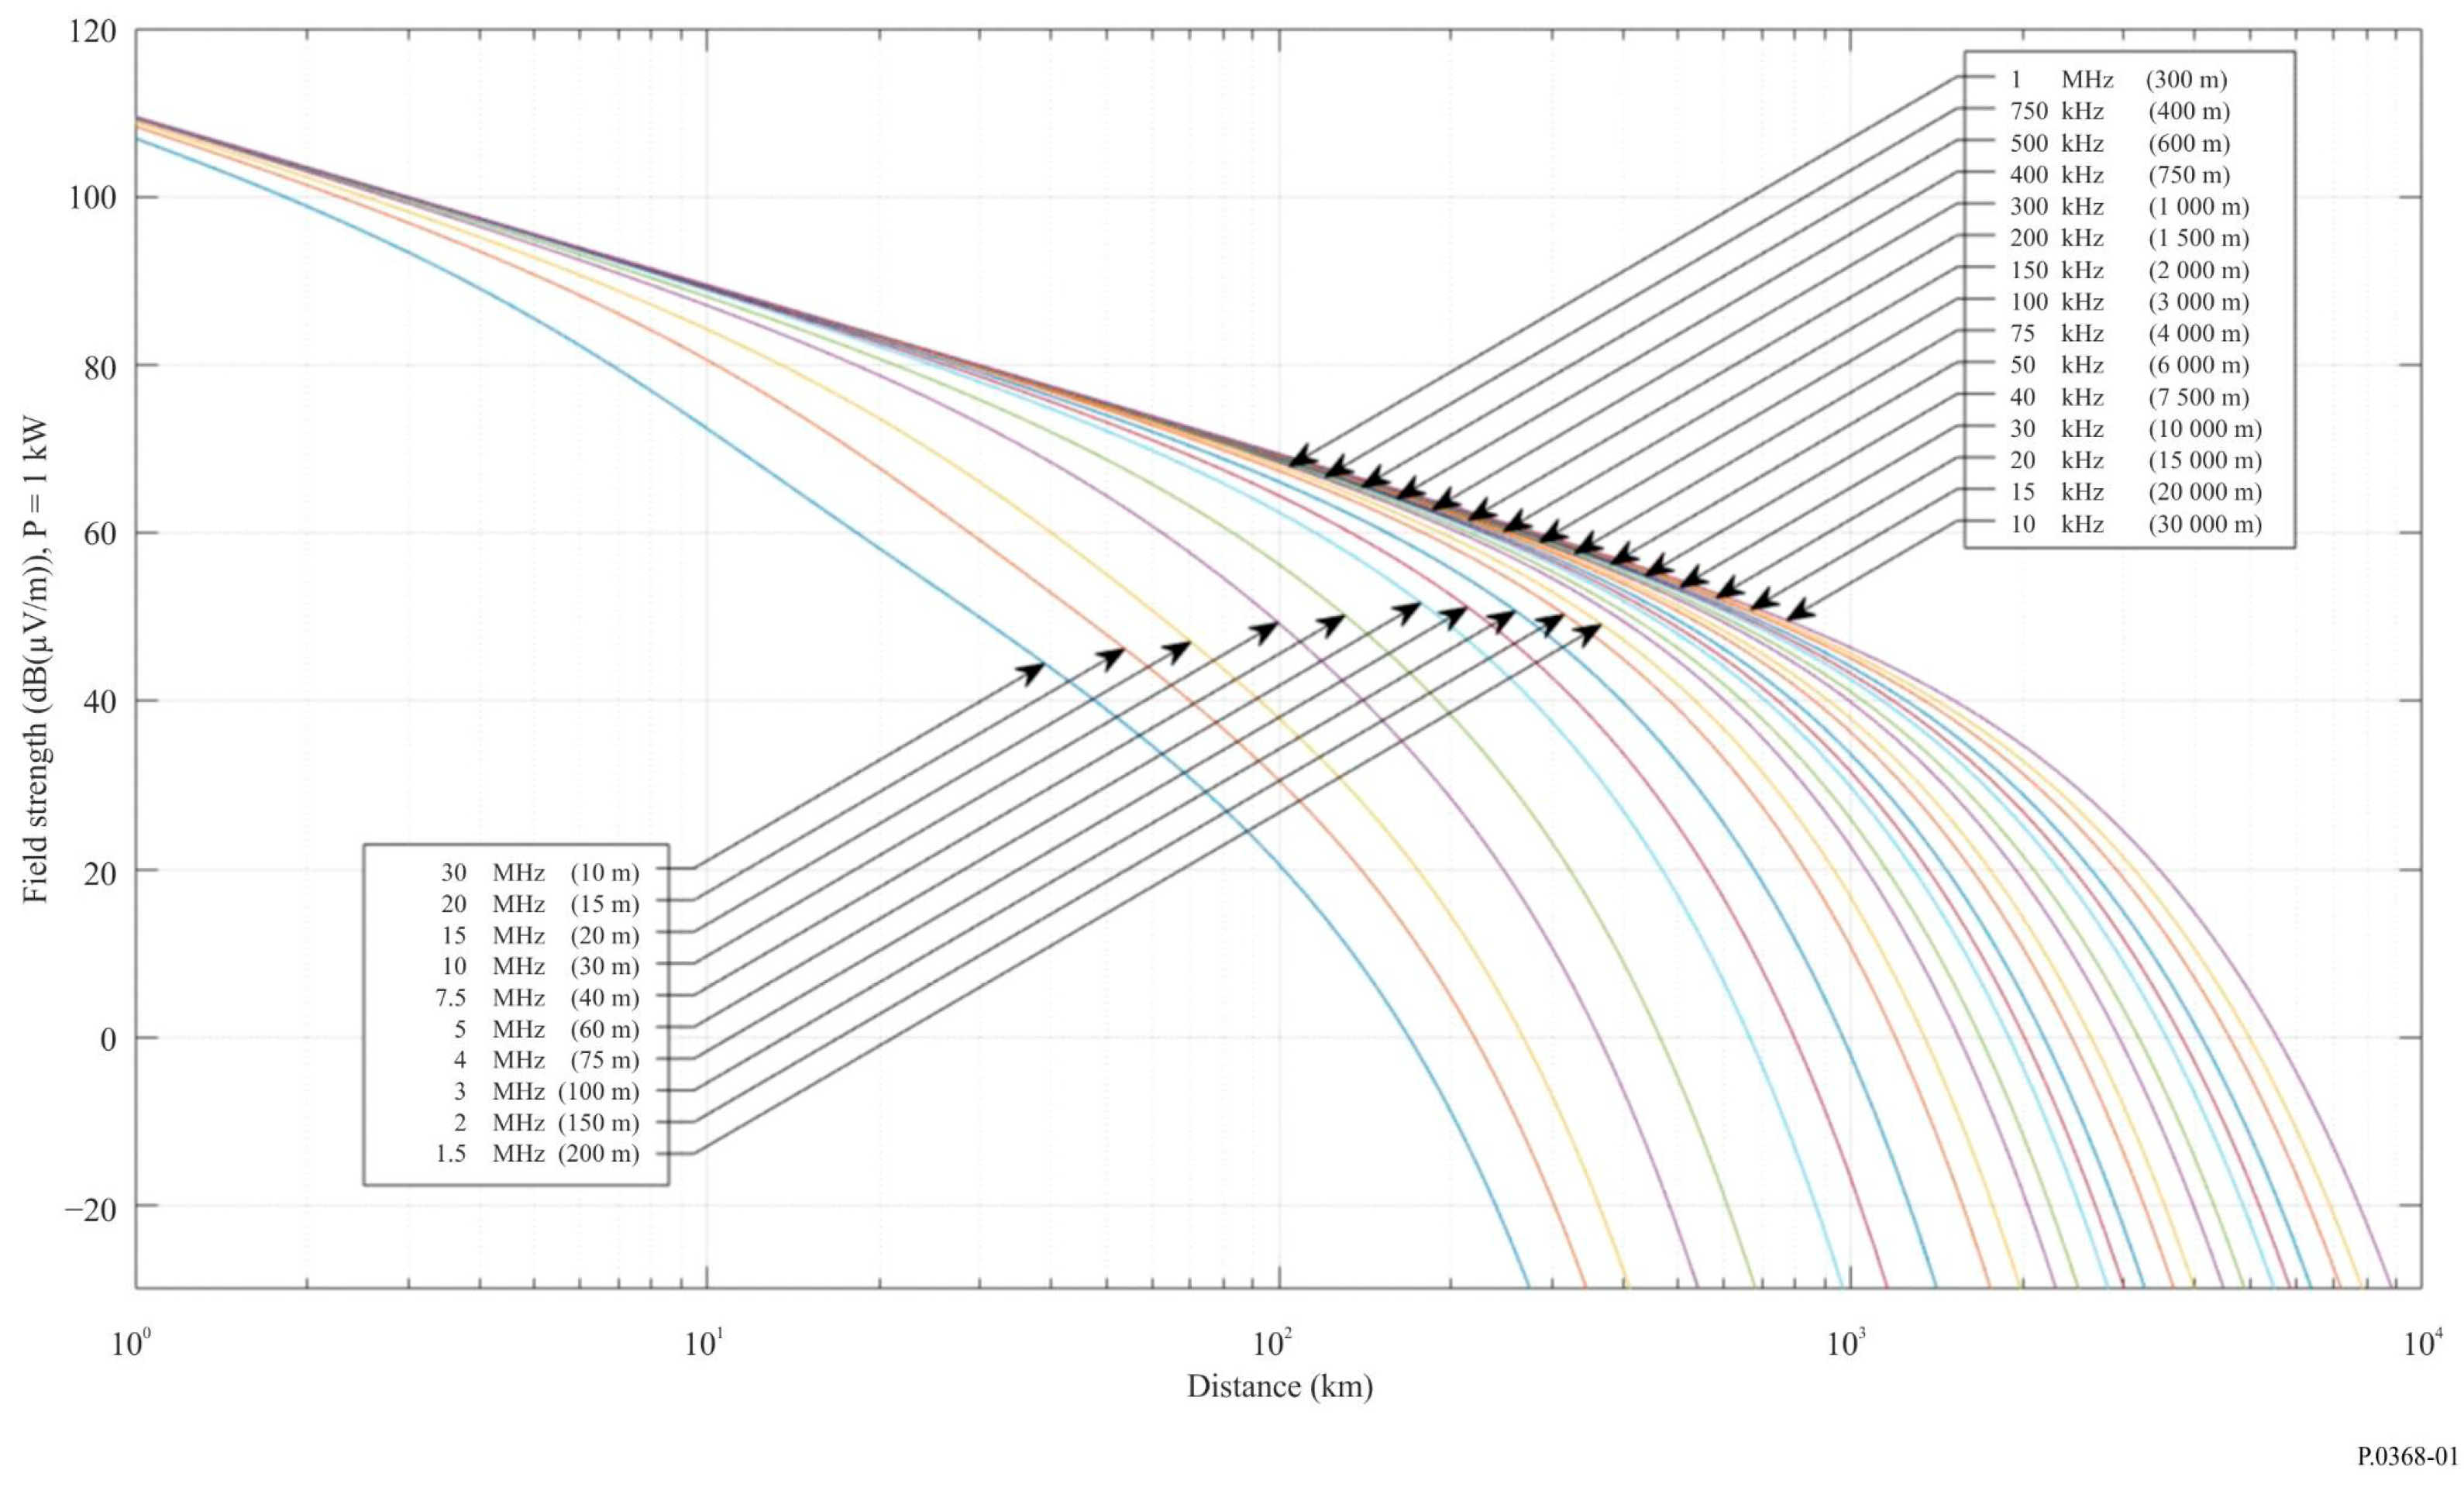
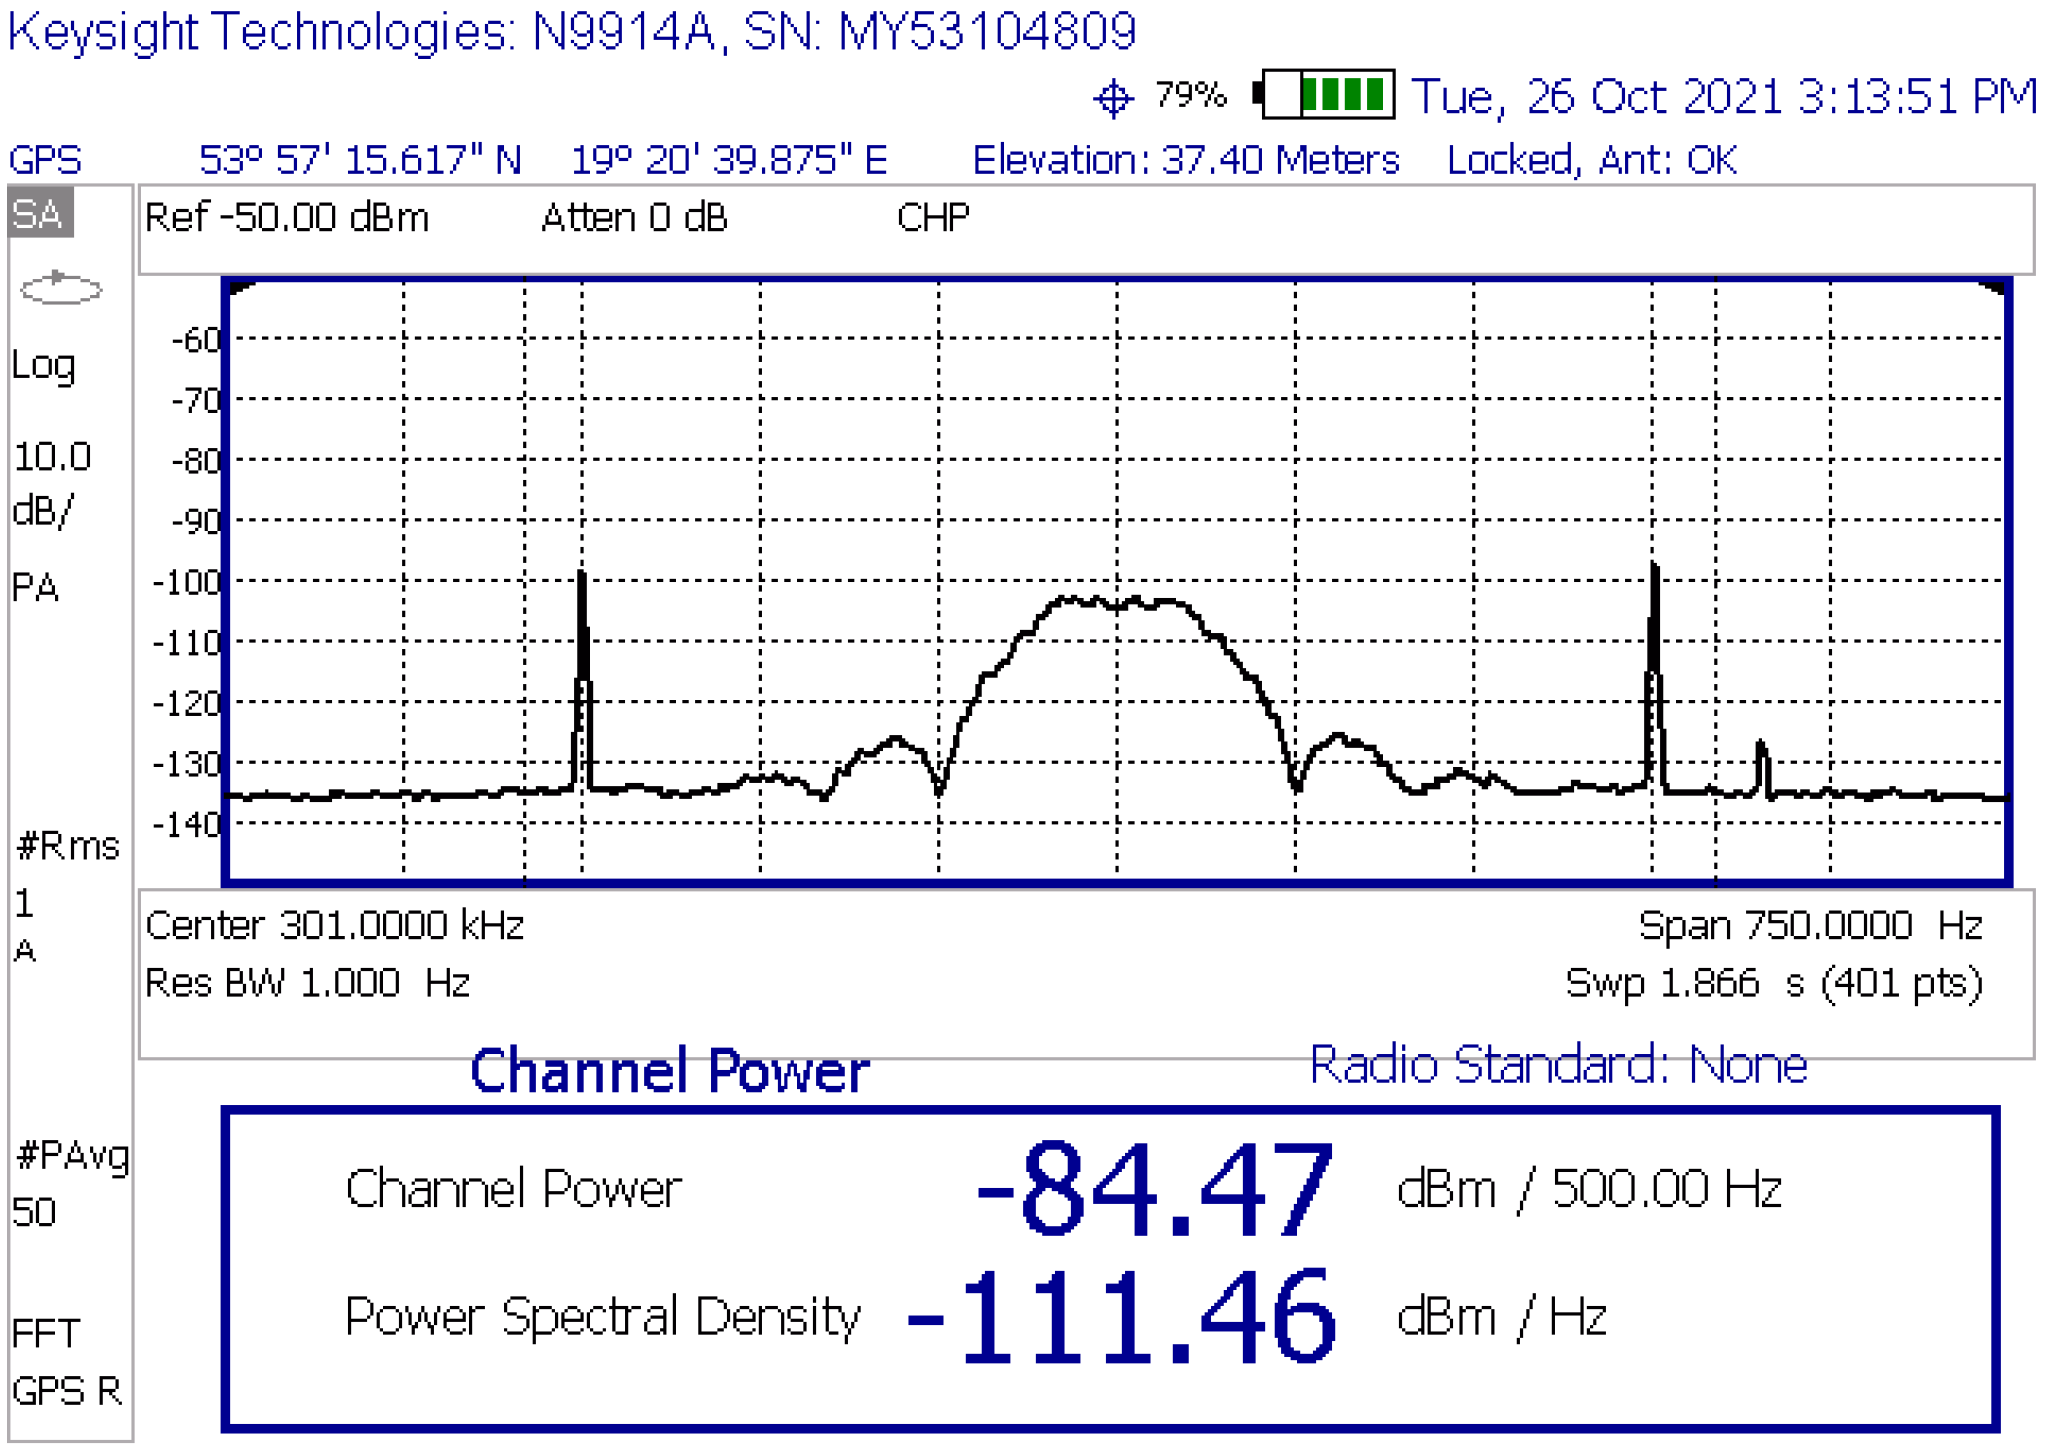
- Frequency: 301 kHz,
- Transmitting antenna height: 23 m a.g.l.,
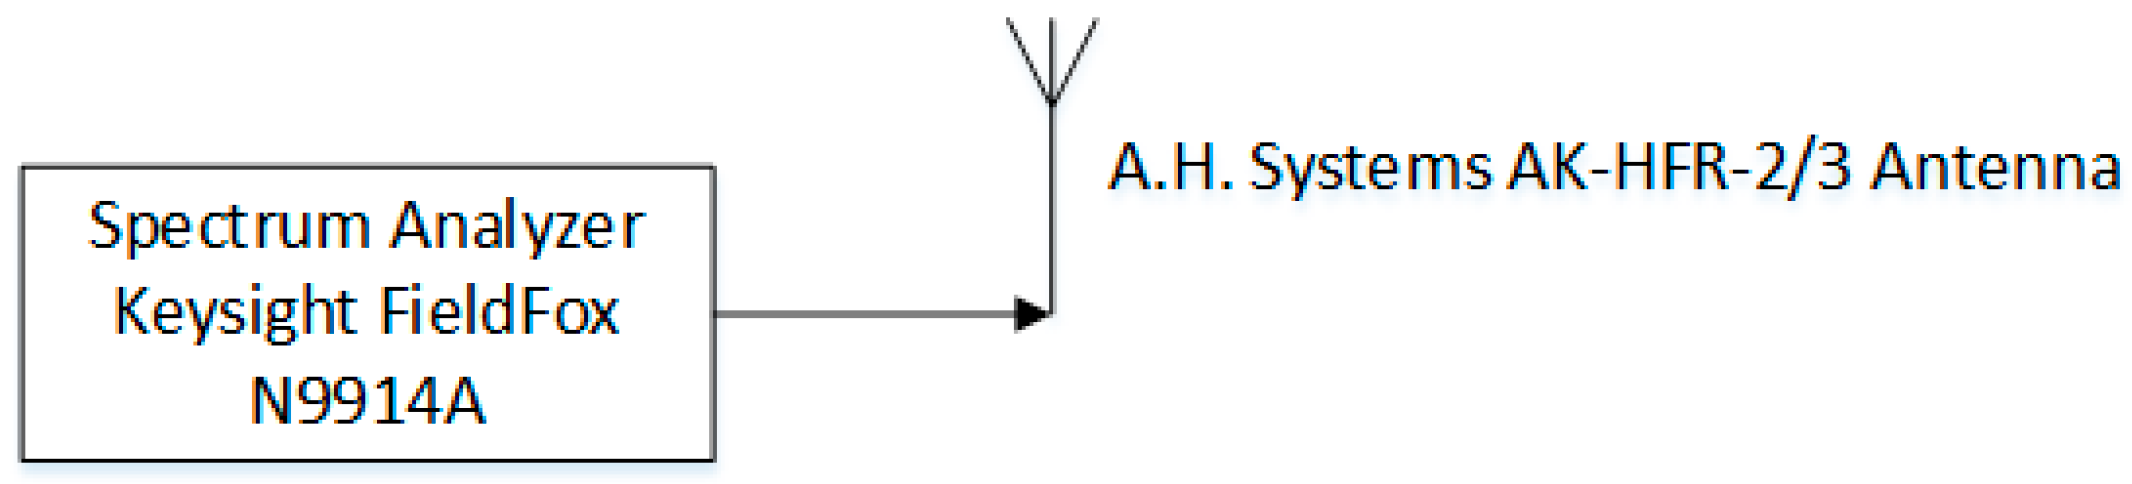
- Receiving antenna height: 2 m a.g.l.,
- Polarization: vertical,
- Soil conductivity: 0.01 S/m,
- Relative electrical permittivity of the soil: 30,
- Refractive index: 315 (N-Units).
- The reduction in DGPS signal attenuation with distance from the DGPS transmitter did not occur in case of the Jasna “South” wind farm, because there was only a small increase in the distance between the transmitter and the measurement points. In addition, momentary propagation conditions and measurement error (the confidence interval for the measurements taken is 1 dB with a probability of 90% [22] in each and every location that the measurements were made) could have caused an apparent increase in the level of the measured signal.
- The simulated increase in attenuation was determined based on a certain mathematical model [13], which does not perfectly reflect real conditions in every situation—the apparent “amplification” of the signal by the wind farm is, therefore, probably caused by the imperfection of the model, on top of measurement and statistical error.
- The soil conductivity and relative electrical permittivity are not homogenous and may be slightly different for various paths. According to [13]—in many cases the difference in levels of a signal at nearby locations follows a log-normal distribution with a standard deviation within ±3–4 dB, averaging approximately 3.5 dB.
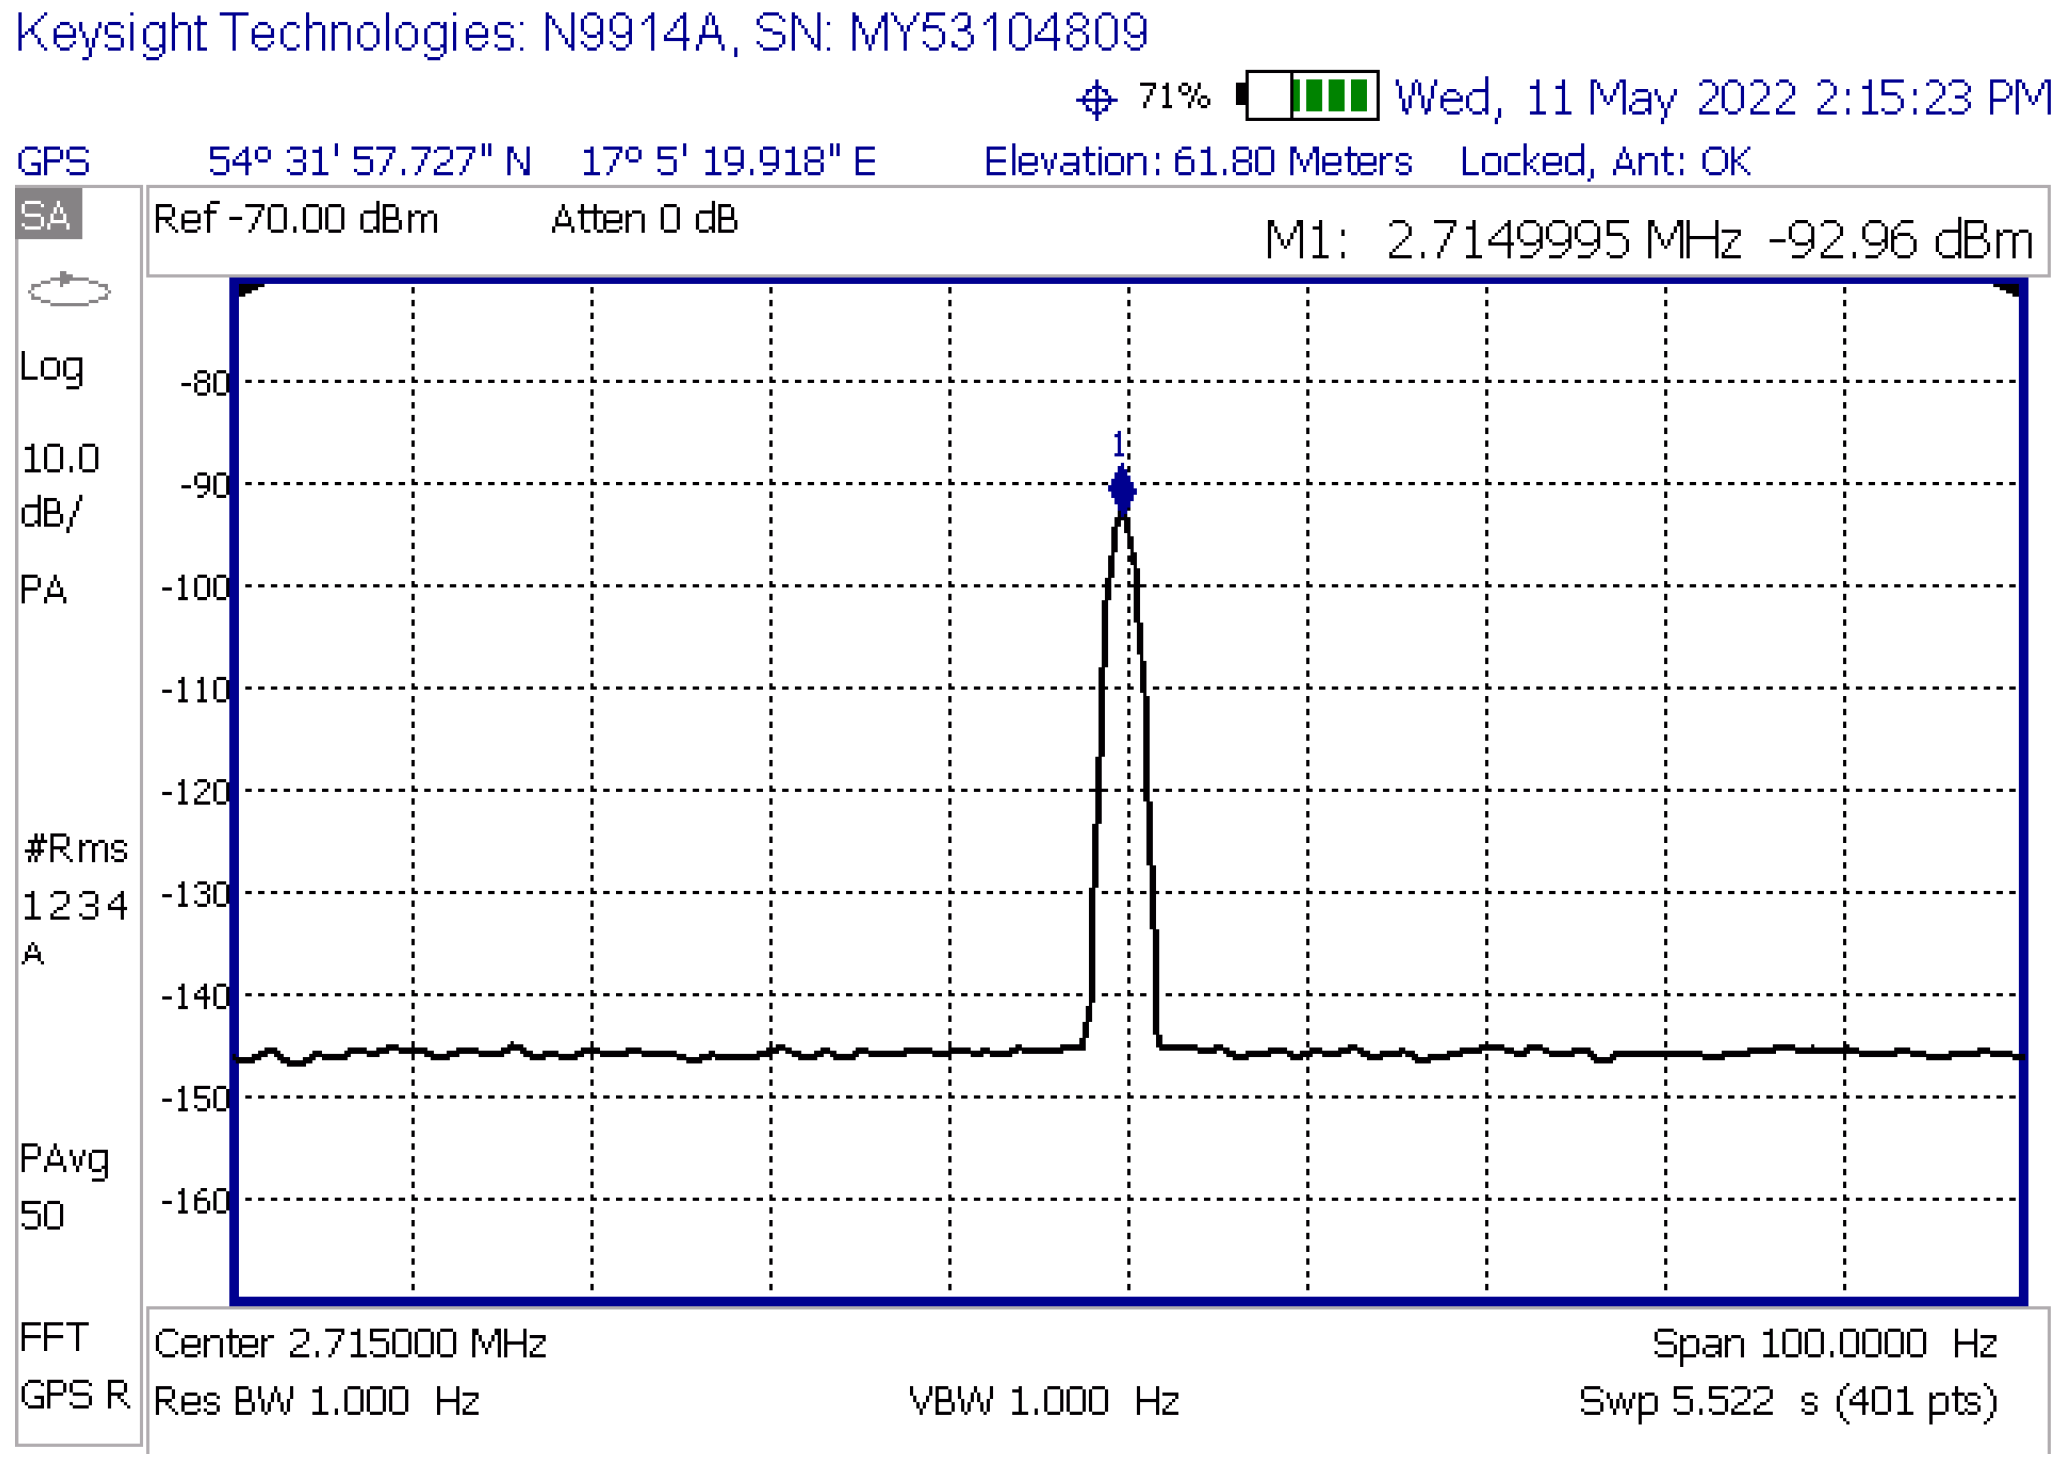
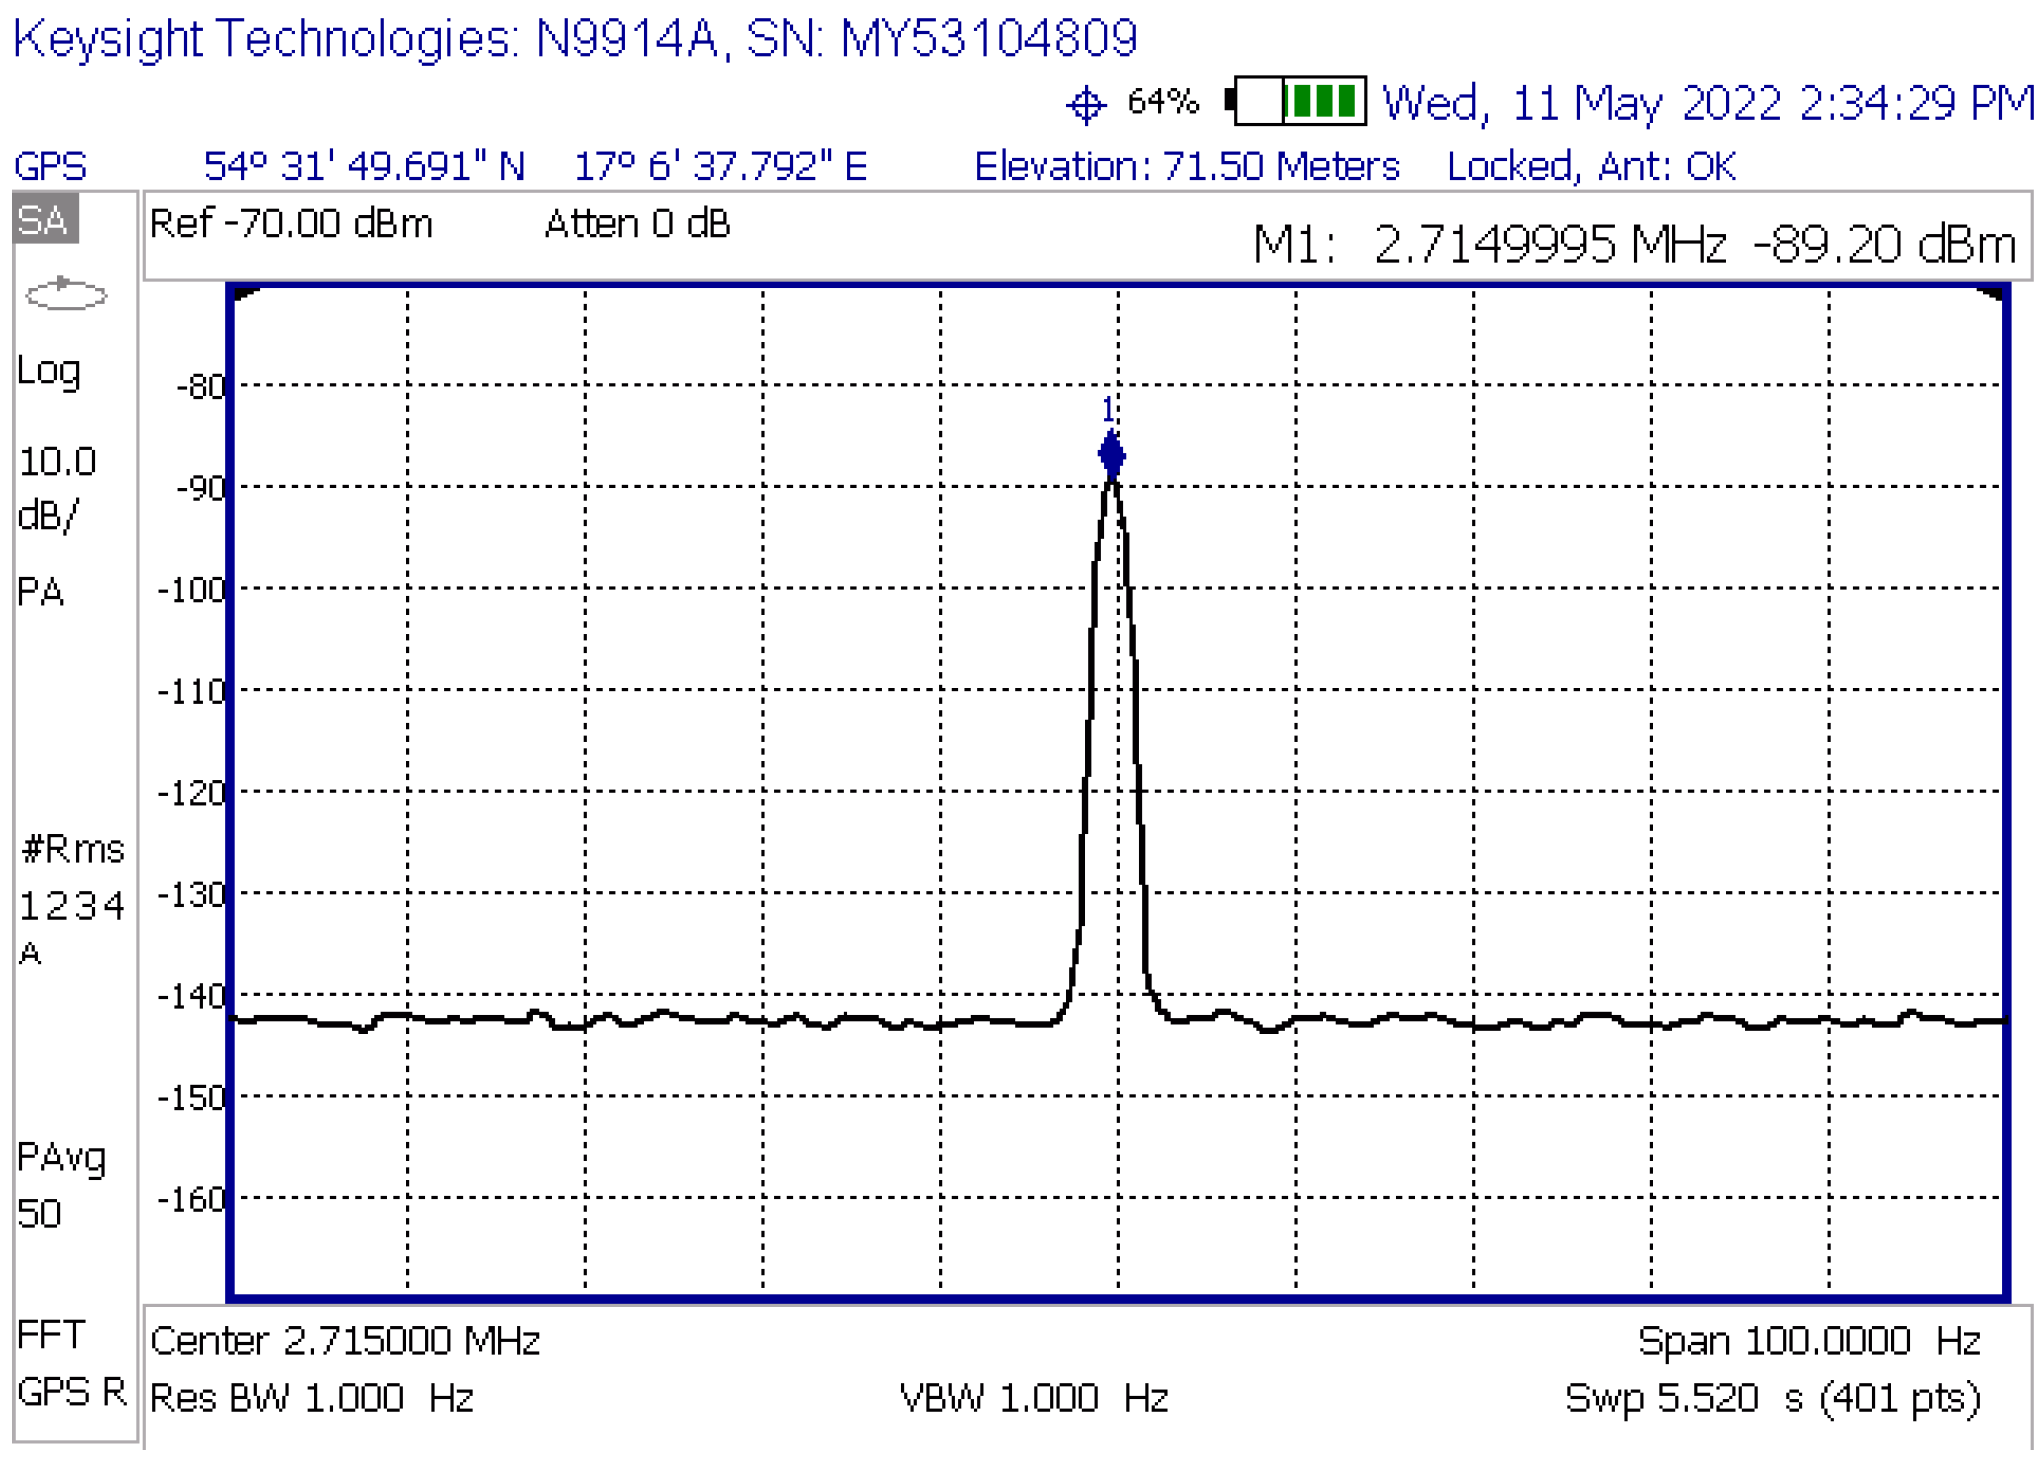
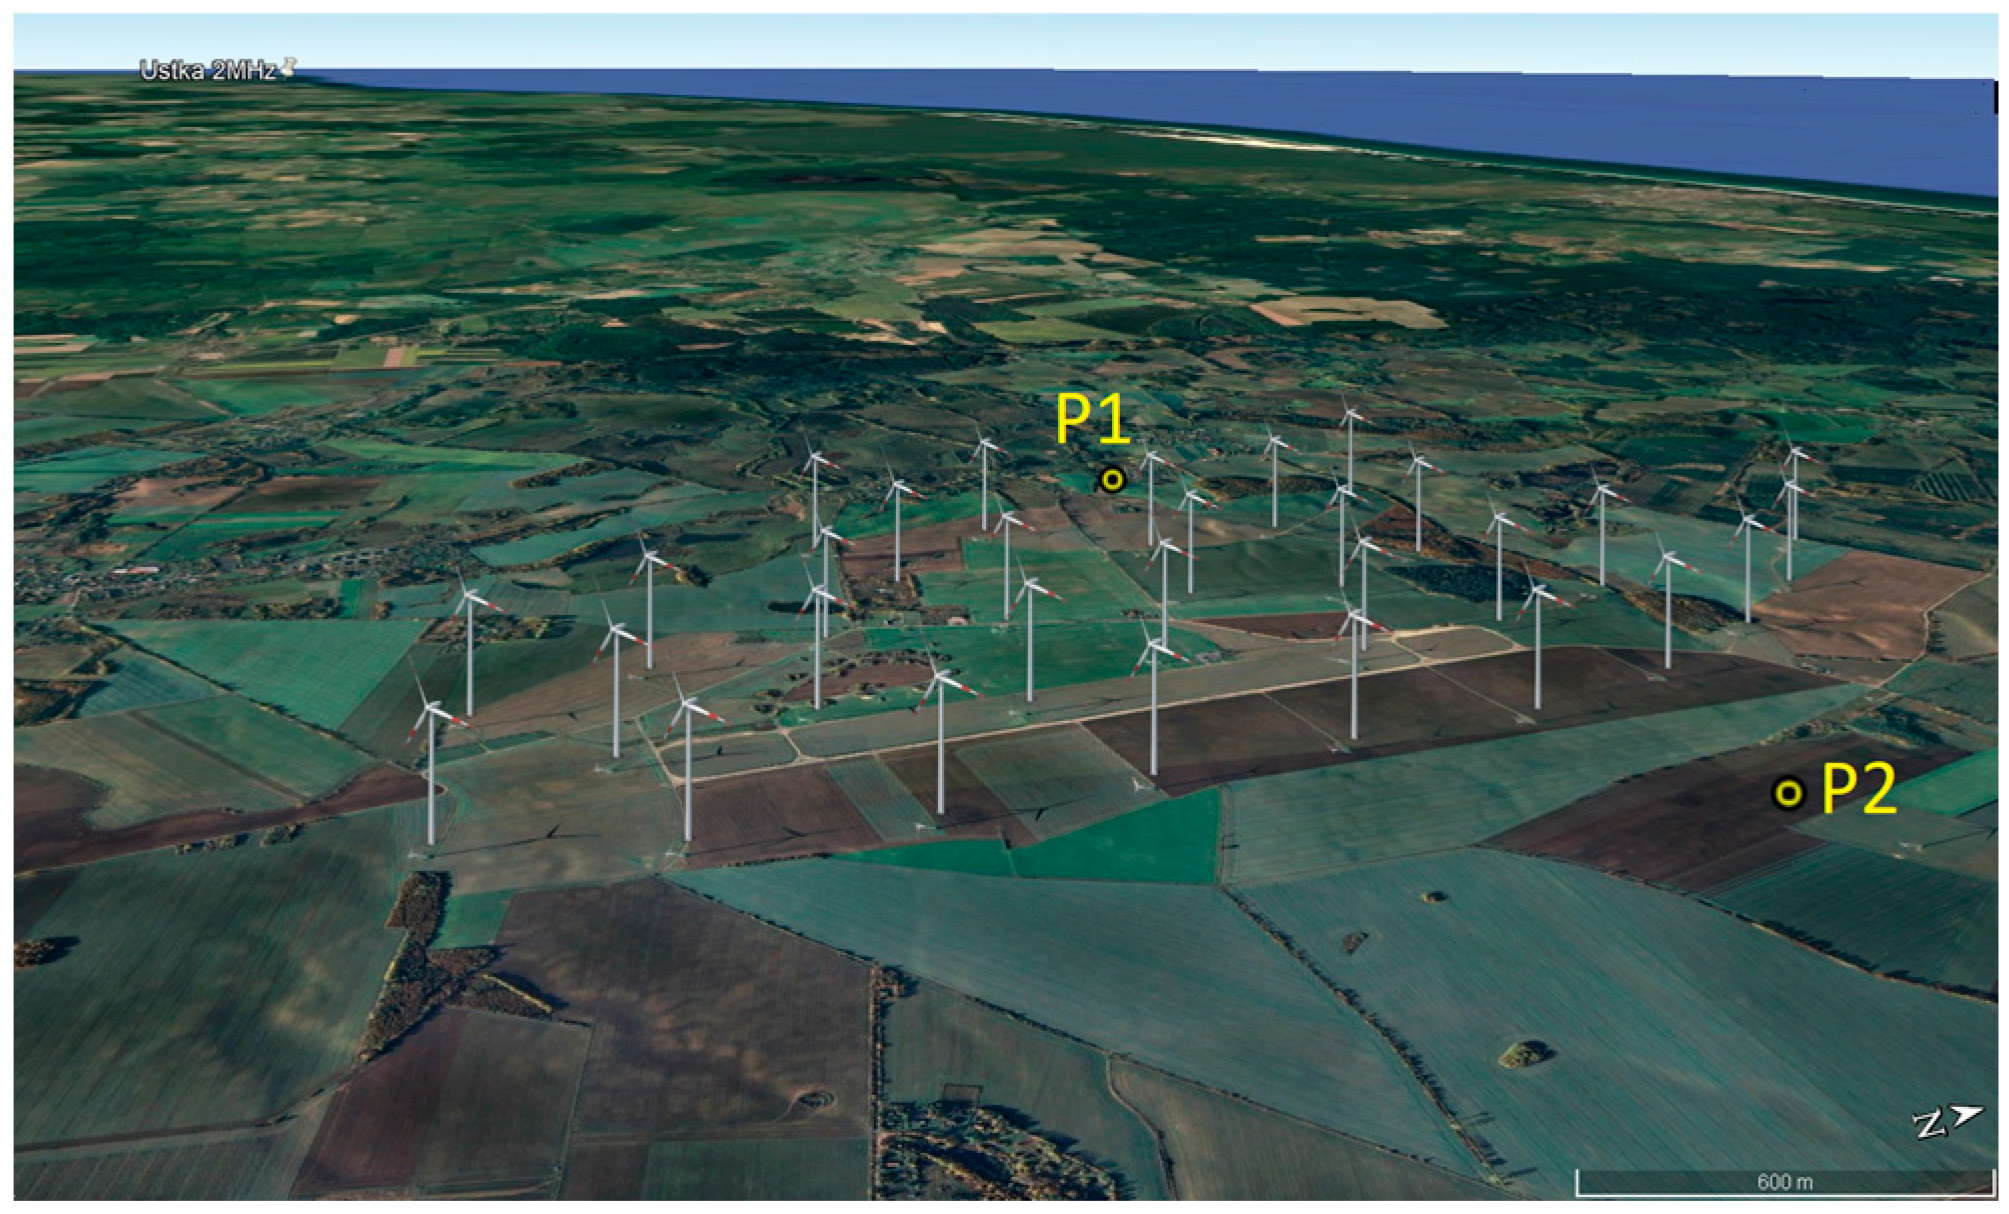
3.2. Measurements in the Upper MF Band
- Frequency: 2715 kHz,
- Transmitting antenna height: 32 m a.g.l.,
- Receiving antenna height: 2 m a.g.l.,
- Polarization: vertical,
- Soil conductivity: 0.01 S/m,
- Relative electrical permittivity of the soil: 30,
- Refractive index: 315 (N-Units).
- The apparent increase in the signal level measured at the Wrzeście wind farm could be caused by a momentary signal enhancement, which may be caused by the formation of ducts for small percentages of time [23] and measurement error (the confidence interval for the measurements taken is 1 dB with a probability of 90% [22] in each and every location the measurements were made).
- The difference in soil conductivity values at different signal level measurement locations could have influenced the apparent increase in the signal level behind the wind farm. According to [13]—in many cases the difference in levels of a signal at nearby locations follows a log-normal distribution with a standard deviation within ±3–4 dB, averaging approximately 3.5 dB.
- The simulated increase in attenuation was determined based on a mathematical model [13], which does not reflect real conditions perfectly in every situation—the apparent signal amplification by the wind farm is, therefore, probably caused by the imperfection of the model and measurement and statistical error.
4. Conclusions
- in the case of communications in the HF and MF bands, besides ground waves, we are also dealing with ionospheric propagation, which is the basis of almost all HF communication beyond the horizon, as well as the possibility of the formation of tropospheric ducts.
- the narrow band of the radio systems discussed in this article is much smaller than the coherence bandwidth of the channel. As a result, even if there were to be fading due to signal reflection (and interference), this fading would not be frequency selective and would not significantly affect the performance of these systems.
Author Contributions
Funding
Data Availability Statement
Acknowledgments
Conflicts of Interest
Abbreviations
| DGPS | Differential Global Positioning System |
| EEZ | Exclusive Economic Zone |
| EMF | Electromagnetic Field |
| GMDSS | Global Maritime Distress and Safety System |
| GWEC | Global Wind Energy Council |
| HF | High Frequency |
| ITU | International Telecommunication Union |
| LF | Low Frequency |
| MF | Medium Frequency |
| OWF | Offshore Wind Farm |
| R-Mode | Ranging Mode |
| UHF | Ultra High Frequency |
| VHF | Very High Frequency |
References
- Global Energy Wind Council (GWEC). Global Wind Report 2024; GWEC Global Energy Wind Council: Brussels, Belgium, 2024. [Google Scholar]
- European Commission. Boosting Offshore Renewable Energy for a Climate Neutral Europe—Press Release; European Commission: Brussels, Belgium, 2020; Available online: https://ec.europa.eu/commission/presscorner/detail/en/ip_20_2096 (accessed on 7 February 2025).
- Bronk, K.; Lipka, A.; Niski, R.; Wereszko, B. Wind farms influence on radiocommunication systems operating in the VHF and UHF bands. J. Telecommun. Inf. Technol. 2015, 60, 30–43. [Google Scholar]
- Bronk, K.; Koncicki, P.; Lipka, A.; Niski, R.; Wereszko, B. Radio Channel Modelling for VHF System Operating in the Offshore Wind Farms Propagation Environment. Sensors 2023, 23, 7593. [Google Scholar] [CrossRef] [PubMed]
- Bronk, K.; Koncicki, P.; Lipka, A.; Niski, R.; Wereszko, B. Modeling Wind Turbines to Assess Impact of Offshore Wind Farms on Maritime X- and S-Band Radars. JTIT 2024, 95, 54–74. [Google Scholar] [CrossRef]
- IMO. International Convention For Safety of Life at Sea (SOLAS); International Maritime Organization: London, UK, 1974. [Google Scholar]
- International Telecommunication Union (ITU). Radio Regulations: Vol. II Appendix 15 (Rev.WRC-23); Frequencies for distress and safety communications for the Global Maritime Distress and Safety System (GMDSS); ITU-R: Geneva, Switzerland, 2024. [Google Scholar]
- International Telecommunication Union (ITU). Radio Regulations: Vol. I Chapter I; ITU-R: Geneva, Switzerland, 2024. [Google Scholar]
- Saunders, S.R.; Aragón-Zavala, A. Antennas and Propagation for Wireless Communication Systems, 2nd ed.; Wiley: Bognor Regis, UK, 2007; pp. 2–7. [Google Scholar]
- Seybold, J.S. Introduction to RF Propagation; Wiley: Hoboken, NJ, USA, 2005; pp. 1–13. [Google Scholar]
- Katulski, R.J. Radio Wave Propagation in Wireless Telecommunications; WKŁ: Warszawa, Poland, 2009; pp. 57–84. (In Polish) [Google Scholar]
- Rizzi, F.G.; Grundhöfer, L.; Gewies, S.; Ehlers, T. Performance Assessment of the Medium Frequency R-Mode Baltic Testbed at Sea near Rostock. Appl. Sci. 2023, 13, 1872. [Google Scholar] [CrossRef]
- Recommendation ITU-R P.368-10 (08/2022); Ground-Wave Propagation Prediction Method for Frequencies Between 10 kHz and 30 MHz. ITU: Geneva, Switzerland, 2022.
- Recommendation ITU-R, P. Recommendation ITU-R P.341-7 (08/2019); The Concept of Transmission Loss for Radio Links. ITU: Geneva, Switzerland, 2019.
- Fockens, K.; Vogt-Ardatjew, R.; Leferink, F. Propagation Measurements and Analysis on MF and HF Bands in Urban Areas in The Netherlands. IEEE Trans. Electromagn. Compat. 2022, 64, 650–660. [Google Scholar] [CrossRef]
- Nishioka, Y.; Inasawa, Y.; Konishi, Y. Comparison of measured and theoretically predicted results of ground-wave propagation characteristic at MF-band. In Proceedings of the International Symposium on Electromagnetic Theory, Hiroshima, Japan, 20–24 May 2013; pp. 302–305. [Google Scholar]
- Hehenkamp, N.; Rizzi, F.G.; Grundhöfer, L.; Gewies, S. Prediction of Ground Wave Propagation Delay for MF R-Mode. Sensors 2024, 24, 282. [Google Scholar] [CrossRef] [PubMed]
- Gewies, S.; Dammann, A.; Ziebold, R.; Bäckstedt, J.; Bronk, K.; Wereszko, B.; Rieck, C.; Gustafson, P.; Eliassen, C.G.; Hoppe, M.; et al. R-Mode testbed in the Baltic Sea. In Proceedings of the 19th IALA Conference, Incheon, Republic of Korea, 27 May–2 June 2018. [Google Scholar]
- Grundhöfer, L.; Rizzi, F.G.; Gewies, S.; Hoppe, M.; Bäckstedt, J.; Dziewicki, M.; Del Galdo, G. Positioning with medium frequency R-Mode. Navigation 2021, 68, 829–841. [Google Scholar] [CrossRef]
- ITU-R. Ground-Wave Propagation (GRWAVE) Software Tool. Available online: http://www.itu.int/oth/R0A0400000F/en (accessed on 30 June 2022).
- Recommendation ITU-R P.832-4 (07/2015); World Atlas of Ground Conductivities. ITU: Geneva, Switzerland, 2015.
- Lee, W.C.Y. Mobile Communications Design Fundamentals, 2nd ed.; Wiley and Sons: Hoboken, NJ, USA, 1993; pp. 47–51. [Google Scholar]
- Recommendation ITU-R P.530-18 (09/2021); Propagation Data and Prediction Methods Required for the Design of Terrestrial Line-of-Sight Systems. ITU: Geneva, Switzerland, 2021.
- International Commission on Non-Ionizing Radiation Protection. ICNIRP Guidelines for Limiting Exposure to Electromagnetic Fields (100 kHz to 300 GHz). Health Phys. 2020, 118, 483–524. [Google Scholar]
- Recommendation ITU-R, M. Recommendation ITU-R M.2092-1; Technical Characteristics for a VHF Data Exchange System in the VHF Maritime Mobile Band. ITU: Geneva, Switzerland, 2022.
- Ormobass Project Website. Available online: https://interreg-baltic.eu/project/ormobass/ (accessed on 7 February 2025).


| Name | RS Dziwnów | RS Rozewie |
|---|---|---|
| Coordinates | 54°01′20.56″ N | 54°49′50.99″ N |
| 14°43′50″ E | 18°20′05.2″ E | |
| Frequency | 283.5 kHz | 301 kHz |
| Bandwidth | 250 Hz | 250 Hz |
| Transmitted power | 23 dBW | 23 dBW |
| Antenna height | 24.3 m a.g.l. | 27 m a.g.l. |
| Antenna gain | −7.83 dBi | −8.44 dBi |
| Wind Farm | Measuring Point | Antenna | Antenna Height [m] | Terrain Height [m a.s.l.] | Antenna Height Including Terrain Height After Correction [m] | Distance of the Receiver from the Transmitting Station in Rozewie [km] | Signal Level from the Spectrum Analyzer [dBm] | GRWAVE Path Loss [dB] |
|---|---|---|---|---|---|---|---|---|
| Jasna—“North” | R1 | Tx | 23 | 49 | Hn = 53.1 | 114 | −89.46 | 66.23 |
| Rx | 2 | 18.9 | Ho = 2 | |||||
| R2 | Tx | 23 | 49 | Hn = 36.6 | 117.5 | −84.47 | 66.6 | |
| Rx | 2 | 35.4 | Ho = 2 | |||||
| R3 | Tx | 23 | 49 | Hn = 42.9 | 112.2 | −88.78 | 66.06 | |
| Rx | 2 | 29.1 | Ho = 2 | |||||
| R4 | Tx | 23 | 49 | Hn = 35.7 | 112.7 | −87.33 | 66.13 | |
| Rx | 2 | 36.3 | Ho = 2 | |||||
| Jasna—“South” | R5 | Tx | 23 | 49 | Hn = 23 | 126.4 | −92.14 | 67.48 |
| Rx | 2 | 102 | Ho = 55 | |||||
| R6 | Tx | 23 | 49 | Hn = 23 | 126.7 | −92.96 | 67.53 | |
| Rx | 2 | 93.3 | Ho = 46.3 | |||||
| R7 | Tx | 23 | 49 | Hn = 23 | 127.9 | −92.54 | 67.61 | |
| Rx | 2 | 103.7 | Ho = 56.2 |
| Coordinates | 54°34′42.39″ N |
| 16°48′27.60″ E | |
| Antenna type | 32 m Ground Plane type Double Vee |
| Frequencies | 2714 kHz, 2182 kHz, 2187.5 kHz, 2174.5 kHz |
| Transmitter | SAIT CST3001 |
| Transmitted power | 35 dBW |
| Emission class | J3E, F1B |
| Wind Farm | Measuring Point | Antenna | Antenna Height [m] | Terrain Height [m a.s.l.] | Antenna Height Including Terrain Height After Correction [m] | Distance of the Receiver from the Transmitting Station in Ustka [km] | Signal Level from the Spectrum Analyzer [dBm] | GRWAVE Path Loss [dB] |
|---|---|---|---|---|---|---|---|---|
| Wojciechowo | P1 | Tx | 32 | 9 | Hn = 32 | 59.5 | −107.2 | 107.6 |
| Rx | 2 | 78 | Ho = 71 | |||||
| P2 | Tx | 32 | 9 | Hn = 32 | 62.3 | −107.6 | 108.3 | |
| Rx | 2 | 98 | Ho = 91 | |||||
| Wrzeście | P3 | Tx | 32 | 9 | Hn = 32 | 18.8 | −92.9 | 83.9 |
| Rx | 2 | 61.8 | Ho = 54.8 | |||||
| P4 | Tx | 32 | 9 | Hn = 32 | 20.3 | −89.2 | 85.6 | |
| Rx | 2 | 71 | Ho = 64 |
Disclaimer/Publisher’s Note: The statements, opinions and data contained in all publications are solely those of the individual author(s) and contributor(s) and not of MDPI and/or the editor(s). MDPI and/or the editor(s) disclaim responsibility for any injury to people or property resulting from any ideas, methods, instructions or products referred to in the content. |
© 2025 by the authors. Licensee MDPI, Basel, Switzerland. This article is an open access article distributed under the terms and conditions of the Creative Commons Attribution (CC BY) license (https://creativecommons.org/licenses/by/4.0/).
Share and Cite
Bronk, K.; Koncicki, P.; Lipka, A.; Niski, R.; Wereszko, B. Offshore Wind Farm Impact Assessment on Radio Systems Operating in the MF Band. Energies 2025, 18, 1652. https://doi.org/10.3390/en18071652
Bronk K, Koncicki P, Lipka A, Niski R, Wereszko B. Offshore Wind Farm Impact Assessment on Radio Systems Operating in the MF Band. Energies. 2025; 18(7):1652. https://doi.org/10.3390/en18071652
Chicago/Turabian StyleBronk, Krzysztof, Patryk Koncicki, Adam Lipka, Rafał Niski, and Błażej Wereszko. 2025. "Offshore Wind Farm Impact Assessment on Radio Systems Operating in the MF Band" Energies 18, no. 7: 1652. https://doi.org/10.3390/en18071652
APA StyleBronk, K., Koncicki, P., Lipka, A., Niski, R., & Wereszko, B. (2025). Offshore Wind Farm Impact Assessment on Radio Systems Operating in the MF Band. Energies, 18(7), 1652. https://doi.org/10.3390/en18071652