Article

Logarithmic Mean Divisia Index Analysis and Dynamic Back Propagation Neural Network Prediction of Transport Carbon Emissions in Henan Province

School of Automobile and Transportation, Xihua University, Chengdu 610039, China
*
Author to whom correspondence should be addressed.
Energies 2025, 18(7), 1630; https://doi.org/10.3390/en18071630
Submission received: 5 March 2025 / Revised: 15 March 2025 / Accepted: 17 March 2025 / Published: 25 March 2025
(This article belongs to the Section B3: Carbon Emission and Utilization)

Abstract

:
Amid escalating global concerns over climate change and sustainable development, carbon emissions have emerged as a critical issue for the international community. The control of carbon dioxide (CO2) emissions is particularly crucial for meeting the objectives of the Paris Agreement. This study applied the LMDI decomposition method and a BP neural network model to thoroughly analyse the factors influencing carbon emissions in Henan Province’s transportation sector and forecast future trends. Our core contribution is the development of an integrated model that quantifies the impact of key factors on carbon emissions and offers policy recommendations. This study concludes that by optimizing the energy structure and enhancing energy efficiency, China can meet its carbon peak and neutrality targets, thereby providing scientific guidance for sustainable regional development.

1. Introduction

With the growing global concern over climate change and sustainable development, the issue of carbon emissions has become a central theme for the international community. Carbon dioxide (CO2), one of the major greenhouse gases, and the control of its emissions are critical to achieving the goals of the Paris Agreement. Tutmez [1] provides a new perspective for modelling CO2 emissions associated with global coal and fossil fuel consumption through a trend analysis approach. McKibbin [2] emphasised the dependence of future climate change scenarios on GHG emission projections. Wen & Huang [3] analysed five key factors affecting carbon emissions by applying projection tracking models and Markov transfer matrices at the provincial level in China. S. Wang [4] compared the different paths that China might take in regional emissions reduction by modelling different “peak emissions” and “carbon neutral” paths and analysed the Chinese economy. They also analysed the role of China’s economy, population and technology in this process. As global concern about climate change increases, the study by McKibbin [2] emphasised the importance of long-term mitigation pathways. Abbas [5] projected the demand for energy and carbon emissions from the transport sector in Pakistan through a grey model, highlighting the important contribution of the transport sector in carbon emissions in developing countries.
In the context of China, Chang [6] evaluated the key factors affecting CO2 emission projections in China using machine learning techniques, specifically projection tracking regression (PPR). Lyu [7] showed that the development of the digital economy can effectively reduce regional carbon emission intensity, but this effect varies across regions. Zhai [8] proposed a regional carbon emission forecasting method and analysed the reduction potential under different policy and technology scenarios. S. H. Zhang [9] used a combination of models to explore the carbon emission drivers, long-term emission reduction pathways, and carbon quota allocation in the Beijing–Tianjin–Hebei region. Focusing on the ecological role of agriculture, Wu, Yue [10] assessed agricultural carbon emissions in 31 provinces in China and explored strategies to achieve “peak carbon and carbon neutrality” goals. W. W. Wang and Ang [11,12] provide detailed guidance on the LMDI decomposition methodology, while Lin [13] demonstrated the application of the LMDI methodology in analysing carbon emissions from the chemical industry in China. Goh [14] discussed the energy efficiency tracking method based on the LMDI method, and these studies provided methodological support. Ma [15] developed a LMDI decomposition method based on energy and CO2 allocation Sankey diagrams to analyse the contribution of various influencing factors to the growth of energy-related CO2 emissions at the national level. Zhou [16] improved the accuracy of CO2 emission forecasts by combining LMDI decomposition and GA-SVM models. Li [17] explored the influencing factors of CO2 emissions in Central Asia using LMDI decomposition, and employed decoupled elasticities and decoupled indices based on LMDI decomposition results to explore the relationship between economic growth and CO2 emissions. Chontanawat [18] decomposed the sources of changes in the level and intensity of CO2 emissions from the industrial sector in Thailand using the LMDI method and pointed out that the structural change effect contributes to the reduction of CO2 emissions and emission intensity. Isik [19] assessed and revealed the influential factors of CO2 emissions from the transport sector in Turkey between 2000 and 2017 using LMDI methodology, pointing out that economic growth is the main factor driving the rise of CO2 emissions from the transport sector.
Jiang [20] used the LMDI method based on Kaya’s constant equation to decompose the factors affecting non-residential electricity consumption in China into population size, economic development, regional economic structure, regional industrial structure, and electricity consumption intensity. Yasmeen [21] assessed the carbon emissions of Pakistan during 1972–2016 using the LMDI methodology and pointed out that economic development factors are the main drivers of the increase in per capita carbon emissions.
W. Zhang [22] decomposed the factors influencing the CO2 emission intensity of China’s manufacturing sector by combining the LMDI approach of the development model extension with the production theory approach. Dolge [23] applied LMDI decomposition analyses to investigate the changes in energy-related CO2 emissions from manufacturing industries in Latvia over the period from 1995 to 2019. He, Y [24] used a combination of LMDI decomposition and K-mean cluster analysis to examine the influential factors of carbon emissions in China’s power sector. Korica [25] used an LMDI analytical model to analyse the number of end-of-life vehicles managed in 31 European countries and the impact of these management choices on the total number managed. This study focuses on the prediction and control of regional carbon emissions in China, an engineering problem of great significance and urgency. Globally, China is one of the largest carbon emitters, and its goal of achieving carbon peaking and carbon neutrality is a milestone for global climate change response. The innovation of this paper is to provide a scientific basis for China to achieve the goals of carbon peaking and carbon neutrality through multi-scenario analyses by integrating economic, demographic and technological factors.
Currently, research on carbon emissions has made some progress globally, especially in understanding the drivers of carbon emissions and predicting future trends. The study S. Wang [4] compared the different paths that China might take in regional emissions reduction by modelling different “peak emissions” and “carbon neutral” pathways, and analysed the role of China’s economy, population and technology in this process.
While the existing studies provide valuable insights, some shortcomings remain. Most studies fail to adequately consider the impacts of interregional policy synergies and economic differences on carbon emission trends. For example, a comprehensive understanding of the development and application of carbon peaking and carbon neutrality, as described in Chang [6], has not yet been developed. In addition, for the study of agricultural carbon emissions, as described by Wu [10], while providing valuable data and analyses, the application and policy recommendations at the regional level are still insufficient. Meanwhile, the findings of Lyu [7] showed that the development of the digital economy can effectively reduce regional carbon intensity, but this effect varies across regions. Zhai [8] proposed a regional carbon emission prediction method and analysed the reduction potential under different policy and technology scenarios. S. H. Zhang [9] used a combination of models to explore carbon emission drivers, long-term emission reduction pathways and carbon quota allocation in the Beijing–Tianjin–Hebei region.
In the field of carbon emission forecasting and analysis, researchers have employed diverse models and methods to investigate multi-level challenges. Zhai [8] utilized the LEAP model to predict energy demand across Chinese regions and sectors, subsequently identifying regional carbon reduction potentials through precise analysis. Concurrently, Ye [26] innovatively combined the Autoregressive Integrated Moving Average (ARIMA) model with Support Vector Regression (SVR), leveraging their respective strengths in capturing linear and nonlinear patterns for accurate urban-level carbon emission predictions. To address challenges posed by technological and policy dynamics, Li [27] developed an integrated framework incorporating multimodal data, CNN-InceptionV2, attention-enhanced TextCNN, and BiLSTM networks, achieving high-precision carbon emission forecasts.
In related research, Ding [28] addressed time-lag and interaction effects of influencing factors by synergizing Choquet fuzzy integrals with grey multivariate lag models. Their empirical analysis of national carbon emission data demonstrated robust stability and reliability. Chang [6] employed Projection Pursuit Regression (PPR) to identify critical drivers of China’s CO2 emissions, revealing escalating electricity consumption as a key contributor. Their projections indicate sustained growth in building energy demand through 2050 absent substantial policy interventions or technological breakthroughs, underscoring the imperative for coordinated policy and innovation efforts.
This study aimed to fill these gaps by constructing more comprehensive models that provide more accurate guidance for policy formulation. We made use of the latest data and methods, such as machine learning techniques, to identify and quantify the key factors affecting carbon emissions. Through scenario analyses, we assessed the changes in carbon emissions under different policy and technology development pathways and proposed targeted policy recommendations to facilitate the reduction of regional carbon emissions and the achievement of carbon neutrality targets.
The objective of this study was to construct a comprehensive model to forecast regional carbon emission trends in China and to analyse potential pathways to achieve the goals of carbon peaking and carbon neutrality. Our work is based on a comprehensive analysis of a wide range of literature, including assessments of global carbon emission trends, carbon emission forecasting models, studies of the relationship between carbon emissions and economic growth, analyses of the factors influencing carbon emissions, and the linkages between carbon emissions, energy structure and technological progress. Our research work and key findings are presented below:
Application of integrated analytical methods: The LMDI decomposition method was used to analyse the factors affecting carbon emissions, a method widely used in energy and emissions research.
Application of machine learning techniques: Our study also utilized a BP neural network model to predict carbon emissions, which is a powerful nonlinear prediction tool. The application of the GA-SVM model in predicting CO2 emissions is mentioned in Zhou [16], while L. Zhang [29] proposed a constrained optimization method based on the BP neural network.
Scenario analysis: By combining scenario analysis with a BP neural network approach, we combined predictive power with the ability to consider possible future developments. This method not only considers possible future developments but also effectively uses historical data to improve the accuracy of the forecast, as demonstrated by Pan, Zhou [30]. They showed that the integration of scenario analysis and neural networks is a robust approach for forecasting carbon emissions from the transport sector.
Policy recommendations: Based on the results of our analyses, we made targeted policy recommendations to promote regional carbon emission reductions and carbon neutrality targets. Gao [31] noted that approaches to both the prediction and management of agricultural carbon emissions are important components of our study.
Key findings: Our findings suggest that by optimizing the energy mix and improving energy efficiency, combined with appropriate policy incentives, China can achieve its carbon peaking and carbon neutrality targets within a given timeframe. These findings not only provide new perspectives for academics, but also offer practical guidance for policymakers.
This study constructed a hybrid modelling framework synergistically driven by Logarithmic Mean Divisia Index (LMDI) decomposition and back propagation (BP) neural networks, effectively bridging the traditional methodological problem between static attribution analysis and dynamic prediction in carbon emission research. The LMDI methodology employs the Kaya identity to achieve precise quantification of driving factors. Simultaneously, the BP neural network dynamically captures complex interaction effects between urbanization rates and GDP growth through its nonlinear mapping capabilities. The deep integration of these approaches enables tripartite functional convergence in mechanistic interpretation, trend projection, and policy simulation.
This dual-driven architecture overcomes the inherent rigidity of standalone decomposition models in long-term scenario extrapolation while addressing the attribution ambiguity characteristics of purely data-driven approaches. The proposed framework provides scientifically robust and operationally actionable decision-support tools for high-growth regions navigating the “development–emission reduction” dilemma under China’s dual carbon peaking and neutrality targets.
In summary, this study provides new perspectives and tools for carbon emission control and policymaking in China and globally through comprehensive analyses and forecasting models. Our findings not only contribute to the understanding of the drivers of carbon emissions but also offer practical guidance for achieving the goals of carbon peaking and carbon neutrality.

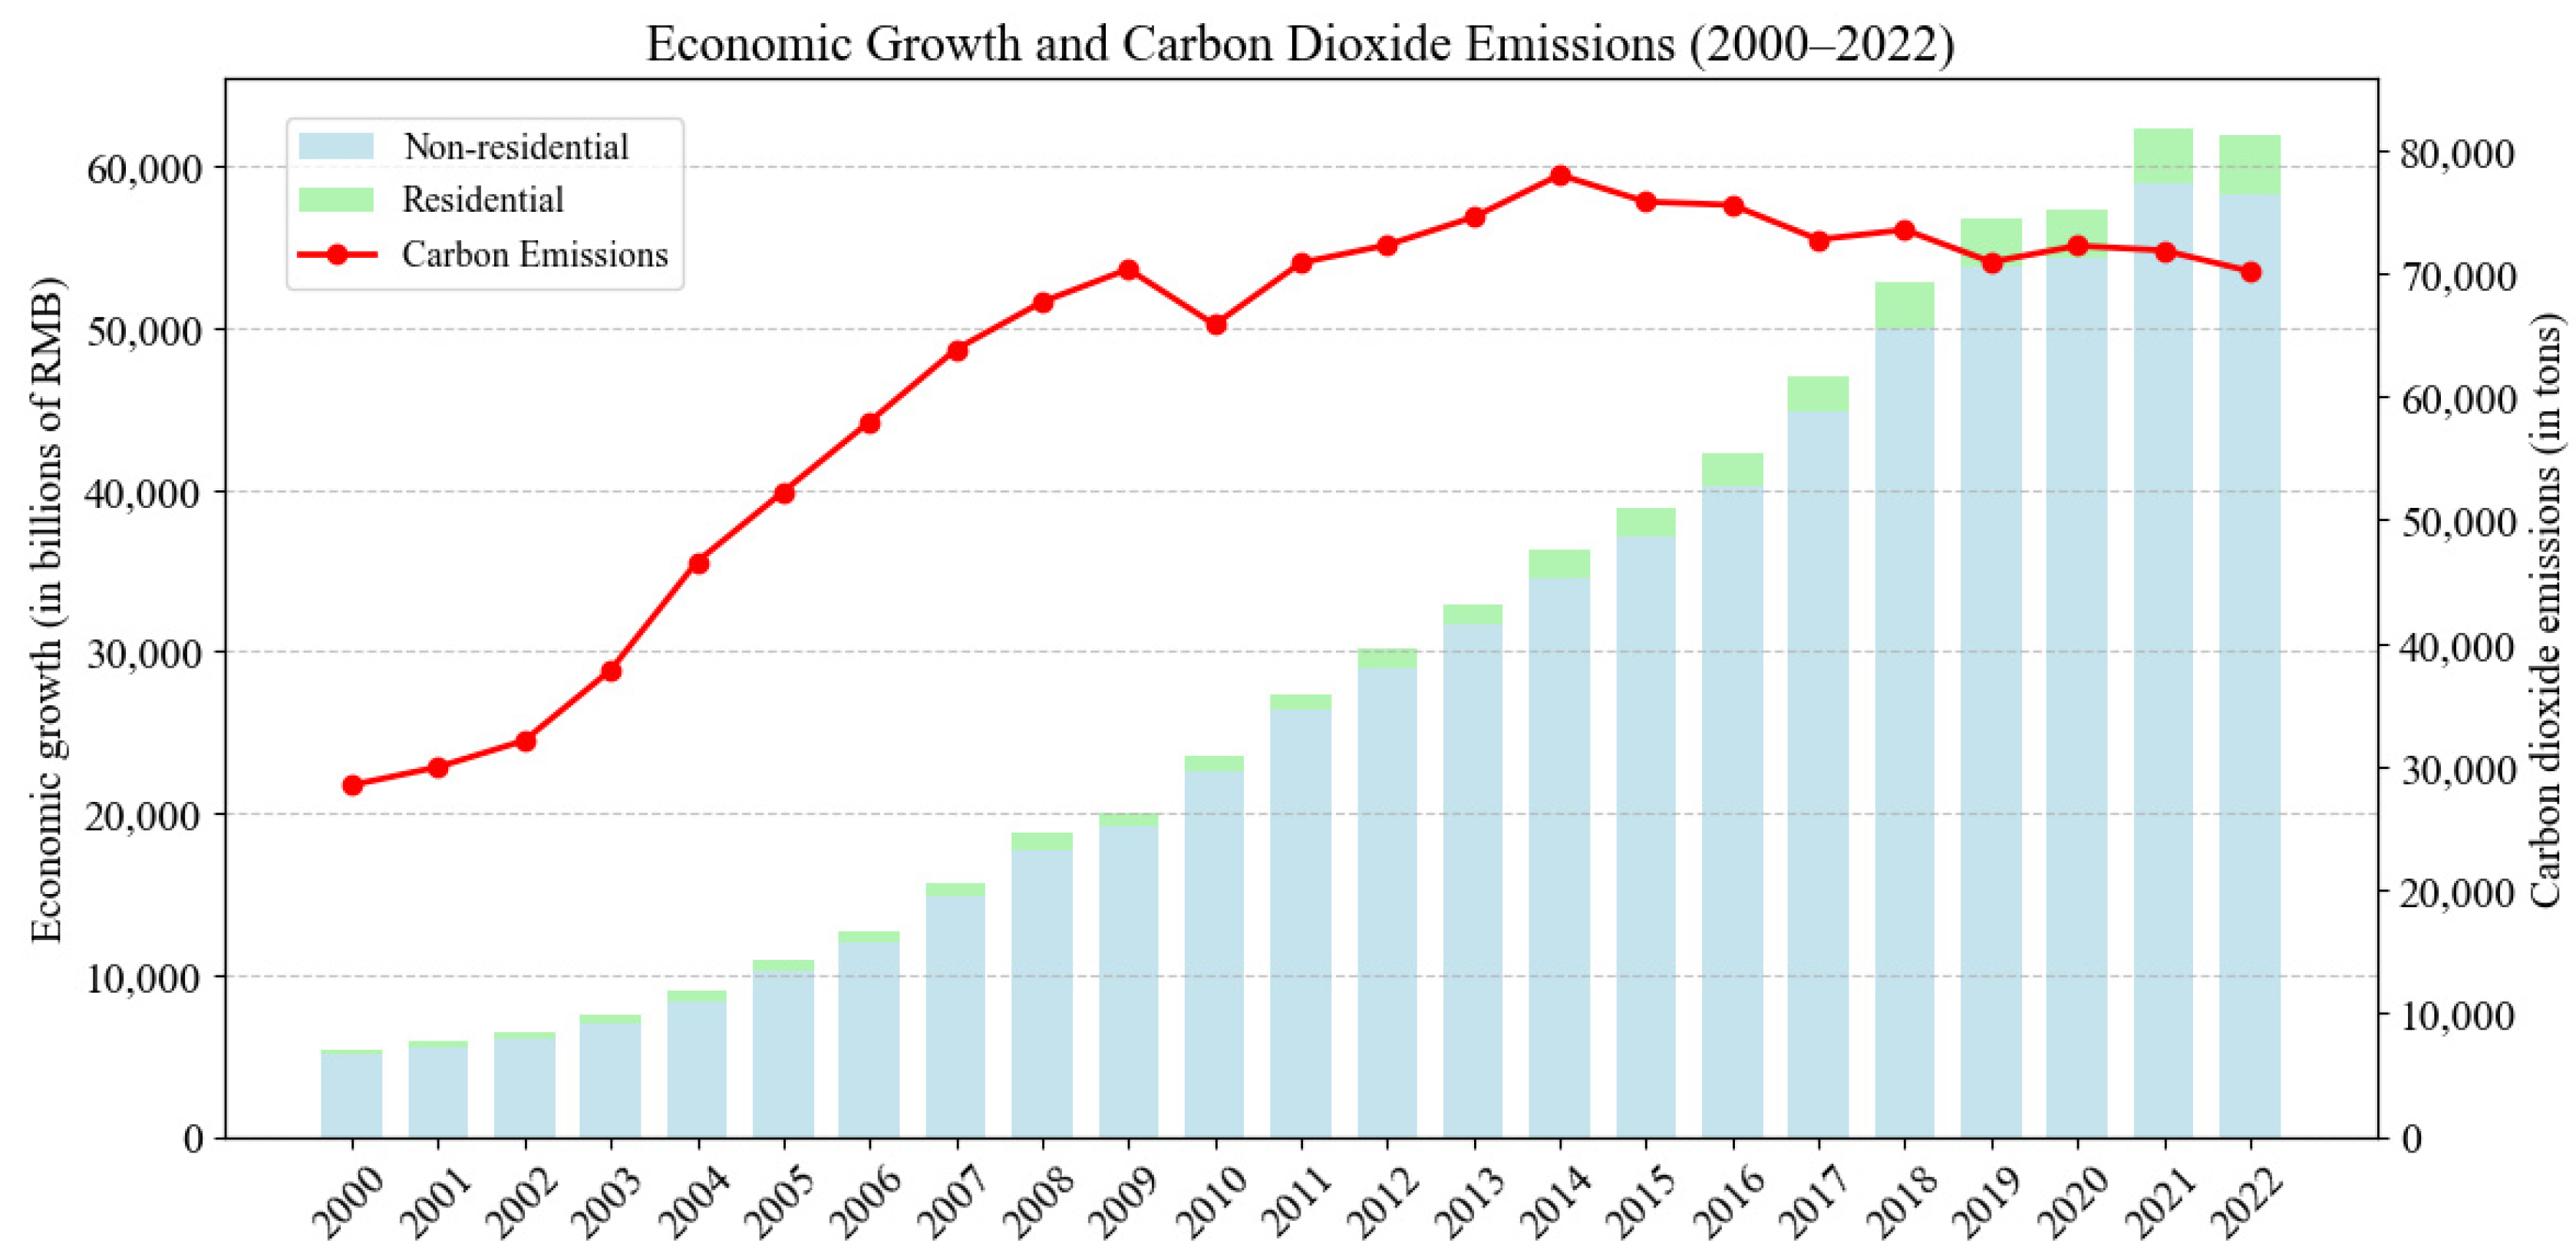
2. Economic Growth and Carbon Dioxide Emissions

As shown in Figure 1, the economic development of Henan Province has continued to move forward over the past 22 years, demonstrating strong growth momentum. From 2000 to 2022, the gross domestic product (GDP) of Henan Province grew from 505.299 billion yuan to 5,9132.39 billion yuan, representing an increase of about 11.7 times and an average annual growth rate of 9.6 percent. This period has been accompanied by the booming development of new industries and businesses, which have boosted economic activities in all fields.
In terms of carbon emissions from the transport sector in Henan Province, the data reveal an upward trend, increasing from 57,026,000 tonnes in 2000 to 140,316,100 tonnes in 2022. Despite this significant escalation in carbon emissions, the trajectory of the growth rate diverges from the economic development pattern. Notably, total carbon emissions reached a peak of 155,914,700 tonnes in 2014, followed by a marginal decline in 2015 and 2016, indicative of the nation’s efforts in implementing emission reduction policies.
The value added by the transport industry has exhibited a sustained upward trend, escalating from 39.188 billion yuan in 2000 to 372.108 billion yuan in 2022. This indicates the progressive enhancement of the transport industry’s role within the national economy. This growth signifies that, alongside rapid economic development, the transport industry not only facilitates the circulation of a variety of goods and services but also establishes a foundation for the further expansion of the national economy.

3. Methods and Data

3.1. Date

In this study, missing values were addressed through linear interpolation to ensure data continuity, while min–max normalization was systematically applied to eliminate scale discrepancies among variables during the prediction phase. This dual preprocessing strategy maintains data integrity while enhancing model comparability across heterogeneous metrics.
In the transport sector, carbon emissions are typically calculated using two predominant methodologies: the top-down approach and the bottom-up approach. The top-down approach is anchored in macro-level data, encompassing total energy consumption and the energy mix of a country or region. The procedure for this methodology is as follows: initially, total energy consumption is determined, followed by the extrapolation of total carbon emissions based on the energy mix and the associated carbon emission factors. This method is well-suited for estimating carbon emissions at the national or regional scale, particularly excelling at the macro level where data are centralized and harmonized.
In contrast, the bottom-up approach concentrates on individual emission sources, directly measuring or estimating the carbon emissions from each source and aggregating these data to derive the total carbon emissions. However, this method presents greater challenges in terms of data collection and processing, necessitating a substantial number of on-site measurements and comprehensive source-specific data. Given the focus of this paper on provincial carbon emissions, a top-down approach was employed for the calculations. The specific steps for the calculation are as follows:
C E = i = 1 m c i = i = 1 m e i × σ i
where C E is the total amount of carbon emissions, c i is the total amount of carbon emissions from energy source category i , e i is the consumption of energy source category, and i and σ i are the carbon emission coefficients of energy source category i . Based on the data provided by the Climate Change Programme of the National Science and Technology Commission of China, the carbon emission coefficients for each type of energy were determined and assumed to remain constant during the study period. The specific data are shown in Table 1:

3.2. Methodologies

3.2.1. Kaya’s Constant Equation

Proposed by Japanese scholar Yoichi Kaya, this equation is mainly used to link CO2 emissions to economic, policy, demographic and other factors. Kaya’s Constant Equation provides a framework through which carbon emissions can be decomposed into the product of several key factors, such as population P , G D P , energy intensity E / G D P , and carbon intensity C / E . The formula is shown specifically below:
C = C E × E G × G P × P

3.2.2. LMDI Model

LMDI models are extensively applied in the realms of energy economics, environmental science, and policy analysis, particularly in evaluating the causes and trends of changes in energy consumption and carbon emissions. These models can effectively integrate with Kaya’s Constant Equation to dissect the factors influencing carbon emissions with greater precision. After pinpointing the primary factors affecting carbon emissions through the Kaya equation, the LMDI model further decomposed the specific contributions of these factors to changes in carbon emissions. The energy consumption (E) component in the Kaya equation can be further broken down into elements such as energy intensity and energy mix. Subsequently, the LMDI model was employed to quantify the impact of these factors on total carbon emissions. By leveraging the combination of the Kaya Constant Equation and the LMDI model, researchers achieved a more holistic understanding of the multifaceted factors driving environmental change and established a more accurate foundation for policy formulation. This approach aids in identifying pivotal areas for emission reduction and potential mitigation strategies. It logically leads to the derivation of the following equation:
C = i C i E i × E i T i × T i H × H G × G P u × P u P × P
Simplified, it is as shown below:
C = I × U × T × V × M × S × P
The meanings of the main variables are shown in Table 2.
The decomposition of LMDI is shown below:
C = C t C 0 C ϱ = i   C i t C i 0 ln C i t ln C i 0 ln Q i t Q i 0
The breakdown is as follows:
C I = i C i t C i 0 ln C i t ln C i 0 ln I i t I i 0
C U = i C i t C i 0 ln C i t ln C i 0 ln U i t U i 0
C T = i C i t C i 0 ln C i t ln C i 0 ln T i t T i 0
C V = i C i t C i 0 ln C i t ln C i 0 ln V i t V i 0
C M = i C i t C i 0 ln C i t ln C i 0 ln M i t M i 0
C P = i C i t C i 0 ln C i t ln C i 0 ln P i t P i 0
Energy Carbon Emission Factor ( I ): The carbon emission factor is a critical parameter that quantifies the amount of carbon dioxide emitted per unit of output, such as per unit of energy consumed, per unit of product produced, or per unit of service provided, for a specific activity or process. The significance of the carbon emission factor remains paramount for assessing and mitigating greenhouse gas (GHG) emissions.
Level of energy consumption per unit of transport ( U ): The energy consumption level per unit of transport is defined as the amount of energy expended to accomplish a unit of transport work over a specified period. This metric is widely utilized to gauge the energy efficiency and consumption characteristics of a transport system.
Transport turnover per unit of output ( T ): The total volume of transport completed by the transport industry to generate a certain economic output within a certain period of time is an important indicator. This metric is commonly used to measure the efficiency and output level of the transport sector and to assess the contribution of transport services to economic development.
Transportation output per unit of GDP ( V ): Transport output per unit of GDP is an economic indicator that quantifies the economic contribution and efficiency of the transport sector. This metric reflects the transport sector’s contribution to GDP over a specified period, indicating the proportion of the economic output generated by the transport sector relative to the total economic output.
GDP per capita of urban residents ( M ): GDP per capita of the urban population within a given region or country is an important economic indicator. This metric reflects the average level of economic output per urban resident and serves as a key measure of the economic situation in towns and cities, as well as the living standards of their residents.
Urbanisation rate ( P ): This is an indicator that reflects the level of urbanisation development in a country or region. The urbanisation rate is typically expressed as the proportion of the urban population to the total population.

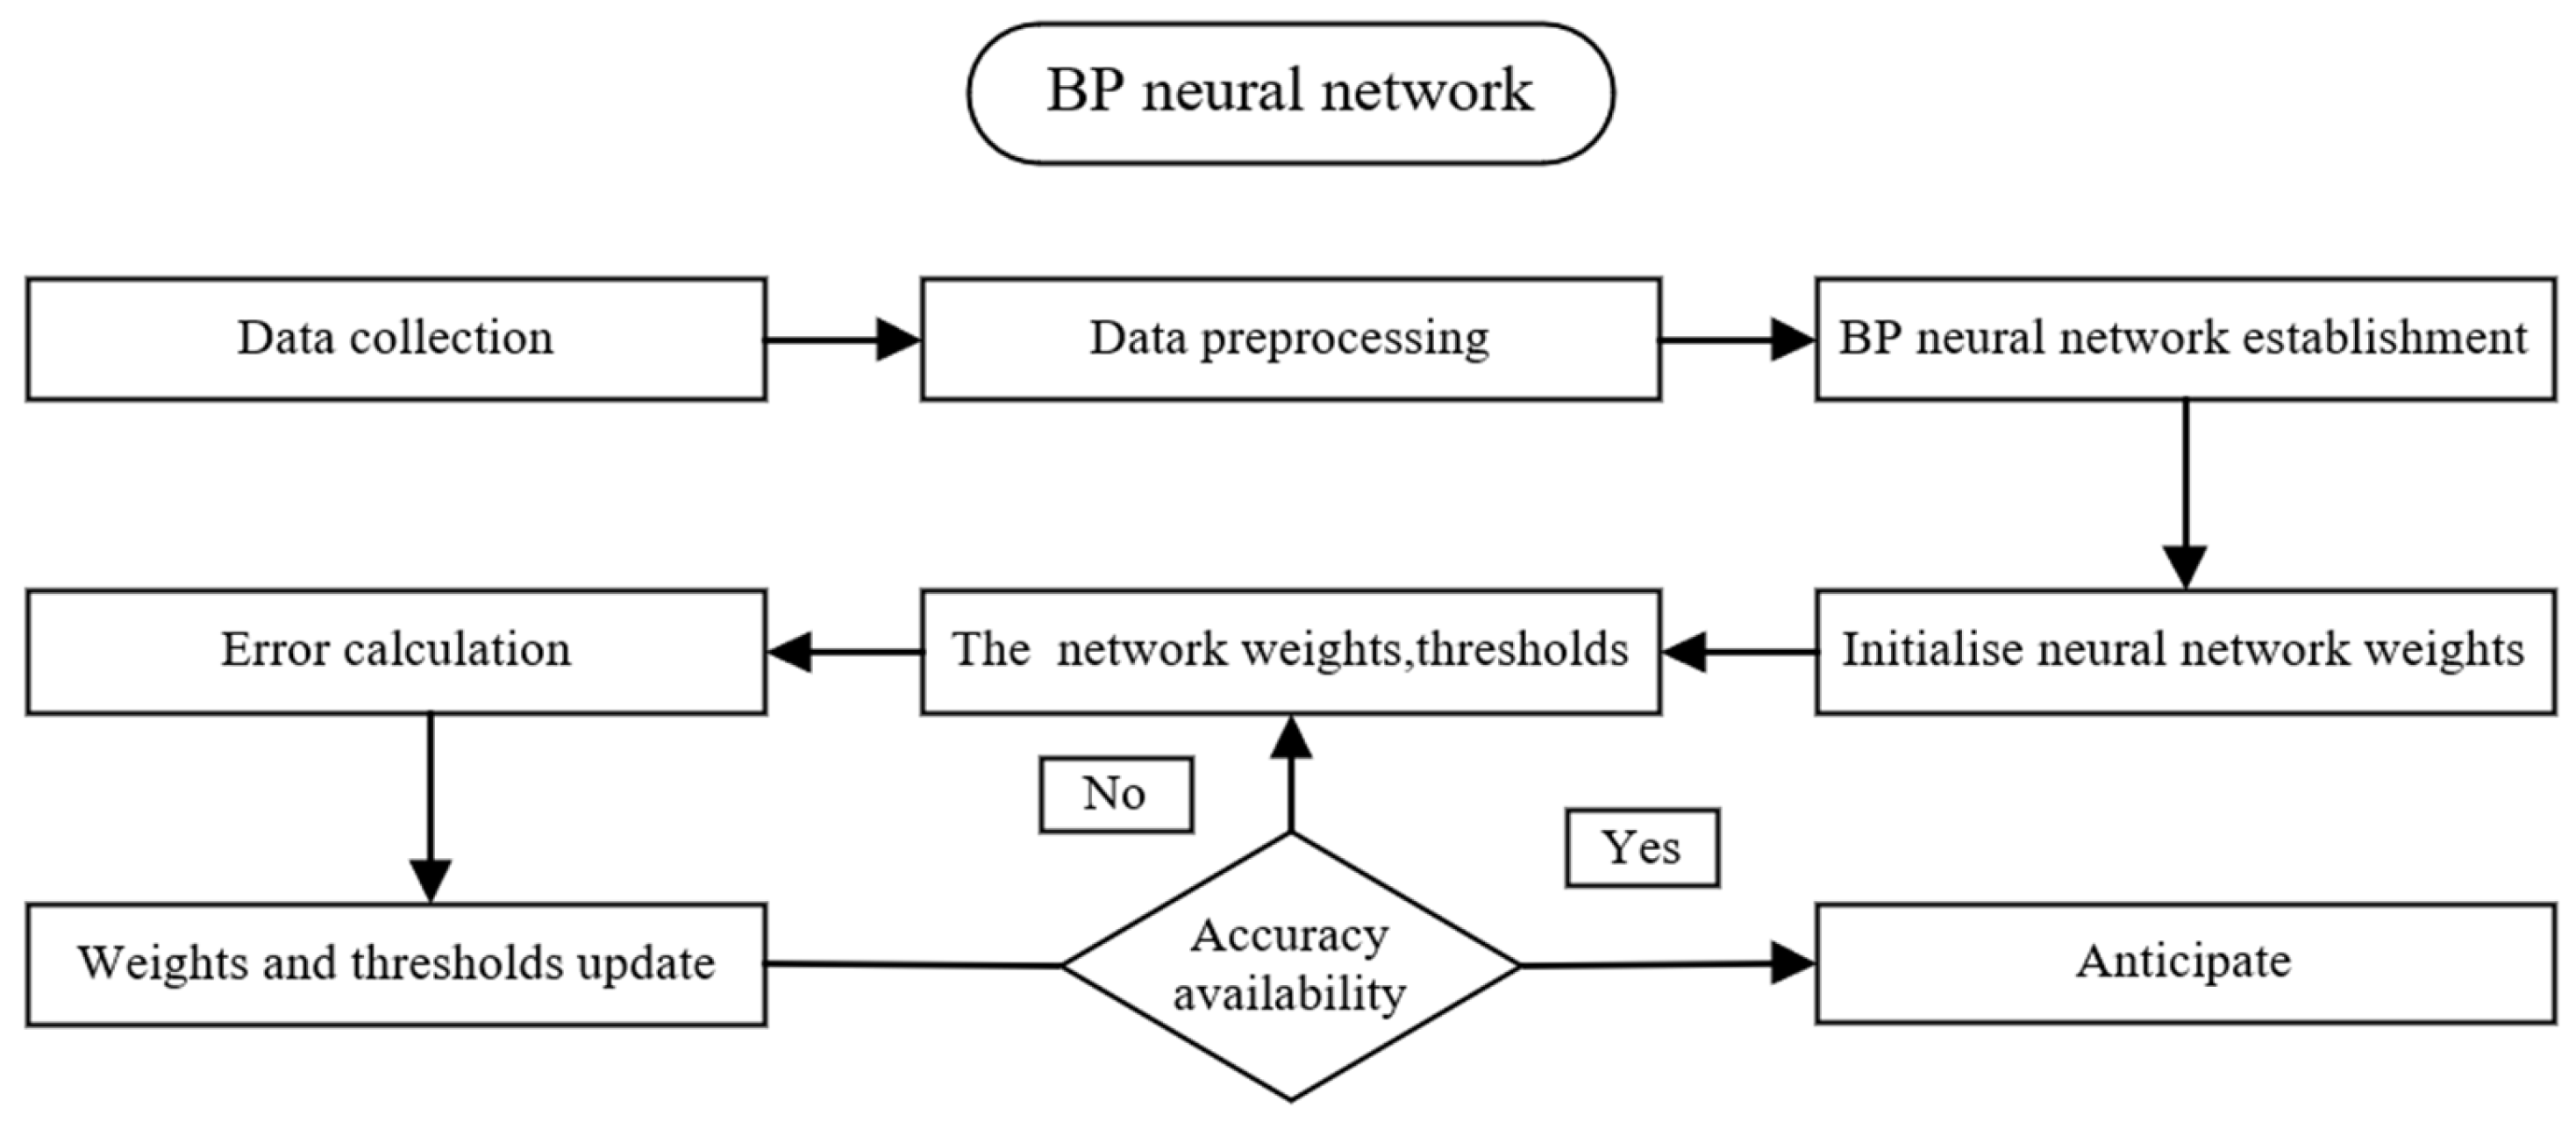
3.2.3. BP Neural Network

The rationale for selecting the BP neural network over alternative machine learning models in this study is threefold. Firstly, the BP neural network demonstrates superior stability when processing small-sample datasets. Secondly, the hidden layer of the BP neural network can effectively capture the nonlinear characteristics inherent in carbon emission data. Thirdly, when integrated with LMDI decomposition results, the layer-by-layer weight adjustment mechanism of the BP neural network enables the effective interpretation of factor contributions. The training process of a BP neural network encompasses backpropagation of error, a mechanism that minimizes the prediction error in the output layer by computing the gradient and adjusting the weights. During the forward propagation phase, input data traverses the network layer by layer. Neurons within each layer execute a weighted summation of the outputs from the preceding layer and produce a new output signal via an activation function. When a discrepancy arises between the network’s output and the desired output, the backpropagation phase is initiated. This phase utilizes the error to compute the gradient of the loss function, which is then minimized by retroactively passing it through the network using the chain rule and updating the weights and biases of the neurons in each layer. Figure 2 illustrates the principles of the neural network.
The training process of a BP neural network is an iterative optimization process, which gradually aligns the predicted output with the true value through continuous adjustment of network parameters. This network’s learning capability and generalization performance lead to its widespread application in various domains, including pattern recognition, time series prediction, classification, and regression. Additionally, the BP neural network can effectively mitigate the covariance issues that may arise in predicting carbon emission factors. The BP neural network process is specifically shown in Figure 3.

3.2.4. Flowchart of the Methodology

In this study, a comprehensive method combining the LMDI decomposition method and BP neural network model was used to analyse the influencing factors of transportation carbon emissions in Henan Province and forecast its future trend. The specific process is shown in Figure 4.
The above can be divided into five main modules, which are data collection, data preprocessing, feature selection and extraction, prediction modelling and result output. The data collection module obtains transportation carbon emissions and related data from data sources such as Henan Statistical Yearbook. The data preprocessing module cleans and normalizes the data to ensure data quality. The feature selection and extraction module applies the LMDI decomposition method to screen out the key features that have a significant impact on transportation carbon emissions and further extracts the features to reduce the data dimension. The prediction model was constructed based on the BP neural network, and the training set was used to train and optimize the model parameters and structure. The resulting output module used the trained model to predict the transportation carbon emissions, and provided a scientific basis for policy making through visual display and report generation.as shown in Figure 5.

4. Results

4.1. Carbon Emission

The research period for this paper spanned from 2001 to 2022, with data collected from the Henan Statistical Yearbook, China Energy Statistical Yearbook, and China Transport Statistical Yearbook. The transport turnover data encompassed both passenger and freight transport, standardized by applying uniform passenger and freight conversion coefficients. The freight turnover served as the basis for our calculations. In accordance with China’s current statistical system, the conversion factors for railways, highways, water transport, and aviation were 1, 0.1, 0.33, and 0.072, respectively. The carbon emissions values were derived using Equation (1), and the year-by-year carbon emissions in the transport sector are shown specifically in Figure 6.

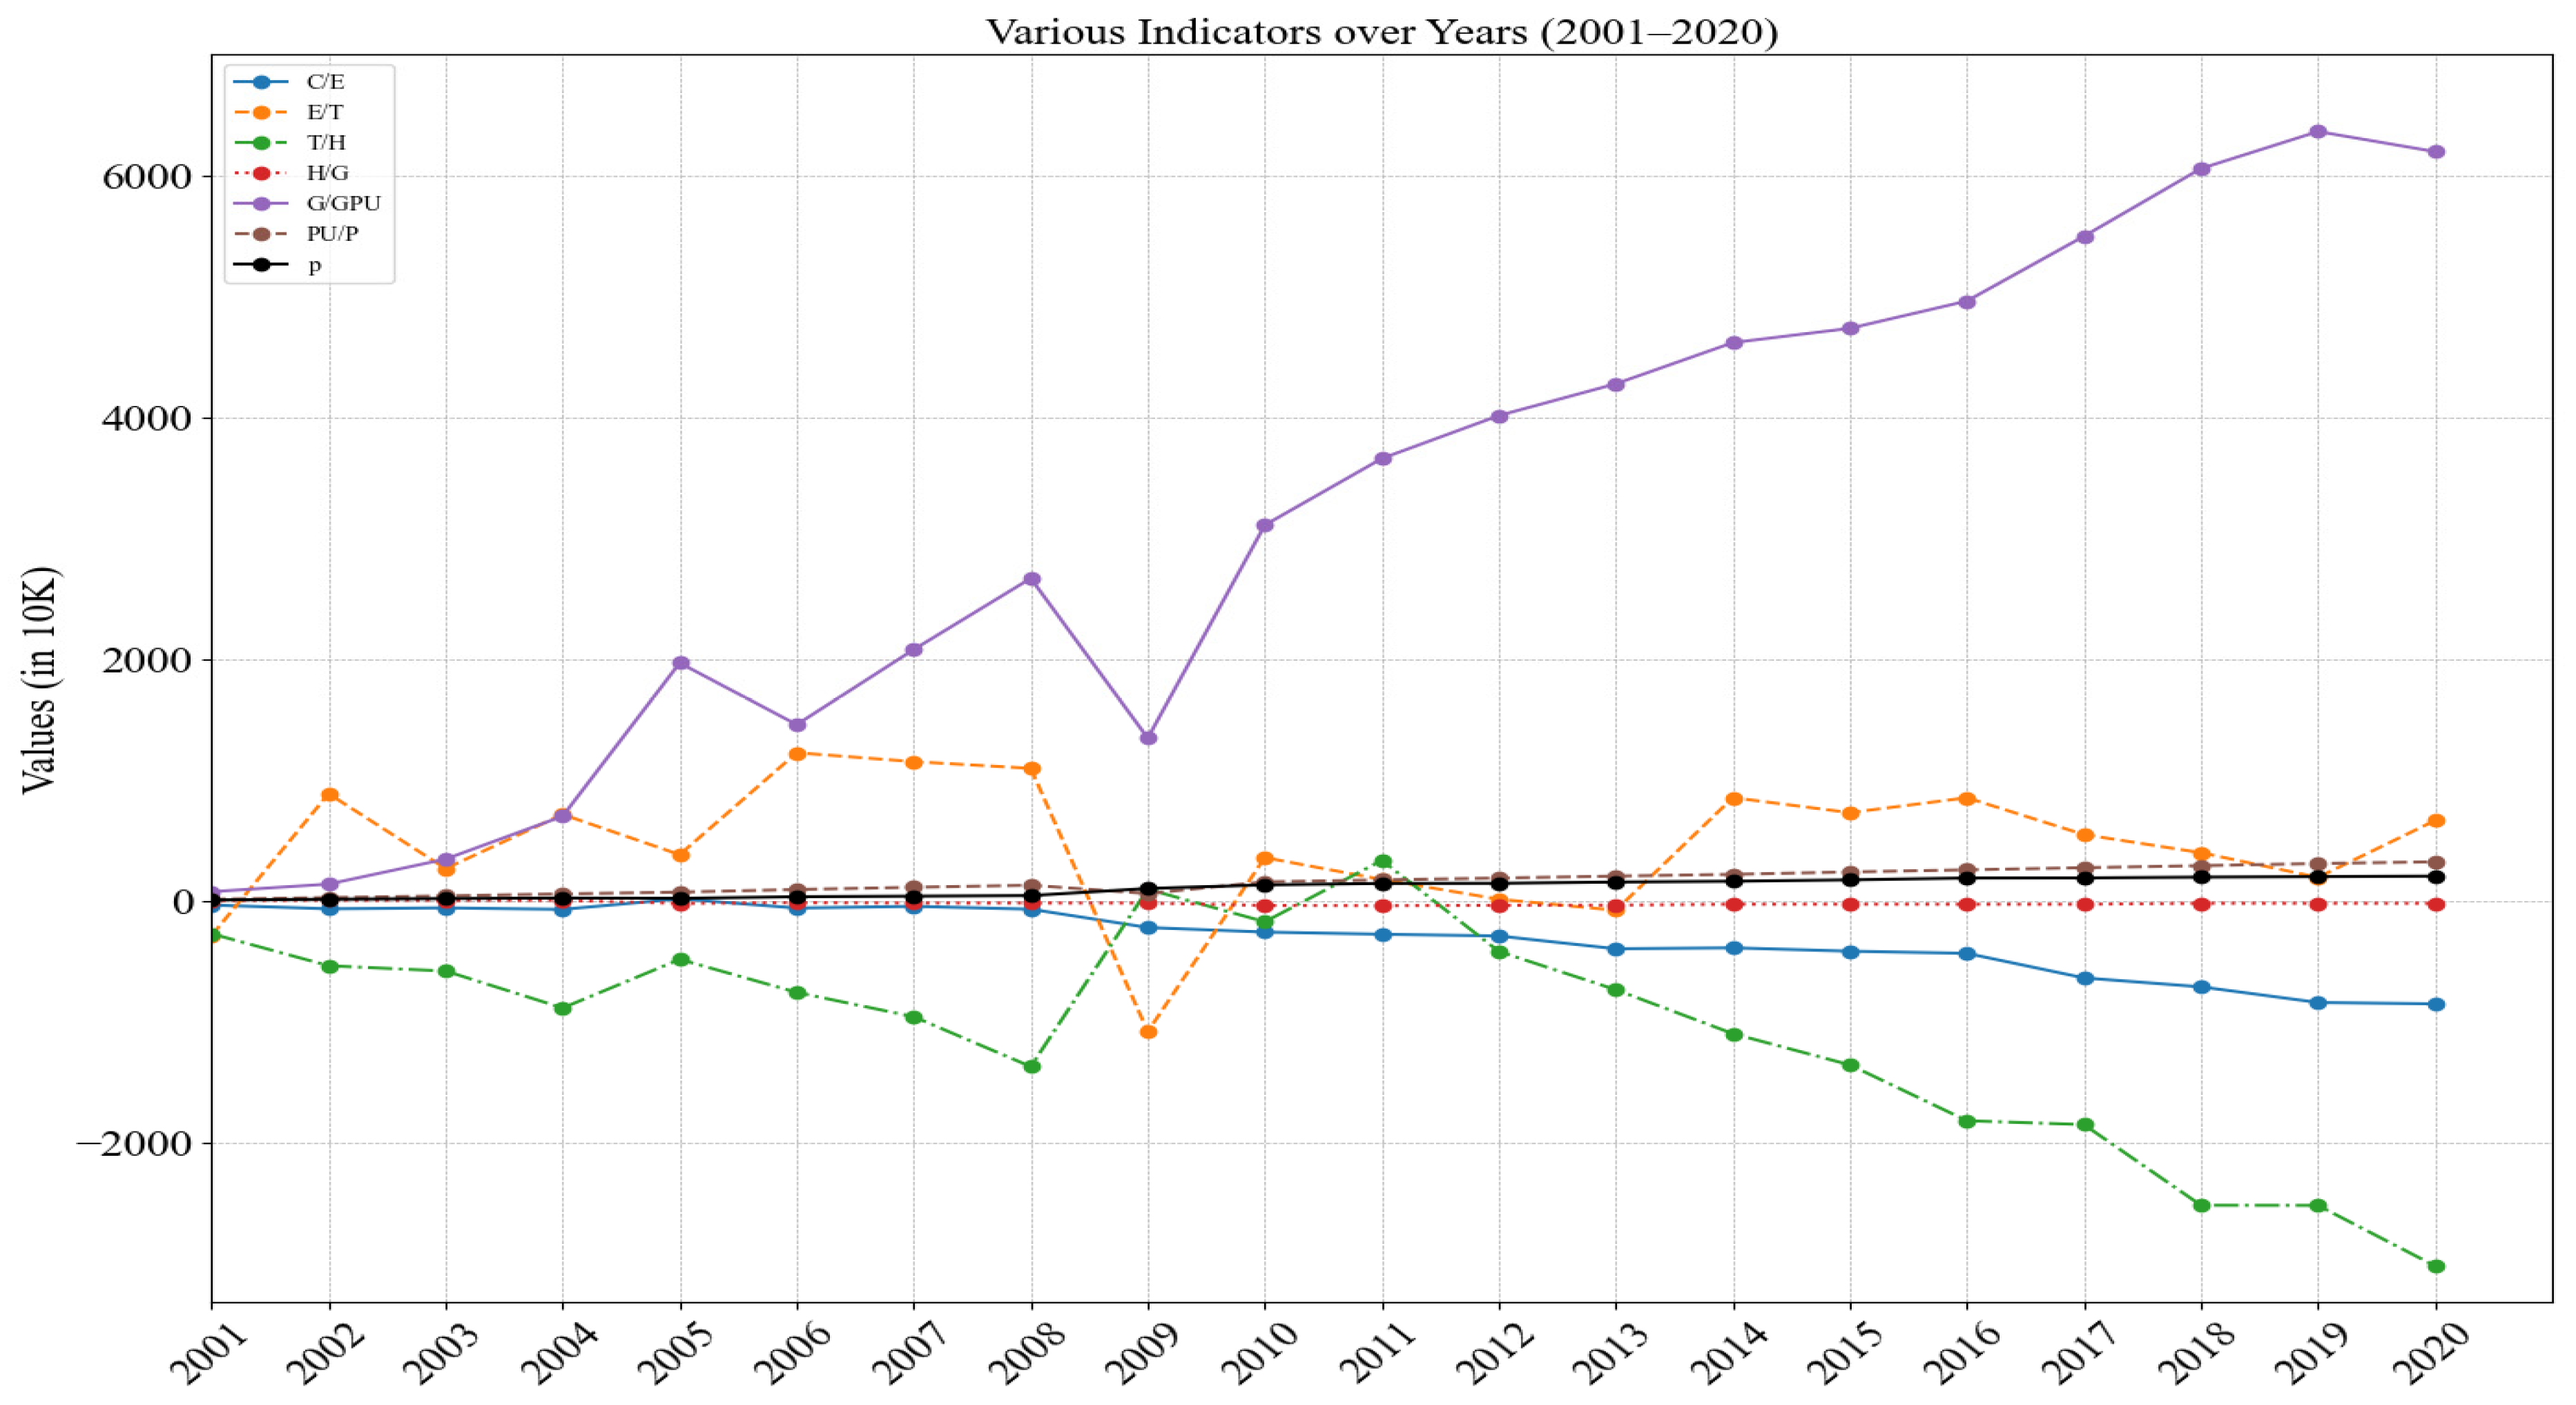
4.2. LMDI Decomposition Results

The decomposition results of carbon emissions in the transportation sector of Henan Province, as shown in Figure 7, indicate that the energy carbon emission coefficient, turnover per unit of transportation output, and transportation output per unit of GDP have an inhibitory effect on carbon emissions in the transportation sector, while the level of energy consumption per unit of transportation, the GDP per capita of urban residents, and the urbanization rate along with the total population of the transportation sector have a promotional effect on carbon emissions in the transportation sector.
The energy carbon emission factor exhibits an overall inhibitory effect, accounting for a cumulative reduction of 853.07885 million tons of carbon emissions between 2001 and 2020. This inhibitory effect is progressively strengthening in recent years, as the economic output per unit of energy consumption increases due to advancements in energy efficiency and technology. This improvement leads to a decreased energy demand per unit of output, consequently lowering carbon emissions. Concurrently, the optimization of the energy mix, including the substitution of cleaner energy sources like wind and solar for fossil fuels, diminishes the carbon intensity per unit of energy. Additionally, economic structural transformations, such as a transition from heavy industry to service sectors, may also decrease reliance on carbon-emitting energy sources.
The suppression of carbon emissions per unit of output turnover in transport has been particularly prominent, contributing to a total reduction of 302.16 million tons of carbon emissions over the past two decades. Technological advances should not be overlooked, as the energy efficiency of modes of transport has improved with the application of new technologies, such as more efficient engines, optimized driveline systems, and aerodynamic designs. At the same time, transport efficiency increases as transport systems are optimized, for example, through more precise scheduling and route planning, reducing ineffective operation and idling. Transportation output values also curb the growth of carbon emissions to some extent, with the application of Intelligent Transportation Systems (ITS), such as traffic signal optimization and the provision of real-time traffic information, helping to reduce congestion and delays, and lowering energy consumption. Nearly two decades ago, the government introduced energy efficiency standards and regulations, such as the implementation of the first phase of the national motor vehicle pollutant emission standards in 2000 and then the implementation of the sixth phase of the national motor vehicle pollutant emission standards in 2001, which required carbon monoxide emissions to not exceed 0.7 milligrams per kilometre, a reduction of 45 times compared to the previous standard. At the same time, multimodal transport can effectively optimize the mode of cargo transport, reduce long-distance road transport, and make use of more efficient modes of transport such as railroads and waterways.
The overall energy consumption per unit of transport exerts a promotional effect on carbon emissions, leading to an increase of 66.35 million tonnes over the past two decades. This trend can be attributed to the significant expansion of China’s road network, which grew from 1,402,700 km in 2000 to 5,280,700 km in 2021, along with a concurrent surge in door-to-door transport services, contributing to the rise in carbon emissions. Additionally, urbanization and population growth play a role in this increase. The migration of populations to urban areas, coupled with the heightened demand for housing and livelihoods, led to an increased demand for residential, infrastructure, and public services. The construction and operation of these facilities generated additional carbon emissions. Urbanization is often accompanied by the expansion of industrial and commercial activities, which consume more energy in the production and transport of goods, thereby increasing carbon emissions. To accommodate the growing urban population, the construction of additional infrastructure, such as roads, bridges, and buildings, is necessary. These construction and maintenance processes consume energy and produce carbon emissions.
Per capita GDP of urban residents in Henan Province significantly propelled carbon emissions from 2001 to 2020. This reflects that the rapid economic development, rising income levels, and consumption structure upgrades increased transportation demand, thus increasing carbon emissions. Meanwhile, the transportation industry output also impacted carbon emissions. Its growth indicates the growing importance of the transportation sector in the economy. However, transport turnover per unit of transportation industry output had an inhibiting effect on carbon emissions, indicating that improved transport efficiency somewhat slowed the growth of carbon emissions.
Compared with Shandong Province, Henan Province has a faster growth rate of transportation—related carbon emissions. Shandong Province is more proactive in economic structural adjustment, with the rapid development of the service industry, which has a clear substitution effect on the industrial transport demand that generates high carbon emissions. In contrast, Henan Province is still in the stage of accelerating industrialization, with a large demand for heavy industrial transport, resulting in a faster increase in carbon emissions. Beijing has implemented strict vehicle quota and tail number restriction policies to control transportation-related carbon emissions, effectively reducing urban traffic congestion and carbon emissions. Henan Province can learn from this experience, combine it with local realities, and develop suitable transportation demand management policies, such as peak hour traffic restrictions in major cities, to further reduce transportation-related carbon emissions. The detailed breakdown is shown in Table 3.

5. Transportation Carbon Emission Projections and Policy Suggestions

5.1. Model Establishment

In this study, the LMDI decomposition method was employed to quantify the impact of various influencing factors on carbon emissions. The main factors identified through this decomposition were selected as the input layer of our neural network, with the corresponding carbon emissions serving as the output layer.
We developed a BP neural network model using the Pycharm2021.1 deep-learning library Keras. During the data preprocessing phase, the feature data were normalized via the MinMaxScaler method, which scales all feature values to the range of 0 to 1. This normalization step ensures that the model is not biased by features of different scales and accelerates the training process. The target variables also undergo the same normalization process.
For predicting total carbon emissions, the output layer uses a linear activation function. The model was trained with the Adam optimizer, which adjusts the learning rate adaptively to accelerate convergence and enhance performance. The mean square error (MSE) was selected as the loss function to measure the discrepancy between predicted and actual values. To prevent overfitting, early stopping was adopted; training halts when the validation loss does not improve for 10 consecutive epochs. The maximum training epochs were set to 500, and the batch size was 64. Figure 8 presents the prediction results.
Our neural network was very stable in its learning curve, with a final R2 result of 0.9976, which proves the accuracy and reliability of the model in the prediction task. This R2 not only shows that the predicted values are very close to the actual values but also shows that the margin of error for each data point is very small. The predicted output closely follows the true value, which indicates that the model exhibits robust performance across the entire dataset.

5.2. Model Parameters and Predictive Analysis

This study employed a hybrid approach that integrated scenario analysis with BP neural networks to forecast future carbon emissions in the transport sector. Scenario analysis, a method widely adopted since the 1970s, constructs plausible future development trajectories based on current trends and potential policy shifts, considering human factors and external condition changes. By employing scenario analysis, we established future scenarios and projected the growth rates of key influencing factors based on the existing literature, historical policies, and empirical data. The projected data serve as inputs to the BP neural network, which is then trained to forecast carbon emissions in the transport sector. This synergistic approach harnesses both potential future developments and historical data, thereby enhancing the precision of our predictions and bolstering the practical significance and scientific rigor of our study in the context of transport sector carbon emissions forecasting.
In forecasting future carbon emissions from the transport sector, a nuanced approach was utilized to analyse future trends in key indicators. According to the China Energy Development Report and historical statistics, the level of energy consumption per unit of transport is projected to exhibit a declining trend of 1.02 percent per annum until 2025, with a slight increase in this decline to 1.015 percent anticipated post-2025. Regarding the transport structure, the Statistical Bulletin on the Development of the Transport Industry indicates a continuous optimization of freight transport structure. Long-term trend analysis suggests that road transport turnover is expected to decrease at an average annual rate of 1.0 percent until 2025, potentially rising to 1.20 percent thereafter. For transport output, in conjunction with the adjustment of the base period for domestic economic statistics, an average annual growth rate of 6.0 percent is forecasted until 2025, with an expected increase to 7.0 percent post-2025. In terms of GDP growth, aligning with economic development reports from the World Bank and others, the average annual growth rate is projected at 6.0 percent until 2025, with an anticipated adjustment to 5.0 percent thereafter. Concerning population growth, the 2020 census results show that China’s total population is 1.41 billion, with an average annual growth rate of 0.53 percent, and the proportion of the urban population has reached 63.9 percent. Based on the analysis of China’s current demographic trends and considering the impact of existing policies, the annual average growth rates for the total population and urban population are expected to be 0.05 percent and 1.50 percent, respectively, before 2025, and are projected to adjust to 0.048 percent and 1.20 percent, respectively, after 2025. A detailed breakdown of the projected growth for these underlying indicators is presented in Table 4.
The projected outcomes for transport carbon emissions are depicted in Figure 9, demonstrating a strong correlation between the projected and actual observed values. Upon analysing the various influencing factors, it is anticipated that China’s transport carbon emissions will continue to increase in the short term, with a specific projection of reaching 153.18 million tonnes by 2025 and further increasing to 157.45 million tonnes by 2030. This growth, compared to the period preceding 2020, indicates a slight deceleration in the overall growth rate. Consequently, China’s transport sector is anticipated to face mounting pressure to reduce emissions amidst a continuing upward trend in carbon emissions. This trend could present a significant challenge to China’s goals of achieving carbon peaking and carbon neutrality, necessitating the accelerated development and implementation of effective policies to mitigate this trajectory.

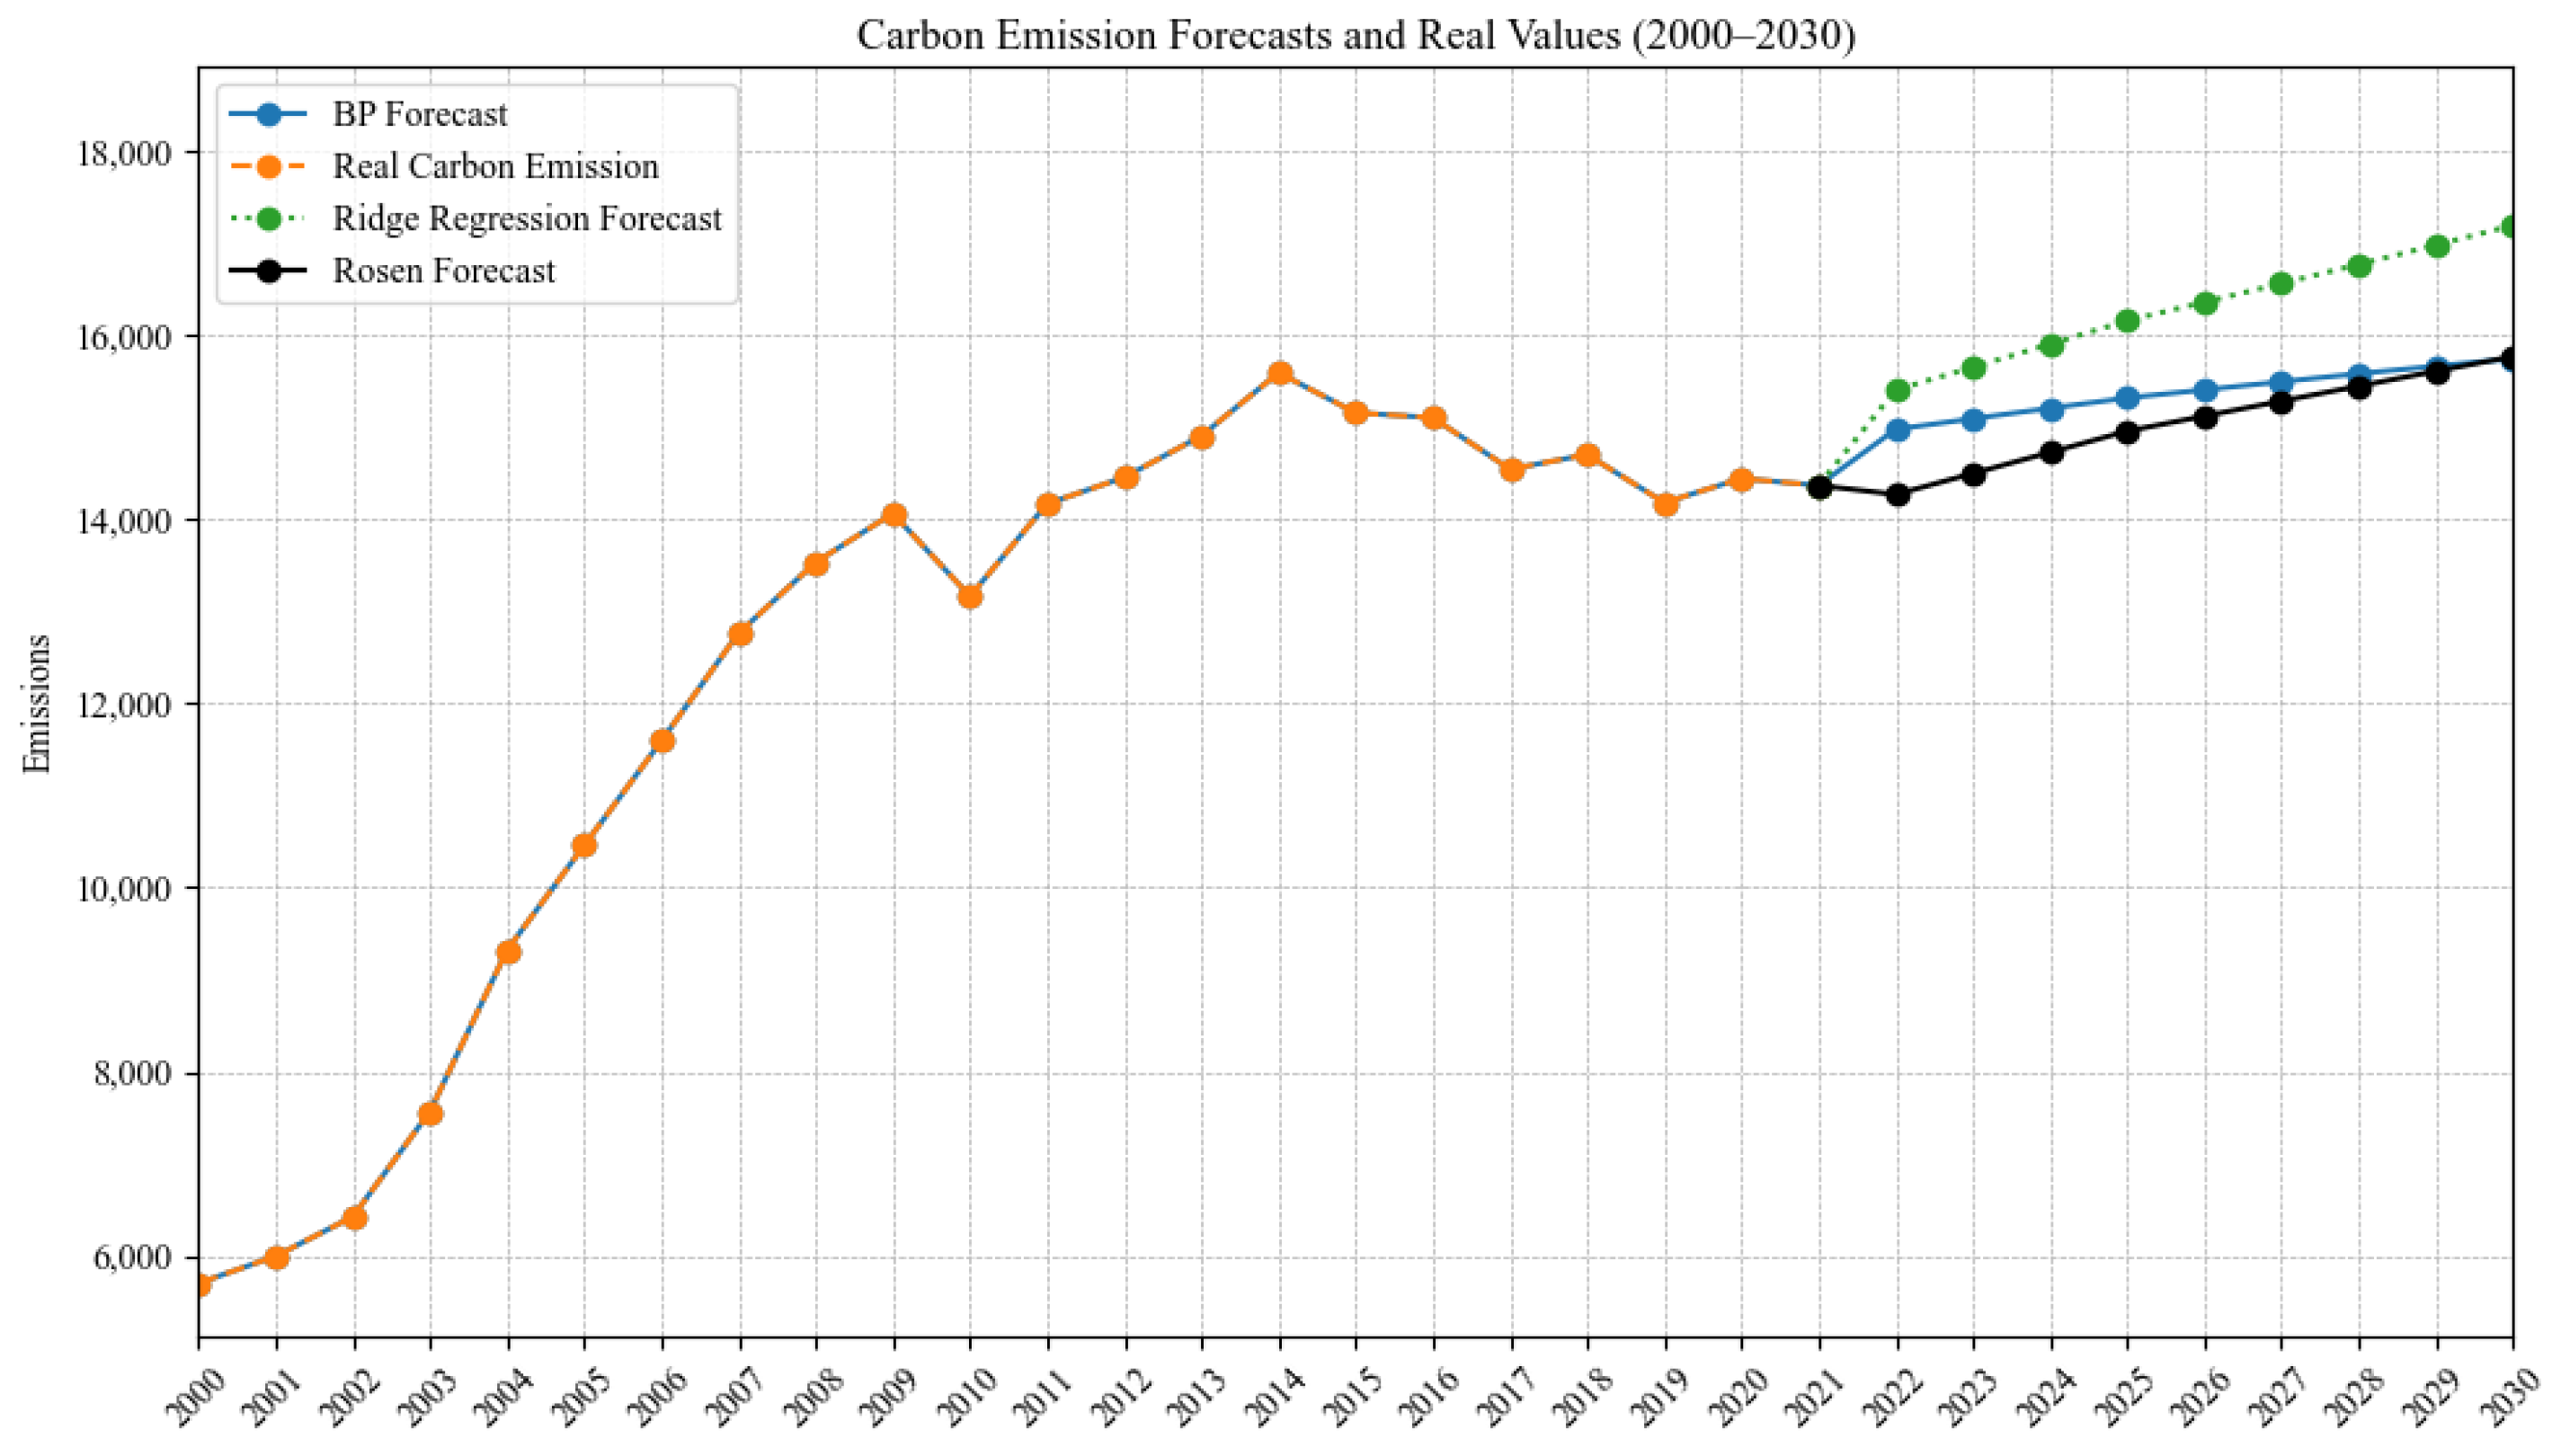
5.3. Comparative Analysis of Forecasts

In order to provide further validation of the predictive effect of the BP neural network model, this study compared and analysed it with the fitted data of the time series of carbon emissions from China’s transportation industry. As shown in Figure 7, although both the ridge regression and Rosen regression methods show a better fit to the historical data, the prediction results are significantly different in trend. While the ridge regression model demonstrates a high goodness of fit (R2 = 0.962), its predictions indicate a substantial increase in carbon emissions from China by 2030, which is incongruent with the national carbon emission control policy and the prevailing development trend. Similarly, the Rosen regression model, exhibiting an optimal fit (R2 = 0.999), forecasts an accelerated growth trend that does not align with the observed development.
These findings underscore the limitations of relying solely on historical time-series data for forecasting, as it may not accurately capture the true future trend. In contrast, the BP neural network model incorporates a range of actual influencing factors, and its prediction results indicate that carbon emissions will increase gradually over the next decade, aligning with the green and low-carbon development strategy currently promoted by China. Consequently, the BP neural network prediction results are more advantageous in terms of reliability and better reflect the real trend of future transportation carbon emissions.

5.4. Policy Recommendations

Henan Province should formulate and implement stricter carbon emission standards for transportation, specify carbon emission limits for all types of transportation vehicles, and impose economic penalties and other constraints on enterprises or individuals exceeding the limits, so as to directly constrain carbon emission behaviours in the transportation sector. At the same time, they should significantly increase financial subsidies for new energy vehicles to reduce their acquisition costs, improve market competitiveness and popularization speed, and reduce the use of traditional fuel vehicles. In addition, the use of big data and artificial intelligence technology to rationally plan transportation routes and scheduling programs, reduce empty vehicles and circuitous transportation, and improve transportation efficiency should be implemented.
Policies to accelerate the construction and application of intelligent transportation systems to reduce vehicle waiting time and congestion and reduce energy consumption should also be developed. For example, we can learn from the experience of Chengdu City in the construction of a rapid transit system for the city through the planning of “a ring and five shoot” rapid transit backbone network, with the formation of internal and external links and transverse east–west and vertical north–south “ring + radial” rapid transit networks, which has significantly improved the operational efficiency and service level of public transportation. The operational efficiency and service level of public transportation has been significantly improved. At the same time, we can learn from Jiangsu Province through the development of river transport and railroad transport to reduce the proportion of road transport and optimize their own transport structure. Large cities in Henan Province, such as Zhengzhou, can study and formulate locally appropriate traffic demand management policies, such as peak hour traffic restrictions, to reduce carbon emissions from urban transportation.

6. Conclusions

(1)
This study used the LMDI decomposition method to analyse transportation-related carbon emissions in Henan Province. The results showed that transport structure, urban per capita GDP, urban–rural population ratio, and total population are key factors driving carbon emission growth, with urban per capita GDP having the largest impact, highlighting the close link between economic growth and carbon emissions. Conversely, transport energy intensity, transport turnover per unit of transport industry output, and transport industry output per unit of GDP restrain carbon emission growth, with the reduction in transport energy intensity being the most decisive. The impact of transport turnover per unit of transport industry output on carbon emissions changes in phases over time, promoting carbon emissions from 2005 to 2009 but inhibiting them from 2015 to 2019, likely due to adjustments in Henan’s transport structure and green–low-carbon development strategies.
(2)
This study pinpoints key factors influencing transportation-related carbon emissions in Henan and underscores the significance of policy intervention in carbon emission control. The findings offer a scientific basis for formulating and improving carbon-reduction policies in Henan’s transportation sector, hold reference value for other regions, and are crucial for achieving regional carbon emission control goals.
(3)
When devising future development strategies for the transportation sector, relevant departments should consider the BP neural network model’s predictive results, strengthen carbon emission control policies, and focus on two main aspects: optimizing the transport structure and boosting energy consumption efficiency. These measures can cut transport energy intensity and aid in achieving the “dual-carbon” goals.
(4)
Although this study constructed a comprehensive model to predict regional carbon emission trends and analyse reduction paths, there is room for expansion. Future research can improve its prediction accuracy by incorporating more machine learning models (e.g., LSTM) for comparison with or integration into the BP neural network. It can also enhance model explanatory power by refining input variables (e.g., subdividing the energy structure into different energy types and technology efficiency). Additionally, based on existing research, policy potential can be further explored. This includes analysing long-term policy-combination impacts on carbon emissions, evaluating the reduction benefits of multimodal transport and new-energy-vehicle promotion policies, and conducting cost—benefit analyses to offer policymakers more practical suggestions.

Author Contributions

Conceptualization, C.M.; methodology, C.M.; validation, C.M. and J.L.; investigation, S.J.; resources, J.L.; data curation, S.J.; writing—original draft preparation, C.M.; writing—review and editing, J.L.; visualization, B.Z.; supervision, B.Z.; project administration, J.L.; funding acquisition, J.L. All authors have read and agreed to the published version of the manuscript.

Funding

This research was funded by Xihua University, grant number YK20240231.

Data Availability Statement

Data are contained within the article.

Conflicts of Interest

The authors declare that this study was conducted in the absence of any business or financial relationship that could be perceived as a potential conflict of interest. Commercial or economic relationship that could be perceived as a potential conflict of interest.

References

  1. Tutmez, B. Trend analysis for the projection of energy-related carbon dioxide emissions. Energy Explor. Exploit. 2006, 24, 139–149. [Google Scholar] [CrossRef]
  2. McKibbin, W.J.; Pearce, D.; Stegman, A. Long term projections of carbon emissions. Int. J. Forecast. 2007, 23, 637–653. [Google Scholar] [CrossRef]
  3. Wen, L.; Huang, L.L. Analysis of influencing factors of Chinese provincial carbon emissions based on projection pursuit model and Markov transfer matrix. Int. J. Clim. Change Strateg. Manag. 2019, 11, 406–423. [Google Scholar] [CrossRef]
  4. Wang, S.; Wang, Y.X.; Zhou, C.X.; Wang, X.L. Projections in Various Scenarios and the Impact of Economy, Population, and Technology for Regional Emission Peak and Carbon Neutrality in China. Int. J. Environ. Res. Public Health 2022, 19, 12126. [Google Scholar] [CrossRef]
  5. Abbas, S.; Yousaf, H.; Khan, S.; Rehman, M.Z.; Blueschke, D. Analysis and Projection of Transport Sector Demand for Energy and Carbon Emission: An Application of the Grey Model in Pakistan. Mathematics 2023, 11, 1443. [Google Scholar] [CrossRef]
  6. Chang, L.; Mohsin, M.; Hasnaoui, A.; Taghizadeh-Hesary, F. Exploring carbon dioxide emissions forecasting in China: A policy-oriented perspective using projection pursuit regression and machine learning models. Technol. Forecast. Soc. Change 2023, 197, 122872. [Google Scholar] [CrossRef]
  7. Lyu, Y.; Zhang, L.F.; Wang, D. Does digital economy development reduce carbon emission intensity? Front. Ecol. Evol. 2023, 11, 1176388. [Google Scholar] [CrossRef]
  8. Zhai, J.J.; She, L.H.; Hao, S.P.; Liu, H.M. Projection of regional carbon emissions and analysis of emission reduction potential under multiple scenarios. Energy Rep. 2023, 9, 753–761. [Google Scholar] [CrossRef]
  9. Zhang, S.H.; Dong, H.N.; Lu, C.; Li, W. Carbon Emission Projection and Carbon Quota Allocation in the Beijing-Tianjin-Hebei Region of China under Carbon Neutrality Vision. Sustainability 2023, 15, 15306. [Google Scholar] [CrossRef]
  10. Wu, H.; Yue, Y.; Shen, Y. Agricultural Carbon Emissions in China: Estimation, Influencing Factors, and Projection of Peak Emissions. Pol. J. Environ. Stud. 2024, 33, 4791–4806. [Google Scholar] [CrossRef]
  11. Wang, W.W.; Liu, X.; Zhang, M.; Song, X.F. Using a new generalized LMDI (logarithmic mean Divisia index) method to analyze China’s energy consumption. Energy 2014, 67, 617–622. [Google Scholar] [CrossRef]
  12. Ang, B.W. LMDI decomposition approach: A guide for implementation. Energy Policy 2015, 86, 233–238. [Google Scholar] [CrossRef]
  13. Lin, B.Q.; Long, H.Y. Emissions reduction in China’s chemical industry—Based on LMDI. Renew. Sustain. Energy Rev. 2016, 53, 1348–1355. [Google Scholar] [CrossRef]
  14. Goh, T.; Ang, B.W. Tracking economy-wide energy efficiency using LMDI: Approach and practices. Energy Effic. 2018, 12, 829–847. [Google Scholar] [CrossRef]
  15. Ma, L.W.; Chong, C.H.; Zhang, X.; Liu, P.; Li, W.Q.; Li, Z.; Ni, W.D. LMDI Decomposition of Energy-Related CO2 Emissions Based on Energy and CO2 Allocation Sankey Diagrams: The Method and an Application to China. Sustainability 2018, 10, 344. [Google Scholar] [CrossRef]
  16. Zhou, J.G.; Yu, X.C.; Guang, F.T.; Li, W. Analyzing and Predicting CO2 Emissions in China Based on the LMDI and GA-SVM Model. Pol. J. Environ. Stud. 2018, 27, 927–938. [Google Scholar] [CrossRef]
  17. Li, J.X.; Chen, Y.N.; Li, Z.; Huang, X.T. Low-carbon economic development in Central Asia based on LMDI decomposition and comparative decoupling analyses. J. Arid. Land 2019, 11, 513–524. [Google Scholar] [CrossRef]
  18. Chontanawat, J.; Wiboonchutikula, P.; Buddhivanich, A. An LMDI decomposition analysis of carbon emissions in the Thai manufacturing sector. Energy Rep. 2020, 6, 705–710. [Google Scholar] [CrossRef]
  19. Isik, M.; Sarica, K.; Ari, I. Driving forces of Turkey’s transportation sector CO2 emissions: An LMDI approach. Transp. Policy 2020, 97, 210–219. [Google Scholar] [CrossRef]
  20. Jiang, S.; Zhu, Y.N.; He, G.H.; Wang, Q.M.; Lu, Y.J. Factors influencing China’s non-residential power consumption: Estimation using the Kaya-LMDI methods. Energy 2020, 201, 117719. [Google Scholar] [CrossRef]
  21. Yasmeen, H.; Wang, Y.; Zameer, H.; Solangi, Y.A. Decomposing factors affecting CO2 emissions in Pakistan: Insights from LMDI decomposition approach. Environ. Sci. Pollut. Res. 2020, 27, 3113–3123. [Google Scholar] [CrossRef] [PubMed]
  22. Zhang, W.; Tang, X.; Yang, G.L.; Zha, D.L. Decomposition of CO2 emission intensity in Chinese MIs through a development mode extended LMDI method combined with a production-theoretical approach. Sci. Total Environ. 2020, 702, 134787. [Google Scholar] [CrossRef] [PubMed]
  23. Dolge, K.; Blumberga, D. Key Factors Influencing the Achievement of Climate Neutrality Targets in the Manufacturing Industry: LMDI Decomposition Analysis. Energies 2021, 14, 8006. [Google Scholar] [CrossRef]
  24. He, Y.; Xing, Y.T.; Zeng, X.C.; Ji, Y.J.; Hou, H.M.; Zhang, Y.; Zhu, Z. Factors influencing carbon emissions from China’s electricity industry: Analysis using the combination of LMDI and K-means clustering. Environ. Impact Assess. Rev. 2022, 93, 106724. [Google Scholar] [CrossRef]
  25. Korica, P.; Cirman, A.; Gotvajn, A.Z. Comparison of end-of-life vehicles management in 31 European countries: A LMDI analysis. Waste Manag. Res. 2022, 40, 1156–1166. [Google Scholar] [CrossRef]
  26. Ye, L.; Du, P.; Wang, S. Industrial carbon emission forecasting considering external factors based on linear and machine learning models. J. Clean. Prod. 2024, 434, 140010. [Google Scholar] [CrossRef]
  27. Li, Y.; Wang, Z.; Liu, S. Enhance carbon emission prediction using bidirectional long short-term memory model based on text-based and data-driven multimodal information fusion. J. Clean. Prod. 2024, 471, 143301. [Google Scholar] [CrossRef]
  28. Ding, Q.; Xiao, X.; Kong, D. Estimating energy-related CO2 emissions using a novel multivariable fuzzy grey model with time-delay and interaction effect characteristics. Energy 2023, 263, 126005. [Google Scholar] [CrossRef]
  29. Zhang, L.; Wang, F.L.; Sun, T.; Xu, B. A constrained optimization method based on BP neural network. Neural Comput. Appl. 2018, 29, 413–421. [Google Scholar] [CrossRef]
  30. Pan, X.Q.; Zhou, W.S.; Lu, Y.; Sun, N. Prediction of Network Traffic of Smart Cities Based on DE-BP Neural Network. IEEE Access 2019, 7, 55807–55816. [Google Scholar] [CrossRef]
  31. Gao, C.X.; Hu, Q.P.; Bao, L.X. Inventory, Dynamic Evolution, and Scenario Projections of Agricultural Carbon Emissions in Shandong Province, China. Sustainability 2024, 16, 3196. [Google Scholar] [CrossRef]
Figure 1. Economic growth and carbon emissions from transport (2000–2022).
Energies 18 01630 g001
Figure 2. Principle of BP neural network.
Energies 18 01630 g002
Figure 3. BP neural network process.
Energies 18 01630 g003
Figure 4. Methodology flow chart.
Energies 18 01630 g004
Figure 5. System module.
Energies 18 01630 g005
Figure 6. Carbon Emissions in Henan Province.
Energies 18 01630 g006
Figure 7. Annual Decomposition of Impact Factors on Transport Carbon Emissions in Henan Province (2001–2020).
Energies 18 01630 g007
Figure 8. Comparison of Actual vs. BP Neural Network-Predicted Carbon Emissions.
Energies 18 01630 g008
Figure 9. Plot of actual versus projected carbon emissions.
Energies 18 01630 g009
Table 1. Energy carbon emission factors.
AgenciesCoalsPetrochemicalPetroleumElectrical Power
Climate Change Programme of the National Science and Technology Commission of China0.7260.5830.4090.1229
(Date from: https://www.most.gov.cn/index.html accessed on 8 January 2024).
Table 2. Variable Interpretation Table.
C i Carbon emissions from energy type i E i Consumption of energy type i
T i Converted turnover of category i transport H Value of transport output
P u Urban population C / E Energy carbon emission factor
E / T Level of energy consumption per unit of transport T / H Transport turnover per unit of output
H / G Value of transport output per unit of G D P G / P u Per capita GDP of urban residents
P u / P Urbanisation rate
Table 3. Decomposition results are normalized to 2001 levels (positive values indicate driving effects, while negative values denote inhibitory effects).
C/EE/TT/HH/GG/PUPU/PP
2001−0.0036−0.0287−0.27320.00230.07480.01230.0067
2002−0.00310.1173−0.26470.00150.06320.01370.0058
20030.00080.1778−0.0438−0.00060.20680.0140.0054
2004−0.00120.4480−0.3057−0.00010.35490.0170.005
20050.00210.18340.6629−0.01960.42620.01750.0051
2006−0.00100.3268−0.53390.00060.33160.01850.0052
20070.0014−0.0735−0.2016−0.00330.62120.01840.0049
2008−0.0023−0.0556−0.41240.00040.58900.01690.0049
2009−0.0011−2.33784.6492−0.01590.14140.01670.0049
2010−0.0179−0.50470.7332−0.00440.29900.01120.0833
2011−0.0018−0.18110.5083−0.00200.55060.01650.0122
2012−0.0014−0.1634−0.75350.00320.35500.01520.001
2013−0.0106−0.0916−0.31710.00160.26300.01610.0107
20140.00080.9320−3.63450.00710.34060.01450.0063
2015−0.0028−0.1241−0.25840.00030.11820.01970.0115
2016−0.00180.1236−0.4620−0.00060.22580.01760.0153
2017−0.0203−0.3051−0.03190.00010.53570.01780.0007
2018−0.0074−0.1497−0.66780.00850.56020.01680.0067
2019−0.0129−0.2043−0.0013−0.00020.30630.01770.0042
2020−0.00110.4702−0.5002−0.0003−0.16630.01420.004
aggregate−0.0853−1.4404−2.1084−0.02136.19730.32230.2038
Table 4. Scenario setting table.
Energy ConsumptionGross Domestic ProductionTotal PopulationValue Added of TransportConversion TurnoverUrban Population
20251.021.061.0051.061.071.015
20301.0151.051.00481.051.061.012
Disclaimer/Publisher’s Note: The statements, opinions and data contained in all publications are solely those of the individual author(s) and contributor(s) and not of MDPI and/or the editor(s). MDPI and/or the editor(s) disclaim responsibility for any injury to people or property resulting from any ideas, methods, instructions or products referred to in the content.

