Abstract
When the inlet flow velocity in the disc-type winding region of an oil-immersed transformer operates within a high Reynolds number range, it leads to an uneven distribution of oil flow. This phenomenon results in the abnormal occurrence of reverse oil flow in the bottom oil ducts, causing the hotspot temperature to rise instead of decrease. To address this issue, a three-node flow resistance module was introduced at the intersection of T-shaped oil ducts based on the flow paths of oil in the main and branch ducts within the disc-type winding region. A flow network model for the transformer winding region was subsequently constructed. The accuracy of the model was validated through CFD simulations and experiments conducted on a transformer winding region test platform, with a maximum relative error of 4.02%. The model successfully predicted the flow distribution of the cooling oil within the winding region. Furthermore, by considering the structural characteristics of the winding region and the principles of heat transfer, particular attention was given to variations in local Nusselt number correlations. This led to the development of a thermal network model tailored to the winding region experiencing reverse oil flow. Comparative analysis of the model’s calculation results yielded a maximum relative error of only 1.12%, demonstrating its ability to rapidly and accurately elucidate the reverse oil flow effect. This study provides a theoretical foundation for the identification and mitigation of reverse oil flow in future applications.
1. Introduction
Oil-immersed transformers with forced oil circulation, such as those used in vehicle-mounted systems and offshore wind turbine towers, often operate in confined and enclosed environments, with limited space for expansion. These conditions result in poor heat dissipation, leading to localized overheating issues [1,2]. While increasing the inlet flow velocity in the winding region is an effective method of enhancing cooling efficiency, it has been observed that although the average temperature rise decreases, reverse oil flow occurs in certain oil ducts, causing the hotspot temperature to rise instead of fall [3,4,5]. In oil-immersed transformers, the distribution of oil flow directly determines the temperature distribution within the windings [6,7]. Therefore, it is imperative to rapidly elucidate the reverse oil flow phenomenon and implement timely adjustments to address this issue.
To ensure the efficient and reliable operation of transformer cooling systems, it is essential to monitor their abnormal states accurately and promptly. Current research on power transformer cooling systems predominantly relies on computational fluid dynamics (CFD) for numerical simulations, which have been widely recognized for their accuracy [8,9,10,11]. For instance, Zhang J. developed an axisymmetric model of a transformer under ON cooling conditions [12]. A comparison between experimental and simulation results demonstrated minimal errors and high data consistency, confirming the accuracy of the axisymmetric model for research purposes. Yuan S. identified the presence of oil flow stagnation layers in the horizontal oil ducts of the winding region using a two-dimensional closed-loop full-scale thermal-flow field simulation model. The study considered the effects of horizontal duct width and the number of baffles on the distribution of cooling oil flow and proposed widening the horizontal ducts and installing multiple baffles to improve oil circulation [13]. These findings highlight the capability of CFD simulations to accurately model transformer cooling systems. However, CFD simulations are also limited by their slow computational speed and the difficulty of modifying model parameters.
The establishment of thermal-hydraulic network models is another effective approach to studying the oil flow and heat transfer processes within transformers. Compared to CFD simulations, these models require fewer computational resources, save time and costs, and maintain high reliability [14]. For example, Taheri developed a lumped dynamic thermal network model based on a three-dimensional heat transfer path distribution of thermal resistance, which can predict the top-oil thermal behavior of indoor distribution transformers, and proposed a conventional cyclic overload strategy [15,16]. Mikha et al. introduced an extended thermal network model that separately defines the temperatures of different components of oil-immersed power transformers, enabling the analysis of thermal behavior under unbalanced power supply voltages [17,18]. Traditional flow network models typically employ a single-node form at oil flow bifurcation points (split/merge), which assumes positive flow in both directions and has been proven accurate under normal conditions [19,20]. However, under special conditions where reverse oil flow occurs, the single-node approach of traditional flow network models fails to accurately predict oil flow distribution. To address this limitation, a three-node flow resistance module was introduced to more accurately represent the flow state at the intersection of oil ducts [21]. Additionally, changes in the oil flow field can significantly affect the thermal field. As demonstrated in [22], where CFD and curve-fitting methods are used to modify the convective heat transfer correlations in the oil ducts of low-voltage windings, it is crucial to carefully adjust the existing model parameters under reverse oil flow conditions.
To address the limitations of CFD modeling, this study adopts the construction of a flow thermal network model to investigate the reverse oil flow phenomenon in the disc-type winding region of transformers. To accurately predict oil flow distribution under reverse oil flow conditions, a three-node flow resistance module was introduced, and a flow network model for the winding region was developed. The model’s accuracy was validated through CFD simulations and experiments conducted on a transformer winding region test platform, with a maximum relative error of 4.02%. Furthermore, since existing model parameters may change under reverse oil flow conditions, adjustments were made to correlations such as the local Nusselt number, resulting in the development of a thermal network model specifically tailored to the winding region experiencing reverse oil flow. The accuracy of the model was verified using CFD simulations, and the mechanisms underlying reverse oil flow were elucidated. This study provides a theoretical foundation for optimizing the design of transformer cooling systems in the future.
2. Construction of the Flow Network Model in the Winding Region
2.1. Geometric Structure of the Winding Region
This study focuses on a transformer with a forced oil-directed cooling structure. The winding region of the transformer consists of winding discs, the axial spacing between the discs, and the radial spacing between the discs and the insulating cylinder. The latter two are referred to as axial and radial channels, respectively. The internal structure of the winding region of this type of transformer is illustrated in Figure 1. Figure 1a shows a three-dimensional model of the region between adjacent spacers in the winding area. Figure 1b presents a two-dimensional model of the winding region, where each section contains six winding discs, with each disc composed of 15 turns of conductors. The horizontal radial oil ducts are formed between adjacent discs, between the discs and the tank wall, and between the discs and the oil guide rings, totaling seven horizontal radial oil ducts. Additionally, two vertical axial oil ducts are formed between the discs and the left and right tank walls. The study specifically investigates the bottom oil duct region where reverse oil flow occurs. Figure 1c depicts the two-dimensional structure of a single turn of the winding disc, which consists of a copper conductor wrapped with insulating paper. In the forced oil-directed cooling system, the cooling oil is driven by an oil pump into the bottom of the winding. Guided by the oil guide rings within the winding, the cooling oil flows through the horizontal and vertical oil ducts, forming a “zigzag” flow path. This design ensures that the cooling oil comes into full contact with the heat-generating winding discs, facilitating efficient convective heat transfer and enabling the removal of a greater amount of heat. The schematic diagram of the winding region model parameters is shown in Figure 2. The ratio of the height of the bottom radial oil channel (H1) to the width of the outer axial oil channel (Win) is defined as α.
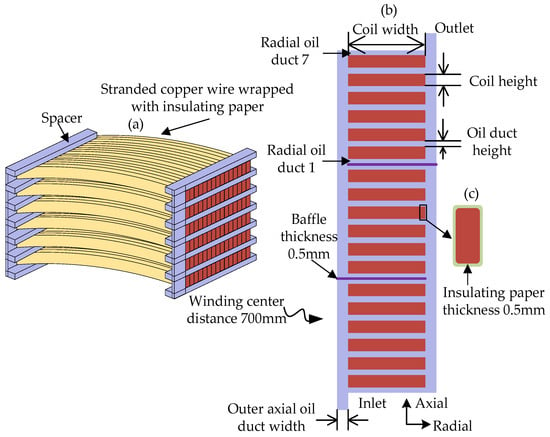
Figure 1.
(a) Three-dimensional model of the adjacent spacers in the winding area. (b) Two-dimensional winding model. (c) A two-dimensional structural composition diagram of a single-turn coil disc.
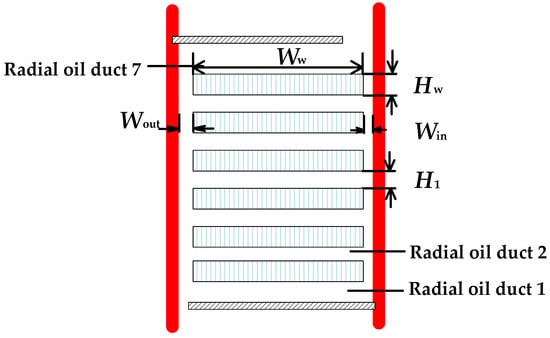
Figure 2.
Winding region model parameter schematic diagram.
The primary focus of this research is the bottom oil channel, where reverse oil flow is prone to occur. The cooling oil enters the outer axial oil channel through the oil guide ring at the bottom oil channel. Due to pressure variations, a branch flow separates at the corner and enters the inner axial oil channel, subsequently converging in the next cooling channel before exiting the winding region. When the Reynolds number of the oil flow at the entrance of the winding region is sufficiently high, reverse flow is observed in the bottom radial oil channel 1 [14]. The initiation of reverse oil flow is attributed to two scenarios: (1) the reversal of the static pressure drop across the radial oil channel, where the total hydraulic resistance in the radial channel is positive; and (2) the absence of a reversal in the static pressure drop across the radial oil channel, where the total hydraulic resistance is negative.
2.2. Establishment of the Flow Resistance Model
The construction of the flow network model requires that parameters such as pressure and flow rate satisfy Kirchhoff’s laws, allowing it to be analogously represented as an equivalent electrical circuit. The corresponding equivalent variables are summarized in Table 1. As illustrated in the electro-thermal-flow analogy in Figure 3, the oil channel flow rate Q is primarily determined by the pressure drop ΔP between nodes and the flow resistance R within the channel. The flow resistance R is predominantly influenced by frictional losses during fluid motion, with secondary contributions from pressure losses due to changes in flow direction.

Table 1.
Equivalent variables for electrical-thermal-flow analogies.

Figure 3.
Equivalent circuits for electrical-thermal-flow analogies.
Traditional flow network models typically employ a single-node approach at the bifurcation or confluence of oil flow paths, which only accounts for the forward flow of oil into the adjacent channels. However, the actual flow dynamics at the intersection of oil channels are considerably more complex. The conventional single-node models are inadequate for accurately predicting the distribution of oil flow within winding regions, particularly in scenarios involving reverse flow. To address this limitation, additional nodes must be introduced at the points of flow bifurcation and confluence. This enhancement allows for the precise prediction of flow splitting, merging, and pressure drop reversals in radial channels, while ensuring that the principle of zero net pressure drop in a closed loop is not violated.
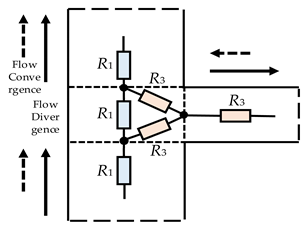
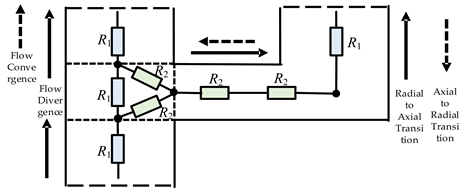
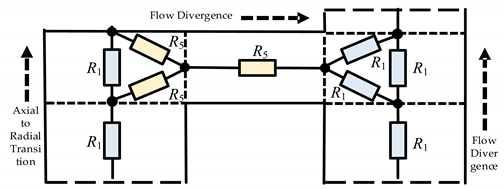
As illustrated in Figure 4, the flow network model developed in this study incorporates a node at both the inlet and outlet of each oil channel, with flow resistances connecting each pair of nodes to form a triangular resistance module. This module effectively represents the three primary flow states at the intersection of oil channels: flow splitting, merging, and the transition from axial to radial flow. Consequently, the flow network model for the winding region proposed in this chapter introduces an additional 40 flow resistances compared to traditional models. These resistances enable a more accurate representation of the complex flow dynamics occurring at the intersections of the oil channels.
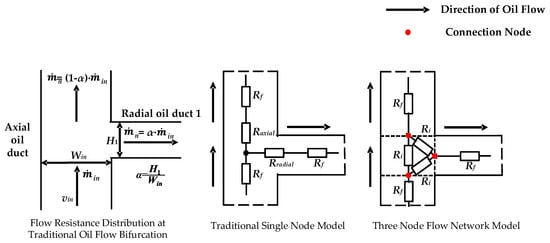
Figure 4.
Flow resistance model established at the junctions of the oil channels.
Based on the structural characteristics of various oil ducts within the winding region and the distinct flow states of oil within these ducts, different flow resistance models were established to characterize the actual flow conditions of oil in various duct configurations. These models were developed by integrating the relationships between flow resistance, pressure drop loss coefficients, mass flow rate, and hydraulic diameter. The flow resistance formulas corresponding to each type of oil duct are presented in Table 2, Table 3 and Table 4. In the equations, R1, R2, R3, R4, and R5 represent the flow resistances corresponding to different flow directions in various oil ducts. The term K denotes the pressure drop loss coefficient, while Dh represents the hydraulic diameter. The mass flow rate at the specific node location is denoted by , and the mass flow rate at the inlet node is represented by . Additionally, H1 signifies the height of the radial oil duct, and Win indicates the width of the inner axial oil duct.

Table 2.
The flow resistance formula for the remaining oil passages.

Table 3.
The flow resistance formula for the bottom radial oil passage.

Table 4.
The flow resistance formula for the top radial oil passage.
2.3. Construction of the Flow Network Model for the Winding Region
Based on the aforementioned flow resistance models for various oil ducts, the flow resistance modules are systematically integrated by utilizing the circulating flow path of the oil within the winding region. This integration is achieved by constructing a flow network model for the winding region, which is analogous to an electrical circuit, as illustrated in Figure 5.
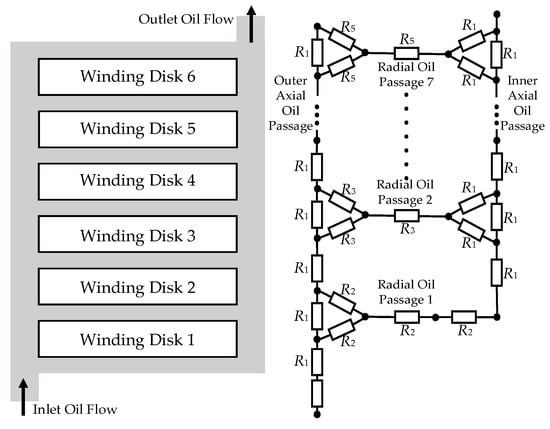
Figure 5.
Flow network modeling in the winding area.
In addition to the flow resistance equations, the pressure drop is also determined by the corresponding pressure loss coefficient, the oil flow velocity at the axial inlet, and the density of the oil. This relationship is expressed by the following formula:
In the equation, ΔP represents the pressure drop, ρ denotes the density of the oil, vin is the oil flow velocity at the initial inlet, and K is the pressure loss coefficient.
3. Validation of the Flow Network Model and Analysis of Flow Characteristics
3.1. Construction of the CFD Simulation Model
In this study, the two-dimensional unstructured mesh for the transformer winding region was generated using ANSYS ICEM CFD 2021 R1 software, as illustrated in Figure 6. The computational mesh model comprises a total of 823,402 elements. The copper conductors, which are wrapped with 0.5 mm thick insulating paper, and the insulating paper domain itself, were both discretized using square elements. To enhance computational accuracy and convergence reliability, the fluid–solid interface was refined with two layers of thin rectangular elements. The boundary elements account for 159,300 elements, representing 19.35% of the total mesh. This refined mesh structure ensures the precise extraction of physical quantities such as velocity and temperature within the fluid domain.
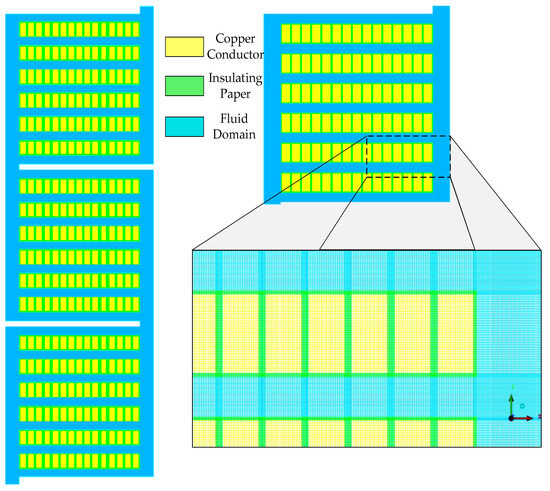
Figure 6.
Unstructured mesh diagram of 2D model of winding area.
The partial geometric parameters of the two-dimensional model for the oil-immersed transformer winding region are presented in Table 5. The thermophysical properties of the transformer oil exhibit significant variations, with changes in oil temperature, as detailed in Table 6. In contrast, the material properties of the copper conductors and insulating paper are minimally affected by temperature variations and can therefore be treated as constants. The relevant physical properties of these materials are summarized in Table 7.

Table 5.
Parts of geometric parameters of the model.

Table 6.
Physical priorities of the fluid materials.

Table 7.
Physical properties of the winding materials.
Based on the previously delineated two-dimensional grid model of the transformer winding region, the mesh quality was meticulously inspected and optimized. Subsequently, appropriate boundary conditions were configured for the Fluent post-processing. The simulation experiment was conducted using Fluent software to analyze the flow distribution within the oil channels of the winding region at a ratio α of 0.5. The results, as depicted in Figure 7, illustrate the flow characteristics across various oil channels under different inlet Reynolds numbers.
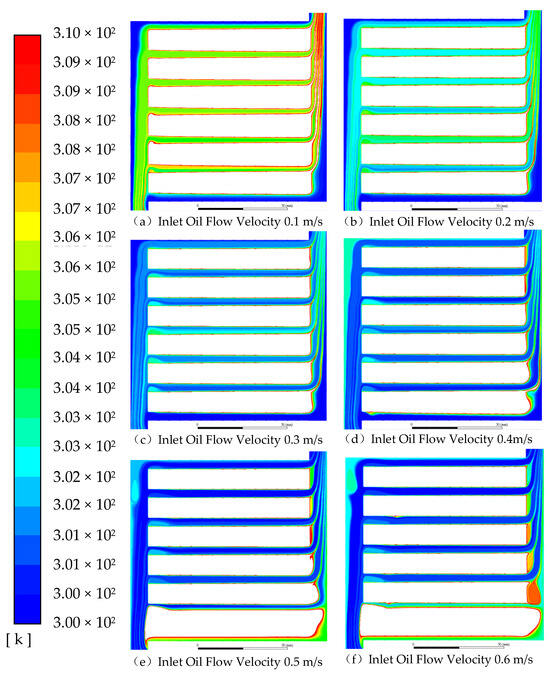
Figure 7.
Flow distribution of the third gear winding area under different inlet Reynolds numbers.
It was observed that the flow patterns within the winding region were fundamentally similar across the five different inlet Reynolds numbers; however, the actual flow velocities varied significantly. As the inlet Reynolds number increased, the inlet velocity of the oil entering the outer axial oil channel progressively heightened. Moreover, the oil flow velocity within the radial oil channels closer to the top region exhibited a marked increase. Conversely, the oil flow velocity within the bottom radial oil channel remained relatively unchanged or showed a slight decrease, as indicated by the deepening blue hues in the figure. Detailed analysis of the flow distribution within the bottom radial oil channel revealed the presence of reverse flow in the first oil channel.
3.2. Validation of the Flow Network Model
Based on the flow network model constructed for the winding region in this study, the flow resistance parameters of each oil channel were systematically combined and arranged to form a flow resistance parameter matrix. This matrix was then utilized in the computational process outlined in the flowchart presented in Figure 8. The iterative procedure involved calculating the pressure and flow rate matrices, with continuous updates applied until the discrepancy between successive flow rate values fell below a predefined threshold. Upon convergence, the final flow rate distribution was output, providing the predicted flow distribution within the winding region as determined by the model.
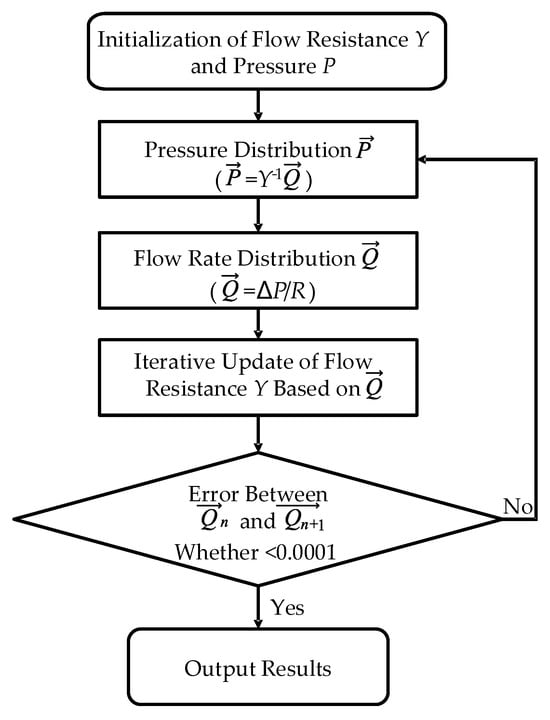
Figure 8.
Flowchart of the flow network model calculation.
When the Reynolds number (Re) at the inlet is 1215.298 and α = 0.5, the flow rate proportions predicted by the flow network model constructed in this study are compared with those obtained from the CFD simulation model, as illustrated in Figure 9. The results reveal that the flow network model predicts a flow rate proportion of −2.509% for the bottom radial oil channel 1, indicating a reverse flow direction contrary to the normal flow pattern. This observation suggests the occurrence of reverse oil flow in the bottom radial oil channel 1. Furthermore, the flow rate proportions predicted by the flow network model for the other radial oil channels demonstrate excellent agreement with the CFD simulation results, with a maximum deviation of only 3.02%. Notably, the prediction for the bottom radial oil channel 1 (−2.509%) closely matches the CFD model result (−2.572%), highlighting the capability of the flow network model to preliminarily identify the triggering of reverse oil flow effects in the bottom oil channels.
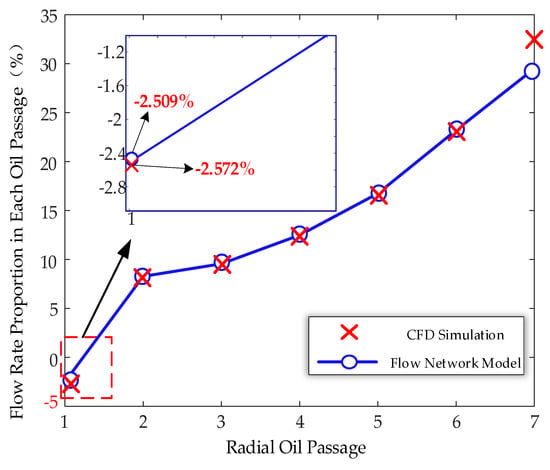
Figure 9.
Flow ratio between CFD and the flow network model.
3.3. Experimental Validation of the CFD Simulation Models
Given the strong agreement between the flow network model results and the CFD simulation results, it is essential to further validate the established CFD model through experimental verification. By comparing the experimental results with the CFD simulations, the accuracy of the flow network model can be confirmed.
The primary focus of this study is the bottom oil channel of the transformer winding. To facilitate the investigation, a single-stage winding was employed as an alternative to the conventional three-stage winding for the experimental setup. Initially, an equivalent model of the single-stage transformer winding was constructed in CFD and compared with the three-stage winding. This comparison determined that the angle between the upper wall and the horizontal plane at the inlet was 36.23°, with an upper wall length of 40 mm, as illustrated in Figure 10.
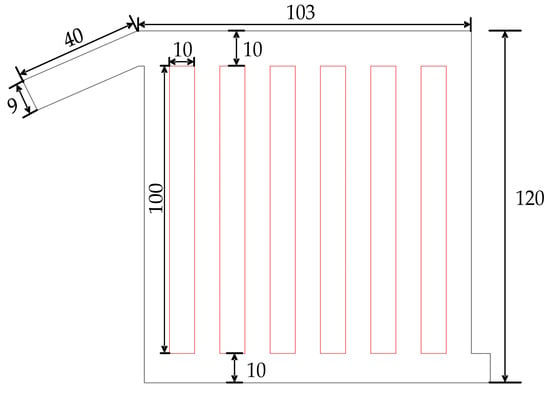
Figure 10.
The specific dimensions of the winding region.
Based on the established model dimensions, transparent acrylic plates were selected, and a three-layer design was adopted. The transformer winding plates were fabricated using a milling machine and observed through a particle image velocimetry (PIV) system. To ensure accurate tracking of the oil flow, hollow glass microspheres with diameters ranging from 10 to 20 μm were introduced into the oil. During the experiment, a light-emitting sheet was positioned horizontally to ensure that the illuminated measurement plane was two-dimensional. The position was adjusted so that the light source was aligned with the inlet of the single-stage winding model. A high-resolution CCD camera was placed perpendicular to the measurement plane to capture particle images under two pulsed light exposures. Subsequently, the captured particle images were divided into small regions for cross-correlation analysis, generating a velocity field across the entire measurement plane. The experimental setup and observation results are depicted in Figure 11a.
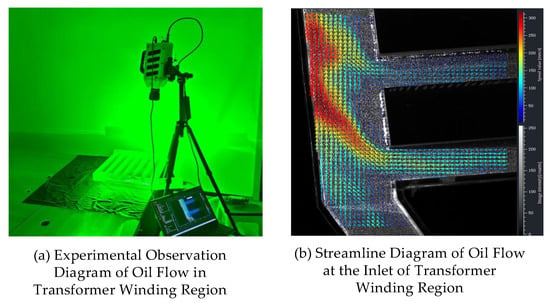
Figure 11.
Transformer winding region oil flow observation experiment diagram and result diagram.
With the inlet velocity set to 0.3 m/s, the oil flow streamline pattern observed at the inlet of the single-block winding, as shown in Figure 11b, exhibited a high degree of consistency with the CFD simulation results. The flow rate proportions of seven oil channels were extracted for error analysis, as summarized in Table 8. The correlation coefficient (R2) was 0.999448, with a maximum absolute error of 0.0063 and a maximum relative error of 4.02%. These results demonstrate the excellent predictive capability of the CFD simulation.

Table 8.
Comparison of oil flow rate ratios: CFD simulation vs. experimental values.
3.4. Prediction of Oil Flow Distribution Using the Flow Network Model
Figure 12 illustrates the pressure distribution and oil flow behavior among the nodes in the winding region flow network model when reverse oil flow occurs in the bottom radial oil channel. The figure reveals that when reverse flow appears in radial oil channel 1, the pressure at node 10 (294.73 Pa) is higher than that at node 6 (293.94 Pa). This observation aligns with the discussion in Section 2.1 of this study, which states that reverse flow in the bottom radial oil channel is caused by a pressure drop reversal across the channel. Additionally, the established three-node flow resistance model accurately predicts the pressure differences between various nodes, such as node 9 (297.15 Pa), node 11 (296.32 Pa), and node 12 (296.64 Pa). By analyzing the sign of the pressure drop, the flow direction between nodes can be easily determined, thereby identifying the occurrence of reverse flow in the bottom radial oil channel.
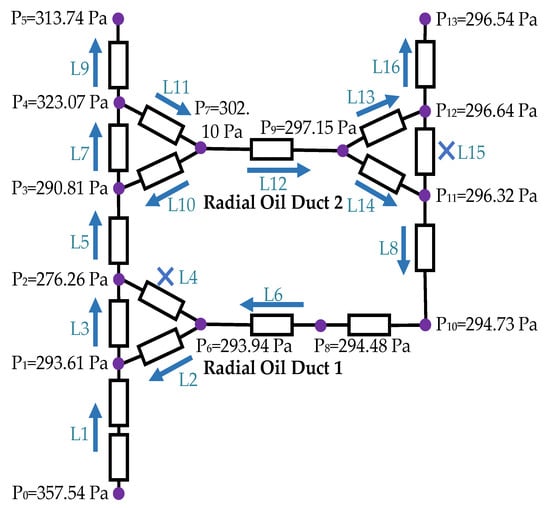
Figure 12.
Pressure and flow distribution of oil channels.
Table 9 presents the flow rate distribution among the nodes. Using the flow rate at the third-block inlet L1 as the baseline (100%), the flow rate at L2 is negative (−2.51%), while the flow rate at L3, which is the sum of L1 and L2 (102.51%), exceeds 100%. This indicates that the oil flow at the junction of these channels is in a merging state, deviating from the normal flow pattern expected at the inlet of the radial oil channel. Furthermore, the flow rates at L2, L6, L8, and L14 are identical (−2.51%), demonstrating that the same oil flow forms a circulating loop within these channels. Specifically, the oil flows downward from radial oil channel 2 into radial oil channel 1. The flow rates at L4 and L15 are zero, while the flow rate at L12 (8.17%) is approximately the sum of the flow rates at L13 (5.89%) and L14 (−2.51%). These findings further confirm that an excessively high inlet oil flow Reynolds number causes the oil flow at the outlet of radial oil channel 2 to split. The majority of the flow moves upward, exiting through the remaining channels, while a smaller portion flows downward, accumulating in radial oil channel 1 and resulting in a reverse flow of the cooling oil.

Table 9.
Oil flow distribution at each node.
4. Construction of the Thermal Network Model for Winding Region
Based on the findings from Section 3, the flow conditions within the winding region can be preliminarily inferred. To more efficiently and accurately elucidate the reverse oil flow effect inside oil-immersed transformers, a thermal network model for the winding region was developed in this section.
4.1. Construction of the Conductor-Insulation Paper Thermal Model
Given that the structural components within the winding region are largely uniform, and the heat transfer pathways exhibit minimal variation across this space, the process of establishing the thermal network model was simplified by initially focusing on a single winding disk and a single cooling channel as the primary subjects for heat transfer analysis. Subsequently, various thermal models were combined to construct the comprehensive thermal network model for the entire winding region.
Taking a single turn of the winding disk as an example, a thermal model for the conductor-insulation paper unit was developed based on the heat flow patterns within the conductor-insulation paper. Initially, the center of the copper conductor was designated as the heat source. Heat is generated at this source, and driven by the thermal properties of the copper conductor, is conducted through solid materials. The heat then propagates from the center of the heat source to the interface between the copper conductor and the insulation paper, facilitating heat transfer between copper elements. Consequently, the conductive thermal resistance between copper conductors, denoted as RCu, was established in accordance with heat transfer theory, as follows:
In the equation, RCu represents the conductive thermal resistance between copper conductors; δCu denotes the thickness of the copper conductor through which heat passes; kCu is the thermal conductivity of copper; and A is the cross-sectional area perpendicular to the direction of heat transfer.
Subsequently, heat is transferred from the interface between the copper conductor and the insulation paper (i.e., the inner surface of the insulation paper) to the outer surface of the insulation paper, completing the conductive heat transfer between paper layers. Therefore, the conductive thermal resistance between paper layers, denoted as Rpaper, is established as follows:
In the equation, Rpaper represents the conductive thermal resistance between insulation paper layers; δpaper denotes the thickness of the insulation paper through which heat passes; kpaper is the thermal conductivity of the insulation paper; and A is the cross-sectional area perpendicular to the direction of heat transfer.
Based on the two thermal resistance models described above, a thermal model for a single turn of the winding disk was constructed in accordance with the principles of heat transfer, as illustrated in Figure 13. Similarly, adjacent turns of the winding disk were connected in series to form the thermal model for a single winding disk.
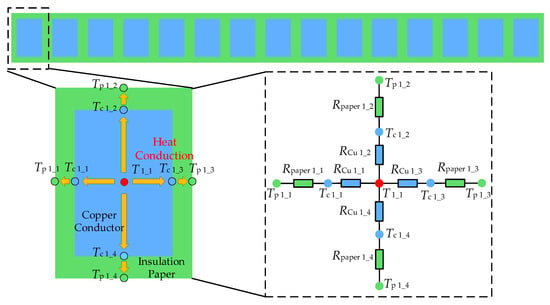
Figure 13.
Thermal model of a single-turn winding wire cake.
4.2. Construction of the Insulation Paper-Oil Flow-Oil Flow Thermal Model
After reaching the outer surface of the insulation paper, heat is transferred through two primary pathways: (1) heat exchange between the current turn of the winding disk and adjacent turns, completing the heat transfer path across the entire winding disk; and (2) heat dissipation from the outer surface of the insulation paper through the flow of cooling oil, achieving the heat transfer process between the winding disk and the oil flow. The second pathway is primarily facilitated by the oil pump and forced oil guiding structure, which directs the oil flow in a laminar manner over the outer surface of the insulation paper, absorbing heat from the surface and transferring it to the oil flow through convective heat transfer. Consequently, convective heat transfer occurs on both the left and right sides of a single winding disk when the cooling oil flows through axial oil channels, and on the upper and lower surfaces of adjacent winding disks when the oil flows through radial oil channels. Based on heat transfer theory, the convective thermal resistance between the insulation paper and the oil flow, denoted as Rpo, is established as follows:
In the equation, Rpo represents the convective thermal resistance between the insulation paper and the oil flow; A is the cross-sectional area perpendicular to the direction of heat transfer; and hpo is the convective heat transfer coefficient between the insulation paper and the oil flow, which can be determined by the following formulas:
In the equations, NuA is the average Nusselt number between the oil flow and the insulation paper; l is the length of the fluid flow channel for convective heat transfer; and koil is the thermal conductivity of the transformer oil. A one-dimensional coordinate system is defined, with the origin at the oil channel inlet of the third winding region, and the positive x-axis direction aligned with the left-to-right flow direction. Here, x1 and x2 represent the positions of the left and right sides of the insulation paper in the coordinate system, respectively, and Nux is the local Nusselt number of the oil flow at position x.
Based on the flow position and characteristics of the transformer oil, the following appropriate formula is selected to calculate the required local Nusselt number [23,24,25]:
In the equation, x* is the dimensionless distance, which is calculated as
In the equation, x is the position of the oil flow in the coordinate system; voil(x) is the flow velocity of the oil at position x; koil is the thermal conductivity of the transformer oil; Dh is the hydraulic diameter of the oil channel; ρoil is the density of the transformer oil; and (CP)oil is the specific heat capacity of the transformer oil.
Due to the action of the oil pump and forced oil guiding structure, the oil flow exhibits excellent flow characteristics within the various oil channels of the winding region, enabling the oil flow itself to facilitate heat transfer. Consequently, convective heat transfer occurs between oil flows. The convective thermal resistance between oil flows, denoted as Roo, is expressed as follows:
In the equation, Roo represents the convective thermal resistance between oil flows; A is the cross-sectional area perpendicular to the direction of heat transfer; and hoo is the convective heat transfer coefficient between oil flows, which can be determined by the following formula:
In the equation, Nuoo is the Nusselt number between oil flows; l is the length of the fluid flow channel for convective heat transfer; and koil is the thermal conductivity of the transformer oil. Since the transformer oil flows in a laminar manner within the oil channels, the Nusselt number Nuoo between oil flows can be calculated using an empirical Nusselt formula as follows:
In the equations, Proo is the Prandtl number between oil flows; Reoo is the Reynolds number between oil flows; ρoil is the density of the transformer oil; μoil is the viscosity of the transformer oil; (CP)oil is the specific heat capacity of the transformer oil; koil is the thermal conductivity of the transformer oil; l is the length of the fluid flow channel for convective heat transfer; and voil is the average flow velocity between oil flows.
Based on the above heat transfer analysis and the circulating flow of oil within the winding region, a thermal model for the insulation paper-oil flow-oil flow system was constructed, as illustrated in Figure 14. This thermal model characterizes the heat flow trajectory, in which heat from the outer surface of the insulation paper is absorbed by the cooling oil, and the fluid properties of the cooling oil are utilized to transfer its heat to other lower-temperature oil flows, ultimately directing it to the external cooling system for oil flow cooling.
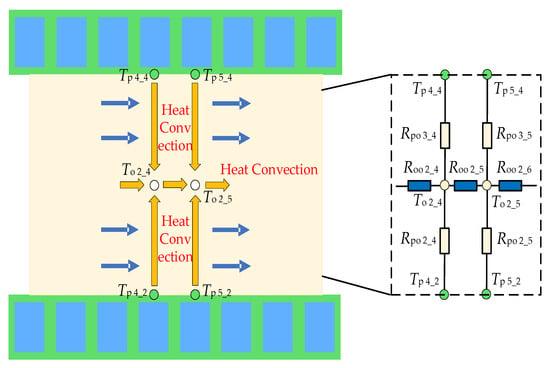
Figure 14.
Thermal model between the wire cake and oil flow.
4.3. Construction and Validation of the Thermal Network Model for Winding Region
Integrating the previous heat transfer analyses, the overall heat flow pathway is determined as: copper conductor → insulation paper → oil flow. The thermal models of each unit module are combined and connected according to the actual direction of heat flow to construct a thermal network model, as illustrated in Figure 15. Based on the specific structural distribution of the winding region, the thermal network model is divided into seven radial oil channels, two axial oil channels, and six winding disks. Each winding disk is further divided into 15 turns, containing 15 heat sources, resulting in a total of 90 heat sources. The oil flow within each oil channel is represented by convective thermal resistance, which correlates with the temperature at various points of the oil flow, facilitating the analysis of temperature distribution patterns under different inlet flow velocities.
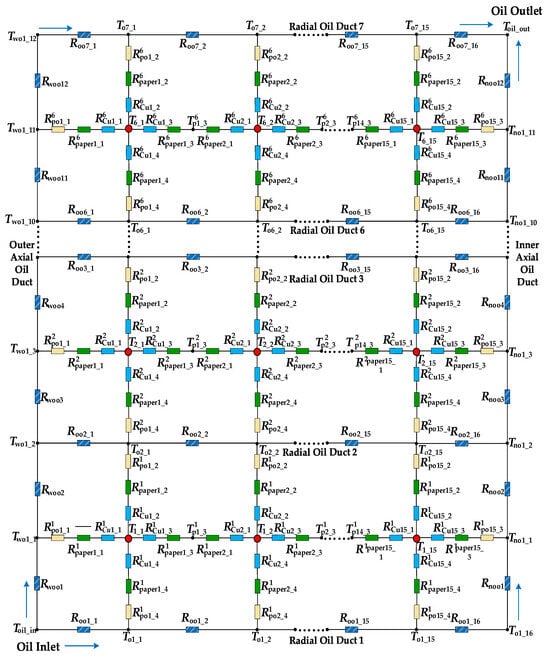
Figure 15.
Thermal network model in the third gear winding area.
By adjusting relevant parameters and boundary conditions in Fluent software, the temperature distribution of oil flow in the winding region was obtained for different inlet velocities when the ratio α of the height of the bottom radial oil channel to the width of the outer axial oil channel is 0.5, as shown in Figure 16. From Figure 16a–d, it can be observed that as the inlet oil velocity increases, the temperature of the oil flow in each channel gradually decreases. Higher flow rates enhance the cooling performance of the oil. However, as seen in Figure 16e,f, further increasing the inlet oil velocity causes a sharp rise in the temperature of the oil flow in radial channels 1 and 2, while the temperature changes in other channels remain insignificant. For example, at a high inlet velocity of 0.6 m/s, this phenomenon occurs because the oil flow, after converging through the oil guide washer into the next cooling channel, experiences fluid impact at the junction. This causes the flow to deviate toward the side wall opposite the horizontal oil channel, hindering the separation of the oil flow into the horizontal channel and triggering a reverse oil flow effect. As a result, the high-temperature oil in radial channels 1 and 2 cannot enter the transformer’s cooling cycle, accumulates in the bottom radial channels, and obstructs the inflow of cooling oil, leading to a rapid temperature increase. This CFD simulation model clearly identifies the temperature variations at different points in the oil channels.
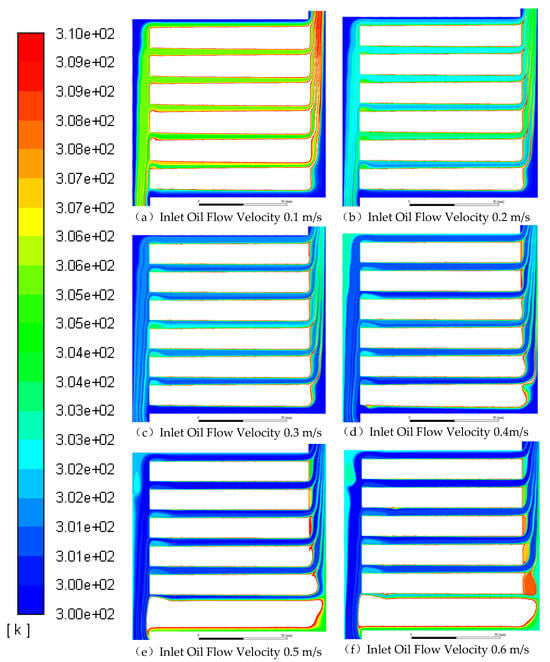
Figure 16.
Distribution of oil temperature in the winding area under different inlet flow rates.
Using the constructed thermal network model of the winding region, the temperature distribution of the outlet oil flow under different inlet flow velocities can be obtained by altering relevant parameters and performing algorithmic calculations, as shown in Figure 17. From the figure, it is apparent that the outlet oil temperature trends of the thermal network model align closely with those of the CFD simulation model. Both models show that as the inlet oil flow velocity increases, the outlet oil temperature gradually decreases, but the rate of decrease diminishes, indicating the weakening influence of inlet flow velocity on the outlet temperature. Additionally, there is a temperature deviation between the two curves, with differences ranging from 1 to 3 K under various inlet flow velocities, and a maximum relative error of 1.12%. This demonstrates that the thermal network model constructed in this study provides a certain level of accuracy in predicting the oil flow temperature in the third winding region.
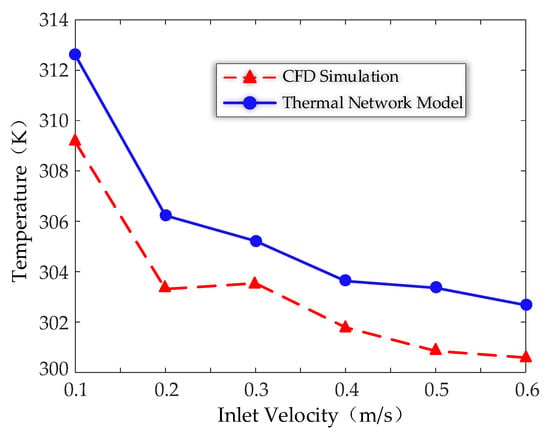
Figure 17.
Variation of outlet oil temperature from the thermal network model with CFD under different inlet flow rates.
4.4. Explanation of Reverse Oil Flow in the Radial Oil Ducts at the Bottom of the Winding Region
To validate the ability of the thermal network model presented in this paper to rapidly characterize the reverse oil flow phenomenon within the winding region, an investigation was conducted on the oil temperature at various points in radial oil channels 1 and 2. As illustrated in Figure 18, several observations can be made.
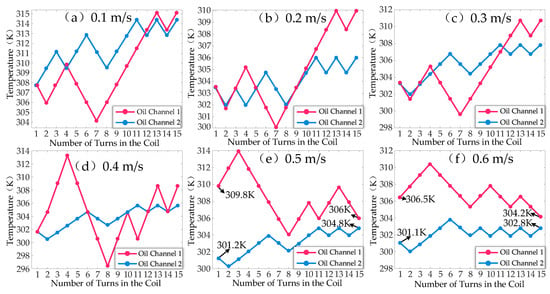
Figure 18.
Variation of oil temperature in radial oil channels 1 and 2.
When the inlet oil velocity ranges from 0.1 to 0.3 m/s, the oil temperatures at the inlets of both radial oil channels 1 and 2 (at the first turn) are nearly identical. The temperature variation curves of the two channels intersect at certain points, showing a consistent increasing trend from left to right. Notably, radial oil channel 1 exhibits a greater temperature variation amplitude, with its outlet oil temperature (at the 15th turn) consistently higher than that of radial oil channel 2.
At the critical flow stage observed in Figure 18d, while the temperature curves of the two channels still intersect, their variation trends differ from the previous cases. As shown in Figure 18e,f, when the inlet velocity increases to 0.5–0.6 m/s, the overall temperature of radial oil channel 1 becomes consistently higher than that of radial oil channel 2. The temperature curves of the two channels gradually converge from left to right, reaching similar values at the outlet. This indicates that the oil flow in radial oil channel 2 splits at the channel intersection, with part of the oil flowing downward through the inner axial oil channel. Consequently, a reverse oil flow effect is triggered in radial oil channel 1, causing the oil to flow from right to left.
Interestingly, the overall temperature trend in this scenario decreases from left to right, which is the opposite of the temperature variation observed in the previous cases for radial oil channel 1. This suggests that the reverse oil flow reabsorbs heat from the winding coils, resulting in a temperature increase from right to left in radial oil channel 1. Consequently, the oil temperature in radial oil channel 1 remains consistently higher than that in radial oil channel 2.
The thermal network model accurately captures the temperature distribution of each turn in the oil channels and clearly identifies the hotspot locations within the windings under high flow velocities. Furthermore, it elucidates the mechanism behind the initiation of reverse oil flow. This model can serve as a valuable tool for evaluating the effectiveness of different transformer cooling designs in mitigating reverse oil flow and enhancing overall cooling performance, thereby providing a theoretical foundation for addressing the reverse oil flow issue comprehensively.
5. Conclusions
- Based on the specific structural distribution and geometric dimensions of the oil-immersed transformer winding region, an electric-flow analogy equivalent circuit was utilized to establish flow resistance models for each oil channel. Notably, a triangular node flow resistance module was introduced at the T-junction of the oil channels. These flow resistance models were then combined and connected to form a flow network model for the winding region. Compared to traditional flow network models, this model incorporates 40 additional flow resistances, providing a technical foundation for analyzing the flow state of oil within the winding region.
- By inputting relevant parameters, the flow network model predicted the flow rate ratios within the radial oil channels. These predictions were compared with the CFD simulation results, showing a maximum deviation of 3.02%, which demonstrates the accuracy of the constructed flow network model. An experimental observation platform for the transformer winding region was established, and the accuracy of the CFD simulations was experimentally verified, thereby validating the flow network model. Using this model, the flow distribution and pressure distribution between nodes can be accurately predicted, enabling precise determination of the oil flow patterns.
- Based on the structural characteristics and heat transfer principles of the oil-immersed transformer winding region, a thermal model for a single winding disk was established and integrated into a thermal network model for the winding region. The outlet oil temperatures calculated by the model were compared with those from the CFD simulation model, revealing a maximum relative error of only 1.12%. The temperature variation curves calculated by the model can quickly and accurately elucidate the reverse oil flow effect.
Author Contributions
Conceptualization, L.W.; methodology, L.W. and J.Q.; software, J.Q; validation, Y.C. and L.Z.; formal analysis, J.Q.; investigation, Y.C. and J.Z.; data curation, J.Q.; writing—original draft preparation, L.W. and J.Q.; writing—review and editing, J.Q. and Y.C.; visualization, J.Q. and L.Z.; supervision, J.Z.; project administration, L.W. and J.Z. All authors have read and agreed to the published version of the manuscript.
Funding
This research was funded by the National Natural Science Foundation of China, grant number 52207180 and the Graduate Innovation Program of China University of Mining and Technology, grant number 2025WLJCRCZL348.
Data Availability Statement
Data are contained within the article.
Conflicts of Interest
The authors declare no conflicts of interest.
References
- Sun, J. Research on Main Top-Level Technical Indicators of the Traction System for 400 km/h EMU. China Railw. Sci. 2017, 38, 70–77. [Google Scholar]
- Wu, G.; Li, X.; Yang, Y.; Hu, G.; Gao, B.; Zhang, W.; Wang, Z. Research Progress of Fault Prediction and Health Management for On-board Traction Transformers. High Volt. Eng. 2020, 46, 876–889. [Google Scholar]
- Gao, B.; Xu, J.; Yang, Y.; Ni, Y.; Wu, G. Research on Thermal Aging Characteristics and Mechanism of Oil-Paper Insulation in On-Board Traction Transformers. J. China Railw. Soc. 2020, 42, 80–86. [Google Scholar]
- Quan, G.; Liu, Z.; Liang, X.; Zhong, M.; Xiong, X. Experimental Study on Temperature Field in Equipment Cabin of EMU under High-Temperature Environment. Railw. Roll. Stock 2018, 56, 1–5. [Google Scholar]
- Jarman, P.; Zhang, X.; Daghrah, M.; Wang, Z.; Liu, Q.; Dyer, P.; Gyore, A.; Smith, P.W.R.; Mavrommatis, P.; Negro, M.; et al. Uneven liquid flow distribution in radial ducts in transformer winding cooling systems shown by CFD and experimental measurements. In Proceedings of the CIGRE Paris Session 2018, Paris, France, 26 August 2018. [Google Scholar]
- Ma, Y.; Wang, Y.; Zhu, C.; Zhang, Y.; Xu, T.; Zhao, J. Performance Study of Oil-Immersed Transformers Under Different Cooling Methods. Mech. Electr. Eng. Technol. 2020, 49, 37–39. [Google Scholar]
- Liu, R.; Zhao, Z.; Zheng, C.; Gao, F.; Liu, X.; Wu, L. Influence of Oil Guide Plates on Oil Flow Characteristics and Temperature Distribution in Oil-Immersed Transformers. Chem. Autom. Instrum. 2023, 50, 865–874. [Google Scholar]
- Alonso, P.E.B.; Meana-Fernández, A.; Oro, J.M.F. Thermal response and failure mode evaluation of a dry-type transformer. Appl. Therm. Eng. 2017, 120, 763–771. [Google Scholar] [CrossRef]
- Zhang, X.; Wang, Z.; Liu, Q. Interpretation of hot spot factor for transformers in OD cooling modes. IEEE Trans. Power Deliv. 2017, 33, 1071–1080. [Google Scholar] [CrossRef]
- Raeisian, L.; Niazmand, H.; Ebrahimnia-Bajestan, E.; Werle, P. Thermal management of a distribution transformer: An optimization study of the cooling system using CFD and response surface methodology. Int. J. Electr. Power Energy Syst. 2019, 104, 443–455. [Google Scholar] [CrossRef]
- Daghrah, M.; Zhang, X.; Wang, Z.; Liu, Q.; Jarman, P.; Walker, D. Flow and temperature distributions in a disc type winding—Part I: Forced and directed cooling modes. Appl. Therm. Eng. 2020, 165, 114653. [Google Scholar]
- Zhang, J.; Li, X.; Vance, M. Experiments and modeling of heat transfer in oil transformer winding with zigzag cooling ducts. Appl. Therm. Eng. 2008, 28, 36–48. [Google Scholar] [CrossRef]
- Yuan, S.; Zhou, L.; Gou, X.; Ding, S.; Zhu, Q.; Wang, L.; Wang, D. Calculation of Train Wind Cooling Convective Heat Transfer and Thermal Network Modeling of Winding Regions for Dry-type On-board Traction Transformers. Proceedings of the CSEE. 2022, 42, 5719–5730. [Google Scholar]
- Patio-Jaramillo, G.A.; Iglesias, I.; Vera, M. Laminar Flow and Pressure Loss in Planar Tee Joints: Numerical Simulations and Flow Analysis. Eur. J. Mech. B/Fluids 2022, 92, 75–89. [Google Scholar] [CrossRef]
- Taheri, A.; Abdali, A.; Rabiee, A. Indoor distribution transformers oil temperature prediction using new electro-thermal resistance model and normal cyclic overloading strategy: An experimental case study. IET Gener. Transm. Distrib. 2020, 14, 5792–5803. [Google Scholar] [CrossRef]
- Taheri, A.; Abdali, A.; Rabiee, A. A novel model for thermal behavior prediction of oil-immersed distribution transformers with consideration of solar radiation. IEEE Trans. Power Deliv. 2019, 34, 1634–1646. [Google Scholar] [CrossRef]
- Mikhak-Beyranvand, M.; Faiz, J.; Rezaeealam, B. Thermal analysis of power transformer using an improved dynamic thermal equivalent circuit model. Electr. Power Compon. Syst. 2019, 47, 1598–1609. [Google Scholar] [CrossRef]
- Mikha-Beyranvand, M.; Faiz, J.; Rezaeealam, B.; Rezaei-Zare, A.; Jafarboland, M. Thermal analysis of power transformers under unbalanced supply voltage. IET Electr. Power Appl. 2019, 13, 503–512. [Google Scholar] [CrossRef]
- Patio-Jaramillo, G.A.; Iglesias, I.; Vera, M. Laminar Flow and Pressure Loss in Planar Tee Joints: Pressure Loss Coefficients. Eur. J. Mech. B/Fluids 2022, 94, 263–275. [Google Scholar] [CrossRef]
- Coddé, J.; Veken, W.V.; Baelmans, M. Assessment of a Hydraulic Network Model for Zig–Zag Cooled Power Transformer Windings. Appl. Therm. Eng. 2015, 80, 220–228. [Google Scholar] [CrossRef]
- Zhang, X.; Wang, Z. Assessment of hydraulic network models in predicting reverse flows in OD cooled disc type transformer windings. IEEE Access 2019, 7, 139249–139257. [Google Scholar] [CrossRef]
- Wu, W.; Wang, Z.D.; Revell, A.; Lacovides, H.; Jarman, P. Computational fluid dynamics calibration for network modelling of transformer cooling oil flows—Part I heat transfer in oil ducts. IET Electr. Power Appl. 2012, 6, 19–27. [Google Scholar] [CrossRef]
- Zhang, J.; Li, X. Coolant Flow Distribution and Pressure Loss in ONAN Transformer Windings—Part I: Theory and Model Development. IEEE Trans. Power Deliv. 2004, 19, 186–193. [Google Scholar] [CrossRef]
- Zhang, J.; Li, X. Oil Cooling for Disk-Type Transformer Windings—Part 1: Theory and Model Development. IEEE Trans. Power Deliv. 2006, 21, 1318–1325. [Google Scholar] [CrossRef]
- Weinlader, A.; Wu, W.; Tenbohlen, S.; Wang, Z. Prediction of the Oil Flow Distribution in Oil-Immersed Transformer Windings by Network Modelling and Computational Fluid Dynamics. IET Electr. Power Appl. 2012, 6, 82–90. [Google Scholar] [CrossRef]
Disclaimer/Publisher’s Note: The statements, opinions and data contained in all publications are solely those of the individual author(s) and contributor(s) and not of MDPI and/or the editor(s). MDPI and/or the editor(s) disclaim responsibility for any injury to people or property resulting from any ideas, methods, instructions or products referred to in the content. |
© 2025 by the authors. Licensee MDPI, Basel, Switzerland. This article is an open access article distributed under the terms and conditions of the Creative Commons Attribution (CC BY) license (https://creativecommons.org/licenses/by/4.0/).
