1. Introduction
Advancements in information and communication technology (ICT), including fifth-generation communication technology (5G) and increasingly sophisticated mobile networks, have led to a significant increase in the number of mobile users and Internet of Things (IoT) devices. In particular, projections indicate that, by 2030, 5G technology will account for over 75% of all mobile traffic [
1,
2]. In order to ensure the low latency and high reliability required for future wireless devices, the network management efficiency and flexibility of heterogeneous 5G networks can be improved by employing a large number of both micro- and macro-base stations [
3]. However, the energy consumption associated with these base stations and their operation under high loads mean that ICT is potentially a major contributor to global energy consumption and greenhouse gas emissions in the future. Therefore, the development of green heterogeneous 5G networks is crucial to ensure the sustainability of ICT [
4,
5,
6].
The integration of sustainable renewable energy sources, such as solar and wind power, can significantly reduce the electricity costs and carbon emissions associated with base stations in 5G networks. However, it is difficult for traditional power grids to fully accommodate green energy, thus exacerbating the environmental burden [
7,
8,
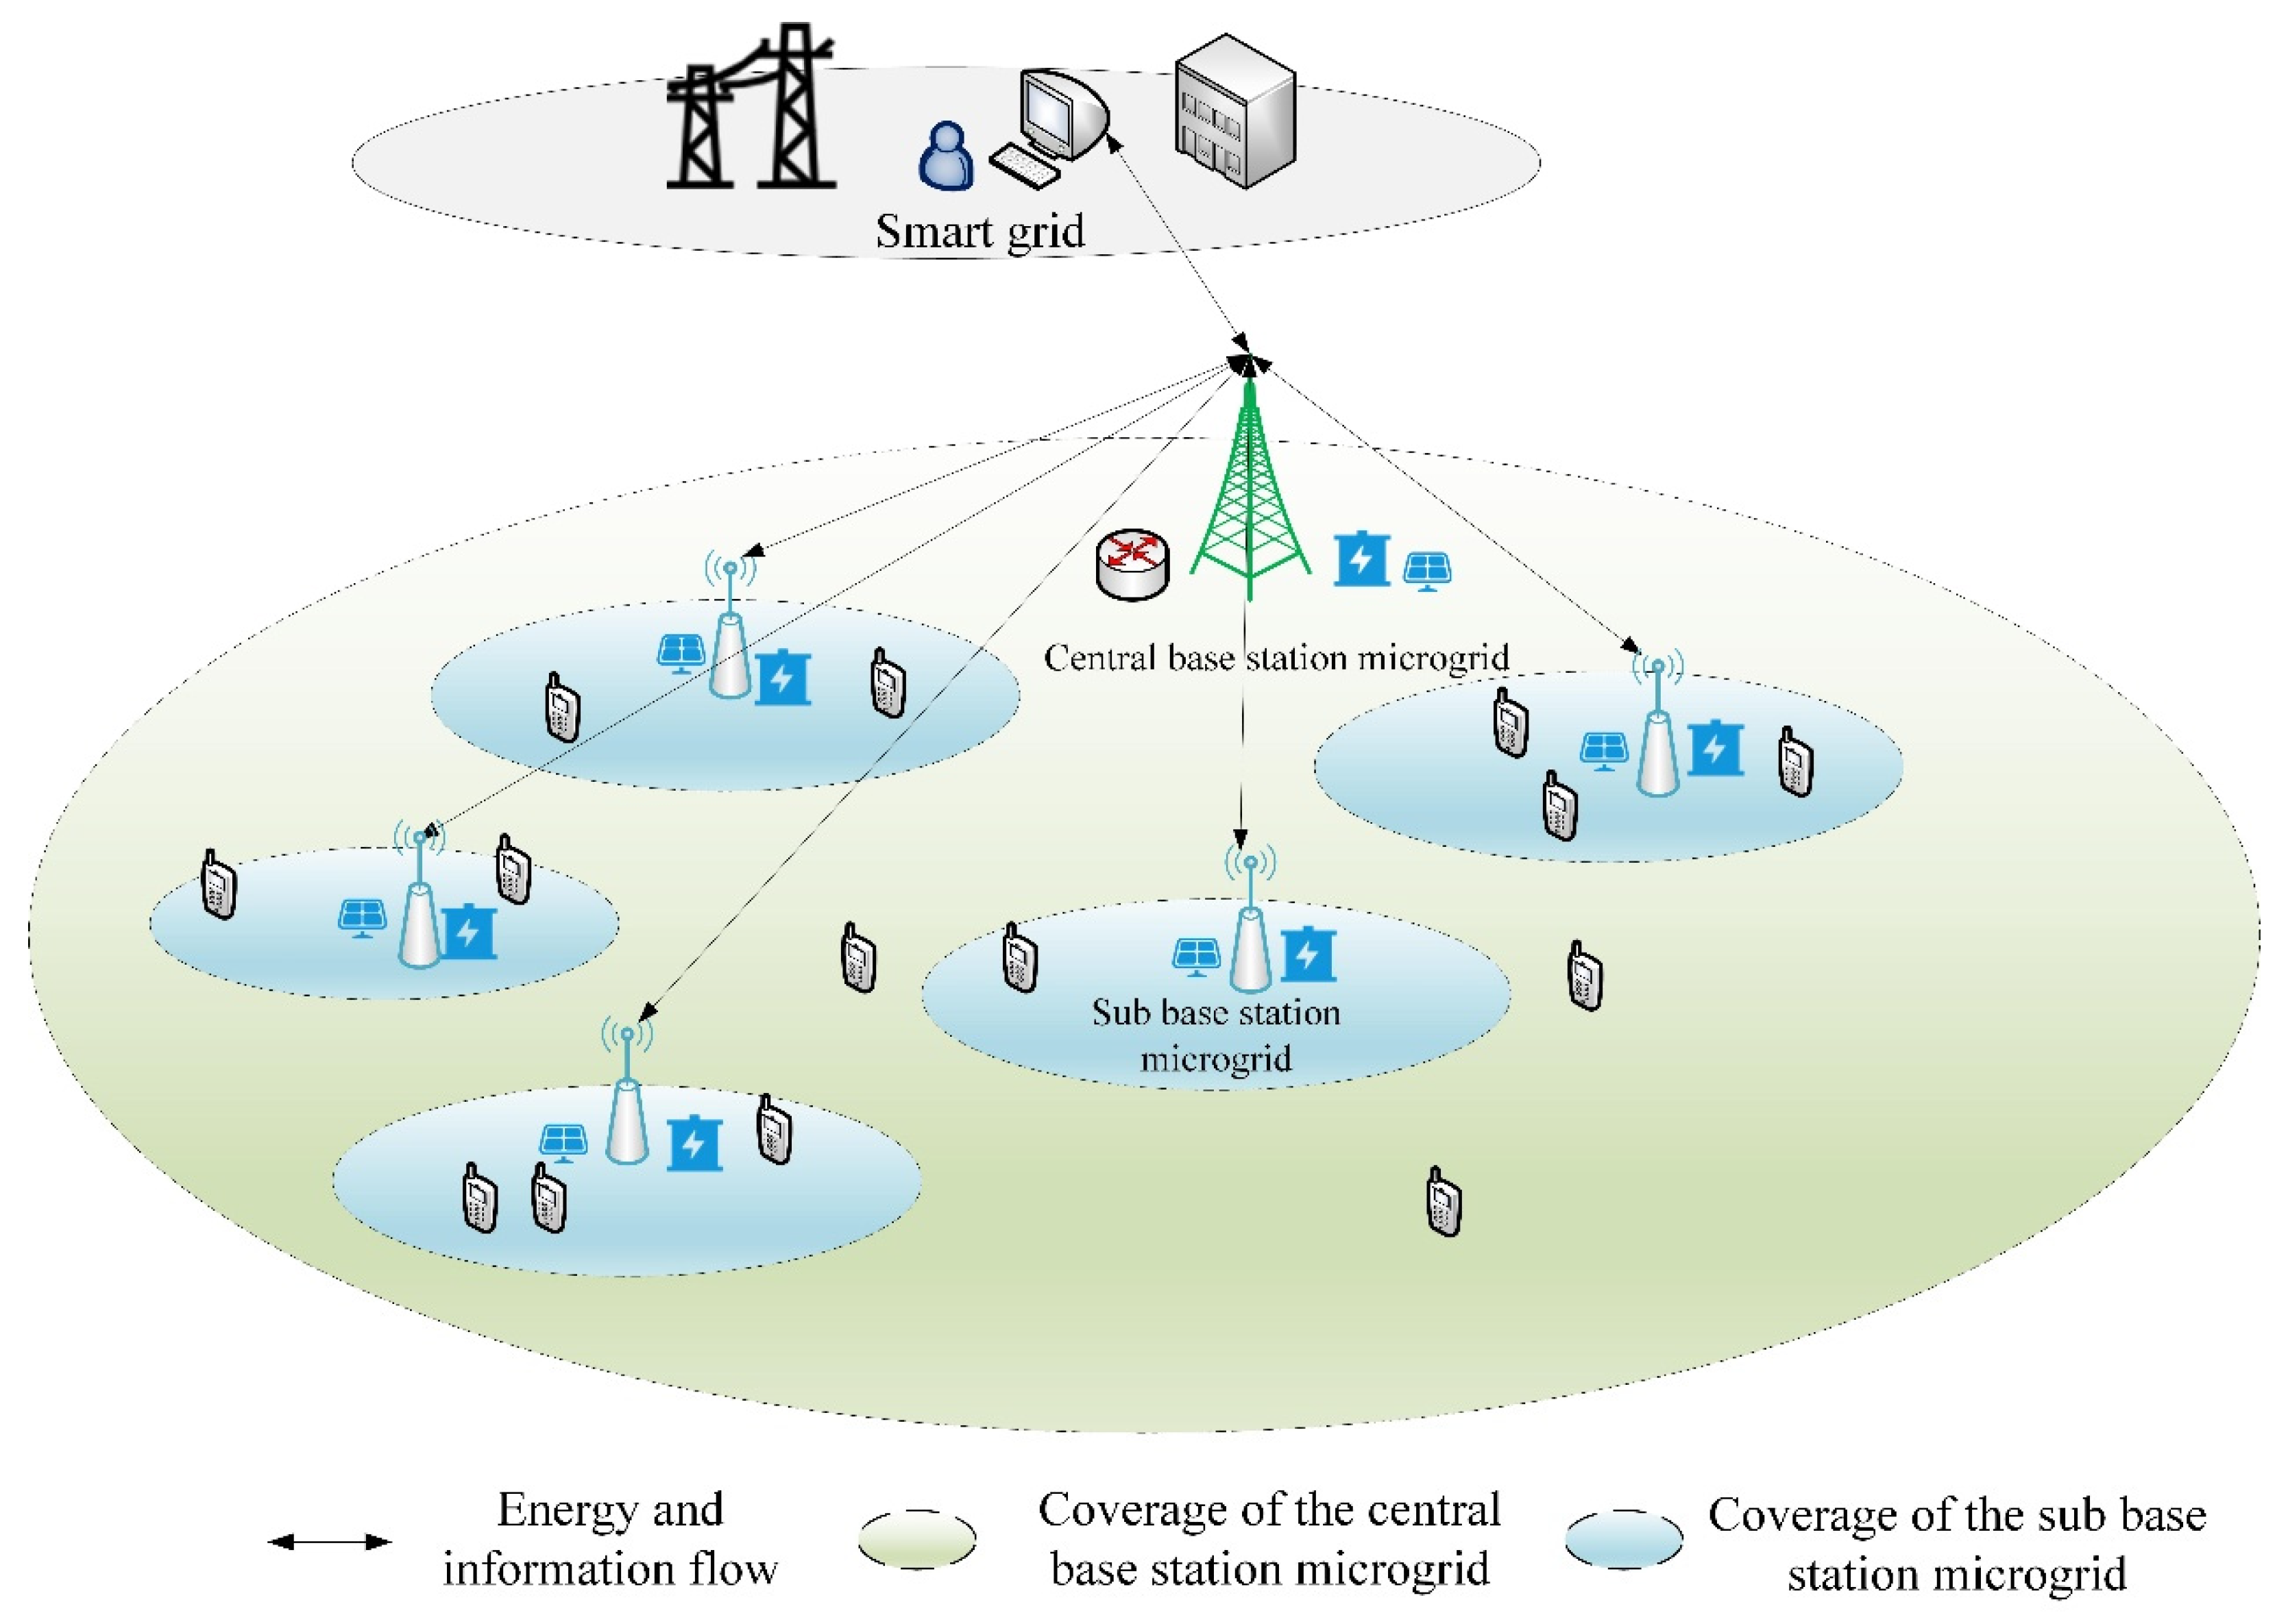
9]. A promising solution to this is the use of microgrids, a critical component of smart grids, to facilitate the interconnection of heterogeneous base station microgrid (BSMG) systems through renewable energy access, enabling bidirectional flows of information and energy [
10,
11]. The strategic implementation of sleep mode for base stations can significantly reduce excessive energy consumption. While renewable energy-powered BSMGs present a sustainable solution, several critical challenges remain unresolved [
12,
13]. Existing strategies often fail to effectively balance accurate traffic demand prediction, efficient green energy utilization, and strict user quality of service (QoS) guarantees, given the stochastic nature of renewable energy generation and dynamic network loads. Moreover, traditional sleep-mode strategies for base stations (BSs) frequently compromise QoS during user handovers to active stations, while static optimization methods cannot adapt to spatiotemporal variations in energy supply and demand. Furthermore, conventional multi-objective optimization frameworks, such as the standard multi-objective evolutionary algorithm based on decomposition (MOEA/D), exhibit slow convergence and poor solution diversity when addressing the coupled objectives of energy efficiency, cost minimization, and QoS preservation in large-scale heterogeneous networks. These limitations lead to inefficient energy sharing, over-reliance on grid power, and degraded network performance, thereby hindering the development of sustainable 5G infrastructure [
14].
This study proposes a cooperative strategy for sleep and energy sharing within a heterogeneous BSMG system. The primary objective is to minimize grid dependency and carbon footprint in heterogeneous BSMG systems while ensuring strict QoS requirements. This is achieved through synergistic traffic-aware sleep scheduling and adaptive energy-sharing strategies. The principal contributions of this paper are as follows:
A two-layer heterogeneous BSMG system model enabling bidirectional energy-information flow through centralized control.
A deep learning model integrating convolutional blocks and multi-head attention mechanisms for enhanced spatiotemporal traffic forecasting.
An improved MOEA/D algorithm incorporating quantum local search and adaptive mutation to optimize energy sharing and sleep scheduling while ensuring QoS.
Comprehensive simulations demonstrating 13% energy savings during peak loads and 36.5% higher green energy utilization compared to existing approaches.
The remainder of this paper is organized as follows. In
Section 2, we review related works on reducing the energy consumption of heterogeneous base station networks. In
Section 3, the system model is formulated. The design of the proposed scheme is described in
Section 4. We evaluate the performance of the proposed scheme in
Section 5. Finally,
Section 6 concludes this study.
2. Related Work
Past studies have highlighted significant advancements in reducing the energy consumption of heterogeneous base station networks, particularly via the integration of renewable energy into mobile networks and the energy management of base station dormancy [
15,
16]. For example, Guo et al. introduced an effective algorithm for the energy deployment of heterogeneous 5G base stations that optimized the number of micro-base stations, their deployment locations, and their power configurations, thus enhancing both energy efficiency and overall network performance [
17]. The authors of [
18] also derived a coverage probability expression for a base station on/off control system utilizing random geometry methods and extended the analysis to heterogeneous networks based on weighted density. This approach offered a promising strategy to minimize the number of active base stations, consequently reducing energy consumption. However, the optimization of deployment strategies may lead to a significant increase in construction costs, which is inconsistent with the pursuit of low-carbon practices. To address this, Ghosh et al. examined a sleep strategy for heterogeneous base stations using M/M/1(Markovian Arrival, Markovian Service, Single Server) queuing theory and analysed the energy utilization rate of their proposed strategy using continuous-time Markov chains [
19]. Similarly, the scheme described in [
20] proposed a power-sensing user association and renewable energy allocation strategy designed to optimize grid-connected energy in heterogeneous mixed-energy cellular networks, employing Lyapunov optimization to manage energy consumption across users. Nevertheless, previous research on heterogeneous base station networks has primarily concentrated on the base stations themselves, overlooking both user QoS and energy consumption costs. Moreover, under rapidly changing environmental conditions or fluctuating traffic demand, the adaptability of these decision-making methodologies may be insufficient.
In addition, in 5G network design and management, there are also literatures that use mathematical optimization models and algorithms for optimization. In recent years, mathematical optimization models and algorithms have shown significant potential in 5G network resource management and energy efficiency optimization. The study [
21] introduced a mixed integer programming model based on virtual network function reusable function blocks, providing an innovative framework for deploying 5G network virtualization functions. By jointly optimizing computing resource allocation and network topology reconstruction, this model reduces end-to-end delay and enhances resource utilization. In the domain of energy efficiency management, Salahdine et al. [
22] conducted a systematic review of sleep mode techniques in ultra-dense networks, highlighting the energy-saving potential of dynamic sleep strategies. This conclusion is supported by the variable threshold sleep mechanism proposed by Ma et al. [
23], which significantly improves the energy efficiency of base stations through a dynamic activation threshold in live network tests. Regarding data uncertainty in network management, the robust optimization framework proposed by Garroppo et al. [
24] represents a methodological breakthrough in addressing wireless channel fluctuations and traffic prediction errors. By constructing a multi-scenario robust model, this scheme reduces network energy consumption while maintaining QoS constraints.
To address randomness in network traffic demand for heterogeneous base stations, several studies have employed deep learning techniques for predictive modelling to enhance load management [
25]. One notable contribution involves the development of a graph attention network that employs time series similarity to capture spatial and temporal information from cellular traffic data [
26]. This approach has been successfully applied to traffic prediction in 5G and beyond-5G environments, demonstrating superior performance compared to classical prediction models such as graph neural networks and gated recurrent units (GRUs). Another study [
27] has proposed a traffic prediction method based on support vector regression, which allows users to identify the optimal unit within a heterogeneous network based on anticipated traffic demand. Additionally, Ref. [
28] introduced the integration of Butterworth filters for the preprocessing of raw data, constructing various hybrid prediction models that combine CNNs and LSTMs tailored to different frequency bands of Butterworth outputs with multiple features. Simulation results confirmed the effectiveness of this methodology across a diverse range of scenarios. The authors in [
29] also introduced a base station hibernation scheme based on BiLSTM networks and the signal-to-interference-plus-noise ratio (SINR) in a two-layer heterogeneous cellular network. This framework predicted user traffic demand, which was then used to determine hibernation strategies for base stations within the network. Attention mechanisms have emerged as a critical advancement in deep learning, enabling models to concentrate on salient features while mitigating long-range dependency issues. Recent literature highlights their effectiveness in spatiotemporal data analysis. The study by [
30] proposed a time-level attention-assisted CNN architecture for cellular traffic prediction, effectively reducing the computational time required for traffic data forecasting. Additionally, Ref. [
31] introduced a novel temporal attention-enhanced network that selectively filters out highly correlated data due to short-term temporal dependencies and periodicity by leveraging input time series. The temporal attention mechanism is subsequently applied to extracted spatiotemporal features to exploit further temporal dependencies. In [
32], variational mode decomposition (VMD) is utilized to preprocess network traffic, while the whale optimization algorithm is employed to select optimal parameters for VMD. Furthermore, the transformer network is enhanced by integrating a temporal convolutional network and a multi-head attention mechanism. This proposed model is validated to outperform traditional single or combined models in wireless network traffic prediction.
Inspired by the above research, traffic prediction primarily relies on deep learning models such as CNNs and LSTMs, with their performance directly impacting the energy efficiency of base station networks. To enhance these deep learning models, attention mechanisms have been developed to effectively capture salient information while addressing the long-range dependency issues faced by some models. Motivated by these studies and the high energy consumption associated with heterogeneous 5G BSMG networks, this paper implements a DAM that incorporates both convolutional block attention and multi-head attention to optimize the performance of a CNN–BiLSTM traffic prediction model. It also explores the use of collaborative sleep and energy-sharing algorithms for BSMGs. In particular, a modified MOEA/D enhanced using quantum local search and adaptive variation techniques is employed to reduce the energy consumption of heterogeneous BSMG systems while considering user QoS requirements.
4. Cooperative Sleep and Energy-Sharing Strategy for BSMGs
To reduce energy consumption within the grid while protecting user QoS, we propose a cooperative strategy for sleep and energy sharing among BSMGs guided by the prediction of traffic loads. Then, the optimization problem is modelled and finally solved by the improved MOEA/D algorithm.
4.1. Traffic Prediction Based on Deep Learning
In practice, user traffic within a cellular network exhibits real-time fluctuations, self-similarity, and long-range dependence. To take full advantage of the spatial expansion, feature extraction, and fusion capabilities of the CNN and the temporal extension of BiLSTM, this paper introduces a battery storage management grid traffic prediction model based on a combination of a CNN, DAM, and BiLSTM. By precisely forecasting the traffic for each battery storage management grid, we aim to effectively manage network resources and enhance the energy efficiency of the overall system.
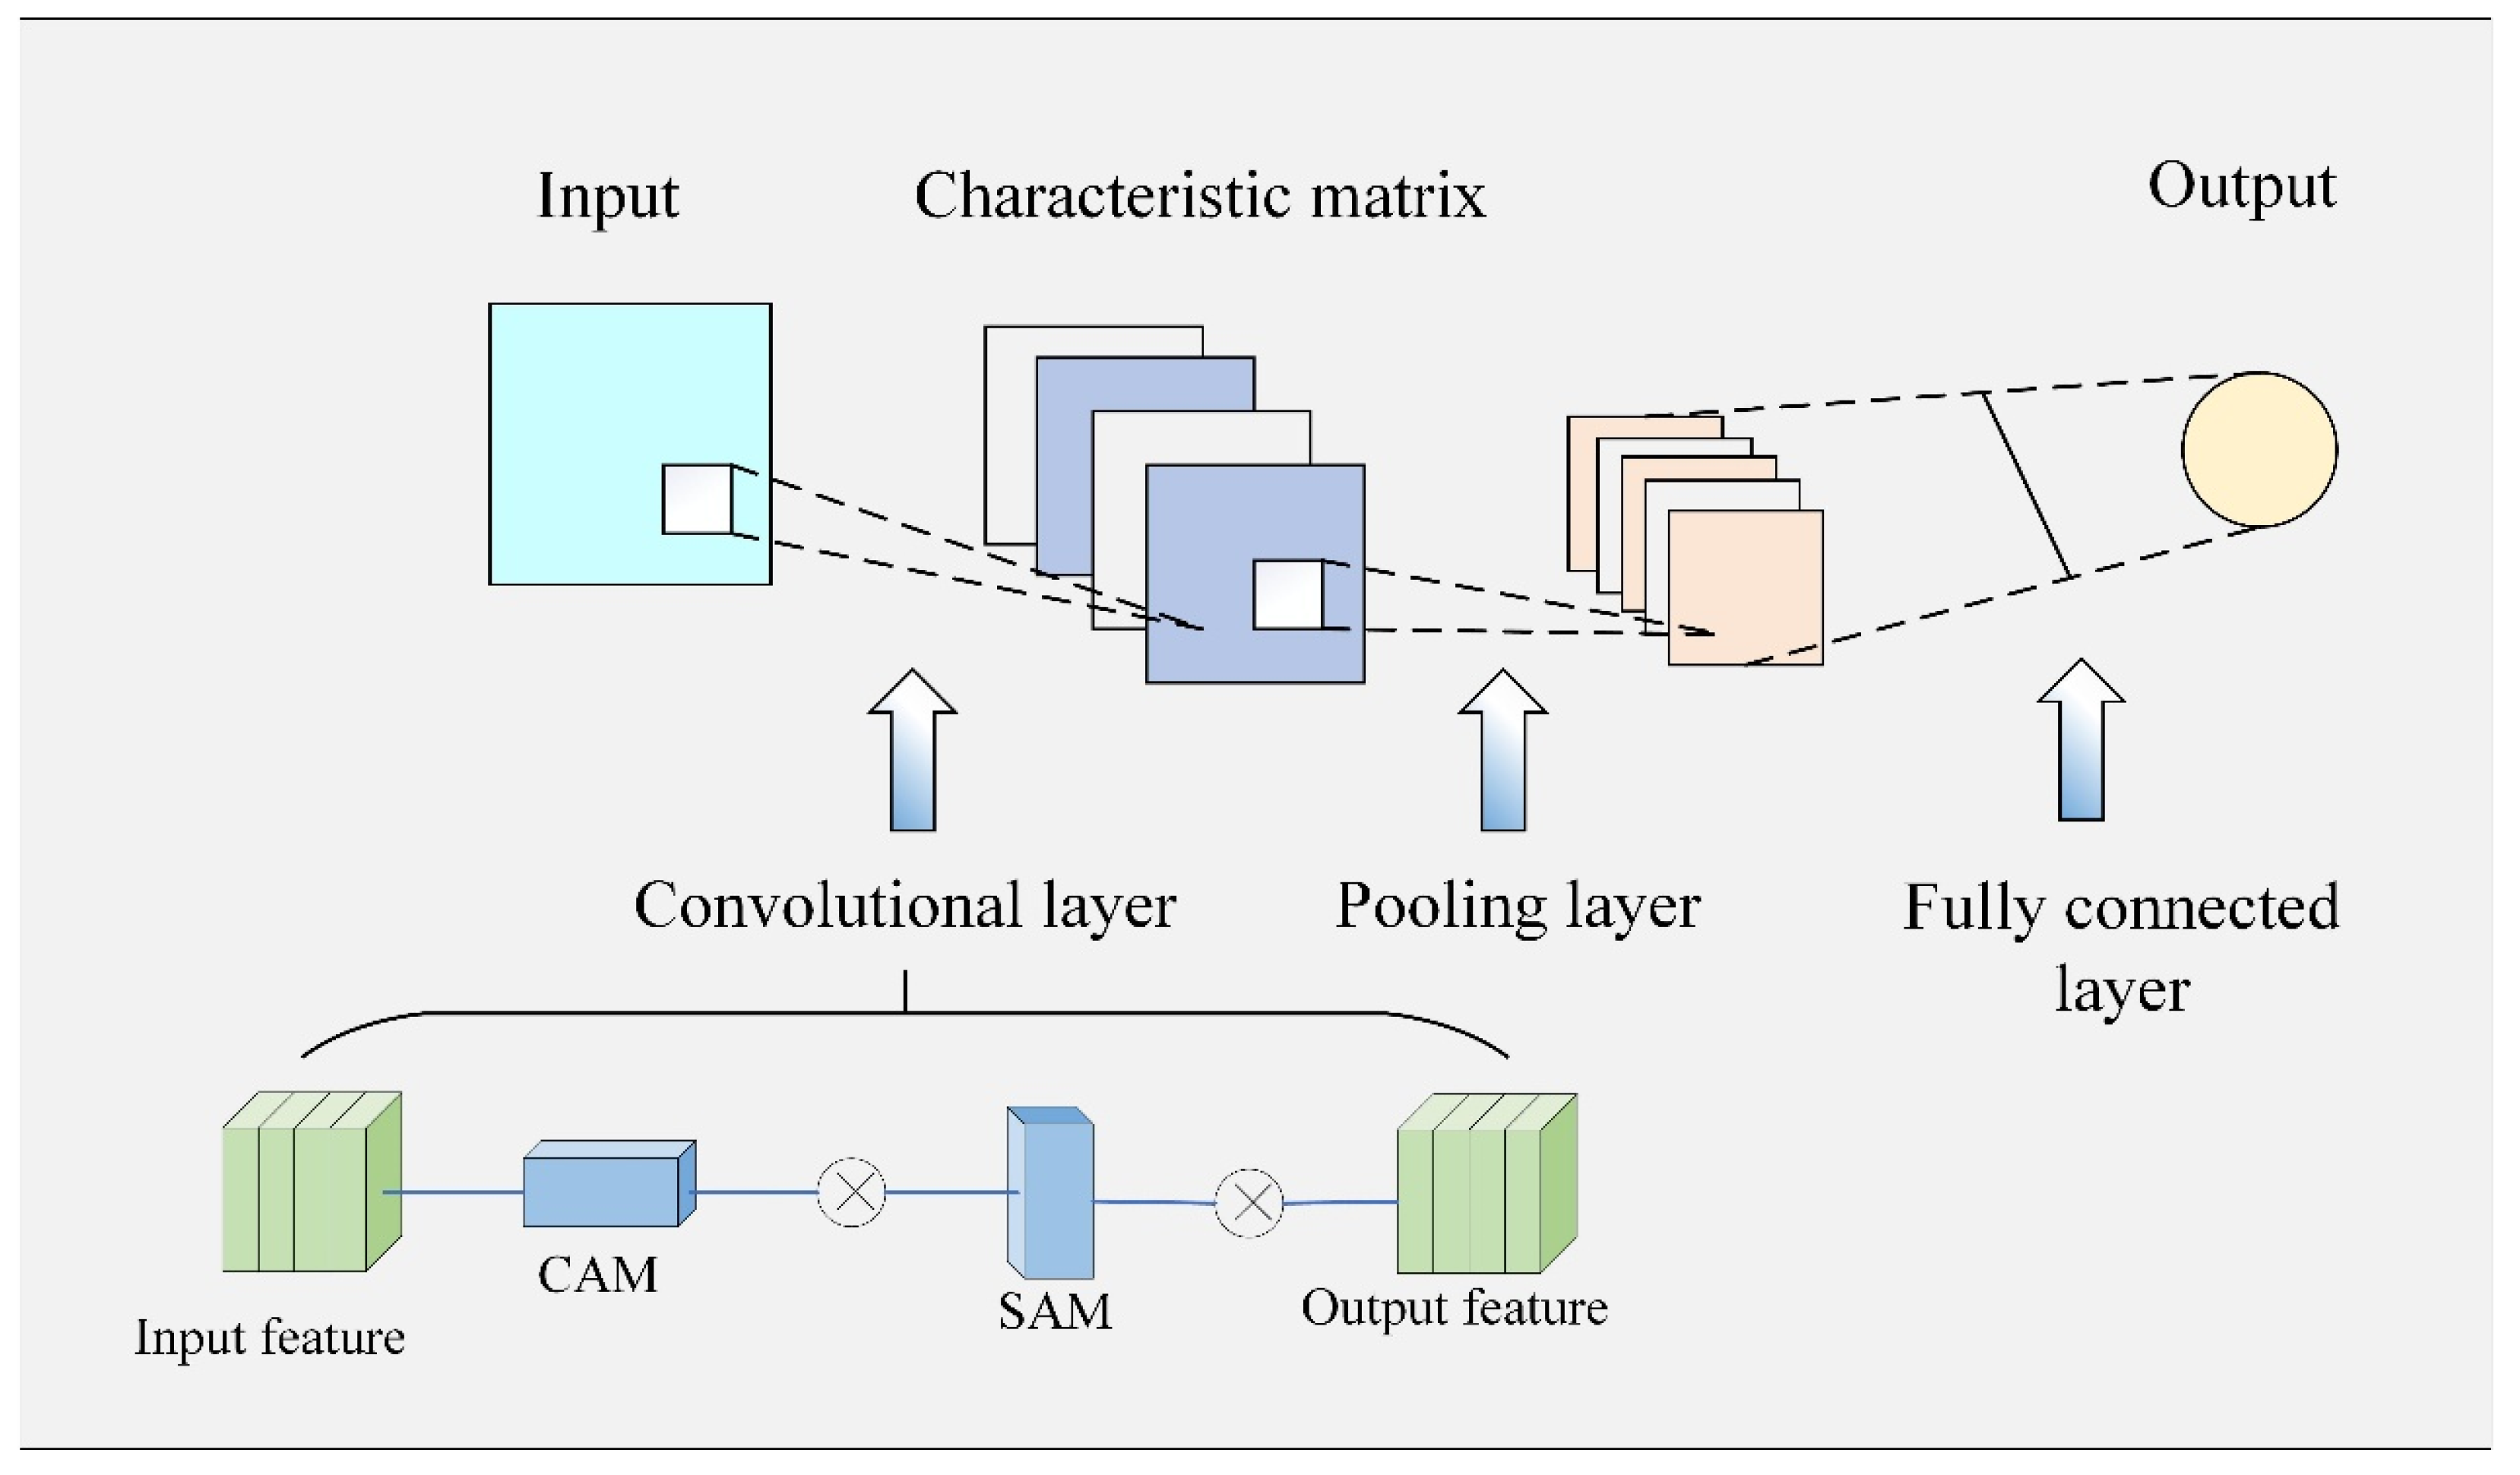
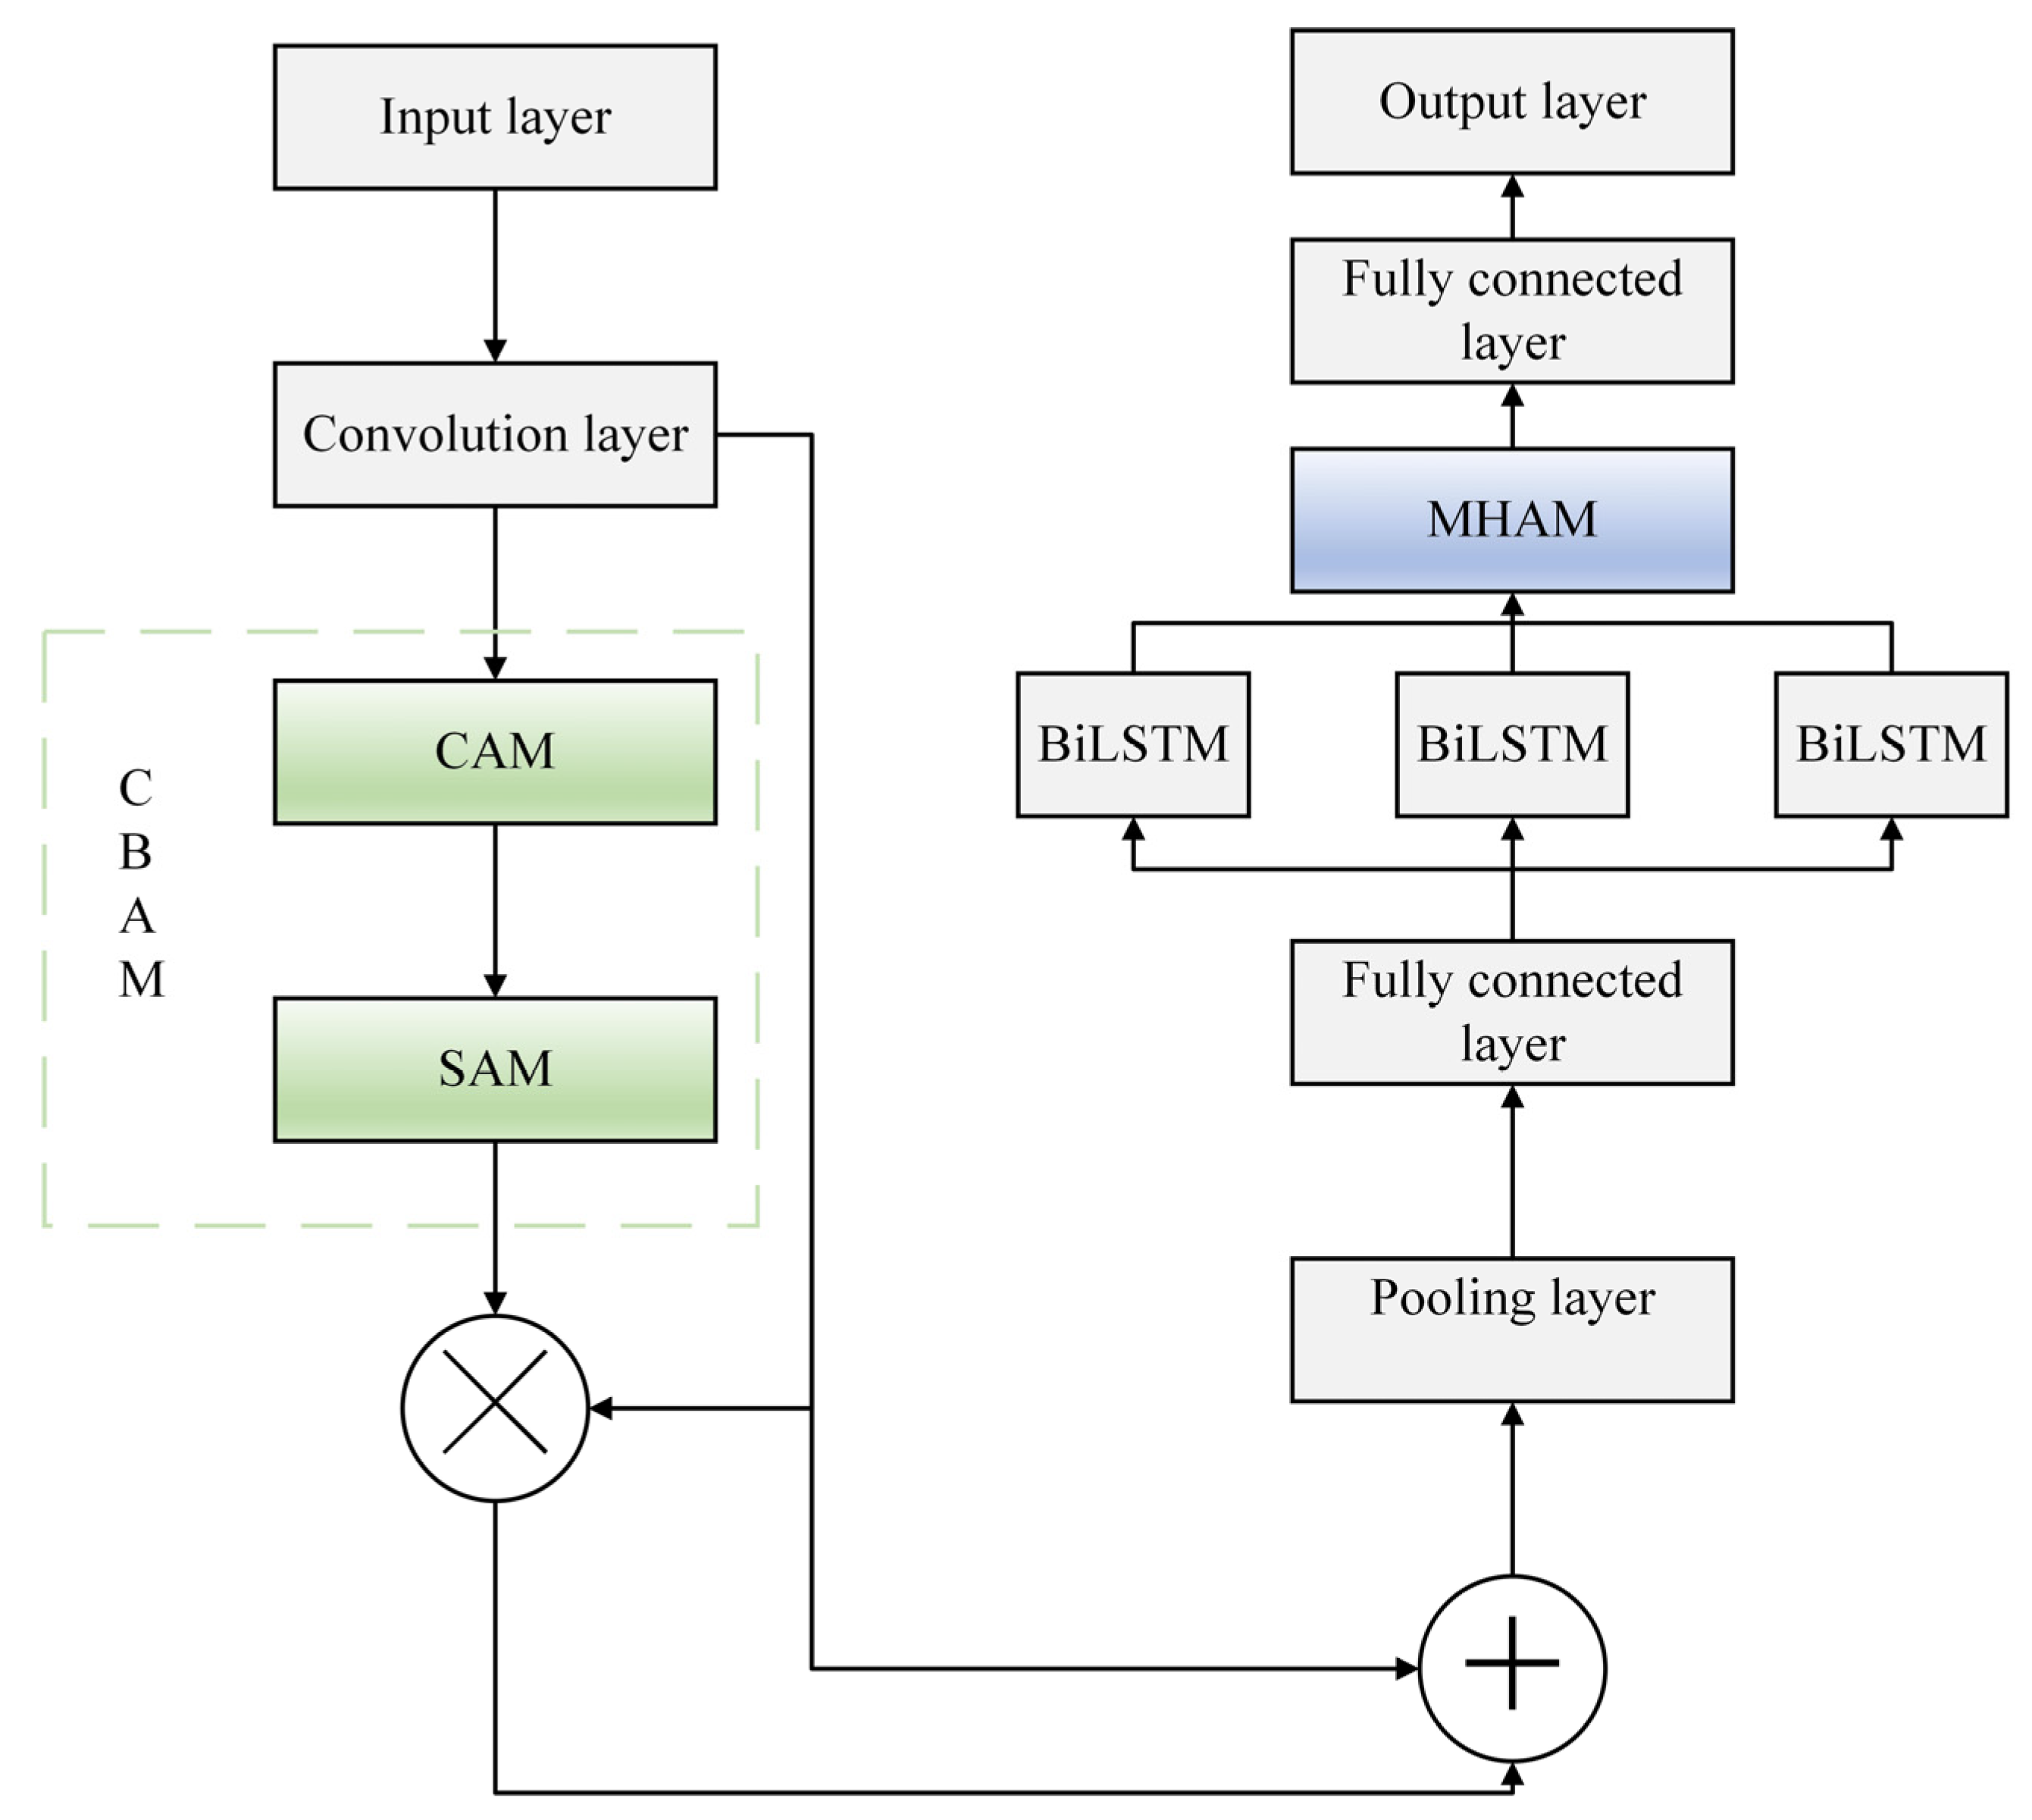
As a multi-layer supervised learning network employing convolutional operations, a CNN employs weight sharing for spatial expansion, feature extraction, and fusion. The architecture of a CNN generally consists of convolutional, pooling, and fully connected layers. However, for time series prediction models, the use of traditional CNNs may lead to information loss or the identification of local features that do not represent the overall trend of the series.
Attention mechanisms are designed to optimize the use of limited computational resources when processing large volumes of data by focusing on the most significant information. We thus integrate a convolutional block attention module (CBAM) into the CNN framework. By taking into account the interaction of information across time scales and introducing weight allocation, the ability of the CNN to learn salient channel feature information is strongly enhanced, thus improving the predictive accuracy of the model.
The CBAM consists of two components: a channel attention module (CAM) and a spatial attention module (SAM). The CAM begins with global average pooling, followed by two fully connected layers that reduce the dimensionality and increase the nonlinearity, respectively. A sigmoid activation function and feature multiplication yield the attention weight vector for each channel, resulting in a weighted feature representation that strengthens the correlation between different feature channels while eliminating redundant information. This process enables the model to concentrate on the most pertinent feature channels.
The SAM employs maximum pooling across the channel dimensions for each weighted feature map, capturing the maximum response value at each spatial location to highlight important features. Similar to the CAM, this module enhances various spatial locations within the feature map, forcing the model to focus on the most important spatial areas.
The CBAM is employed after each convolutional block of the CNN. The output feature map from each convolutional block is first processed through the CAM and then the SAM, which emphasizes the representation of significant channels and spatial locations.
Figure 2 summarizes the structure of the refined CNN network.
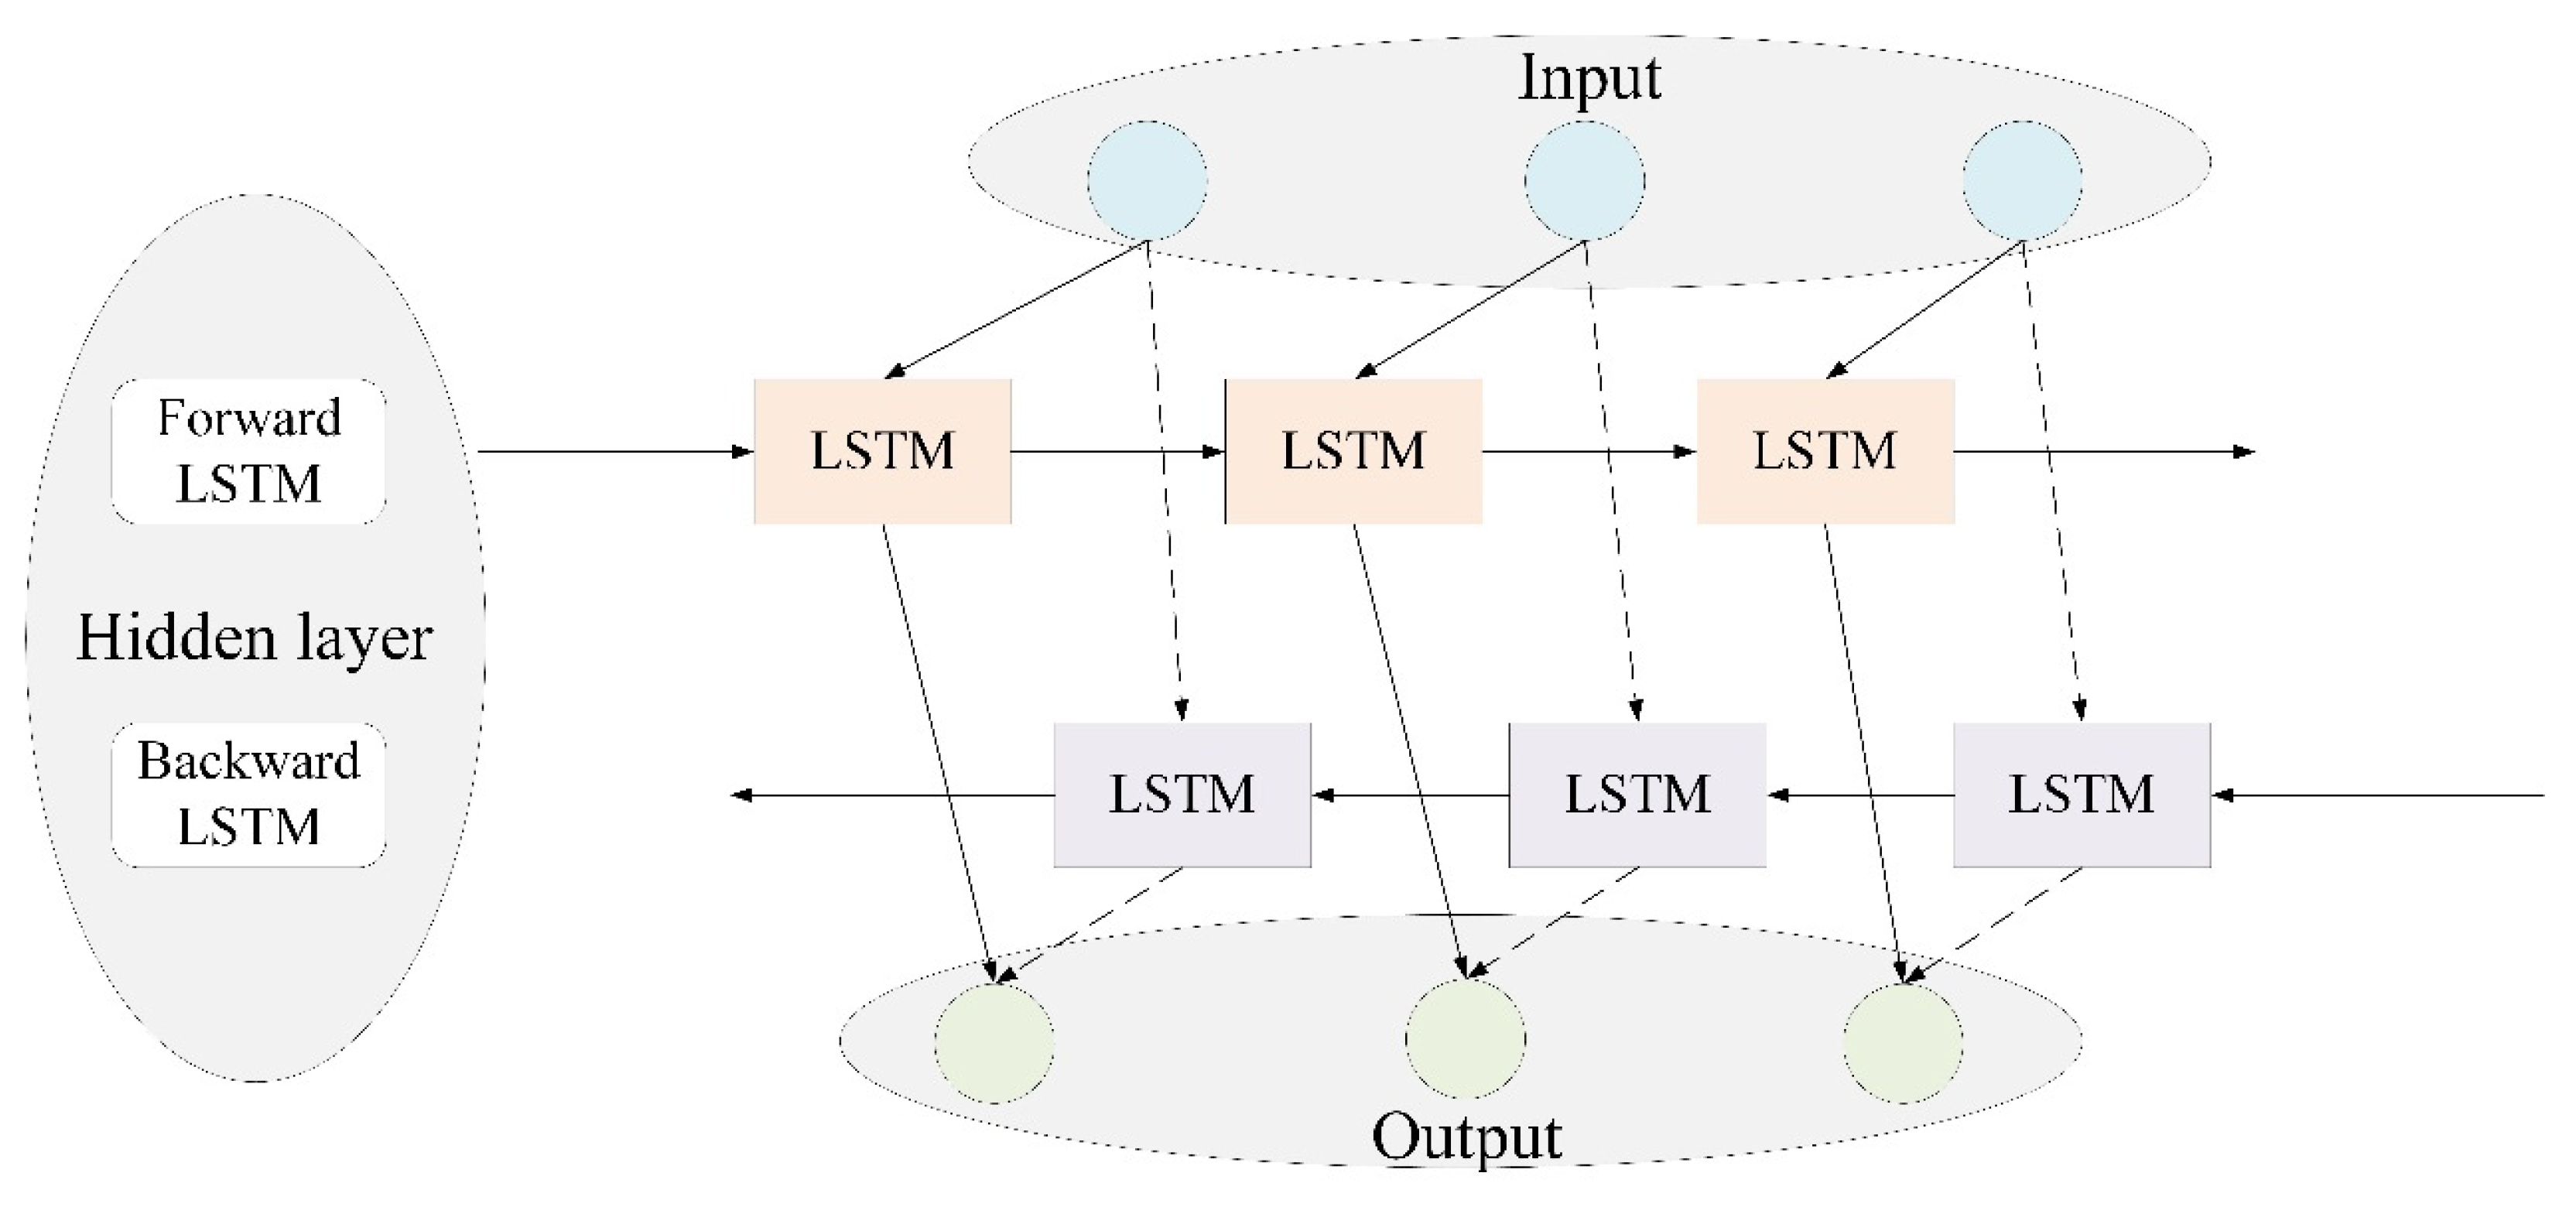
LSTM networks generally avoid the vanishing and exploding gradient issues associated with traditional recurrent neural networks during the training process and are more suited for the tracking of the long-term dependencies in time-series data. A BiLSTM network consists of two LSTM units, thus improving on traditional one-way LSTM networks, which cannot make full use of future information in sequence data. BiLSTM employs a shared weight matrix that can extract forward and reverse features from the time series via splicing, thus overcoming long-term dependency issues and improving prediction performance. The network structure of BiLSTM is presented in
Figure 3.
The BiLSTM cell structure includes forget, input, and output gates. In the BiLSTM network, the state unit updates and retains the historical state, ensuring that the output at each step is closely linked to both the current and historical input. However, when the time series being processed is very long, the limited storage capacity of the state unit may result in the loss of critical information from important time nodes. To address this, we introduce a multi-head attention mechanism (MHAM) to the BiLSTM network, enhancing its ability to focus on and capture a variety of features within the time series for the prediction of traffic loads.
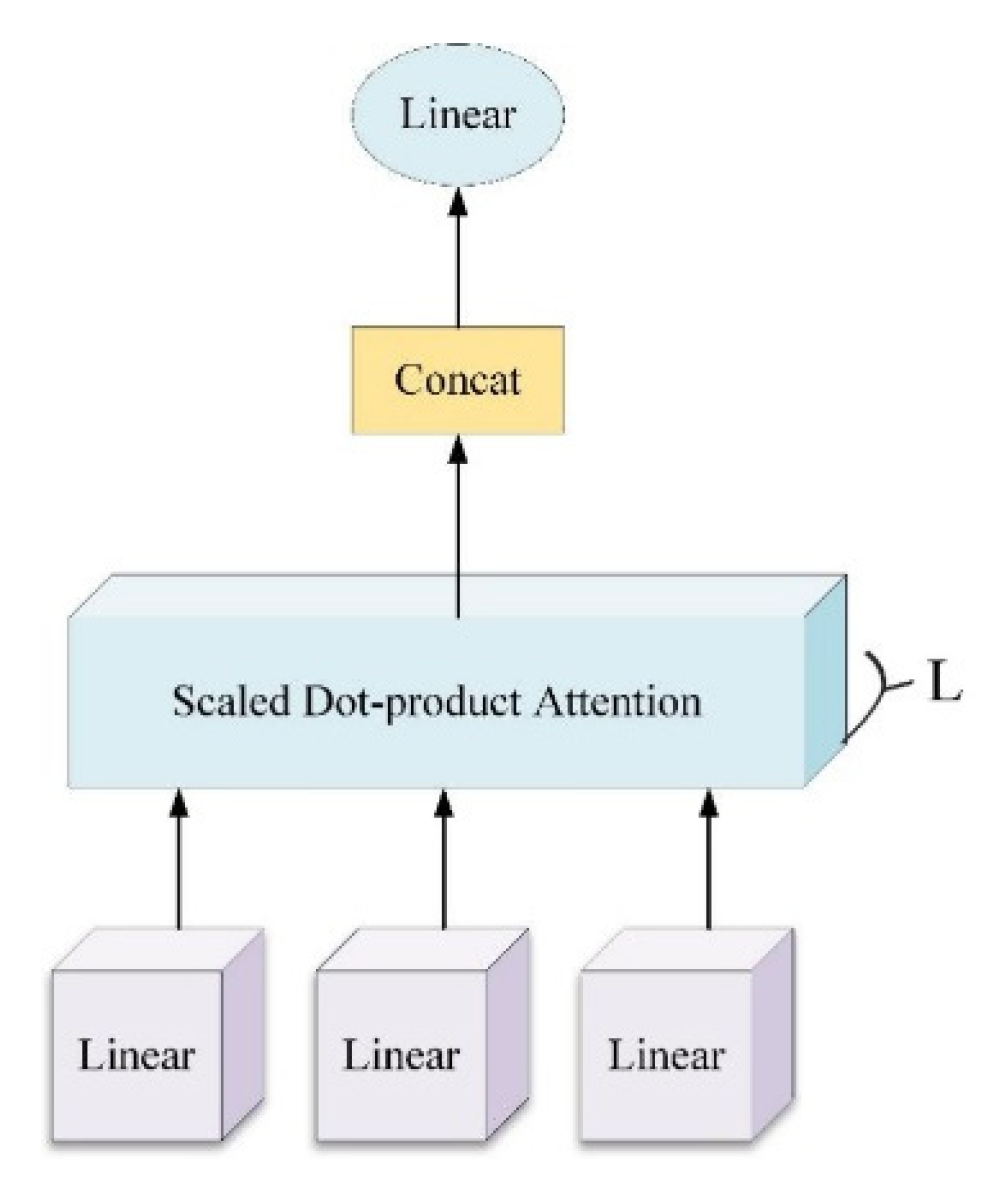
The MHAM independently concentrates on various features via the parallel computation of multiple attention heads, each employing its own weight allocation method. This facilitates the analysis of input information from multiple perspectives. The output vector from the BiLSTM is transformed into three input matrices—query (Q), key (K), and value (V)—using different mapping operations. The corresponding weights obtained during the training process are denoted
,
, and
, respectively. The assigned weights for each hidden layer vector can consequently be expressed as
The MHAM partitions the time series into L subspaces, with each head executing self-attention calculations on its respective subspace. The multiple heads that are generated are subsequently concatenated. The attention output matrix is normalized using a softmax function as follows:
where
represents the feature dimensions for each key, which are used for weight scaling and are normalized to the interval [0, 1] using the softmax function.
In Equation (12),
is the weight of the linear transformation,
represents the L-th head of the MHAM, and Concat represents the concatenation operation. The structure of the MHAM is presented in
Figure 4.
To improve the traffic prediction performance of the BSMGs, we combine the CBAM with the MHAM to produce a DAM that optimizes the CNN and BiLSTM, respectively (
Figure 5). In the feature extraction stage of the CNN–DAM–BiLSTM model, the CAM and the SAM are employed after each convolutional block of the CNN by introducing the CBAM to the CNN. The output feature map of each convolutional block passes sequentially through the CAM and SAM to increase the weighting of important channel features, before being processed by the pooling layer and the fully connected layer. Because BiLSTM can suffer from longitudinal temporal information loss, the MHAM is added to the BiLSTM model to more accurately capture correlations with the time series data. The BiLSTM network is trained to extract features with long-term correlation characteristics from the traffic feature vectors extracted from the CNN layer, and, when combined with the MHAM, the output of the BiLSTM network is weighted to learn more feature information from different spaces. The weighted feature information is then passed to the fully connected layer to predict future traffic loads.
4.2. Optimization Problem Modeling
Based on the aforementioned system model, this section formulates a multi-objective optimization problem to coordinate the sleep decisions, energy allocation, and resource sharing within the BSMG. By jointly optimizing , , and , the optimal trade-off among system revenue, QoS benefits, and energy efficiency is achieved while satisfying QoS constraints and maintaining energy balance.
Decision variable: Based on predictions from the CNN–DAM–BiLSTM traffic prediction model, when a BSMG is idle or its normalized load
is low, it can be switched to sleep mode to save grid or renewable energy. The
at time t determines state
of the BSMG. When cells become idle (
), they transition to sleep mode and remain there (
) while the traffic loads remain below the threshold. The sets of active and sleeping BSMGs are defined as
and
denotes the minimum required rate set of users during a low-load period. Because the distance between individual BSMGs is short, it can be assumed that transmission loss during energy sharing is negligible, meaning that BSMG i has surplus energy to share with other BSMGs that are facing energy shortages. Therefore, the energy-sharing strategy employed between BSMGs
and
at time t can be expressed as
where
denotes the energy taken by BSMG i from the smart grid.
Feasibility constraint: Equation (14) is then introduced as a constraint for the active and sleeping BSMGs to ensure the QoS of users based on the rate index while also preventing BSMGs from being overloaded:
where
is the threshold for the user SINR. We obtain the candidate sleep set for the BSMGs using the CNN–DAM–BiLSTM traffic prediction model. The energy consumption of BSMG i can be expressed as follows:
The BSMGs can share energy with each other or purchase energy from the smart grid to ensure the QoS of users when their renewable energy supply is exhausted. For simplicity, in this paper, solar energy is the only source of BSMG renewable energy for the model network. The renewable energy generation of a BSMG at time t can be expressed as
, which can be predicted based on the previous historical data for photovoltaic power generation and statistical methods as follows [
34]:
where
is the generation power of the photovoltaic power generation system,
is the rated generation power of (
,
) under standard test conditions,
is the intensity of light radiation,
is the ambient temperature, and
is the power factor. In addition, it is assumed that the energy consumption of the renewable energy capacity generation process is 0.
Each BSMG is equipped with an energy storage device to meet periods of high demand in the future and reduce its dependence on smart grid energy. Assuming that the initial energy storage is 0, the energy storage for a BSMG at time t is denoted as
, which is constrained by the maximum energy storage capacity
. The energy storage state in the subsequent time slot can be determined, thereby satisfying the energy storage dynamic balance constraint, as shown in Equation (17):
Energy sharing between BSMGs is based on the difference in energy consumption caused by spatiotemporal variation in traffic loads and differences in renewable energy reserves due to geographic factors. The amount of energy available for energy sharing based on the current load and the renewable energy harvesting status of BSMG i can be expressed as follows:
Objective function: To encourage energy sharing among BSMGs, we set the cost of energy sharing between BSMGs (
) to be lower than the cost of energy purchased from the smart grid (
). The objective function of the BSMG system benefit can then be compared with the use of the traditional grid power supply as follows:
In addition, considering the user experience, we define the QoS objective function for the network energy efficiency obtained using the maximum demand rate as follows:
Finally, based on the ratio of total energy consumption to total service rate, the objective function used to determine the network energy efficiency is as follows:
Based on the above analysis, the decision variables of the optimization problem mainly include binary vectors (
and
) and continuous variables (the amount of energy sharing between BSMGS
and the user rate guarantee
based on QoS requirements). Feasibility constraints include QoS constraints and load constraints (Equation (14)), sleep state constraints (Equation (15)) and energy balance constraints (Equation (17)). The objective function of the model aims to maximize system revenue, QoS benefits, and energy efficiency. This constitutes a typical NP-hard problem. To address the trade-offs between these objectives, we construct a mixed integer nonlinear programming model within the Pareto optimization framework, as demonstrated in Equation (22).
4.3. Improved MOEA/D Algorithm
To address the aforementioned multi-objective optimization problem, this paper employs an enhanced version of the MOEA/D algorithm. The MOEA/D is based on a decomposition strategy that is particularly suitable for solving optimization problems with complex nonlinear and integer decision variables. This algorithm generates a set of uniform weight vectors, divides the multi-objective problem into many single-objective sub-problems, assigns the corresponding weight and the neighbourhood of the related population point to each sub-problem, and generates new solutions through the crossover and mutation of each sub-problem. The decomposition strategy is then used to aggregate the multi-objective problem into a single-objective problem, and the parent population is updated. Each sub-problem is repeated until the termination condition is reached by optimizing the solution of the corresponding neighbourhood. The weighted sum method, Chebyshev method, and penalty-based boundary intersection method are three common decomposition methods in the MOEA/D algorithm. Among these, the Chebyshev decomposition serves as the most fundamental and widely used strategy within MOEA/D. It primarily minimizes the maximum weighted deviation, thereby effectively addressing complex multi-objective optimization problems. The mathematical formulation of its aggregation function is as follows:
Let denote the set of feasible strategies, V∗ represent the current optimal solution of the objective function , which is also the ideal point, and be the weight vector. When the weight vector is uniformly distributed, the corresponding solutions of the subproblems are uniformly distributed along the Pareto front. Moreover, the solution update for each subproblem relies on the solutions of neighbouring subproblems, with information sharing facilitated through the neighbourhood structure of the weight vector.
The proposed algorithm outperforms other alternatives when dealing with continuous multi-objective problems. However, its fixed neighbourhood value reduces the convergence speed, and its global search ability is weak because it uses a fixed mutation probability. Therefore, this paper proposes a method to self-adaptively adjust the size of the neighbourhood value based on a quantum local search. Assume that the current solution represents a quantum state, as depicted in Equation (24):
Let
denote the angle between the current solution and the local optimum solution. The quantum rotation gate functions to rotate the quantum state and update the probability amplitude:
Let
denote the rotation angle. If
indicates that the current solution is close to a local optimum, then
follows. The probability amplitude after rotation is presented in Equation (26):
Consequently, the probability of escaping the local optimum is given by the following:
The initial rotation angle
is assumed to be small and can be approximated using a Taylor expansion.
When the rotation angle is much less than 1, higher-order terms can be neglected, yielding the following result:
This indicates that the square of the rotation angle is proportional to the probability of escaping the local optimum.
To accelerate convergence and avoid invalid search, the adaptive rotation coefficient is first calculated as follows [
35]:
Where
is the maximum number of iterations and
and
are preset fixed values. By substituting Equation (29), the probability of escaping the local optimum using the adaptive rotation strategy can be derived as follows:
Consequently, the probability of escaping the local optimum is high during the initial iterations. As the rotation angle decreases in the later stages, the ability to escape the local optimum diminishes, thereby balancing exploration and exploitation.
The attraction point
is generated based on the individual historical optimal position and the group historical optimal position using Equation (32):
where
is a random matrix with a uniform distribution within [0, 1]. Based on the
-well potential, it is assumed that the neighbourhood position vector exhibits quantum behaviour, with the wave function
used to describe the vector state. By solving the Schrodinger equation for the one-dimensional
-well potential, the probability density for the vector at a certain point in space is obtained:
where
is the new neighbourhood position vector and
is the position vector after the individual expansion coefficient is changed. Finally, the new position vector equation is obtained using a Monte Carlo stochastic simulation as follows:
In addition, the adaptive mutation probability
is generated based on the number of iterations and Gaussian mutation to enhance the global search without reducing the convergence speed, as shown in Equation (35):
where
is the rate adjustment factor and
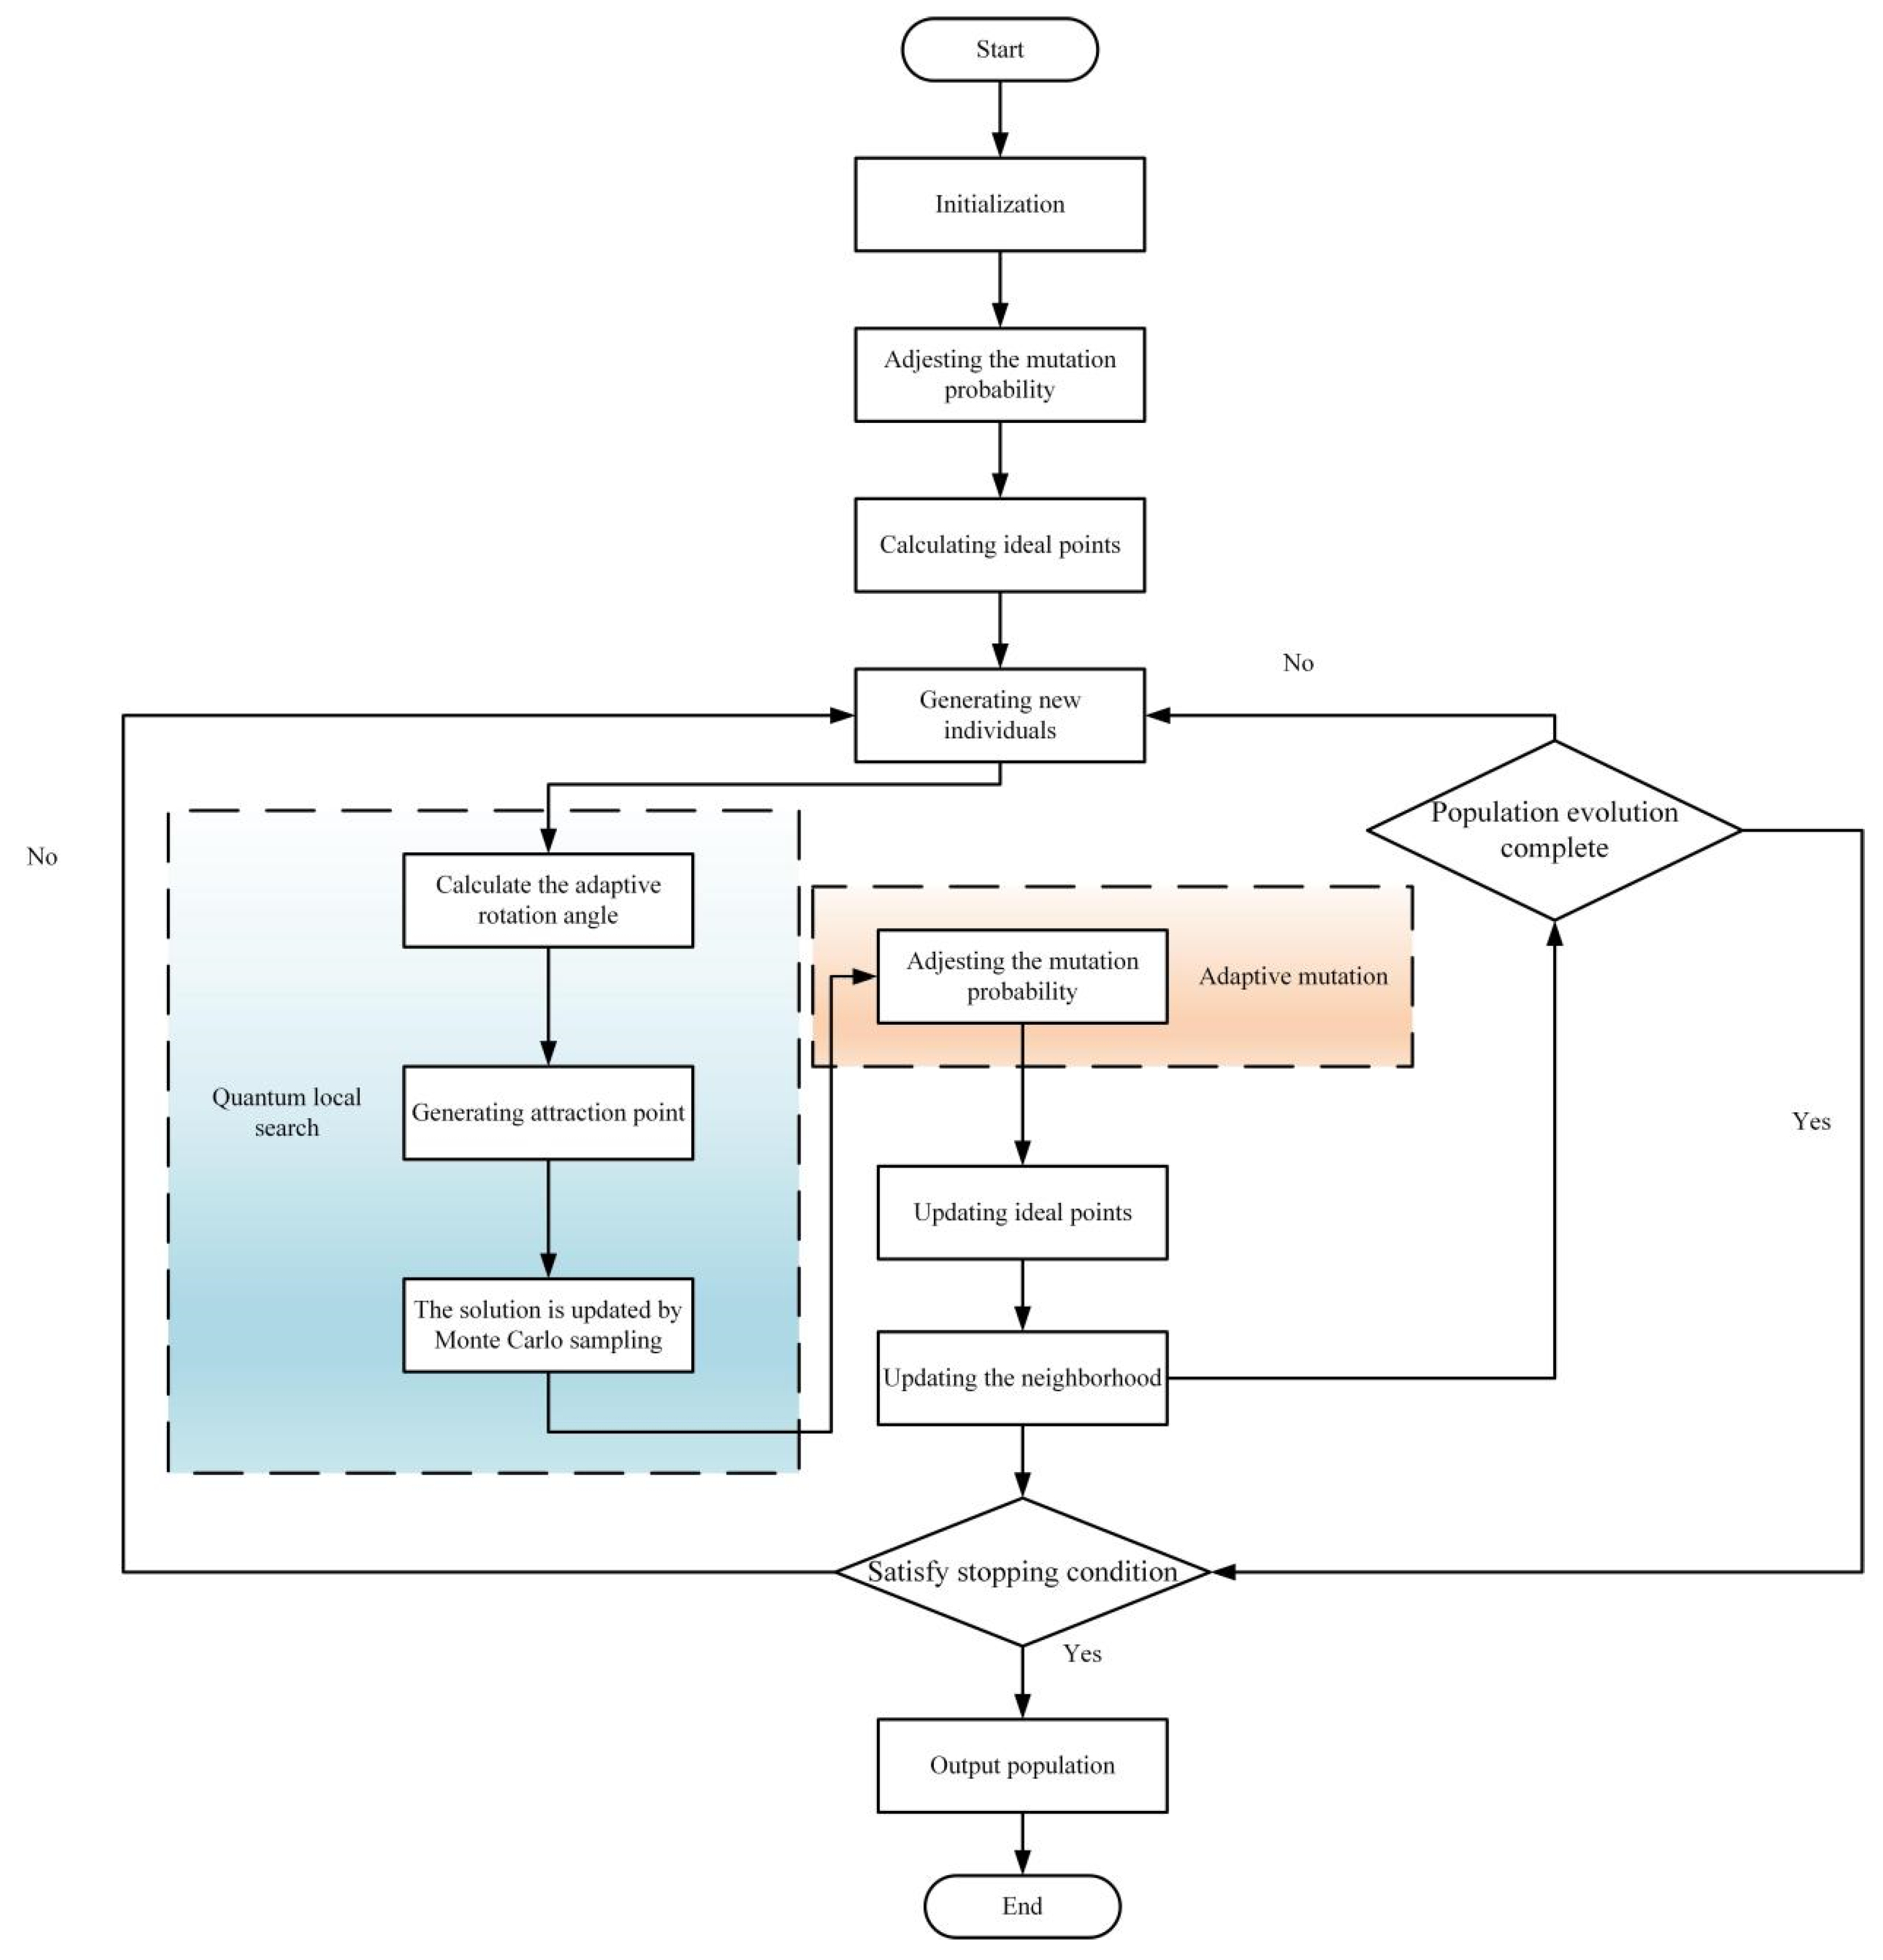
is the standard normal distribution. A summary of the improved MOEA/D is presented in
Figure 6 and Algorithm 1.
| Algorithm 1. Improved MOEA/D algorithm |
Input: multi-objective optimization problem, evenly distributed weight vector, neighbourhood size, maximum number of iterations and crossover and mutation parameters, and quantum rotation angle range ()
Step 1: Initialize the neighbourhood. For each weight vector, compute the Euclidean distance to all other weight vectors. Select the nearest weight vectors as the neighbourhood. Subsequently, initialize the population and the ideal point .
Step 2: For , do
Step 3: For each individual , candidate solution is generated based on quantum local search.
Calculate the adaptive rotation angle:
Generate the attraction point.
The solution is updated by Monte Carlo sampling.
Step 4: Perform adaptive Gaussian mutation on and calculate the dynamic mutation probability.
Step 5: Update the ideal point: If an objective value of is superior to that of , then is updated accordingly.
Step 6: Update the neighbourhood. Utilize the Chebyshev decomposition-based aggregate function. If , then the objective function value is .
Step 7: If the maximum number of iterations is reached, stop the iteration and output the optimal solution set, otherwise return to step 2.
Output: Non-dominated solution stored during search. |
The time complexity of the original MOEA/D algorithm is primarily determined by the following operations:
Neighbourhood cooperation: Each subproblem must traverse solutions within its neighbourhood for information exchange. The time complexity for this operation is , where denotes the number of subproblems.
Crossover and mutation: The genetic operation complexity for each subproblem is , and the total is .
Reference point update: To maintain the ideal point, all objective values must be traversed. The complexity for this operation is , where is the number of objectives.
In summary, the time complexity for a single iteration of the original algorithm is . The overall complexity, considering as the maximum number of iterations, is .
The improvements to the algorithm include the adaptive neighbourhood size for quantum local search and the dynamic adjustment of the Gaussian mutation probability. The calculations of the expansion coefficient, the generation of the attraction point, the computation of probability density, and the Monte Carlo simulation, which are introduced in the algorithm, are related to the neighbourhood size . However, since only linear operations are required for each individual, the complexity remains , which is of the same order as the original neighbourhood operation. The dynamic adjustment of the mutation probability involves generating a normal distribution and updating parameters, with the complexity of a single operation being , and the total being . Compared to the original mutation operation, the complexity order does not increase. In summary, the complexity of the improved algorithm remains . Through adaptive neighbourhood adjustment and dynamic mutation probability, the enhanced MOEA/D algorithm significantly improves global search capability and convergence speed while maintaining the complexity order of the original algorithm. In the context of energy sharing within a base station microgrid, the algorithm can efficiently address dynamic multi-objective optimization problems and meet real-time scheduling requirements.
5. Simulation Results
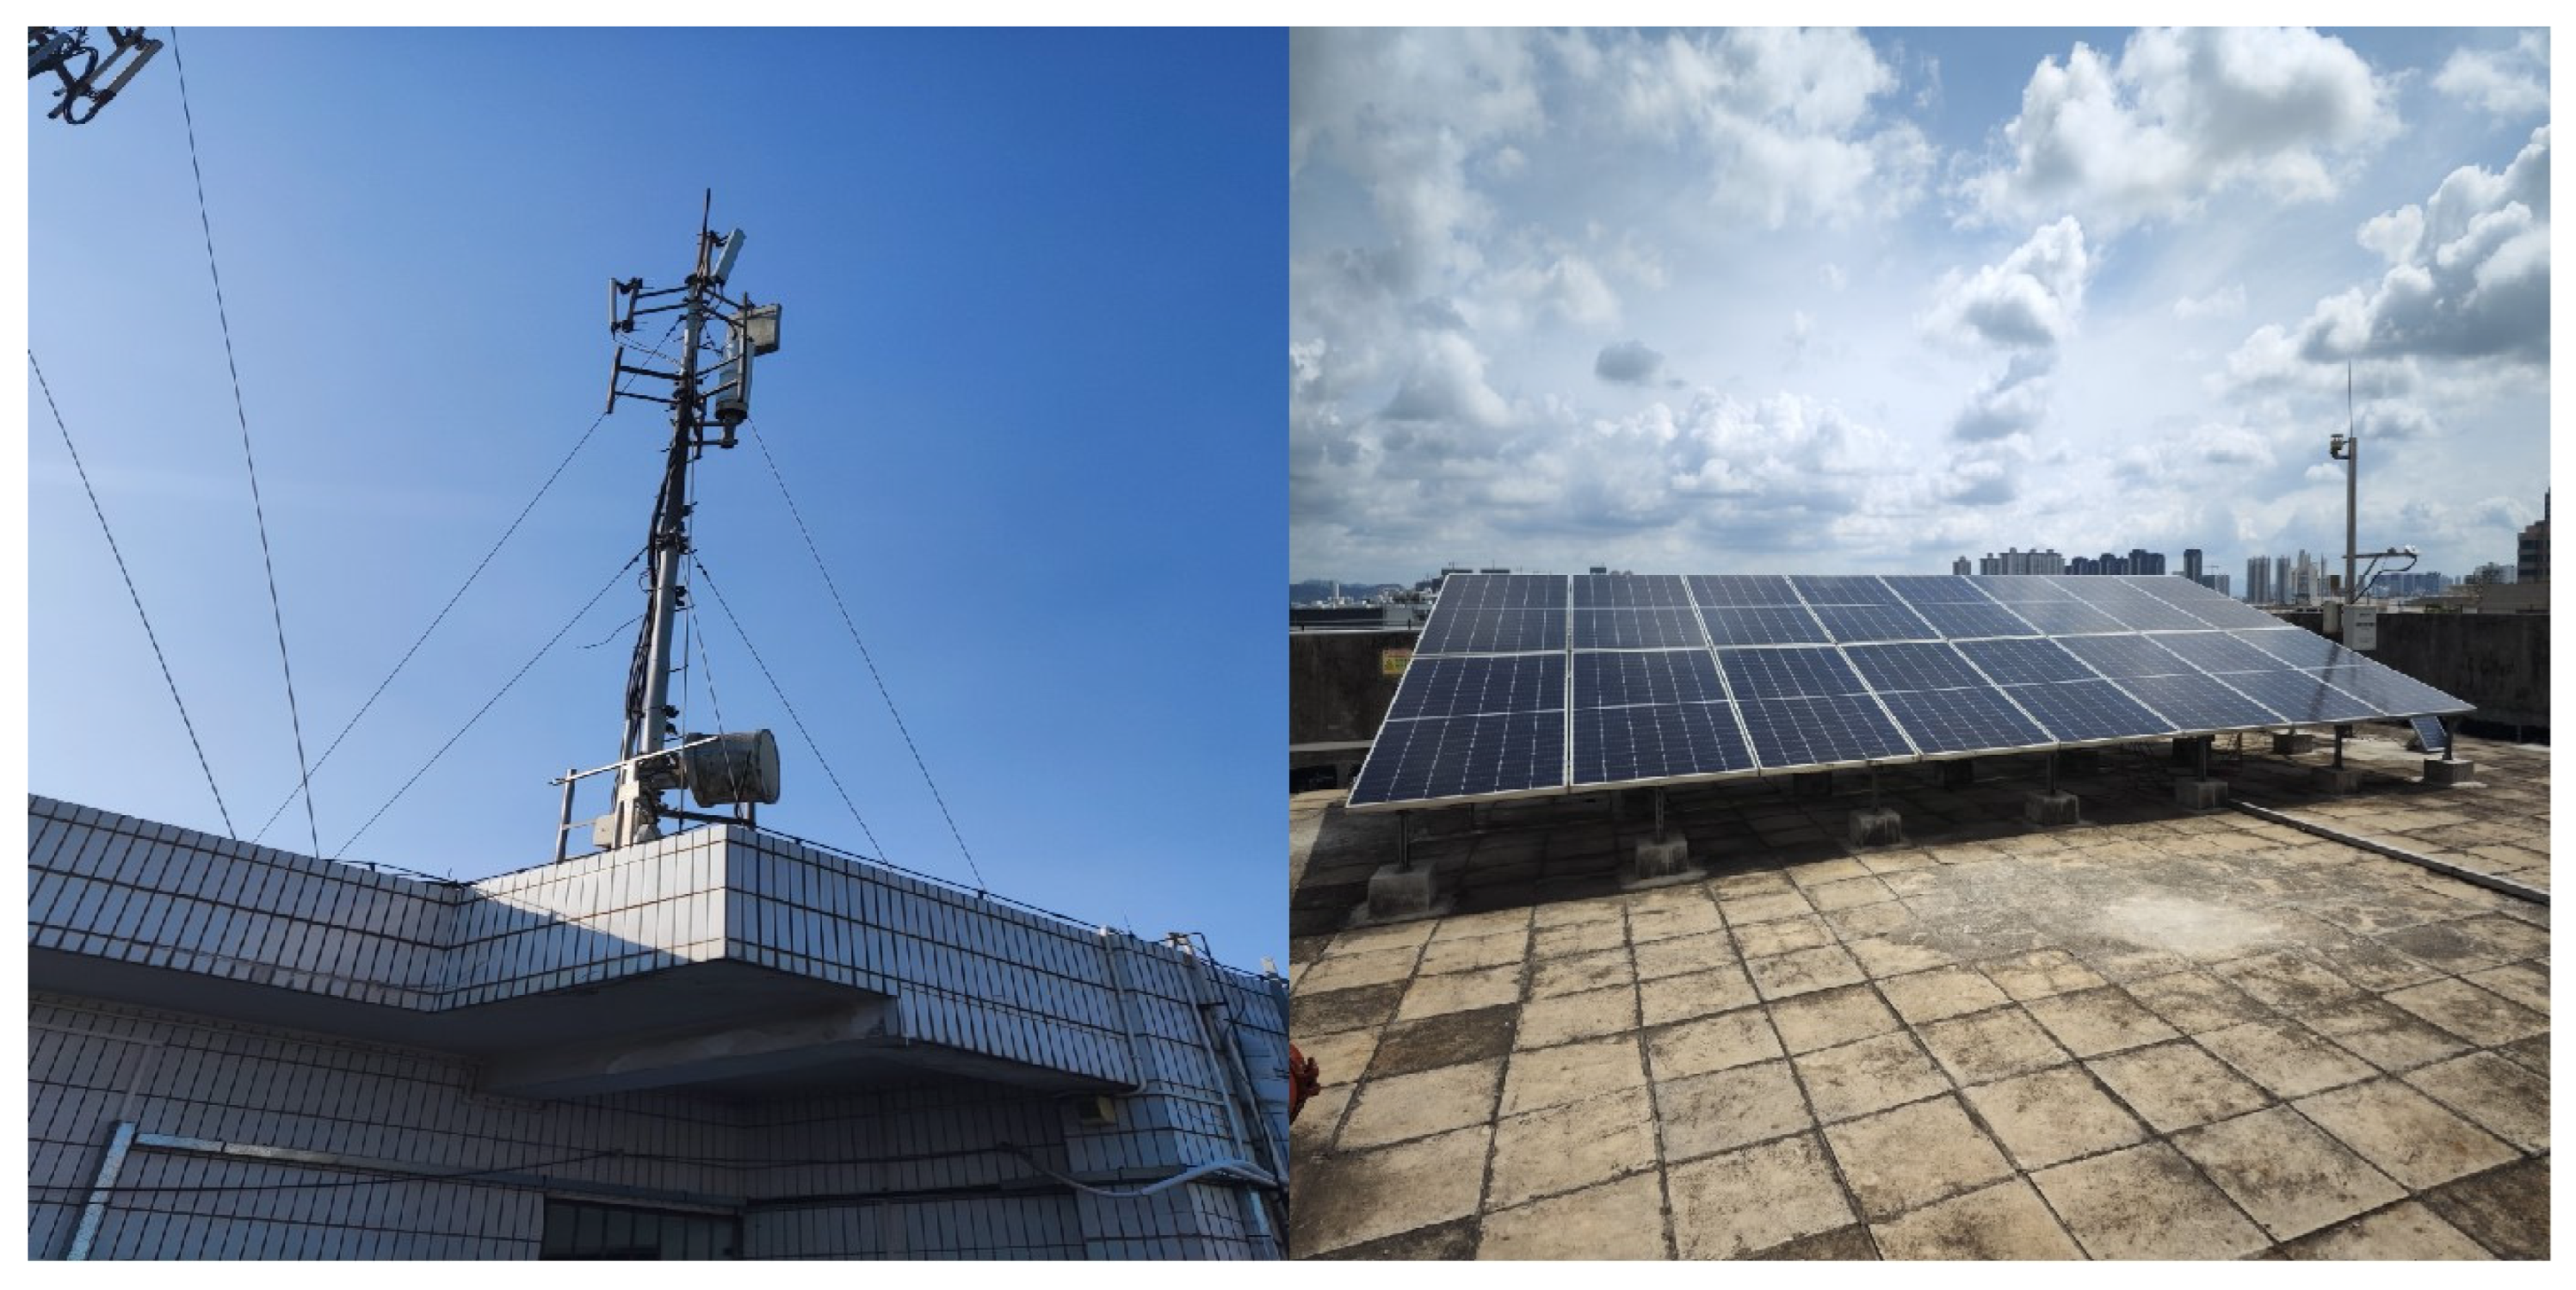
We initially conducted the simulation verification utilizing MATLAB 2023a to assess the performance of the proposed scheme. To capture spatiotemporal dynamics in urban user mobility and renewable energy generation, we analysed a 12-month dataset from 2023 from 5G base stations at Guangxi University, shown in
Figure 7. The dataset includes half-hourly measurements of network traffic, energy consumption, PV generation, and environmental factors. In addition, the base station comprises 30 photovoltaic panels for green energy provision, along with batteries having a capacity of 8 kW·h for energy storage. Prior to model training, feature selection was performed using mutual information scores, retaining the top 15 features (e.g., active users, lagged traffic, hour of day). Highly correlated features (PV generation vs. solar irradiance) were aggregated to avoid multicollinearity.
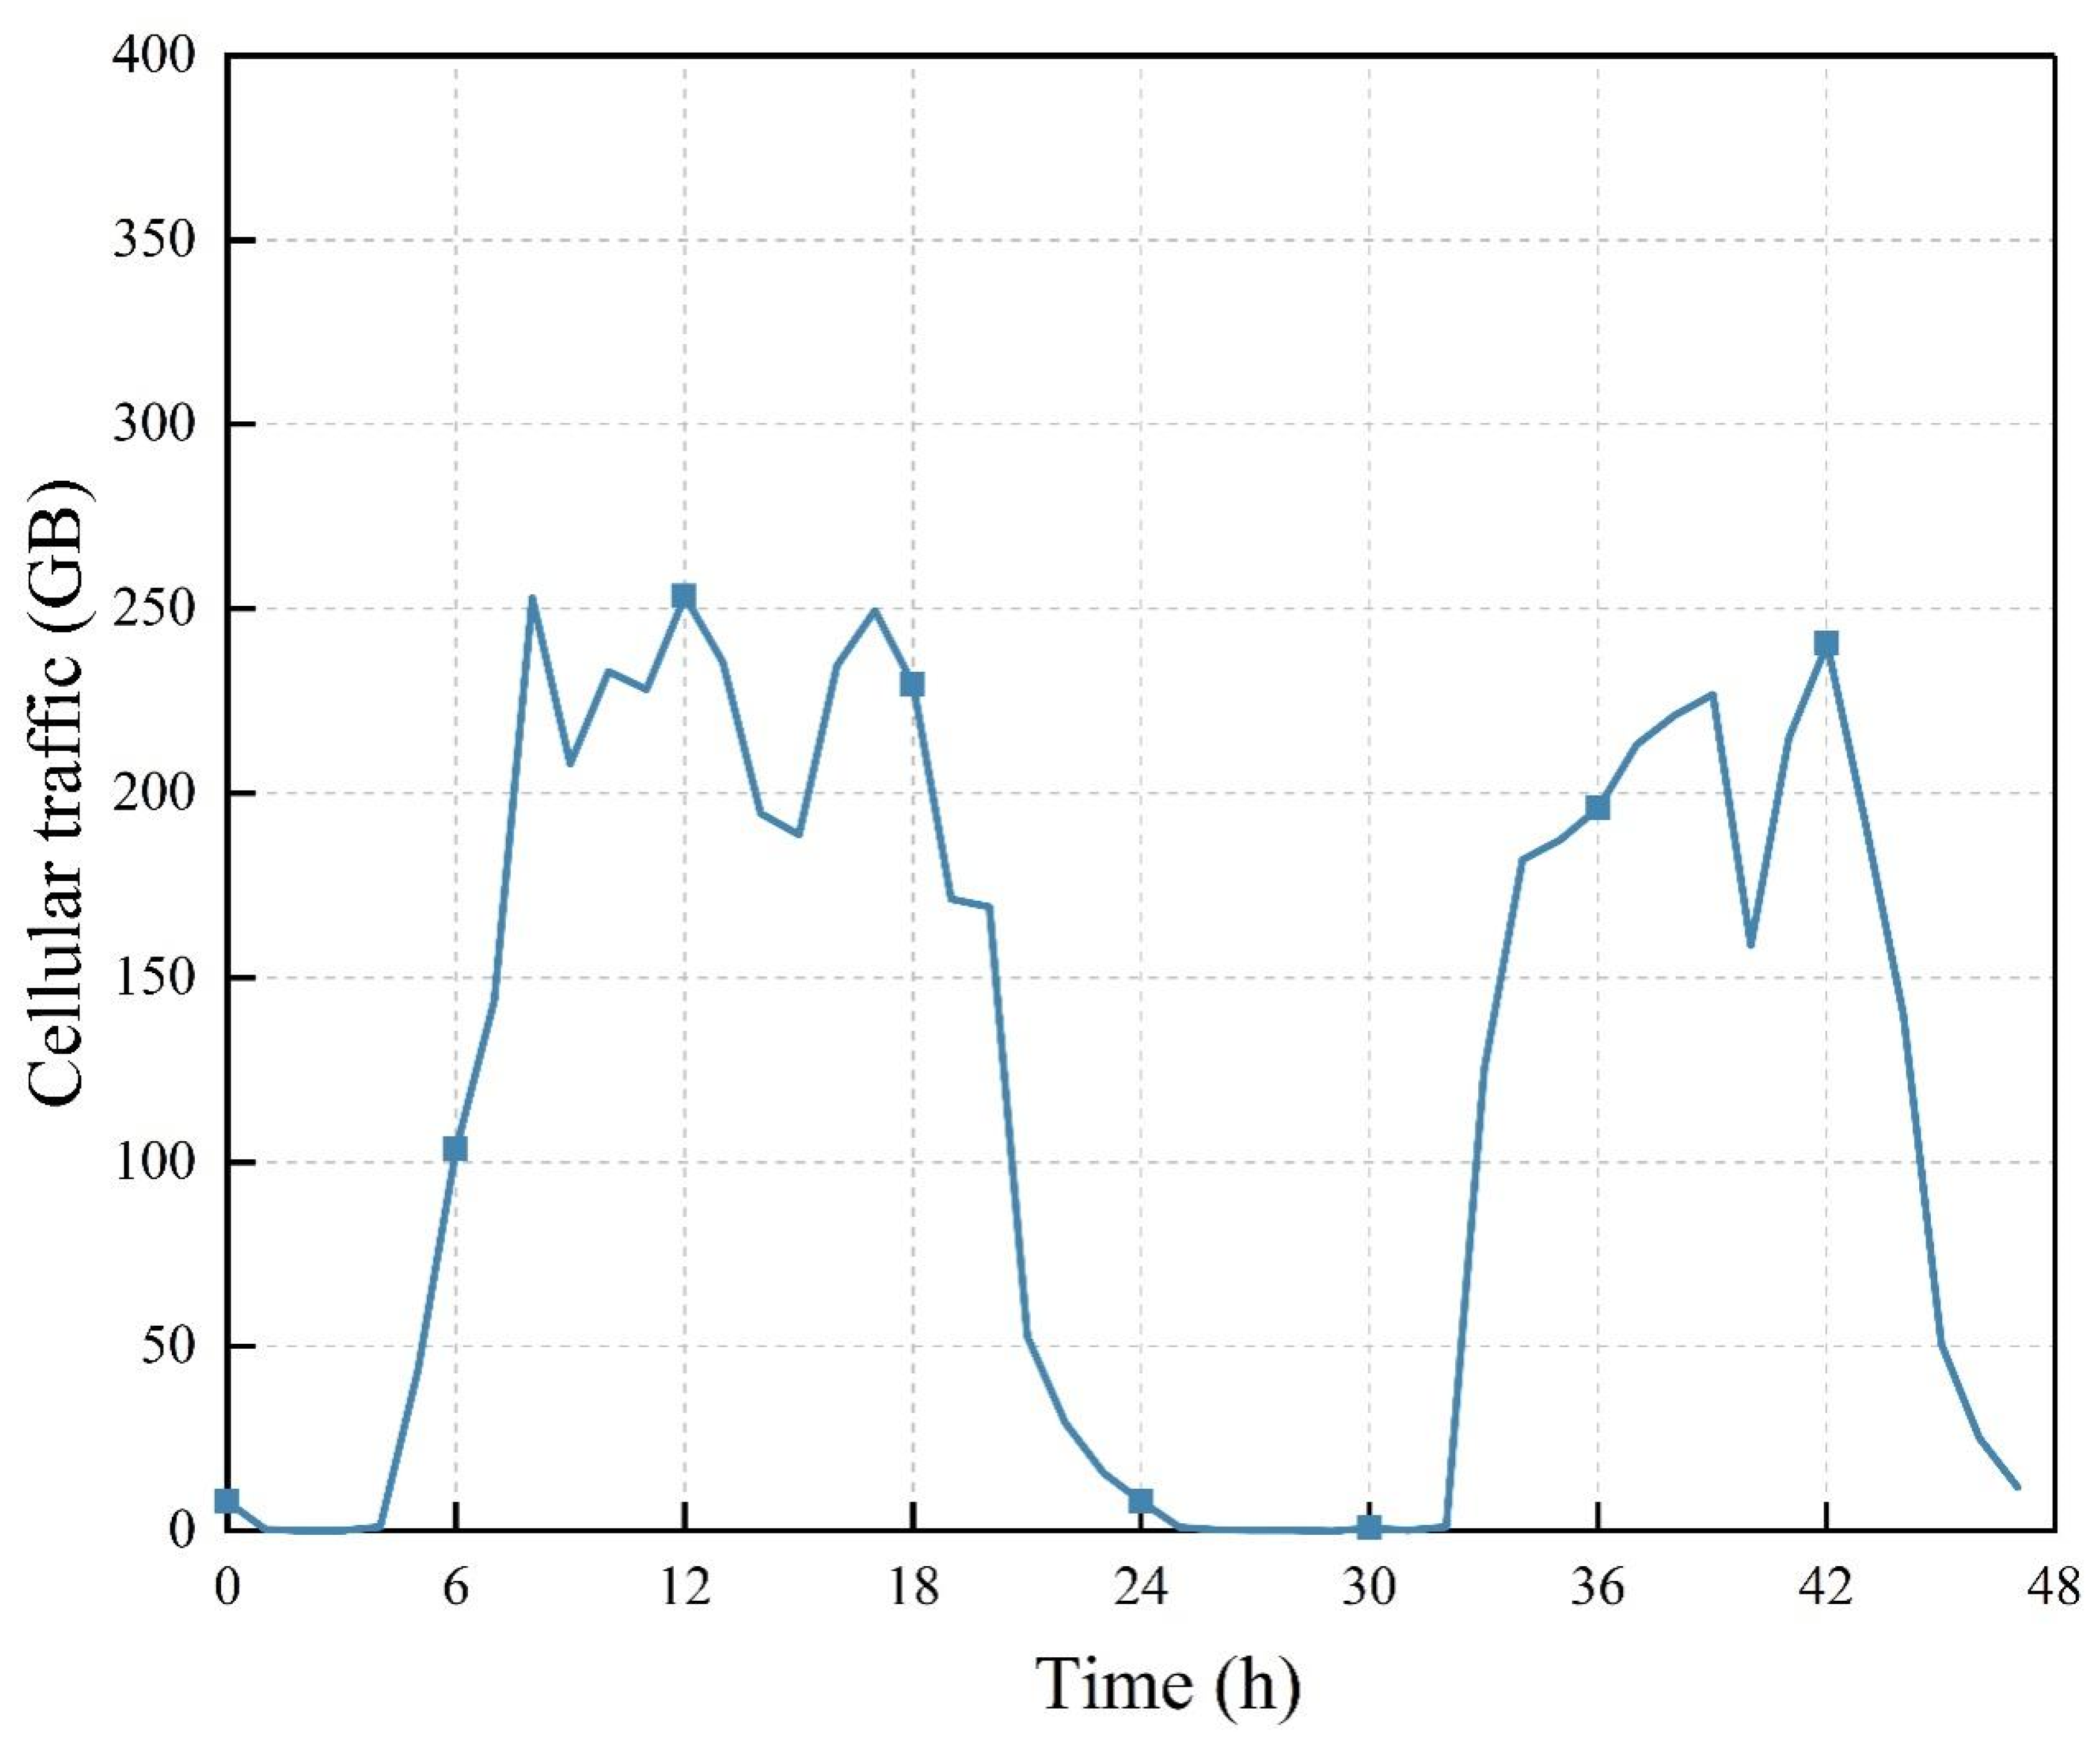
Figure 8 presents the traffic patterns for the base station over the course of two days. The load at the base station remains relatively high during daylight hours, coinciding with higher energy demands, while it experiences a significant decline at night, leading to lower energy consumption and a potential energy surplus within the storage device.
The network parameters used for the heterogeneous battery storage management grid system are summarized in
Table 1, while the cost of energy sharing between BSMGs and the cost for procuring energy from the smart grid are set at
and
, respectively.
Table 2 presents the traffic and meteorological data during the evening peak period (18:00–20:30) on a particular summer day, characterized by high user density and a load rate of 0.95, nearing the network capacity limit. This scenario primarily results from the surge in traffic due to video streaming, social media, and other applications, coupled with increased user density that intensifies resource competition and diminishes the efficiency of base station scheduling. Consequently, some users may switch to nearby base stations; however, the decline in channel quality leads to a reduced service rate (from 350 Mbps at 18:00 to 320 Mbps at 19:30). Additionally, decreased photovoltaic generation compels base stations to purchase power from the grid and necessitates increased energy sharing.
The CNN–DAM–BiLSTM architecture encompasses a substantial number of hyperparameters, and their configuration significantly impacts the experimental outcomes. To efficiently identify the optimal parameter combination, we employ a Bayesian optimization algorithm. The Bayesian optimization algorithm leverages the prior probability distribution of the objective function and known observation points to update the posterior probability distribution, subsequently identifying the next minimum value based on this updated distribution. In Bayesian optimization, the optimal parameters are obtained by sampling from regions where the global optimum is most probable and from unexplored areas, iteratively minimizing the loss function. Initially, a pre-defined range of parameters is specified, and Bayesian optimization searches within these ranges to determine the best parameter combination for the current model. The root mean square error (RMSE) and mean absolute percentage error (MAPE) are also used to quantify the performance of the prediction models (Equations (36) and (37), respectively).
The primary hyperparameters of the prediction model in this study include the number of BiLSTM units, the number of attention heads (MHAM), the number of convolution kernels (CNN), and the learning rate. To more clearly compare the performance metrics of different parameter settings, we conducted experiments with several pre-selected values, and the resulting parameter performance is presented in the
Table 3.
The results indicate that the attention mechanism and the number of BiLSTM units significantly influence the model’s performance and should be prioritized for optimization. The learning rate and convolution kernel size also require adjustment to prevent overfitting or underfitting. Specifically, increasing the number of BiLSTM units from 32 to 64 results in a substantial decrease in RMSE and MAE by 15.1% and 19.2%, respectively. This suggests that augmenting model capacity enhances its ability to capture temporal dependencies. However, further increasing the number of units to 128 leads to overfitting, as evidenced by a validation set RMSE of 21.8. The number of attention heads, when within an optimal range, improves the model’s capacity to focus on multi-dimensional features. Exceeding this range results in performance degradation due to computational redundancy and noise interference. Additionally, appropriately selecting the convolution kernel size and learning rate enriches spatial feature extraction and ensures stable convergence, thereby ultimately enhancing prediction accuracy.
SHAP (SHapley Additive exPlanations) offers a significant advantage in explaining deep learning models by quantifying the directional impact of hyperparameters on prediction error. Grounded in game theory, SHAP equitably allocates contributions among parameters, thereby circumventing the biases inherent in traditional grid search methods. As depicted in
Figure 9, the colour gradient (ranging from blue to red) intuitively illustrates nonlinear interactions. Notably, the number of BiLSTM cells exhibits diminishing returns. Additionally, SHAP values are predominantly concentrated within the range of −0.2 to 0.2 (with a mean value close to 0), indicating that adjusting the number of convolution kernels has minimal impact on RMSE, with fluctuations limited to ±2.1%. Attention heads exceeding eight demonstrate a substantial shape variance of 15%, suggesting that redundant feature interactions impair generalization and lead to overfitting. Lastly, the learning rate exhibits the broadest range of SHAP values (−0.3 to 0.4), underscoring its pivotal role in model convergence. However, high learning rates can induce performance degradation, with optimal stability achieved at a learning rate of 0.005. Consequently, the optimal hyperparameter combination is as follows: the number of BiLSTM cells = 64, the number of attention heads = 8, the number of convolution kernels = 32, and the learning rate = 0.005.
To demonstrate the necessity of each component in the dual attention mechanism, we conducted ablation experiments, as illustrated in
Table 4. The experimental results indicate that the components within the DAM are complementary, and their synergy effectively fuses spatio-temporal features. CBAM selects key spectral features and spatial hotspots through channel-spatial attention. CBAM alone outperforms MHAM alone, suggesting that CBAM attention is more critical for local feature extraction. CAM induces more significant performance degradation than SAM, where the RMSE decreases by 15%, indicating that channel attention plays a dominant role in spectral feature selection. Conversely, MHAM captures long-term traffic dependencies through temporal attention. Removing either component results in a significant decrease in prediction performance (
p < 0.05), thereby verifying the necessity of the DAM architecture design.
To simulate the traffic demand for the BSMGs, we utilized historical traffic data from the previous eight days for model training, with the first seven days allocated for training and the eighth day reserved for testing. We compared the results of the proposed CNN–DAM–BiLSTM model with those obtained from CNN–BiLSTM [
36], CNN–BiGRU [
37], and CNN–SA–BiLSTM [
38]. The selected baselines—CNN–BiLSTM, CNN–BiGRU, and CNN–SA–BiLSTM—represent the state-of-the-art in hybrid deep learning for cellular traffic prediction. CNN–BiLSTM and CNN–BiGRU serve as foundational architectures for spatiotemporal modelling, while CNN–SA–BiLSTM embodies a recent advancement incorporating self-attention mechanisms. By comparing these models with our DAM-enhanced architecture, we illustrate the improvements in feature fusion and long-range dependency capture achieved through the incorporation of dual attention mechanisms.
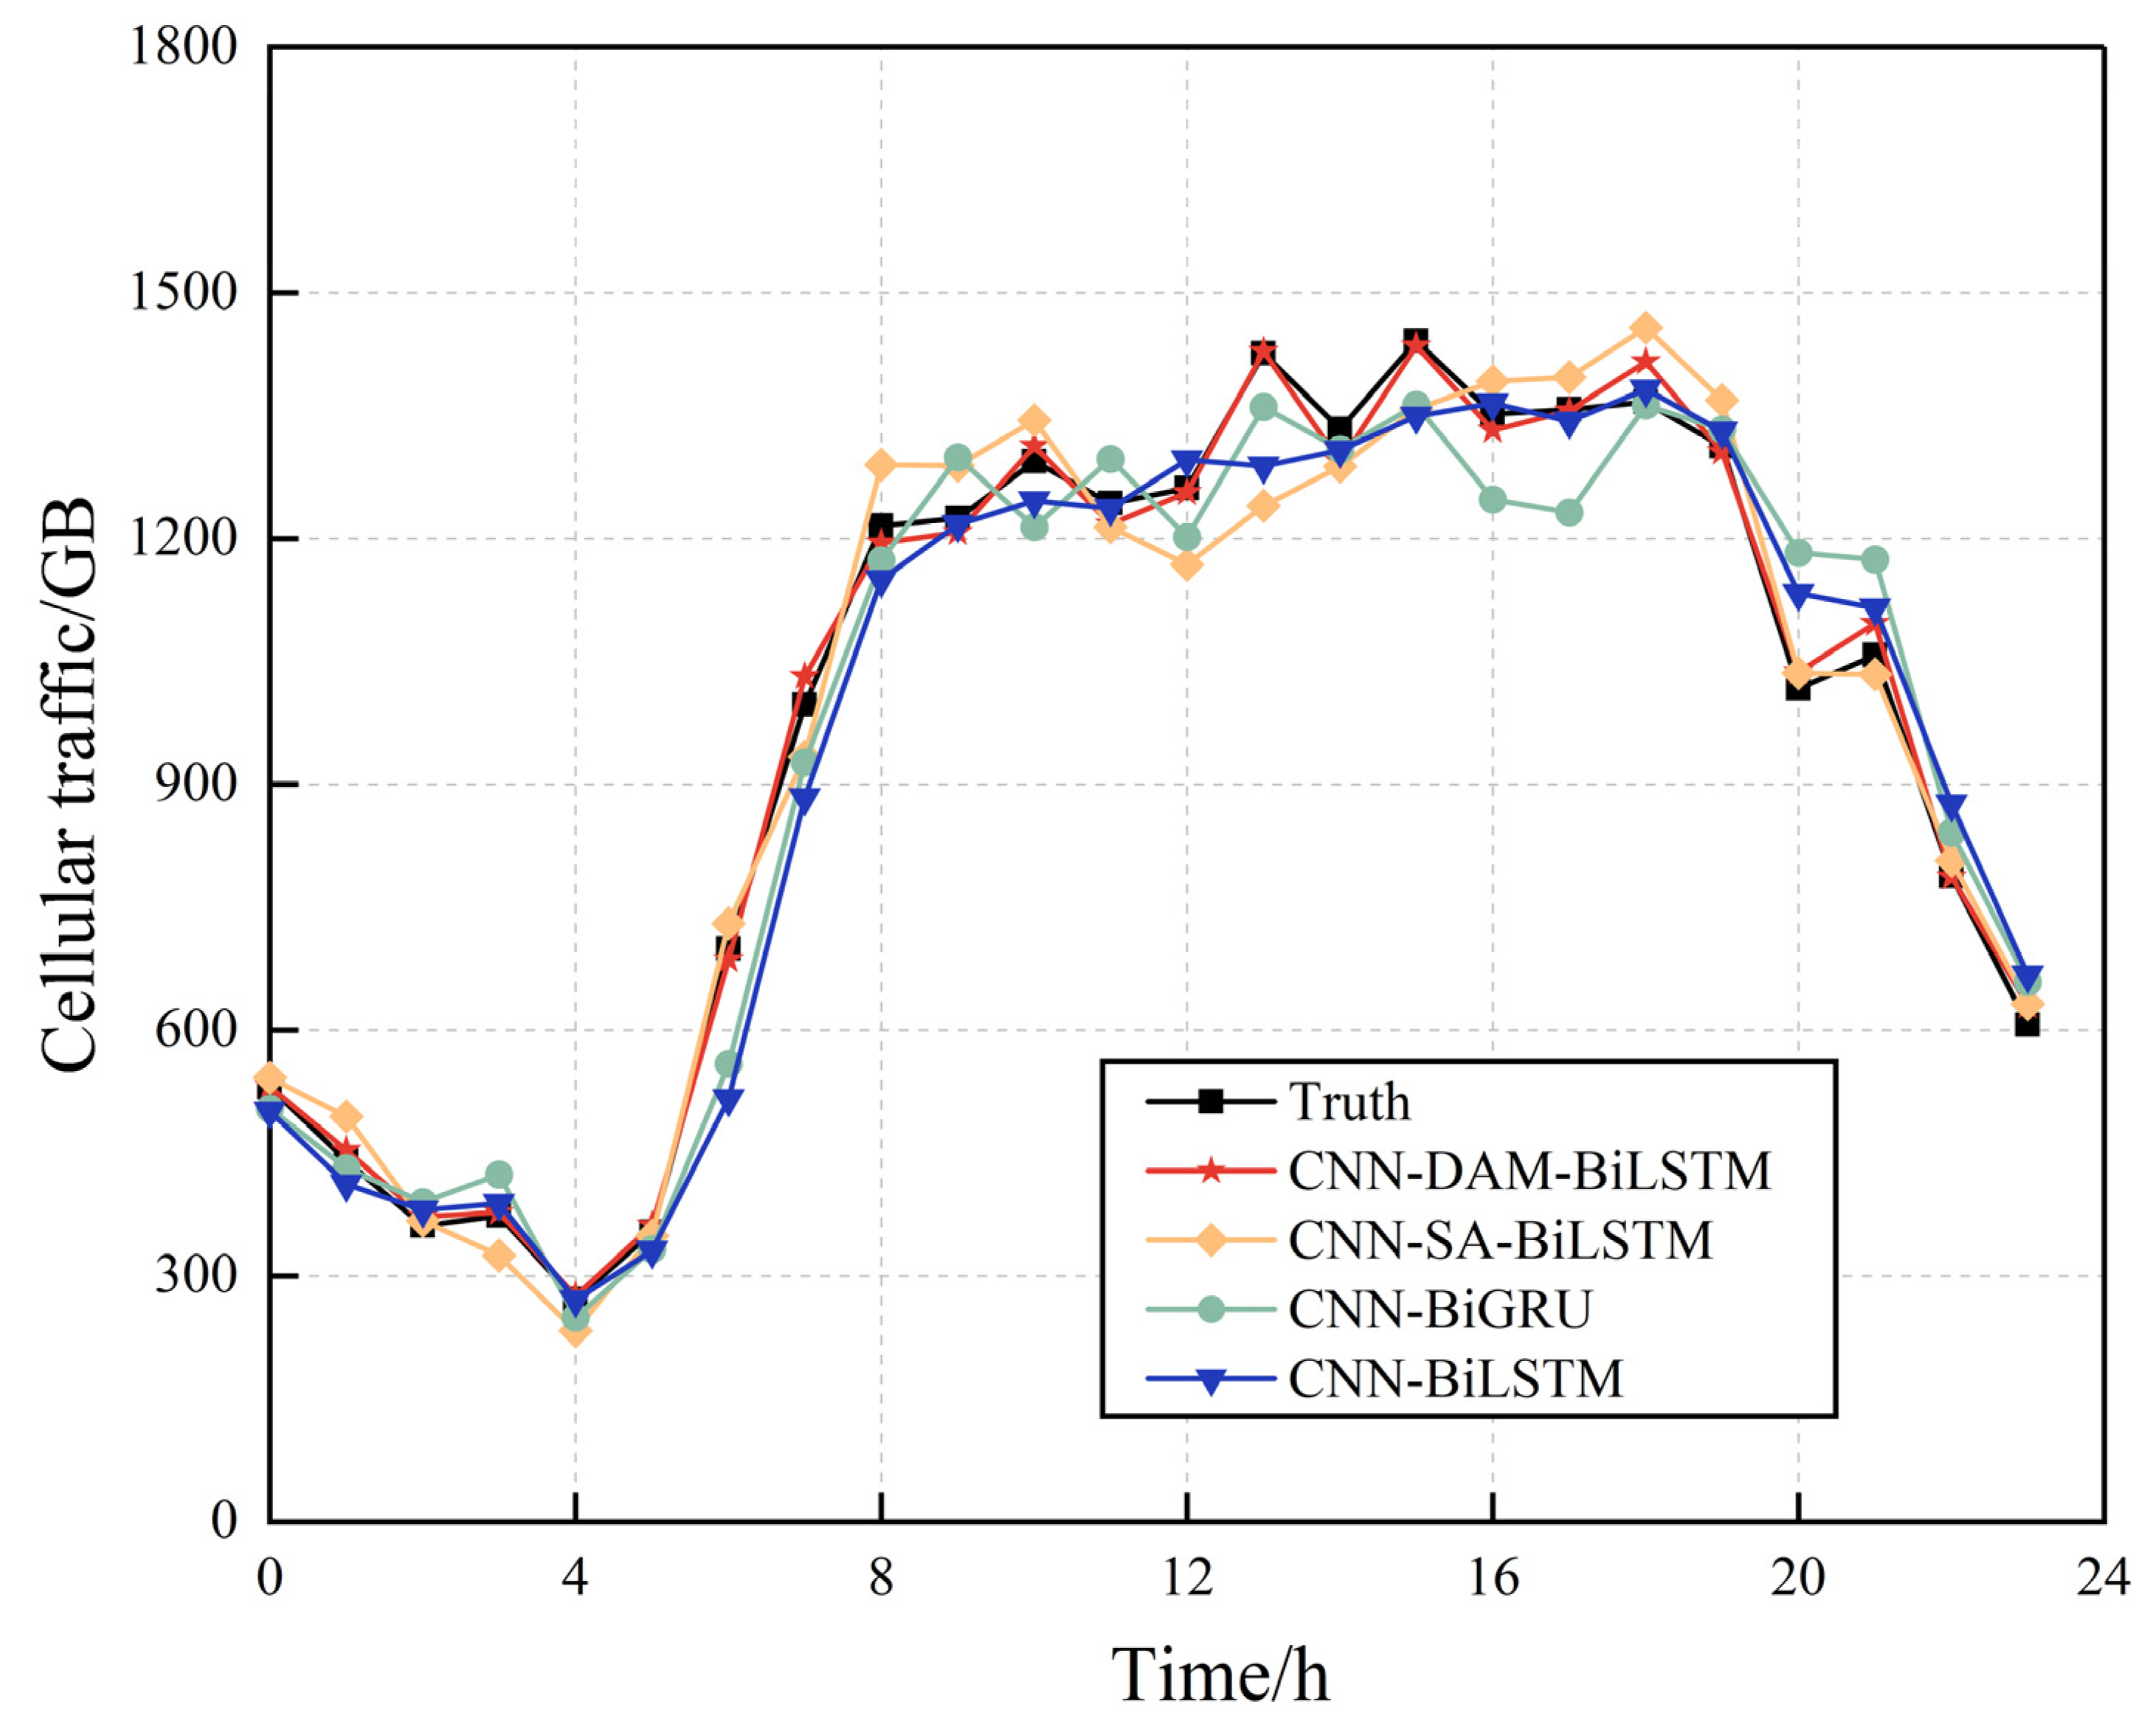
Figure 10 presents the real traffic for a base station over 24 h and the prediction results obtained from the compared prediction models. The predictions from each model are more accurate in the initial stages, with the CNN–BiLSTM, CNN–BiGRU, and CNN–SA–BiLSTM models returning large errors during peak night-time traffic. In contrast, the proposed model exhibits a higher prediction accuracy during this peak and over the entire period in general.
The evaluation results are presented in
Table 5. BiLSTM and BiGRU cannot accurately capture long-distance dependencies, resulting in a high RMSE and MAPE, while CNN–SA–BiLSTM cannot effectively combine the local features extracted by the CNN and the key information from BiLSTM due to its attention mechanism, adversely affecting its prediction performance. In contrast, due to its DAM, the proposed model accurately captures different features of the time series, leading to an RMSE and MAPE that are 72.09% and 74.71% lower, respectively, than the CNN–BiGRU model. Collectively, these results confirm the feasibility of the CNN–DAM–BiLSTM model for traffic prediction.
Based on the user traffic data predicted by the CNN–DAM–BiLSTM model, we then analyse the influence of the improved MOEA/D on the energy-sharing strategy of the BSMGs in comparison to the other multi-objective optimization algorithms MOSSA [
39], NSGA-II [
40], MOPSO [
41], and MOEA/D [
42]. NSGA-II and MOPSO serve as classical benchmarks for diversity and convergence, respectively. MOSSA, with its efficient exploration and exploitation balancing mechanism, is particularly suitable for nonlinear problems such as energy sharing. Meanwhile, the original MOEA/D underscores the impact of our quantum-inspired modifications.
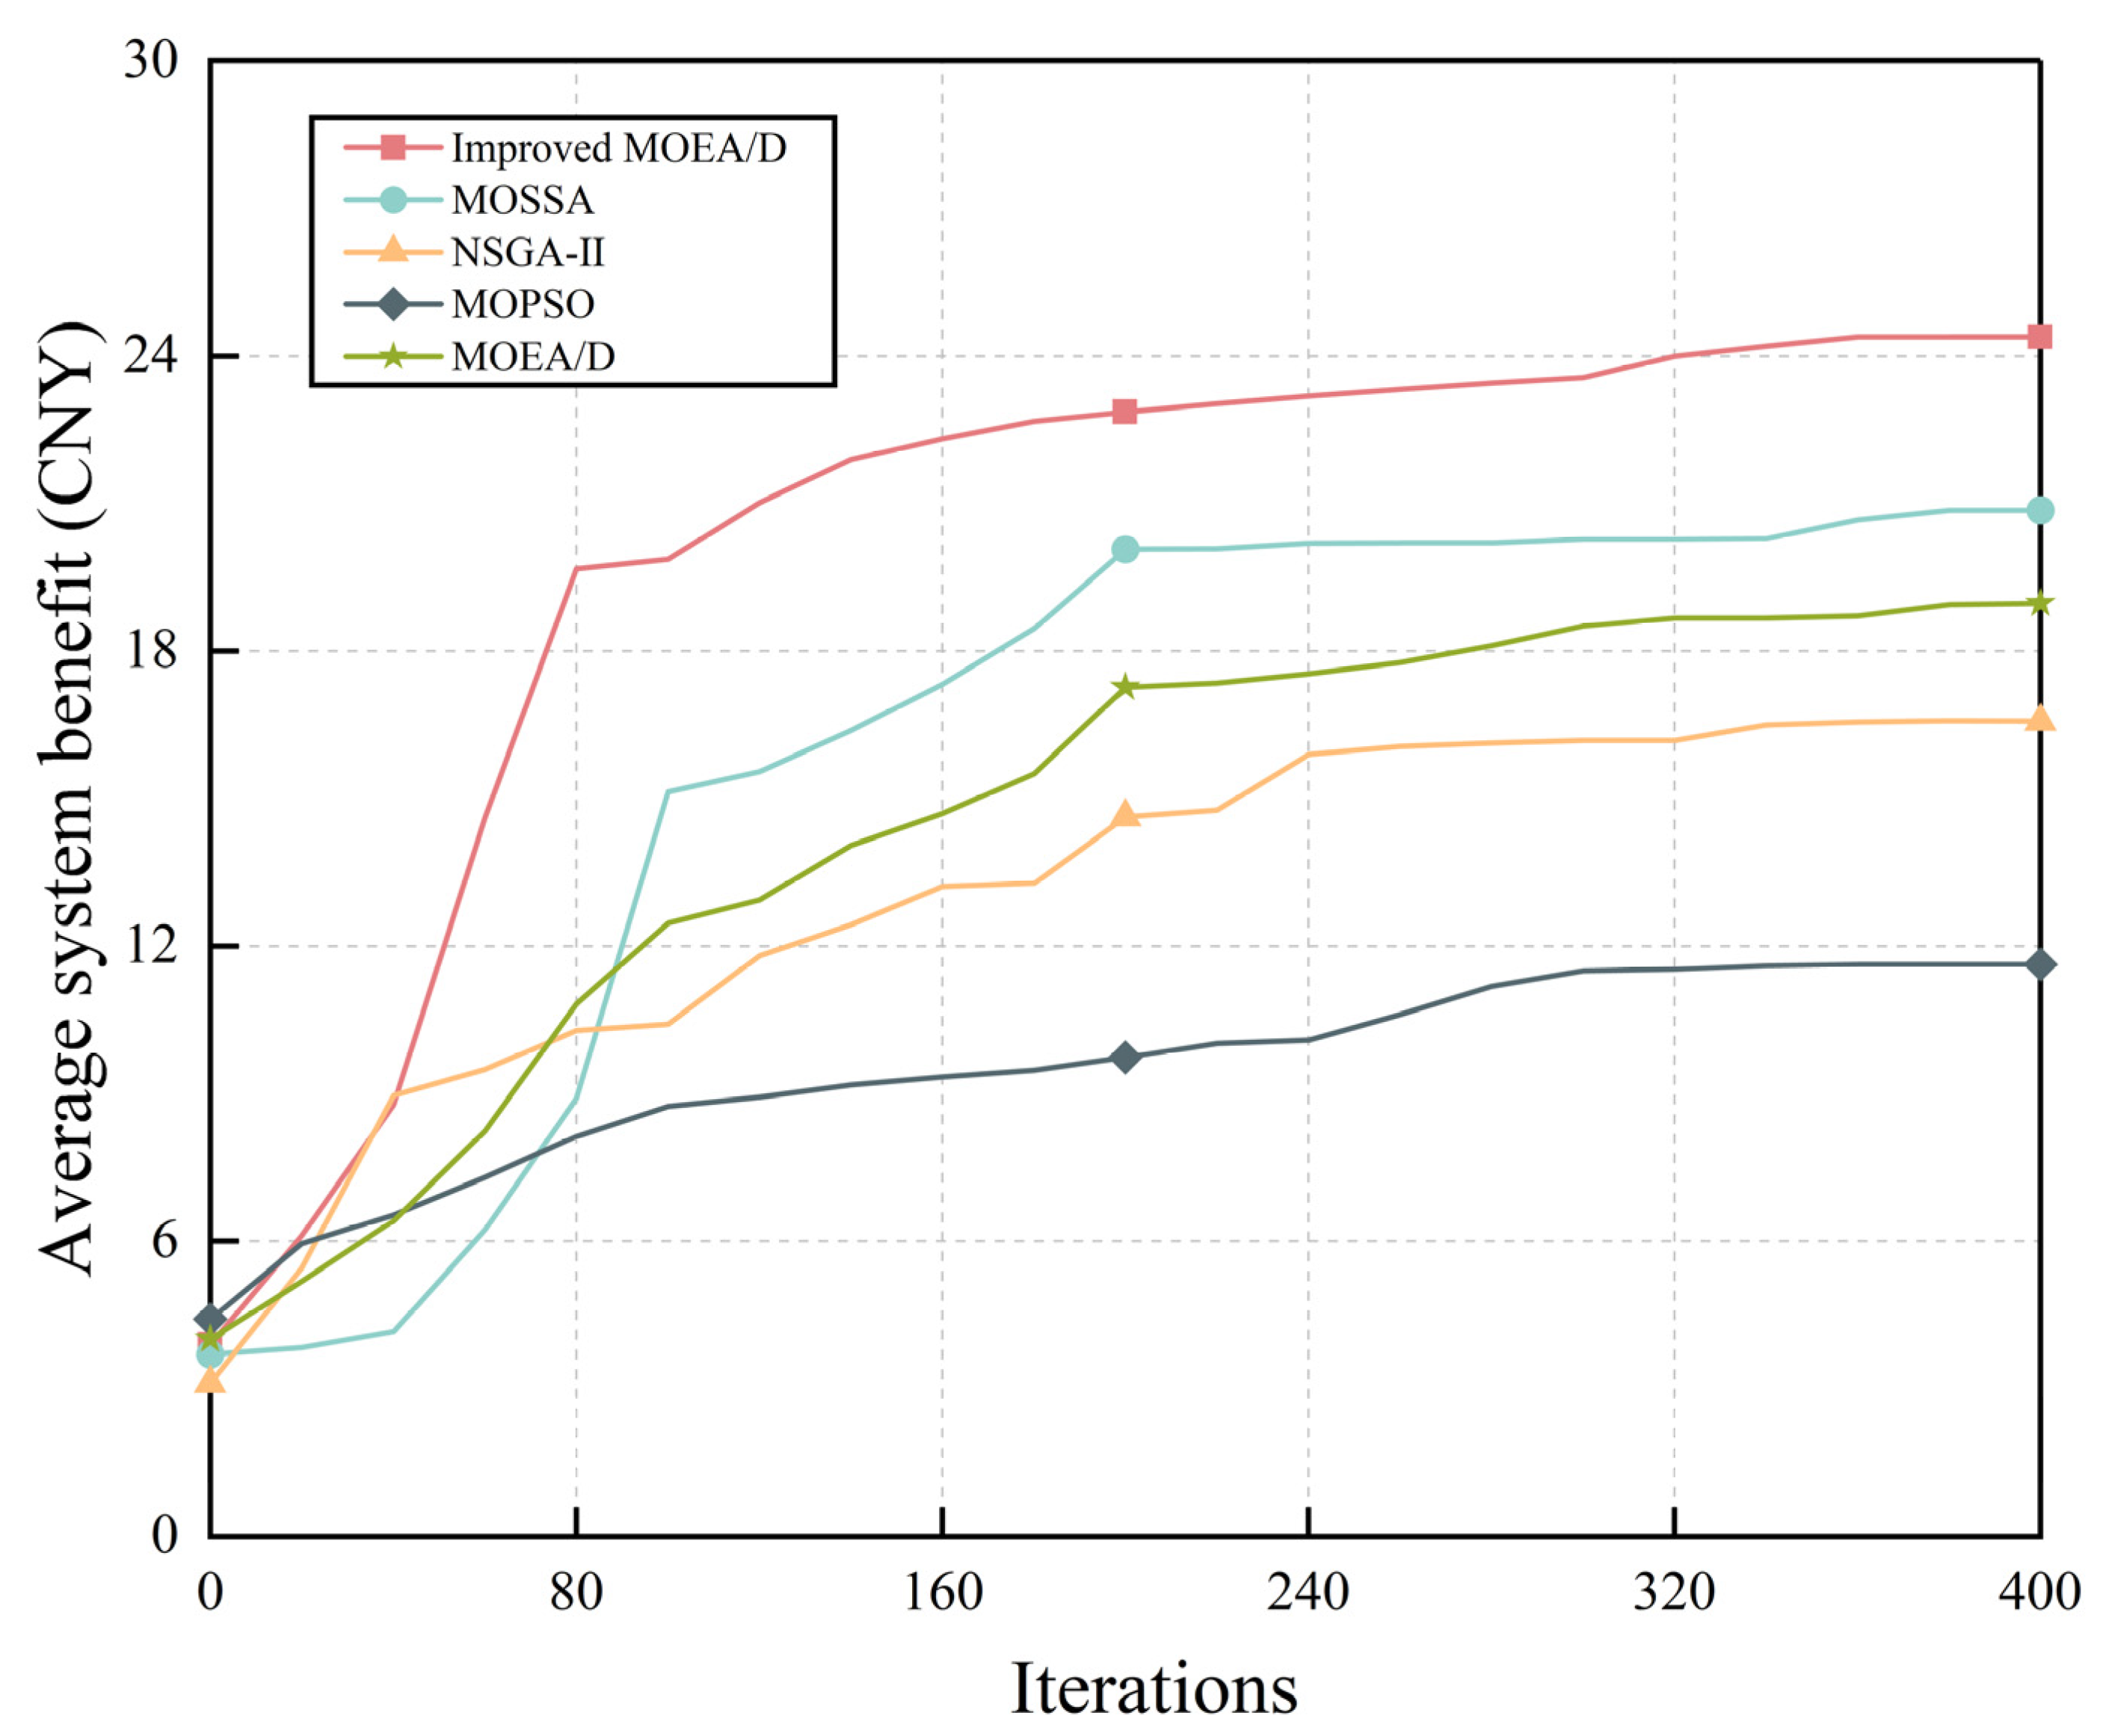
Figure 11 compares the improved MOEA/D and the other four algorithms in terms of the average system revenue when the number of iterations is set at 400, with the results averaged over every 20 iterations. The improved MOEA/D is observed to converge more rapidly to the optimal solution than the other algorithms. This is because the quantum local search strategy used in the improved MOEA/D allows local optima to be avoided, ensuring that the algorithm approaches the Pareto front during the iterations and leading to an optimal solution that is closer to the theoretical optimum than the other algorithms. MOSSA locates the Pareto front more rapidly due to its unique search mechanism and adaptive strategy, but it readily falls into local optima in complex objective space. The other two algorithms converge to a poor Pareto front due to their over-dependence on local information and the uneven distribution of the initial population.
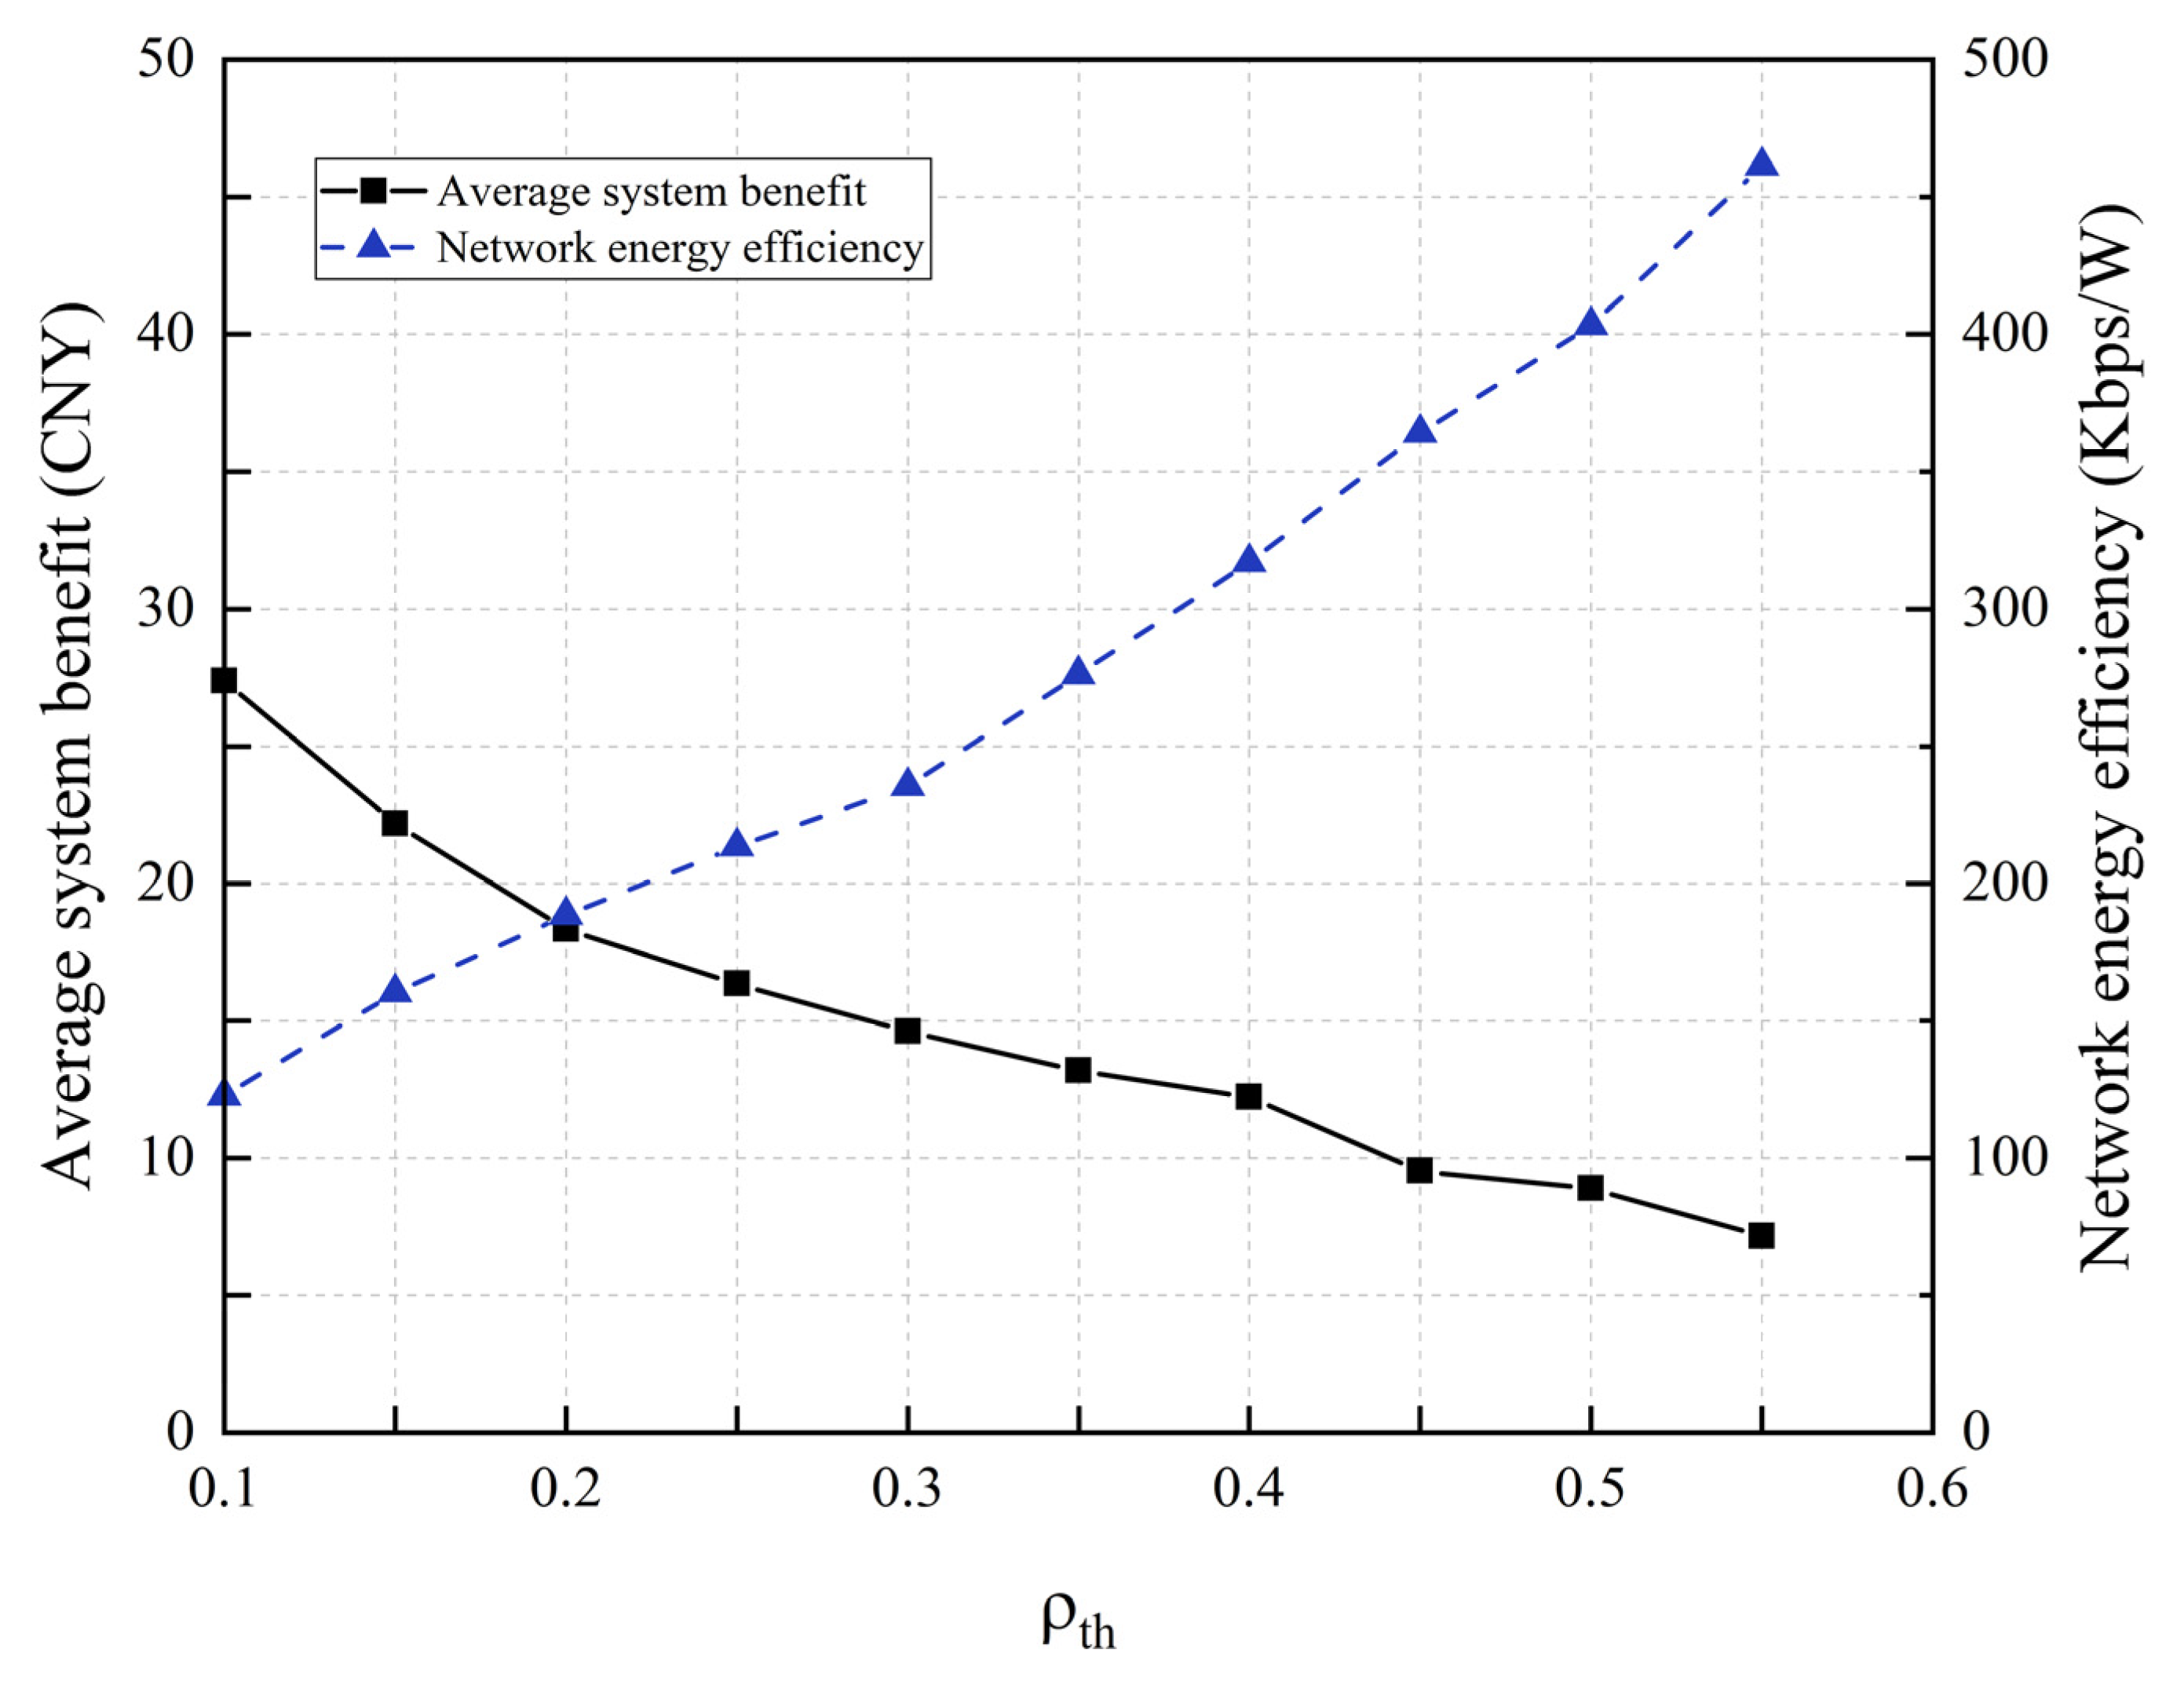
The selection of the sleep threshold
has a significant impact on the average system revenue and network energy efficiency.
Figure 12 presents a comparison of the average system revenue and network energy efficiency of the proposed scheme under different load thresholds. As the threshold rises, the energy efficiency of the network increases because the number of dormant BSMGs is lower, meaning that more users can access the CBSMG and meet their QoS requirements more effectively. Considering the system revenue and network energy efficiency, a moderate load threshold of
can maximize the traffic rate requirements of all users while ensuring that multiple BSMGs enter sleep mode, thus leading to more significant energy-saving advantages.
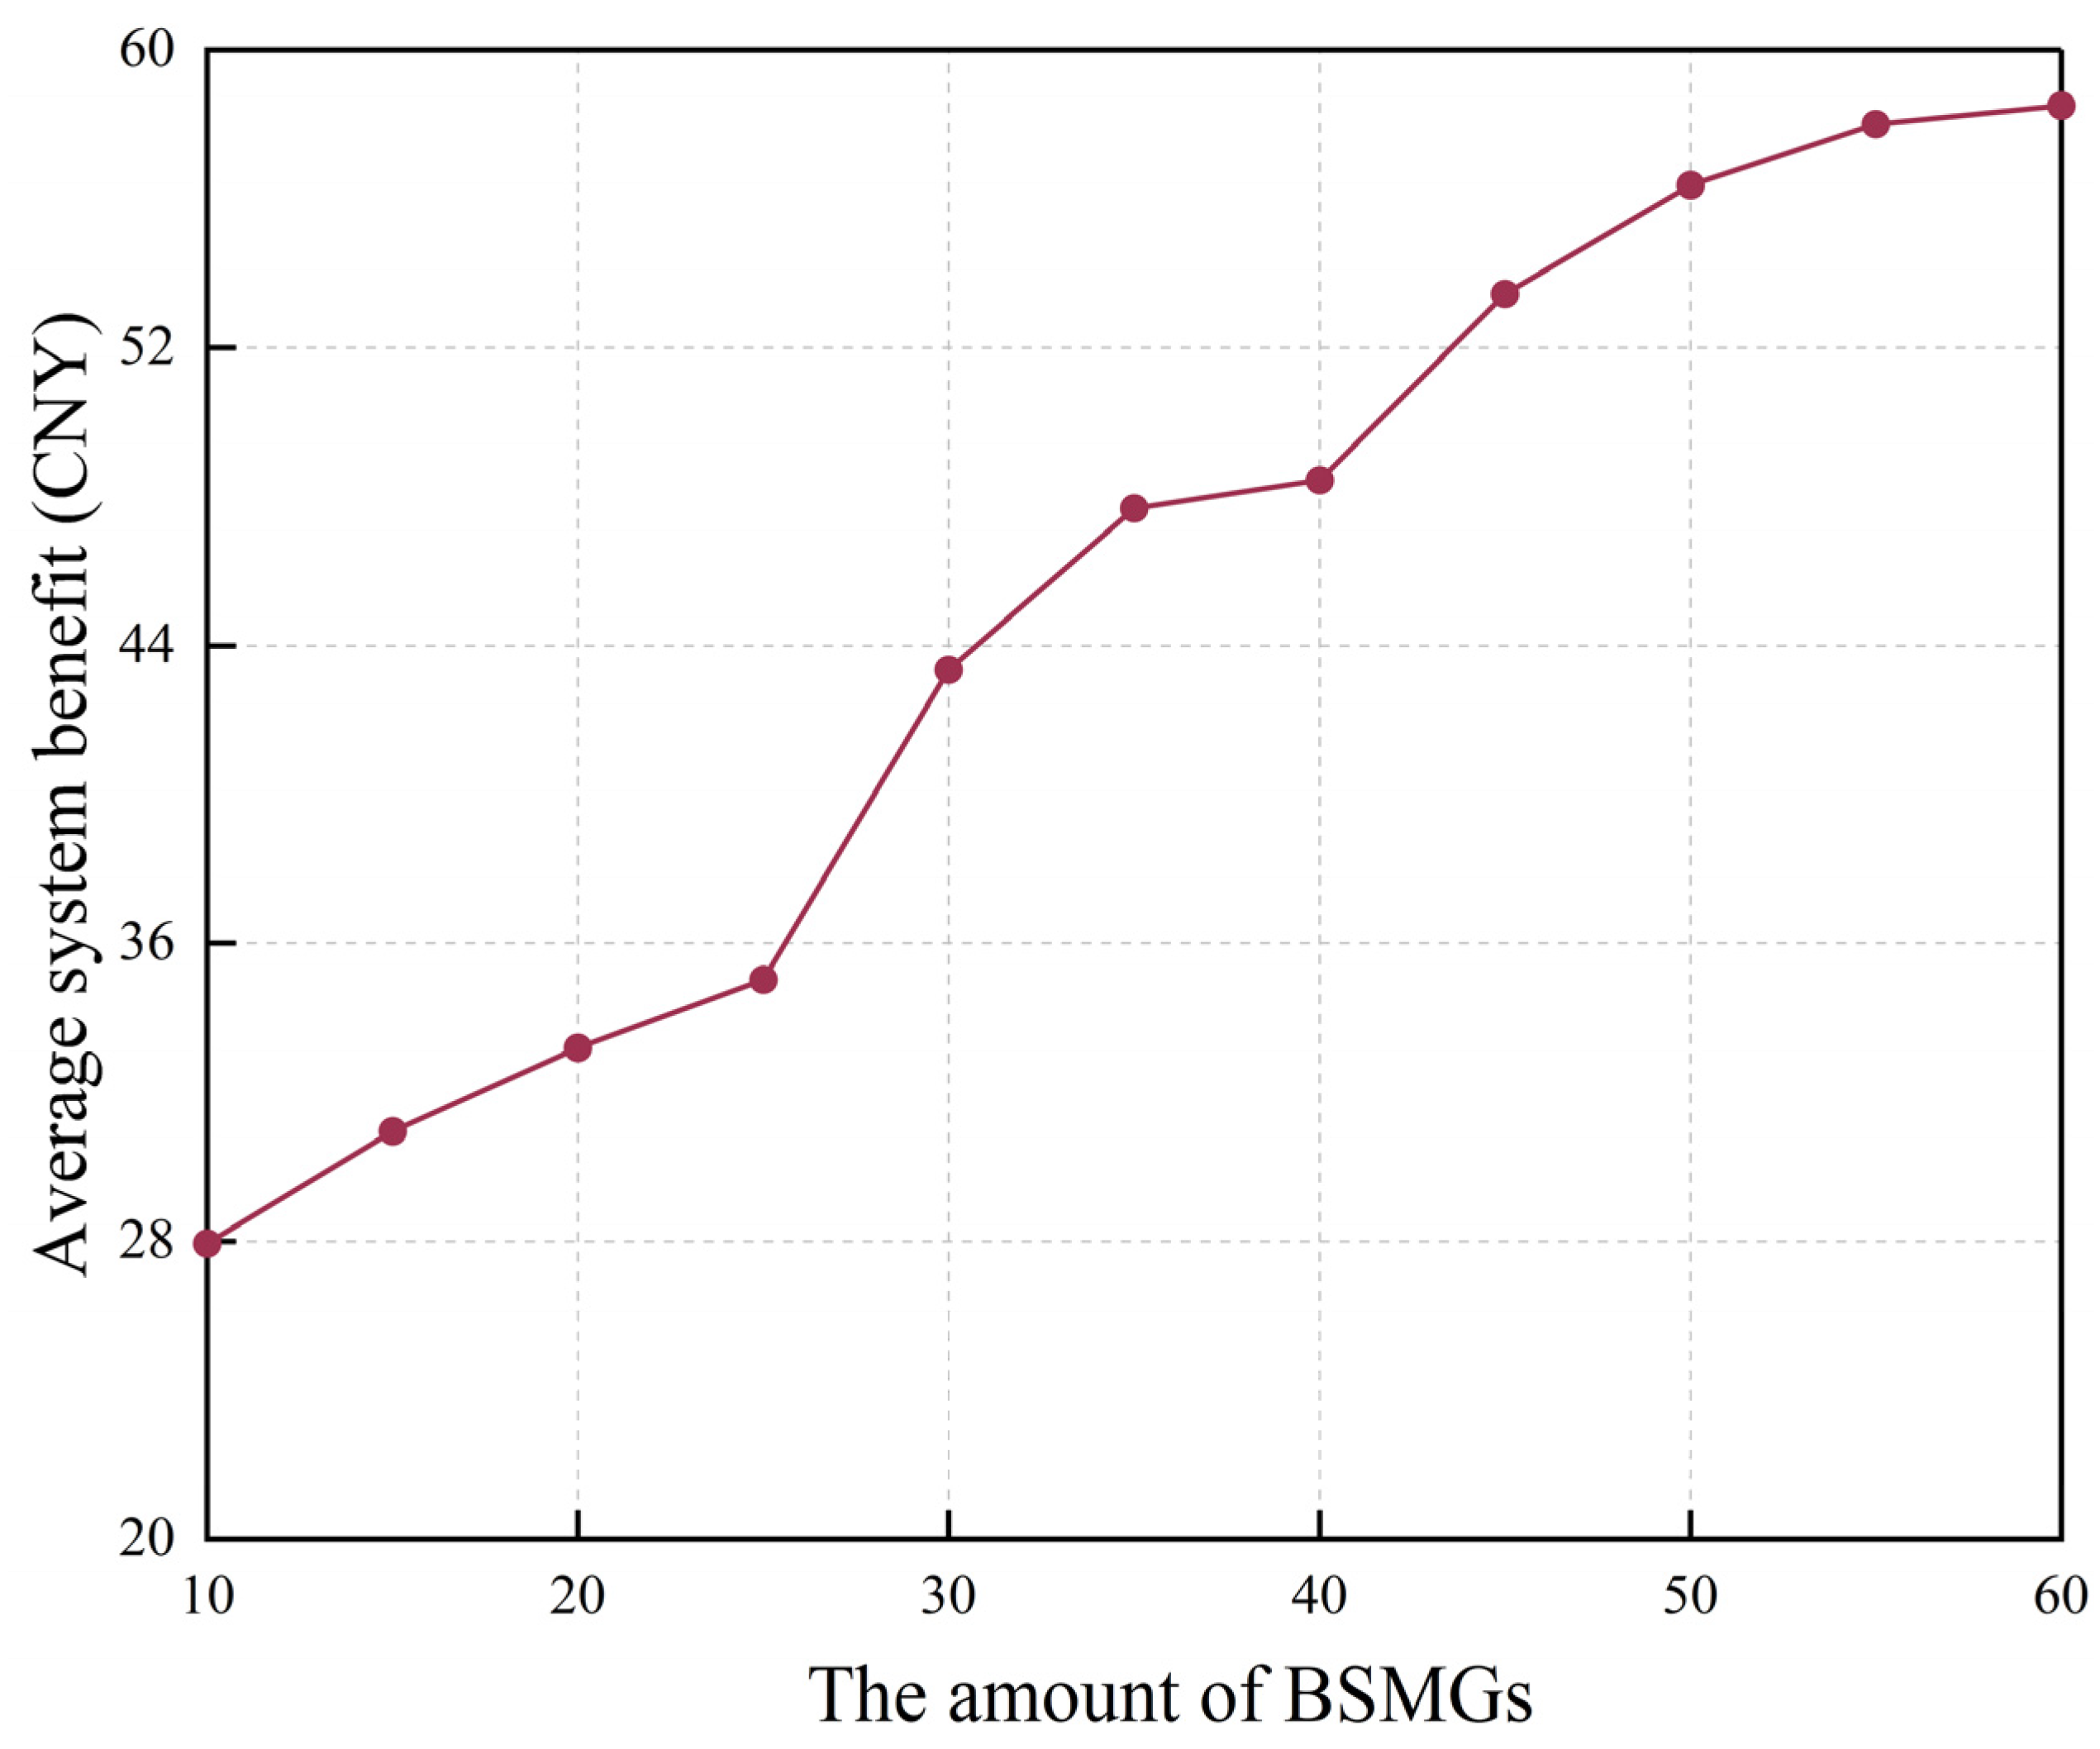
In addition, we assess the impact of the number of BSMGs on the average system revenue (
Figure 13). The average system revenue is positively correlated with the increase in the number of BSMGs, mainly because an increase in the number of BSMGs leads to a higher possibility of no or low loads. Therefore, using sleep mode decisions based on traffic predictions and energy sharing between BSMGs, more BSMGs can be made dormant while still ensuring the service requirements of users, raising the average revenue of the system.
After confirming the stability of the number of BSMGs and the load threshold, the performance of our proposed strategy for cooperative sleep and energy sharing is compared with other energy-saving schemes ([
43,
44,
45,
46]). The comparative literature on this topic is detailed as follows:
Ref. [
43]: The algorithm primarily uses the distance between CBSMGs as a criterion and randomly selects active SBSMGs to enter a sleep state.
Ref. [
44]: This method does not consider the QoS demands of users when determining base station sleep patterns. It also relies on traffic prediction results generated through deep learning methods.
Ref. [
45]: The algorithm employs Q-learning and other reinforcement learning techniques to tackle the challenge of optimizing BSMG sleep states and energy-sharing mechanisms.
Ref. [
46]: The energy-sharing problem in BSMGs is addressed through a dynamic evolutionary game, offering a solution for optimal energy distribution among base stations.
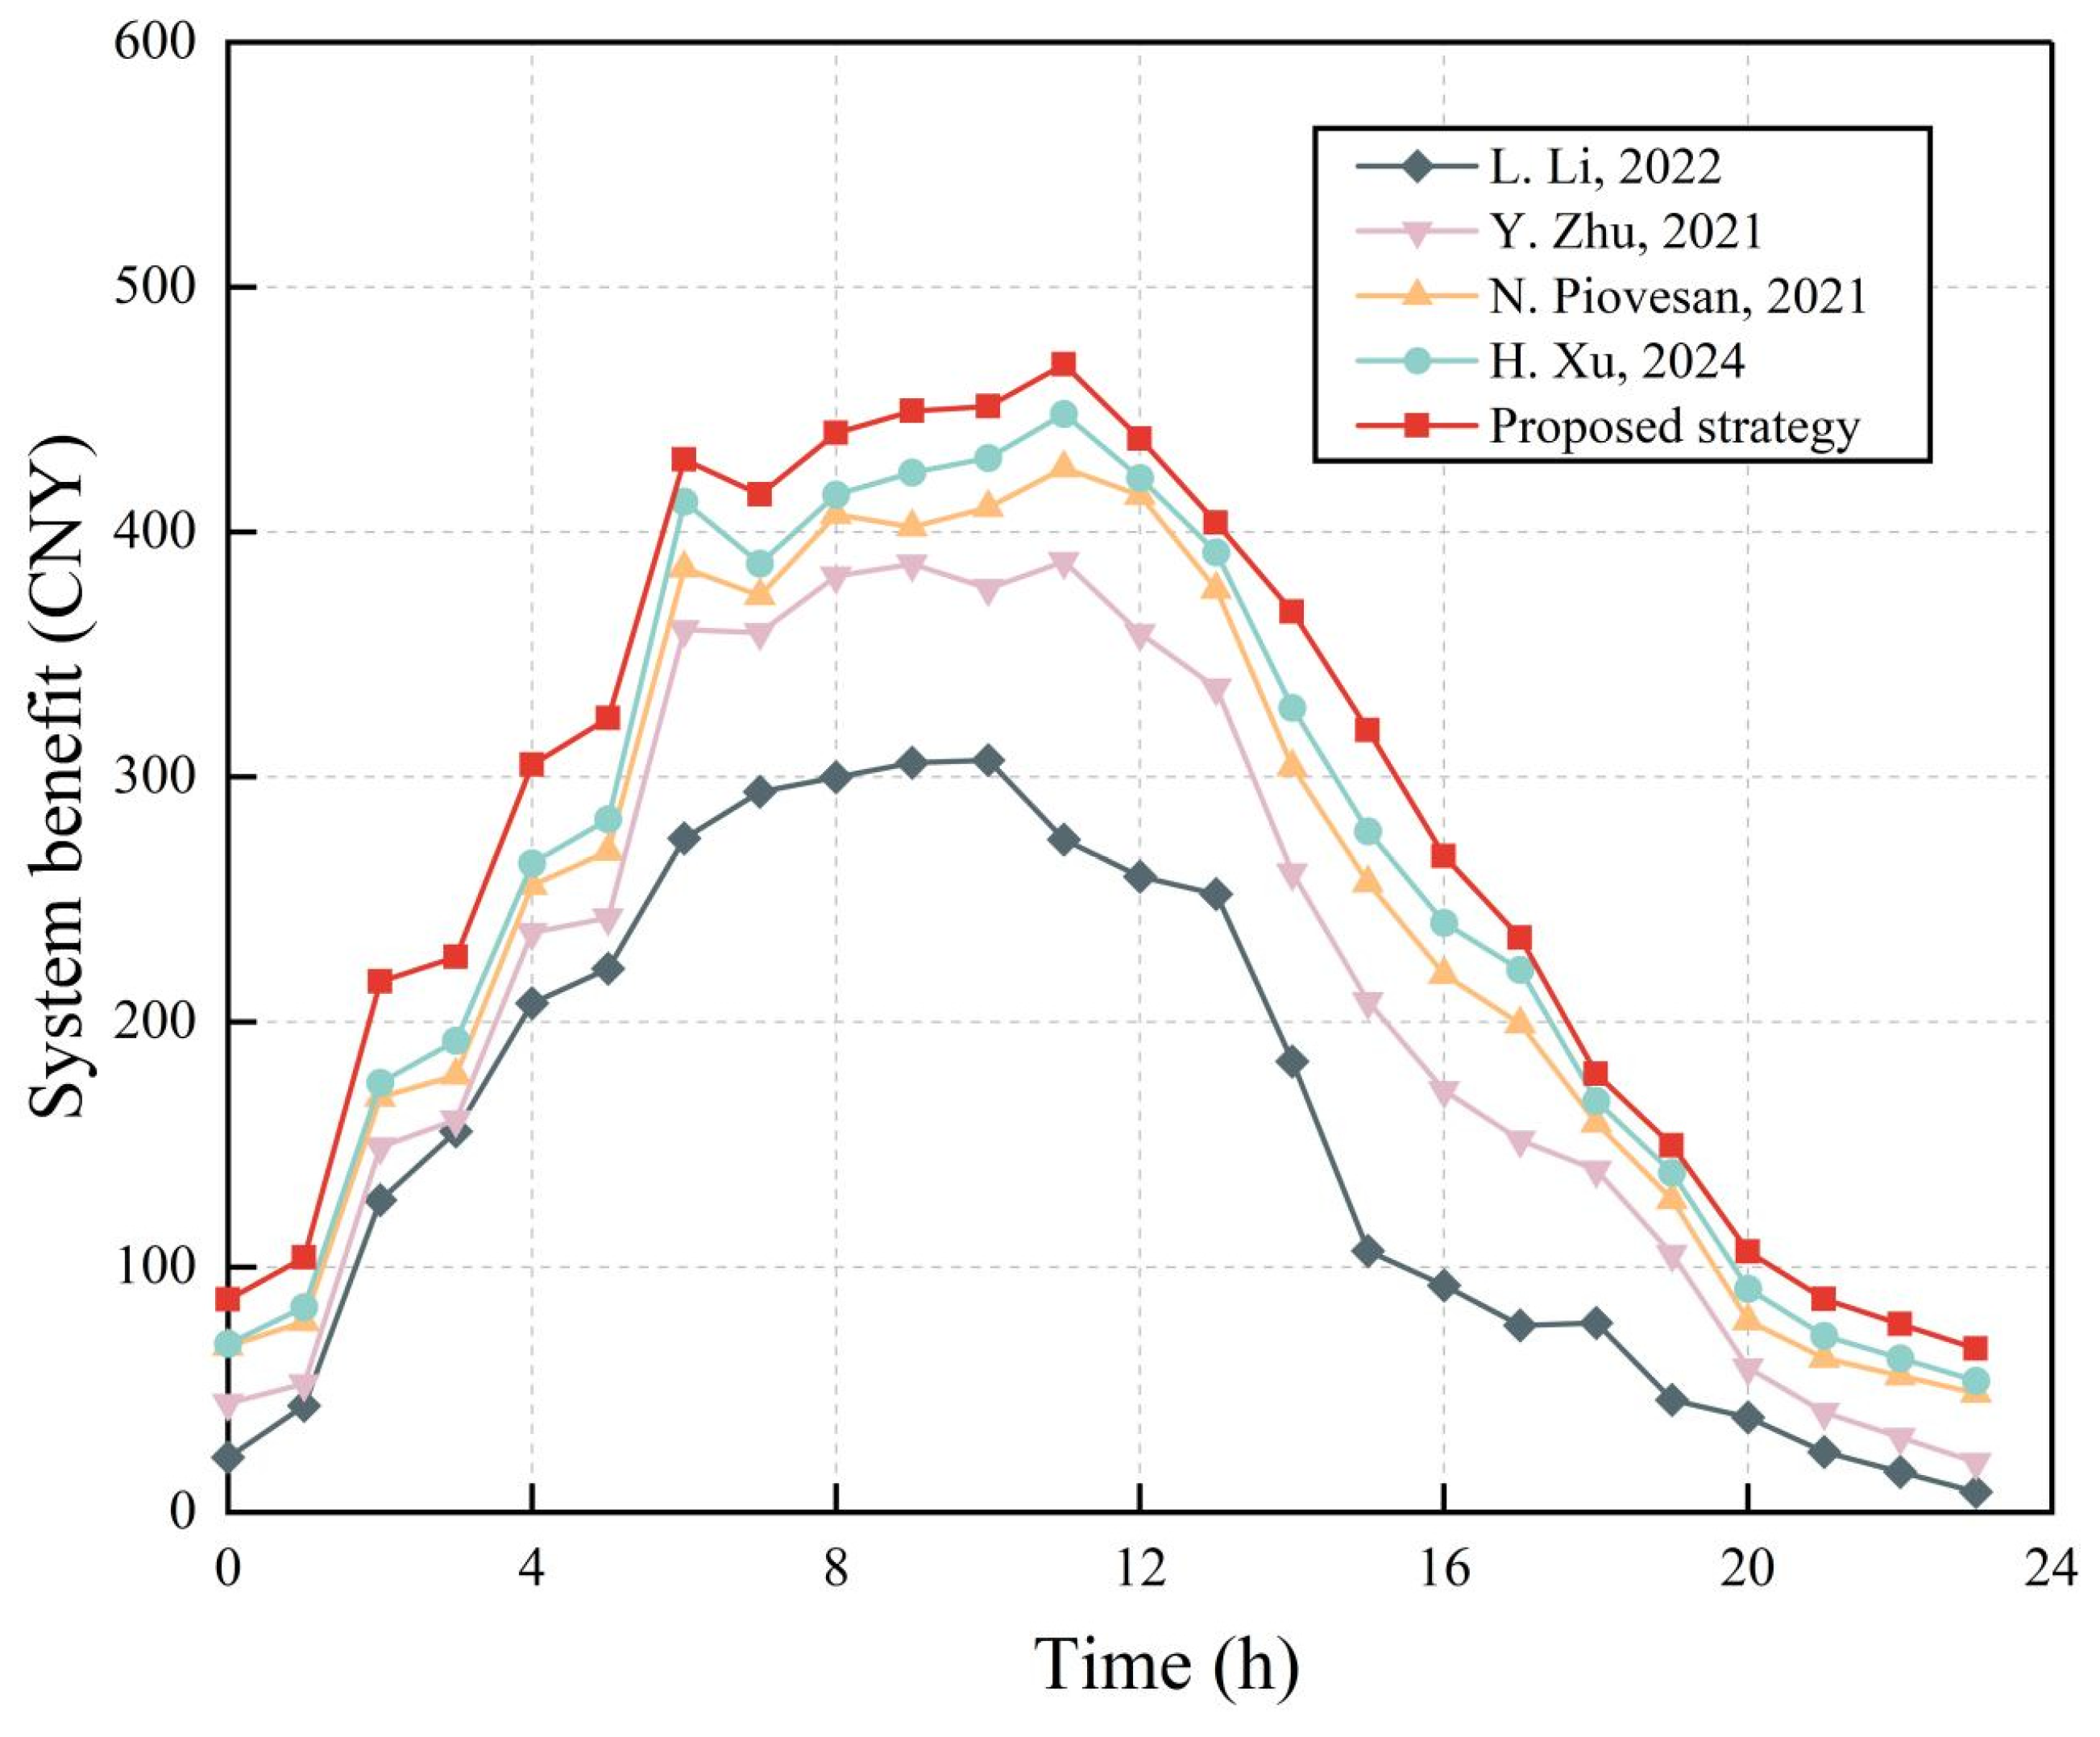
Figure 14 presents the system revenue for a heterogeneous BSMG system under five energy-saving algorithms. Overall, the system power consumption increases with higher network loads because more SBSMGs are woken up, and the load for the CBSMG increases due to the higher number of users. At night, because there are fewer active users and more sleeping BSMGs, the energy storage devices for each BSMG meet their energy demand, so the difference in the system revenue between the control algorithms is low. However, in the daytime, the proposed strategy significantly reduces the energy consumption by 13% on average compared with the other energy-saving algorithms. This is because the CNN–DAM–BiLSTM traffic prediction model more accurately identifies which SBSMGs can be put into sleep mode. The heterogeneous BSMG energy-sharing strategy proposed in this paper also reduces the dependence on grid energy by encouraging energy sharing between individual BSMGs, while other energy-saving algorithms need to purchase more energy from the grid once the green energy is exhausted, which reduces system revenue. In particular, the control algorithm from [
43] prioritizes SBSMGs that sleep close to the CBSMG, which means that the CBSMG load is always close to saturation, reducing the number of sleeping BSMGs and thus reducing system revenue.
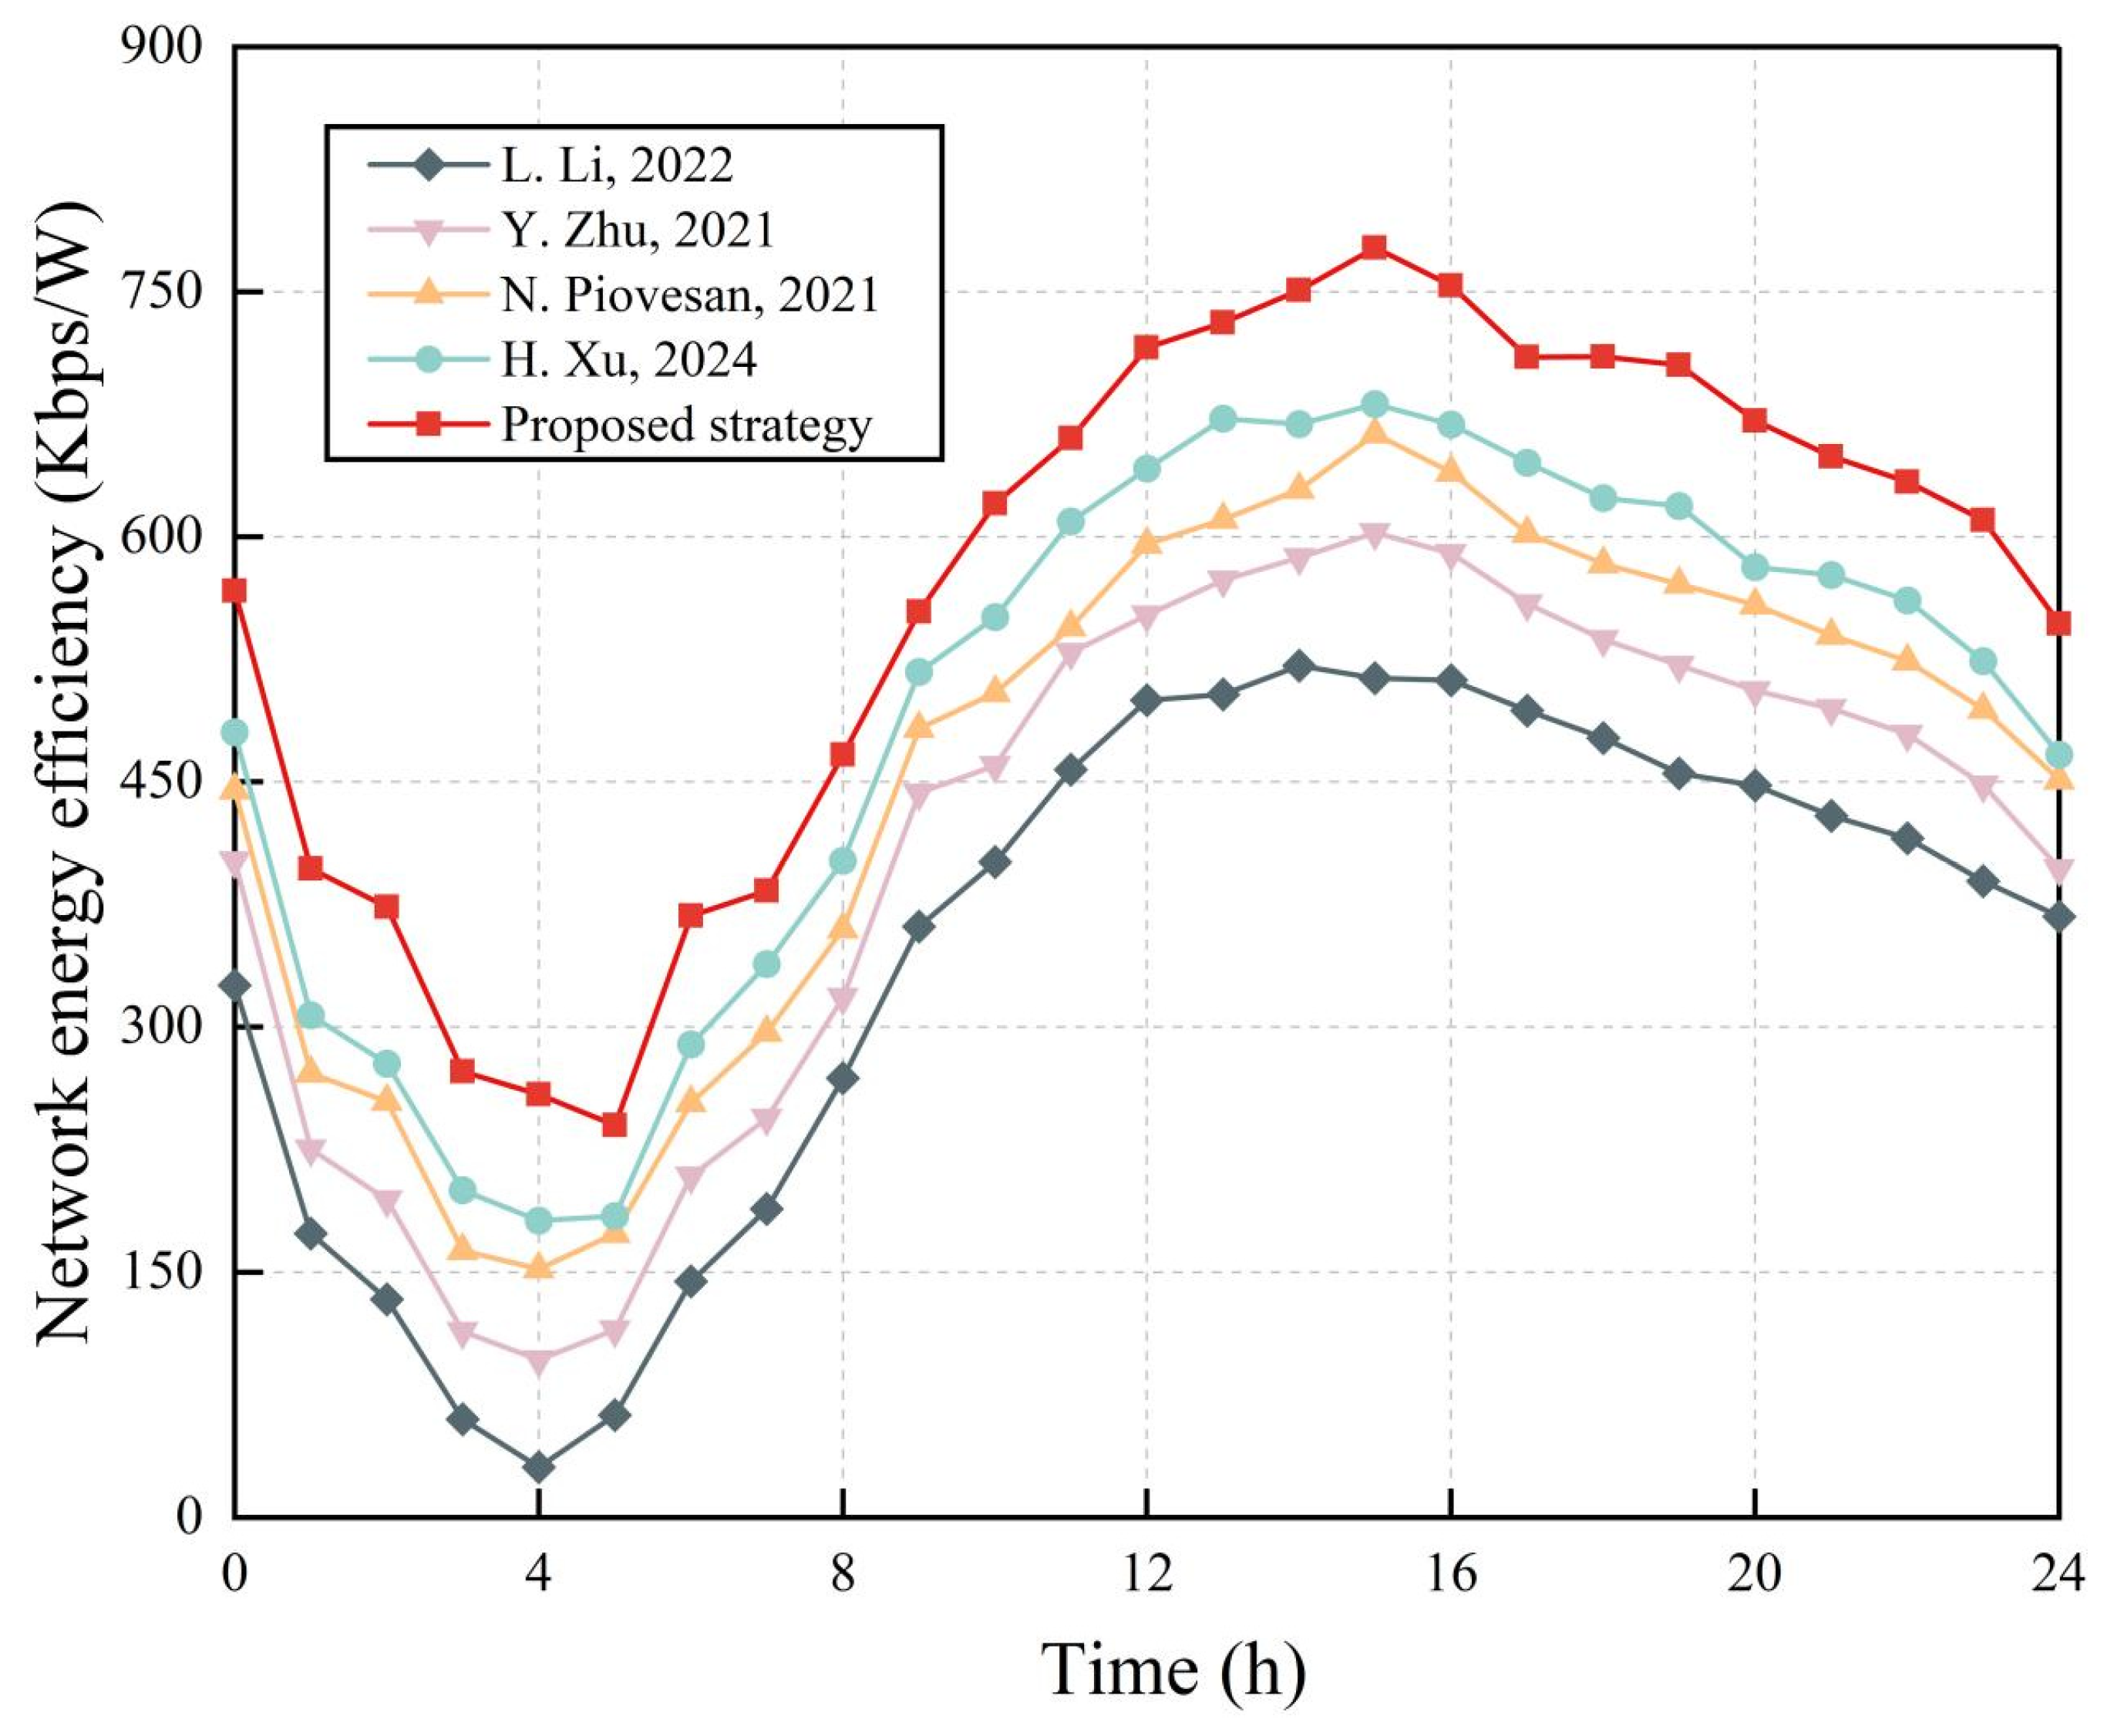
Figure 15 presents the network energy efficiency obtained using the five energy-saving algorithms over a 24 h period. The network energy efficiency decreases with the lower number of users in the early morning. In the daytime, with an increase in user activity, the network energy efficiency of each algorithm also rises, reaching a peak between 12 h and 18 h. However, the network energy efficiency of the proposed algorithm is higher than that of the other four algorithms across the entire period. This is because, when using the other four algorithms, because the maximum demand rate for users is not considered, QoS requirements cannot be fully met, which means that these algorithms tend to improve system efficiency while ignoring network energy efficiency. The dynamic evolutionary game is used to improve the energy efficiency in [
46], but the improved MOEA/D outperforms it because of its better target processing mechanism, stronger convergence, and solution diversity.
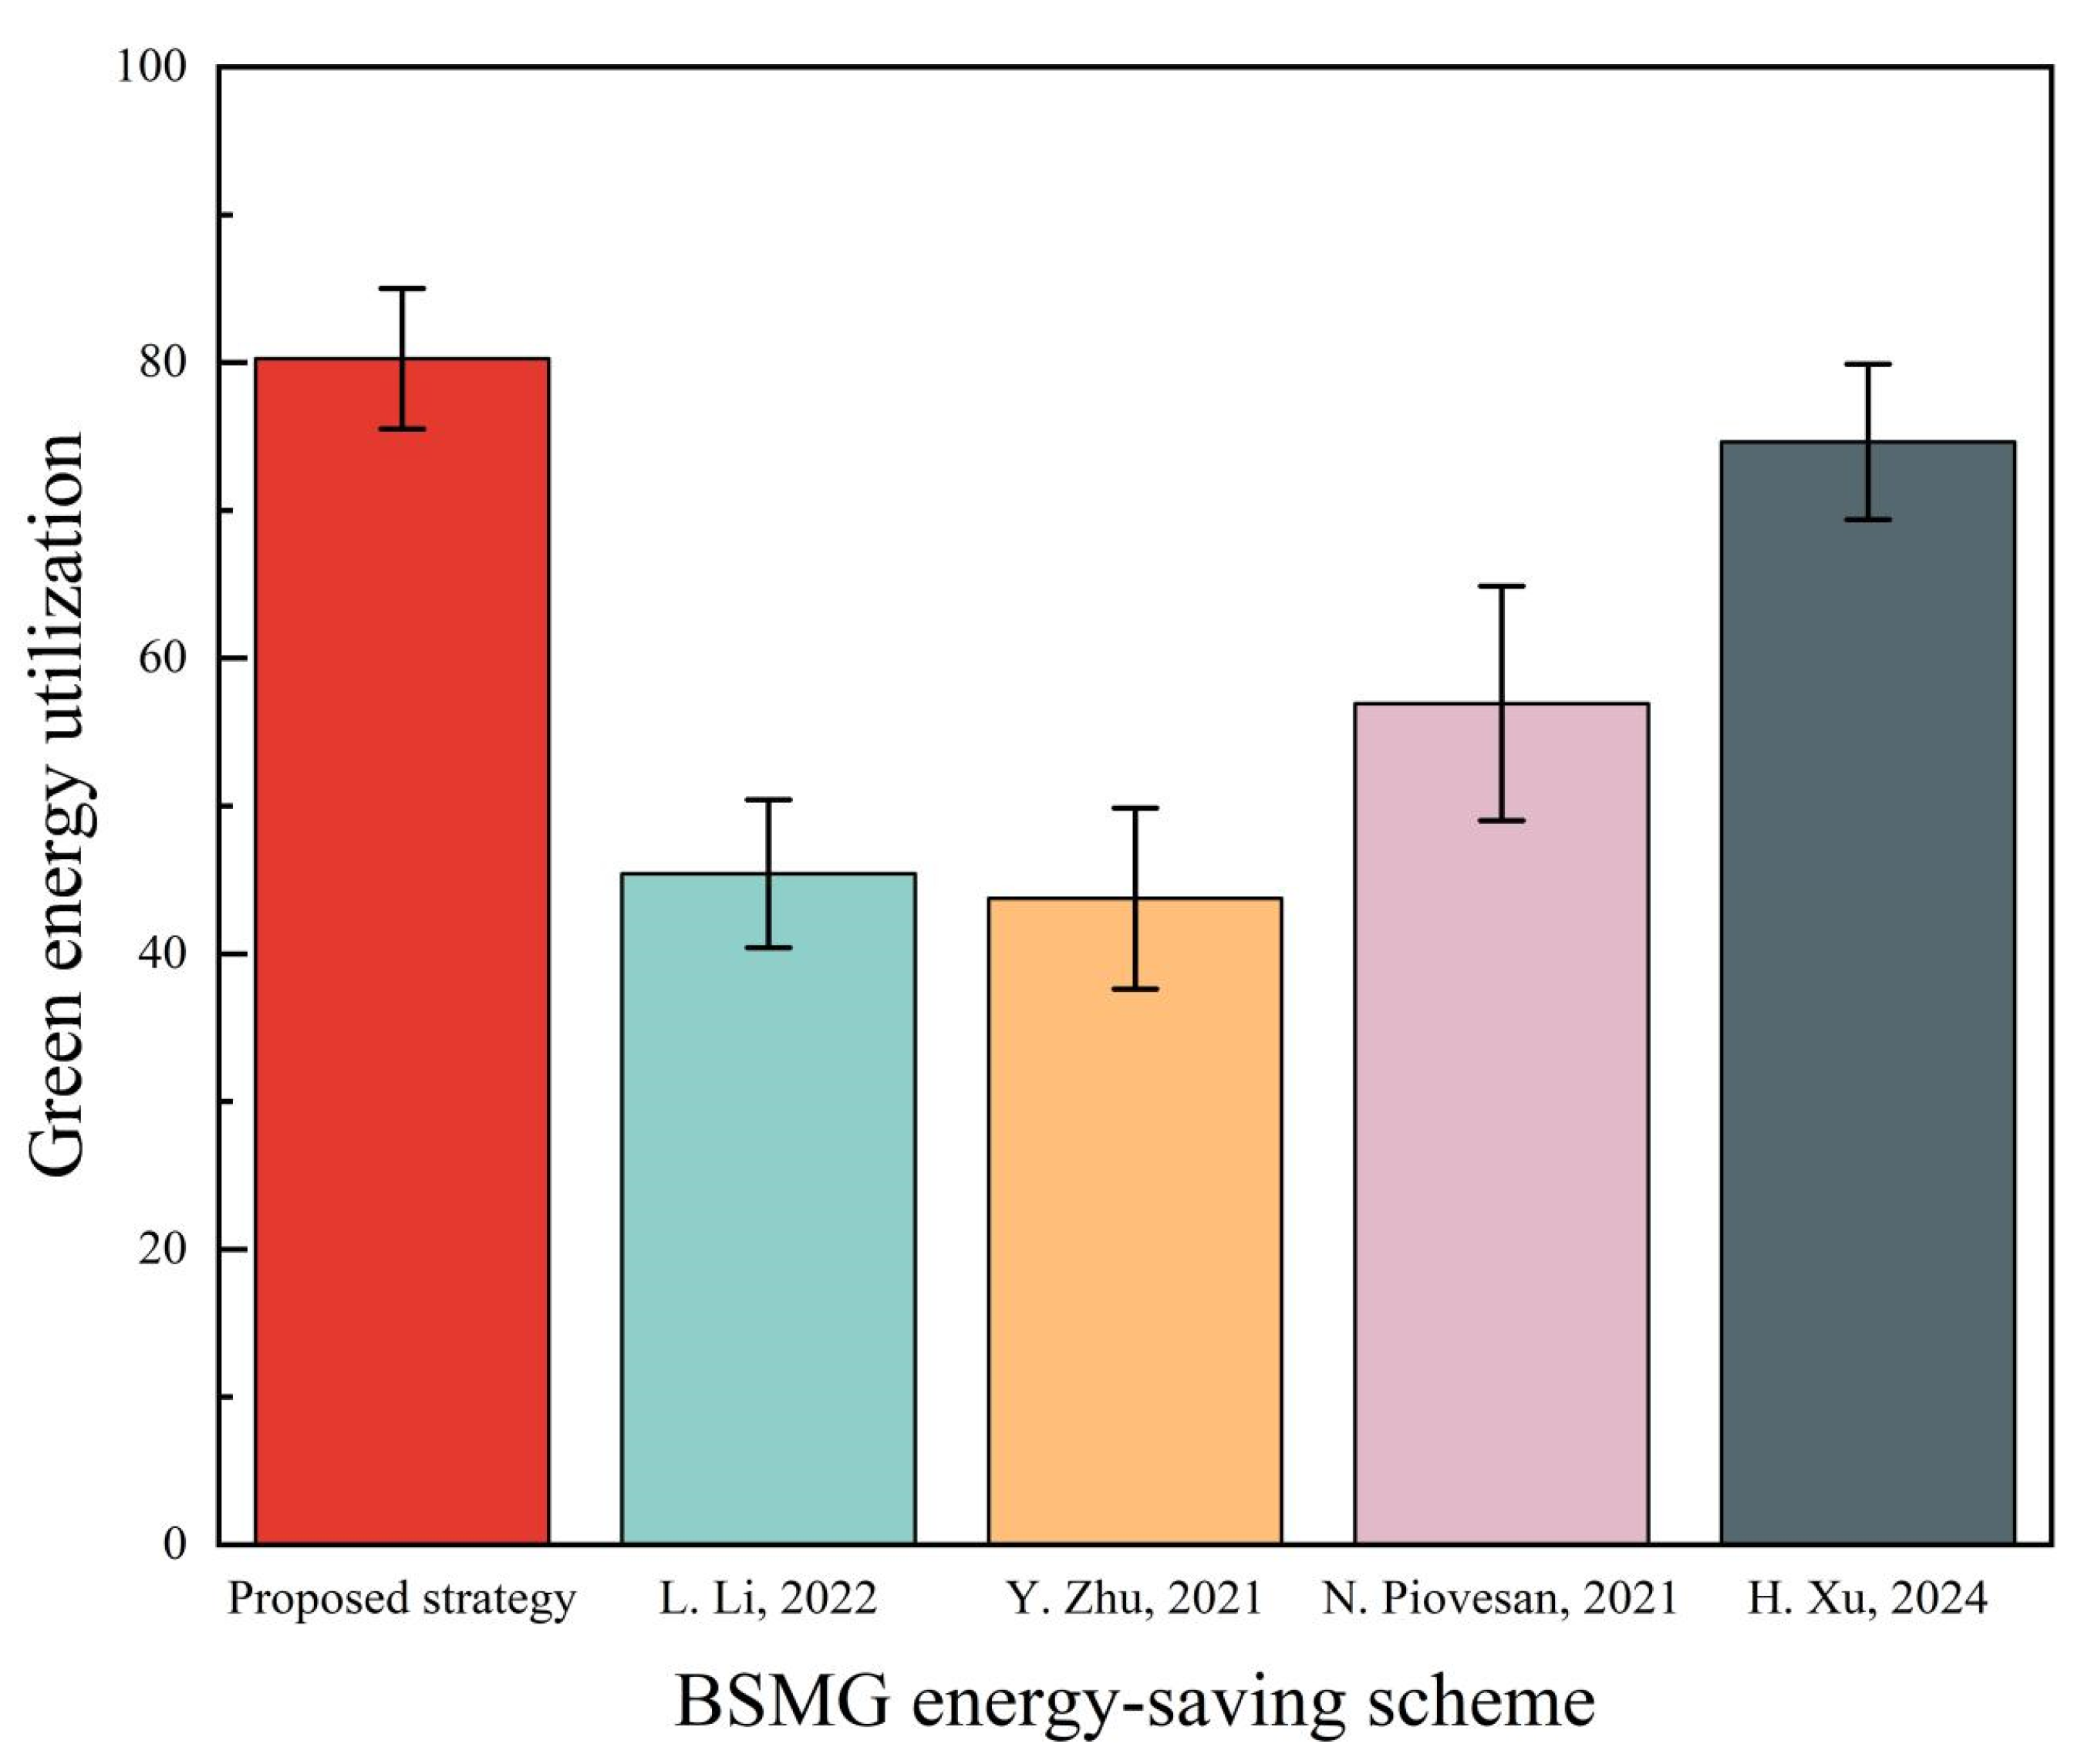
The modified MOEA/D also improves green energy utilization due to energy-sharing among the individual BSMGs (
Figure 16). Compared with the other four energy-saving algorithms, the green energy utilization rate of the proposed algorithm increases by up to 36.5%, highlighting its ability to maximize the use of renewable energy through energy sharing and cooperative sleep decisions, which is in line with low-carbon policies and initiatives.
In summary, the literature [
43] primarily relies on the physical distance between the base station and the CBSMG for sleep decision-making, employing a random selection mechanism. This static strategy, based on geometric location, overlooks the spatio-temporal dynamics of traffic demand and the uneven distribution of renewable energy. Although the literature [
44] utilizes deep learning for traffic prediction, its sleep decision-making process does not explicitly account for user QoS, thereby increasing the risk of service interruption and local overload. The optimization strategy based on Q-learning and other reinforcement learning methods, as presented in reference [
45], faces two significant challenges: the curse of dimensionality and the exploration–exploitation trade-off. The study [
46] focuses on solving the Nash equilibrium through evolutionary game theory, which typically assumes that participants are fully rational and that the payoff function is linearly separable. These assumptions limit the strategy’s ability to address multi-objective nonlinear optimization problems and result in high computational complexity. In contrast, the proposed strategy leverages a deep learning-driven prediction-optimization closed-loop architecture and integrates multi-objective decomposition with adaptive search algorithms. This approach systematically enhances energy efficiency while ensuring QoS and effectively manages photovoltaic fluctuations and traffic bursts, thereby providing a scalable collaborative management framework for 5G heterogeneous BSMGs.


