Article

Assessment of Risks of Voltage Quality Decline in Load Nodes of Power Systems

by
Pylyp Hovorov
1,*,
Roman Trishch
2,*,
Romualdas Ginevičius
3,*,
Vladislavas Petraškevičius
4 and
Karel Šuhajda
5
1
Department of Electric Power Supply and Lighting Cities O.M., Beketov National University of Urban Economy in Kharkiv, 61108 Kharkiv, Ukraine
2
Department of Mechatronics and Electrical Engineering, Ukraine National Aerospace University “Kharkiv Aviation Institute”, 61070 Kharkiv, Ukraine
3
Faculty of Engineering Management, Bialystok University of Technology, 15-351 Bialystok, Poland
4
Department of Economic Engineering, Faculty of Business Management, Vilnius Gediminas Technical University, Saulėtekio al. 11, LT–10223, 08303 Vilnius, Lithuania
5
Institute od Building Construction, Faculty of Civil Engineering, Brno University of Technology, Veveří 95, 602 00 Brno, Czech Republic
*
Authors to whom correspondence should be addressed.
Energies 2025, 18(7), 1579; https://doi.org/10.3390/en18071579
Submission received: 6 February 2025 / Revised: 17 March 2025 / Accepted: 19 March 2025 / Published: 21 March 2025

Abstract

:
The results of numerous studies show that the control of power grid modes is carried out mainly using a technical criterion. The economic criterion is taken into account through the use of complex and inaccurate models that do not accurately predict the result. The emergence of market relations in the energy sector makes power systems economic entities in terms of production and satisfaction of demand for electricity by various economic entities (industry, households, businesses, etc.). Under these conditions, electricity is a commodity with a corresponding price and quality indicators. This requires the application of the risk assessment methodology as an economic category in the activities of power systems as a business entity. The methodology of risk assessment in market conditions requires business entities to search for methods to minimize risk as a possibility of adverse events. Under these conditions, it becomes possible to make the best management decisions regarding the most important criterion that reflects the interests of business entities at a given time. However, the imperfection of the relevant methodology for risk assessment in the energy sector delays their application in the industry. At the same time, when making management decisions, three possible levels can be distinguished: decision-making in conditions of certainty, when the result is presented in a deterministic form and can be determined in advance; decision-making under conditions of risk, when the outcome cannot be determined in advance, but there is information on the probability of distribution of possible consequences; decision-making in conditions where the outcome is random and there is no information about the consequences of the decision. An analysis of scientific publications shows that some authors’ works are devoted to solving the issues of applying the theory and principles of risks in the energy sector, in which the problem is solved only at the first two levels. At the same time, the operation of energy facilities is characterized by a high level of uncertainty and incomplete information about the consequences of such decisions. Therefore, the development of a methodology for making management decisions in the energy sector based on the theory and practice of risks, taking into account the high level of uncertainty and incomplete information, is an urgent scientific task. Implementation of algorithms and programs for controlling the modes of power grids based on them can meet the requirements for reliable and high-quality energy supply to the most demanding consumers and create favorable conditions for their business. This work is devoted to the development of scientific and methodological foundations for determining the voltage risk in power system networks, taking into account the uncertain nature of the loads and its impact on consumers. Based on the results of the study, a mathematical model of the risk of voltage collapses in networks, an algorithm and a methodology for its calculation were proposed.

1. Introduction

Currently, the energy sector of Ukraine has started a gradual transition from vertical congested market relations protected from competition to a regulated competitive market, the main indicator of which is price. Under these conditions, price uncertainty in the market makes management decisions ineffective. This requires revision of criteria for the evaluation of power systems performance on the basis of reduction of uncertainty in decision-making.
It is well known that disturbances with significant cost consequences can occur in the electricity grid for various reasons, at any time and in any system environment. Such disturbances can result in safety problems in the power system: thermal overload (overheating) of equipment; voltage instability or instability of the system transient state. Such problems can lead the system to an uncontrollable emergency. Certain technical constraints are necessary to maintain system safety or reliability, independent of the economic factors that drive market relations [1].
Transmission power flows are significantly influenced by the power market, i.e., proper transmission choices can provide millions of dollars of profit in the sale or purchase of power. Therefore, electricity sellers need to maximize the ability to transmit electricity to consumers to maximize profits [2].
Some interest has been generated by the controversy surrounding the regulation of electricity exchange practices between businesses focused on competition for effect. Current market conditions need new rules to affect the security of the system. This would allow the free market to enforce security requirements on its own [3].
Voltage mode has the greatest impact on the operating efficiency of consumers connected to power grids. Therefore, the voltage in power system nodes must be maintained within the range established by state standards. In the case of overloaded power systems in conditions of interconnections or a shortage of reactive power, a voltage avalanche may occur, which reduces efficiency or makes it impossible for consumers to operate [4].
The prevailing practice to prevent voltage instability in this case is to maintain specified requirements for reactive power, line capacity and permissible load levels at power system nodes, so that the system can prevent a voltage avalanche when the state of any component changes [5].
Most publications on the study of voltage stability [6,7,8] use a deterministic approach, which does not take into account the uncertainty of the initial information. Voltage functionality metrics are very commonly used with satisfactory results in many offline and online safety assessment tools. Evaluation indicators such as sensitivity factors, ref. [9] special significance and characteristic values, safety margins and permissible loads, touch vector indicators, etc., have been proposed. Some researchers have presented their results using second- and first-order approximations of the load boundary to determine the load [10] and existing power transfer methods. It should be noted that it is necessary to take into account the load margin and the maximum sensitivity of its changes, since they are closely related to the need to use a probabilistic approach to calculate the probability of a voltage avalanche.
For a certain operating point, the load value in a certain circuit can increase, which can cause a voltage avalanche; it is the load margin for the voltage avalanche.
At the same time, the use of a probabilistic approach ensures greater accuracy in obtaining results. There are several applications of probabilistic analysis to evaluate voltage stability. In [11], a technique is given for measuring the probability of voltage instability and corresponding indicators. Here, for the problem of avalanche and stress, the probability of movement of the system and the boundaries of destruction change. The economic implications of safety are also discussed, such as expected unsatisfied demand, expected unsupplied energy, and the expected cost of disruption. In [12], the paper referenced as calculates the probability and frequency of voltage instability, along with the expected voltage stability limit, by analyzing the stability indicator at load nodes where it exceeds a specified threshold value. Essentially, they monitor how often and how likely voltage problems are to occur and how stable the voltage can be expected to be, by focusing on the most vulnerable points in the system. On the other hand, a probabilistic voltage estimation method based on linearization of the AC equation is used to estimate voltage instability, reflecting random load fluctuations, generation uncertainty, and operational disturbances. Voltage standard deviations and voltage-reactive power sensitivity are considered as effective indicators of a voltage avalanche. Some metrics include probabilistic load margin estimates based on a tangency vector and Monte Carlo models, while others look at expected voltage instability using sensitivity. Indicators such as the probability of load loss and the risk of voltage instability in nodes are also considered. The essence of the Monte Carlo method is to repeatedly generate random scenarios and calculate the results for each of them, and then average these results to obtain an estimate of the desired value. The steps of the method include identifying input variables that are random, generating a large number of random values for these variables, performing calculations based on the generated values for each scenario, and finally calculating the average of the results to obtain the final estimate [12].
Some scientific studies [13,14,15] examine methods of risk assessment as the probability of unexpected results. This approach is used in various sectors of the national economy, namely: energy and nuclear facilities [16,17,18]; the automotive industry [19]; the medical industry [20]; additive manufacturing [21].
Various existing methods are used to assess a complex indicator as a combined value of single-quality indicators. Among such methods, we can distinguish those that are often found in publications [22,23], namely, methods for finding the average value with regard to weighting coefficients.
This paper discusses a method that is based on the use of a probabilistic approach to calculating the effects of stress. The method involves determining the risk of voltage instability using a probabilistic method combined with the use of a deterministic approach to determining the voltage sensitivity limit. There is a risk that shows the expected cost consequences associated with the two problems of voltage instability (voltage avalanche) or voltage limitation and can be effectively used to make decisions regarding the economic operation of the system.
This risk assessment typically involves two key steps: determining the likelihood of an event and evaluating its potential consequences. The overall method is broken down into two assessment types: component-level, which focuses on the impact on consumers at specific node voltages, and system-level, which considers uncertainty to gauge the overall risk of voltage instability for the power system’s operating state.
The methodology of decision-making developed by the authors is the basis of the electronic advisor of dispatchers of the “Kharkivoblenergo” company (Kharkiv, Ukraine).

2. Materials and Methods

Power system reliability indicators, as referenced in [24,25,26], are used to manage the frequency and duration of customer power outages. These indicators fall into two main categories: customer-based, which track individual user disturbances and are best suited for residential areas, and load-based, which monitor load interruptions and are more relevant for industrial or commercial networks. Various metrics like SAIFI, SAIDI, CAIDI, and ASAI [26,27,28,29,30] exist to evaluate the adequacy of these reliability efforts.
A systematic and standardized assessment of electricity quality is key to monitoring its condition in distribution networks, and voltage disturbance analysis methods allow us to predict deviations, identifying their sources and localizing faults. They play an important role in ensuring the stability of the power supply, taking into account such indicators as amplitude, frequency, and overall power quality [31,32,33].
Article [34] provides an overview of the main methods for determining the sources of power quality disturbances in electrical networks, in particular through the identification of the causes of disturbances and the localization of their origin. The authors analyze different approaches, emphasizing their characteristics, advantages and disadvantages, and suggest ways to improve the responsibility of suppliers and consumers in solving power supply quality problems.
In their research paper [35], the authors study the impact of load imbalance on the assessment of electricity quality in distribution networks. They analyze various power quality indicators, such as voltage and current factors, and propose methods to improve the accuracy of the assessment in the face of phase imbalance.
Paper [36] investigates the impact of distributed energy storage systems on the quality of electricity in distribution and transmission networks. The authors evaluate how the integration of such systems improves the quality of the power supply, in particular voltage stability, by comparing different architectures for deploying energy storage systems.
There have been a number of works carried out to evaluate the security of the power system which give various indicators of its security. The functionality index, as noted in [37,38,39,40], shows the level of security of the system state based on the evaluation of deviations of power flows and bus voltages from their normal values.
In addition to the review of probabilistic approaches to the power system security assessment, ref. [41] proposes a probabilistic security indicator to determine its operating limits. In [42], a time series method is used for statistical characteristic values of indicators based on sensitivity calculations of characteristic values. It can be used for probabilistic evaluation of weak-signal or oscillatory processes. In [43,44], probabilistic analysis of transient stability in a power system is discussed.
All functional and probabilistic indices define the security of a power system as basic and mandatory for its operation. Most of them do not consider the importance of economic requirements related to the reliability of power system operation.
Based on the use of existing studies [45,46], a comprehensive risk indicator for assessing the reliability of the power system is defined. This indicator reflects the expected economic losses due to possible reductions in system reliability, which appear in four different forms: thermal overload (overheating), equipment and lines, voltage instability, and transient system instability.
Since risk indicators are defined for each single reliability indicator and have universal economic significance, they are additional and become part of a comprehensive risk indicator that reflects the overall level of power system reliability [47,48,49,50].
The quantification of the composite two-component risk in the paper is accomplished by calculating the expected impact in value terms of the individual components and the systems as a whole, taking into account the uncertainty of their outcomes.
This paper develops a two-pronged approach to determine a comprehensive risk assessment for a particular operating condition of a power system. In the paper, the two-vector approach involves a step-by-step calculation of probabilistic risk characteristics of individual components and, after the arc, a calculation of risks of abnormal situations of the whole system taking into account uncertainty. A detailed description of the process of building a probabilistic model using the example of a test model is given in Article 6.
This risk assessment utilizes two complementary approaches: a component assessment and a system assessment. The component assessment quantifies the expected financial impact for individual power system elements under varying electrical conditions. The system assessment, on the other hand, calculates the overall monetary impact for a given operating state, considering the uncertainties affecting the system’s components [51].
In component evaluation, it is important to evaluate the consequence as well as the monetary value associated with each power system component at a given electrical operating state of the power system. The component assessment provides an indication of the expected impact on the security of each energy facility. Transmission lines, transformers, generating units (devices), etc., are subject to such an evaluation.
It is known that power flow through a transmission line, under certain conditions, may be accompanied by thermal overloading of wires and thus by corresponding physical damage and even human casualties [52].
This paper explores the economic effects of thermal overloading, emphasizing that overloading depends on both the power flow and environmental factors. By using a probabilistic approach to weather conditions, the study determines the risk of overloading a transmission line for a given power flow. This generates a power flow risk curve, unique to each transmission line, based on local conditions and physical properties. This component estimation approach streamlines the calculation of the expected monetary impact on the transmission line without needing detailed knowledge of its internal characteristics or financial value. Essentially, knowing the power flow, the monetary loss due to transmission under certain conditions can be determined [53,54].
The component voltage risk considers the expected impact of a load interruption on a node at a given voltage, where the cost consequences of voltage instability are calculated. It shows the loss due to load interruption at a given node voltage. To calculate an estimate of this risk in a node at given voltage levels, two measurements are required: the probability of a consumer power interruption and the expected cost of an interruption. The risk at a node is the result of these two dimensions [55,56].
For any node voltage, the volume of the disrupted load is determined by how well it can withstand the specific voltage before failure, also known as the stability margin. Since statistically load values have different variations in a composite load at a node, the stability limit is random. By multiplying the likelihood of a load disruption by the associated costs, you can calculate the expected impact on the load due to instability at a particular voltage. This stress risk component is represented as a flowchart in Figure 1.
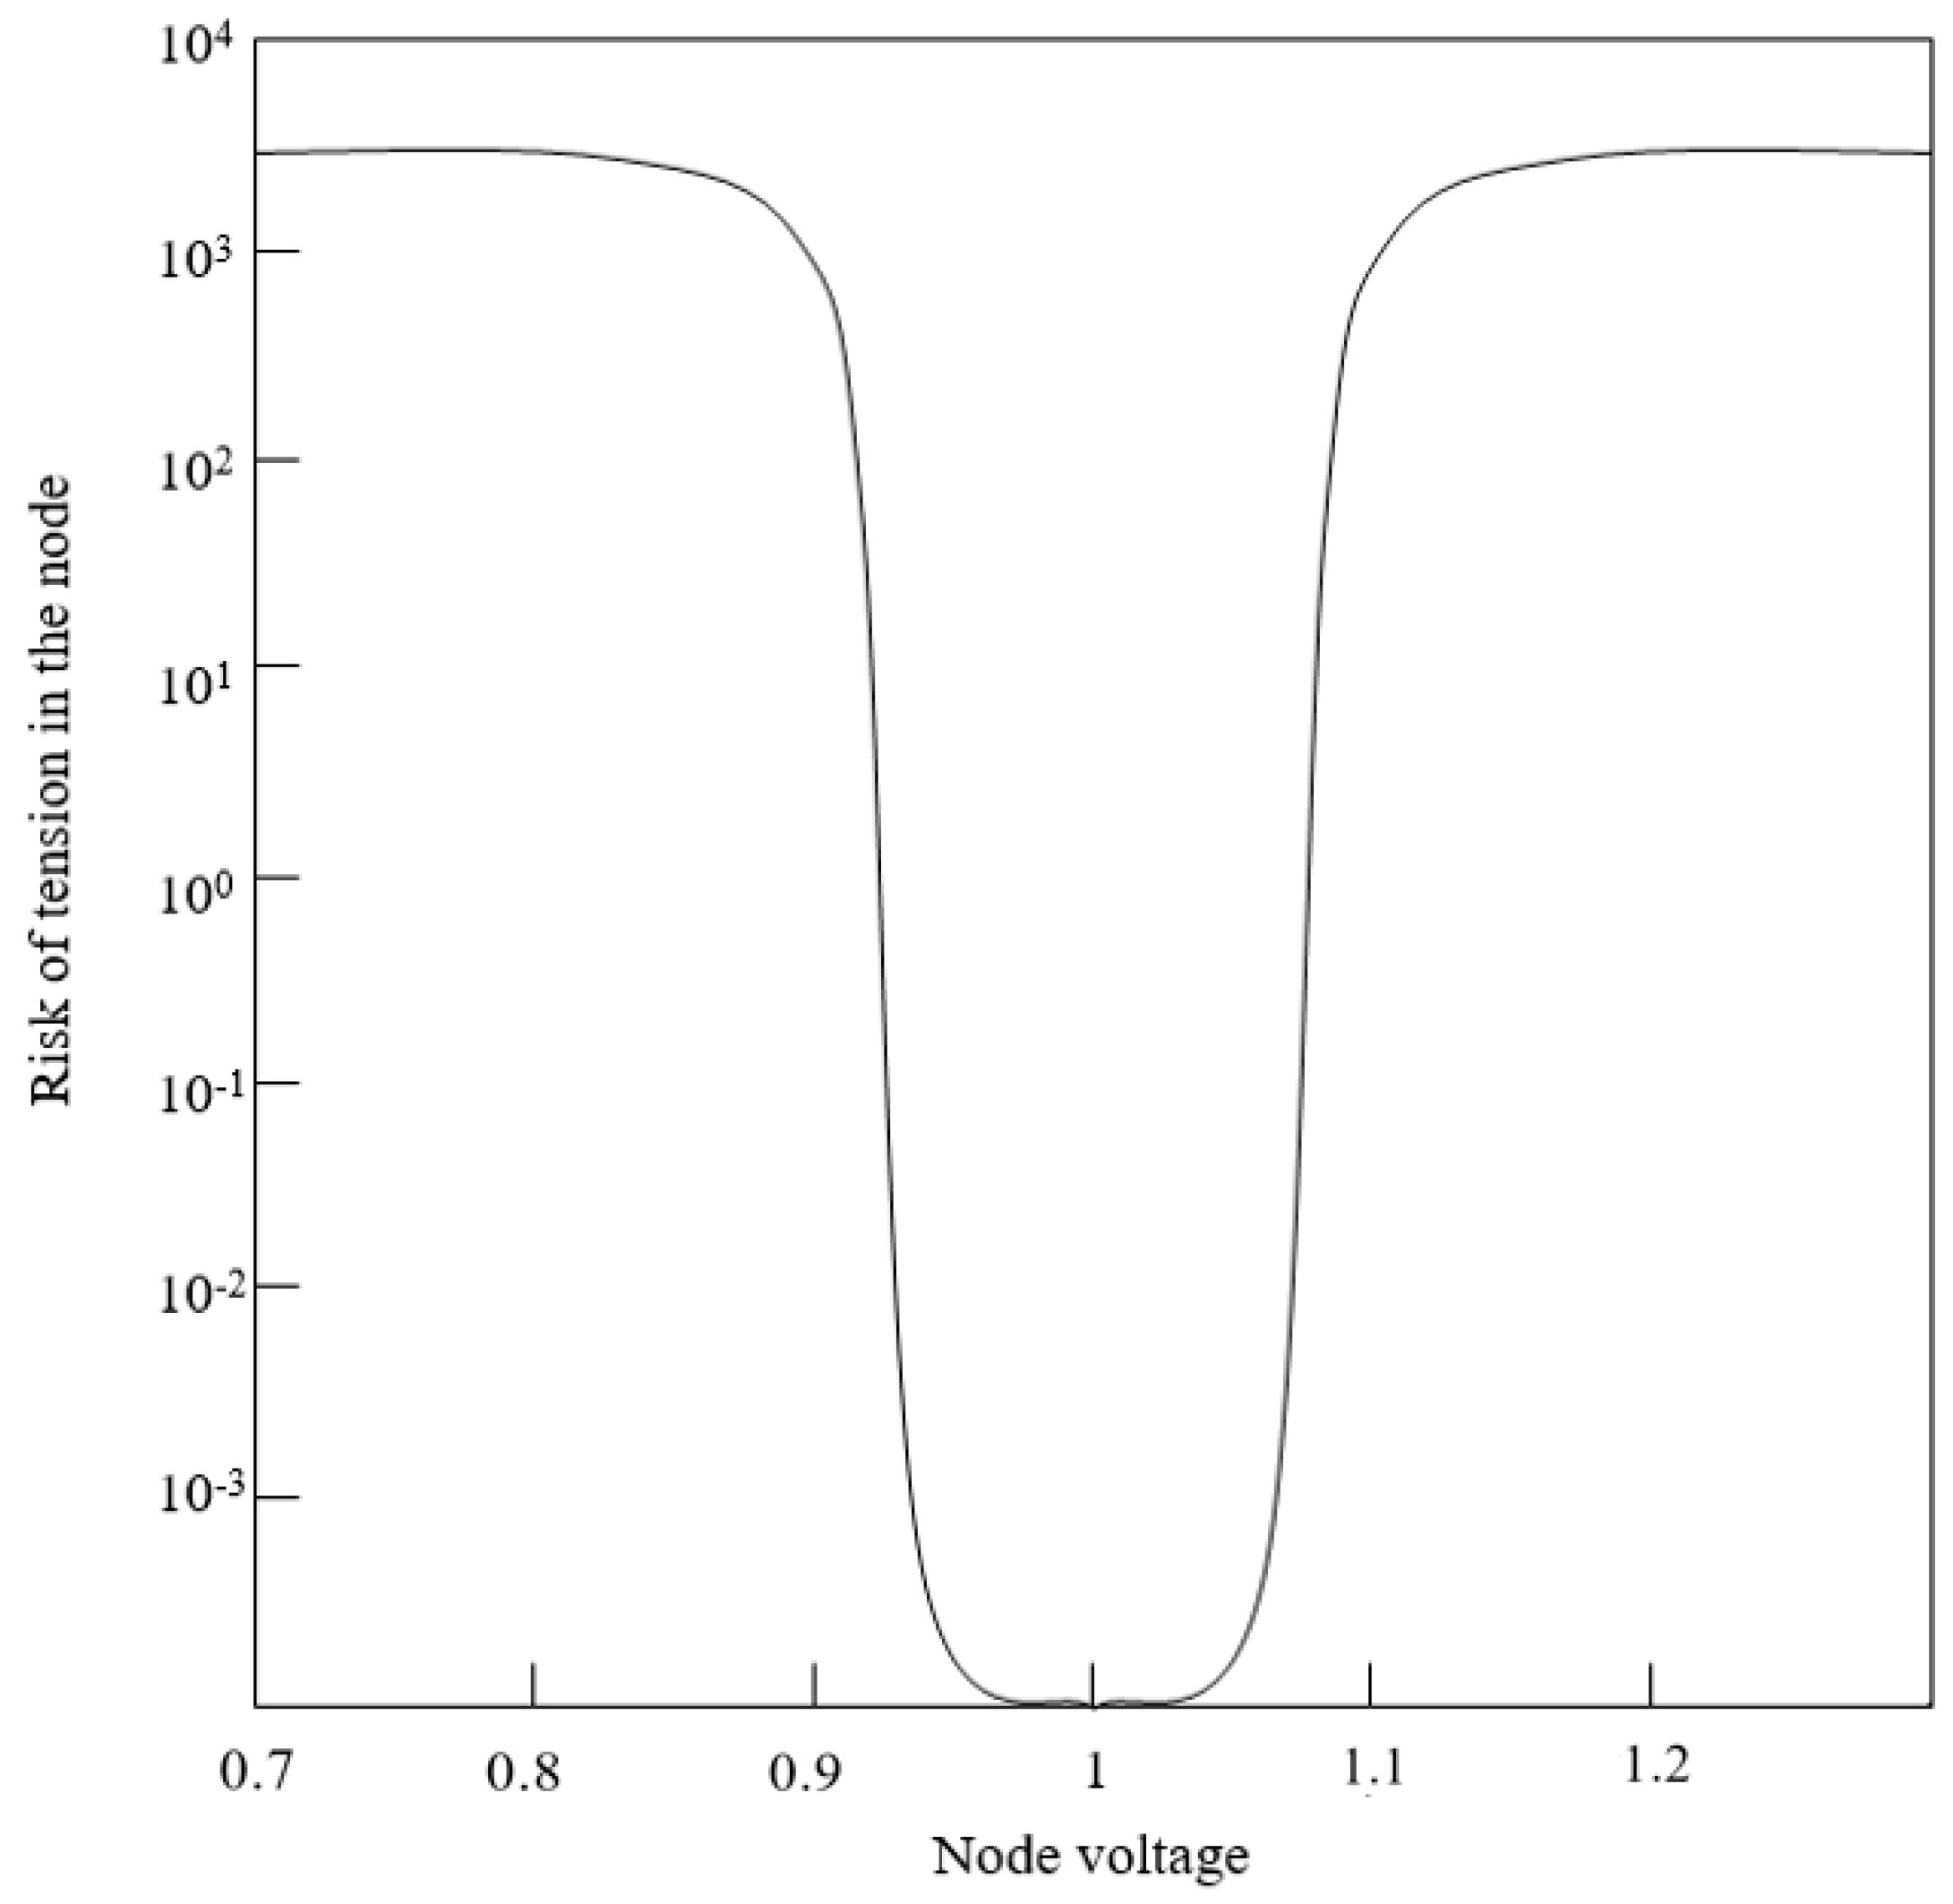
For each node, the component definition produces a “risk versus stress” plot that provides a detailed examination of the expected stress effects at the node. It can be used when studying a system, where probabilistic indicators of the voltage at a node and thus the risk are obtained through the uncertain conditions of the system. The result of the component evaluation produces the expected impact on the node, given the load profile.
The general expression for the stress risk can be written as:
R i s k = Pr C o l l a p s e × I m C o l l a p s e + P r ( C o l l a p s e ¯ ) × I m N o C o l l a p s e
As follows from Equation (1), the risk assessment includes two factors: measuring the probability of collapse, the expected consequences of collapse, and also measuring the probability of it going beyond the voltage limits.
The risk of load loss in a node at a given node voltage. The likelihood of interruption of the power supply to consumers and its cost consequences associated with this remain. The result is given by a voltage risk curve, so that different nodes have different voltage risk curves, according to the load interruption voltage and service interruption costs.
To protect against extreme voltage fluctuations in distribution networks, excessive low or high voltage protection strategies are commonly implemented. These strategies disconnect loads automatically, thus preventing potential voltage collapse through load-shedding schemes. When a voltage exceeds its threshold, consumers experience power interruptions. Conversely, unstable voltage can sometimes cause loads to reset without any intervention from protective relays.
Table 1 shows the interruption voltages for distribution network protection. The load interruption voltage depends on the equipment and must be modeled separately. Therefore, when studying typical power flow and power stability, the entire system is modeled as one total load at a node. This is the total load in a node—a combination of individual loads with characteristics.
The limit value of the load deflection voltage presented in Table 1 corresponds to the Ukrainian standard DSTU 13.109-97. Similar values are presented in European power systems.
Component-based methods determine the overall load model, with particular interest in the sensitivity of active and reactive power to voltage. These methods categorize loads at each node into domestic, commercial, or industrial classes, often using payment or statistical data. This component-based approach is valuable because it effectively integrates available load information and avoids the need to model each individual load separately by grouping similar loads into classes. This same approach can be applied to model load interruption voltage.
In this paper, the use of normal distribution for determining the stress stability limits is due to the sufficient accuracy of the calculations under the conditions of a large number of parameters.
To model the load interruption voltage, we use the tools of mathematical statistics, namely, knowledge of the law of distribution of random variables. According to the central limit theorem, if the resultant value is the sum of a large number of independent random factors, each of which has a small effect, then its distribution is close to normal. In our opinion, and based on existing scientific and practical experience, we believe that the distribution of random variables of the interrupting voltage is closest to the normal distribution law.
To estimate the parameters of the normal distribution law μ and σ, it is proposed to use effective non-biased estimates: mean and standard deviation, respectively. To estimate them, the results of measurements of a random variable (load interruption voltage, Vc) in existing power grids for six years four times a year were used, taking into account the change in seasonal loads.
When the model is represented by a mixed load at a node and the interruption voltage in a certain load class is normally distributed, the probability distribution of the interruption voltage is:
V L , c N μ L , c , σ L , c 2 V U , c N μ U , c , σ U , c 2
where the lowest and highest stability limits (and) in the load class are randomly distributed with the mean (and) and standard (and) deviation. These parameters can be determined via voltage statistics V L , c V U , c μ L , c μ U , c σ L , c σ U , c .
The possibility of interruption to the power supply to a node occurs when the voltage in the node exceeds the stability limits of an individual load. The probability of interruption to a class (c) load at a given voltage level can be calculated as
P r V L , c > V b u s   o r   V U , c < V b u s | V b u s
The integral is the general probability of random and represents the probability that a load of class (c) is supplied to the consumer. Therefore, the probability of power interruption is 1.0—this is the probability of the load supplied to consumers V L , c V U , c .
The magnitude of the expected impact of class (c) load voltage at an individual power interruption node can be determined as the cost of the expected power interruption multiplied by its expected interruption magnitude.
E I m b u s V b u s = E P b u s × c E C b u s , c × E K b u s , c × P r V L , c > V b u s   o r   V U , c < V b u s | V b u s
where the total amount of load at an individual node is the percentage of load class (c) in, represents the expected number of power interruptions at load class (c); the cost of power interruption associated with class (c) load at that node. The expected cost of a power interruption at each load class can be obtained using regression methods based on customer surveys or process data.
Expected cost of an interruption to the electricity supply for each load class: can be derived using regression methods based on customer surveys or process data.
P b u s K b u s , c P b u s E K b u s , c . P r V L , c > V b u s   o r   V U , c < V b u s | V b u s C b u s , c E C b u s , c
The voltage risk curve shows the voltage risk at different voltage levels in a node.
The task of assessing the system voltage risk is to find the risk associated with voltage instability for a particular region or the entire system under a given operating condition. At the same time, risk measures the probability of voltage instability (voltage collapse) and the associated cost consequences.
The risk voltage of a given operating condition can be defined as
R i s k X 0 = E I m | X 0 = Pr C o l l a p s e | X 0 × E I m C o l l a p s e + 1.0 Pr C o l l a p s e | X 0 × E I m N o C o l l a p s e
where X 0 is a characteristic of the current operating state.
The risk depends on the probability of a stress avalanche in the state, R i s k X 0 Pr C o l l a p s e | X 0 X 0 E I m C o l l a p s e ; this is the expected impact of collapse and the expected impact of non-collapse.
There are several uncertainties in the probability of a voltage avalanche related to emergency situations, a short-term system load, short-term deviations, load distribution deviations, generation control, etc.
E i P o i s s o n λ , t
where there is a frequency of occurrence of an emergency, allocated time interval t-time used to calculate our future risk, i.e., we assess the risk over the next t hours.
We obtain the expectation of these parameters as E K p , where the parametric vector column Kp can include all possible system parameters, such as load distribution factors, generation participation factors, and so on.
Based on the expectation E K p _ that it is the power flow that gives the expectation of the maximum possible load E ( L m i ) and the boundary sensitivity Sp with respect to these parameters. According to the second assumption in this section:
L m i = E L m i + S p T _ × K p _ E K p _
where is the maximum possible load of the system, which is now random due to random parameters.
Under the assumption of normality of parametric deviations Kp of a multivariate normal distribution with an average vector E(Kp) and variation−covariance matrix Vp, we obtain the expression for the probability distribution of parameters.
K p _ M V N   E K p _ ,   V p
where E K p _ V p is the vector of the expected parametric scenario of the system and is the variation−covariance matrix of these parameters.
The elements of the variation covariance matrix represent the variations in each parameter and the relationship between the deviations of other parameters. This matrix can be determined from the statistics of the process data.
It can be proven that Lmi, a linear function of the distributed MVN Kp, is also a normal Gaussian distribution. Its expected value is E ( L m i ) and variability is S p r _ × V p × S p _ .
As a result, the probability distribution of the maximum possible load
L m i N E L m i , S p T _ × V p × S p _
The probability of collapse for a given topology, when the load level L and the maximum possible load Lmi are random, the probability of a voltage avalanche is the probability that the load boundary Mi=Lmi-L is negative. The probability distributions Lmi and L are obtained through Equations (6) and (8), respectively. As long as they both belong to a normal voice distribution, the resulting load boundary will also be normally Gaussian distributed with mean and variability. There is the probability of collapse in an emergency.
Pr C o l l a p s e | E i = Pr M i < 0 | E i
where M i = L m i L the random load limit has a normal Gaussian distribution and a probability distribution of the load limit
M i N μ m i , σ m i 2 μ m i = E L m i μ L σ m i 2 = S p T _ × V p × S p _ + σ L 2
Using the general probability theorem, the total probability of an avalanche, the stress in the system is subject to and takes the form
Pr C o l l a p s e = E i Pr C o l l a p s e | E i × Pr E i
where Pr C o l l a p s e | E i Pr E i is the conditional probability and the emergency probabilities are given in Equations (5) and (9), respectively.
Expected impact without voltage avalanche: The voltage in the node depends on the emergency situation, as well as the level of short-term system load and short-term parametric deviations. For small deviations in the system parameters, a linear approximation of the voltage to its expectation assumes that a multivariate normal distribution of voltages in the nodes is obtained:
V _ = E V _ | L , E i + δ V _ δ K p _ × K p _ E K p _
Function of multivariate normal probability of voltage in a node:
V _ M V N E V | L , E i , δ V _ δ K p _ V p δ V _ δ K p _ T
where δ V _ δ K p _ – voltage sensitivity matrix in the node. If there is no collapse, then the voltage at the node is obtained by calculating the power flow based on the expected state of the system and the emergency situation. E V | L , E i , δ V _ δ K p _ E i V , is a variation−covariance matrix of parametric deviations
E I m | L , E i = b u s V b u s V d u s E I m b u s | V b u s P r ( V b u s ) d V b u s  
where E I m b u s | V b u s P r ( V b u s ) is given in Equation (3) and is the normal (Gaussian) probability density function given in Equation (12). V d u s dangerous system loads.
Expected impact on the system without collapse
E I m N o C o l l a p s e = E i ( E I m | L , E i × Pr L d L ) × Pr E i
Expected impact with voltage avalanche Equation (14)
b u s P b u s c C b u s , c × K b u s , c
where all system loads and all load components at nodes are interrupted.
The theoretical background and specific operating parameters, models, and calculation steps are summarized in Section 1.
For a simple illustration, we offer a grouped load that has a 100% household load with an average voltage deviation of 0.85 (lower average) and 1.15 (higher average) standard deviation of 0.02. Based on the lower average voltage interruption of this residential grade load, the load can be expected to be reduced by at least half when the voltage drops below 0.85. On the other hand, more than half the load may be lost if the voltage is too high, such as in this case greater than 1.15.
The expected cost consequences or impacts of a load interruption at this node at various voltage levels are calculated in Equation (13) and shown in the figure, where for this residential load an expected cost of USD 50 per megawatt hour is assumed for an average of 6 h of interruption.
Figure 2 shows the dependence on different types of consumers (industrial, municipal, commercial). For more detailed data, see Section 1.
The analysis assumes a one-hour time interval, during which the expected future system state remains consistent with the current operating state. The standard deviation of the load is set to 2% of its expected value. Additionally, the load-sharing factor at each node varies parametrically, with a standard deviation equal to 5% of its expected value. Finally, fault probabilities are estimated based on annual damage rates for each transmission line, considering the maximum potential load. These estimates are presented in Table 2.
As an example, the grid has the following parameters: voltage 110–220 kV and total capacity 3600 MW. As an example, let us propose that the current load level is 3600 MW; then, under the current operating condition with a standard deviation of 2%, the present load has a 95% probability of fluctuating within the interval of 3600 ± 1.96 × 72 MW.
The random nature of the possible load magnitude under different emergency conditions is summarized in Table 3. They are obtained from Equation (8). The random nature of load boundaries and distance between random maximum possible load and random load level for each emergency are shown in Table 4 and are obtained from Equation (10).
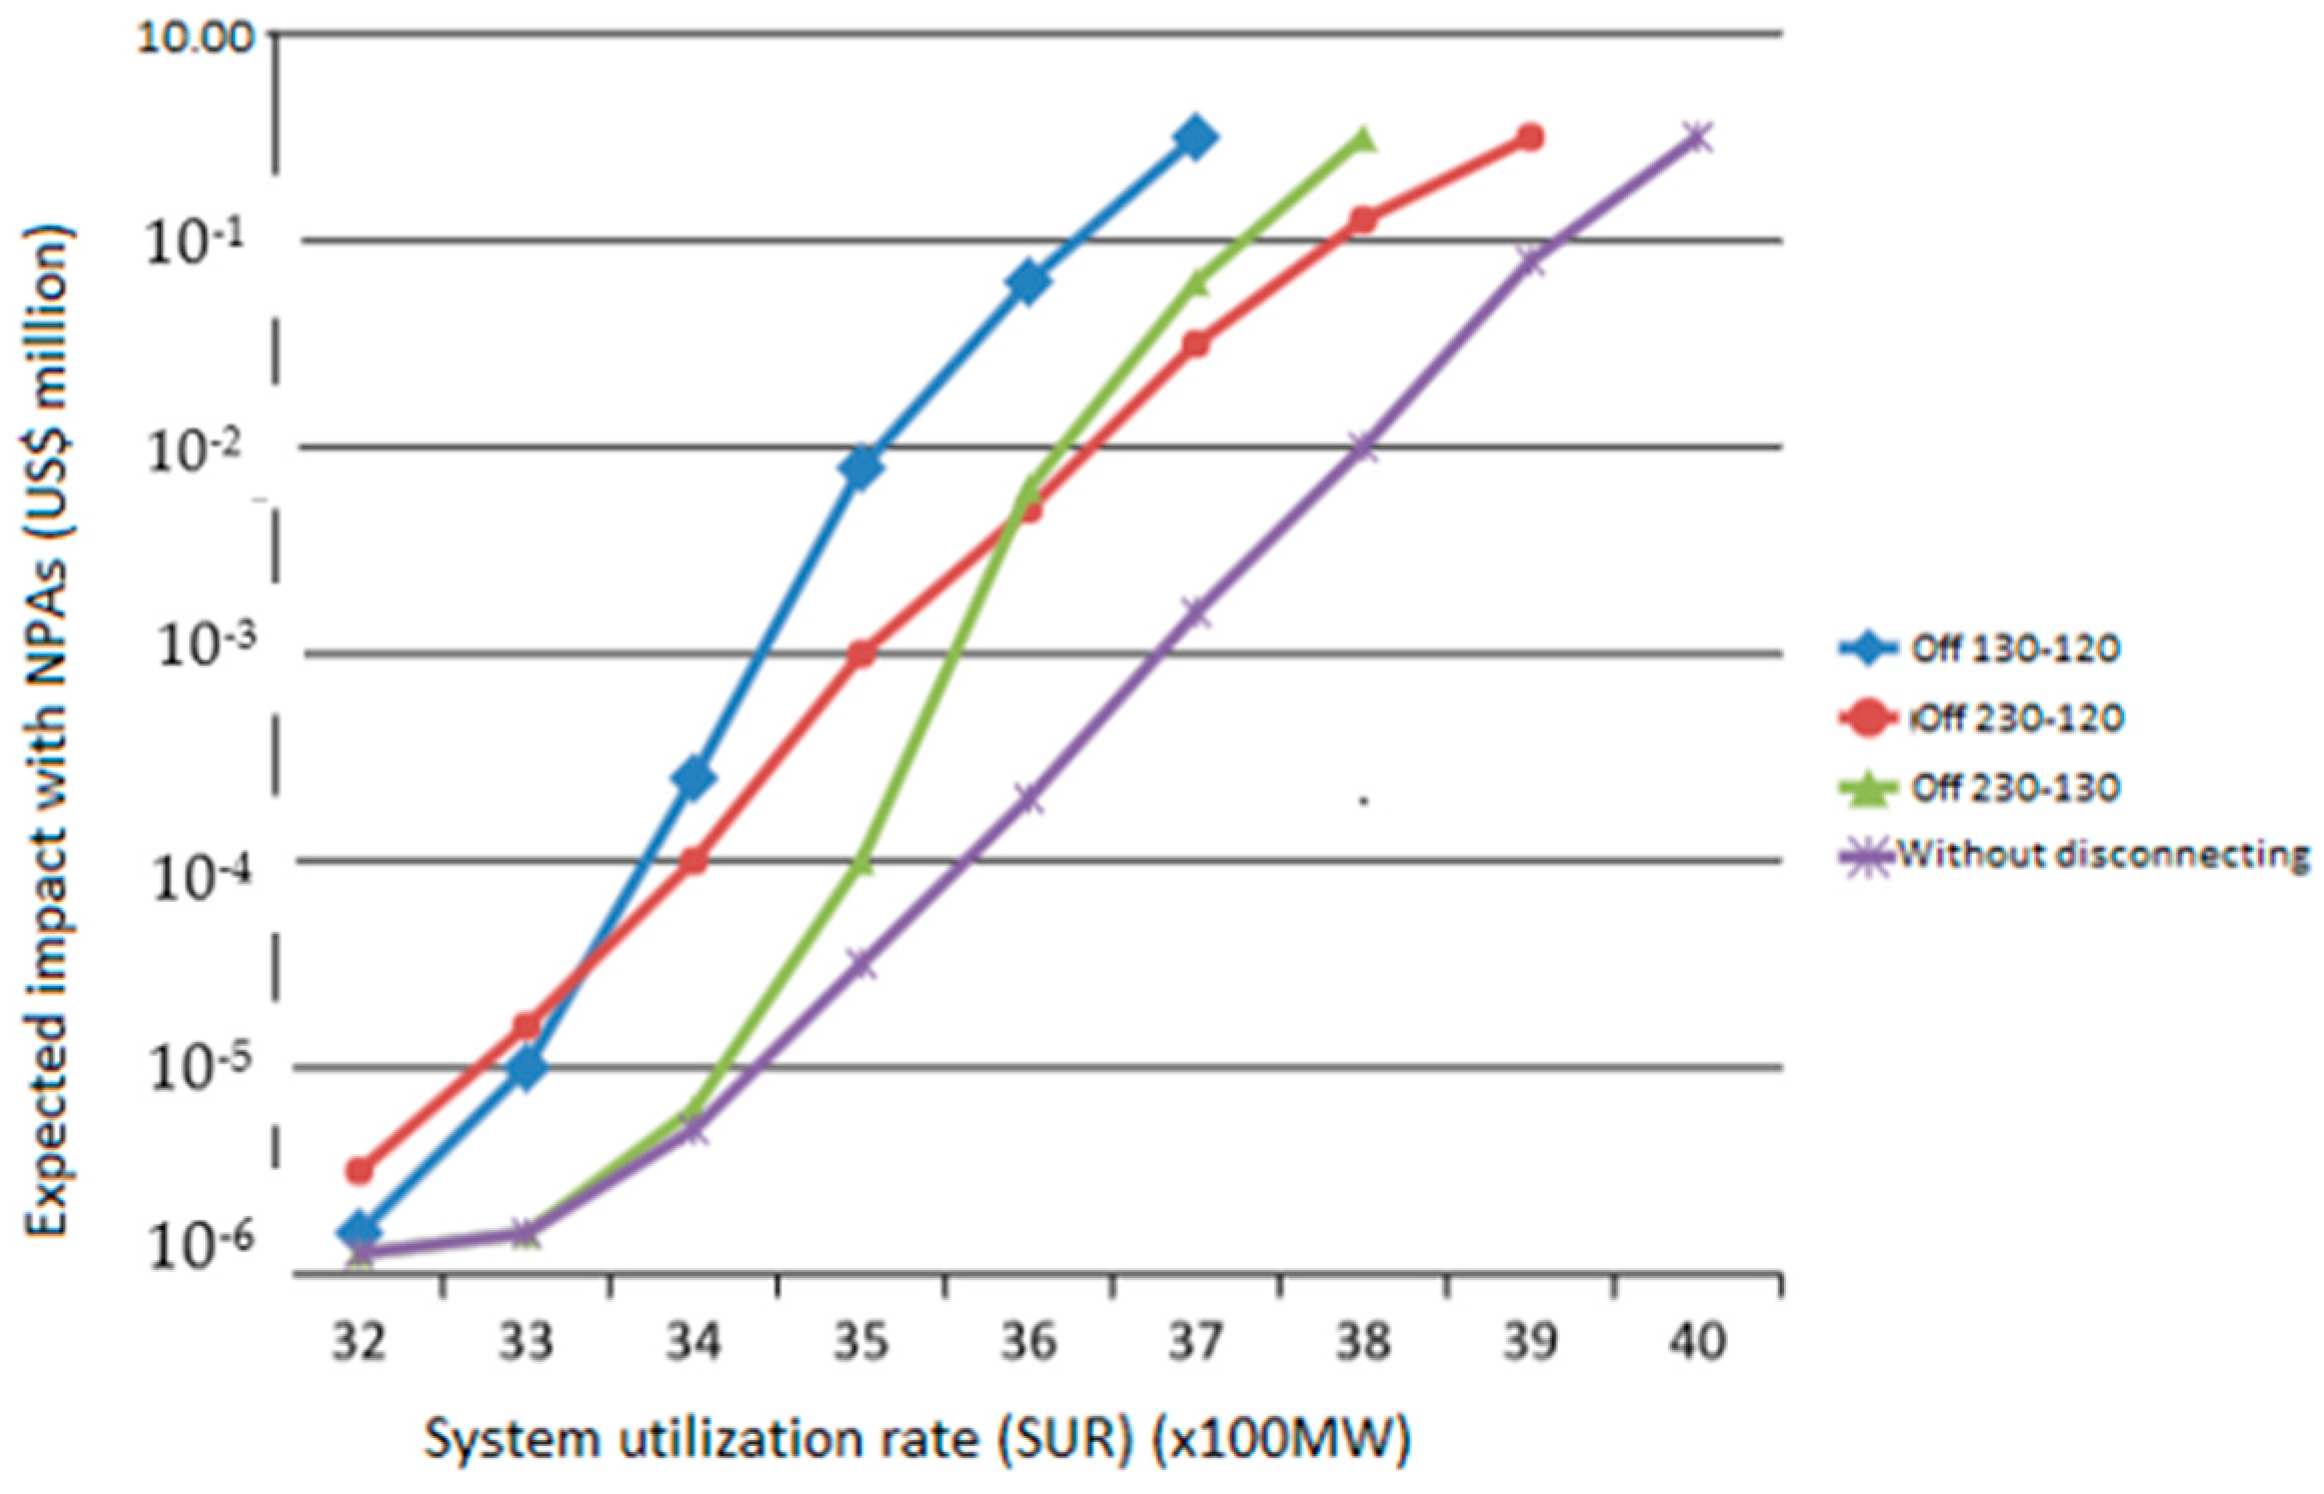
Consequently, for a load of 3600 MW, the calculated probability of voltage collapse within the next hour is extremely low, at only 8.5 × 10⁻⁶. This value represents the sum of all calculated probabilities of collapse occurring under emergency conditions. Figure 3 illustrates the expected financial impact, or cost consequence, of out-of-bounds voltage conditions at varying load levels, assuming the system does not experience a full voltage collapse. The impact curves in Figure 3 highlight the potential financial losses associated with load interruptions due to out-of-bounds voltage, which occur because the system voltage declines as the load increases.
The voltage instability risk is determined using Equation (1). It is the sum of two parts: the risk of collapse and the risk of over-voltage. Equation (1) represents the safety boundary for the most severe single fault. It is the traditional hard safety limit of the system. The overall resulting risk curve, which means the expected impact of voltage instability problems, including both voltage collapse and voltage out-of-bounds, varies at different system load levels. The risk of loss of voltage stability and voltage limits becomes higher when a higher system load is required.
To confirm the adequacy of the developed model, the results of experimental studies conducted in the power grids of “Kharkivoblenergo” were used.

3. Discussion

This study is devoted to the development of a methodology for determining the risk of voltage deterioration in power system networks, taking into account the uncertain nature of loads. The relevance of the topic is due to the transition of Ukraine’s energy sector to a regulated competitive market, where price uncertainty reduces the effectiveness of management decisions.
The result of the functioning of energy systems is a product—electricity with its inherent price and quality indicators. Price is becoming the main indicator in a regulated competitive market, which complicates the process of making management decisions. There is a need to revise the criteria for assessing the efficiency of power systems, taking into account uncertainty in decision-making.
The authors propose a mathematical model of the risk of voltage collapse in networks and an algorithm for its calculation.
Power grids are subject to disturbances that can cause thermal overloads, voltage instability, and emergencies. This is especially true for grids with renewable energy sources, whose performance depends on solar intensity, wind load, etc. When renewable sources operate in parallel with conventional ones, power changes are accompanied by disturbances, increasing the risk of voltage instability for consumers. In the case of the autonomous operation of such networks, these risks become even more important. Therefore, to ensure the reliability of the power system, it is important to comply with technical limitations regardless of economic factors. The electricity market affects the transmission of power, which necessitates taking into account commercial aspects when ensuring stability.
The voltage in the system nodes affects the efficiency of consumers, and its deviation can lead to a voltage collapse. This is prevented by regulating reactive power, load, and line capacity. Traditional methods for assessing voltage stability are based on deterministic approaches that do not take into account the uncertainty of input data. The introduction of a probabilistic approach allows for more accurate risk assessment. Research suggests indicators for assessing stability, including sensitivity factors, safety indicators, and allowable load. The Monte Carlo method and other probabilistic methods are used to model random scenarios and predict risks.
For a more detailed understanding of the proposed methodology, let us look at its technical aspects and practical application in modern power systems.
This approach makes it possible to estimate the expected economic losses associated with power grid disruptions and make informed decisions on the economic operation of the system. Risk analysis helps to assess the likelihood of instability and possible economic consequences, such as unmet demand and energy losses. An important aspect is to take into account the economic consequences of disturbances, such as thermal overload of equipment and voltage instability. The application of risk assessment methods in the energy sector has analogies in the nuclear power industry, and automotive and medical fields. The proposed method combines a probabilistic approach to stress assessment and a deterministic approach to determining its sensitivity limits, which increases the efficiency of management decisions.
The developed models and algorithms can be used to make informed management decisions and minimize economic losses. However, further research could focus on expanding the theoretical framework and applying these methods in different power systems to improve their efficiency and reliability. In general, the study contributes to the development of a methodology for risk assessment in the energy sector, especially in the context of market relations and ensuring the quality of the electricity supply.

4. Conclusions

This paper investigates processes in power systems and determines the need to take them into account in market conditions in the form of risks. This makes it possible to take into account the requirements of business entities regarding voltage regimes, which further makes it possible not only to identify and prevent adverse events, but also to predict the risk of their occurrence and make the best decision for the given conditions.
The research results show that power grid modes are managed mainly according to the technical criterion, while the economic criterion is taken into account through complex and inaccurate models. The formation of market relations in the energy sector transforms power systems into business entities, where electricity becomes a commodity with appropriate price and quality characteristics. This requires risk assessment as an economic category. The risk assessment methodology allows us to minimize adverse events and make optimal decisions, although its imperfection makes it difficult to apply in the energy sector.
Management decisions are divided into three levels: under conditions of certainty (deterministic outcomes), under conditions of risk (there is a probability of consequences), and under conditions of uncertainty (no information about the consequences). Scientific publications mostly consider only the first two levels, while the operation of power systems is accompanied by high uncertainty, especially at the upper levels. The implementation of algorithms for controlling grid modes allows us to ensure a reliable power supply to consumers, taking into account this uncertainty. The paper is devoted to determining the risk of a voltage drop taking into account load uncertainty. A mathematical model of a voltage drop risk and an algorithm for its calculation are proposed.
The article further proposes a methodology for calculating the numerical value of the risk of avalanche stress among consumers, taking into account the uncertainty of the initial information and its expected impact on consumers. This approach is especially relevant for distributed power grids.
For a more detailed understanding of the proposed methodology, let us consider its practical application and the results of analysis under specific operating conditions.
For a group load of household electricity consumers and an average voltage deviation of 0.85 (below average) and 0.15 (above average) with a standard deviation of 0.02, it was determined that a voltage reduction of 0.85 can be expected to reduce the load by at least half. Conversely, at a voltage of 1.15, more than half of the load may be lost.
These findings confirm that, with a standard deviation of 0.02, a voltage reduction to 0.85 results in at least a halving of the load, while an increase to 1.15 results in a loss of more than half of the load.
Further research that would add value to this topic could be related to the analysis of existing forecasting methods and comparison with the proposed method. The result of such an analysis should be to determine the effectiveness of this approach for the different operating conditions of power systems.

Author Contributions

Investigation, K.Š.; Resources, R.G., V.P. and K.Š.; Writing—original draft, P.H. and R.T.; Writing—review & editing, P.H. and R.T.; Project administration, R.G. and V.P. All authors have read and agreed to the published version of the manuscript.

Funding

This research received no external funding.

Data Availability Statement

The original contributions presented in this study are included in the article. Further inquiries can be directed to the corresponding author(s).

Conflicts of Interest

The authors declare no conflict of interest.

References

  1. Hovorov, P.; Kindinava, A.; Hovorov, V.; Abdelrhim, O. Control of Modes of Power Supply and Lighting Systems of Cities Based on the Concept of Smart-Grid. In Proceedings of the 2022 IEEE 8th International Conference on Energy Smart Systems (ESS), Kyiv, Ukraine, 12–14 October 2022; pp. 21–25. [Google Scholar] [CrossRef]
  2. Prokhorova, V.; Budanov, M.; Budanov, P. Devising an integrated methodology for energy safety assessment at an industrial power-generating enterprise. East.-Eur. J. Enterp. Technol. 2024, 130, 118–131. [Google Scholar] [CrossRef]
  3. Lezhniuk, P.; Rubanenko, O.; Komar, V.; Sikorska, O. The Sensitivity of the Model of the Process Making the Optimal Decision for Electric Power Systems in Relative Units. In Proceedings of the 2020 IEEE KhPI Week on Advanced Technology (KhPIWeek), Kharkiv, Ukraine, 5–10 October 2020; pp. 247–252. [Google Scholar] [CrossRef]
  4. Zharkin, A.F.; Novskiy, V.O.; Popov, V.A.; Yarmoliuk, O.S. Improving the Efficiency of Distribution Network Control Under the Conditions of Application of Distributed Sources Generation of Electrical Energy and Means of Its Accumulation. Tech. Electrodyn. 2021, 2021, 37–43. [Google Scholar] [CrossRef]
  5. Zharkin, A.; Pazieiev, A. Analysis of dynamic instability of output voltage in active power factor correctors. In Proceedings of the 2020 IEEE KhPI Week on Advanced Technology (KhPIWeek), Kharkiv, Ukraine, 5–10 October 2020; pp. 411–414. [Google Scholar] [CrossRef]
  6. Zharkin, F.; Palachov, S.O.; Pazieyev, A.G.; Malakhatka, D.O. Determination of optimal characteristics of devices for voltage unbalance reducing in low voltage electric networks. Tech. Electrodyn. 2020, 2020, 43–46. [Google Scholar] [CrossRef]
  7. Alhelou, H.H.; Hamedani-Golshan, M.E.; Njenda, T.C.; Siano, P. A survey on power system blackout and cascading events: Research motivations and challenges. Energies 2019, 12, 682. [Google Scholar] [CrossRef]
  8. Sun, H.; Guo, Q.; Qi, J.; Ajjarapu, V.; Bravo, R.; Chow, J.; Li, Z.; Moghe, R.; Nasr-Azadani, E.; Tamrakar, U.; et al. Review of Challenges and Research Opportunities for Voltage Control in Smart Grids. IEEE Trans. Power Syst. 2019, 34, 2790–2801. [Google Scholar] [CrossRef]
  9. Sovacool, B.K.; Furszyfer Del Rio, D.D. Smart home technologies in Europe: A critical review of concepts, benefits, risks and policies. Renew. Sustain. Energy Rev. 2020, 120, 109663. [Google Scholar] [CrossRef]
  10. Ahmad, T.; Zhu, H.; Zhang, D.; AlGhamdi, A.S.; Alshamrani, S.S. Energetics Systems and artificial intelligence: Applications of industry 4.0. Energy Rep. 2022, 8, 334–361. [Google Scholar] [CrossRef]
  11. Hovorov, P.; Hovorov, V.; Kindinova, A. Modeling of processes in a voltage-boosting transformer as an element of Smart-Grid power systems. In Proceedings of the 2021 IEEE 62nd International Scientific Conference on Power and Electrical Engineering of Riga Technical University (RTUCON), Riga, Latvia, 15–17 November 2021; pp. 1–4. [Google Scholar] [CrossRef]
  12. Scheiter, M.; Valentine, A.; Sambridge, M. Upscaling and downscaling Monte Carlo ensembles with generative models. Geophys. J. Int. 2022, 230, 916–931. [Google Scholar] [CrossRef]
  13. Trishch, R.; Cherniak, O.; Zdenek, D.; Petraskevicius, V. Assessment of the occupational health and safety manage-ment system by qualimetric methods. Eng. Manag. Prod. Serv. 2024, 16, 118–127. [Google Scholar] [CrossRef]
  14. Jeevith, H.; Børge, R. Applications of machine learning methods for engineering risk assessment—A review. Saf. Sci. 2020, 122, 104492. [Google Scholar] [CrossRef]
  15. Cherniak, O.; Trishch, R.; Ginevičius, R.; Nechuiviter, O.; Burdeina, V. Methodology for Assessing the Processes of the Occupational Safety Management System Using Functional Dependencies. In Integrated Computer Technologies in Mechanical Engineering—2023. ICTM 2023; Lecture Notes in Networks and Systems; Springer: Cham, Switzerland, 2024; Volume 996, pp. 3–13. [Google Scholar] [CrossRef]
  16. Hrinchenko, H.; Trisch, R.; Burdeina, V.; Chelysheva, S. Algorithm of technical diagnostics of the complicated damage to the continued resource of the circulation pipeline of the nuclear power plant. Probl. At. Sci. Technol. 2019, 120, 104–110. [Google Scholar] [CrossRef]
  17. Khomiak, E.; Trishch, R.; Zabolotnyi, O.; Cherniak, O.; Lutai, L.; Katrich, O. Automated Mode of Improvement of the Quality Control System for Nuclear Reactor Fuel Element Shell Tightness. In Information Technology for Education, Science, and Technics, ITEST 2024; Lecture Notes on Data Engineering and Communications Technologies; Emil, F., Yurii, T., Tero, V., Olena, D., Maksym, B., Constantine, B., Grygoriy, Z., Eds.; Springer: Cham, Switzerland, 2024; Volume 221, pp. 79–91. [Google Scholar] [CrossRef]
  18. Khomiak, E.; Burdeina, V.; Cherniak, O.; Olesia, N.; Bubela, T. Improving the Method of Quality Control of the Fuel Element Shell in Order to Improve the Safety of a Nuclear Reactor. In Integrated Computer Technologies in Mechanical Engineering—2023. ICTM 2023; Lecture Notes in Networks and Systems; Springer: Cham, Switzerland, 2024; Volume 1008, pp. 351–360. [Google Scholar] [CrossRef]
  19. Markulik, Š.; Šolc, M.; Blaško, P. Use of Risk Management to Support Business Sustainability in the Automotive Industry. Sustainability 2024, 16, 4308. [Google Scholar] [CrossRef]
  20. Dyadyura, K.; Slyuz, A.; Vysotsky, I.Y.; Bubela, T.; Cherniak, O. Decision Support Algorithm at the Life Cycle Stages of Medical Devices Based on the Application of Markov Process. In Integrated Computer Technologies in Mechanical Engineering—2023. ICTM 2023; Lecture Notes in Networks and Systems; Nechyporuk, M., Pavlikov, V., Krytskyi, D., Eds.; Springer: Cham, Switzerland, 2024; Volume 996, pp. 87–97. [Google Scholar] [CrossRef]
  21. Kumar, M.; Epiphaniou, G.; Maple, C. Comprehensive Threat Analysis in Additive Manufacturing Supply Chain: A Hybrid Qualitative and Quantitative Risk Assessment Framework. Prod. Eng. Res. Devel 2024, 18, 955–973. [Google Scholar] [CrossRef]
  22. Kupriyanov, O.; Trishch, R.; Dichev, D.; Kupriianova, K. A General Approach for Tolerance Control in Quality Assessment for Technology Quality Analysis. In Grabchenko’s International Conference on Advanced Manufacturing Processes; Lecture Notes in Mechanical Engineering; Springer: Cham, Switzerland, 2023; pp. 330–339. [Google Scholar] [CrossRef]
  23. Riabchykov, M.; Alexandrov, A.; Trishch, R.; Nikulina, A.; Korolyova, N. Prospects for the Development of Smart Clothing with the Use of Textile Materials with Magnetic Properties|Možnosti za razvoj pametnih oblačil z uporabo tekstilnih materialov z magnetnimi lastnostmi. Tekstilec 2022, 65, 36–43. [Google Scholar] [CrossRef]
  24. Mahmud, K.; Sahoo, A.K.; Fernandez, E.; Sanjeevikumar, P.; Holm-Nielsen, J.B. Computational Tools for Modeling and Analysis of Power Generation and Transmission Systems of the Smart Grid. IEEE Syst. J. 2020, 14, 3641–3652. [Google Scholar] [CrossRef]
  25. Ahmad, T.; Zhang, D.; Huang, C. Methodological framework for short-and medium-term energy, solar and wind power forecasting with stochastic-based machine learning approach to monetary and energy policy applications. Energy 2021, 231, 120911. [Google Scholar] [CrossRef]
  26. Huang, C.; Zhang, H.; Song, Y.; Wang, L.; Ahmad, T.; Luo, X. Demand Response for Industrial Micro-Grid Considering Photovoltaic Power Uncertainty and Battery Operational Cost. IEEE Trans. Smart Grid 2021, 12, 3043–3055. [Google Scholar] [CrossRef]
  27. Ahmad, T.; Zhang, D. Using the internet of things in smart energy systems and networks. Sustain. Cities Soc. 2021, 68, 102783. [Google Scholar] [CrossRef]
  28. Suman, S. Artificial intelligence in nuclear industry: Chimera or solution. J. Clean. Prod. 2021, 278, 124022. [Google Scholar] [CrossRef]
  29. Kiran, P.; Chandrakala, K.V. New interactive agent based reinforcement learning approach towards smart generator bidding in electricity market with micro grid integration. Appl. Soft Comput. 2020, 97, 106762. [Google Scholar] [CrossRef]
  30. Chang, C.-L.; McAleer, M.; Wang, Y.A. Herding behaviour in energy stock markets during the Global Financial Crisis, SARS, and ongoing COVID-19. Renew. Sustain. Energy Rev. 2020, 134, 110349. [Google Scholar] [CrossRef] [PubMed]
  31. Garcia, C.I.; Grasso, F.; Luchetta, A.; Piccirilli, M.C.; Paolucci, L.; Talluri, G. A comparison of power quality disturbance detection and classification methods using CNN, LSTM and CNN-LSTM. Appl. Sci. 2020, 10, 6755. [Google Scholar] [CrossRef]
  32. Mahela, O.P.; Khan, B.; Alhelou, H.H.; Tanwar, S. Assessment of power quality in the utility grid integrated with wind energy generation. IET Power Electron. 2020, 13, 2917–2925. [Google Scholar]
  33. Kharrazi, A.; Sreeram, V.; Mishra, Y. Assessment techniques of the impact of grid-tied rooftop photovoltaic generation on the power quality of low voltage distribution network—A review. Renew. Sustain. Energy Rev. 2020, 120, 109643. [Google Scholar]
  34. Martinez, R.; Castro, P.; Arroyo, A.; Manana, M.; Galan, N.; Moreno, F.S.; Bustamante, S.; Laso, A. Techniques to Locate the Origin of Power Quality Disturbances in a Power System: A Review. Sustainability 2022, 14, 7428. [Google Scholar] [CrossRef]
  35. Ciontea, C.I.; Iov, F. A Study of Load Imbalance Influence on Power Quality Assessment for Distribution Networks. Electricity 2021, 2, 77–90. [Google Scholar] [CrossRef]
  36. Adewumi, O.B.; Fotis, G.; Vita, V.; Nankoo, D.; Ekonomou, L. The Impact of Distributed Energy Storage on Distribution and Transmission Networks’ Power Quality. Appl. Sci. 2022, 12, 6466. [Google Scholar] [CrossRef]
  37. Toopshekan, A.; Yousefi, H.; Astaraei, F.R. Technical, economic, and performance analysis of a hybrid energy system using a novel dispatch strategy. Energy 2020, 213, 118850. [Google Scholar] [CrossRef]
  38. Ledesma, J.J.G.; do Nascimento, K.B.; de Araujo, L.R.; Penido, D.R.R. A two-level ANN-based method using synchronized measurements to locate high-impedance fault in distribution systems. Electr. Power Syst. Res. 2020, 188, 106576. [Google Scholar] [CrossRef]
  39. Badiei, A.; Akhlaghi, Y.G.; Zhao, X.; Shittu, S.; Xiao, X.; Li, J.; Fan, Y.; Li, G. A chronological review of advances in solar assisted heat pump technology in 21st century. Renew. Sustain. Energy Rev. 2020, 132, 110132. [Google Scholar] [CrossRef]
  40. Ali, M.; Prasad, R.; Xiang, Y.; Deo, R.C. Near real-time significant wave height forecasting with hybridized multiple linear regression algorithms. Renew. Sustain. Energy Rev. 2020, 132, 110003. [Google Scholar] [CrossRef]
  41. Bracale, A.; Caramia, P.; De Falco, P.; Hong, T. A Multivariate Approach to Probabilistic Industrial Load Forecasting. Electr. Power Syst. Res. 2020, 187, 106430. [Google Scholar] [CrossRef]
  42. Ramirez, A.D.; Boero, A.; Rivela, B.; Melendres, A.M.; Espinoza, S.; Salas, D.A. Life cycle methods to analyze the environmental sustainability of electricity generation in Ecuador: Is decarbonization the right path. Renew. Sustain. Energy Rev. 2020, 134, 110373. [Google Scholar] [CrossRef]
  43. Shi, Z.; Yao, W.; Li, Z.; Zeng, L.; Zhao, Y.; Zhang, R.; Tang, Y.; Wen, J. Artificial intelligence techniques for stability analysis and control in smart grids: Methodologies, applications, challenges and future directions. Appl. Energy 2020, 278, 115733. [Google Scholar] [CrossRef]
  44. Kaya, S.K.; Erginel, N. Futuristic airport: A sustainable airport design by integrating hesitant fuzzy SWARA and hesitant fuzzy sustainable quality function deployment. J. Clean. Prod. 2020, 275, 123880. [Google Scholar] [CrossRef]
  45. Matemilola, S.; Fadeyi, O.; Sijuade, T. Paris Agreement. In Encyclopedia of Sustainable Management; Idowu, S., Schmidpeter, R., Capaldi, N., Zu, L., Del Baldo, M., Abreu, R., Eds.; Springer: Cham, Switzerland, 2020. [Google Scholar] [CrossRef]
  46. Atitallah, S.B.; Driss, M.; Boulila, W.; Ghézala, H.B. Leveraging Deep Learning and IoT big data analytics to support the smart cities development: Review and future directions. Comput. Sci. Rev. 2020, 38, 100303. [Google Scholar] [CrossRef]
  47. Aly, H.H. A novel deep learning intelligent clustered hybrid models for wind speed and power forecasting. Energy 2020, 213, 118773. [Google Scholar] [CrossRef]
  48. Yun, J.; Jayababu, N.; Kim, D. Self-powered transparent and flexible touchpad based on triboelectricity towards artificial intelligence. Nano Energy 2020, 78, 105325. [Google Scholar] [CrossRef]
  49. Tushar, W.; Saha, T.K.; Yuen, C.; Smith, D.; Ashworth, P.; Poor, H.V.; Basnet, S. Challenges and prospects for negawatt trading in light of recent technological developments. Nat. Energy 2020, 5, 834–841. [Google Scholar] [CrossRef]
  50. Bienvenido-Huertas, D.; Farinha, F.; Oliveira, M.J.; Silva, E.M.; Lança, R. Comparison of artificial intelligence algorithms to estimate sustainability indicators. Sustain. Cities Soc. 2020, 63, 102430. [Google Scholar] [CrossRef]
  51. Chen, L.; Wu, J.; Wu, F.; Tang, H.; Li, C.; Xiong, Y. Energy flow optimization method for multi-energy system oriented to combined cooling, heating and power. Energy 2020, 211, 118536. [Google Scholar] [CrossRef]
  52. Adjerid, H.; Maouche, A.R. Multi-Agent system-based decentralized state estimation method for active distribution networks. Comput. Electr. Eng. 2020, 86, 106652. [Google Scholar]
  53. Ruhnau, O.; Hennig, P.; Madlener, R. Economic implications of forecasting electricity generation from variable renewable energy sources. Renew. Energy 2020, 161, 1318–1327. [Google Scholar] [CrossRef]
  54. Nguyen, M.T.; Truong, L.H.; Tran, T.T.; Chien, C.F. Artificial intelligence based data processing algorithm for video surveillance to empower industry 3.5. Comput. Ind. Eng. 2020, 148, 106671. [Google Scholar] [CrossRef]
  55. Hsu, C.Y.; Chen, W.J.; Chien, J.C. Similarity matching of wafer bin maps for manufacturing intelligence to empower Industry 3.5 for semiconductor manufacturing. Comput. Ind. Eng. 2020, 142, 106358. [Google Scholar] [CrossRef]
  56. Xu, Z.; Zheng, Z.; Gao, X. Energy-efficient steelmaking-continuous casting scheduling problem with temperature constraints and its solution using a multi-objective hybrid genetic algorithm with local search. Appl. Soft Comput. 2020, 95, 106554. [Google Scholar] [CrossRef]
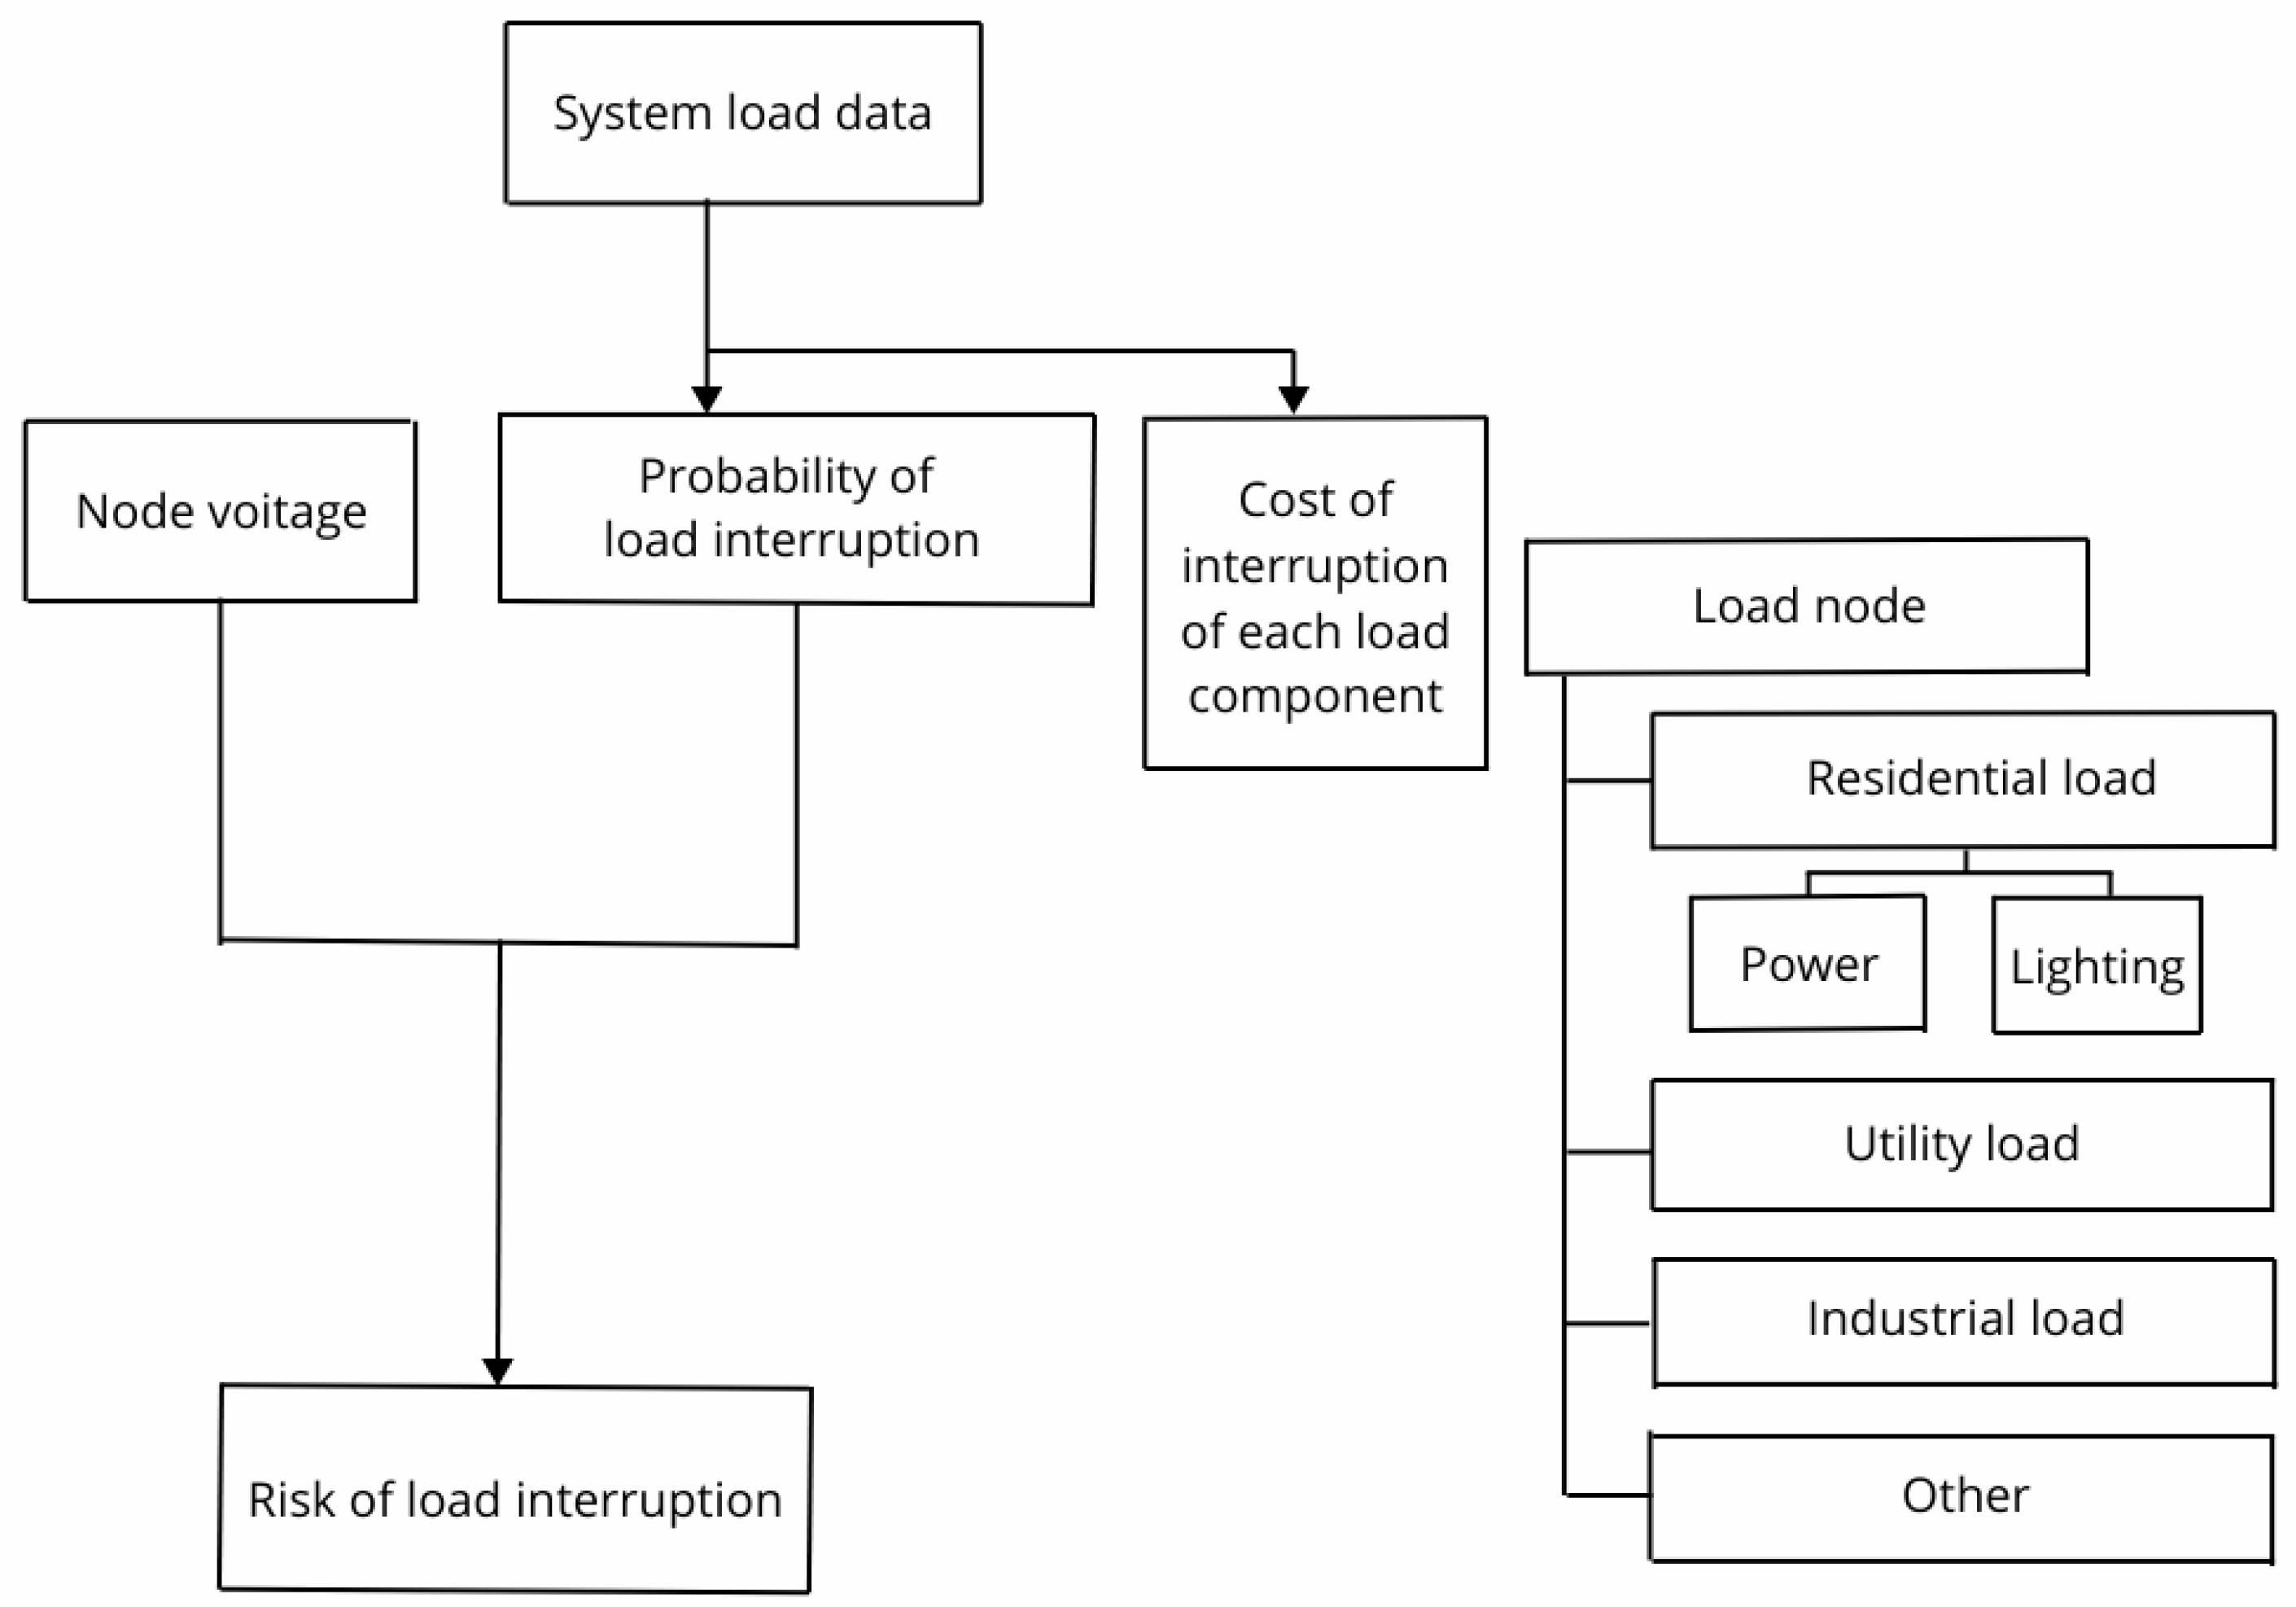
Figure 1. Diagram block of the study of the voltage risk component.
Energies 18 01579 g001
Figure 2. Diagram of risk dependence on voltage in a node.
Energies 18 01579 g002
Figure 3. Graph of risk versus voltage in a node.
Energies 18 01579 g003
Table 1. Limit voltage deviation values for loads.
DeviceVoltage Level
Communication equipment±5%
Computers, data processing equipment±10%
Motor starters
Lightingfrom −15% to +10%
Luminescent−10%, +25%
Incandescent lamp=18%
Motors, standard starting±10%
Resistive loads, furnaces, heaters, etc.Hesitates
OtherHesitates
Table 2. Evaluation results under different emergency conditions.
Emergency SituationProbability of OccurrenceCapacity Load
(×100 MW)
No irregularities in operation0.999940.70
Disorderly conduct 130-1204.58 × 10−539.14
Disorderly conduct 230-1304.58 × 10−537.32
Disorderly conduct 230-1204.58 × 10−536.89
Table 3. Random nature of the possible load due to uncertain load-sharing factors.
Emergency SituationProbability of OccurrenceExpected Load ×100 MWStandard Deviation ×100 MW
No irregularities in operation0.999940.700.3839
No irregularities in operation 130-1204.58 × 10−539.140.4179
No irregularities in operation 230-1304.58 × 10−537.320.3970
No irregularities in operation 230-1204.58 × 10−536.890.3353
Table 4. Random nature of the load boundary.
Emergency SituationProbability of OccurrenceExpected Load ×100 MWStandard Deviation ×100 MW
No irregularities in operation4.700.81604.3 × 10−9
No irregularities in operation 130-1203.140.83258.0 × 10−5
No irregularities in operation 230-1301.320.82250.0547
No irregularities in operation 230-1200.890.79420.1306
Disclaimer/Publisher’s Note: The statements, opinions and data contained in all publications are solely those of the individual author(s) and contributor(s) and not of MDPI and/or the editor(s). MDPI and/or the editor(s) disclaim responsibility for any injury to people or property resulting from any ideas, methods, instructions or products referred to in the content.