Abstract
This article analyzes the path towards achieving electric energy independence for dormitories. It examines electricity consumption in dormitories to determine the necessary volume for daily electrochemical energy storage systems, seasonal hydrogen storage system capacity, and photovoltaic (PV) system power. Electricity consumption data from dormitories between 2021 and 2024 were analyzed, showing hourly, daily, and monthly trends. The study developed a mathematical model of hourly electric energy usage and production in Matlab/Simulink to optimize the photovoltaic (PV) system, increase self-consumption potential, and enhance surplus energy storage. This enabled the selection of capacities for daily and seasonal storage, along with PV system power to meet dormitory energy needs, particularly in autumn and winter. The software accommodates monthly energy consumption profiles and PV system characteristics, allowing for the estimation of electric energy surplus after usage by inhabitants for hydrogen production and storage. The study offers a comprehensive framework for sustainable electric energy management in student housing.
1. Introduction
The long-term changes in the climate underscore the urgent need for decisive action to curb the rise in Earth’s average temperature, primarily through the reduction in greenhouse gas emissions. In 1897, Professor Svante Arrhenius, in his article On the Influence of Carbonic Acid in the Air upon the Temperature of the Ground [1], was among the first researchers to highlight the impact of atmospheric carbon dioxide (CO2) levels on the rise in global temperature. Through his research, he laid the foundations for the discovery of the phenomenon that we now know today as the greenhouse effect. Figure 1 illustrates the relative increase in the temperature of the globe’s surface in the period 1880–2024, caused by the greenhouse effect [2]. It is currently at the level of 1.1 degrees Celsius in relation to the years 1880–1900. A clear increase in the temperature of the globe’s surface has been visible since 1960, accompanied by an increase in the concentration of CO2 in the atmosphere. Figure 2 [2] illustrates the increase in atmospheric CO2 levels from 1880 to 2024, showing a rise from 315 ppm in 1960 to 425 ppm in 2024.
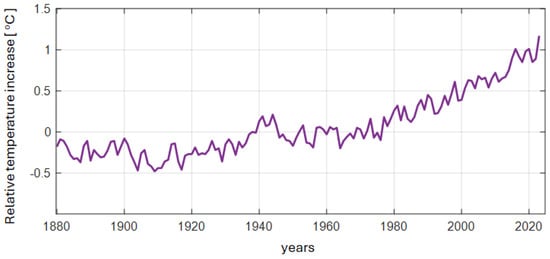
Figure 1.
Relative global temperature increase according to the period 1880–1990 in the range of 1880–2023 [2].
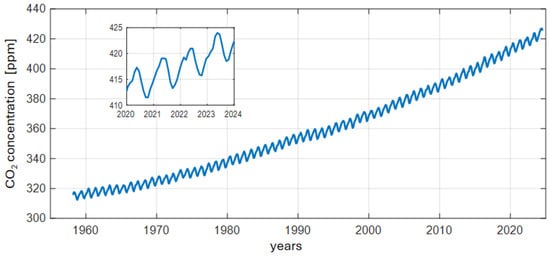
Figure 2.
Increase in the CO2 concentration in the atmosphere in the years 1956–2024 [2].
This upward trend is no longer significantly limited by seasonal plant vegetation (see subplot in Figure 2), which causes a periodic decrease of up to 4–5 ppm, but this does not change the general upward trend of CO2 concentration. The following climate changes [3], confirmed by many years of observations, result largely from greenhouse gas emissions (carbon dioxide—CO2; methane—CH4; nitrous oxide—N2O; and gases used in the energy industry, such as hexafluoride sulfur—SF6), electricity production from fossil fuels (hard coal, brown coal, crude oil and natural gas), steel and cement production, exhaust emissions related to land, sea and air transport, breeding ungulates [4], and so-called low emissions in households. One way to reduce the low emission in households is the implementation of the photovoltaic microgrid for electric energy generation, which should also be equipped with a properly selected energy storage system.
The effective selection of a photovoltaic (PV) system connected to the electricity distribution network and intended for existing buildings, aimed at achieving their annual energy autonomy, is crucial for several key reasons:
- Oversized photovoltaic systems without energy storage can only meet the current electricity demand of the facility during periods of strong and moderate sunlight. The surplus energy is fed into the power grid, which may cause the distribution network voltage limits to be exceeded. As a result, this can lead to the shutdown of photovoltaic systems, forcing the recipient to draw energy from the grid. As indicated in [5], excess energy generated by photovoltaic systems may necessitate feeding the surplus into the grid, ultimately leading to system shutdowns. Optimizing the power of PV systems and the capacity of energy storage systems is vital to minimize energy costs and enhance the self-sufficiency of households. Furthermore, Chub [6] suggests that the use of variable DC connection voltage in microinverters can increase system efficiency by 2% per year, reducing energy losses and improving the overall efficiency of the PV system.
- A large number of oversized photovoltaic systems and the resulting overproduction of energy can lead to current overloads in the local grid. As shown in [7], increasing the capacity of PV systems in the distribution network can exceed the grid’s hosting capacity (HC), causing voltage regulation issues and reverse energy flows. The introduction of solutions like energy storage can help increase the allowable level of PV connections, but challenges remain due to the high penetration of renewable energy into the grid. Similarly, Boeckl [8] emphasizes the importance of selecting the right power for PV system and energy storage systems based on household type to prevent grid overloads, especially during peak hours.
- The electricity consumption profiles of consumers depend on their activities and exhibit significant variability throughout the day. Domestic consumers typically use the most energy in the late afternoon, evening, and night, while businesses such as shops, offices, and manufacturing plants consume the most energy during working hours, typically in the morning, noon, and afternoon. The use of cooling systems in homes, offices, or production facilities leads to distorted energy consumption profiles throughout the day. As pointed out in [9], variable weather conditions, such as sunlight, air temperature, or shading, affect the performance of PV systems and their ability to adapt to different energy consumption profiles throughout the day. With better weather classification and improved PV technologies, system power can be more precisely matched to users’ changing energy needs, leading to greater efficiency of the photovoltaic system.
- A photovoltaic system with too small a power that limits or eliminates surplus energy will provide small savings to consumers but will not be satisfactory. As noted in [8], the correct selection of photovoltaic system power depends on the household type. A too-small system will not be able to fully meet the energy demand, especially during peak hours, resulting in only modest savings. On the other hand, oversizing the installation combined with appropriate energy storage yields better results, though the value of excess energy for storage must be carefully matched to the user’s needs. Similarly, Hazim [10] emphasizes that optimal sizing of the PV system is crucial for maximizing savings and energy efficiency, taking into account both energy production and minimizing costs related to improper inverter sizing.
- Photovoltaic systems with short-term storage provide self-sufficiency only during the summer, with energy being drawn from the grid during spring, autumn, and winter. As shown in [11], PV systems, especially those with energy storage, can ensure self-sufficiency throughout the year, but only if the storage capacity is matched to demand at different times of the year. Excessive storage capacity may lead to reduced economic benefits, while insufficient capacity will fail to provide adequate autonomy in the winter months. This approach is crucial for achieving energy stability in the context of fluctuating energy demand throughout the year.
- Building awareness of CO2 reduction and climate neutrality is vital. As Wiryadinata [12] indicates, transitioning to CO2-neutral energy systems, including the use of photovoltaics, is key to achieving carbon neutrality goals. This study highlights how integrating renewable energy sources such as photovoltaics can help reduce CO2 emissions, minimizing the environmental impact. Additionally, Suchithra [13] underscores that the sustainable integration of distributed energy sources and storage technologies in distribution networks has the potential to reduce greenhouse gas emissions and improve energy management efficiency in the context of renewable energy sources.
The introduction of a new electricity supply system for student dormitories, generated by a PV system [14,15] and stored in both daily and seasonal storage, is driven by several factors: the need to mitigate the impact of rising electricity prices caused by the COVID-19 pandemic [16,17] and the unstable international situation (including the conflicts in Ukraine, Palestine, and Syria); a response to ongoing climate change [3]; the testing of technical solutions aimed at reducing current building operation costs [18]; and the desire to build a positive image by showcasing good practices [19,20] in municipal construction for energy transformation.
Studies [21,22] exemplify systems that integrate photovoltaic (PV) technology, battery storage, and hydrogen production. In Ref. [21], a 10 kW photovoltaic system, combined with lithium battery storage and hydrogen production via electrolysis, is tested to address the volatility of renewable energy. This system can supply energy for up to 3 h, even when photovoltaic generation is unavailable, offering a reliable off-grid solution. The study in Ref. [22] extends this concept to institutional buildings targeting net-zero energy. The study presents an optimized system that combines a 100 kW photovoltaic system, 32 wind turbines, and hydrogen production through a 10 kW PEM electrolyzer and a 30 kW fuel cell to meet the 72 kW daily energy demand of an institutional building in southern India.
Both studies demonstrate the potential of integrating renewable technologies to enhance energy reliability, sustainability, and cost-effectiveness across various applications, from off-grid solutions to institutional buildings aiming for net-zero energy. However, the proposed solutions will not ensure electricity self-sufficiency during challenging autumn, winter, and spring conditions in the European geographical zone in which Poland is located.
The goal of this project is to develop a power supply system that includes a photovoltaic system, short-term electrochemical storage, and long-term hydrogen storage to eliminate the need for electricity exchange with the grid. This system aims to capture excess energy from the PV system, store it in short-term storage, and use it to produce hydrogen. The stored hydrogen will then be converted back into electricity, mainly during the autumn, winter, and spring seasons. The selection of the photovoltaic system’s power is based on real electricity consumption data from a student dormitory over three years, as well as statistical data on the PV system’s production capacity. The following chapters present an analysis of the dormitory’s electricity consumption, a method for determining the statistical daily electricity consumption profiles (which vary by month), and a mathematical model to calculate the energy produced, energy drawn from the grid, energy generated for self-consumption, and surplus energy that can be stored for hydrogen production and storage. The analysis conducted in the chapters below proves that a photovoltaic system with a capacity of 100 kWp, coupled with a 300 kWh electrochemical storage system and a 100 kg hydrogen energy storage system, will ensure energy self-sufficiency for the dormitory throughout the academic year.
2. Analysis of Electricity Consumption in Dormitory
The subject of this analysis was the five-story Karolinka dormitory, consisting of 9 single rooms and 70 double rooms. The dormitory, under standard conditions, can accommodate 151 people. A photovoltaic system with a maximum power of 49.98 kWp was built on the roof of this building in February 2024. This dormitory is equipped with an IPOE intelligent platform for energy saving (produced by APA Ltd., Gliwice, Poland) [23]. The IPOE system enables monitoring of the consumption of various utilities, such as electricity, heat, and hot and cold water consumption. It also allows for tracking of electrical network parameters, such as the effective values of phase voltages and currents (including the neutral wire), active, reactive and apparent power, power factors, and values of harmonic content factors of voltages and currents. Additionally, the system monitors electricity production from the photovoltaic system and the operation of reactive power compensators. The IPOE system provides flexible tracking of electricity consumption in each dormitory room separately, as well as for the entire building. The recorded data allow for the preparation of reports on current energy consumption and on energy consumption freely defined during the observation period, most often hourly, daily and monthly. Electricity consumption data can be exported to CSV and XLS files; however, they serve as a starting point for further in-depth analysis. Table 1 presents the monthly electricity consumption in the Karolinka dormitory in the last three academic years (21/22; 22/23; 23/24), which ranges from 0.6 to 12.4 MWh.

Table 1.
Monthly electricity consumption in Karolinka in [MWh] in the last three academic years.
The data from Table 1 are also presented in the form of a bar chart in Figure 3. The academic year in Poland begins on 1 October and ends on 31 September of the following calendar year. Accommodation in student dormitories usually begins in September of each year. Electricity consumption in a student dormitory is closely correlated with the rhythm of student life resulting from class schedules, exam sessions and holiday breaks. From the data presented in Table 1, it can be concluded that, as a general rule, a significant increase in energy consumption occurs in the months of October, November, December and January compared to September. The main reasons for the increase in electricity consumption in this period are the full occupancy of places in the dormitory and the shortening of the day resulting from the autumn–winter season. Looking at the three-year average of electricity consumption, the highest energy usage occurs in October, January and March. The decrease in electricity consumption in February is primarily due to the exam sessions, but above all to the winter break between semesters. In the following months, a renewed increase and stabilization of energy consumption is visible, occurring in the period from March to June. The data presented in Table 1 also show a decrease in electricity consumption in the period July–August–September; this is the period of summer holidays, inter-semester break, and exam and retake sessions.
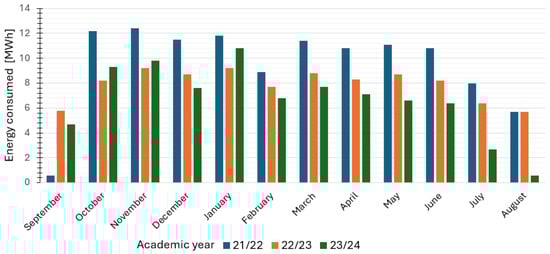
Figure 3.
Summary of monthly electricity consumption in the Karolinka dormitory in [MWh] in academic years 21/22; 22/23; 23/24.
Comparing consecutive academic years, within the three years of observation, a decrease in electricity consumption can be seen on the scale of individual months and years. For a better visualization of electricity consumption, the data summarized in Table 1 are presented in a bar chart in Figure 3. The academic year 21/22 is characterized by the highest annual electricity consumption reaching 115.2 MWh (this is the period of the ongoing COVID-19 pandemic); in the academic year 22/23, we observe a significant decrease in electricity consumption reaching ~18% (94.9 MWh), while the largest decrease in electricity consumption from the power grid is observed in the year 23/24, reaching ~30% compared to the year 21/22 and reaching ~16% compared to the year 22/23. In February 2024, a photovoltaic system began operation, which contributed to a reduction in electricity consumption along with an increase in its production. This decline is particularly visible (Figure 3) in the months of May–August 2024.
The data presented in Table 1 and Figure 3 show that the monthly electricity consumption in the student dormitory is clearly influenced by random events (pandemics), the schedule of classes in the academic year, and days off related to winter and summer holidays as well as Easter and Christmas. The dependence of energy consumption on the seasons, or more precisely on the semesters of the academic year, is also visible. This is due to the greater demand for electricity in the autumn–winter period, i.e., in the winter semester. In the spring–summer season, i.e., in the summer semester, due to the significantly longer day, electricity consumption is lower. Monthly energy consumption values may provide guidance for selecting the capacity of seasonal energy storage when designing and building a photovoltaic system.
Table 2 presents a summary of average daily electricity consumption values in the Karolinka student dormitory, indicating the maximum and minimum daily consumption values over the analyzed academic years. Monthly consumption data for the academic year 21/22 are presented in Figure 4. The maximum daily electricity consumption occurs in November, reaching nearly 490 kWh, while the minimum daily electricity consumption occurs in August, dropping to 160 kWh. The highest average daily energy consumption is recorded in October and November, reaching approx. 400 kWh or more, followed by December and January, where values reach approx. 380 kWh.
Table 2.
Average daily electricity consumption in Karolinka in [kWh], in individual months of academic years 21/22; 22/23; 23/24.

Figure 4.
Average daily electricity consumption in Karolinka in the academic year 21/22.
The situation is slightly different in the next academic year 22/23 for this dormitory. The average daily electricity consumption, shown in Figure 5, approaches approximately 300 kWh in the months of October, November, January, February, April and May. The maximum values occur in the months of November, December, and January at approx. 360 kWh, while the minimum is recorded in April at approx. 60 kWh. In general, there is a decrease in the value of daily electricity consumption in the academic year 22/23 compared to the previous year.
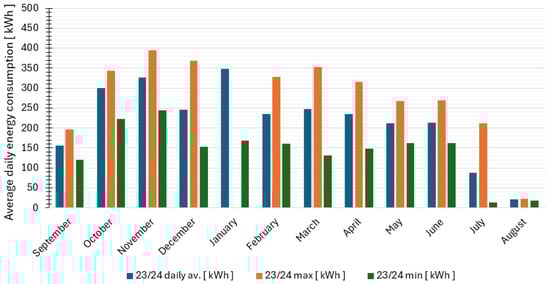
Figure 5.
Average daily electricity consumption in Karolinka in the academic year 22/23.
Figure 6 shows the average daily electricity consumption in the academic year 23/24 for the Karolinka student dormitory. Compared to previous years, the highest average daily energy consumption also occurs in October, November and January, ranging from 300 to 360 kWh.
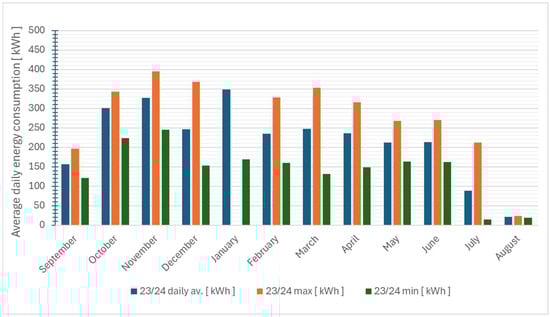
Figure 6.
Average daily electricity consumption in Karolinka in the academic year 23/24.
From February (the moment when the photovoltaic system starts operating), the average daily energy consumption ranges from 200 to 240 kWh, while the maximum daily consumption falls between 320 and 360 kWh. The lowest daily values occur in July and August, at 15 and 20 kWh, respectively.
Figure 7 illustrates the percentage differences in average daily electricity consumption for individual months across the three analyzed academic years. Compared to the pandemic year 21/22, in which the average daily electricity consumption was the highest, energy usage decreased in the subsequent academic years. In the academic year 22/23, the average daily electricity consumption dropped from 33% to 14% depending on the month, which gives an average annual decrease in overall daily energy consumption of 22%. The academic year 23/24, compared to the pandemic year 21/22, shows much greater reductions in average daily electricity consumption from the grid, reaching up to 80%, but on average for the entire year, these decreases amount to 38%. In the middle of the academic year 23/24, the PV system (without energy storage) had already started producing energy. However, while it did not eliminate energy consumption from the power grid, it did help to limit it.
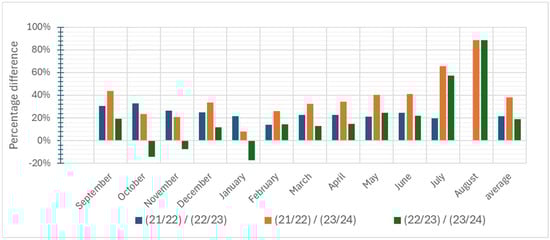
Figure 7.
Percentage differences showing decrease in average daily electricity consumption for individual months of the three academic years.
Comparing the average daily energy consumption in the years 22/23 and 23/24 for the months from February to June, the decrease in energy consumption from the power grid (due to the production of electricity by PV) is in the range of 13% to 24%. In July and August, these reductions are 57% and 80%, respectively. However, this is also influenced by a decrease in the number of tenants as many leave on vacation. During this period, the excess energy produced was fed back to the power grid.
Average daily electricity consumption is an indication for the selection of the maximum capacity for energy storage, particularly short-term, daily energy storage.
Table 3 presents the average hourly electricity consumption in the Karolinka student dormitory. Apart from July, August and September, in each analyzed academic year, the average hourly electricity consumption was higher than 8.8 kWh and lower than 17.2 kWh.
Table 3.
Average hourly electricity consumption in Karolinka in [kWh], in individual months of academic years 21/22; 22/23; 23/24.
The maximum recorded hourly energy consumption did not exceed 33 kWh. For the months from September to December, the difference in average hourly energy consumption values in the pandemic year 21/22 and the year 22/23 ranges from 25% to 32%. Overall, the average difference in average hourly energy consumption between the months of these academic years is 22%. The differences in the values of average hourly energy consumption between the pandemic year 21/22 and the academic year 23/24 are in the range of 8% to 89%, and on average over a 12-month perspective, the difference in average hourly energy consumption values is 39%. Between October and December for the years 22/23 and 23/24, an increase in average hourly energy consumption of 7% to 17% is observed.
The average hourly values and maximum values of average hourly energy consumption may constitute guidelines for selecting the minimum power capacity required for short-term (daily) energy storage.
The data and analyses presented above indicate the following:
- The maximum monthly electricity consumption for the two analyzed dormitories, per dormitory, during the observation period, is approximately 12.5 MWh;
- The maximum daily electricity consumption, per dormitory, during the observation period, is approximately 490 kWh;
- The maximum hourly energy consumption, per dormitory, during the observation period, is approximately 33 kWh.
3. Daily Characteristic Energy Consumption Profiles and PV System Modeling
The information presented in the previous chapter on the nature of electricity consumption in the analyzed student residence provides a general overview of its consumption, as well as the potential capacity and power of daily and seasonal electricity storage facilities. The monthly and annual energy consumption of the dormitories is well documented, providing valuable data for assessing the required capacity of a seasonal electrochemical energy storage system. As well as being well documented, the diurnal energy consumption of the dormitories provides essential data for determining the optimal maximum capacity of a short-term (daily) electrochemical energy storage system. Furthermore, understanding when, during a given day, energy consumption peaks and when it is highest allows us to determine the maximum power of an electrical energy source. However, in order to determine the power of the necessary photovoltaic system and the accompanying storage facility, it is necessary to analyze the electricity consumption profile throughout the day. For this purpose, hourly energy consumption profiles during the day should be developed for individual months of the year. The algorithm based on real measurement data looks as follows:
- 1.
- Electricity consumption data should be collected, containing electricity consumption data for each hour of the day, for each day of a given month. Depending on the length of the month, this file may contain 672 rows of data for 28 days, 720 rows of data for 30 days, and 744 rows of data for 31 days.
- 2.
- The data received in the form of a data vector should be transformed into an array; in the rows of the array, you should place hours (1 to 24), and in the columns, the appropriate, consecutive days. Calculate the average, minimum and maximum values of energy consumption. This procedure allows you to present a characteristic day for each month, illustrating energy consumption during the day. This is known as the daily characteristic profile of energy consumption in a given month. The structure of the tables presenting electricity consumption for individual hours across subsequent days of a month consisting of 31, 30 and 28 days is as follows:For a 31-day month,where and the element represents a column vector consisting of energy used for each full hour of a given day; —pandemic academic year 21/22; —academic years 22/23 and 23/24, respectively. For a 30-day month,where . For a 28-day month,where .
- 3.
- If the observation period spans a multiple of 12 months, for example, 36 months, then when creating a daily characteristic energy consumption profile for a given month, the corresponding months in the observation period should also be taken into account. For an observation covering 36 months, we have three months, e.g., February 2022, February 2023 and February 2024, for which we can calculate the daily characteristic energy consumption profile.
- 4.
- The obtained average energy consumption values for the daily characteristic energy consumption profile (representing a given month) can be approximated by a polynomial function, to facilitate further analysis with smooth functions. The daily characteristic energy consumption profile for the analyzed month, within the range of years of observation, is given by the following formula (arithmetic mean):where ; —energy consumed on i-th day.
Electricity consumption profiles are the subject of many studies, varying significantly depending on geographical location and the nature of the consumer. Pullinger et al. [24] presented, among others, eight typical energy demand profiles in Great Britain, which were identified using cluster analysis. The dominant energy consumption profiles for households are the ‘All daytime’ and ‘Early morning, and evening’ profiles. These studies were conducted in the years 2019–2022. Ponniran et al. [25] presented two typical energy consumption profiles for households and businesses in Malaysia. The profile for households has two distinct peaks—morning and evening—while for the industrial consumer of electricity, the energy consumption is trapezoidal throughout the day, with slight peaks around noon and 5 pm.
Figure 8 and Figure 9 present data according to daily characteristic energy consumption accounted for May and October, represented by original discrete data in the form of bar plots and data approximated by 6-order polynomials. In Table 4, all approximation polynomial coefficients are given for all months. The average difference between discrete data and their approximation is equal to 0.84%; the maximum difference reaches 1.4% (for June) and the minimum difference reaches 0.3% for October. The approximation polynomials of 6 orders have the following general form:
where is the approximation polynomial coefficients, for .
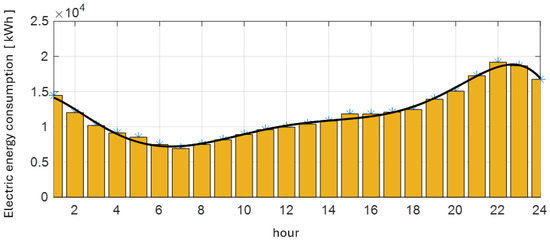
Figure 8.
Daily characteristic energy consumption for May—discrete data (bar plot) and polynomial approximation (continuous black line).
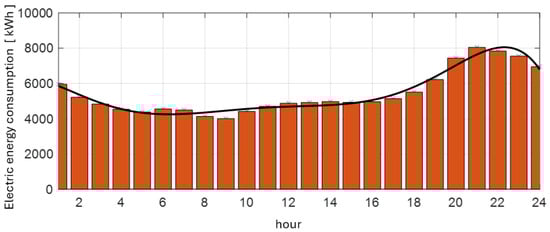
Figure 9.
Daily characteristic energy consumption for October—discrete data (bar plot) and polynomial approximation (continuous black line).
Table 4.
Daily characteristic energy consumption profile approximation polynomial coefficients.
Figure 10 presents a summary of all twelve daily characteristic energy profiles of electricity consumption (one for each month) and their average values from three academic years, approximated by 6th-degree polynomials. The results were obtained after implementing the above polynomial functions in Matlab/Simulink. Each of the coefficients of approximating polynomials was entered into the “Polyval” blocks, for which the input parameter is time (in the range from 1 to 24 h), and the output parameter is the corresponding energy consumption value at that time.
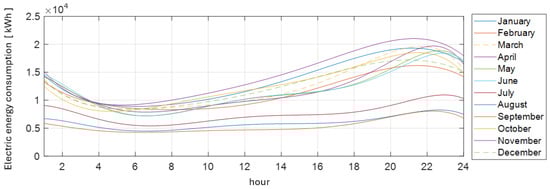
Figure 10.
Approximated daily characteristic energy consumption for all months of analyzed academic years 21/22, 22/23 and 23/24.
The obtained results, presented in Figure 10, were compared with the forecasted long-term electricity production of photovoltaic systems with different maximum capacities (installed capacities). On the website of the European Commission Photovoltaic Geographical Information System (PVGIS) [26], there is online software that allows for examining and verifying the electricity production from a photovoltaic system. The data presented on this website can be used to create a so-called reference model. This software also enables the analysis of archive data for any location in Europe, in the scope of, among others, monthly production of electricity and radiation per 1 square meter of surface. To begin, you need to indicate the location of the photovoltaic system. Then, you need to provide the parameters of the photovoltaic system, such as power, system losses, installation location, panel inclination, azimuth, etc. After performing the calculations, the program displays the forecasted production of the photovoltaic system.
It was assumed that the destination photovoltaic system consists of 320 photovoltaic panels, with a unit area of 1.76 m2 each. The mathematical model of a photovoltaic system was implemented in Matlab/Simulink R2023b software. Table 5 compares the monthly production of a 100 kWp photovoltaic farm, according to PVGIS (reference model), and the monthly production from the mathematical model of a 100 kWp photovoltaic farm consisting of 320 panels. The formulated mathematical model generates energy in the range of months smaller than the PVGIS reference model by 2.75% to 3.5%. The most similar results between the PVGIS reference model and the model formulated for the PV system for the Karolinka dormitory occur for April (2.76%), then for February (3.12%) and August (3.16%).
Table 5.
Comparison between statistical PV 100 kWp (PVGIS) and mathematical model of 100 kWp (PV Karolinka).
4. Modeling of Daily Production, Consumption, Self-Consumption and Overproduction of Energy in Dormitory with PV System
The mathematical model for calculating energy production and utilization in a dormitory, as well as classifying energy usage into categories such as energy consumption from the grid, energy self-consumption from the PV system, and energy overproduction, is presented in Figure 11. The mathematical model was implemented in the Matlab/Simulink program and consists of three main components, as follows:

Figure 11.
Block schema of mathematical model of PV system electric energy production and consumption (ECG), self-consumption (ECPV) and overproduction (Esur) of electric energy in dormitory.
- Daily characteristic energy consumption: This block implements 12 polynomials representing the curve of energy consumption in the dormitory, described in detail in the previous chapter.
- PV production: Inside this block, 12 “Lookup tables” are inserted covering the data of hourly solar irradiation on 1 square meter [26] during the day of a desired month. The solar irradiation is multiplied by the area of solar panels; efficiency is assumed and it is filtered by a lowpass filter (with 15 min time constant). As a result, the outputs show the typical (statistical) hourly electricity production for each month.
- Consumption, self-consumption, and overproduction of energy: This module is based on input signals, such as the daily energy consumption profile and its integral, the PV production integral, and the difference between PV production and daily energy consumption. It calculates the energy usage components, including daily energy consumption and daily energy production. The energy usage components consist of the energy grid consumption, the PV energy self-consumption, and PV energy overproduction.
Table 6 summarizes the results of calculations based on the aforementioned model, providing data on electricity consumption for the student dormitory across statistical days of each month. The table includes the following columns for each statistical day: “Energy consumption”, “PV Energy production”, “PV self-consumption”, “Overproduction from PV”, “Consumption from Grid” and “Energy to storage”. The data in the “Consumption from Grid” column present the sum of electricity drawn from the grid in the evening and at night, when, for obvious reasons, the PV system is not operating. The analysis of the data contained in the columns of Table 6, namely “Overproduction from PV” and “Consumption from the grid”, reveals that the amount of energy produced is almost sufficient to cover the electricity demand of the student house. However, to achieve this, it is necessary to store the surplus of electricity.
Table 6.
Daily production, consumption, self-consumption, and overproduction of energy in dormitory and energy storage potential for 100 kWp PV system.
During certain periods of the year, such as from March to September (inclusive), it is possible to store surplus energy generated by a 100 kWp PV system. To achieve this, a daily electrochemical storage system is required to offset the energy consumed from the grid during the evening and nighttime hours. The capacity of this short-term daily storage should be at least 300 kWh. Such a storage system can be fully charged within a single day and is capable of meeting the energy demands of the student residence for the following day (e.g., from July to September), even in the absence of electricity generation from the PV system (compare the third and fifth columns in Table 6).
The excess accumulated energy should be transferred to seasonal hydrogen storage. Based on the energy values in the “Energy to storage” column (Table 6) for the months of April through September, this surplus energy can also be stored in long-term storage, such as a seasonal hydrogen storage system.
Figure 12a illustrates the daily amount of electric energy stored in short-term storage that is subsequently used for hydrogen production. The negative bars in Figure 12a indicate the energy deficit during winter months. Figure 12b presents bar plots depicting the following:
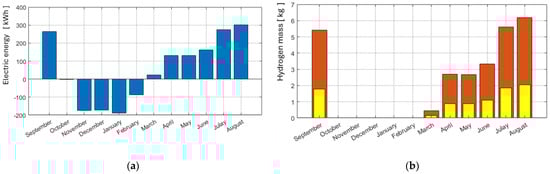
Figure 12.
Daily (a) electric energy surplus and deficit; (b) mass of manufactured and stored hydrogen (orange bars) and mass of hydrogen possible to convert into electric energy (yellow bars).
- The potential for hydrogen production, represented as the positive stored energy from Figure 12a divided by EH2 = 48.87 kWh/kgH2 (energy stored in 1 kg of hydrogen) [27]. The EH2 was calculated assuming 70% electrolysis efficiency, yielding 47.6 kWh/kgH2. Additionally, it was assumed that compression from 20 bar up to 600 bar consumes 1.27 kWh/kgH2 energy [27].
- The mass of hydrogen that can be converted back into electric energy, considering the assumed conversion efficiency of 33% [27]. It was assumed that the LHV is 33.3 kWh/kg of hydrogen and fuel cell efficiency is equal to 50%.
The energy stored in hydrogen within the seasonal storage system, as indicated by the data in Table 7, from March to August, accounts for 79% of the student residence’s energy needs during the winter months, considering the efficiencies of hydrogen compression and electricity production from hydrogen. Between October and February, the total evening and nighttime electricity demand amounts to nearly 19 MWh, while the electricity recoverable from hydrogen storage is approximately 15 MWh.
Table 7.
Electric energy stored (for a single day and single month) in hydrogen over the long term, seasonal storage system and electric energy demands (for a single day and single month).
5. Discussion
The energy consumption patterns in a student dormitory during the academic year are closely aligned with the schedule of educational activities outlined in the academic calendar. Peak energy demand occurs during the initial months of each semester, as well as after holiday breaks, inter-semester intervals, and examination periods. The proposed power supply system for the student dormitory consists of short-term storage, hydrogen storage, a photovoltaic system, a fuel cell, an electrolyzer, and a cooling system that utilizes waste heat for domestic hot water heating and central heating, and it is presented in Figure 13. Additionally, it includes a BMS system that manages the battery charging processes and hydrogen production, as well as controlling the process of electricity production from hydrogen.
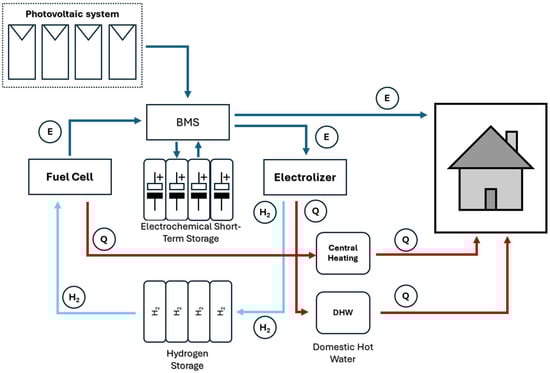
Figure 13.
A block diagram representing the concept of a student dormitory power supply system. The letter ‘E’ denotes the flow of electrical energy, ‘Q’ denotes the flow of waste heat, and ‘H2’ denotes the flow of hydrogen.
Achieving maximum energy independence requires optimizing the self-consumption of generated electricity. Increasing self-consumption during periods of high and stable photovoltaic (PV) production, typically from April to September, is technically feasible. This can be achieved through the integration of short-term energy storage systems.
As demonstrated in Table 6 and Table 7, for dormitories with specific energy consumption [28,29] profiles (illustrated in Figure 10), a daily energy storage capacity of at least 300 kWh can ensure 100% self-consumption. However, under normal production conditions and favorable weather, a 100 kWp PV system may generate excess energy, particularly from July to September, exceeding evening and nighttime demands.
In transitional months like October and March, stored energy will generally suffice to meet demand without overloading storage systems or necessitating excess energy feeding to the grid. However, from April to June, intermediate conditions may arise where surpluses occasionally fill the storage system to capacity.
From November to February, the PV system and short-term storage alone cannot meet the dormitory’s evening and nighttime energy needs. Addressing these challenges requires the implementation of long-term energy storage solutions.
One viable option is the production and storage of hydrogen using surplus energy, with secondary electricity production during winter. Calculations indicate that a combination of a 100 kWp PV system, a daily 300 kWh storage system, and hydrogen-based electricity generation can meet up to 79% of the dormitory’s electricity needs. Additionally, surplus energy generated by the dormitory in July–August (when students are absent or only partially present) could be used for hydrogen production, yielding 5.6 MWh of electricity upon reconversion.
Storing sufficient hydrogen to meet winter demand would require producing nearly 1150 kg of hydrogen. This necessitates constructing a large-scale storage facility to accumulate hydrogen incrementally. While effective, this approach is costly. An alternative strategy could involve a smaller storage system with a capacity of approximately 100 kg of hydrogen, replenished two to three times per month during winter. This approach could balance storage costs with operational efficiency by allowing for hydrogen resale or supplemental purchases during peak demand periods.
6. Conclusions
The analysis presented in this article highlights that achieving energy independence in the student dormitory requires several key measures: expanding the photovoltaic system to a capacity of 100 kWp, integrating an electrochemical energy storage system with a minimum capacity of 300 kWh, and developing a hydrogen storage and production system. For comparison, the existing photovoltaic system with a capacity of 49.98 kWp generates energy surpluses that can be stored long-term only in July, August, and September. These surpluses allow for the production of only 127 kg of hydrogen in total. This amount of hydrogen can cover the additional electricity demand in October. Therefore, it can be concluded that the existing system cannot meet the student dormitory’s year-round electricity demand. However, it can significantly reduce electricity bills during periods outside of autumn, winter, and spring, provided it is equipped with a short-term storage system with a capacity of 150–160 kWh. A 100 kWp photovoltaic system, combined with the proposed 300 kWh storage and hydrogen storage, will ensure electricity self-sufficiency for the student dormitory. An additional benefit of the proposed power supply system for the student dormitory is the ability to utilize waste heat generated during hydrogen production in the electrolyzer and electricity production in the fuel cell. The waste heat from hydrogen production should be used for heating domestic hot water, while the waste heat from the fuel cell should be used to heat water in the central heating system. This provides an additional source of cost reduction for the student dormitory’s operational expenses.
The capacity of the hydrogen storage system should align with the chosen hydrogen management strategy. A practical approach would involve constructing a smaller storage facility with a capacity of 100 kg of hydrogen. This strategy could include selling surplus [30,31] hydrogen during the summer and autumn months and purchasing additional hydrogen in the winter to support electricity production.
Author Contributions
Conceptualization: J.K. and T.T.; methodology: T.T.; software: T.T.; validation: J.K. and T.T.; formal analysis: J.K.; investigation: T.T.; resources: T.T.; writing—review and editing: T.T.; visualization: T.T. and J.K; supervision: J.K. All authors have read and agreed to the published version of the manuscript.
Funding
This research received no external funding.
Data Availability Statement
Dataset available on request from the authors.
Conflicts of Interest
The authors declare no conflicts of interest.
Abbreviations
The following abbreviations are used in this manuscript:
| IPOE | Intelligent platform for energy saving (abbreviation taken from polish: Inteligentna Platforma Oszczędzania Energii) |
| LHV | low heating value |
| PVGIS | Photovoltaic Geographical Information System |
| PV | photovoltaic system |
References
- Arrhenius, S.; Holden, E.S. On the Influence of Carbonic Acid in the Air upon the Temperature of the Earth; Astronomical Society of the Pacific: San Francisco, CA, USA, 1897; Volume 9, pp. 14–24. [Google Scholar]
- The National Aeronautics and Space Administration. Available online: https://climate.nasa.gov/vital-signs/global-temperature/?intent=121 (accessed on 31 December 2024).
- IPCC. 2023: Summary for Policymakers. In Climate Change 2023: Synthesis Report. Contribution of Working Groups I. II and III to the Sixth Assessment Report of the Intergovernmental Panel on Climate Change; Core Writing Team, Lee, H., Romero, J., Eds.; IPCC: Geneva, Switzerland; pp. 1–34. [CrossRef]
- Macleod, M.; Leinonen, I.; Wall, E.; Houdijk, J.; Eory, V.; Burns, J.; Vosough Ahmadi, B.; Gomez Barbero, M. Impact of Animal Breeding on GHG Emissions and Farm Economics; EUR 29844 EN, JRC117897; Publications Office of the European Union: Luxembourg, 2019; ISBN 978-92-76-10943-3. [Google Scholar] [CrossRef]
- Li, J. Optimal sizing of grid-connected photovoltaic battery systems for residential houses in Australia. Renew. Energy 2019, 136, 1245–1254. [Google Scholar]
- Chub, A.; Vinnikov, D.; Stepenko, S.; Liivik, E.; Blaabjerg, F. Photovoltaic energy yield improvement in two-stage solar microinverters. Energies 2019, 12, 3774. [Google Scholar] [CrossRef]
- Saad, S.N.M.; van der Weijde, A.H. Evaluating the potential of hosting capacity enhancement using integrated grid planning modeling methods. Energies 2019, 12, 3610. [Google Scholar] [CrossRef]
- Boeckl, B.; Kienberger, T. Sizing of PV storage systems for different household types. J. Energy Storage 2019, 24, 100763. [Google Scholar]
- Aslam, A.; Ahmed, N.; Qureshi, A.S.; Assadi, M.; Ahmed, N. Advances in solar PV systems; A comprehensive review of PV performance, influencing factors, and mitigation techniques. Energies 2022, 15, 7595. [Google Scholar] [CrossRef]
- Hazim, H.I.; Baharin, K.A.; Gan, C.K.; Sabry, A.H. Techno-economic optimization of photovoltaic (PV)-inverter power sizing ratio for grid-connected PV Systems. Results Eng. 2024, 23, 102580. [Google Scholar]
- Xiao, W.; Zhang, J.; Liu, Y.; Jiang, C. Assessment of rooftop photovoltaic potential in dormitory towards a low-carbon campus. In Proceedings of the 3rd International Conference on Electrical Engineering and Control Science (IC2ECS), Hangzhou, China, 29–31 December 2023; pp. 796–800. [Google Scholar]
- Wiryadinata, S.; Morejohn, J.; Kornbluth, K. Pathways to carbon neutral energy systems at the University of California, Davis. Renew. Energy 2019, 130, 853–866. [Google Scholar]
- Suchithra, J.; Robinson, D.; Rajabi, A. Hosting Capacity Assessment Strategies and Reinforcement Learning Methods for Coordinated Voltage Control in Electricity Distribution Networks: A Review. Energies 2023, 16, 2371. [Google Scholar] [CrossRef]
- Li, B.; Liu, Z.; Wu, Y.; Wang, P.; Liu, R.; Zhang, L. Review on photovoltaic with battery energy storage system for power supply to buildings: Challenges and opportunities. J. Energy Storage 2023, 61, 106763. [Google Scholar] [CrossRef]
- Chen, Y.; Quan, M.; Wang, D.; Du, H.; Hu, L.; Zhao, Y.; Guo, M.; Liu, Y. Optimization and comparison of multiple solar energy systems for public sanitation service buildings in Tibet. Energy Convers. Manag. 2022, 267, 115847. [Google Scholar] [CrossRef]
- Wang, Q.; Yang, X.; Li, R. The impact of the COVID-19 pandemic on the energy market—A comparative relationship between oil and coal. Energy Strategy Rev. 2022, 39, 100761. [Google Scholar] [CrossRef]
- Szczygielski, J.J.; Brzeszczynski, J.; Charteris, A.; Bwanya, P.R. The COVID-19 storm and the energy sector: The impact and role of uncertainty. Energy Econ. 2022, 109, 105258. [Google Scholar] [CrossRef] [PubMed]
- Kang, X.; An, J.; Yan, D. A systematic review of building electricity use profile models. Energy Build. 2023, 281, 112753. [Google Scholar] [CrossRef]
- Tsiaras, E.; Papadopoulos, D.N.; Antonopoulos, C.N.; Papadakis, V.G.; Coutelieris, F.A. Planning and assessment of an off—Grid power supply system for small settlements. Renew. Energy 2020, 149, 1271–1281. [Google Scholar] [CrossRef]
- Hao, D.; Qi, L.; Tairab, A.M.; Ahmed, A.; Azam, A.; Luo, D.; Pan, Y.; Zhang, Z.; Yan, J. Solar energy harvesting technologies for PV self—Powered applications: A comprehensive review. Renew. Energy 2022, 188, 678–697. [Google Scholar] [CrossRef]
- Hui, B.; Liang, F.; Ren, F.; Zhu, S.; Su, S.; Li, W.; Li, Q. Experimental investigation of a 10 kW photovoltaic power system and lithium battery energy storage system for off-grid electro-hydrogen coupling. Case Stud. Therm. Eng. 2025, 68, 105877. [Google Scholar] [CrossRef]
- Rajasekaran, S.; Krishnamoorthy, M.; Srinivasan, S.; Gouda, P.K. Integrated renewable electrification system modelling and tri-objective optimization analysis for net zero energy institutional building: A simulated case study of green hydrogen production. Environ. Dev. Sustain. 2024, 1–30. [Google Scholar] [CrossRef]
- IPOE (APA Sp. z o.o. Company). Available online: https://ipoe.pl/ (accessed on 1 January 2025).
- Pullinger, M.; Zapata-Webborn, E.; Kilgour, J.; Elam, S.; Few, J.; Goddard, N.; Hanmer, C.; McKenna, E.; Oreszczyn, T.; Webb, L. Capturing variation in daily energy demand profiles over time with cluster analysis in British homes (September 2019–August 2022). Appl. Energy 2024, 360, 122683. [Google Scholar] [CrossRef]
- Ponniran, A.; Azura Mamat, N.; Joret, A. Electricity Profile Study for Domestic and Commercial Sectors. Int. J. Integr. Eng. 2012, 4, 8–12. [Google Scholar]
- European Commision—Photovoltaic Geographical Information System—PVGIS. Available online: https://re.jrc.ec.europa.eu/pvg_tools/en/ (accessed on 2 November 2024).
- Pashchenko, D. Green hydrogen as a power plant fuel: What is energy efficiency from production to utilization? Renew. Energy 2024, 223, 120033. [Google Scholar] [CrossRef]
- Louie, H.; Atcitty, S.; Terry, D.; Lee, D.; Peter Romine, P. Daily electrical energy consumption characteristics and design implications for off-grid homes on the Navajo Nation. Energy Sustain. Dev. 2023, 73, 315–325. [Google Scholar] [CrossRef]
- Pombeiro, H.; Pina, A.; Silva, C. Analyzing residential electricity consumption patterns based on consumer’s segmentation. In Proceedings of the First International Workshop on Information Technology for Energy Applications, Lisbon, Portugal, 1 January 2012; pp. 29–38. [Google Scholar]
- Anestis, A.; Georgios, V. Economic benefits of Smart Microgrids with penetration of DER and mCHP units for non-interconnected islands. Renew. Energy 2019, 142, 478–486. [Google Scholar] [CrossRef]
- Hinestroza-Olascuaga, L.M.; Carvalho, P.M.S.; Cardoso de Jesus, C.M.S. Lowering risk intolerance to unlock private investments in renewable energy-based rural electrification. Energy Sustain. Dev. 2023, 74, 258–268. [Google Scholar] [CrossRef]
Disclaimer/Publisher’s Note: The statements, opinions and data contained in all publications are solely those of the individual author(s) and contributor(s) and not of MDPI and/or the editor(s). MDPI and/or the editor(s) disclaim responsibility for any injury to people or property resulting from any ideas, methods, instructions or products referred to in the content. |
© 2025 by the authors. Licensee MDPI, Basel, Switzerland. This article is an open access article distributed under the terms and conditions of the Creative Commons Attribution (CC BY) license (https://creativecommons.org/licenses/by/4.0/).