
Smart Charging Recommendation Framework for Electric Vehicles: A Machine-Learning-Based Approach for Residential Buildings

 ,
,  , and
, and
Abstract
1. Background
1.1. Introduction
- The modular design of the ML-based forecasting engine facilitates the integration of additional data streams—such as national grid energy flows—ensuring that the system remains responsive to evolving energy market dynamics as well as user requirements.
- The framework employs a dynamic weighting mechanism for the forecast values, which underpins the generation of a probabilistic recommendation. This flexible mechanism can be recalibrated based on local and regional/national data streams, thereby optimizing energy usage recommendations across a broader spectrum of operational scenarios.
1.2. EV Charging Operations
- Peak Charging: Occurring when vehicle owners charge their vehicles immediately after work, coinciding with periods of heightened residential electricity demand. The simultaneous increase in residential electricity consumption and EV charging can significantly elevate grid load peaks, potentially requiring DSM interventions such as load-shifting strategies.
- Off-Peak Charging: Involving delayed or controlled charging, this pattern typically occurs during night hours when electricity rates are lower and overall demand is reduced. Off-peak charging offers the opportunity to flatten the load curve and improve grid stability by shifting energy consumption to periods with surplus generation capacity.
- Stochastic Charging: Characterized by sporadic charging events based on immediate needs or personal habits, this pattern is the most unpredictable. Its random nature complicates accurate forecasting. Nonetheless, such charging behavior tends to be less prevalent in residential scenarios compared to public charging in commercial areas.
1.3. Related Work
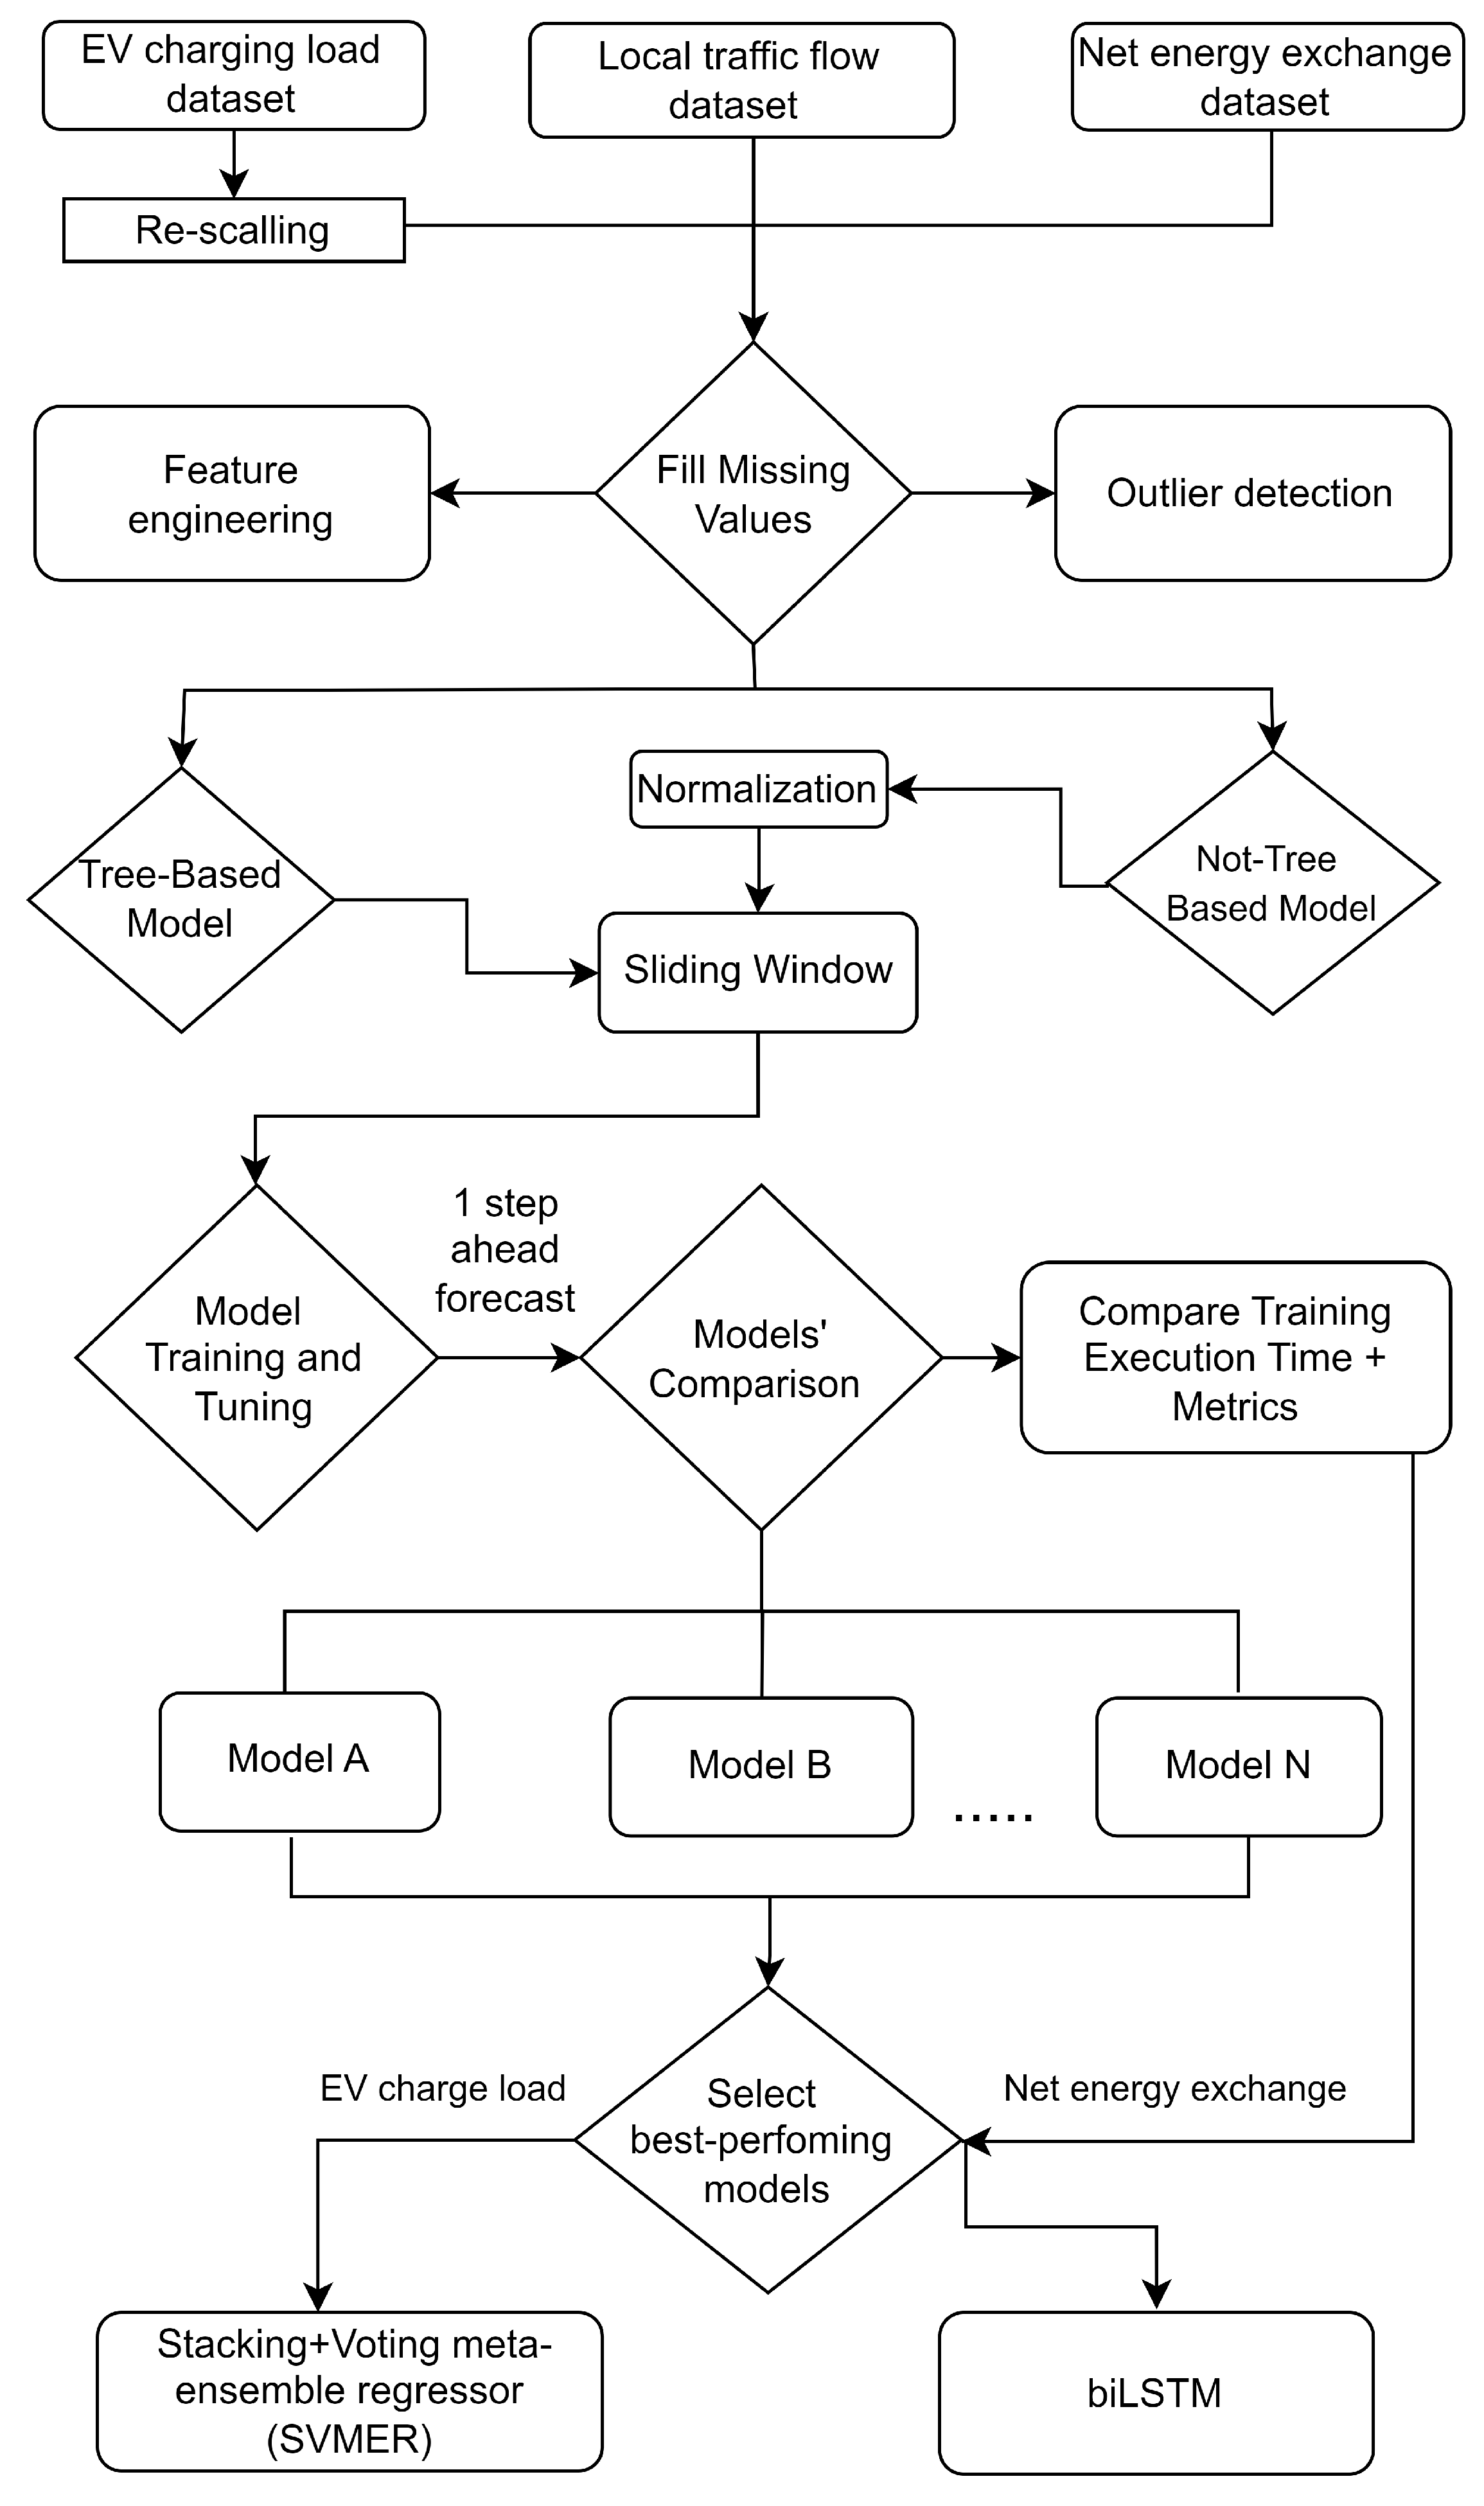
2. Methodology
2.1. Data Description
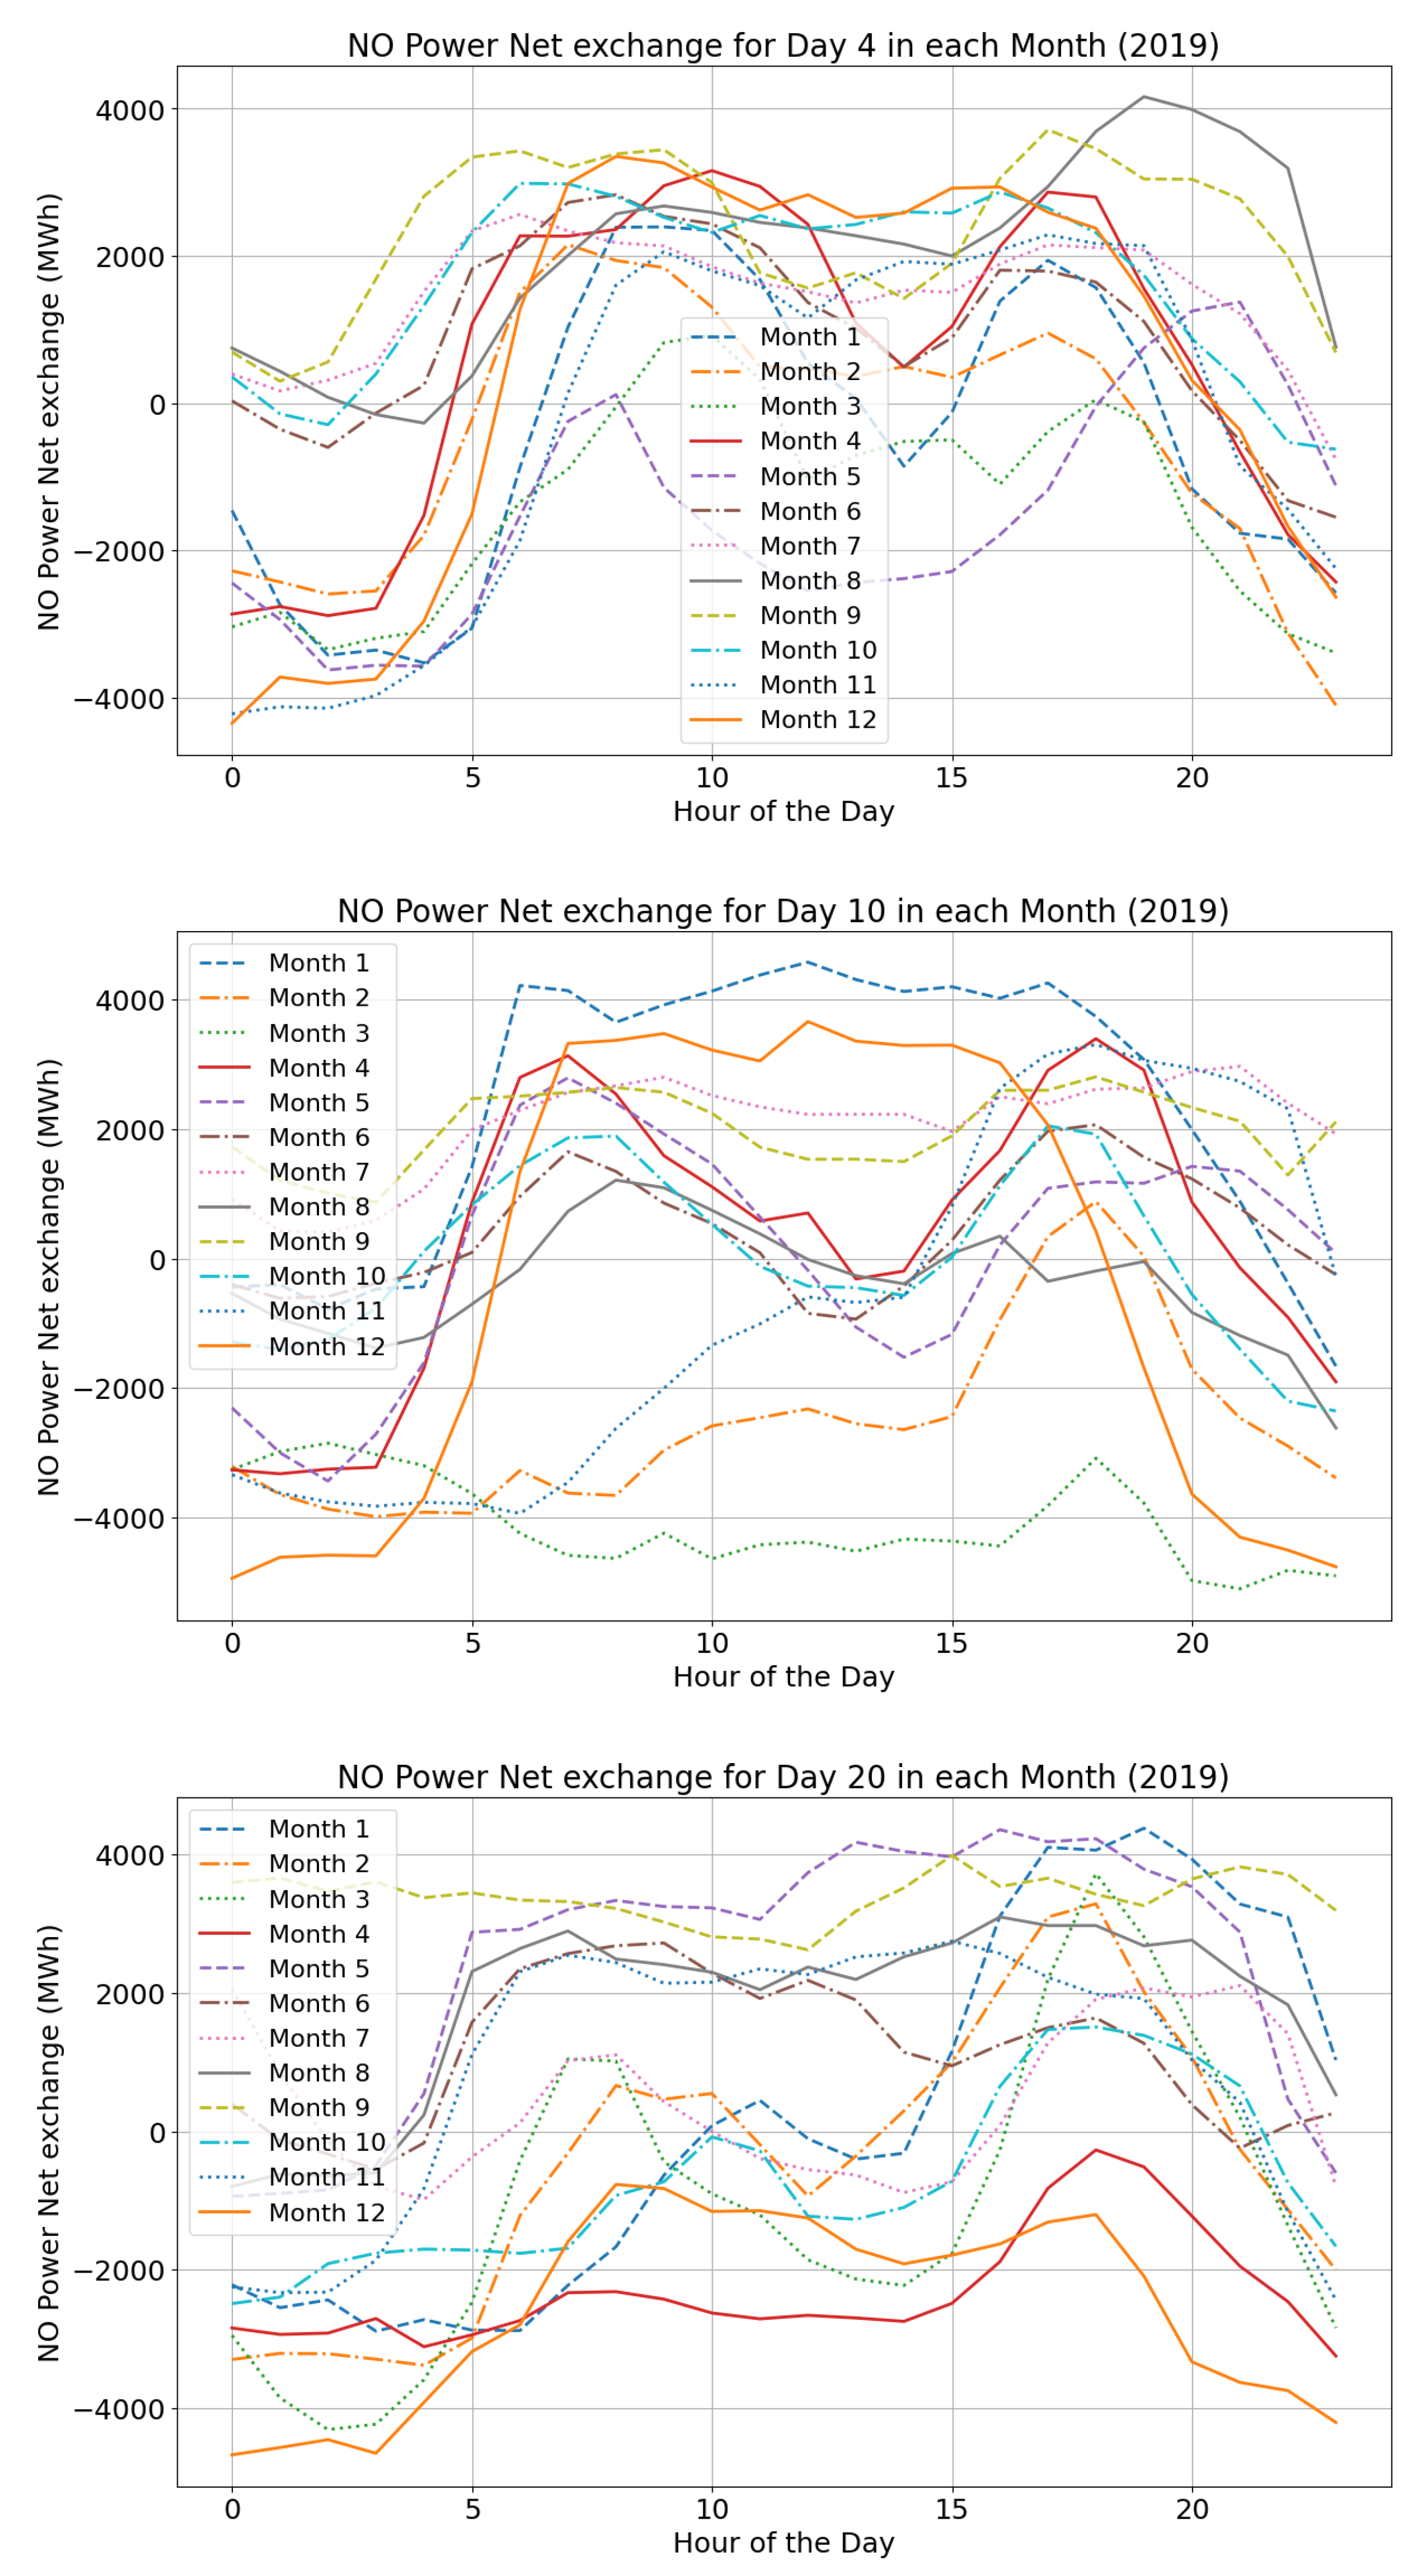
2.2. Net Energy Exchange Data (Norway)
2.3. Preprocessing and Feature Engineering
- Temporal features: Seasonality features were generated by partitioning timestamps into categorical variables (e.g., hour, day, week, and month). Additional features, such as off-peak hours, were synthesized to better capture variations in charging and traffic patterns. Then, a sinusoidal positional encoding method was utilized to preserve the inherent periodicity of these features. For a given temporal feature x (e.g., the hour of the day) with a known maximum value (for instance, 24 for hours), cyclical encoding is defined by the following transformations:This mapping projects the value x onto the unit circle, ensuring that values near the cycle boundaries (e.g., 23:00 and 00:00) are close in the transformed space.
- Other features: Two additional exogenous features were included in the dataset:
- –
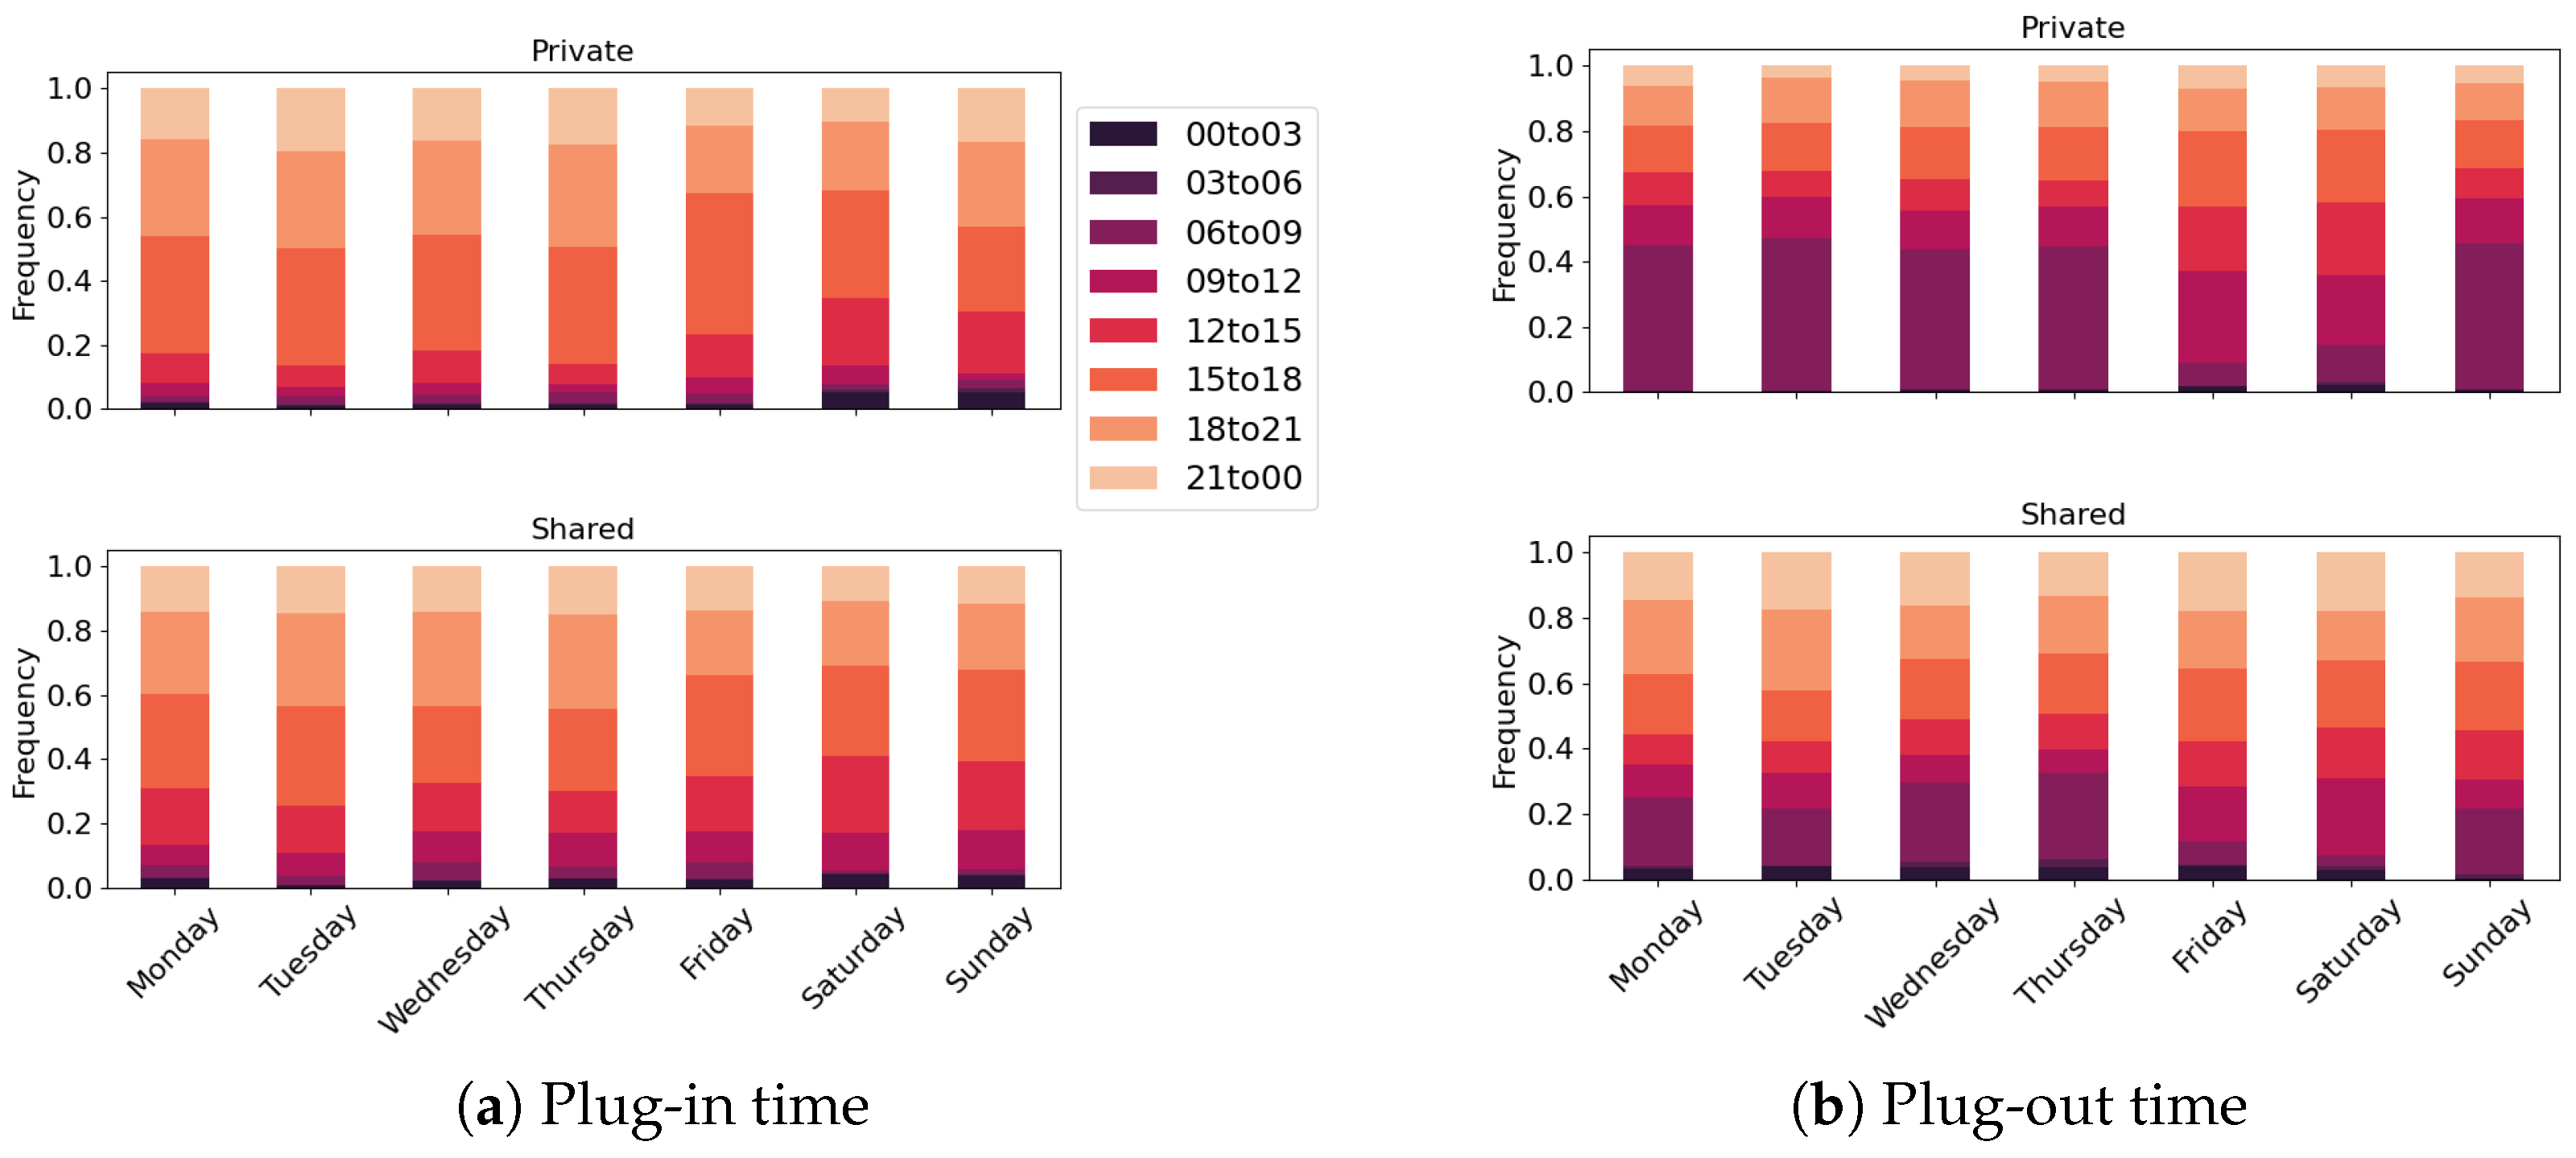
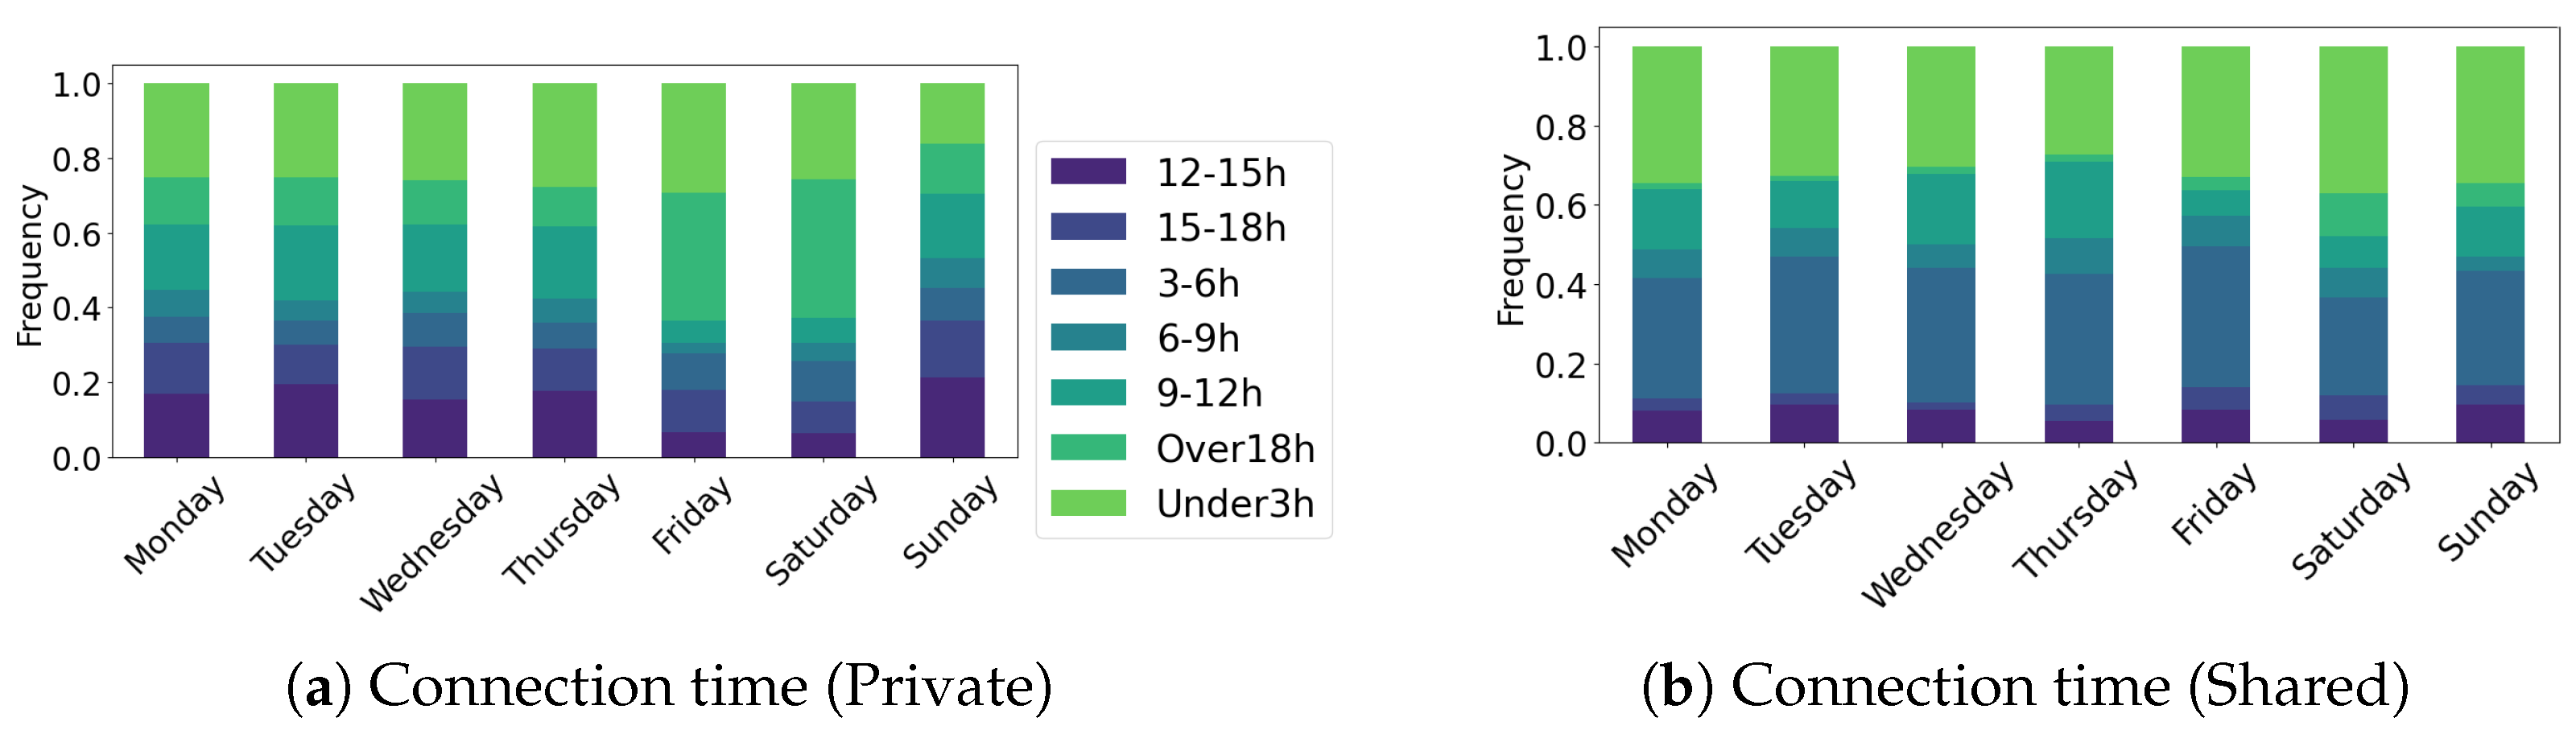
- Public/Private Charging Share: Charging sessions were classified into shared and private categories. The hourly proportion for each category was computed by aggregating the session durations, which were first recorded on a minute-by-minute basis and subsequently summed to obtain an hourly total.
- –
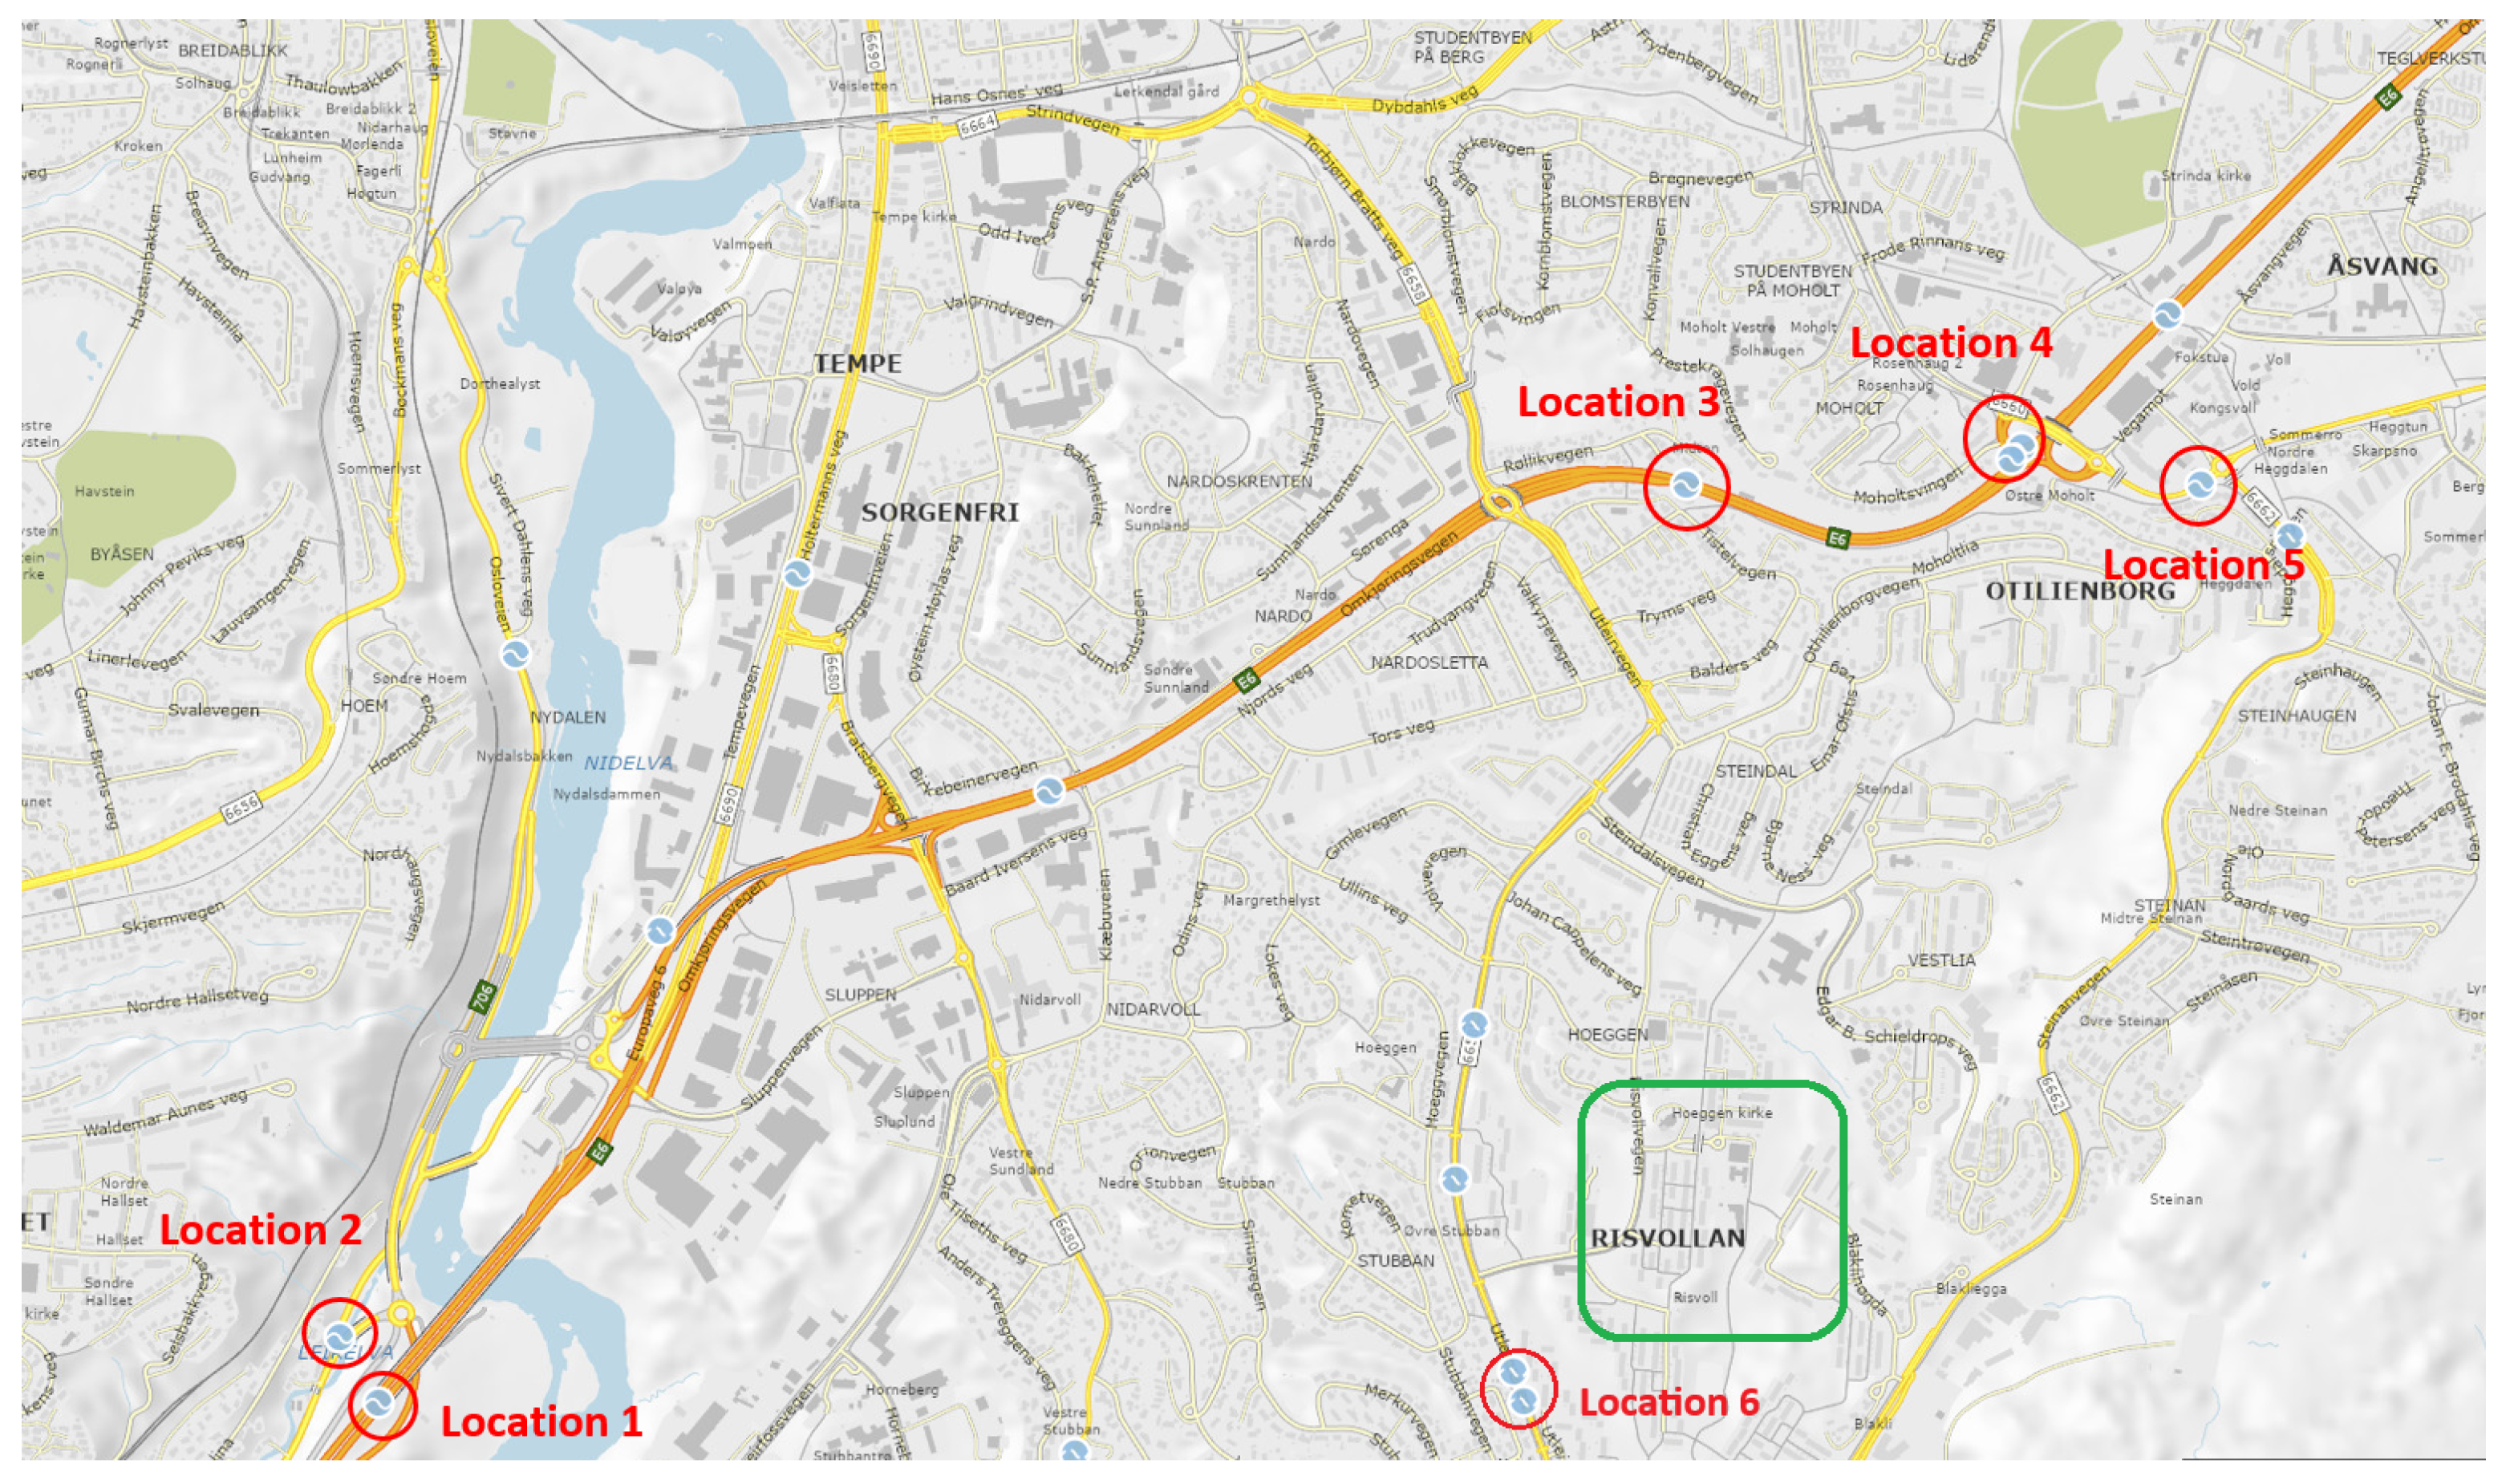
- Local Traffic Flow Indicator: This feature quantifies the variability of local traffic patterns by employing dimensionality reduction. Specifically, Principal Component Analysis (PCA) was applied to traffic flow data collected from six nearby locations (Figure 5) over the preceding eight hours. The data were then projected onto the first principal component, which was subsequently utilized as a training feature.
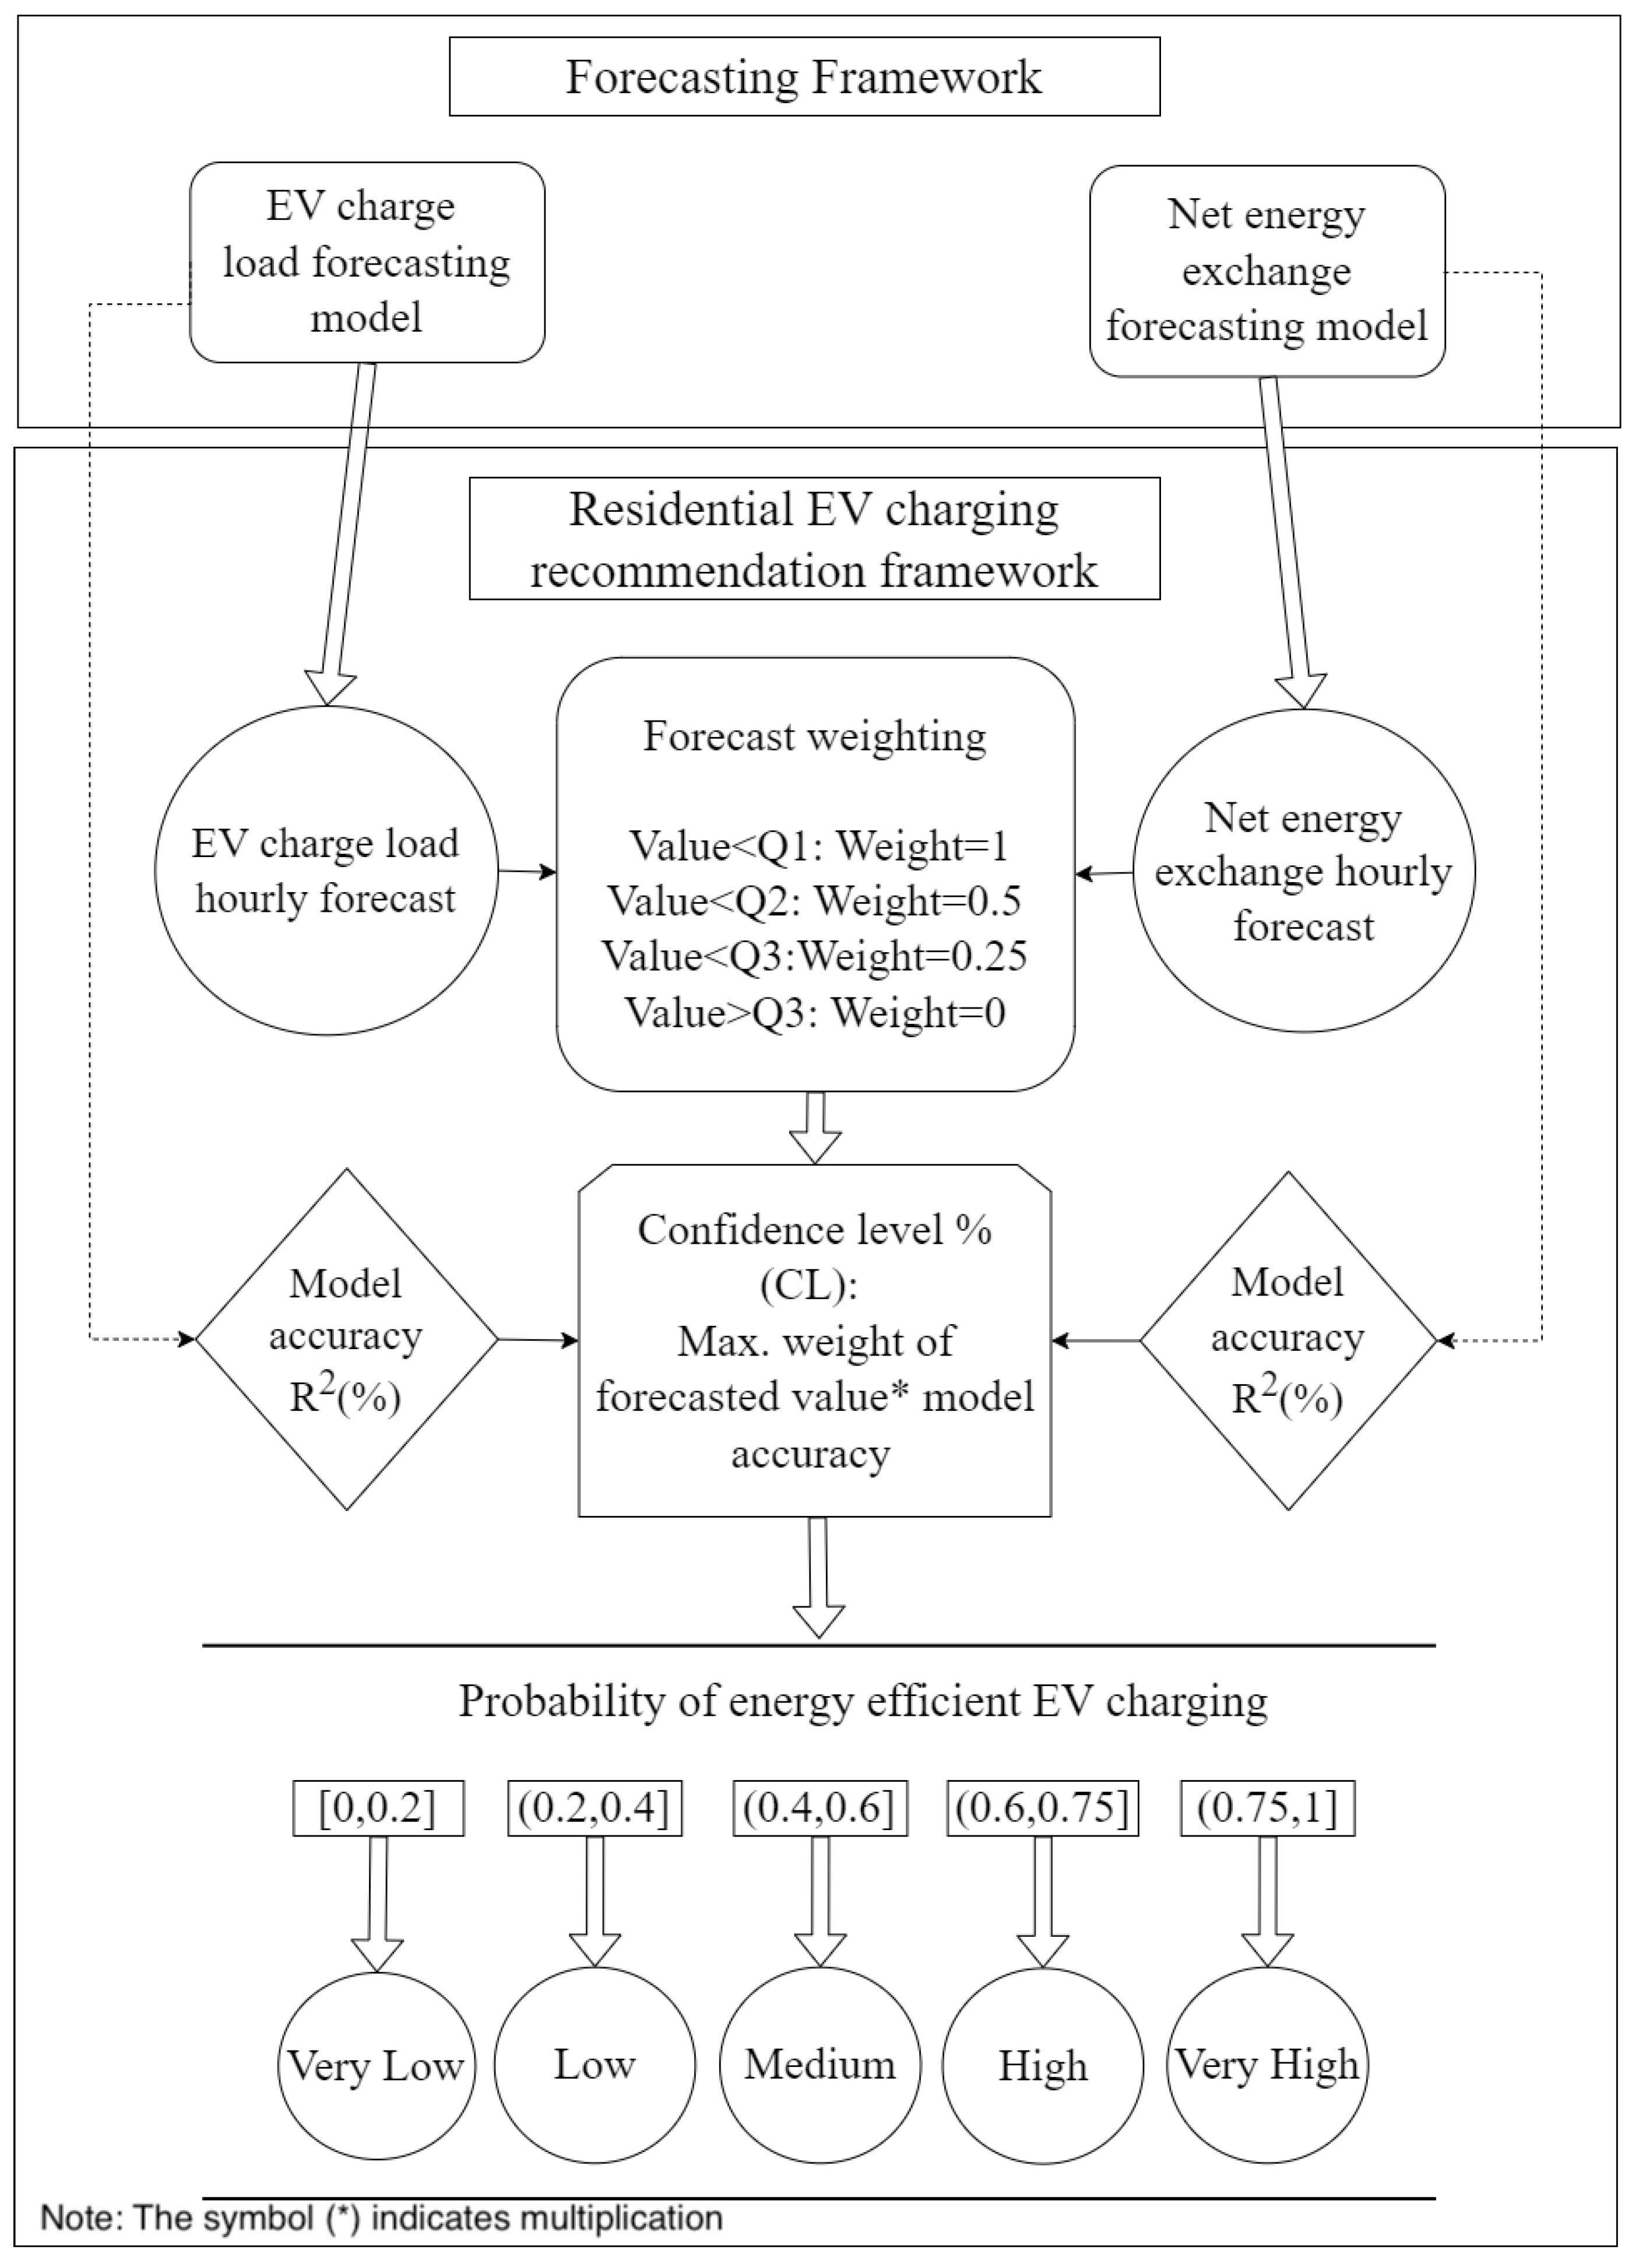
2.4. Forecasting Approach
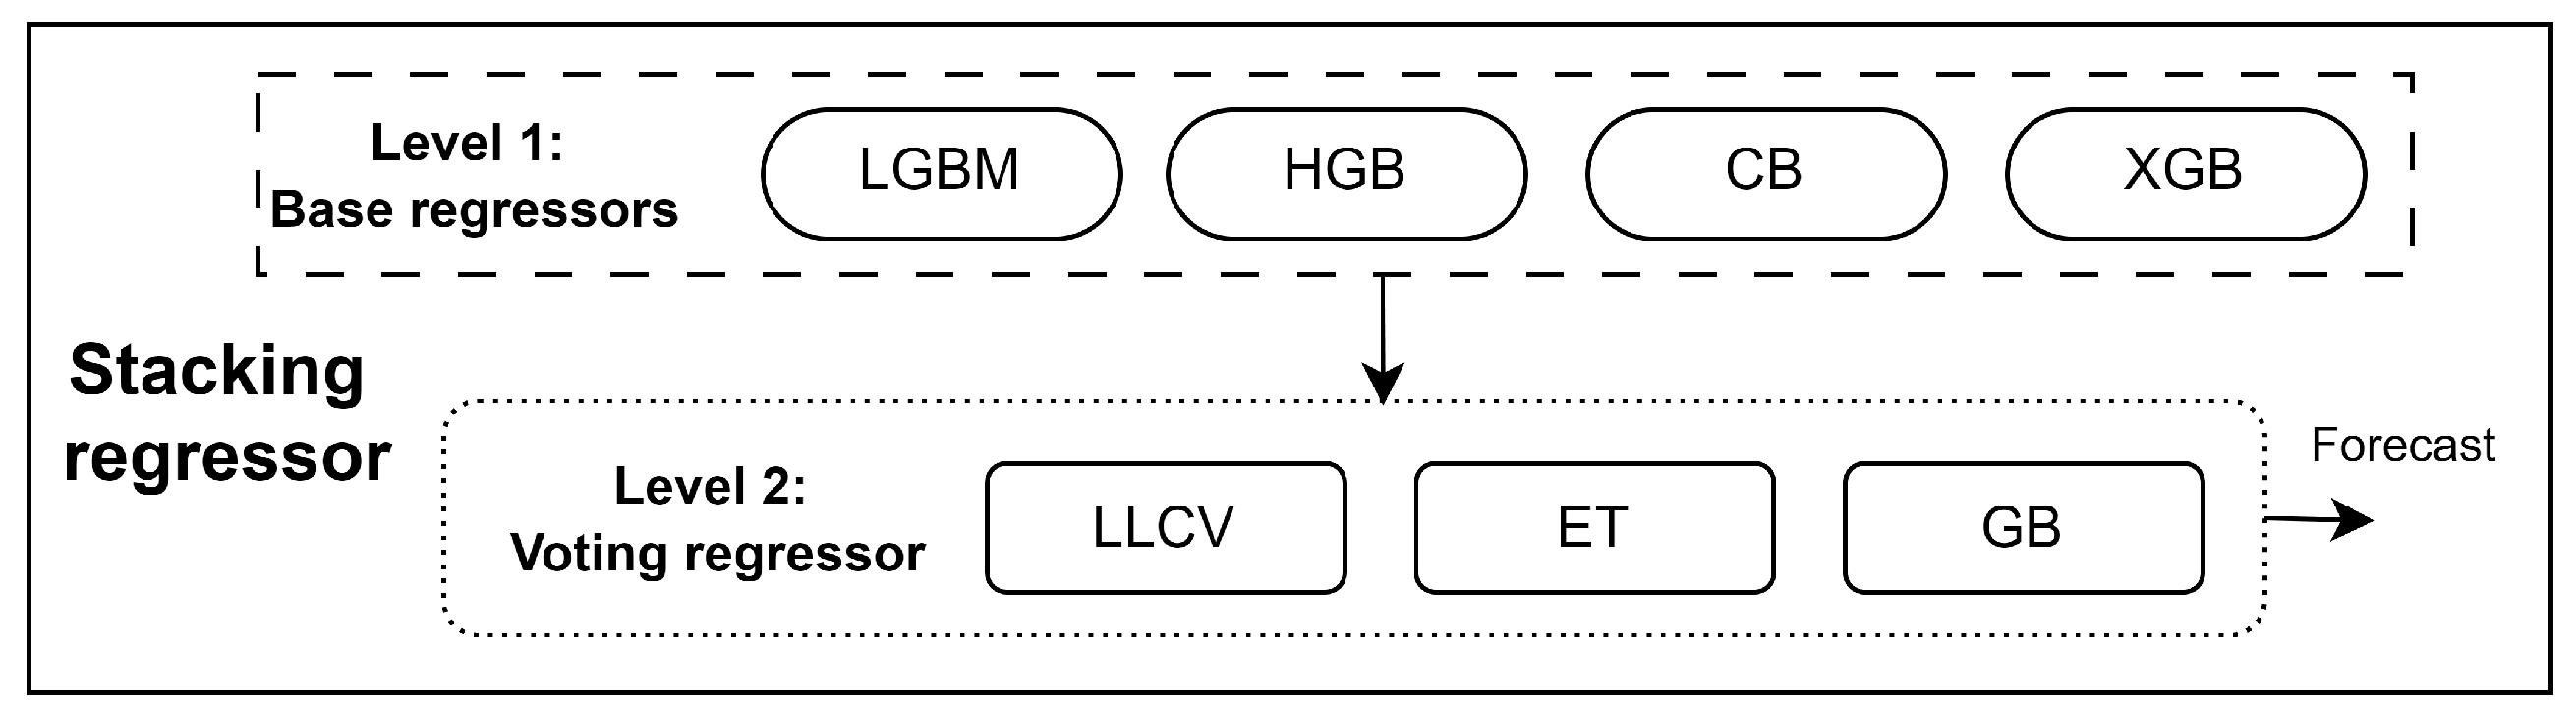
2.4.1. EV Charge Load Forecasting
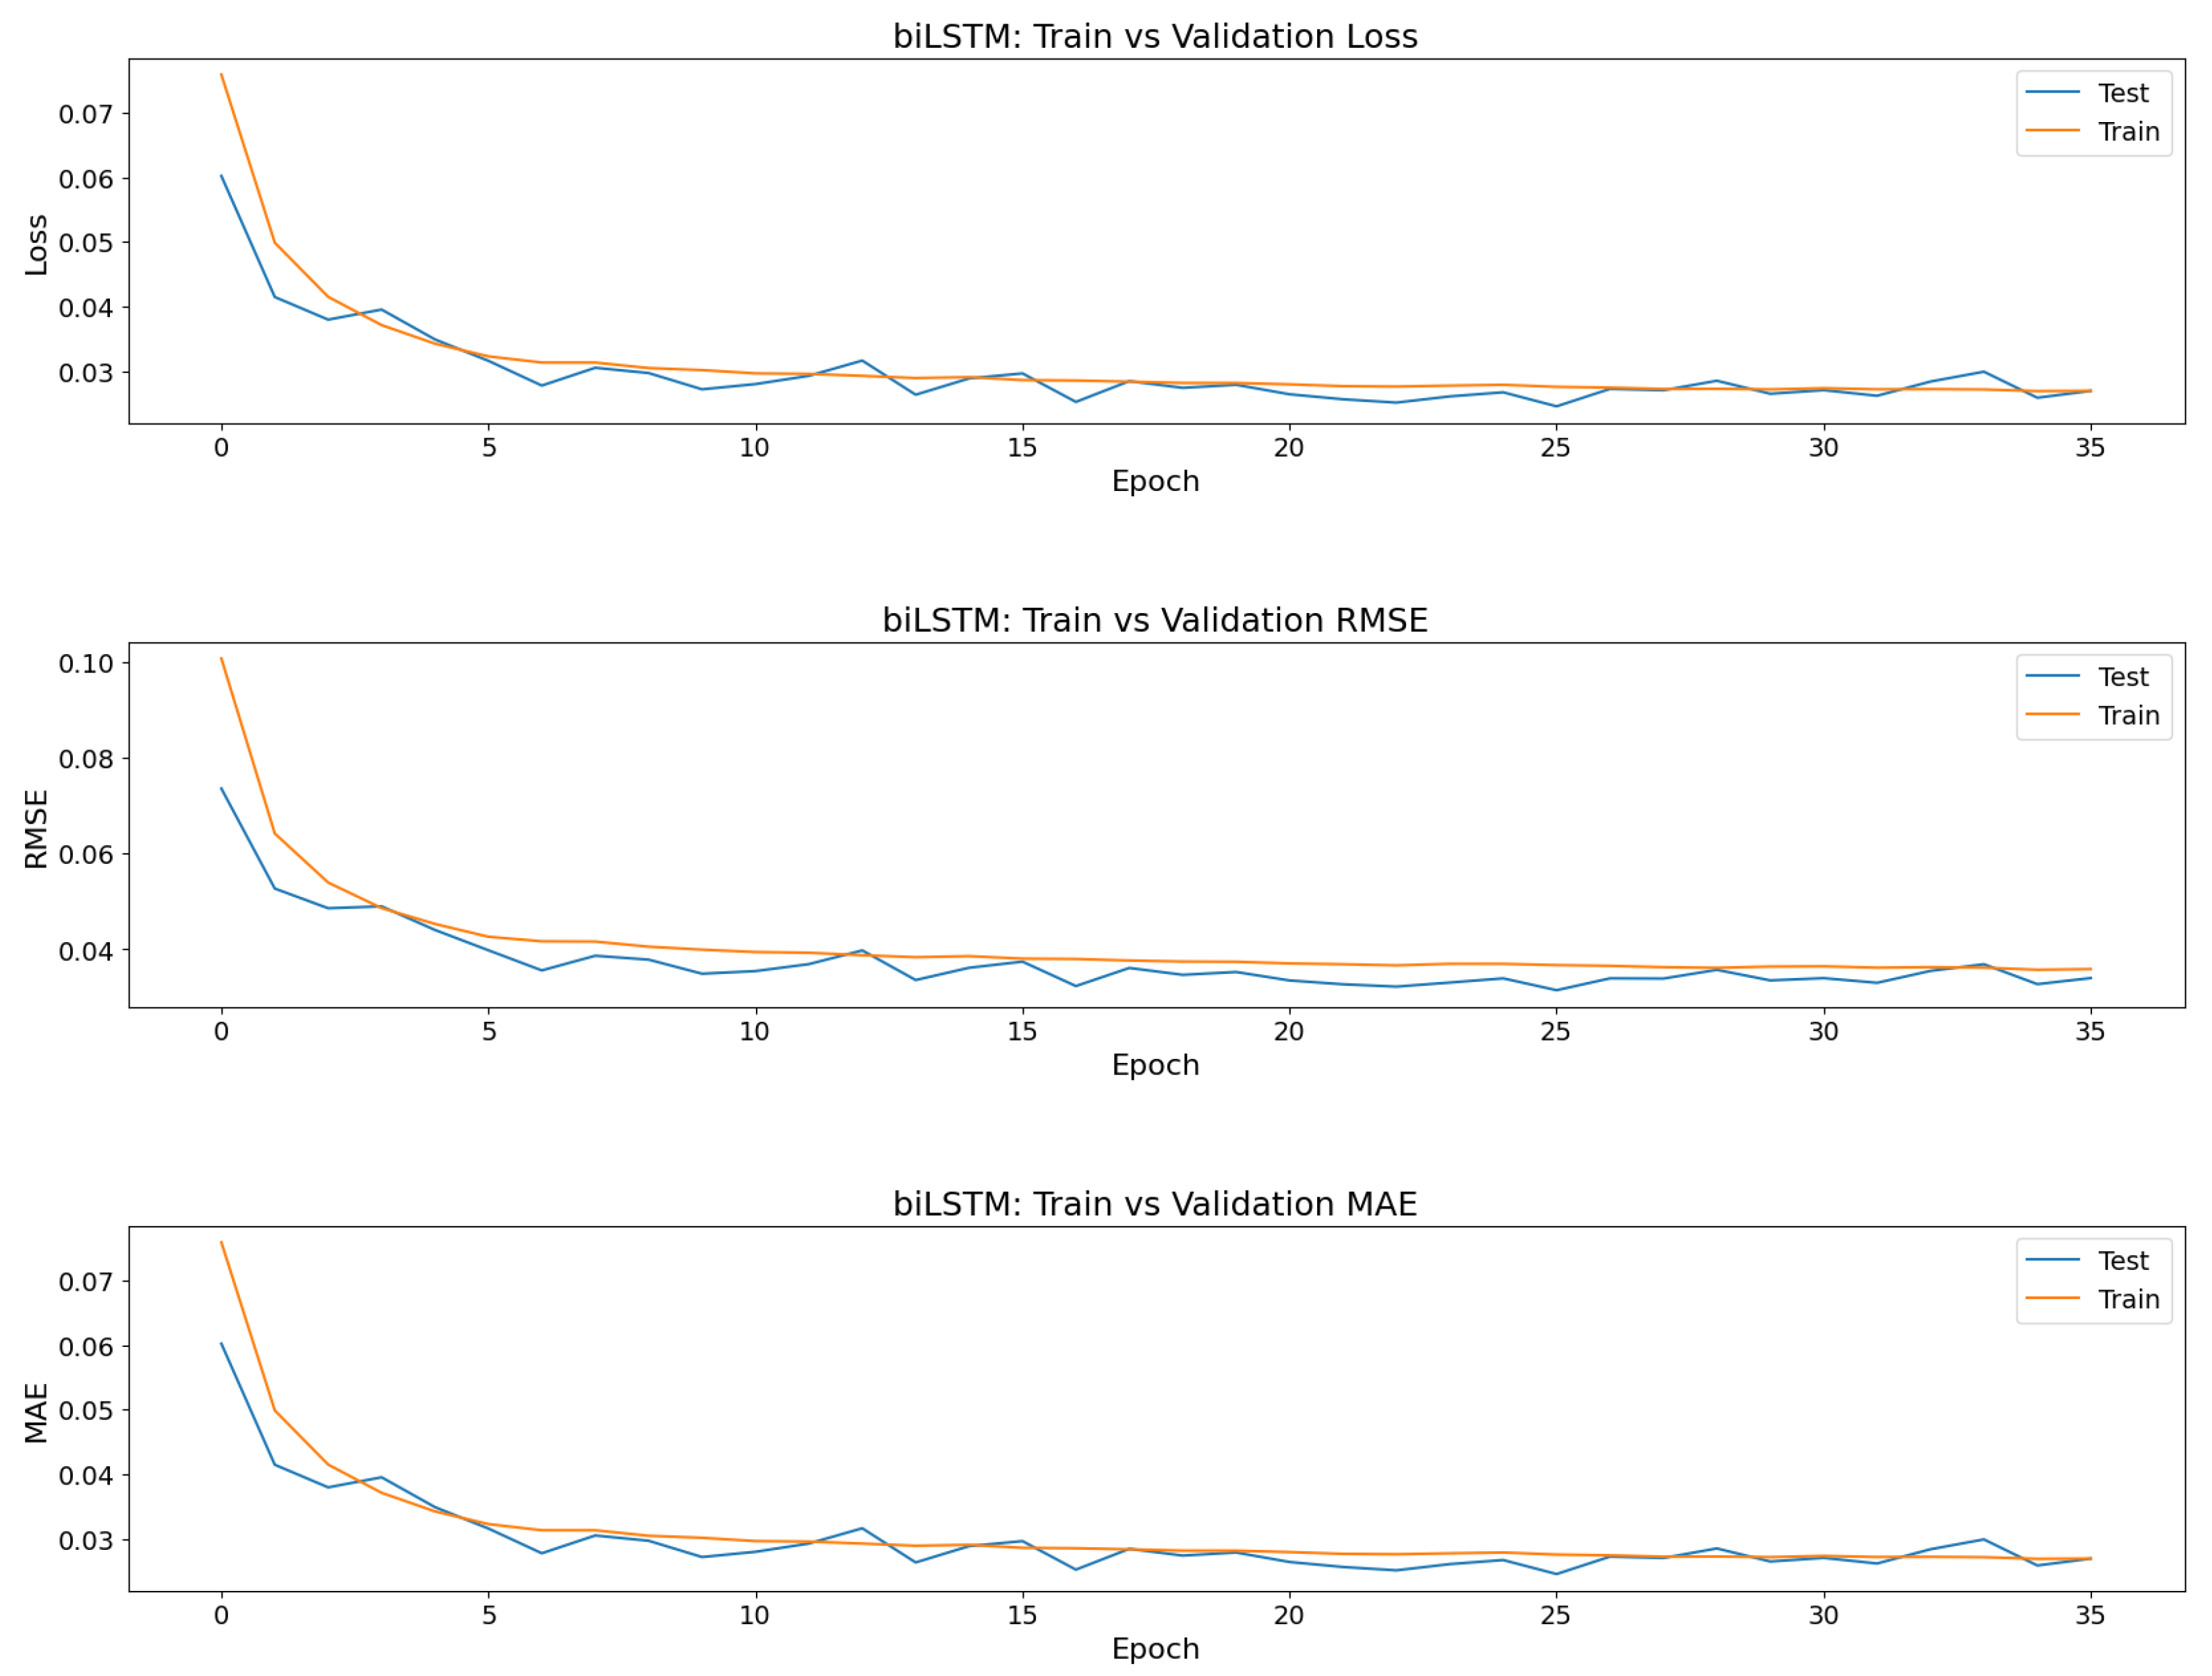
2.4.2. Net Energy Exchange Forecasting
2.5. Smart Charging Recommendation Framework
- A lower national energy demand, which typically correlates with reduced electricity costs for residential users.
- A short-term assessment of the anticipated charging load, ensuring that the cumulative demand remains within the normal operating power limit of the residential block’s charging infrastructure and serving as an indicator of increased availability of shared CP.
3. Experimental Results and Discussion
3.1. Forecasting Results
3.2. Charging Recommendations
4. Conclusions
4.1. Implications
- Residents of future smart buildings who also drive EVs. The proposed framework offers a user-centric decision support tool that enables them to optimize their charging schedules.
- Charge Point Operators (CPOs) can offer personalized recommendations to users and implement dynamic pricing and service strategies. For instance, during peak grid demand, prices at certain charging points might increase to incentivize users to charge at off-peak times or locations with lower grid stress.
- If implemented on a larger scale, Distribution System Operators (DSOs) and CPOs can collaborate to create more efficient Demand Response (DR) solutions. The predictive capabilities not only support the synchronization of local charging decisions with broader grid conditions but can also help facilitate the incorporation of RESs and Vehicle-to-Grid (V2G) technologies.
4.2. Limitations and Future Work
- A more detailed sensitivity analysis of the balancing parameter, . Future work should explore the development of an adaptive weighting scheme that dynamically adjusts based on real-time grid conditions and local charging infrastructure constraints, which could further enhance the robustness of the recommendations.
- Enhance the methodology by incorporating multi-step ahead forecasting and expanding the training dataset to include additional charging data and longer timeframes. Validate the models on new data and investigate their improvement in terms of forecasting accuracy and generalization.
- Regarding the cost-effectiveness aspect, the framework could be further enhanced by incorporating Day-ahead Market (DAM) energy price data. This enhancement would enable the framework to provide more accurate recommendations during periods of low electricity pricing. This could contribute to establishing economic incentives for EV users with respect to charging operations.
Author Contributions
Funding
Data Availability Statement
Acknowledgments
Conflicts of Interest
Abbreviations
| Accuracy () of the EV charging load forecasting model | |
| Accuracy () of the net energy exchange forecasting model | |
| AMS | Advanced Measurement Systems |
| biLSTM | bidirectional Long Short-Term Memory |
| BESS | Battery Energy Storage System |
| CB | CatBoost |
| CNN | Convolutional Neural Network |
| CP | Charging Point |
| CV | Cross-Validation |
| CVRMSE | Coefficient of Variation in the Root Mean Square Error |
| DAM | Day-ahead Market |
| DR | Demand Response |
| DSM | Demand Side Management |
| DL | Deep Learning |
| DSO | Distribution System Operator |
| DTR | Decision Tree Regressor |
| EV | Electric Vehicle |
| ET | Extra Trees |
| Forecast EV charge load (kWh) | |
| Forecast net energy exchange (MWh) | |
| GB | Gradient Boosting |
| GRU | Gated Recurrent Unit |
| HGBR | HistGradientBoosting Regressor |
| HR | Huber Regressor |
| ICEV | Internal Combustion Engine Vehicle |
| IoT | Internet of Things |
| KNN | K-Nearest Neighbors |
| Balancing factor between local charge load & net energy exchange forecasts () | |
| LCVF | Load Conservation Valley-Filling |
| LGBM | LightGBM |
| LLCV | Lasso Lars Cross-Validation |
| LSTM | Long Short-Term Memory |
| MAE | Mean Absolute Error |
| MISDP | Multilayer Iterative Stochastic Dynamic Programming |
| ML | Machine Learning |
| MLP | Multi-Layer Perceptron |
| NEE | Net Energy Exchange |
| NRMSE | Normalized Root Mean Square Error |
| PCA | Principal Component Analysis |
| PSO | Particle Swarm Optimization |
| First quartile of EV charging load | |
| First quartile of net energy exchange | |
| PV | Photovoltaics |
| R2 | Coefficient of Determination |
| RF | Random Forest |
| RNN | Recurrent Neural Network |
| RES | Renewable Energy Sources |
| SC | Smart Charging |
| SLSQP | Sequential Least Squares Programming |
| SRI | Smart Readiness Indicator |
| SVMER | Stacking and Voting Meta-Ensemble Regressor |
| UMC | User-managed Charging |
| V2G | Vehicle-to-Grid |
| XGB | XGBoost |
References
- Alanazi, F. Electric Vehicles: Benefits, Challenges, and Potential Solutions for Widespread Adaptation. Appl. Sci. 2023, 13, 6016. [Google Scholar] [CrossRef]
- Farzaneh, F.; Jung, S. Lifecycle carbon footprint comparison between internal combustion engine versus electric transit vehicle: A case study in the U.S. J. Clean. Prod. 2023, 390, 136111. [Google Scholar] [CrossRef]
- International Energy Agency. Global EV Outlook 2024: Moving Towards Increased Affordability; Technical Report; IEA: Paris, France, 2024. [Google Scholar]
- Olatomiwa, L.; Mekhilef, S.; Ismail, M.; Moghavvemi, M. Energy management strategies in hybrid renewable energy systems: A review. Renew. Sustain. Energy Rev. 2016, 62, 821–835. [Google Scholar] [CrossRef]
- Ukoba, K.; Olatunji, K.O.; Adeoye, E.; Jen, T.C.; Madyira, D.M. Optimizing renewable energy systems through artificial intelligence: Review and future prospects. Energy Environ. 2024, 35, 3833–3879. [Google Scholar] [CrossRef]
- Barman, P.; Dutta, L.; Bordoloi, S.; Kalita, A.; Buragohain, P.; Bharali, S.; Azzopardi, B. Renewable energy integration with electric vehicle technology: A review of the existing smart charging approaches. Renew. Sustain. Energy Rev. 2023, 183, 113518. [Google Scholar] [CrossRef]
- Saxena, V.; Manna, S.; Rajput, S.K.; Kumar, P.; Sharma, B.; Alsharif, M.H.; Kim, M.K. Navigating the complexities of distributed generation: Integration, challenges, and solutions. Energy Rep. 2024, 12, 3302–3322. [Google Scholar] [CrossRef]
- Koukaras, P.; Dimara, A.; Herrera, S.; Zangrando, N.; Krinidis, S.; Ioannidis, D.; Fraternali, P.; Tjortjis, C.; Anagnostopoulos, C.N.; Tzovaras, D. Proactive Buildings: A Prescriptive Maintenance Approach. In Proceedings of the Artificial Intelligence Applications and Innovations. AIAI 2022 IFIP WG 12.5 International Workshops, Crete, Greece, 17–20 June 2022; Maglogiannis, I., Iliadis, L., Macintyre, J., Cortez, P., Eds.; Springer: Cham, Switzerland, 2022; pp. 289–300. [Google Scholar]
- Boasso, E.; Manganelli, M.; Martirano, L. Impact of EV Charging on the Electric Load of Smart Buildings and Energy Communities. In Proceedings of the 2021 IEEE Industry Applications Society Annual Meeting (IAS), Vancouver, BC, Canada, 10–14 October 2021; pp. 1–7. [Google Scholar] [CrossRef]
- Muñiz, R.; del Coso, R.; Nuño, F.; Villegas, P.J.; Álvarez, D.; Martínez, J.A. Solar-Powered Smart Buildings: Integrated Energy Management Solution for IoT-Enabled Sustainability. Electronics 2024, 13, 317. [Google Scholar] [CrossRef]
- Rodriguez-Gil, J.A.; Mojica-Nava, E.; Vargas-Medina, D.; Arevalo-Castiblanco, M.F.; Cortes, C.A.; Rivera, S.; Cortes-Romero, J. Energy management system in networked microgrids: An overview. Energy Syst. 2024. [Google Scholar] [CrossRef]
- Chatzikonstantinidis, K.; Giama, E.; Fokaides, P.A.; Papadopoulos, A.M. Smart Readiness Indicator (SRI) as a Decision-Making Tool for Low Carbon Buildings. Energies 2024, 17, 1406. [Google Scholar] [CrossRef]
- Siddique, M.T.; Koukaras, P.; Ioannidis, D.; Tjortjis, C. A Methodology Integrating the Quantitative Assessment of Energy Efficient Operation and Occupant Needs into the Smart Readiness Indicator. Energies 2023, 16, 7007. [Google Scholar] [CrossRef]
- Märzinger, T.; Österreicher, D. Supporting the Smart Readiness Indicator—A Methodology to Integrate A Quantitative Assessment of the Load Shifting Potential of Smart Buildings. Energies 2019, 12, 1955. [Google Scholar] [CrossRef]
- Mu, C.; Liu, W.; Xu, W. Hierarchically Adaptive Frequency Control for an EV-Integrated Smart Grid With Renewable Energy. IEEE Trans. Ind. Informatics 2018, 14, 4254–4263. [Google Scholar] [CrossRef]
- Sidharthan, V.P.; Kashyap, Y.; Kosmopoulos, P. Adaptive-Energy-Sharing-Based Energy Management Strategy of Hybrid Sources in Electric Vehicles. Energies 2023, 16, 1214. [Google Scholar] [CrossRef]
- Korkas, C.D.; Baldi, S.; Yuan, S.; Kosmatopoulos, E.B. An Adaptive Learning-Based Approach for Nearly Optimal Dynamic Charging of Electric Vehicle Fleets. IEEE Trans. Intell. Transp. Syst. 2018, 19, 2066–2075. [Google Scholar] [CrossRef]
- Johnsen, D.; Ostendorf, L.; Bechberger, M.; Strommenger, D. Review on Smart Charging of Electric Vehicles via Market-Based Incentives, Grid-Friendly and Grid-Compatible Measures. World Electr. Veh. J. 2023, 14, 25. [Google Scholar] [CrossRef]
- Henriksen, I.M.; Throndsen, W.; Ryghaug, M.; Skjølsvold, T.M. Electric vehicle charging and end-user motivation for flexibility: A case study from Norway. Energy Sustain. Soc. 2021, 11, 44. [Google Scholar] [CrossRef]
- Ahmad, A.; Khalid, M.; Ullah, Z.; Ahmad, N.; Aljaidi, M.; Malik, F.A.; Manzoor, U. Electric Vehicle Charging Modes, Technologies and Applications of Smart Charging. Energies 2022, 15, 9471. [Google Scholar] [CrossRef]
- Pareek, S.; Sujil, A.; Ratra, S.; Kumar, R. Electric Vehicle Charging Station Challenges and Opportunities: A Future Perspective. In Proceedings of the 2020 International Conference on Emerging Trends in Communication, Control and Computing (ICONC3), Lakshmangarh, India, 21–22 February 2020; pp. 1–6. [Google Scholar] [CrossRef]
- Libertson, F. Requesting control and flexibility: Exploring Swedish user perspectives of electric vehicle smart charging. Energy Res. Soc. Sci. 2022, 92, 102774. [Google Scholar] [CrossRef]
- Tuballa, M.L.; Abundo, M.L. A review of the development of Smart Grid technologies. Renew. Sustain. Energy Rev. 2016, 59, 710–725. [Google Scholar] [CrossRef]
- De Dutta, S.; Prasad, R. Digitalization of Global Cities and the Smart Grid. Wirel. Pers. Commun. 2020, 113, 1385–1395. [Google Scholar] [CrossRef]
- Tsalikidis, N.; Mystakidis, A.; Tjortjis, C.; Koukaras, P.; Ioannidis, D. Energy load forecasting: One-step ahead hybrid model utilizing ensembling. Computing 2023, 106, 241–273. [Google Scholar] [CrossRef]
- Wu, Y.; Wang, Z.; Huangfu, Y.; Ravey, A.; Chrenko, D.; Gao, F. Hierarchical Operation of Electric Vehicle Charging Station in Smart Grid Integration Applications—An Overview. Int. J. Electr. Power Energy Syst. 2022, 139, 108005. [Google Scholar] [CrossRef]
- Shi, Y.; Tuan, H.D.; Savkin, A.V.; Duong, T.Q.; Poor, H.V. Model Predictive Control for Smart Grids With Multiple Electric-Vehicle Charging Stations. IEEE Trans. Smart Grid 2019, 10, 2127–2136. [Google Scholar] [CrossRef]
- Al-Ogaili, A.S.; Tengku Hashim, T.J.; Rahmat, N.A.; Ramasamy, A.K.; Marsadek, M.B.; Faisal, M.; Hannan, M.A. Review on Scheduling, Clustering, and Forecasting Strategies for Controlling Electric Vehicle Charging: Challenges and Recommendations. IEEE Access 2019, 7, 128353–128371. [Google Scholar] [CrossRef]
- Sumanasena, V.; Gunasekara, L.; Kahawala, S.; Mills, N.; De Silva, D.; Jalili, M.; Sierla, S.; Jennings, A. Artificial Intelligence for Electric Vehicle Infrastructure: Demand Profiling, Data Augmentation, Demand Forecasting, Demand Explainability and Charge Optimisation. Energies 2023, 16, 2245. [Google Scholar] [CrossRef]
- Crozier, C.; Morstyn, T.; McCulloch, M. The opportunity for smart charging to mitigate the impact of electric vehicles on transmission and distribution systems. Appl. Energy 2020, 268, 114973. [Google Scholar] [CrossRef]
- Pagani, M.; Korosec, W.; Chokani, N.; Abhari, R. User behaviour and electric vehicle charging infrastructure: An agent-based model assessment. Appl. Energy 2019, 254, 113680. [Google Scholar] [CrossRef]
- Chung, Y.W.; Khaki, B.; Li, T.; Chu, C.; Gadh, R. Ensemble machine learning-based algorithm for electric vehicle user behavior prediction. Appl. Energy 2019, 254, 113732. [Google Scholar] [CrossRef]
- Shahriar, S.; Al-Ali, A.R.; Osman, A.H.; Dhou, S.; Nijim, M. Machine Learning Approaches for EV Charging Behavior: A Review. IEEE Access 2020, 8, 168980–168993. [Google Scholar] [CrossRef]
- Nimalsiri, N.I.; Mediwaththe, C.P.; Ratnam, E.L.; Shaw, M.; Smith, D.B.; Halgamuge, S.K. A Survey of Algorithms for Distributed Charging Control of Electric Vehicles in Smart Grid. IEEE Trans. Intell. Transp. Syst. 2020, 21, 4497–4515. [Google Scholar] [CrossRef]
- Mohanty, S.; Panda, S.; Parida, S.M.; Rout, P.K.; Sahu, B.K.; Bajaj, M.; Zawbaa, H.M.; Kumar, N.M.; Kamel, S. Demand side management of electric vehicles in smart grids: A survey on strategies, challenges, modeling, and optimization. Energy Rep. 2022, 8, 12466–12490. [Google Scholar] [CrossRef]
- Amara-Ouali, Y.; Goude, Y.; Massart, P.; Poggi, J.M.; Yan, H. A review of electric vehicle load open data and models. Energies 2021, 14, 2233. [Google Scholar] [CrossRef]
- Makridakis, S.; Spiliotis, E.; Assimakopoulos, V. M5 accuracy competition: Results, findings, and conclusions. Int. J. Forecast. 2022, 38, 1346–1364. [Google Scholar] [CrossRef]
- Ma, T.; Antoniou, C.; Toledo, T. Hybrid machine learning algorithm and statistical time series model for network-wide traffic forecast. Transp. Res. Part C Emerg. Technol. 2020, 111, 352–372. [Google Scholar] [CrossRef]
- Kożuch, A.; Cywicka, D.; Adamowicz, K. A Comparison of Artificial Neural Network and Time Series Models for Timber Price Forecasting. Forests 2023, 14, 177. [Google Scholar] [CrossRef]
- Helmus, J.R.; Lees, M.H.; van den Hoed, R. A data driven typology of electric vehicle user types and charging sessions. Transp. Res. Part C Emerg. Technol. 2020, 115, 102637. [Google Scholar] [CrossRef]
- Dai, X.; Li, H.; Olanrewaju, I.; Kotter, R.; Putrus, G.; Aslam, N.; Bentley, E.; Wang, Y.; Marzband, M.; Das, R.; et al. Data-Driven EV Charging Load Forecasting and Smart Charging. Transp. Res. Procedia 2022, 72, 2832–2839. [Google Scholar] [CrossRef]
- Kara, E.C.; Macdonald, J.S.; Black, D.; Bérges, M.; Hug, G.; Kiliccote, S. Estimating the benefits of electric vehicle smart charging at non-residential locations: A data-driven approach. Appl. Energy 2015, 155, 515–525. [Google Scholar] [CrossRef]
- Brady, J.; O’Mahony, M. Modelling charging profiles of electric vehicles based on real-world electric vehicle charging data. Sustain. Cities Soc. 2016, 26, 203–216. [Google Scholar] [CrossRef]
- Tsalikidis, N.; Koukaras, P.; Ioannidis, D.; Tzovaras, D. Hybrid CNN-LSTM Forecasting Model for Electric Vehicle Charging Demand in Smart Buildings. In Proceedings of the 2024 6th Global Power, Energy and Communication Conference (GPECOM), Budapest, Hungary, 4–7 June 2024; pp. 590–595. [Google Scholar] [CrossRef]
- Feng, J.; Chang, X.; Fan, Y.; Luo, W. Electric Vehicle Charging Load Prediction Model Considering Traffic Conditions and Temperature. Processes 2023, 11, 2256. [Google Scholar] [CrossRef]
- Aljohani, T.M. Multilayer Iterative Stochastic Dynamic Programming for Optimal Energy Management of Residential Loads with Electric Vehicles. Int. J. Energy Res. 2024, 2024, 6842580. [Google Scholar] [CrossRef]
- Abdelfattah, W.; Abdelhamid, A.S.; Hasanien, H.M.; Rashad, B.A.E. Smart vehicle-to-grid integration strategy for enhancing distribution system performance and electric vehicle profitability. Energy 2024, 302, 131807. [Google Scholar] [CrossRef]
- Souza, G.G.d.; Santos, R.R.d.; Godoy, R.B. Optimizing power grids: A valley-filling heuristic for energy-efficient electric vehicle charging. PLoS ONE 2025, 20, e0316677. [Google Scholar] [CrossRef] [PubMed]
- Promasa, N.; Songkoh, E.; Phonkaphon, S.; Sirichunchuen, K.; Ketkaew, C.; Unahalekhaka, P. Optimization of Sizing of Battery Energy Storage System for Residential Households by Load Forecasting with Artificial Intelligence (AI): Case of EV Charging Installation. Energies 2025, 18, 1245. [Google Scholar] [CrossRef]
- Carvalhosa, S.; Ferreira, J.R.; Araújo, R.E. Electric Vehicle Charging Method for Existing Residential Condominiums. IEEE Access 2024, 12, 166537–166552. [Google Scholar] [CrossRef]
- Sorensen, L.; Lindberg, K.B.; Sartori, I.; Andresen, I. Analysis of residential EV energy flexibility potential based on real-world charging reports and smart meter data. Energy Build. 2021, 241, 110923. [Google Scholar] [CrossRef]
- Norwegian Public Roads Administration. Trafikkdata. 2023. Available online: https://trafikkdata.atlas.vegvesen.no (accessed on 1 September 2023).
- Tsalikidis, N.; Mystakidis, A.; Koukaras, P.; Ivaškevičius, M.; Morkunaite, L.; Fokaides, P.; Tjortjis, C.; Tzovaras, D. Urban Traffic Congestion Prediction: A Multi-Step Approach Utilizing Sensor Data and Weather Information. Smart Cities 2024, 7, 10. [Google Scholar] [CrossRef]
- Norwegian Ministry of Energy. Key Facts About the Norwegian Renewable Energy Sector. 2024. Available online: https://energifaktanorge.no/en/norsk-energiforsyning/kraftproduksjon/ (accessed on 30 November 2024).
- Statnett. Data from the Power System—Statnett. 2023. Available online: https://www.statnett.no/en/for-stakeholders-in-the-power-industry/data-from-the-power-system/#import-and-export (accessed on 1 September 2023).
- Nord Pool. Day-Ahead Electricity Prices—Nordpool Group. 2023. Available online: https://data.nordpoolgroup.com/auction/day-ahead/prices (accessed on 30 November 2023).
- Lee, C.H.; Lin, C.R.; Chen, M.S. Sliding-Window Filtering: An Efficient Algorithm for Incremental Mining. In Proceedings of the International Conference on Information and Knowledge Management, Atlanta, GA, USA, 5–10 October 2001; pp. 263–270. [Google Scholar] [CrossRef]


| Field | Description | Units |
|---|---|---|
| Charging sessions | ||
| session_ID | Unique charging session ID | – |
| Garage_ID | Garage address identifier | – |
| User_ID | User identifier | – |
| User_type | Charger ownership (Private/Shared) | – |
| Start_plugin | Plug-in date and time | DateTime |
| Start_plugin_hour | Hour of plug-in (00–23) | – |
| End_plugout | Plug-out date and time | DateTime |
| El_kWh | Charged energy | kWh |
| Duration_hours | EV connection duration | Hours |
| weekdays_start | Plug-in weekday | Monday–Sunday |
| Plugin_category | 3-h interval category | e.g., morning, afternoon |
| EV charge load (Garages B12 & A1) | ||
| date_from | Start time | DateTime |
| date_to | End time | DateTime |
| AMS_kWh | Hourly aggregated load | kWh |
| Local traffic flow | ||
| date_from | Start time | DateTime |
| date_to | End time | DateTime |
| Nearby Locations | Hourly number of vehicles | Count |
| Net energy exchange (Norway) | ||
| date | Timestamp | DateTime |
| Net energy exchange | Amount of electric energy imported/exported | MWh |
| Descriptive Statistics | Garage B12 | Garage A1 |
|---|---|---|
| Count | 9424 | 8285 |
| Mean | 2.9772 | 1.0314 |
| Std. | 4.2723 | 2.0760 |
| Min. | 0.0000 | 0.0280 |
| 25th Percentile | 0.0500 | 0.0290 |
| Median | 0.4000 | 0.0290 |
| 75th Percentile | 4.5000 | 0.6400 |
| Max. | 26.4588 | 18.2180 |
| Model | RMSE | MAE | CVRMSE | NRMSE | |
|---|---|---|---|---|---|
| Test data-Garage B12 | |||||
| SVMER | 0.798 | 1.950 | 1.201 | 0.642 | 0.079 |
| LGBM | 0.758 | 2.105 | 1.257 | 0.708 | 0.088 |
| HGBR | 0.757 | 2.111 | 1.266 | 0.710 | 0.088 |
| CB | 0.763 | 2.085 | 1.286 | 0.701 | 0.087 |
| XGB | 0.735 | 2.201 | 1.331 | 0.740 | 0.092 |
| DTR | 0.696 | 2.358 | 1.392 | 0.793 | 0.098 |
| KNN | 0.655 | 2.514 | 1.598 | 0.845 | 0.105 |
| RF | 0.753 | 2.127 | 1.257 | 0.715 | 0.089 |
| HR | 0.688 | 2.389 | 1.352 | 0.803 | 0.100 |
| Test data-Garage A1 | |||||
| SVMER | 0.809 | 0.933 | 0.467 | 0.908 | 0.056 |
| LGBM | 0.775 | 0.955 | 0.477 | 0.932 | 0.066 |
| HGBR | 0.772 | 0.961 | 0.485 | 0.937 | 0.066 |
| CB | 0.776 | 0.952 | 0.490 | 0.928 | 0.066 |
| XGB | 0.750 | 1.007 | 0.504 | 0.982 | 0.070 |
| DTR | 0.719 | 1.067 | 0.525 | 1.041 | 0.074 |
| KNN | 0.524 | 1.390 | 0.765 | 1.355 | 0.096 |
| RF | 0.770 | 0.965 | 0.475 | 0.941 | 0.067 |
| HR | 0.712 | 1.081 | 0.494 | 1.054 | 0.075 |
| Train data | |||||
| SVMER (Garage B12) | 0.827 | 1.417 | 0.903 | 0.477 | 0.059 |
| SVMER (Garage A1) | 0.839 | 0.738 | 0.389 | 0.725 | 0.041 |
| Model | RMSE | MAE | CVRMSE | NRMSE | |
|---|---|---|---|---|---|
| Test data | |||||
| LSTM | 0.9617 | 0.031 | 0.023 | 0.061 | 0.043 |
| biLSTM | 0.9624 | 0.031 | 0.023 | 0.06 | 0.043 |
| GRU | 0.9567 | 0.033 | 0.024 | 0.064 | 0.046 |
| Time (Local) | Net Energy Forecast (MWh) | EV Charge Load Forecast (kWh) | Probability of Efficient Charge |
|---|---|---|---|
| 2019-03-01 06:00:00 | 1746.58 | 0.32 | Low |
| 2019-03-01 07:00:00 | −815.20 | 0.70 | Medium |
| 2019-03-01 08:00:00 | 164.16 | 0.63 | Medium |
| 2019-08-16 09:00:00 | 2744.52 | 0.35 | Low |
| 2019-08-16 10:00:00 | 1704.57 | 9.09 | Very Low |
| 2019-08-16 11:00:00 | 1550.41 | 0.22 | Low |
| 2019-03-16 10:00:00 | −3436.45 | 0.22 | Very High |
| 2019-03-16 11:00:00 | −3389.84 | 0.19 | Very High |
| 2019-03-16 12:00:00 | −3494.69 | 10.05 | Medium |
| 2019-04-07 12:00:00 | 1760.57 | 0.49 | Low |
| 2019-04-07 13:00:00 | −1290.92 | 3.25 | Low |
| 2019-04-07 14:00:00 | −453.22 | 6.05 | Low |
| 2020-01-29 12:00:00 | 3130.09 | 0.13 | Low |
| 2020-01-29 13:00:00 | 2941.38 | 0.41 | Low |
| 2020-01-29 14:00:00 | 2765.86 | 6.32 | Very Low |
| 2019-07-16 14:00:00 | −221.96 | 0.29 | Medium |
| 2019-07-16 15:00:00 | −1757.87 | 0.93 | Medium |
| 2019-07-16 16:00:00 | 1744.21 | 4.54 | Low |
| 2019-07-16 17:00:00 | 362.66 | 3.30 | Low |
| 2019-07-16 18:00:00 | 1059.23 | 4.66 | Low |
| 2019-05-08 19:00:00 | 2462.33 | 4.67 | Very Low |
| 2019-05-08 20:00:00 | 2168.85 | 8.59 | Very Low |
| 2019-05-08 21:00:00 | 1986.10 | 9.89 | Very Low |
| 2019-06-01 23:00:00 | −2897.51 | 1.03 | Very High |
| 2019-06-02 00:00:00 | −2798.59 | 4.67 | High |
| 2019-06-02 01:00:00 | −2558.05 | 0.22 | Very High |
| 2019-05-05 02:00:00 | −2722.13 | 5.03 | High |
| 2019-05-05 03:00:00 | −2584.82 | 0.17 | Very High |
| 2019-05-05 04:00:00 | −2490.52 | 5.75 | High |
| 2019-05-05 05:00:00 | −2592.87 | 0.19 | Very High |
Disclaimer/Publisher’s Note: The statements, opinions and data contained in all publications are solely those of the individual author(s) and contributor(s) and not of MDPI and/or the editor(s). MDPI and/or the editor(s) disclaim responsibility for any injury to people or property resulting from any ideas, methods, instructions or products referred to in the content. |
© 2025 by the authors. Licensee MDPI, Basel, Switzerland. This article is an open access article distributed under the terms and conditions of the Creative Commons Attribution (CC BY) license (https://creativecommons.org/licenses/by/4.0/).
Share and Cite
Tsalikidis, N.; Koukaras, P.; Ioannidis, D.; Tzovaras, D. Smart Charging Recommendation Framework for Electric Vehicles: A Machine-Learning-Based Approach for Residential Buildings. Energies 2025, 18, 1528. https://doi.org/10.3390/en18061528
Tsalikidis N, Koukaras P, Ioannidis D, Tzovaras D. Smart Charging Recommendation Framework for Electric Vehicles: A Machine-Learning-Based Approach for Residential Buildings. Energies. 2025; 18(6):1528. https://doi.org/10.3390/en18061528
Chicago/Turabian StyleTsalikidis, Nikolaos, Paraskevas Koukaras, Dimosthenis Ioannidis, and Dimitrios Tzovaras. 2025. "Smart Charging Recommendation Framework for Electric Vehicles: A Machine-Learning-Based Approach for Residential Buildings" Energies 18, no. 6: 1528. https://doi.org/10.3390/en18061528
APA StyleTsalikidis, N., Koukaras, P., Ioannidis, D., & Tzovaras, D. (2025). Smart Charging Recommendation Framework for Electric Vehicles: A Machine-Learning-Based Approach for Residential Buildings. Energies, 18(6), 1528. https://doi.org/10.3390/en18061528