Article

Framework for Selecting the Most Effective State of Health Method for Second-Life Lithium-Ion Batteries: A Scientometric and Multi-Criteria Decision Matrix Approach

1
Department of Mechanical Engineering, American University of Sharjah, Sharjah 26666, United Arab Emirates
2
Duroub Academy, Amman 11118, Jordan
*
Author to whom correspondence should be addressed.
Energies 2025, 18(6), 1527; https://doi.org/10.3390/en18061527
Submission received: 10 February 2025 / Revised: 16 March 2025 / Accepted: 17 March 2025 / Published: 19 March 2025
(This article belongs to the Section D2: Electrochem: Batteries, Fuel Cells, Capacitors)

Abstract

:
The predicted rapid accumulation of end-of-life lithium-ion batteries (LIBs) from electric vehicles (EVs) has raised environmental concerns due to the toxic nature of LIB materials. Consequently, researchers have developed reusing and recycling plans for end-of-life LIBs to extend their life spans, mitigate residual capacity loss, and reduce their environmental impact. As a result, many studies have recommended establishing a lifecycle framework for LIBs to identify and manage the potential options for reusing, recycling, remanufacturing, or disposal of second life LIBs. In response, the state of health (SOH) and state of safety (SOS) methods were introduced as key performance indicators (KPIs) to determine the batteries’ health and usability based on their capacity levels. Thus, both SOH and SOS methods are crucial for battery cell selection frameworks employed to designate batteries’ second-life applications. Various papers have analyzed and compared SOH methods, yet none have clearly quantified their differences, to determine the most effective method. Therefore, this study aims to create a framework for selecting the most effective SOH method for use in LIB frameworks by identifying and quantifying their main KPIs. The proposed framework will utilize scientometric analysis to identify the KPIs necessary for a gray relation analysis (GRA)-based multi-criteria decision matrix (MCDM) to select the appropriate SOH method.

1. Introduction

Recently, the rapid adoption of electric vehicles (EVs) as an environmentally friendly alternative to internal combustion engines (ICEVs) has led to new environmental challenges [1]. These issues mainly stem from the accumulation and recycling of end-of-life lithium-ion batteries (LIBs) of EVs. Initially, end-of-life batteries accumulate due to a lack of governing systems or frameworks to assign the batteries to their appropriate destination after their first use [1]. Recent EV models have an average lifespan of 200,000 km which surpasses petrol ICEVs lifespan of 186,700 km [2]. Although EV lifespans are still shorter compared to diesel ICEVs of 257,100 km, recent research has revealed their potential to achieve 313,000 km lifespans [3]. Since the average lifespan of EVs and their batteries is comparable to that of ICEVs, the accumulation of end-of-life batteries can be approximated using end-of-life ICEVs trends. The average number of end-of-life vehicles scrapped annually in the EU between 2008 and 2022 was 5.519 million units [4]. Furthermore, the number of end-of-life vehicles across the EU dropped from 6.1 million units in 2018 to 4.668 million units in 2022. Moreover, 5.5 million tons of waste materials were collected from end-of-life vehicles in 2022, which is a significant decrease from the 6.5 million tons collected in 2021 [4]. Furthermore, based on reasonable forecasts of EV and PHEV sales in the US for the year 2035, the annual number of end-of-life batteries is expected to increase from 1.2 M/year in 2015 to 6.12 M/year in 2035 [5]. Additionally, Tesla, the forerunner of the BEV industry, produced 4.365 million units just between 2020 and 2023 [6]. Thus, based on the presented estimates, the EU and US alone would accumulate on average 11 million units of end-of-life EV batteries annually.
Consequently, EV batteries are categorized as waste electrical or electronic equipment (WEEE) [7]. The electrodes and solid electrolyte interphase (SEI) of Li-ion, lead acid and nickel batteries contain critical raw materials such as cadmium, cobalt, lithium, manganese, nickel, and vanadium [7], in addition to the carbon graphite, iron phosphates, and other metal hydrides present in LFP and NiMH batteries. Furthermore, printed circuit boards (PCBs) that connect the batteries to the EV’s general circuitry and components contain aluminum, copper, and precious metals such as gold and silver [8]. PCBs containing higher percentages of precious metals contribute to safer EVs with better-performing battery management systems (BMS), faster charging, and efficient charge distribution [8]. As with WEEE, direct disposal of dead EV batteries through landfilling contaminates the landfilled soil and subsoil. It also contaminates underground freshwater sources near the landfilling site [7,9]. This is caused by the following: (1) interaction of moist soil with degrading plastic casings of battery packs; (2) leakage of acidic battery electrolytes into the soil; (3) interaction of moist soil with corroding toxic metals in battery electrodes such as cadmium and lead; and (4) heavy rains seeping into landfilled soil, carrying contaminants into underground water channels and freshwater sources.
Subsequently, multi-stage recycling processes are employed to extract EV battery materials. These processes include mechanical pretreatment, pyrolysis, leaching and hydrolysis, and electrolysis [7]. Initially, the pyrolysis of EV batteries’ plastic casings and PCBs burns polybrominated polyphenyl compounds which release toxic volatile organic compounds, dioxins, and furan gases into the environment [7]. Additionally, the precious metals within PCBs are lost to the slag byproduct of pyrolysis. Moreover, pyrolysis is less efficient than other metallurgical processes because it consumes more energy and results in lower recovery rates of targeted metal alloys [10]. For instance, recent work by Hu et al. (2021) proposed pyrolysis via the reductive melting of end-of-life LIB electrodes at 1600 °C. The method resulted in recovering Li as concentrated Li2CO3 with a recovery rate of 68.3% and Co, Ni, and Mn were recovered as metal alloys [11]. Later, another method was proposed to convert Li species from the lattice into a water-soluble form using a methane reduction reaction, resulting in a Li recovery rate of 71.23% [12].
Alternatively, leaching and hydrometallurgical processes yield recovery rates of 90–100% for all metals within EV batteries [7]. Moreover, 90–98% of precious metals in battery PCBs can be recovered using this process. However, this approach consumes copious amounts of freshwater and energy [7]. Furthermore, improper disposal of the used water also leads to soil and freshwater contamination [7,9]. Electrolysis processes also have high recovery rates of 95–100% for all metals of EV batteries. Earlier electrolysis vats had uncovered surfaces, allowing the formation of hazardous acidic mists that corrode facility equipment and damaged workers’ respiratory systems [7,9].
Over time, new LIB recycling processes and modifications were introduced to reduce their impact on the environment. For instance, electrometallurgical processes recently had modifications where plastic balls are utilized to cover the surface of their acidic solutions. These plastic ball covers prevent the bursting and escaping of O2 bubbles contributing to the formation of acidic mists [7]. In addition, newer pyro-metallurgy furnaces using Umicore technology trap released gases in gas collection and treatment chambers [11]. These gas chambers utilize afterburn processes, or rapid quenching at temperatures below 180 °C, to treat the released gases containing furans and dioxins before releasing them into the environment [11]. Moreover, emerging pyrometallurgical processes such as additive-assisted roasting or microwave roasting boast recovery rates of 93–100% for Li. However, their reliance on acidic leaching catalysts causes equipment corrosion and increases their recovery costs [10].
Consequently, several studies have called for the development of EV battery lifecycle frameworks to mitigate their environmental impact and extend their lifespan [1,7,13,14,15,16,17]. Initially, efforts are directed towards battery reuse to extend the battery life and reduce the number of expired batteries scrapped yearly. This would effectively mitigate the environmental impact of recycling processes while optimizing the battery life and energy potential. Coincidently, the EU and Germany plan to use clean variable renewable energy systems (VRESs) to generate 80% of their energy by 2050 in compliance with the Energy SDGs of the same year [18]. Moreover, end-of-life EV batteries will be used as storage cells to cover the VRES flexibility demand [18,19]. The flexibility demand refers to the energy required to cover drops in VRES production during the grid’s peak demand hours [18]. These drops in VRES production occur due to the variable nature of their energy sources being reliant on weather conditions and natural phenomena. Various studies have estimated the flexibility demand for the EU’s 2050 VRES powered grid to be between 40 and 100 GW/year [18,19], of which 33 GW is already covered by the currently in place pumped hydrogen storage systems (PHSs) [18]. Therefore, battery energy storage systems (BESSs) intended to cover the flexibility demand would need to cover 6 GW annually at the lowest estimate and 67 GW annually at the highest estimate [18,19]. Furthermore, the average capacity of a used EV battery is 60 KWh, down from an initial capacity of 75 KWh. Considering a flexibility demand of 67 GW/year and the average end-of-life battery capacity, at least 13.4 million end-of-life batteries are needed to meet the yearly flexibility needs of the EU. This demand could easily be met with the rise in EV production and accumulation of end-of-life batteries. Consequently, EV battery lifecycle frameworks require a sorting mechanism to distinguish end-of-life EV batteries suitable for reuse in BESS applications [13,18,19]. The framework should also identify the most appropriate application for each battery based on its remaining capacity. Additionally, it should make use of optimal deposit return frameworks to incentivize EV users to return used batteries to EV manufacturers or other private recycling entities for due processing [1].
Accordingly, battery state of health (SOH) and state of safety (SOS) estimation models, and battery chemical compositions have been identified as crucial to the development of the necessary battery lifecycle frameworks [9,13,14]. SOH is defined as the remaining capacity of the battery at full charge, compared to its original rated capacity at full charge by the OEM [13]. Generally, EV batteries are deemed expired once 20% of their original rated capacity is depleted [13]. Evidently, some batteries can continue to power EVs beyond this limit. However, manufacturers impose this limit to indicate the end of the batteries’ optimum performance within their vehicles. Beyond the imposed SOH limit, the batteries charge and capacity retaining capabilities are significantly reduced leading to inconvenient longer charging times and quicker battery discharging [13,14]. On the other hand, SOS measures the safety of the battery during use based on the assessment of fault tree analysis (FTA) or fault mode and effects analysis (FMEA) models [14]. These models are based on the safety level standards of the European Council for Automotive Research and Development (EUCAR) [14]. Although SOS methods can be used by EV battery management frameworks, the selection of appropriate SOS methods for use in battery management frameworks is not part of this framework’s scope. Consequently, the chemical composition of EV batteries can be used in EV batteries’ lifecycle frameworks as a sorting category for selecting appropriate recycling methods for dead batteries unfit for reuse or repurposing [9].
Another relative term is the state of charge (SOC) defined as the optimum capacity currently available in a battery in contrast to its remaining capacity at full charge [13]. SOC is used to determine EV batteries’ current charge percentage, like how smartphones display battery charge percentage. The methods used to determine a battery’s SOH can also be used to determine its SOC, and vice versa. Various studies [13,20,21,22,23,24,25,26,27,28,29,30,31,32] have reviewed different SOH/SOC estimation methods which are presented in Figure 1. Ungrean et al. [20] compared different SOH algorithms and evaluated their viability for embedded applications. Huang et al. [21] reviewed the different types of machines learning-based SOH methods and presented their advantages and disadvantages. Noura et al. reviewed and assessed the different online state of health methods and listed their advantages and disadvantages [28]. Moreover, Cannarella et al. [22] presented a different approach to evaluating the SOH onboard EVs using mechanical properties measurement techniques. This approach can later enable determining batteries’ SOH in real time during driving conditions. Lotfi et al. [25] and Zhang et al. [31] presented new mixed SOH methods combining empirical and data-based SOH estimation methods to establish new linked IoT methods that can be easily integrated onboard EVs. But no clear evaluation or selection criteria based on quantifiable key performance indicators (KPIs) have been established in the literature for comparing and selecting SOH methods. Therefore, there is a need to develop a clear framework for evaluating and selecting SOH methods. This framework must be based on the KPIs of SOH methods identified in the relevant literature. Thus, this work aims to develop a scientometric and gray relation analysis-based multi-criteria decision matrix framework specifically for selecting the appropriate SOH estimation method to be used in EV battery lifecycle management frameworks. Section 3 presents the methodology of extracting the main KPIs of the SOH estimation methods from the literature using scientometric analysis. In addition to describing how to utilize the gray relational analysis (GRA) to build the multi-criteria decision matrix (MCDM) using the identified KPIs. Subsequently, Section 4 will present a case study demonstrating the effectiveness of the MCDM selection framework. Finally, conclusions drawn from the results of the SOH method selection framework, and its potential applications in future EV battery lifecycle frameworks, will be discussed.

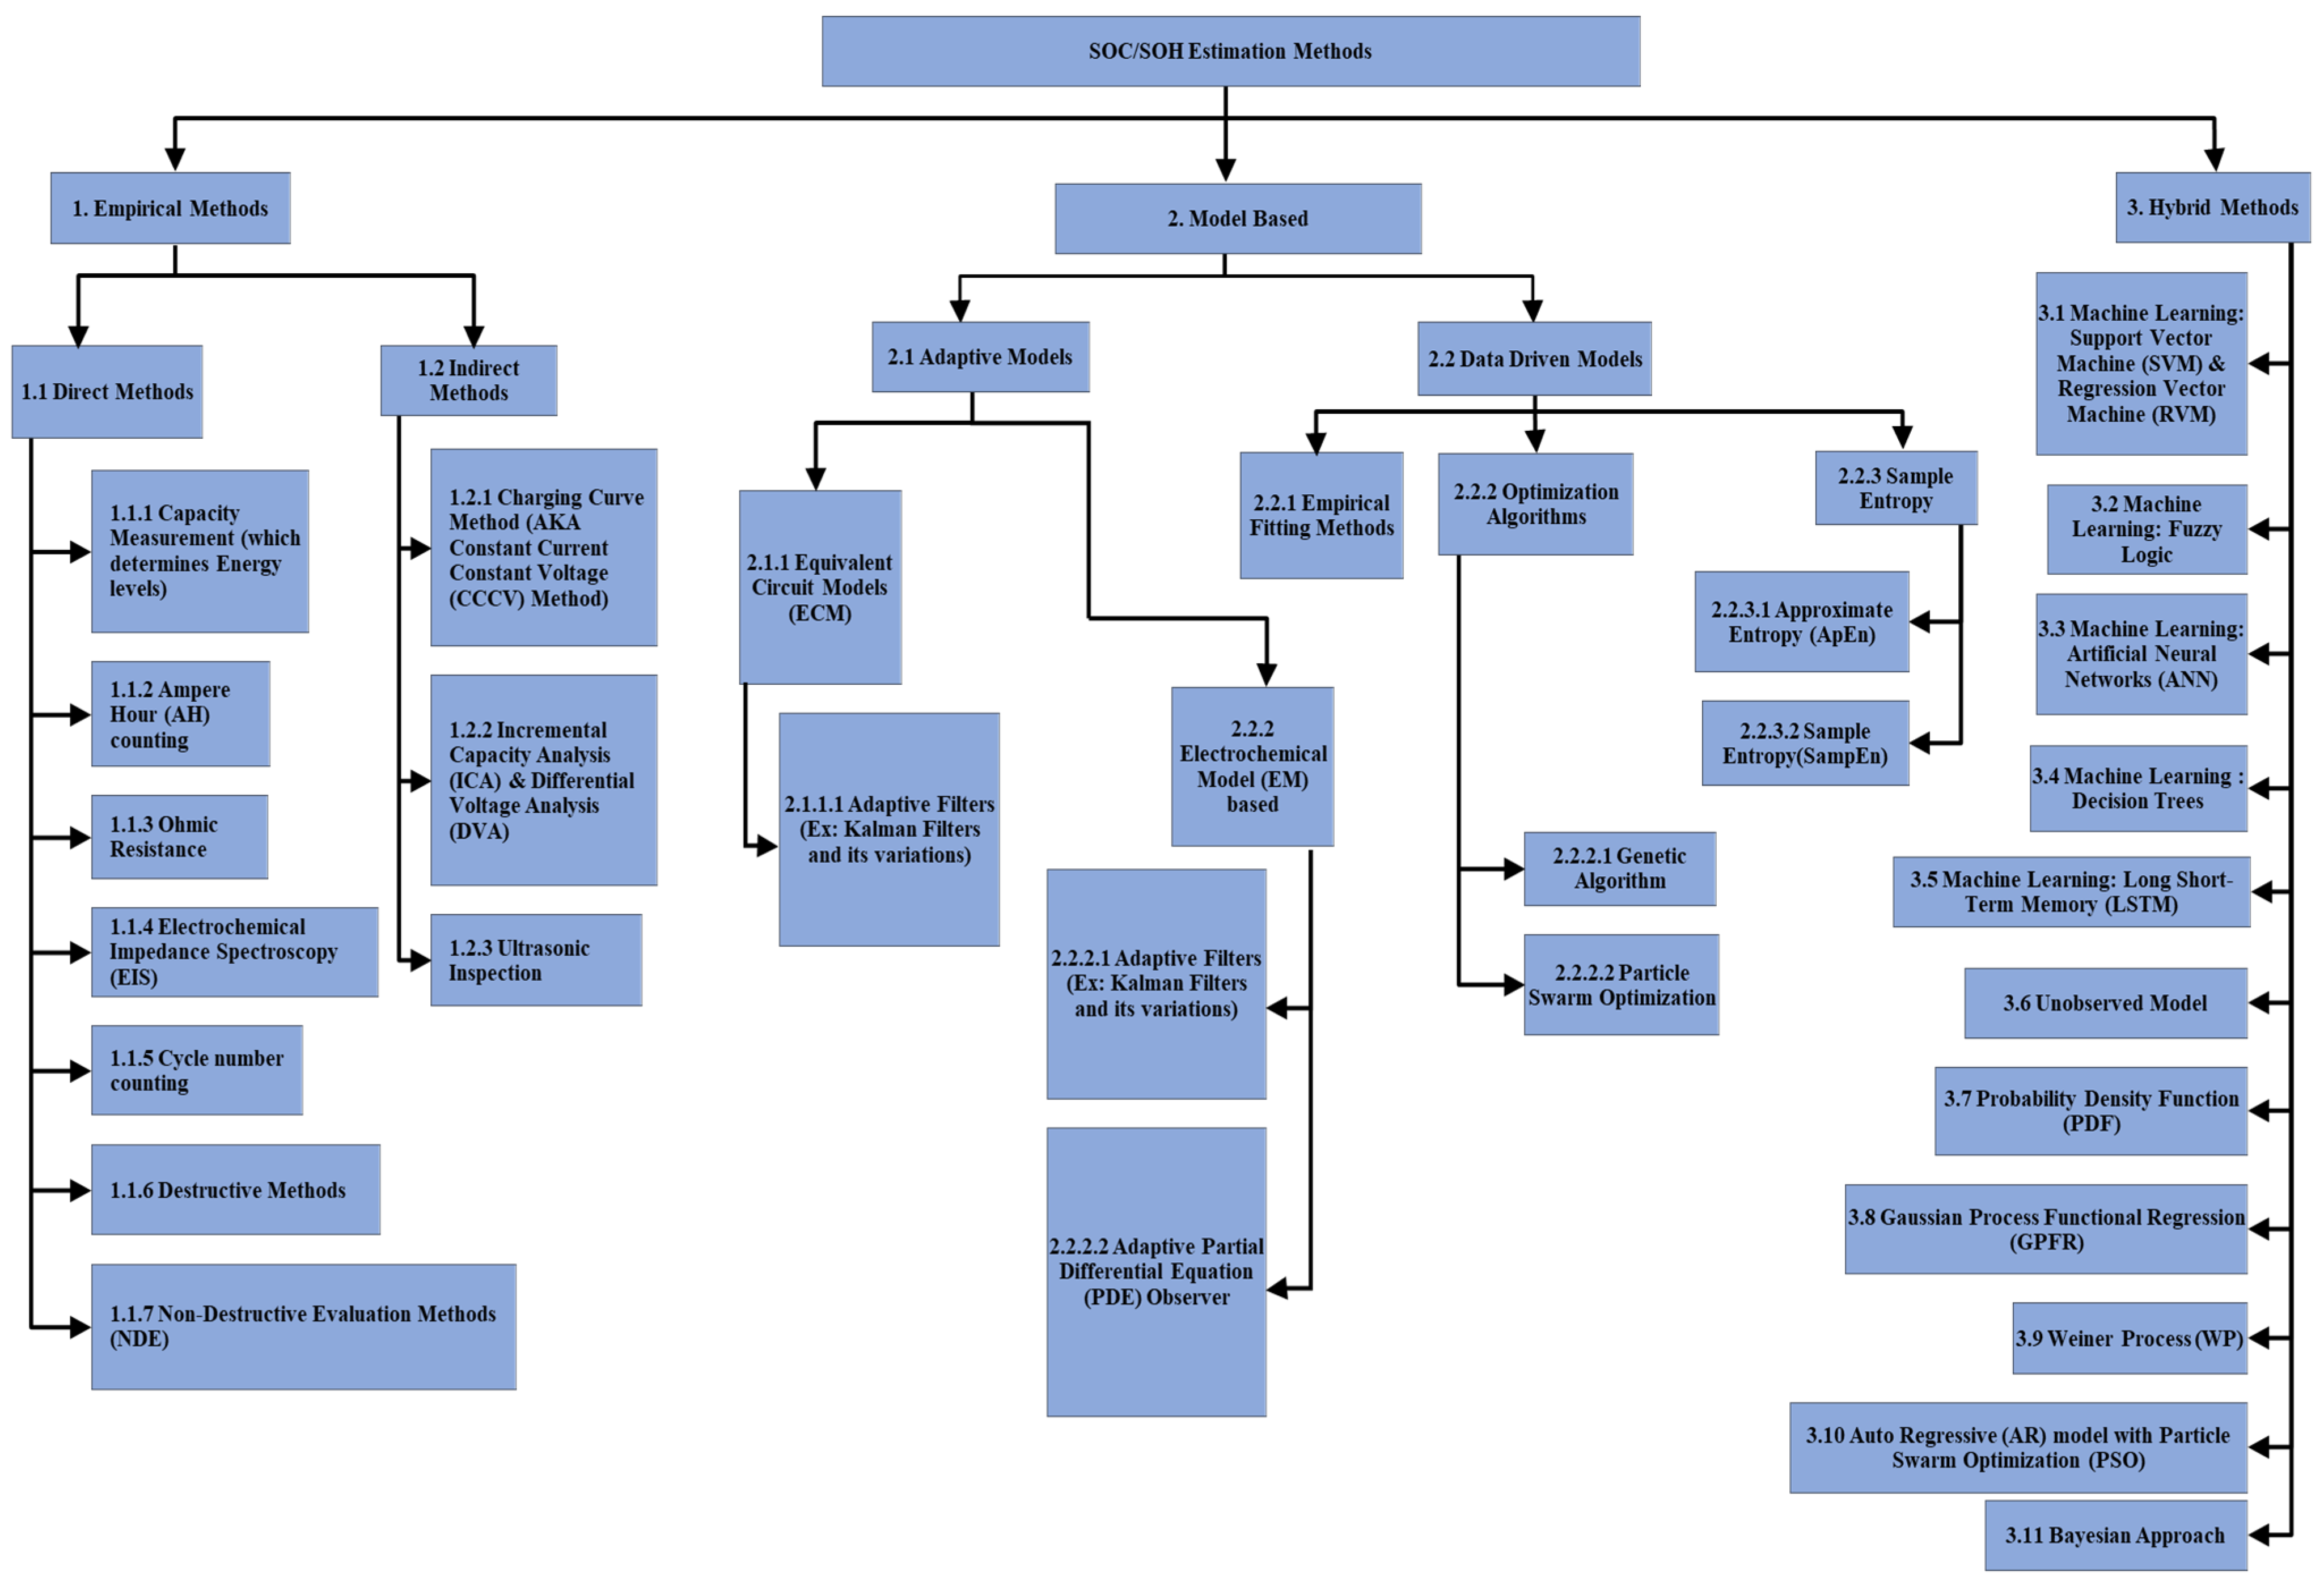
2. Methodology of Evaluation of SOH Methods

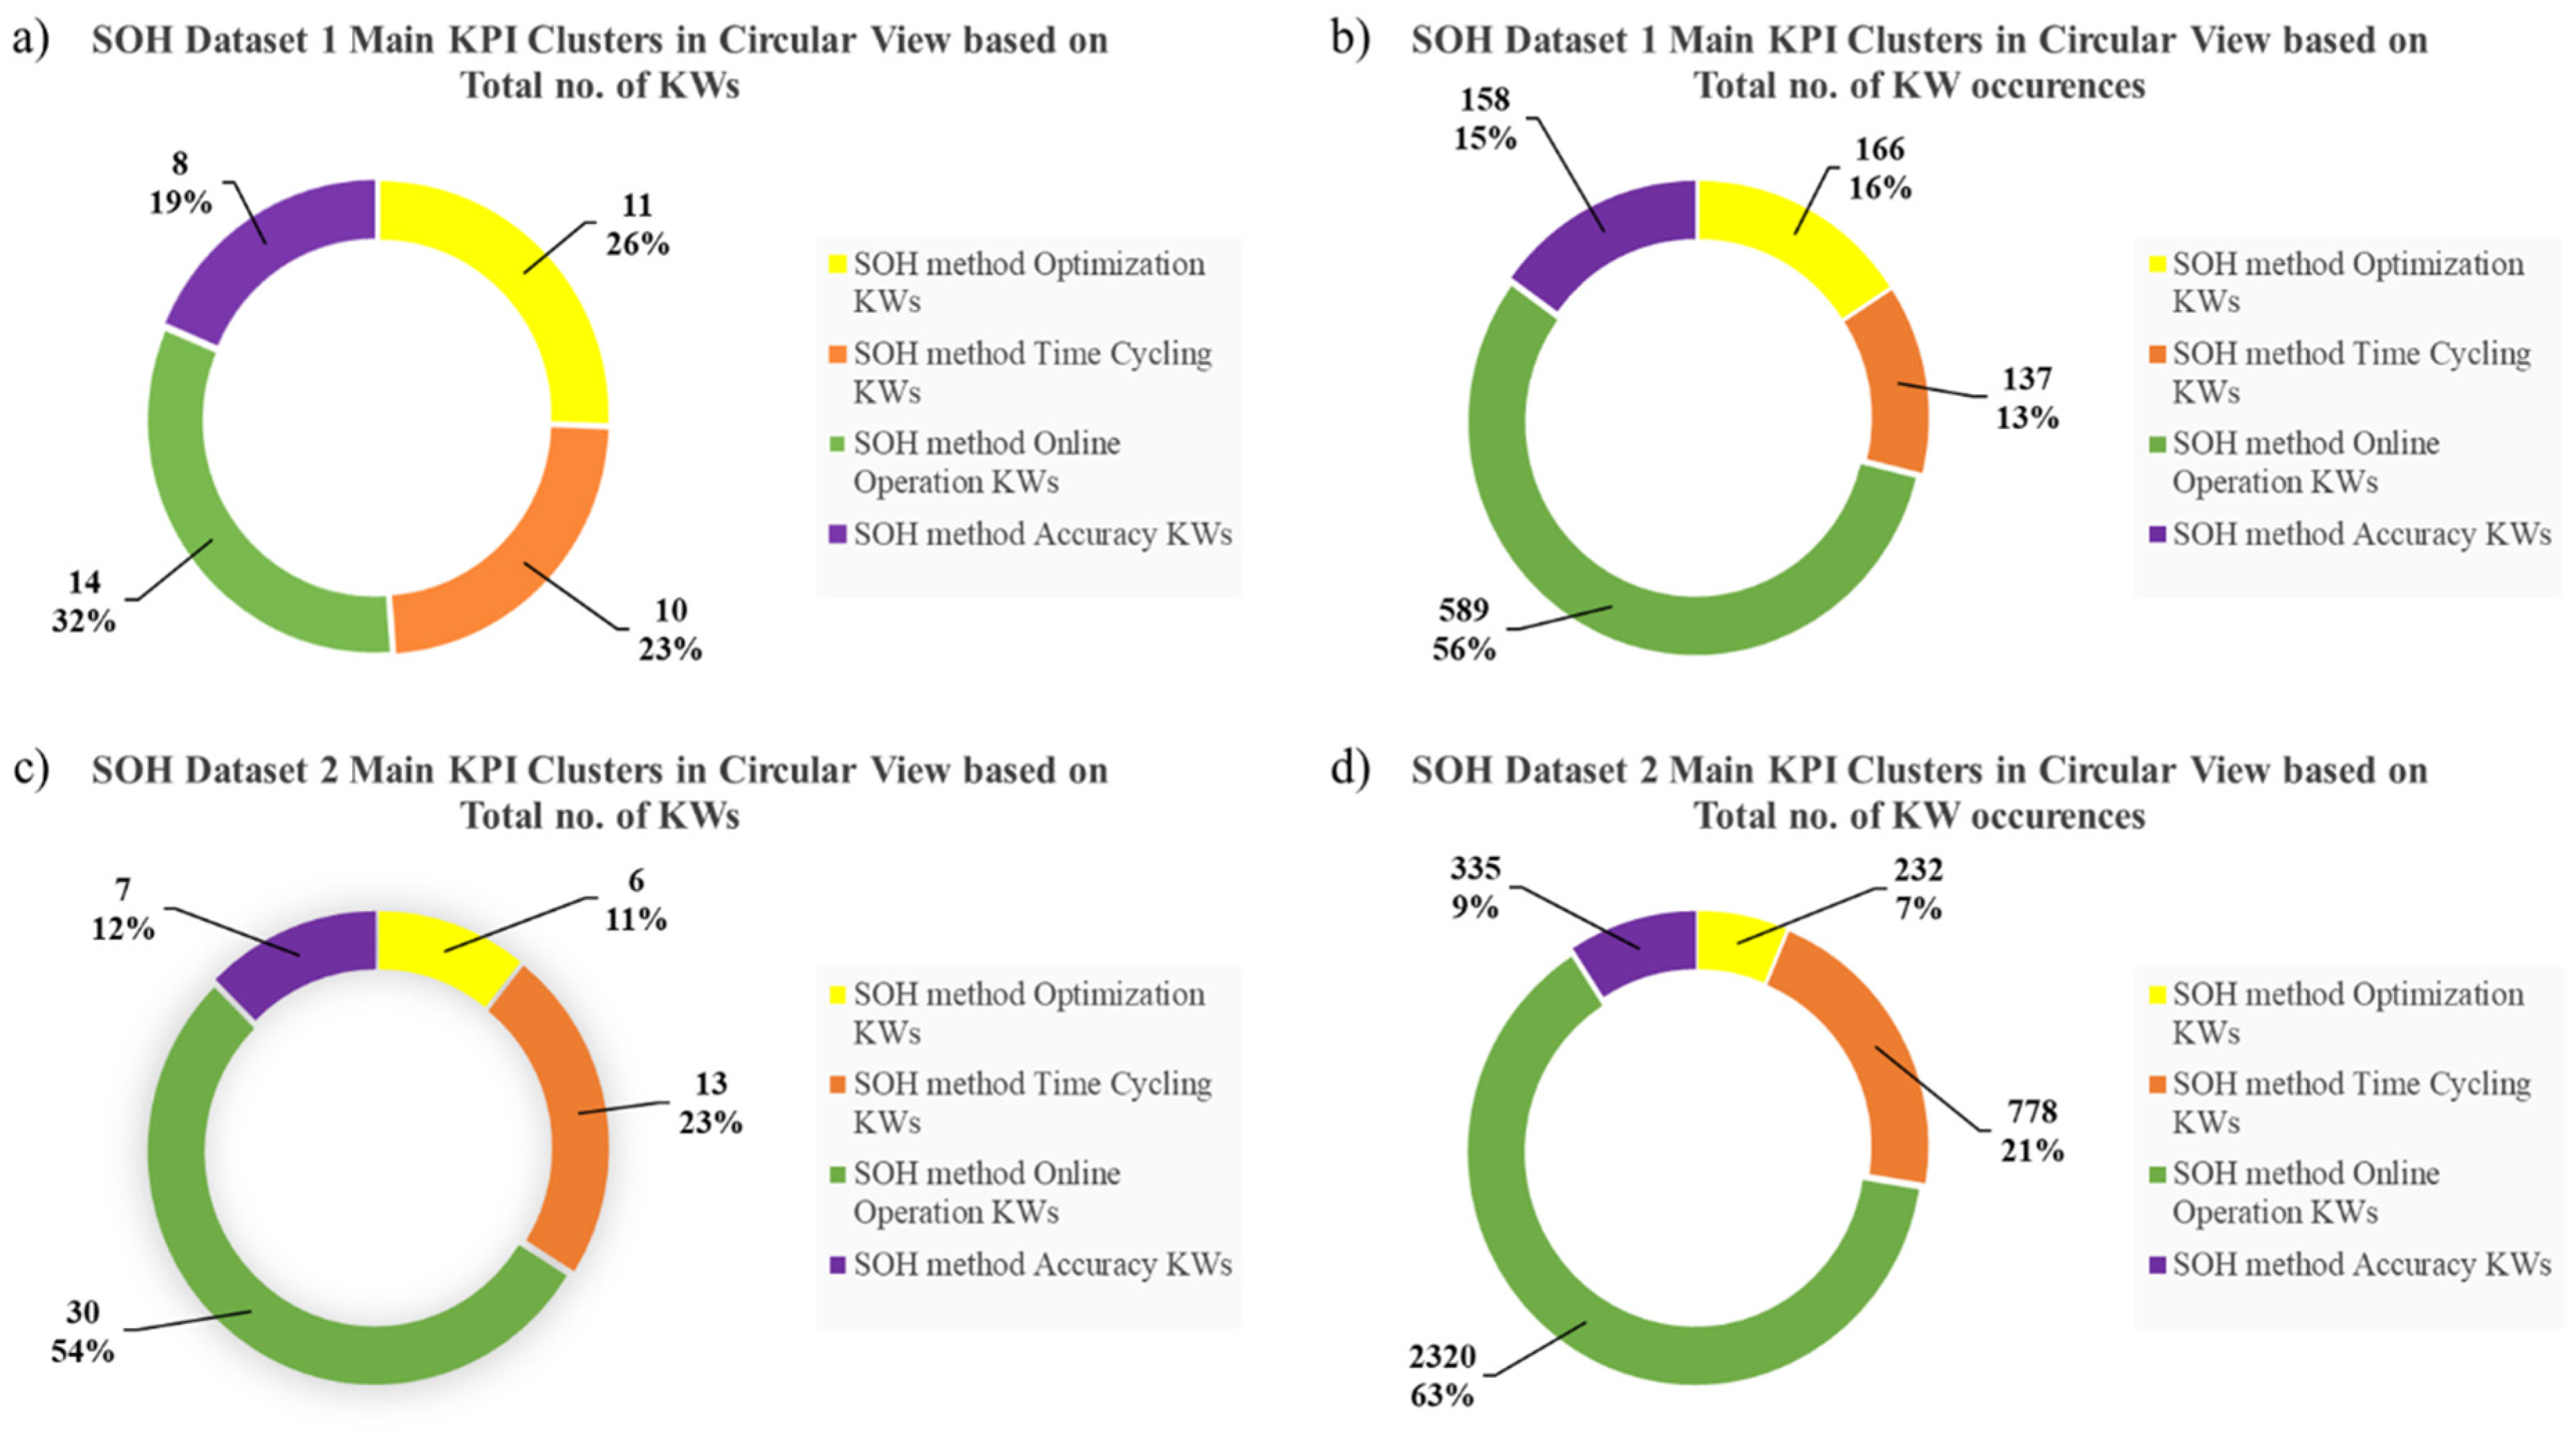
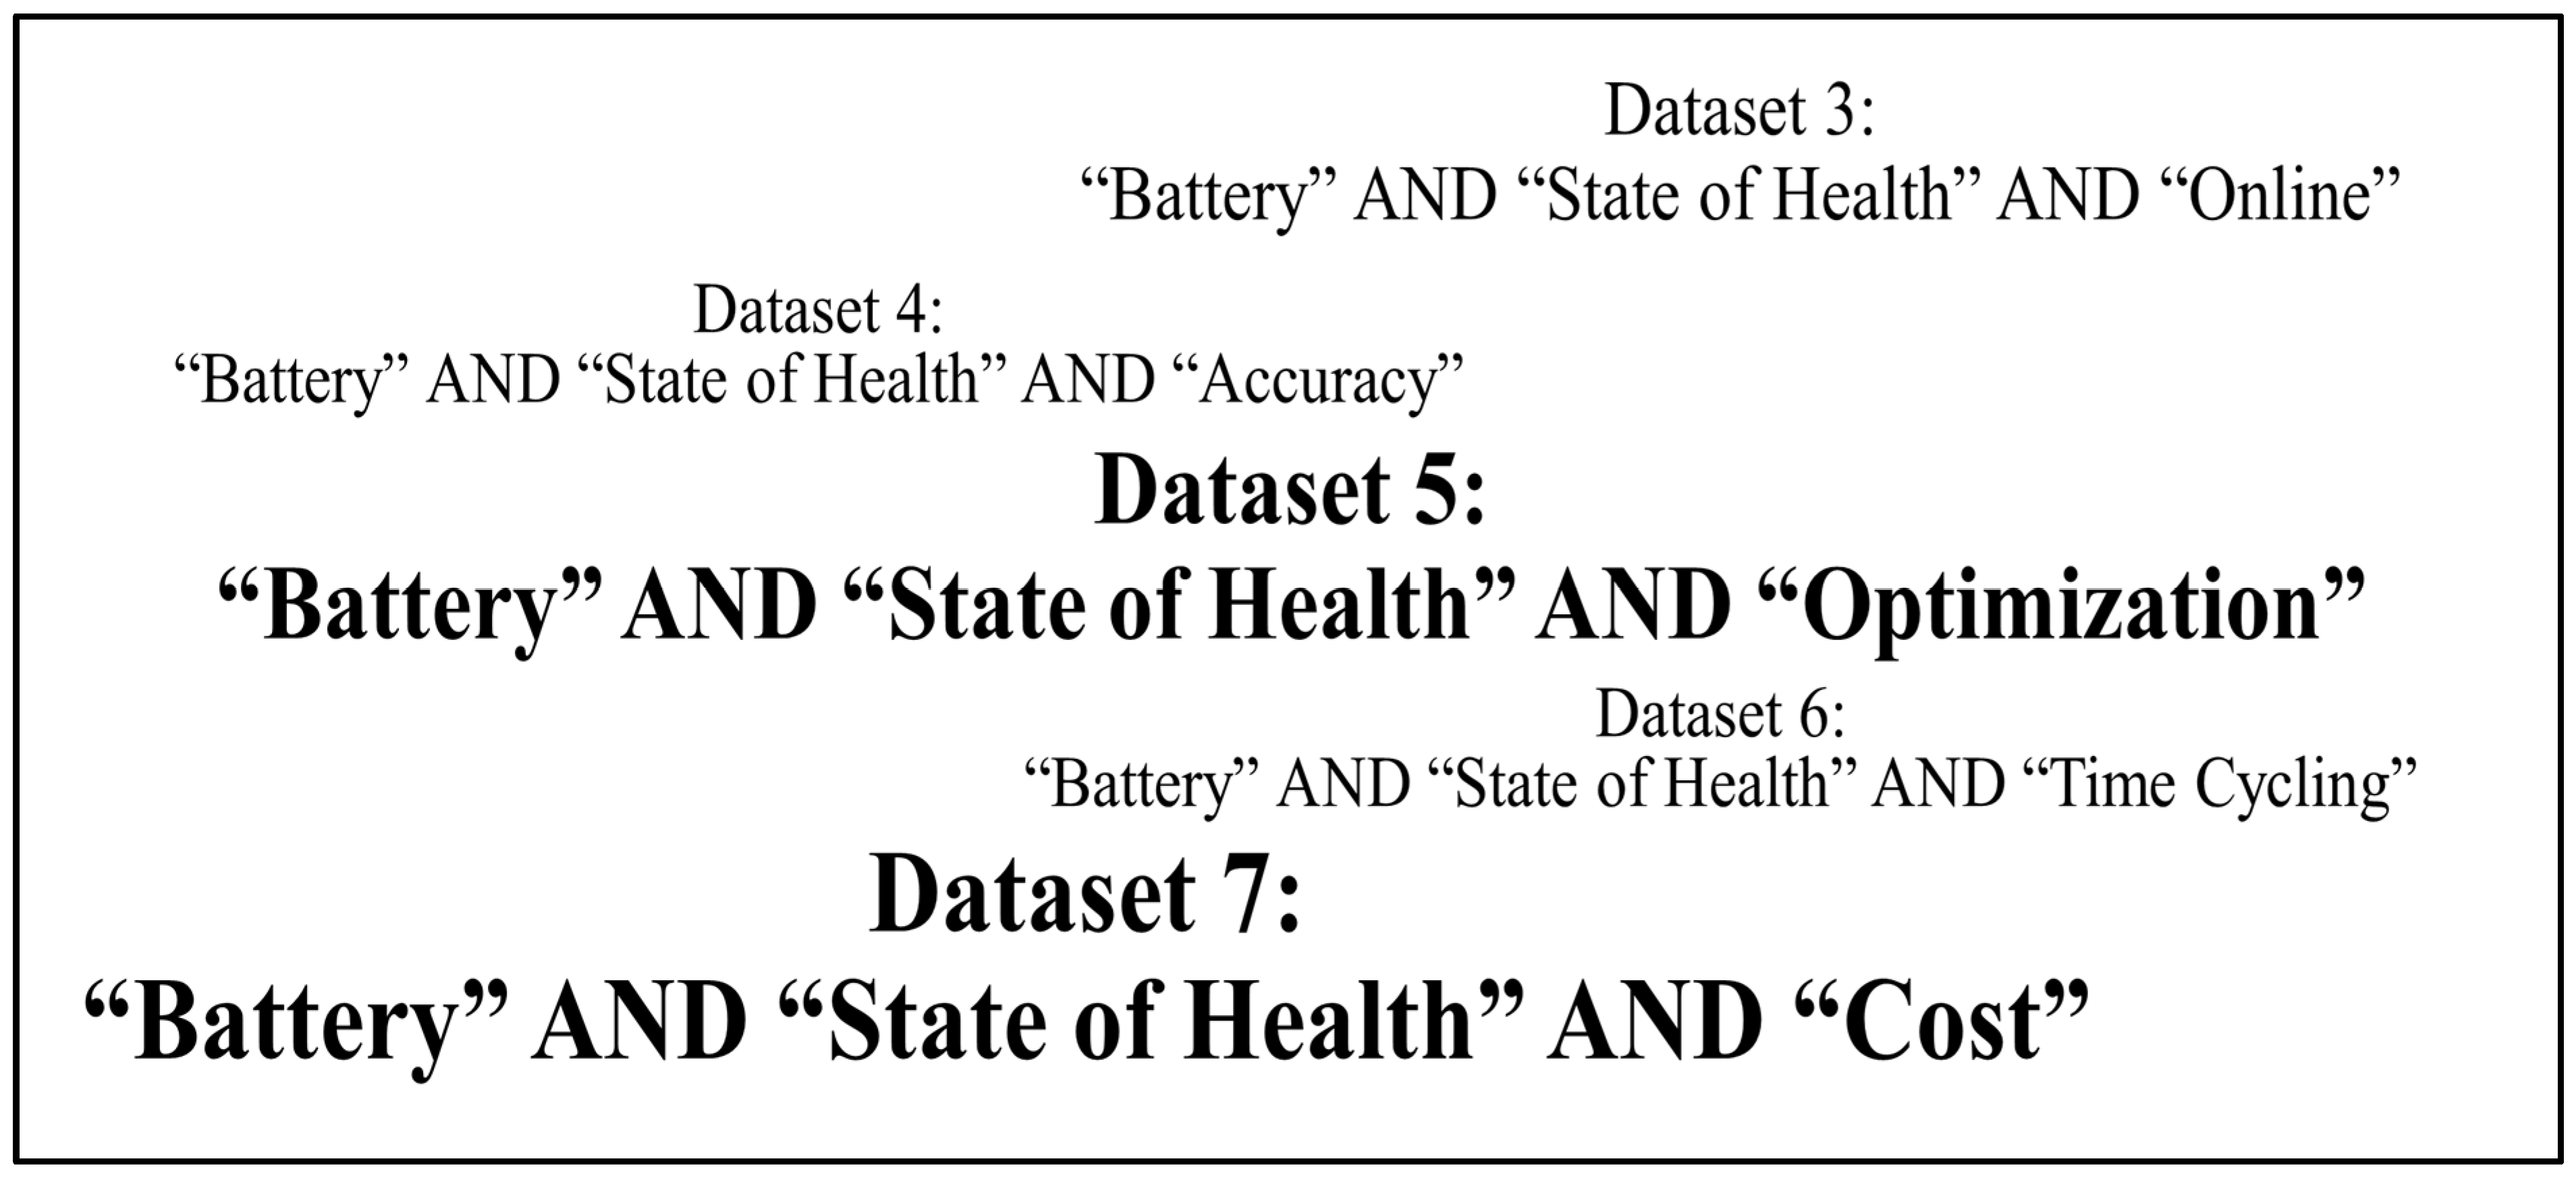
2.1. Identifying the Main KPIs Using Scopus and Scientometric Analysis

Initially, it is essential to acquire reliable datasets of scientific journal articles related to SOH from the literature. These journal article datasets can be analyzed by scientometric analysis to extract SOH-related keywords and indicators. Scientometric analysis is the science of quantifying aspects of scientific publications, science and technology policies, and research and development practices [33]. Furthermore, it relies on citation analysis techniques to analyze patterns and characteristics of authors and documents of a scientific field. Also, scientometrics is useful in discovering indicators for science and technology policy processes and research and development purposes [33]. Thus, it can determine the main KPIs of SOH from the most prevalent keywords in the relevant literature.
Consequently, the Scopus literature search engine and database were used to acquire the SOH journal article datasets. Through multiple search iterations two main datasets were acquired. Dataset 1 was acquired using the search terms, “Battery” AND “State of Health” AND “Indicator”, which resulted in 403 papers. Dataset 2 was acquired using the search terms, “Battery” AND “State of Health” AND “Parameters”, which resulted in 1448 papers. Both datasets contained more than 150 keywords in their search results. However, closer inspection revealed that the keywords of both datasets were almost matching, with some keywords being repeated more in Dataset2, due to its larger pool of papers.
Cluster views of both datasets were generated as shown in Figure 2 and Figure 3, to identify clusters of like term keywords, and group them together. Subsequently, seven main keywords clusters were identified as follows:
  • SOH methods;
  • Cycling time of SOH methods;
  • Optimization of SOH methods;
  • Online operating SOH methods;
  • Accuracy of SOH methods;
  • SOH methods measured indicators;
  • Other SOH methods-related.
The clusters were named based on the most common factor among their constituent keywords. For instance, cluster 1 contained names of different SOH methods found in the literature. Cluster 2 contained keywords related to the time required to gather battery cycling and aging data. Next, cluster 3 contained keywords related to the optimized SOH methods such as performance, safe operation, and particle swarm optimization of SOH estimation methods. Meanwhile, cluster 4 contained keywords of properties related to IoT-linked SOH methods. Cluster 5 included error measurement technique keywords which emphasize the accuracy of SOH estimation methods. Cluster 6 contained keywords related to the parameters and indicators measured by SOH estimation methods. Lastly, Cluster 7 contained general keywords related to the various applications that employ battery SOH estimation methods. Thus, from the extracted clusters, the main KPIs for evaluating the performance of SOH methods are determined to be online operation, cycling time, optimization, and accuracy. Although the other clusters are related to SOH methods, they are not suitable for use as evaluation criteria for the selection of SOH methods. This is due to their consistence of repeated keywords of capacity measurement indicators such as “Internal Resistance”, and “Open Circuit Voltage”, used to obtain training data cycles for use by model-based SOH methods. Other repeated keywords across clusters include SOH method nomenclature terms, such as “Support Vector Machine” and “Regression Models”. which are not useful for evaluation purposes. Figure 4 demonstrates the ranking of the main KPI clusters based on their total number of keywords and total number of recurrences of their keywords.
The online operating SOH methods cluster represents SOH methods that can be integrated within IoT and cloud-based technology. These SOH methods can track the SOH and SOC changes and log them for all EV trips across the batteries’ lifetimes [20,28]. Accurate and robust measurement techniques are essential for estimating batteries’ current SOH levels to determine their suitability for use in EVs. When a battery drops below 80% SOH, it is no longer valid for use in EVs and must be repurposed for other applications such as BESS of VRES [13,34,35,36]. Furthermore, once a battery drops below 60% SOH, it is considered unsuitable for use, as it cannot maintain its charge and experiences rapid energy leakages and dissipations, which pose a risk to the battery’s SOS [14].
Other factors, such as sudden drops in the capacity due to shocks or accidents causing damage to the battery’s inner structure, can also cause sudden changes in the battery’s SOH. Inaccurate measurement of these sudden changes can lead to operating the vehicles past their safe and optimum operation levels for EV applications [13,20,21,22,23,24,25,26,27,28,29,30,31,32]. Therefore, accurate models that can estimate SOH deterioration based on the change in capacitance are crucial.
Additionally, the optimization of SOH methods involves balancing multi-objectives such as cost and complexity of online operating, or IoT-related SOH methods [37,38,39]. The cycling time cluster is related to the total number of cycles needed to gather the necessary data to formulate the SOH decay estimation curves [13,20,21,22,23,24,25,26,27,28,29,30,31,32]. High cycling times were needed to develop the SOH estimation method, which increased their development time and costs. However, the keyword analysis overlooks another important criterion, the cost of developing the SOH estimation methods. Additionally, it does not account for the interdependence between the revealed KPIs. Therefore, further investigation was required to assess the influence of cost on the selection of SOH methods and to examine the interdependence among the identified KPIs. The investigation was performed by combining the search terms of the main datasets with the terms of the main KPIs, to create four new search datasets named Dataset 3, Dataset 4, Dataset 5, and Dataset 6, and after a final search, Dataset 7 was created by combining the search terms with the word cost, as shown in Figure 5.
Subsequently, Datasets 3 through 6 included keywords from the other KPI clusters, thereby confirming the interdependence of the identified KPIs. Moreover, Dataset 5 successfully identified 61 documents out of a total of 565 related to the cost-optimized SOH estimation methods. The top cost-related keywords of Dataset 5 were multi–objective optimization, costs, social and economic effects, and fuel economy, with 55, 18, 13, and 11 recurrences, respectively. Meanwhile, Dataset 7 resulted in 652 documents and 160 keywords relating to the previously established KPIs, and 14 new keywords relating to costs were discovered having a total of 282 recurrences within 202 documents of the original 652 documents. Therefore, cost is justified as an underlying KPI cluster within the optimization cluster of SOH estimation methods’ evaluation criteria. Figure 6 shows the newly defined KPI cost cluster.
Thus, the main KPIs that can be used as the evaluation criteria for selecting SOH estimation methods are online operation, accuracy, cost optimization, and time cycling. The next step in this framework is to develop the evaluation system. To objectively compare the different SOH estimation methods, they must be clearly quantified in terms of the defined interdependent evaluation criteria. Therefore, gray relational analysis (GRA), a weighting and grading method commonly used to create multi-criteria decision matrices (MCDMs) and perform optimization analyses [40], will be employed for this purpose. Furthermore, GRA has the unique benefit of allowing field experts to influence the results of the final method rankings. The GRA allows experts to assign weights to each evaluation criteria based on their importance according to the market needs and their experience. The following section will detail how to utilize the GRA method to create the MCDM and select the best SOH estimation method.

2.2. Modeling the Gray Relational Analysis-Based Decision Matrix

Gray relational analysis (GRA) is a normalization and weighting method that accounts for the interdependencies of its observed parameters. Hence the first step is to tabulate raw data of the main KPIs for the different SOH methods under consideration. Next, the KPIs must be categorized as beneficial and non–beneficial indicators for normalization, where beneficial KPIs are indicators that need to be maximized, while non-beneficial KPIs are indicators that need to be minimized [40]. This categorization of the evaluation KPIs streamlines the decision-making process by highlighting SOH methods with the highest and lowest scores for beneficial KPIs and nonbeneficial KPIs, respectively. Sequentially, the beneficial and non-beneficial KPIs’ data for each SOH method are normalized using Equations (1) and (2), respectively. Where Y S O H i , K P I is the raw value of a KPI (ex. accuracy) of the ith SOH method (ex. SVM), and x S O H i , K P I is the GRA normalized KPI value (ex. accuracy) of the ith SOH method (ex. SVM). Plus, x 0 , K P I is the ideal normalized value of a KPI for all SOH methods [40]. For beneficial KPIs of accuracy and online operation the ideal normalized value x 0 , K P I is 1, and for non-beneficial KPIs of optimized cost and time x 0 , K P I is 0. Consequently, the GRA compares the normalized values of the KPIs to the normalized values of the ideal SOH method. This is accomplished using the gray relational coefficient (GRC) score (γ) calculated by Equation (3). The GRC score indicates the closeness of the normalized KPIs of each method to the KPIs of an ideal SOH method. Furthermore, GRC scores highlight the best performing SOH method for each specific KPI. Usually, a gray relational suppression value (ζ) is used to reduce GRC scores as presented in Equation (3), but it is not required for this framework’s purpose and is assumed to be 1. However, industry experts can use different values, based on their desired output. Subsequently, the gray relational values of the SOH methods are weighed and aggregated to obtain their final grades as presented in Equation (4). The final grades of the methods best represent the interdependencies of the KPIs while accounting for the optimization goals of the matrix users. For the framework’s purposes, the weights will be assigned to each category based on their percentage in Figure 4d, where the KPI categories are ranked based on their number of recurrences in Dataset 2, which reflects their importance in the literature.
Equation (1): GRA normalization of Beneficial Parameters
x S O H i ,   B e n e f i c i a l   K P I = Y S O H i , K P I M i n ( Y S O H i , K P I ) M a x Y S O H i , K P I M i n   ( Y S O H i , K P I )
Equation (2): GRA normalization of Non-Beneficial Parameters
x S O H i , N o n B e n e f i c i a l   K P I = M a x ( Y S O H i , K P I ) Y S O H i , K P I M a x Y S O H i , K P I M i n   ( Y S O H i , K P I )
Equation (3): Gray Relational Coefficient (GRC) score of SOH Method
γ ( x 0 , K P I , x S O H i , K P I ) = M i n Δ S O H i , K P I + ζ M a x ( Δ S O H i , K P I ) Δ S O H i , K P I ζ M a x ( Δ S O H i , K P I )
where
Δ S O H i , K P I = x S O H i , K P I x 0 , K P I
Equation (4): GRA Grade of SOH Method
Γ ( x 0 , x S O H i ) = P = 1 6 w K P I γ ( x 0 , K P I , x S O H i , K P I )

3. Case Study

This case study details the raw KPI data collection for SOH methods and demonstrates the GRA-based MCDM method selection process. The case study is performed for the following SOH methods: capacity measurement, dynamic open voltage testing (VOC), scanning electron microscope (SEM) desktop-based and floor-based models, long short-term memory (LSTM), support vector machine (SVM), optimized regression vector machine (optimized RVM), particle swarm optimization with support vector regression (PSO-SVR), Wiener process (WP), and Gaussian process functional regression (GPFR).

3.1. KPI Data Gathering Process

3.1.1. Online Operation

Initially, online operating SOH estimation methods refer to SOH methods that can provide live measurements of EV battery SOH indicators. These indicators include internal resistance, open voltage, temperature, etc. Once the live measurements are taken, they are uploaded to an online data storage system, which can be used to perform online SOH estimation. Consequently, the online system relays SOH levels to the user through the EV computer’s GUI, or a phone application that tracks their vehicle’s stats [20,28]. Moreover, online SOH methods can be linked with battery management systems (BMSs) and BESSs to maximize battery energy use and prevent degradation [20,28]. Furthermore, online SOH methods can utilize various machine learning techniques, such as neural networks, support vector machines (SVMs), or long short-term memory (LSTM). These methods are trained using equivalent circuit models (ECMs) or previous statistical data from the empirical testing of EV batteries. The online system compares the live-captured data to the statistical data to estimate the current SOH levels of the batteries [20,28]. Additionally, online prediction models can predict the SOH levels based on the current SOH indicator levels [20,28].
Online-based SOH estimation methods face many challenges, including reducing model complexity and computation time while maintaining high accuracy [20,28]. Thus, sub-KPIs for online SOH methods can be defined as these methods evolve. When online SOH methods are widely adopted by EVs, they can be evaluated based on user experience, data storage size, and ease of use. Additionally, system performance such an ease of access to networks without lag or c, connectivity issues, could be considered valid sub-KPIs of online SOH methods. For the purposes of the framework, the evaluated SOH methods will be assigned a score of either 1 or 0 based on their capability for online operation and integration within IoT systems [13,20,21,22,23,24,25,26,27,28,29,30,31,32].

3.1.2. Accuracy

The accuracy of an SOH method is characterized by metrics such as mean square error (MSE), root mean square error (RMSE) or mean absolute error (MAE). In some cases, the regression coefficient R2 is also used [13,20,21,22,23,24,25,26,27,28,29,30,31,32]. MSE refers to the mean square of the errors obtained from difference between the estimated capacity values of the model and the actual values used to train the model. Consequently, RMSE is the square root of the mean square error. Furthermore, the MAE is the mean of all absolute errors of the differences between the estimation model’s capacity values, and the actual values used to train the model. The MSE, RMSE, and MAE can be related to the R2 coefficient, which measures the data’s closeness to the actual true value, representing the best measure of accuracy. However, calculating the R2 coefficient for different SOH methods would require the possession of the model data and training data for all the models, which can be challenging and time-consuming. Alternatively, the RMSE and MAE are the most used error indicators in the literature, and their differences are not that significant for most models [13,20,21,22,23,24,25,26,27,28,29,30,31,32]. Thus, for simplicity and the framework’s purposes, accuracy is represented by Equation (5):
Equation (5): Accuracy of SOH Methods
A c c = 1 R M S E × 100   o r   A c c = 1 M A E × 100

3.1.3. Optimization

As stated previously, the optimization of SOH estimation methods involves multi-objective improvements, such as cost reduction, high accuracy, online integration, reduced computational time, and cycling time of online operating SOH estimation method algorithms [13,20,21,22,23,24,25,26,27,28,29,30,31,32,37,38,39,41]. Since online integration, accuracy, and time cycling have already been identified as KPIs for SOH methods, cost reductions can be used to represent the optimization of the SOH estimation methods.
Initially, a cost-benefit analysis of SOH estimation methods is conducted before they are analyzed by optimization algorithms, such as particle swarm optimization (PSO). The cost–benefit analysis includes the costs of the equipment and facilities used for testing and cycling the batteries for empirical methods, as well as the cost estimates of hiring personnel to develop model-based SOH estimation methods and perform battery testing and data analysis. The optimization algorithm selects the optimal choices from multiple options for each cost–benefit analysis criterion.
In this framework, the final cost of developing optimized online-based SOH estimation methods, and other empirical non-optimized SOH estimation methods, will be evaluated and used in the MCDM to compare different SOH methods. Initially, an energy battery systems modelling and testing company estimated the minimum budget required to set up a battery testing facility is USD 13.5 million [42]. This budget covers USD 6 million for battery testing and analyzing equipment, USD 4 million for lab facility setup, USD 3 million for personnel, and USD 500 K for maintenance [42]. Furthermore, EV manufacturers have heavily invested in battery testing facilities. Volkswagen invested USD 22 million in their battery engineering lab in Tennessee, US; General Motors (GM) invested USD 40 million in their new battery innovation lab in Michigan, US [42,43]; and Ford invested USD 100 million in the battery testing equipment out of a USD 180 million budget to build the Ford Ion Park Lab [44]. This is mainly due to the high cost of large battery analyzers, which are used to cycle the batteries and analyze their behavior. Chinese battery cyclers and analyzers dominate the battery testing equipment market due to their reliability and affordability. Moreover, Chinese battery cycling equipment manufacturers have a wide distribution network spanning across the globe making them easier to attain. Quotations of Chinese battery testers were acquired from their original manufacturers and suppliers through the Made in China online platform. Depending on device specifications and make year, Chinese battery cyclers cost USD 1000–USD 50,000/piece not including shipping costs [45]. Meanwhile, humidity and temperature shock testers used to determine battery safety and aging curves cost USD 5000–70,000/piece, also not including shipping costs [45]. Shipping costs vary from USD 200–USD 5000/piece depending on the weight, material, and size of the shipment, shipping method, and shipping locations. Initially, 1–4 channel voltage and internal resistance testers cost USD 1000–USD 2000/piece [45]. Furthermore, low voltage and low current 10 V 5 A 120 channel cylindrical battery cell testers cost around USD 5000/piece [45]. Moreover, higher grade 100 V 100 A 8–12 channel battery testers cost USD 9000–USD 15,000/piece, not including shipping costs. Additionally, larger 150 V 240 A battery analyzers with more than 120 channels cost USD 50,000/piece not including shipping costs [45]. On the other hand, more sophisticated battery analyzers capable of performing various nondestructive battery tests such as capacity measurement, open circuit voltage, electrochemical impedance spectroscopy, and internal resistance can cost more than USD 200,000/piece. For instance, AMETEK SI-6200 large battery analyzers with 120 channels capable of cycling 120 battery cells at a time and performing most nondestructive battery tests costs USD 272.5 K including shipping costs [46]. These costs justify EV manufacturers’ investments in developing online and IoT-based SOH methods. However, some of the online methods require cycling data to train their estimation algorithms [20,28,31]. Thus, the cost of developing online estimation methods depends heavily on the number of cycles needed to train the model and achieve high accuracy.
Fortunately, most model-based and online operating SOH methods only require cycling a few battery samples to develop their models [20,31]. For instance, the recent smaller 8–16 channel 100 V/60 A HONGDIAN potentiostats capable of cycling eight battery cells at a time are more than sufficient. These potentiostats cost USD 9000–USD 15,000/piece, not including shipping costs [45]. More sophisticated 12 channel AMETEK SI-6200 Battery Analyzers are capable of accurately determining battery capacities using various nondestructive testing methods such as capacity measurement/fade method, open circuit voltage, electrochemical impedance spectroscopy (EIS), and impedance testing cost USD 27,248, including shipping costs [46]. The cost of the large and small battery analyzers may vary with time due to battery testing innovations and changes in other vendors’ prices and selling locations.
The minimum cost needed to develop model-based SOH estimation methods is proportional to the time cycles needed to acquire aging data for statistical training. For instance, recent support vector machine (SVM)-based SOH estimation methods require a minimum of 100 cycles of data to train their model [28,29,30,31,47]. Newer variations in the method could emerge using less training cycles. The simplest battery testing and cycling method is the incremental capacity measurement method [15]. Incremental capacity testing cycles the batteries three times. During each cycle, the batteries are charged by incrementally increasing the capacity the at a constant voltage, followed by dissipation at a constant output voltage and varying current. The cycling data are then analyzed within 8 h, and the differential voltage and incremental current analysis (DVA and ICA) curves are obtained. On the other hand, the dynamic parameter testing method proposed by Fleischer et al. [48] for cell characterization during charging requires more time, as a single charging and discharge testing and analysis cycle takes 3.7 h [15]. Other empirical testing methods, such as electrochemical impedance spectroscopy (EIS), generally take longer when testing the batteries across higher frequency ranges 4–10 kHz using smaller intervals 0.01–0.25 Hz [15,20,35]. Moreover, state of the art battery analyzers can perform EIS for even larger ranges 0.1 mHz–10 MHz [49]. However, emerging data-driven EIS models have improved EIS testing time to 30 min and 3 min for frequency ranges <10 kHz and <2 kHz, respectively [50]. Additionally, EIS is typically used when larger data samples are required for analysis [20].
Since it is not possible to determine which testing method was used to obtain the training data for model-based SOH methods, it is assumed that the incremental capacity measurement method was used to acquire cycling data for all SOH methods evaluated by the framework’s case study. Moreover, it is assumed that versatile AMETEK SI-6200 12 channel battery analyzers were used to cycle the battery cells. Therefore, the total development time and cost can be estimated.
For the SVM-based SOH method requiring 100 cycles of training data, three cycles of incremental capacity testing can be performed per 8 h working day. A total of 33.33 days would be required to cycle the batteries. Additionally, full-time research and testing jobs, with 8 h workdays, would require at least 266.67 h (or 1–2 months of work) to build and program the model.
Based on 2025 surveys by online job marketplace Ziprectruiter.com, the average hourly wages in the United States for a small team consisting of a researcher, a battery testing engineer, and a senior software engineer are USD 43.73/h [51], USD 55/h [51], and USD 69/h [52], respectively. This would result in total wage costs of USD 46,085.91. Other hidden costs, such as medical insurance and housing, could also be included in the final wage cost.
Regarding the cost and time of using SEM-based SOH estimation, calculations were based on data provided by Nanoscience Instruments, a service provider for SEM equipment [53]. The upper limit costs of desktop-based and floor-based SEM equipment were considered. Furthermore, the cost of researchers using the SEM equipment to develop the SOH method is based on the time needed to collect aging and characterization data for a sample of 1000 battery cells. Newer desktop SEM equipment has improved testing times of 4 h per sample, while more expensive floor-based SEM equipment requires 3 days per sample [53], in addition to 2 h for rendering the ICA and DVA curves for each sample. Thus, considering two samples are tested per day using desktop SEM, the total testing and data rendering time would be 5000 h. Alternatively, for floor-based SEM, the total samples testing and data rendering time is estimated to be 72,142 h. Accordingly, the wage costs of the research teams using desktop- and floor-based SEM to develop SOH estimation methods are calculated to be USD 838,650, and USD 12,169,378, respectively.
Additional miscellaneous costs are included in the cost–benefit analysis. For example, the cost of data capturing and analyzing hardware and software programs. The cost of three average PCs for a three-person research team is USD 3600. A yearly subscription to the professional package of the data capturing and analysis software NI instrument LabVIEW would cost USD 3605/year [54]. Furthermore, a yearly subscription to the MATLAB license for the programming of the SOH model would cost USD 275/year [55]. Other software can be used, but these programs are commonly used in the data acquisition and analysis market.
The lab setup and maintenance cost of USD 4.5 million can be considered as an offset cost, as EV manufacturers have already invested in providing the facility. Therefore, the final total cost for the SVM-based SOH estimation method would be the sum of wage costs, equipment and software costs, and facilities and maintenance costs, totaling USD 4,580,813.86. However, by offsetting the facilities and maintenance cost, the total would be USD 80,813.86. Similarly, the cost of developing other SOH methods can be calculated.

3.1.4. Time Cycling

The time needed to develop the SOH method is heavily dependent on the cycling time needed to train the SOH models. For pure empirical SOH methods, batteries are tested for over 3000 cycles to learn about their properties and features before mass production. For example, the capacity measurement method would require 8000 h of cycling, testing, and analysis for over 3000 cycles [15,20,35,36]. Alternatively, dynamic parameter testing for cell characterization using open circuit voltage would require, for the same number of cycles, a total of 11,100 h. This includes the time needed to cycle, test, and analyze the battery properties and behaviors at different conditions. Other empirical methods relying on destructive testing may take several days to weeks, but the sample is either damaged or destroyed [20].
The operational time of the developed SOH models may also be of interest when integrated with online systems or IoT-based devices. The total time that should be considered is the development time and operational time of the SOH method. The operation time of a model-based SOH method is composed of the training time, and the estimation or prediction time. The operation time is affected by a few factors, mainly the sample size, the number of filters, and their complexity. In the case of SVM, it is affected by the sample size, the number of classifications, the radial basis function (RBF), and whether they use Kalman filters [20,31] to smooth their operation. Other methods, such as neural networks (NNs) and their variations, depend on the number of neurons and the number of hidden layers for the correlation of neurons at a single level. Thus, the complexity can affect the speed of the model operation or convergence time. In the case of SVM, the minimum number of cycles needed to develop the model is 100 cycles [31]. Thus, it requires 266.67 h to develop the model using the incremental capacity method to cycle and test the batteries. Furthermore, SVM’s computational time for a small set of 100 cycles can take up to 43.8 s to train and estimate the SOH model [56]. But, for the middle-size data of 3000 cycles, it can take between 30 min to an hour to train and estimate the SOH model. Most SOH models can converge and estimate the model in the order of seconds and milliseconds, because they are being run on a powerful computational program such as MATLAB, Python, or other powerful programming languages. On the other hand, models such as the Wiener process (WP) require only 67 cycles to train their model [20]. In other words, using the incremental capacity method, WP’s total testing and development time would be 178.67 h. This could result in a significant decrease in wage costs and development costs. Therefore, for the framework’s purpose, the total number of hrs. of the cycling times using incremental capacity testing will be used to represent the time cycling KPI.

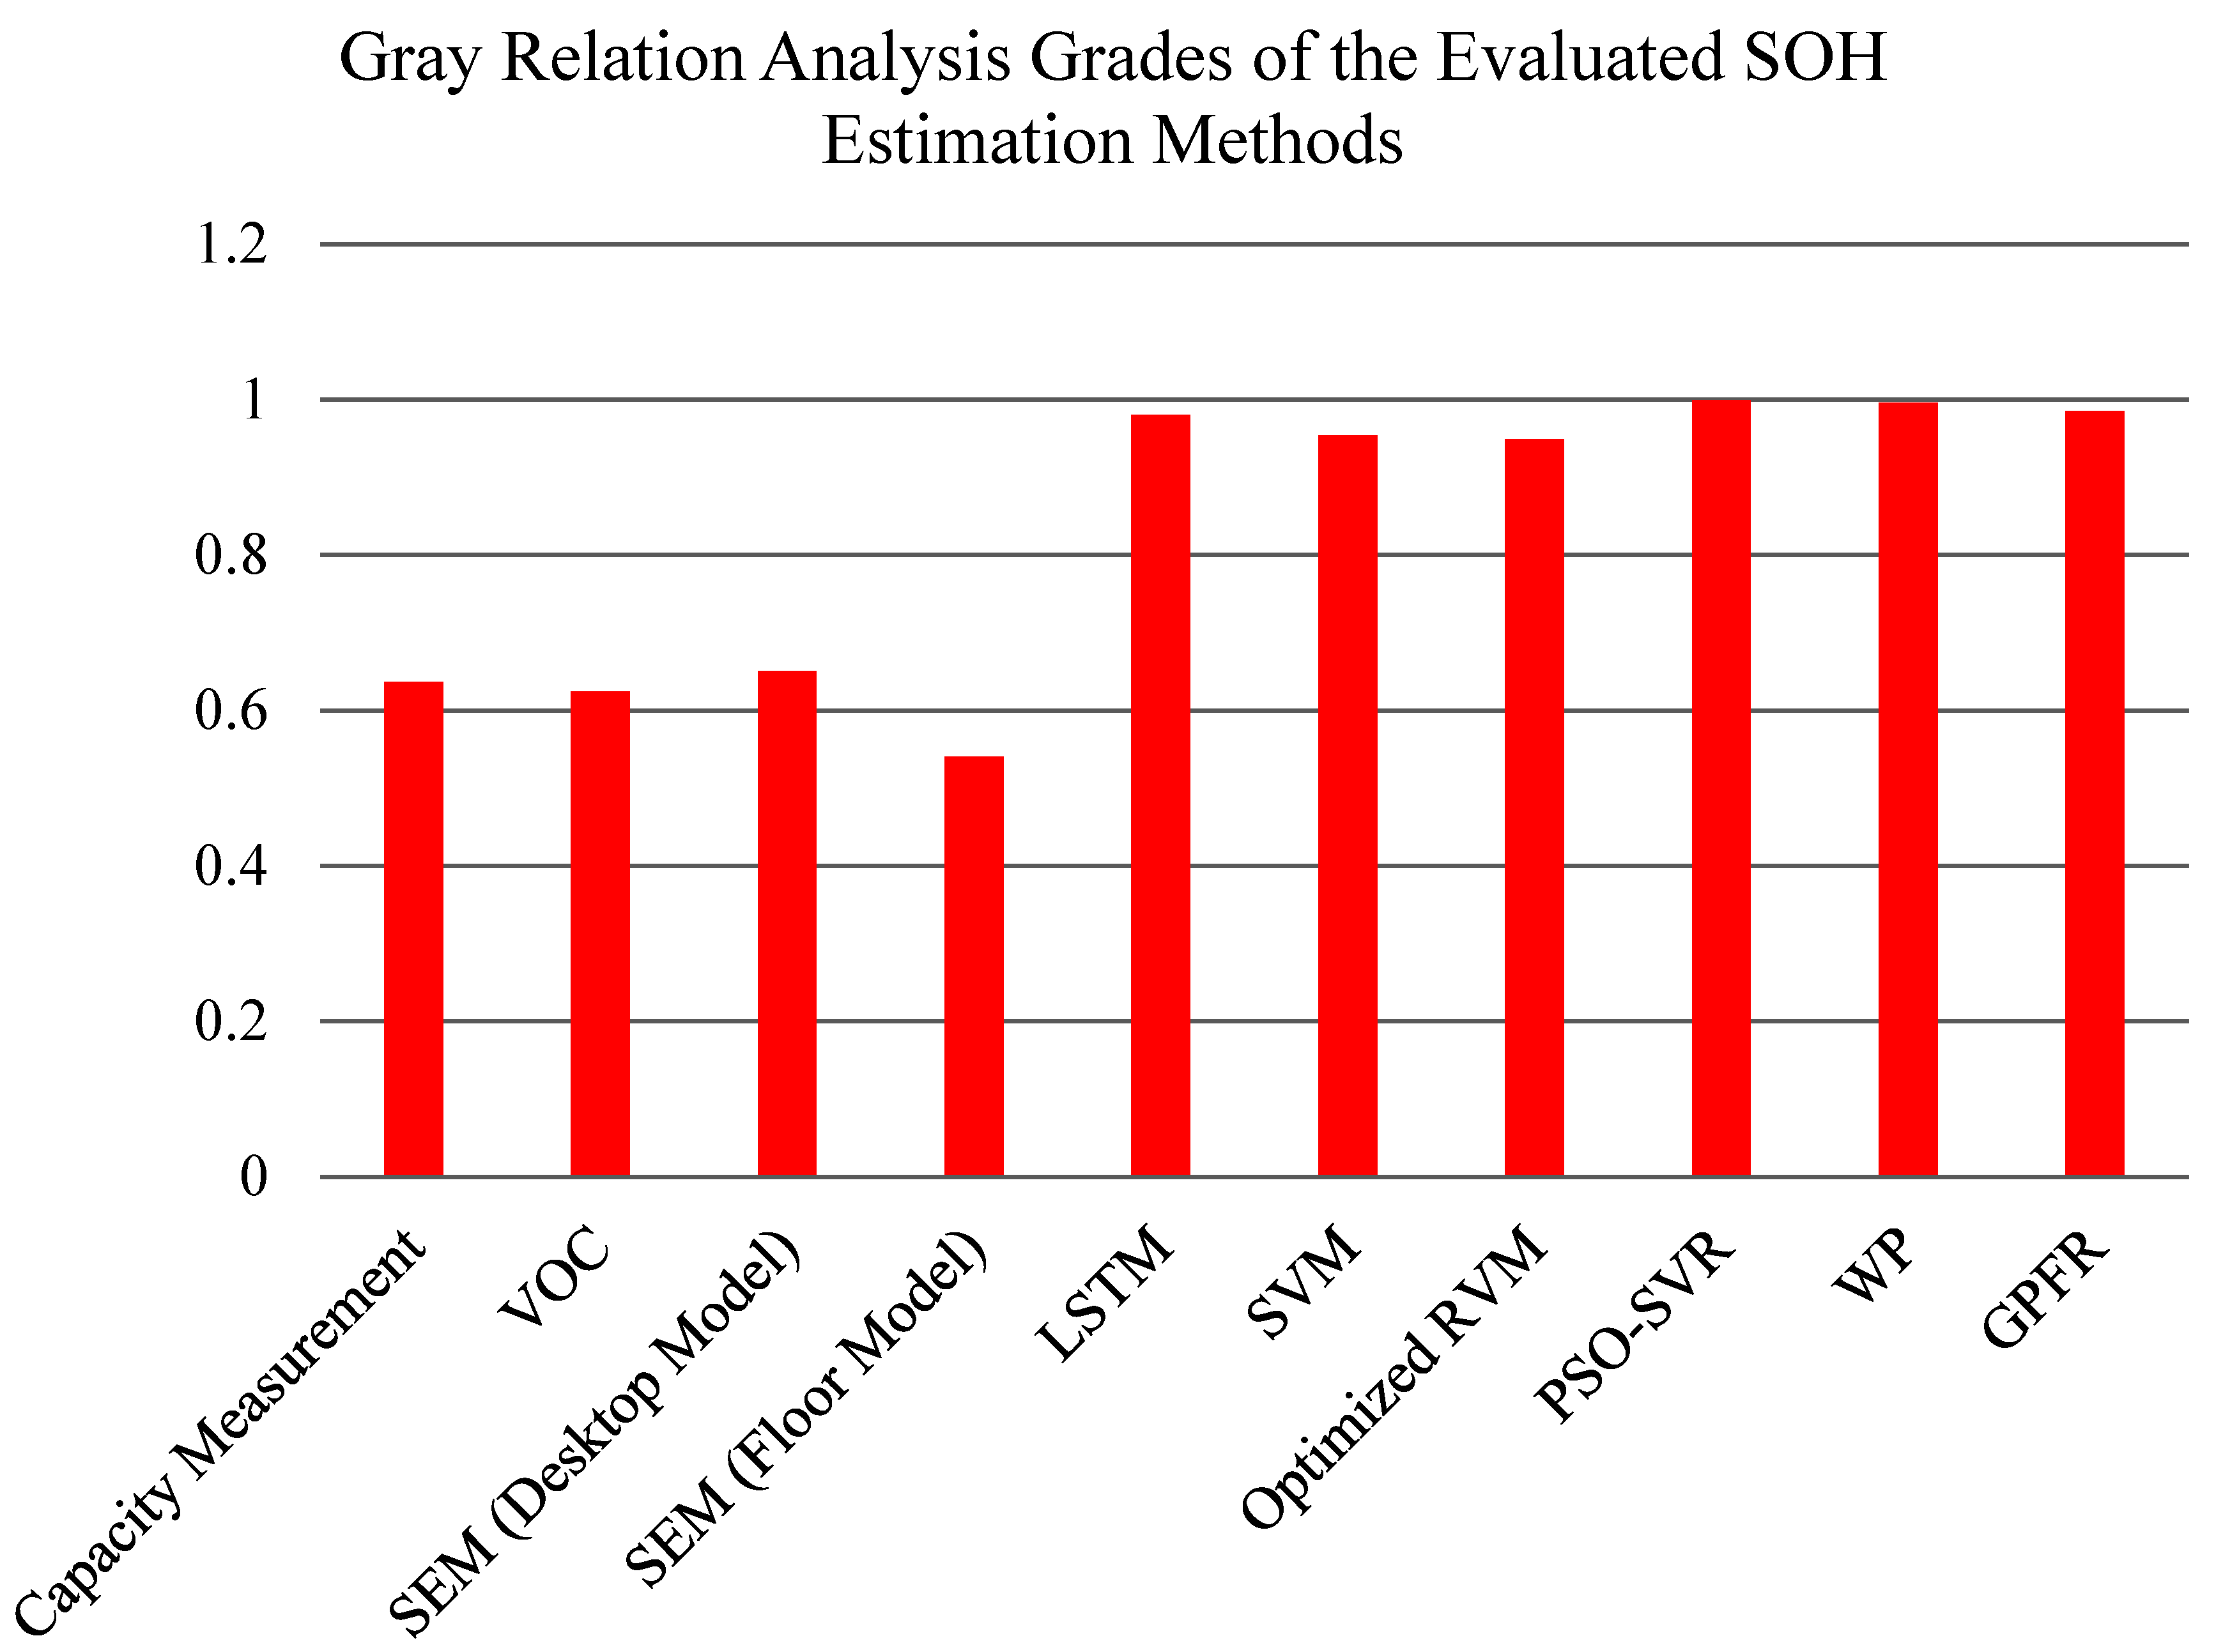
3.2. Case Study Results

Initially, the cost optimization, cycling time, online system integration, and accuracy of several SOH estimation methods were reviewed from the literature [13,20,21,22,23,24,25,26,27,28,29,30,31,32,37,38,39,41]. In particular, the incremental capacity method was selected as the training cycle acquisition method necessary for optimizing both cycling time and cost [13,20,21,22,23,24,25,26,27,28,29,30,31,32,37,38,39,41]. Furthermore, the minimum requirements needed to develop the various model-based SOH methods were defined as three PCs, one potentiostat, one NI instrument LabVIEW, and one MATLAB license. Therefore, the number of staff working on developing the method, along with their wages, would vary depending on the number of cycles required to collect the training data. The gathered data and the gray normalized values for the methods evaluated in the case study are presented in Table 1. The evaluated methods include capacity measurement, dynamic open voltage testing (VOC), scanning electron microscope (SEM) desktop-based and floor-based models, long short-term memory (LSTM), support vector machine (SVM), optimized regression vector machine (optimized RVM), particle swarm optimization with support vector regression (PSO-SVR), Wiener process (WP), and Gaussian process functional regression (GPFR). The corresponding gray relational values and final grades are shown in Table 2. Additionally, the final GRA grades of the different SOH methods are depicted in Figure 7.
Moreover, weighing factors of 0.07, 063, 0.21, and 0.09 were assigned to the criteria of cost reduction, online operation, time cycling reduction, and accuracy, respectively. These factors were selected based on the KPI rankings in Figure 4d. However, it is important to note that these weighing factors can be adjusted by the framework’s users, such as field experts and industry stakeholders, to reflect their data, experience, and/or goals.

4. Discussion

Initially, from Table 2, it can be observed that the PSO-SVR and WP methods are close first and second choice SOH methods, with final grades of 0.9995 and 0.9957, respectively. While the PSO-SVR is more balanced, demonstrating extremely high gray relational coefficient (GRC) scores across all KPIs, the WP method had the highest GRC scores for all KPIs except for accuracy. This difference in accuracy was the decisive factor that led PSO-SVR to emerge as the best choice for SOH estimation. Additionally, the SEM (desktop) method ranked the highest among empirical SOH estimation methods, with a final grade of 0.6507. It also had the highest GRC scores across all KPI categories when compared to other empirical estimation methods.
Although the final grade provides an overall score for all KPI categories, GRC scores are particularly useful for selecting the best method based on a specific KPI. Moreover, online-based and optimized SOH estimation methods outperformed empirical methods in the optimized cost and time cycling KPIs. This is expected, as online-based methods typically require less time to develop and train by utilizing readily available cycling data from previous tests. As a result, this leads to lower overall development costs for the SOH estimation model.
On the other hand, empirical SOH methods remain valuable for characterizing the degradation curves of EV battery models currently under development, such as Silicon anode lithium-ion batteries [58]. However, they cannot be integrated on board IoT-linked EV battery management systems. Furthermore, empirical methods performed better in the accuracy KPI category. Online-based SOH estimation methods often face a trade-off between accuracy and computational speed or model complexity [13,20,21,22,23,24,25,26,27,28,29,30,31,32,37,38,39,41]. Higher model complexity tends to improve estimation accuracy but at the cost of slower computational speed. In contrast, less complex algorithms are quick in providing estimation results, but generally have lower accuracy compared to other online-based and empirical-based SOH estimation methods [13,20,21,22,23,24,25,26,27,28,29,30,31,32,37,38,39,41], as demonstrated by the performance of the SVM and optimized RVM methods in Table 2.
Several sources of error in the framework can be attributed to the assumptions made regarding cycling times and the lack of data in certain categories. Initially, it is assumed that all training data are acquired using the incremental capacity method, which is a static testing method. The incremental capacity method is usually performed at low current rates of 0.1 C and 0.2 C [15]. Current rates in EVs are higher and fluctuate due to inconsistent charging and discharging patterns, as well as varying driving conditions. This results in a faster degradation of battery SOH in EVs compared to lab-tested batteries. Furthermore, the testing time and training times of the estimation models would significantly increase if the data were assumed to be obtained using the dynamic parameter testing method for cell characterization using open circuit voltage or EIS. However, they would better account for the effects of the constantly changing driving conditions on the batteries’ SOH [15]. Moreover, the working hours of researchers and programmers to analyze and code the model, respectively, are assumed to be equal to the testing time required to acquire the training data. The actual working hours may differ from testing time, influenced by factors such as the complexity of the battery’s chemistry or structure. Additionally, the average wages used are specific to the United States and differ in other regions. However, the hourly wages for United States-based battery researchers and engineer are used to demonstrate how wage costs impact the total cost of developing a SOH estimation method. Additionally, the complexity of the mathematical model employed, and the size of the datasets could further increase the model’s processing and training times. Subsequently this could increase or decrease the total working hours, which affects the total wages paid and the model’s total costs of development.
While cost is the most straightforward and accessible key performance indicator (KPI) for optimization, other optimization KPIs could potentially be incorporated into the framework. The availability of data from original equipment manufacturers (OEMs) is crucial for this, as it dictates the feasibility of including additional optimization targets. Scientometric analysis has demonstrated that cost is not only a subset of the optimization KPI, but also the easiest optimization target for which to find data. Thus, cost was used to represent the optimization KPI. It is also important to note that pure empirical SOH testing and estimation methods are not suitable for EV battery sorting frameworks [20], as the batteries are either heavily cycled to over 3000 cycles (as performed in incremental testing and EIS) or damaged using destructive mechanical and dynamic tests such as SEM, Raman Spectroscopy, or X-ray diffraction.
Prospectively, new KPIs could be added to the selection framework, after adopting online SOH monitoring systems on board EVs, for example, the ease of use or online storage capacity of the GUI systems onboard the EVs. The development of smartphone applications for real-time SOH monitoring could also offer a new dimension to the optimization process. Furthermore, scientometric analysis could be enhanced by AI tools, such as ChatGPT, or specialized programs that rely on neural networks, such as Citespace. However, these programs rely on the proximity or frequency of search terms within the dataset [59]. Thus, it may prove challenging to recognize search terms that are too sparse across the years in datasets for currently available scientometric analysis algorithms.
Overall, the framework has proven effective in identifying the main KPIs from the literature. It clearly demonstrates how these identified KPIs can be integrated into a decision matrix for interdependent categories using the GRA method. The GRA method has proven to be suitable and effective in developing SOH selection frameworks, as it maximizes the beneficial categories and suppresses the non-beneficial categories to identify the ideal method for selection. This approach helps identify the most optimal method for SOH estimation while considering the overall performance of different methods across the selected KPIs. Additionally, the GRA method allows for the inclusion of professional or industrial input through weighing and aggregation techniques in the decision matrix, ensuring that the selection process is informed by expert knowledge and aligned with practical requirements.

5. Conclusions

This work presented a battery SOH estimation-method selection framework that utilizes GRA-based multi-criteria decision matrix (MCDM). Initially, scientometric analysis was used to identify key performance indicators (KPIs), which serve as the evaluation criteria for the decision matrix. These KPIs are online operation, time cycling, accuracy, and optimization and were determined from cluster analysis of two literature datasets, with irrelevant clusters discarded.
Upon further investigation, a new underlying cluster within the original optimization cluster was identified to be the optimized cost. Thus, the optimized cost was included as optimization KPI in the MCDM. The main KPI clusters were ranked based on the frequency of occurrence in the literature, and these rankings were used as the basis for assigning weightings in the GRA-based MCDM. A detailed step-by-step guide was provided for building the MCDM utilizing the GRA method to maximize the desired KPIs and minimize the non-beneficial KPIs. Additionally, the framework outlines the process of gathering data for each KPI, serving as a guide for future use by professionals or EV battery industries.
The framework was applied to evaluate ten SOH estimation methods, including capacity measurement, dynamic open voltage testing (VOC), scanning electron microscope (SEM) desktop-based and floor-based models, long short-term memory (LSTM), support vector machine (SVM), optimized regression vector machine (optimized RVM), particle swarm optimization with support vector regression (PSO-SVR), Wiener process (WP), and Gaussian process functional regression (GPFR). The framework successfully identified the PSO-SVR method as the best method out of the evaluated methods, where weighing ratios of 63%, 21%, 9%, and 7% were assigned to the online, time cycling, accuracy, and optimized cost KPIs, respectively. This framework is a simple and effective tool for selecting the best SOH method for EV battery life-cycle management, contributing to sustainability efforts by identifying second-life opportunities for EV batteries. Furthermore, the framework is flexible and allows for the future addition of other KPIs, such as the integration of AI for real-time SOH monitoring during driving or charging cycles.
Future studies could be conducted to include the selection of appropriate SOS methods for use in EV battery lifecycle management. Additionally, the SOH and SOS methods identified through this framework could be integrated into comprehensive EV Li-ion battery lifecycle management systems, with the goal of extending the lifespan of EV batteries and mitigating their negative environmental impact. The selected SOH and SOS methods would also help streamline the sorting of used EV batteries for appropriate reuse, recycling, or remanufacturing. Finally, a material selection framework could be developed to identify suitable battery materials for the next generation of EV batteries.

Author Contributions

All authors contributed to this study’s conception and design. Material preparation and data collection were performed by A.S. under the supervision of B.M.D. and M.N. All authors contributed to the analysis and discussion. The first draft of the manuscript was written by A.S. and all authors commented on previous versions of the manuscript. All authors have read and agreed to the published version of the manuscript.

Funding

This work was supported financially by the American University of Sharjah under grants FRG23-C-E20. The work in this paper was supported, in part, by the Open Access Program from the American University of Sharjah.

Data Availability Statement

The original contributions presented in the study are included in the article, further inquiries can be directed to the corresponding author.

Conflicts of Interest

The authors declare no conflicts of interest.

References

  1. Wu, W.; Li, M.; Yang, Y.; Huang, B.; Wang, S.; Huang, G.Q. Optimal deposit-return strategies for the recycling of spent electric automobile battery: Manufacturer, retailer, or consumer. Transp. Policy 2025, 164, 92–103. [Google Scholar] [CrossRef]
  2. Nguyen-Tien, V.; Zhang, C.; Strobl, E.; Elliott, R.J.R. The closing longevity gap between battery electric vehicles and internal combustion vehicles in Great Britain. Nat. Energy 2025. [Google Scholar] [CrossRef]
  3. Geslin, A.; Xu, L.; Ganapathi, D.; Moy, K.; Chueh, W.C.; Onori, S. Dynamic cycling enhances battery lifetime. Nat. Energy 2025, 10, 172–180. [Google Scholar] [CrossRef]
  4. Eurostat. End-of-Life Vehicles-Reuse, Recycling and Recovery, Totals. Available online: https://ec.europa.eu/eurostat (accessed on 1 March 2025). [CrossRef]
  5. Standridge, C.R.; Corneal, L.; Mineta National Transit Research Consortium. Remanufacturing, Repurposing, and Recycling of Post-Vehicle-Application Lithium-Ion Batteries; Mineta Transportation Institute: San José, CA, USA, 2014. [Google Scholar]
  6. Teslike, T.; Tesla. Tesla Output Forecast for 2023; Reuters: London, UK, 2022. [Google Scholar]
  7. Srinivasan, S.; Shanthakumar, S.; Ashok, B. Sustainable lithium-ion battery recycling: A review on technologies, regulatory approaches and future trends. Energy Rep. 2025, 13, 789–812. [Google Scholar] [CrossRef]
  8. Blaabjerg, F.; Wang, H.; Vernica, I.; Liu, B.; Davari, P. Reliability of Power Electronic Systems for EV/HEV Applications. Proc. IEEE 2021, 109, 1060–1076. [Google Scholar] [CrossRef]
  9. Bachér, J.; Jenu, S.; Kajolinna, T. Identification of waste lithium-ion battery cell chemistry for recycling. Waste Manag. 2025, 194, 137–148. [Google Scholar] [CrossRef]
  10. Zhang, Y.; Liu, Z.; Wang, J.; Du, H.; Sun, Q.; Gao, R.; Xu, Z. Efficient and high-selective lithium extraction from waste LiMn2O4 batteries by synergetic pyrolysis with polyvinyl chloride. Waste Manag. 2025, 198, 95–105. [Google Scholar] [CrossRef]
  11. Hu, X.; Mousa, E.; Tian, Y.; Ye, G. Recovery of Co, Ni, Mn, and Li from Li-ion batteries by smelting reduction—Part I: A laboratory-scale study. J. Power Sources 2021, 483, 228936. [Google Scholar] [CrossRef]
  12. Zhang, H.; Tang, A.; Luo, F.; Xie, X.; Yang, L.; Zheng, Y.; Tao, X.; Qiu, C.; Wang, C.; Peng, A.; et al. Extraction of valuable metals from spent cathode materials by reductive roasting in methane atmosphere. Sep. Purif. Technol. 2023, 318, 123995. [Google Scholar] [CrossRef]
  13. Shah, A.; Shah, K.; Shah, C.; Shah, M. State of charge, remaining useful life and knee point estimation based on artificial intelligence and Machine learning in lithium-ion EV batteries: A comprehensive review. Renew. Energy Focus 2022, 42, 146–164. [Google Scholar] [CrossRef]
  14. Cabrera-Castillo, E.; Niedermeier, F.; Jossen, A. Calculation of the state of safety (SOS) for lithium ion batteries. J. Power Sources 2016, 324, 509–520. [Google Scholar] [CrossRef]
  15. Lee, K.; Kum, D. Development of cell selection framework for second-life cells with homogeneous properties. Electr. Power Energy Syst. 2019, 105, 429–439. [Google Scholar] [CrossRef]
  16. Garg, A.; Mou, J.; Su, S.; Gao, L. Reconfigurable battery systems: Challenges and safety solutions using intelligent system framework based on digital twins. IET Collab. Intell. Manuf. 2022, 4, 232–248. [Google Scholar] [CrossRef]
  17. Feng, J.; Liu, W.; Chen, F. Moving towards a circular economy: A systematic review of barriers to electric vehicle battery recycling. Sustain. Prod. Consum. 2025, 54, 241–260. [Google Scholar] [CrossRef]
  18. Kondziella, H.; Bruckner, T. Flexibility requirements of renewable energy based electricity systems—A review of research results and methodologies. Renew. Sustain. Energy Rev. 2016, 53, 10–22. [Google Scholar] [CrossRef]
  19. Scholz, Y.; Gils, H.C.; Pietzcker, R.C. Application of a high-detail energy system model to derive power sector characteristics at high wind and solar shares. Energy Econ. 2017, 64, 568–582. [Google Scholar] [CrossRef]
  20. Ungurean, L.; Cârstoiu, G.; Micea, M.V.; Groza, V. Battery state of health estimation: A structured review of models, methods and commercial devices. Int. J. Energy Res. 2017, 41, 151–181. [Google Scholar] [CrossRef]
  21. Huang, J.; Ko, K.-M.; Shu, M.-H.; Hsu, B.-M. Application and comparison of several machine learning algorithms and their integration models in regression problems. Neural Comput. Appl. 2020, 32, 5461–5469. [Google Scholar] [CrossRef]
  22. Cannarella, J.; Arnold, C.B. State of health and charge measurements in lithium-ion batteries using mechanical stress. J. Power Sources 2014, 269, 7–14. [Google Scholar] [CrossRef]
  23. Galeotti, M.; Cinà, L.; Giammanco, C.; Cordiner, S.; Di Carlo, A. Performance analysis and SOH (state of health) evaluation of lithium polymer batteries through electrochemical impedance spectroscopy. Energy 2015, 89, 678–686. [Google Scholar] [CrossRef]
  24. Hua, Y.; Cordoba-Arenas, A.; Warner, N.; Rizzoni, G. A multi time-scale state-of-charge and state-of-health estimation framework using nonlinear predictive filter for lithium-ion battery pack with passive balance control. J. Power Sources 2015, 280, 293–312. [Google Scholar] [CrossRef]
  25. Lotfi, N.; Li, J.; Landers, R.G.; Park, J. Li-ion battery state of health estimation based on an improved single particle model. In Proceedings of the 2017 American Control Conference (ACC), Seattle, WA, USA, 24–26 May 2017; pp. 86–91. [Google Scholar]
  26. Qin, P.; Zhao, L.; Liu, Z. State of health prediction for lithium-ion battery using a gradient boosting-based data-driven method. J. Energy Storage 2022, 47, 103644. [Google Scholar] [CrossRef]
  27. Ye, M.; Guo, H.; Xiong, R.; Mu, H. An online model-based battery parameter and state estimation method using multi-scale dual adaptive particle filters. Energy Procedia 2017, 105, 4549–4554. [Google Scholar] [CrossRef]
  28. Noura, N.; Boulon, L.; Jemeï, S. A Review of Battery State of Health Estimation Methods: Hybrid Electric Vehicle Challenges. World Electr. Veh. J. 2020, 11, 66. [Google Scholar] [CrossRef]
  29. von Bülow, F.; Meisen, T. A review on methods for state of health forecasting of lithium-ion batteries applicable in real-world operational conditions. J. Energy Storage 2023, 57, 105978. [Google Scholar] [CrossRef]
  30. Wang, Z.; Zhao, X.; Fu, L.; Zhen, D.; Gu, F.; Ball, A.D. A review on rapid state of health estimation of lithium-ion batteries in electric vehicles. Sustain. Energy Technol. Assess. 2023, 60, 103457. [Google Scholar] [CrossRef]
  31. Zhang, Z.; Min, H.; Guo, H.; Yu, Y.; Sun, W.; Jiang, J.; Zhao, H. State of health estimation method for lithium-ion batteries using incremental capacity and long short-term memory network. J. Energy Storage 2023, 64, 107063. [Google Scholar] [CrossRef]
  32. Wang, J.; Zhu, L.; Dai, H. An efficient state-of-health estimation method for lithium-ion batteries based on feature-importance ranking strategy and PSO-GRNN algorithm. J. Energy Storage 2023, 72, 108638. [Google Scholar] [CrossRef]
  33. Aryadoust, V.; Zhang, S. How to conduct bibliometric and scientometric research in language education? In Reference Module in Social Sciences; Elsevier: Amsterdam, The Netherlands, 2025. [Google Scholar] [CrossRef]
  34. Ng, M.; Zhao, J.; Yan, Q.; Conduit, G.J.; Seh, Z.W. Predicting the state of charge and health of batteries using data-driven machine learning. Nat. Mach. Intell. 2020, 2, 161–170. [Google Scholar] [CrossRef]
  35. Xiong, R.; Li, L.; Tian, J. Towards a smarter battery management system: A critical review on battery state of health monitoring methods. J. Power Sources 2018, 405, 18–29. [Google Scholar] [CrossRef]
  36. Hua, Y.; Liu, X.; Zhou, S.; Huang, Y.; Ling, H.; Yang, S. Toward sustainable reuse of retired lithium-ion batteries from Electric Vehicles. Resour. Conserv. Recycl. 2021, 168, 105249. [Google Scholar] [CrossRef]
  37. Ali, Z.; Putrus, G.; Marzband, M.; Gholinejad, H.R.; Saleem, K.; Subudhi, B. Multiobjective Optimized Smart Charge Controller for Electric Vehicle Applications. IEEE Trans. Ind. Appl. 2022, 58, 5602–5615. [Google Scholar] [CrossRef]
  38. Hu, W.; Zhang, C.; Liu, S.; Jin, L.; Xu, Z. Multi-objective optimization estimation of state of health for lithium-ion battery based on constant current charging profile. J. Energy Storage 2024, 83, 110785. [Google Scholar] [CrossRef]
  39. Ohtani, S.; Miyamoto, J.; Kajitani, H.; Takahashi, S. On-line lithium-ion battery state of health estimation using aging-related impedance identification with optimization. In Proceedings of the 2015 IEEE Innovative Smart Grid Technologies-Asia (ISGT ASIA), Bangkok, Thailand, 3–6 November 2015. [Google Scholar] [CrossRef]
  40. Saad, M.H.; Nazzal, M.A.; Darras, B.M. A general framework for sustainability assessment of manufacturing processes. Ecol. Ind. 2019, 97, 211–224. [Google Scholar] [CrossRef]
  41. Stolze, C.; Rohland, P.; Zub, K.; Nolte, O.; Hager, M.D.; Schubert, U.S. A low-cost amperometric sensor for the combined state-of-charge, capacity, and state-of-health monitoring of redox flow battery electrolytes. Energy Convers. Manag. X 2022, 14, 100188. [Google Scholar] [CrossRef]
  42. About Energy. Keeping the Lights On: The Costs of Battery Testing Labs. 27 September 2023. Available online: https://www.aboutenergy.io/post/keeping-the-lights-on-the-costs-of-battery-testing-labs (accessed on 25 October 2023).
  43. Brooke, L.; SAE. Chattanooga Power Haus. 24 August 2022. Available online: https://www.sae.org/news/2022/08/vw-chattanooga-battery-lab (accessed on 1 March 2025).
  44. Ford Motor Company. Ford Confirms Romulus, Mich., as Location of Ford Ion Park–Company’s New Global Battery Center of Excellence. Available online: https://media.ford.com/content/fordmedia/fna/us/en/news/2021/07/27/ford-romulus-mich-ford-ion-park.html (accessed on 1 March 2025).
  45. Made in China. Battery Test Equipment Price. Available online: https://www.made-in-china.com/manufacturers/battery-test-equipment-price.html?pv_id=1im76e0qh185&faw_id=1im7bfpt1679 (accessed on 5 March 2025).
  46. AMETEK. SI-6200 Battery Cyclers/Analyzers. Available online: https://www.ameteksi.com/products/battery-cycler/si-6200?revision=1efe3e2a-c518-4de2-881b-5543010e4c43&hash=7A6BBACDBA5EC2F69951DB49FBC699E7&requestedmedia=/-/media/ameteksi/download_links/documentations/6200/6200ba_brochure_a4_f.pdf?la=en&revision=1efe3e2a-c518-4de2-881b-5543010e4c43&hash=7A6BBACDBA5EC2F69951DB49FBC699E7 (accessed on 20 October 2024).
  47. Xiao, Y.; Wen, J.; Yao, L.; Zheng, J.; Fang, Z.; Shen, Y. A comprehensive review of the lithium-ion battery state of health prognosis methods combining aging mechanism analysis. J. Energy Storage 2023, 65, 107347. [Google Scholar] [CrossRef]
  48. Fleischer, C.; Waag, W.; Heyn, H.-M.; Sauer, D.U. On-line adaptive battery impedance parameter and state estimation considering physical principles in reduced order equivalent circuit battery models: Part 1. Requirements, critical review of methods and modeling. J. Power Sources 2014, 260, 276–291. [Google Scholar] [CrossRef]
  49. AMETEK. ModulabXM. Available online: https://www.ameteksi.com/-/media/ameteksi/download_links/documentations/modulabxm_ecs/2015_modulab_xm_ecs_a4.pdf?revision=e7dfce1f-e440-4ecf-8e1b-809618400156 (accessed on 2 September 2024).
  50. Pang, Z.; Yang, K.; Song, Z.; Niu, P.; Chen, G.; Meng, J. A new method for determining SOH of lithium batteries using the real-part ratio of EIS specific frequency impedance. J. Energy Storage 2023, 72, 108693. [Google Scholar] [CrossRef]
  51. ZipRecruiter. Battery Salary. Available online: https://www.ziprecruiter.com/Salaries/Battery-Salary (accessed on 25 October 2023).
  52. ZipRecruiter. Senior Software Engineer Salary per Hour. Available online: https://www.ziprecruiter.com/Salaries/Senior-Software-Engineer-Salary-per-Hour (accessed on 25 October 2023).
  53. nanoScience. How Much Does a Scanning Electron Microscope (SEM) Cost? Available online: https://www.nanoscience.com/blogs/how-much-does-a-scanning-electron-microscope-sem-cost/ (accessed on 12 October 2023).
  54. Ni. Select Your LabVIEW Edition. Available online: https://www.ni.com/en/shop/labview/select-edition.html (accessed on 12 October 2023).
  55. Mathworks. Pricing Licensing. Available online: https://www.mathworks.com/pricing-licensing.html?prodcode=ML&intendeduse=edu (accessed on 25 October 2023).
  56. Medium. From Hours to Minutes: 600x Faster SVM. Available online: https://medium.com/intel-analytics-software/from-hours-to-minutes-600x-faster-svm-647f904c31ae (accessed on 25 October 2023).
  57. Particle Technology Labs (PTL). Scanning Electron Microscopy (SEM). Available online: https://particletechlabs.com/analytical-testing/scanning-electron-microscopy-sem/#:~:text=Sample%20Requirements,captured%20and%20dried%20before%20analysis (accessed on 1 March 2023).
  58. Zhang, C. Review-Recent development on silicon-based anodes for high-performance Lithium-Ion Batteries. E3S Web Conf. 2021, 252, 3004. [Google Scholar] [CrossRef]
  59. Sabe, M.; Pillinger, T.; Kaiser, S.; Chen, C.; Taipale, H.; Tanskanen, A.; Tiihonen, J.; Leucht, S.; Correll, C.U.; Solmi, M. Half a century of research on antipsychotics and schizophrenia: A scientometric study of hotspots, nodes, bursts, and trends. Neurosci. Biobehav. Rev. 2022, 136, 104608. [Google Scholar] [CrossRef]
Figure 1. Reviewed SOH estimation method classification chart.
Energies 18 01527 g001
Figure 2. Cluster view of Dataset1 SOH estimation method-related keyword clusters.
Energies 18 01527 g002
Figure 3. Cluster view of Dataset2 SOH estimation method-related keyword clusters.
Energies 18 01527 g003
Figure 4. (a) Circular view of Dataset 1 KPI clusters based on their total no. of KWs; (b) circular view of Dataset1 KPI clusters based on their total no. of reoccurrences; (c) circular View of Dataset2 KPI clusters based on their total no. of KWs; (d) circular view of Dataset2 KPI clusters based on their total no. of reoccurrences.
Energies 18 01527 g004
Figure 5. Search datasets used to find SOH estimation methods’ cost-related cluster of KWs.
Energies 18 01527 g005
Figure 6. Underlying KPI cluster of SOH estimation methods for cost-related KWs.
Energies 18 01527 g006
Figure 7. Gray relational analysis grade of SOH methods.
Energies 18 01527 g007
Table 1. GRA normalization of the SOH methods’ parameters.
SOH MethodOptimized Cost (USD)Time (h)OnlineAccuracy (100-RMSE)%References
(OptCost, Time, Online, Accuracy)
xSOH,OptCostxSOH,TimexSOH,OnlinexSOH,Acc
Capacity Measurement1,417,2888000099[15,20,42,46,51,52,54,55]0.4859642850.28384821300.950684932
VOC1,953,03011,100099[15,20,42,46,51,52,54,55]0.282225187000.950684932
SEM (Desktop Model)895,1555000099[20,42,51,52,53,54,55,57]0.6845279560.65010397100.950684932
SEM (Floor Model)2,691,28072,142099[20,42,51,52,53,54,55,57]00.65010397100.950684932
LSTM113,067453.3198.3[15,31,42,46,51,52,54,55] 0.9819506880.97485379510.75890411
SVM80,814266.67195.53[15,31,42,46,51,52,54,55]0.9942164390.99194237310
Optimized RVM71,596213.33197.22[15,26,42,46,51,52,54,55] 0.0020123540.99682639410.463013699
PSO-SVR75,743237.33199.18[15,31,42,46,51,52,54,55]0.996144730.99462885911
WP65,606178.67199[15,20,42,46,51,52,54,55] 1110.950684932
GPFR80,814266.67198.5[15,20,42,46,51,52,54,55]0.9942164390.99194237310.81369863
generalized x0 1111
weighing (wi)0.070.210.630.09
Note References are ordered with respect to their KPIs in the same order of the KPI parameters. Some references provide information for more than 1 KPI per SOH method and hence are repeated.
Table 2. The gray relational coefficients and grades of SOH methods.
SOH MethodGRCSOH,OptCostGRCSOH,TimeGRCSOH,OnlineGRCSOH,AccGrade
Capacity Measurement0.6601556240.9019695010.50.9530026110.636394724
VOC0.581789710.8682346050.50.9530026110.623824782
SEM (Desktop Model)0.7599144390.9372097240.50.9530026110.650778288
SEM (Floor Model)0.50.50.50.9530026110.540770235
LSTM0.9822449890.99619825910.8057395140.98047534
SVM0.9942412580.99877864810.50.954340404
Optimized RVM0.7174303030.99951859810.6506238860.948675176
PSO-SVR0.9961538910.999185527110.999559733
WP1110.9530026110.995770235
GPFR0.9942412580.99877864810.842956120.985206455
generalized x0
weighing (wi)0.070.210.630.09
Disclaimer/Publisher’s Note: The statements, opinions and data contained in all publications are solely those of the individual author(s) and contributor(s) and not of MDPI and/or the editor(s). MDPI and/or the editor(s) disclaim responsibility for any injury to people or property resulting from any ideas, methods, instructions or products referred to in the content.

