Article

A Novel Prediction Model for Thermal Conductivity of Open Microporous Metal Foam Based on Resonance Enhancement Mechanisms

1
Institute of Thermal Science and Technology, Shandong University, Jinan 250061, China
2
Laboratory for Liquid-Solid Structural Evolution and Processing of Materials (Ministry of Education), Shandong University, Jinan 250061, China
*
Authors to whom correspondence should be addressed.
Energies 2025, 18(6), 1529; https://doi.org/10.3390/en18061529
Submission received: 16 February 2025 / Revised: 6 March 2025 / Accepted: 12 March 2025 / Published: 20 March 2025
(This article belongs to the Section J: Thermal Management)

Abstract

:
Microporous metal materials have promising applications in the high-temperature industry for their high heat exchange efficiency. However, due to their complex internal structure, analyzing the heat transfer mechanisms presents a great challenge. This I confirm work introduces a mathematical model to accurately calculate the radiative thermal conductivity of microporous open-cell metal materials. The finite element and lattice Boltzmann methods were employed to calculate the thermal conduction and thermal radiation conductivities separately and validated for aluminum foams, with the relative errors all less than 9.3%. The results show that the thermal conductivity of microporous metal materials mainly increased with an increase in temperature and volume-specific surface area but decreased with an increase in porosity. Analysis of the spectral radiation characteristics shows that the surface plasmon polariton resonance and the magnetic polariton resonance appearing at the gas–solid interface of the metal foam significantly increase the dissipation effect of the gas–solid interface, further reducing the metal foam’s heat transfer efficiency. This indicates the potential of this work for use in the design of specific microporous metal materials like energy management devices or heat transfer exchangers in the aerospace industry.

1. Introduction

The advancement of modern industry and technology has increased reliance on fossil fuels, exacerbating environmental pollution [1]. Microporous metals, characterized by their high specific surface area and tunable thermal conductivity [2,3], have become integral to various sectors, including automotive [4], aerospace [5], energy conversion [6], and thermal management [7]. Recent studies have made significant strides in elucidating the intricate thermal transport mechanisms inherent in metal foam materials [8,9,10]. However, thermal transport phenomena at the microscale remain inadequately explored due to the predominance of microscale effects, thereby complicating the design and optimization of microporous materials for effective thermal management. Additionally, microporous metal materials’ pronounced scattering properties and unique spectral radiation characteristics pose substantial challenges to experimental measurements [11,12]. Therefore, building a theoretical model to analyze the internal heat transfer mechanism more intuitively is necessary.
When the diameter of open-cell foam is less than 4 mm, convection has a minimal contribution to heat transfer [13], which can be negligible. Therefore, thermal radiation and thermal conduction emerge as the primary modes of heat transfer in microporous metal materials. In thermal conduction, microporous metals with small pore sizes rely predominantly on free-moving electrons and phonons as the primary carriers [14]. Electrons in the outermost atomic orbitals detach from their original orbitals to form free electrons, thereby generating electronic heat conduction. In the thermal radiation of microporous metals, radiative heat transfer between closely spaced objects surpasses traditional blackbody radiation, where Planck’s blackbody radiation law is no longer applicable, as the characteristic size of objects is comparable to or smaller than the thermal radiation wavelength [15]. In microscale thermal radiation studies, particularly when considering the complex internal structures of metal foam materials, several key physical phenomena must be accounted for, including surface plasmon resonance on metal surfaces [16], phonon–polariton resonance in polar materials [17], and microcavity resonance [18]. These effects are significantly amplified at the microscale, directly influencing the materials’ thermal radiation and thermal transport properties. The heat transfer process is shown in Figure 1.
Researchers have recently focused on rationalizing the heat transfer mechanisms within metal foams. Initial research often involved simplifying the foam structure by modeling it as a periodic unit cell with specific sizes and shapes, thereby constructing geometric models analogous to the macroscopic structure of metal materials. For instance, Boomsma and Poulikakos et al. [19] constructed a three-dimensional regular icosahedron skeleton model to simulate the internal structure of open-cell foam metal. The effective thermal conductivity of the foam metal was calculated using this model, neglecting the effects of convection and radiation. Similarly, Xi et al. [20], according to Ashby’s rules, used a cubic unit cell model to derive the formula for the effective thermal conductivity of gas–solid two-phase open-cell foam metal using the minimum thermal resistance method. He et al. [21] proposed a fractal intersecting sphere model for nanoporous silica aerogels, combining the Rosseland approximation with the equivalent resistance method to explore the thermal transport mechanisms in aerogels. With the development of numerical simulation research, compared to traditional unit structures, randomly generated structures better reflect the heat transfer performance of porous materials. Nie et al. [22] proposed a Voronoi model-based algorithm to reconstruct an open-cell foam structure and studied the pressure drop and heat transfer characteristics of open-cell foams. Liu et al. [23] used SEM-derived microstructural morphology to establish the microscopic structure of rough surface ligaments and internal porous media with μ-CT. They also applied the time-domain finite difference method to analyze the spectral radiation transfer characteristics both on the surface and inside the medium. Luo et al. [24] echoed similar methodologies, further advancing the analysis of spectral radiation transfer in metal structures. Fan et al. [25] applied the discrete scale method combined with finite element simulations to numerically solve and analyze the conduction–radiation coupling behavior in honeycomb ceramic. Lin et al. [26] proposed a structured algorithm to reconstruct the hierarchical pore structure of open-cell foam and used the lattice Boltzmann method to evaluate the impact of the hierarchical pore structure on effective thermal conductivity. Chen et al. [27] utilized the quadruple structure generation set method to generate metal media structures and, in conjunction with the lattice Boltzmann method, determined their effective thermal conductivity while investigating the influence of control parameters on isotropic metal media. Despite these advancements, existing models predominantly concentrate on the microscale effects of thermal conduction or thermal radiation but do not include them in the thermal conductivity prediction model. Therefore, there is a critical need for comprehensive computational models that integrate both heat conduction and heat radiation to effectively analyze the influence of structural characteristics on heat transfer mechanisms.
This study aims to investigate the heat transfer properties of microporous metal materials, with a particular emphasis on refining the prediction model for equivalent thermal conductivity. The open-cell aluminum foam model, as a typical metal foam, was developed to simulate the intricate heat transfer processes within the metal foam. The finite element and lattice Boltzmann methods were employed to calculate the thermal conduction and thermal radiation conductivities separately and validated for aluminum foams. Specifically, the effects of cell size, porosity, material refractive index and extinction coefficient, temperature, and volume-specific surface area (VSSA) on thermal conductivity were investigated using porous open-cell foams. Furthermore, this work analyzes the effects of surface plasmon resonance and magnetic polariton resonance on the modulation of equivalent thermal conductivity, which provides essential theoretical support for designing advanced thermal management materials.

2. Methods

2.1. Geometric Model

Numerous studies have shown that traditional irregular and disordered structures often deviate from the Euclidean geometric description when describing the geometric properties of porous materials [28]. Therefore, to more accurately restore the characteristics of the internal structure of microporous metals, this study constructed an open-cell spherical skeleton model as a geometric model, as shown in Figure 2. The porosity φ is calculated by dividing the total air by the total volume of the geometric computational domain, the equivalent pore size dp is the average diameter of the air pore, and the equivalent cell size Dh can be defined in terms of dp and φ, where Dh = dp/φ.

2.2. The Conductive Thermal Conductivity

In this work, the lattice Boltzmann method (LBM) is used to accurately simulate the thermal conduction process. The conductive thermal conductivity κcond of microporous metal materials can be calculated using Fourier’s law:
k c o n d = L × q d A Δ T d A
where L is the characteristic length, A is the differential area element, and ΔT denotes the temperature difference across the material. The heat flux density q is derived from the distribution of particle velocities (D3Q19 discrete velocity model is used in this work) and is calculated as [29]
q = τ 0.5 τ T x , t
where T (x, t) is the local temperature. According to the Chapman–Enskog expansion, the local temperature can be calculated as T (x, t) =   i = 1 18 e i f i , where ei represents the discrete velocity vectors, t is the discrete time, and fi represents the temperature evolution functions in each discrete direction i at position x. The collision form of the evolution equation for the three-dimensional LBM model can be written as [30]
f i x + e i δ t , t + δ t f i x , t = 1 τ f i x , t f i e q x , t
where fieq is the local equilibrium function. In Equations (2) and (3), the relaxation time τ is crucial for ensuring numerical stability and accuracy in the LBM simulations, which significantly impacts the calculation accuracy; it can be determined by [31]
τ = 3 2 k s / f ρ C P c 2 δ t + 0.5
where κs/g represents the thermal conductivity of the solid (s) or gas (g) phase, respectively; ρ is the density; CP is the specific heat capacity; c is the phonon velocity in the material; δt is the time step. As shown in Figure 2, the solid and the gas have different physical properties, and both regions follow the conjugate heat transfer equations simultaneously [32]:
ρ C P s T t = k s 2 T
ρ C P f T t = k f 2 T

2.3. The Radiative Thermal Conductivity

The radiant energy between two closely spaced objects significantly exceeds the predictions of the Planck–Stefan–Boltzmann law [33], necessitating that the thermal radiation process accounts for microscale radiation effects. Based on the optical thickness approximation theory, the equivalent radiative thermal conductivity κrad can be calculated by substituting into the energy equation [34]:
κ rad = 16 σ SB T m 3 σ e , R
where σSB is the Boltzmann constant and Tm is the average temperature; the Rosseland average extinction coefficient σe,R can be calculated from Ref. [35]:
1 σ e , R = 0 1 σ e , λ f λ , T d λ 0 f λ , T d λ
where λ is the wavelength and f (λ,T) is the Planck blackbody emission spectral distribution, representing the ratio of radiation energy at a specific wavelength to the total energy, calculated as follows [36]:
f λ , T = e b , λ T = C 1 λ 5 e C 2 / λ T 1
where eb,λ is the blackbody spectral intensity, C1 is the first radiation constant, and C2 is the second radiation constant. In Equation (8), the spectral extinction coefficient σe,λ reflects the attenuation of the incident light and can be obtained by adding the absorption coefficient σa,λ and the scattering coefficient σs,λ, as σe,λ = σs,λ + σa,λ [37]. The nature of thermal radiation is the transmission of electromagnetic waves, and we use the finite element method to solve Maxwell’s equations [36]:
× H = ε E t + σ E × E = μ H t · H = 0 · E = ρ ε
where H is the magnetic field intensity, E is the electric field intensity, ε is the permittivity, μ is the permeability, σ is the electrical conductivity, and ρ is the volume charge density. Poynting vectors represent (S) the energy transfer of electromagnetic waves [38]. The spectral extinction coefficient is calculated by integrating the time-averaged extinction Poynting vectors Sext (electromagnetic power flow) over the surface [39].
S = 1 2 Re E × H *
σ e , λ = S e x t d A N W i n c = = 1 2 Re Σ E ( i n c ) × H ( s ca ) * + E ( s c a ) × H ( i n c ) * n d A N Re E ( i n c ) × H ( i n c ) *
where Einc, Esca, Hinc, and Hsca are the incident and scattered electric and magnetic fields, respectively; Winc is the power flow per unit area of the incident plane wave; Re is the real part of complex quantity; * indicates conjugate complex numbers. The absorptivity (A), reflectivity (R), and transmittance (T) of the material are then solved using the Poynting vectors [38].
R = S ( r ) d a S ( 0 ) d a
A = S ( 0 ) S ( t ) S ( r ) d a S ( 0 ) d a
where S(0) represents the absorbed energy flux, S(r) represents the reflected energy flux, S(t) is the transmitted energy flux, and T = 1 − AR.

2.4. The Radiative Dissipation Efficiency

The distribution of electric and magnetic fields can be solved according to the finite element method. Poynting vectors represent (S) the energy transfer of electromagnetic waves. Radiative dissipation efficiency (η) is represented using the ratio of the energy transfer between the air and solid regions of the calculated cross-section:
η = S s - g d a S m d a = E s g × H s g * d a E m × H m * d a
where Ss-g is the energy flux at gas–solid interfaces; Sm is the energy flux at the current section. The subsequent sections will analyze the efficiency of radiative dissipation within a material using spectral radiation characteristics.

2.5. The Total Thermal Conductivity

The total thermal conductivity κtotal was calculated as [12]
κ t o t a l = κ c o n d + κ r a d
where the conductive thermal conductivity κcond is calculated by Equation (1), and the radiative thermal conductivity κrad is calculated by Equation (7). To summarize, the overall calculation flow chart is shown in Figure 3.

3. Results and Discussion

3.1. Model Verification

In order to verify the accuracy of the numerical model, the equivalent thermal conductivity calculated by the model was compared with the available experimental results. Four types of experimental data [40,41,42,43] were selected for comparison in this study. The experimental values for open-cell foams were selected from measurements with porosities ranging from 50% to 98%. Figure 4a presents the validation of simulation data against experimental data under medium porosity conditions. In the experiment, foam aluminum samples were fabricated using the liquid infiltration method at room temperature, and thermal conductivity was measured using the steady-state method. The experimental samples had a porosity of 50–77% and pore sizes ranging from 2.0 mm to 2.36 mm. In the simulation calculations, the cell size Dh was determined using Dh = dp/φ. Figure 4b presents the validation under high porosity conditions, where foam samples with a porosity of 90–97% were produced using the permeability casting method, with pore sizes ranging from 2.3 mm to 3.4 mm.
Figure 4 shows that the results of the heat transfer model in this paper agree very well with the experimental measurements with an error of less than 9.3%. Therefore, the computational model will be used for subsequent calculations. The error was calculated based on the relative deviation between the numerical simulation results and the experimental data.
We selected N = 400 × 400 × 400 as the final grid size for the conductive simulations and approximately 550,000 elements for the radiative calculation. The grid independence verification of the numerical simulation part is shown in Figures S1 and S2 of the Supplementary Materials.

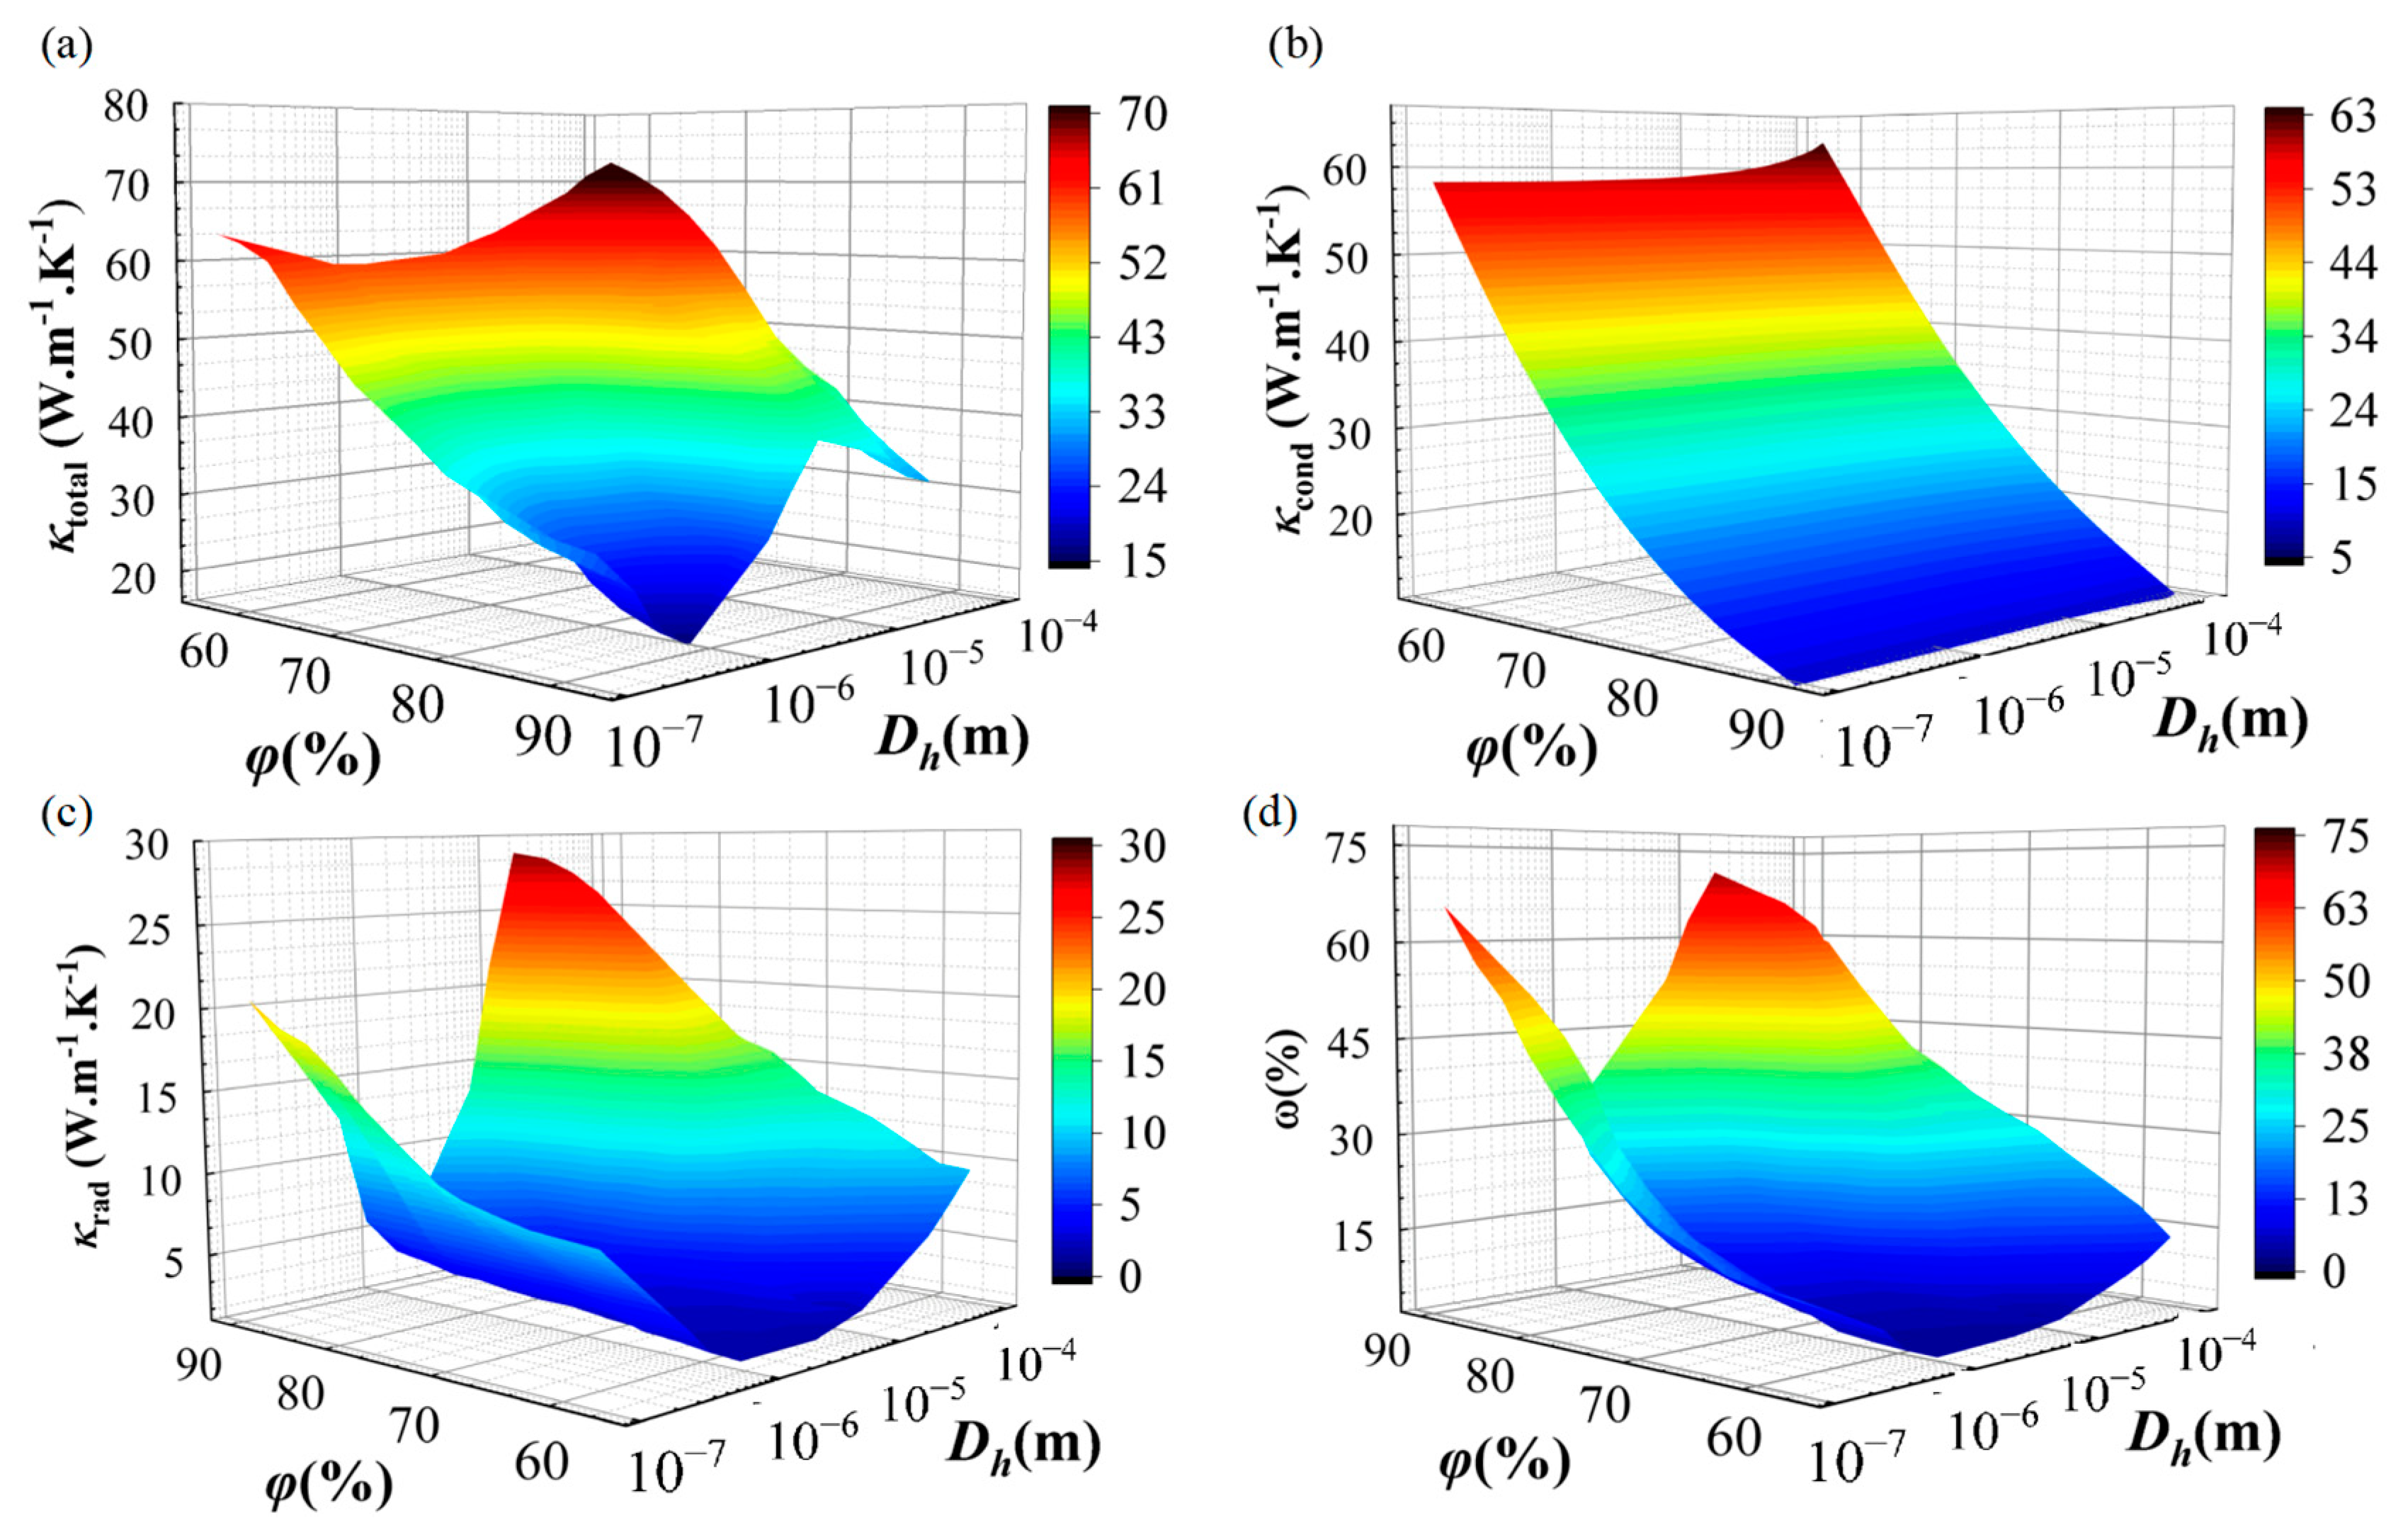
3.2. Factors Influencing the Thermal Conductivity

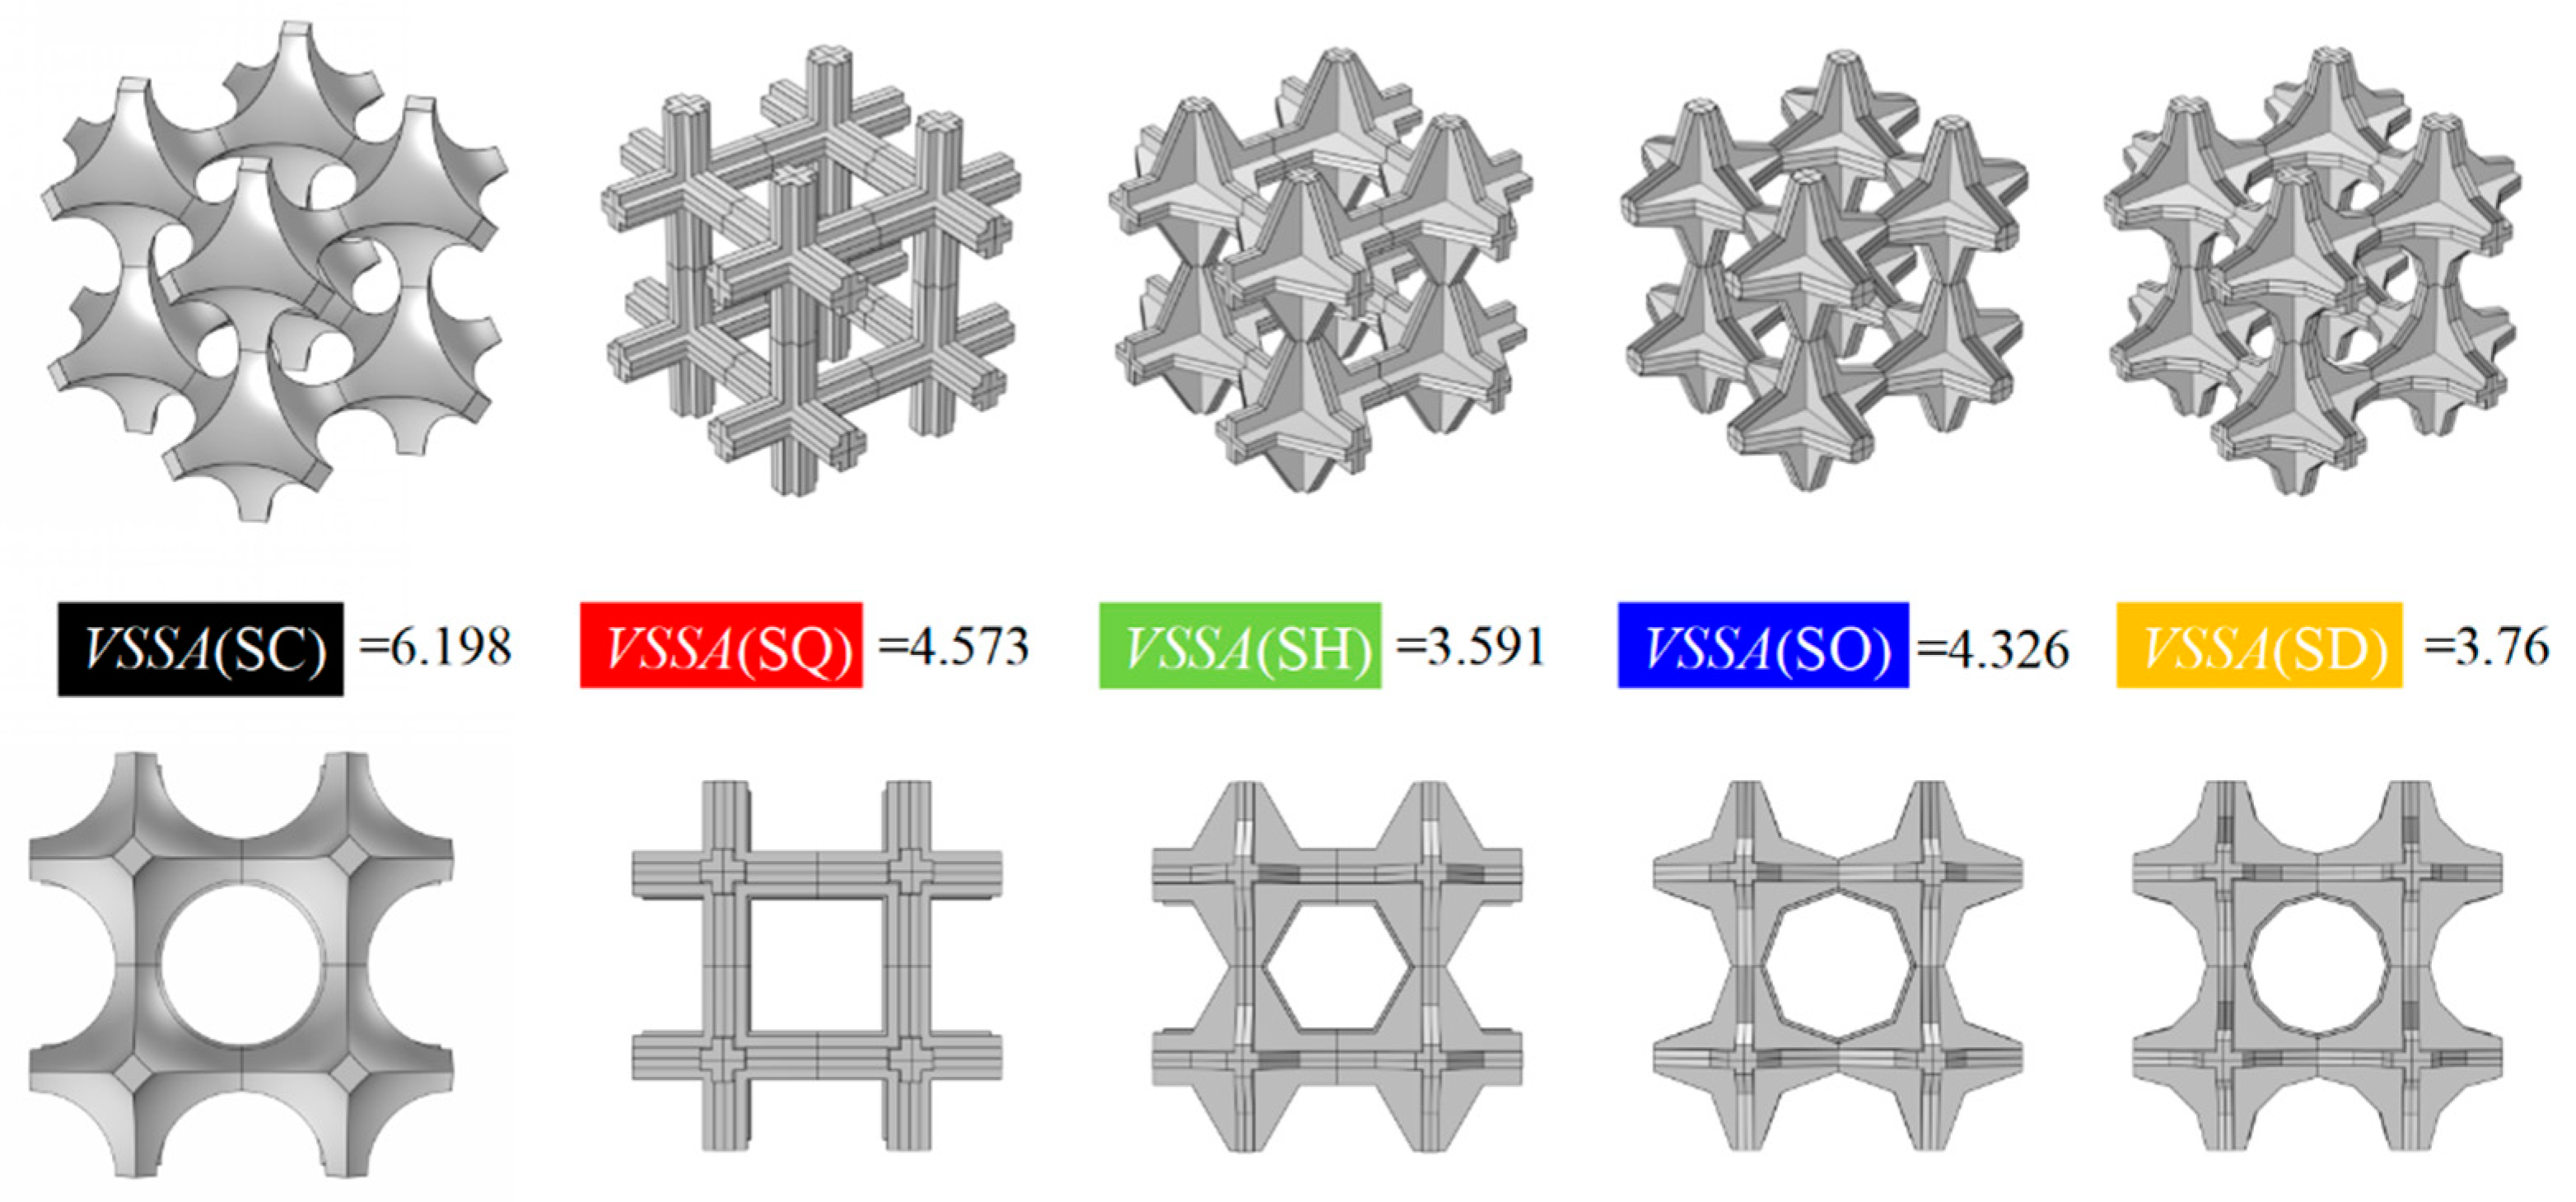
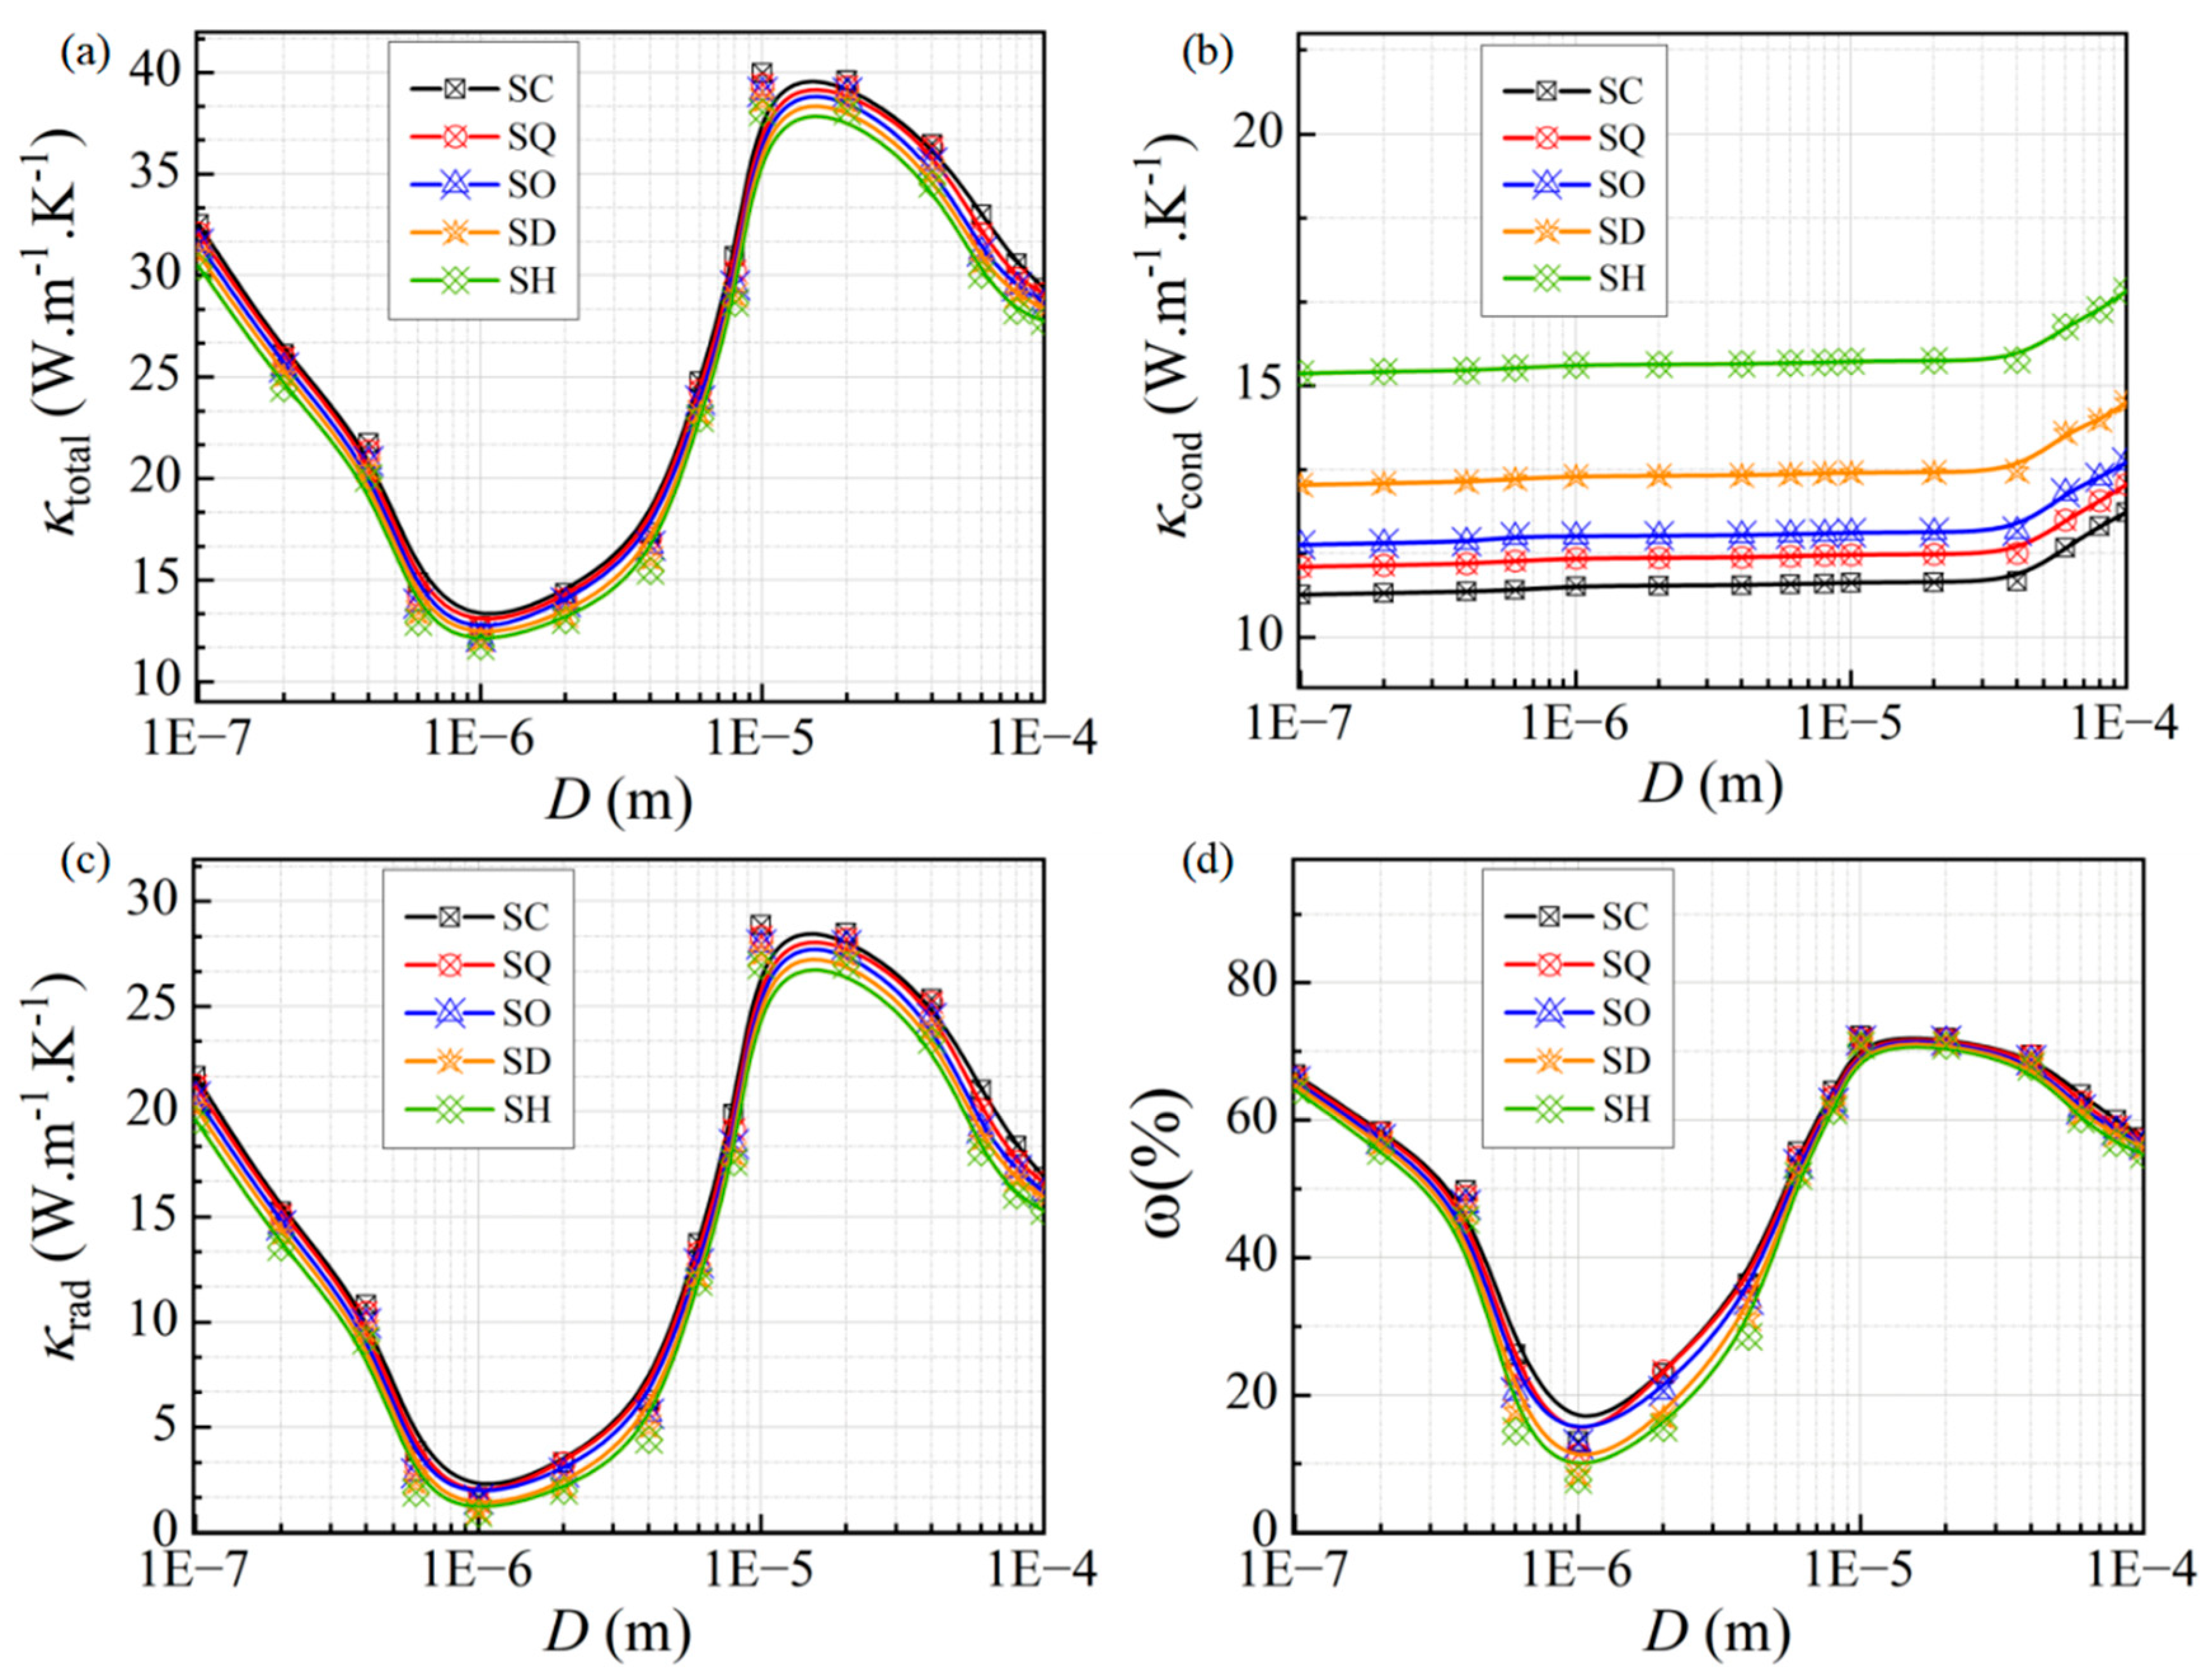
3.2.1. Effect of the Cellular Structure

In order to better illustrate the variation in the thermal transport properties of the porous aluminum structure with the equivalent cell size Dh and porosity φ, 140 sets of models with 100 nm ≤ Dh ≤ 100 μm and 50% ≤ φ ≤ 90% were computed at T = 300 K. The predictions of the total equivalent thermal conductivity κtotal, the radiation conductivity κrad, the conductive thermal conductivity κcond, and the ratio of the radiation conductivity to the total equivalent thermal conductivity ω are plotted in Figure 5.
As shown in Figure 5a, the equivalent thermal conductivity decreases with increasing porosity, and κtotal reaches a maximum at Dh = 100 μm and φ = 90%. The effect of the equivalent cell size Dh on the equivalent thermal conductivity is more complicated. As shown in Figure 5b, as the porosity decreases, the conductive thermal conductivity in the open pore structure decreases. Under the same porosity conditions, the conductive thermal conductivity decreases significantly as the equivalent cell size Dh decreases. It can be seen through Figure 5c that the radiation conductivity fluctuates considerably at high porosity. A maximum occurs at Dh = 10 µm and a minimum at Dh = 1 µm. When the porosity is high, the radiative thermal conductivity increases as Dh decreases, reaching a maximum at Dh = 10 µm. Then it gradually decreases, reaching a minimum at Dh = 1 µm, and subsequently increases again. When the porosity decreases to approximately below 70%, the radiative thermal conductivity decreases as Dh decreases, reaching a minimum at Dh = 1 µm, and then increases again. Analyzing the percentage of radiative thermal conductivity in Figure 5d shows that a smaller cell size enhances the radiative effect. This enhancement is particularly evident at high porosity. When the porosity reaches 90%, the contribution of the radiation conductivity to the total equivalent thermal conductivity even exceeds the thermal conductivity. This suggests that the effect of radiation effect on heat transfer becomes significant in microporous foams, especially at higher porosities. The cell size is close to the characteristic wavelength of Planck’s blackbody radiation (T = 300 K, 9.8 μm), which leads to an interference effect as the radiation propagates inside the material. This phenomenon is further enhanced by the microscale effect, which we will further explore from the perspective of thermal radiation in subsequent studies. To design efficient thermal management materials, it is important to take into account the different effects of radiation and conduction in micro-open-cell foam.

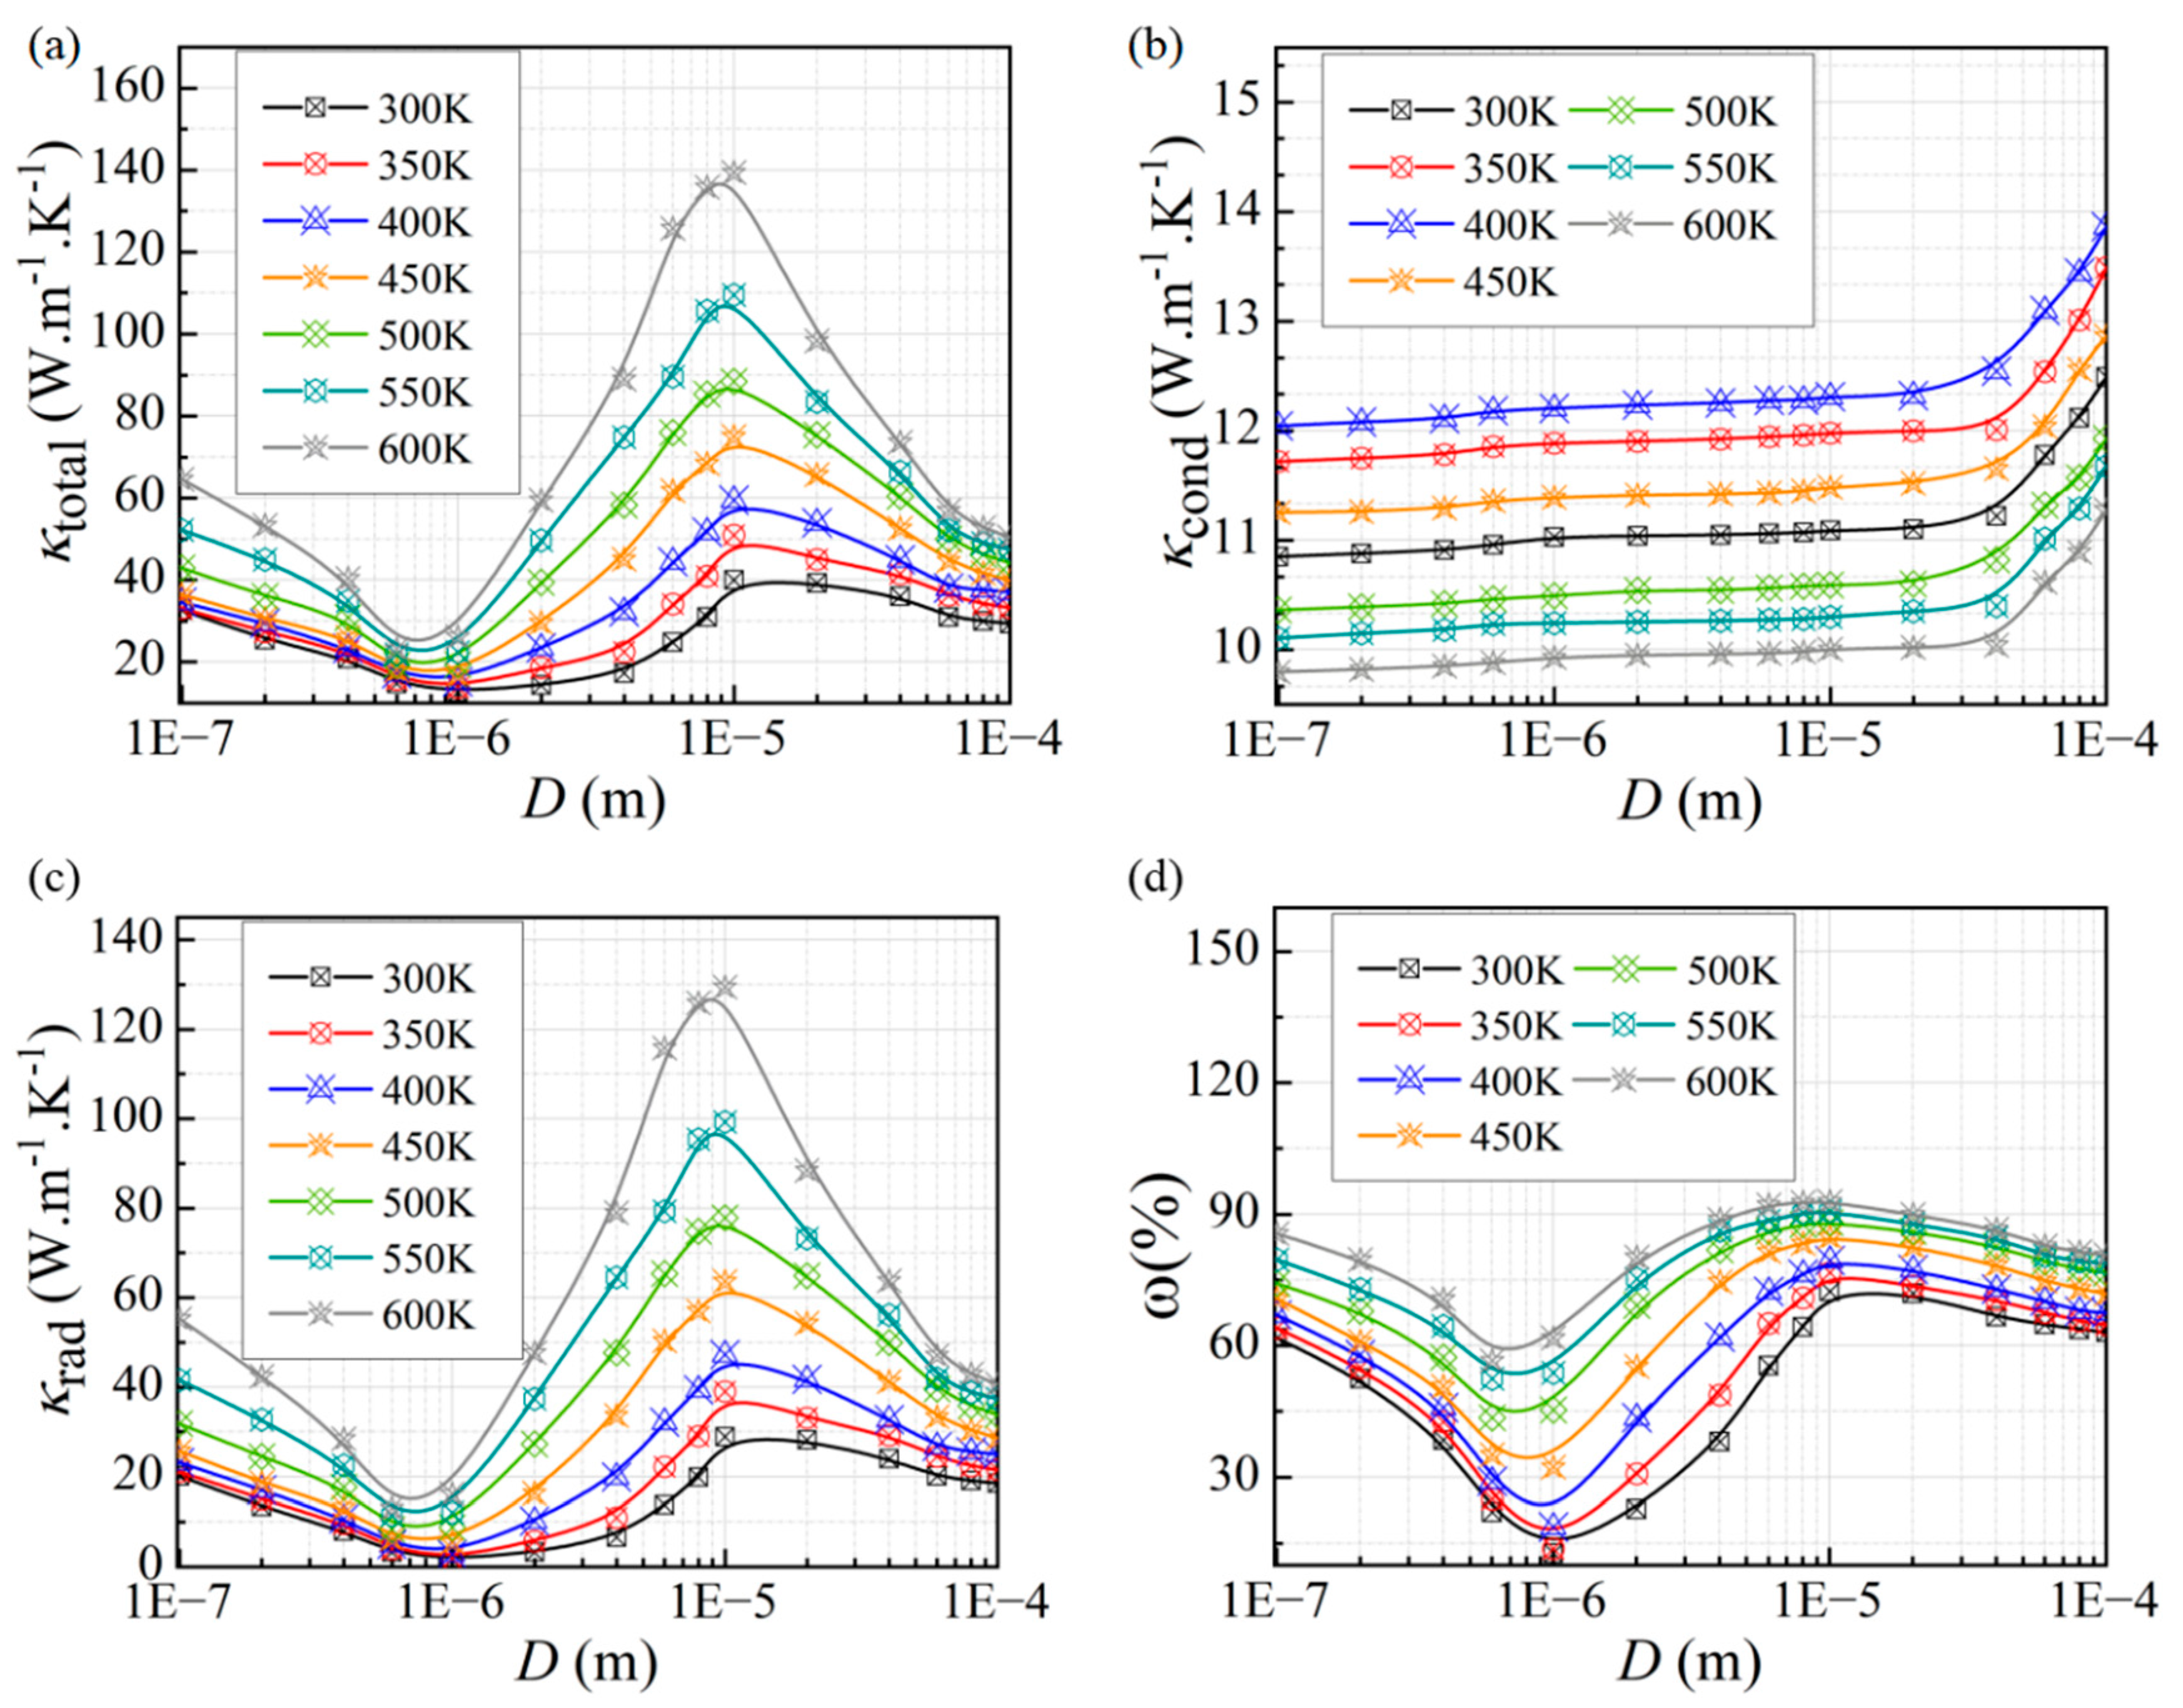
3.2.2. Effect of Temperature

This section presents seven sets of open-cell aluminum foam models with a porosity of φ = 90%, with temperature variations ranging from 300 K to 600 K in increments of 50 K. The effect of temperature on the equivalent thermal conductivity is analyzed, from room temperature to high temperature. The heat transfer coefficient of solid aluminum is obtained from experimental data as a function of temperature, and the results are shown in Figure 6.
By analyzing the change in equivalent thermal conductivity of the open-cell structure with temperature, it can be observed that as the temperature increases, the equivalent thermal conductivity increases. The effect of temperature on thermal conductivity is mainly reflected in radiative heat transfer, while its effect on the conductive part is relatively small. As the temperature increases, the conductive thermal conductivity shows a certain increase. Meanwhile, as the temperature continues to rise, the conductive thermal conductivity tends to decrease. This is related to the change in the heat conductivity of solid aluminum with temperature. Especially for smaller sizes (approximately 0.5 μm–5 μm), the effect of temperature on thermal conductivity is minimal.
In the open-cell model, the thermal conductivity reaches a minimum when the structure size is between 0.5 μm and 5 μm, while a maximum value is observed around 10 μm. As the temperature increases, the thermal conductivity also increases. This is because, for the radiative heat transfer component, Planck’s law in Equation (9) of the computational model indicates that as temperature increases, the peak wavelength of blackbody radiation (the wavelength with the highest energy density) shifts toward shorter wavelengths (higher energy). Meanwhile, the energy density of blackbody radiation increases across all wavelength ranges, which in turn increases the corresponding radiative energy, leading to a rise in the equivalent thermal conductivity. The effect of temperature on equivalent thermal conductivity demonstrates significant differences in heat transfer properties of micro-scale porous foams when exposed to temperature changes.

3.2.3. Effect of Volume-Specific Surface Area

To discuss the effect of different volume-specific surface area factors on the heat transfer characteristics of porous media, this section constructs models with different open-cell shapes, as shown in Figure 7, when the cell size is 100 μm. These models include circular holes (SC, surface area = 18,402 μm2), square holes (SQ, surface area = 24,942 μm2), hexagonal holes (SH, surface area = 31,758 μm2), octagonal holes (SO, surface area = 26,365 μm2), and dodecagonal holes (SD, surface area = 30,265 μm2). With a porosity of 90%, the volume-specific surface area ratio (VSSA) is calculated compared to the volume. The order of volume-specific surface area, from largest to smallest, is as follows: circular holes SC, square holes SQ, octagonal holes SO, dodecagonal holes SD, and hexagonal holes SH. A schematic diagram of the different structures is shown in Figure 7.
From the analysis of the results in Figure 8, it can be observed that the volume-specific surface area mainly influences the conductive thermal transfer. When porosity and wall thickness remain unchanged, a decrease in volume-specific surface area leads to an increase in conductive thermal conductivity. A larger surface area means a higher surface-to-volume ratio in the porous structure, which enhances surface plasmon resonance. This enhancement increases the local energy density, thereby indirectly improving the material’s thermal conductivity. Conversely, as the surface area increases, the radiative thermal conductivity decreases, but the effect is not significant. Due to the high surface area and micro-scale effects, radiation may undergo multiple reflections or absorption, further reducing its effective propagation.

3.2.4. Effect of Refractive Index and Extinction Coefficient

Thermal transfer in foam metals occurs through the vibration of electrons. Additionally, electromagnetic waves generated by the free electrons in the metal produce substantial radiative energy, which is related to the relative permittivity. In the calculation of relative permittivity ε = n + i k 2 , n represents the refractive index and k represents the extinction coefficient. In the calculation, we assume that at 90%, both the refractive index and extinction coefficient change proportionally with wavelength. We investigate the effect of these factors on the equivalent thermal conductivity under five different conditions.
To explore the impact of the refractive index and extinction coefficient on the equivalent thermal conductivity, we assume that when one parameter changes, the other remains constant, as shown in Figure 9a and Figure 10a. The changes in refractive index and extinction coefficient in the relative permittivity mainly affect electromagnetic waves, and thus have little impact on the conductive heat transfer. From Figure 9, it can be seen that as the refractive index increases from n1 to n5, the equivalent thermal conductivity shows almost no significant change at smaller sizes (approximately less than 0.5 μm), because at smaller sizes, the light path inside the material is short, and the effects of reflection and scattering are relatively minimal. When the size reaches around 0.5 μm–5 μm, the equivalent thermal conductivity reaches a low point. This is due to the increase in refractive index, which causes more light to be reflected multiple times by the pore walls, thereby reducing the radiative heat transfer through the pores. This leads to increased local absorption and decreased radiative conduction efficiency. As the size continues to increase to 100 μm, the equivalent thermal conductivity starts to rise. Because the increase in refractive index enhances the transmission and diffusion of radiative light, particularly at larger sizes, the longer light propagation path improves radiation thermal conductivity.
As shown in Figure 10, a higher extinction coefficient indicates that the material has a greater ability to absorb radiative energy. As the extinction coefficient increases from k1 to k5, the equivalent thermal conductivity decreases at smaller sizes (approximately less than 0.5 μm). This is because a higher extinction coefficient enhances radiative absorption within the pores, reducing effective radiative transfer. Therefore, with an increase in the extinction coefficient, the equivalent thermal conductivity shows a decreasing trend. Meanwhile, as the size increases, the propagation path of light becomes longer, which enhances the scattering ability of light and improves radiative transfer. As a result, at larger sizes, the equivalent thermal conductivity increases with the extinction coefficient. By analyzing the thermal conductivity behavior of porous foam materials under different optical properties, this study considers the design of materials with dynamically adjustable optical characteristics to meet the evolving demands of thermal management.

3.3. Radiative Properties Analysis

To investigate the thermal radiation characteristics of micro-porous metals, a regular aluminum foam metal material was constructed, and models exhibiting maximum and minimum values were selected. Specifically, these are the models where the equivalent thermal conductivity reaches its maximum and minimum at a porosity of 90% and 80%, with cell sizes Dh = 10 μm and Dh = 1 μm, respectively. The absorption rate, reflectivity, and transmittance in the visible and infrared wavelength bands were calculated, and the spectral characteristics are shown in the variation curves in Figure 11.
From Figure 11, it can be seen that the variation trends of the porous aluminum structure in the visible and infrared wavelength bands are nearly identical, with the main difference being the wavelengths at which the changes occur. Figure 11a shows that when the wavelength is less than 1 μm, the reflectivity, absorption rate, and transmittance exhibit significant fluctuations without a clear monotonic trend. For porous aluminum foam, the absorption rate initially reaches a high value in the visible light range. As the wavelength approaches 1 μm, it sharply drops to nearly 0, and in the near-infrared range, a peak appears around 2.2 μm, after which it stabilizes. At the same time, the reflectivity shows a peak in the near-infrared range at a wavelength of 1.8 μm, followed by a valley at around 2.2 μm. As the wavelength increases beyond 3 μm, the spectral characteristics stabilize, entering a state of total reflection. In the end, the absorption and transmittance are much smaller than the reflectivity, approaching 0. From Figure 11, it is evident that the porous aluminum structure demonstrates excellent spectral tuning capabilities in the infrared range. To further investigate the spectral radiative properties within the porous structure, the distribution of electromagnetic fields and energy flux will be analyzed in subsequent studies, particularly focusing on the reflection and absorption peaks in the cube structure.
This study selects models with cell structure sizes of 10 μm and 1 μm and porosity of 90% and 80% as references. For the structure with a size of 10 μm, the electric and magnetic field distributions are analyzed at Z = 0 μm, Z = 0.75 μm, and Z = 1.5 μm. For the structure with a size of 1 μm, the electric and magnetic field distributions are analyzed at Z = 0 μm, Z = 7.5 μm, and Z = 15 μm. The screenshot of the electromagnetic field distribution is shown in Figure 12.
We determined the wavelengths at which reflection and absorption peaks occur in the computational domain. Changes in magnetic field strength and electric field direction from the center to the edge of the pore were recorded. Figure 13, Figure 14, Figure 15 and Figure 16 illustrate the electromagnetic field distribution at the absorption and reflection peak wavelengths. In the figures, the color variation represents changes in magnetic field strength, while the arrows indicate the direction of the electric field. Meanwhile, we calculated the radiation dissipation efficiency by studying the energy flux at the gas–solid interfaces. The radiative dissipation coefficients for each section are listed in Table 1, Table 2, Table 3 and Table 4.
The magnetic field strength is shown on a logarithmic scale in the figure, with arrows representing the variation in the direction of the electric field. Cross-sections are taken perpendicular to the electric field direction. By observing the four sets of pictures, it can be seen that the direction of the electric field deviates near the gas–solid interface surface. By analyzing the cross-sectional images, it can be observed that the magnetic field is weaker inside the structure but stronger on both sides. The direction of the electric field deviates near the surface of the structure, indicating the presence of surface plasmon polariton (SPP) resonance. The SPP phenomenon causes an abnormal concentration of the magnetic field in the gas–solid interface region.
By comparing the four sets of pictures, it can be found that there is an obvious attenuation phenomenon in the center position along the propagation direction. According to Faraday’s law of electromagnetic induction, when the frequency of the varying electromagnetic wave approaches a certain characteristic value, an induced current is generated. The formation of this induced current produces an induced magnetic field in the opposite direction. The interaction between these two magnetic fields leads to their mutual cancellation and weakens the local magnetic field. This phenomenon is known as magnetic polariton (MP) resonance. This resonance generates an induced current along the direction of the electric field within the internal cavity, forming a light-colored magnetic field band, which is clearly visible in the images. The two electromagnetic phenomena work together to cause peaks in the spectral properties of the emergent material.
Analyzing the comparison of the radiative dissipation efficiencies of the four sets of tables, it can be observed that as the porosity decreases, the radiative dissipation efficiencies of the structures with small porosities increase considerably as compared to the structures with high porosities. The enhancement of radiative dissipation at gas–solid interfaces results in stronger absorption and scattering of radiant energy at the interface, which leads to an increase in the loss of thermal energy at the interface. This leads to a decrease in thermal conductivity.
The surface plasmon polariton and the magnetic polaritons resonance generated at the gas–solid cross-section due to microscale effects influence the thermal transport properties of metal foams. These phenomena are critical to the design of porous metallic materials, allowing control of thermal conductivity through structural design and material selection for precise thermal management and insulation. In some composites, negative resonance can be combined with surface plasmon resonance to create materials with unique electromagnetic properties. By accurately designing the material structure, negative resonance can be used to tailor the propagation properties of SPP so that the material exhibits high absorption or shielding under specific conditions.

4. Conclusions

This study develops a complete predictive model for equivalent thermal conductivity and provides a detailed analysis of the internal heat transfer and radiation mechanisms, which are essential for the application of materials in thermal management technologies. A periodic open-cell metal foam structure is used in the study, where the microscale conduction is calculated using LBM along with the heat transfer control equation. In addition, the impact of microscale radiation characteristics is examined through finite element methods and Maxwell’s equations for electromagnetic waves. The main conclusions are as follows.
(1)
The equivalent thermal conductivity of micro-porous metal materials decreases with increasing porosity, with porosity having a greater impact on conductive heat transfer. The cell size structure primarily influences radiative thermal conductivity. When the cell size is comparable to the characteristic wavelength at the given temperature, radiative heat transfer significantly weakens. In most cases, conduction dominates heat transfer, but at high porosity levels, radiative thermal conductivity may exceed conductive thermal conductivity.
(2)
As the temperature rises, the equivalent thermal conductivity of the micro-porous structure increases. This is primarily due to the effect of temperature on the radiative energy calculation using Planck’s law, which leads to an increase in radiative thermal conductivity.
(3)
As the refractive index of the material increases, the equivalent thermal conductivity shows little significant change at smaller sizes (approximately less than 0.5 μm). Meanwhile, as the size increases, the equivalent thermal conductivity starts to rise significantly with the increase in refractive index. When the extinction coefficient changes, the variation in equivalent thermal conductivity follows a trend similar to that of the refractive index under large pore conditions. As the pore size decreases, the equivalent thermal conductivity decreases with an increase in extinction coefficient.
(4)
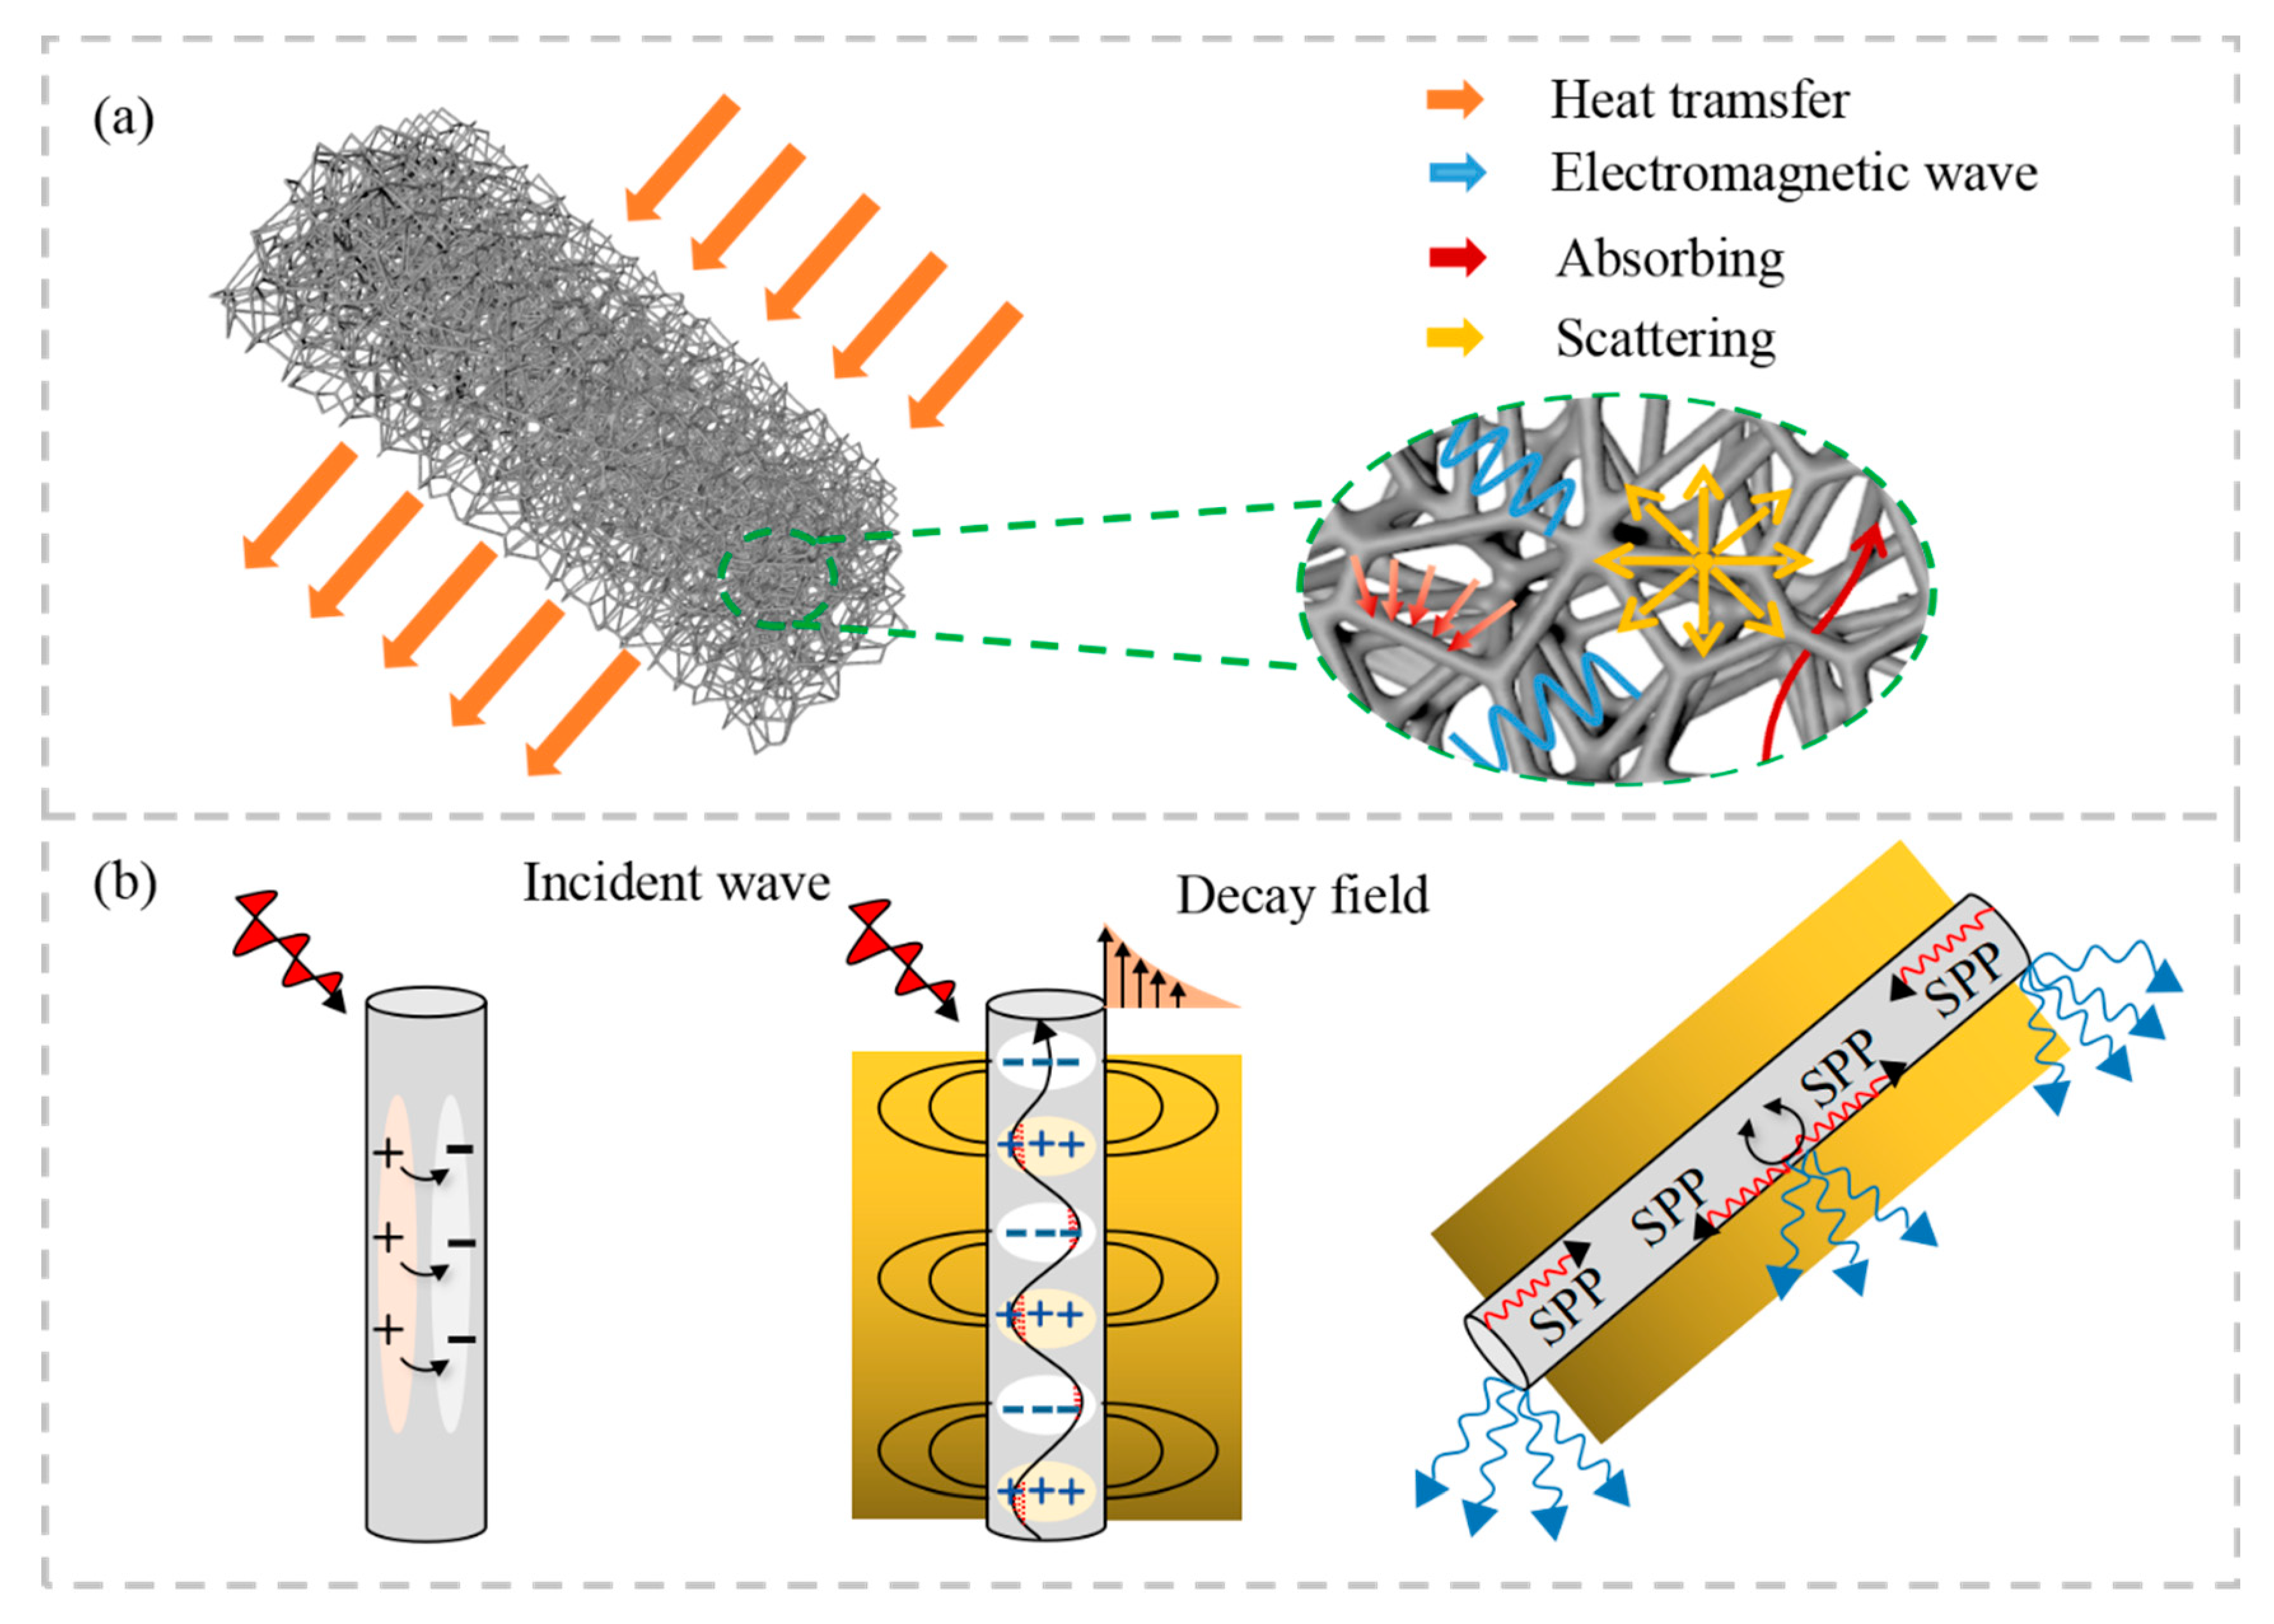
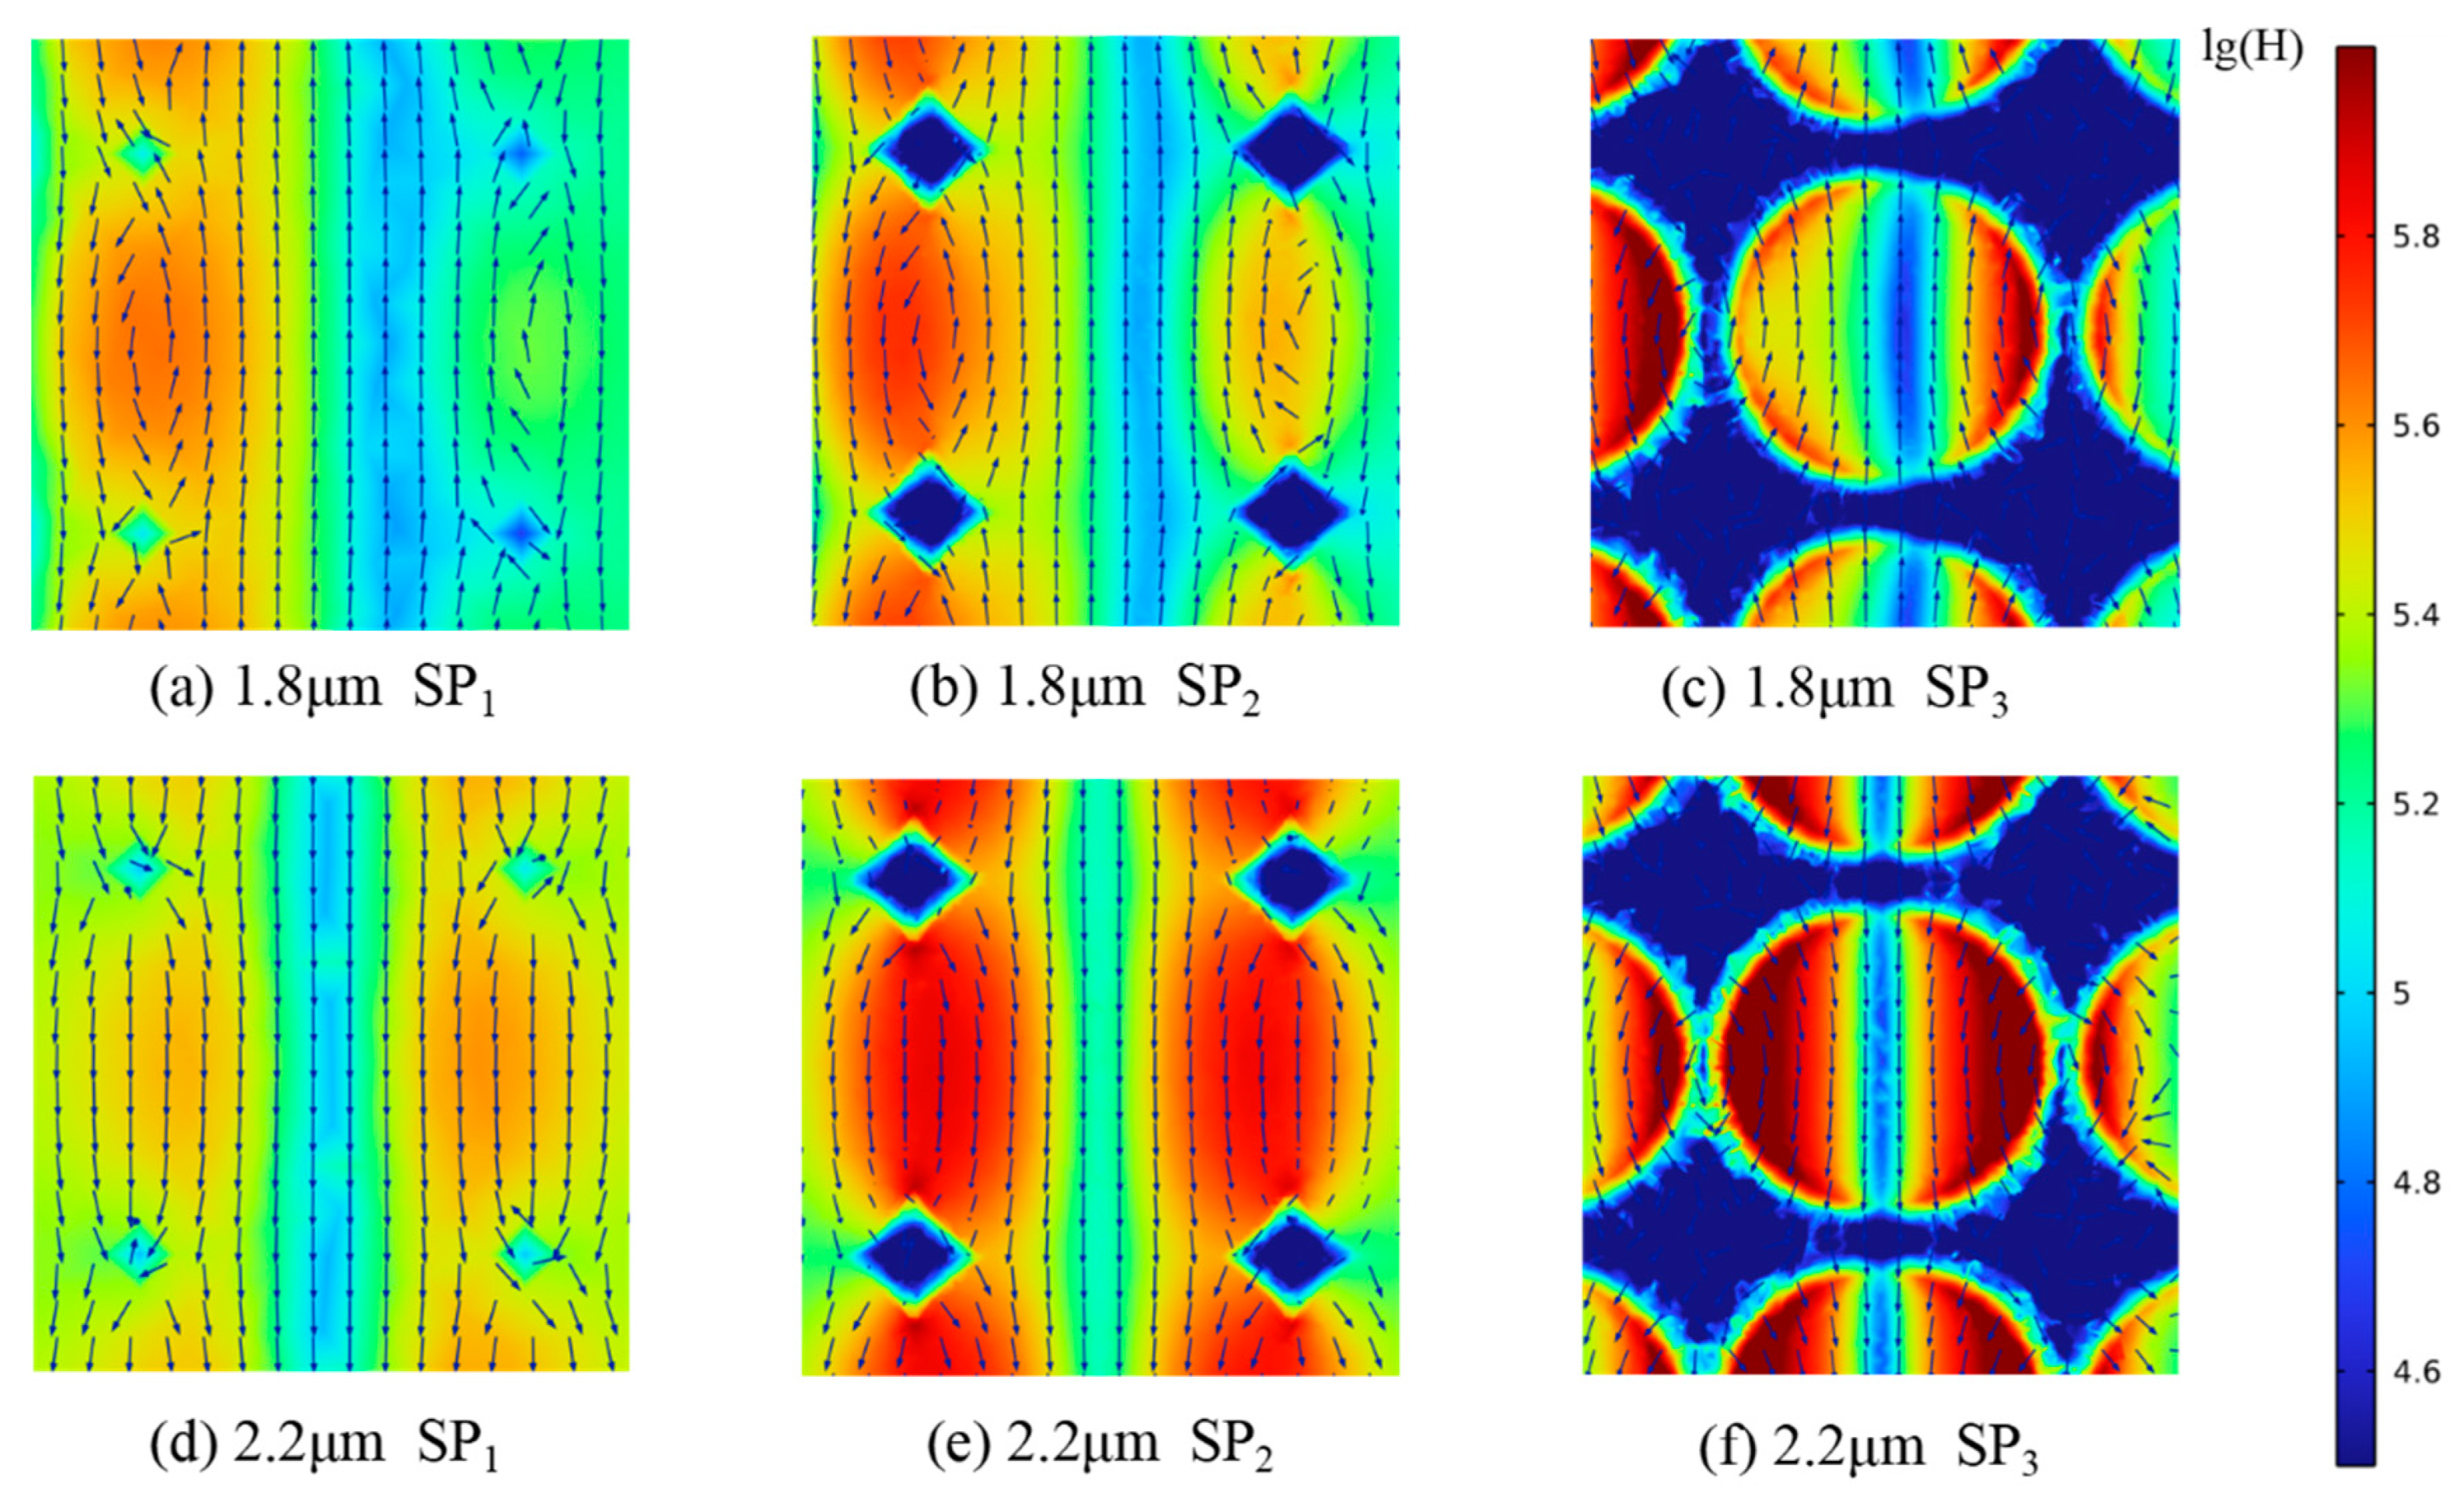
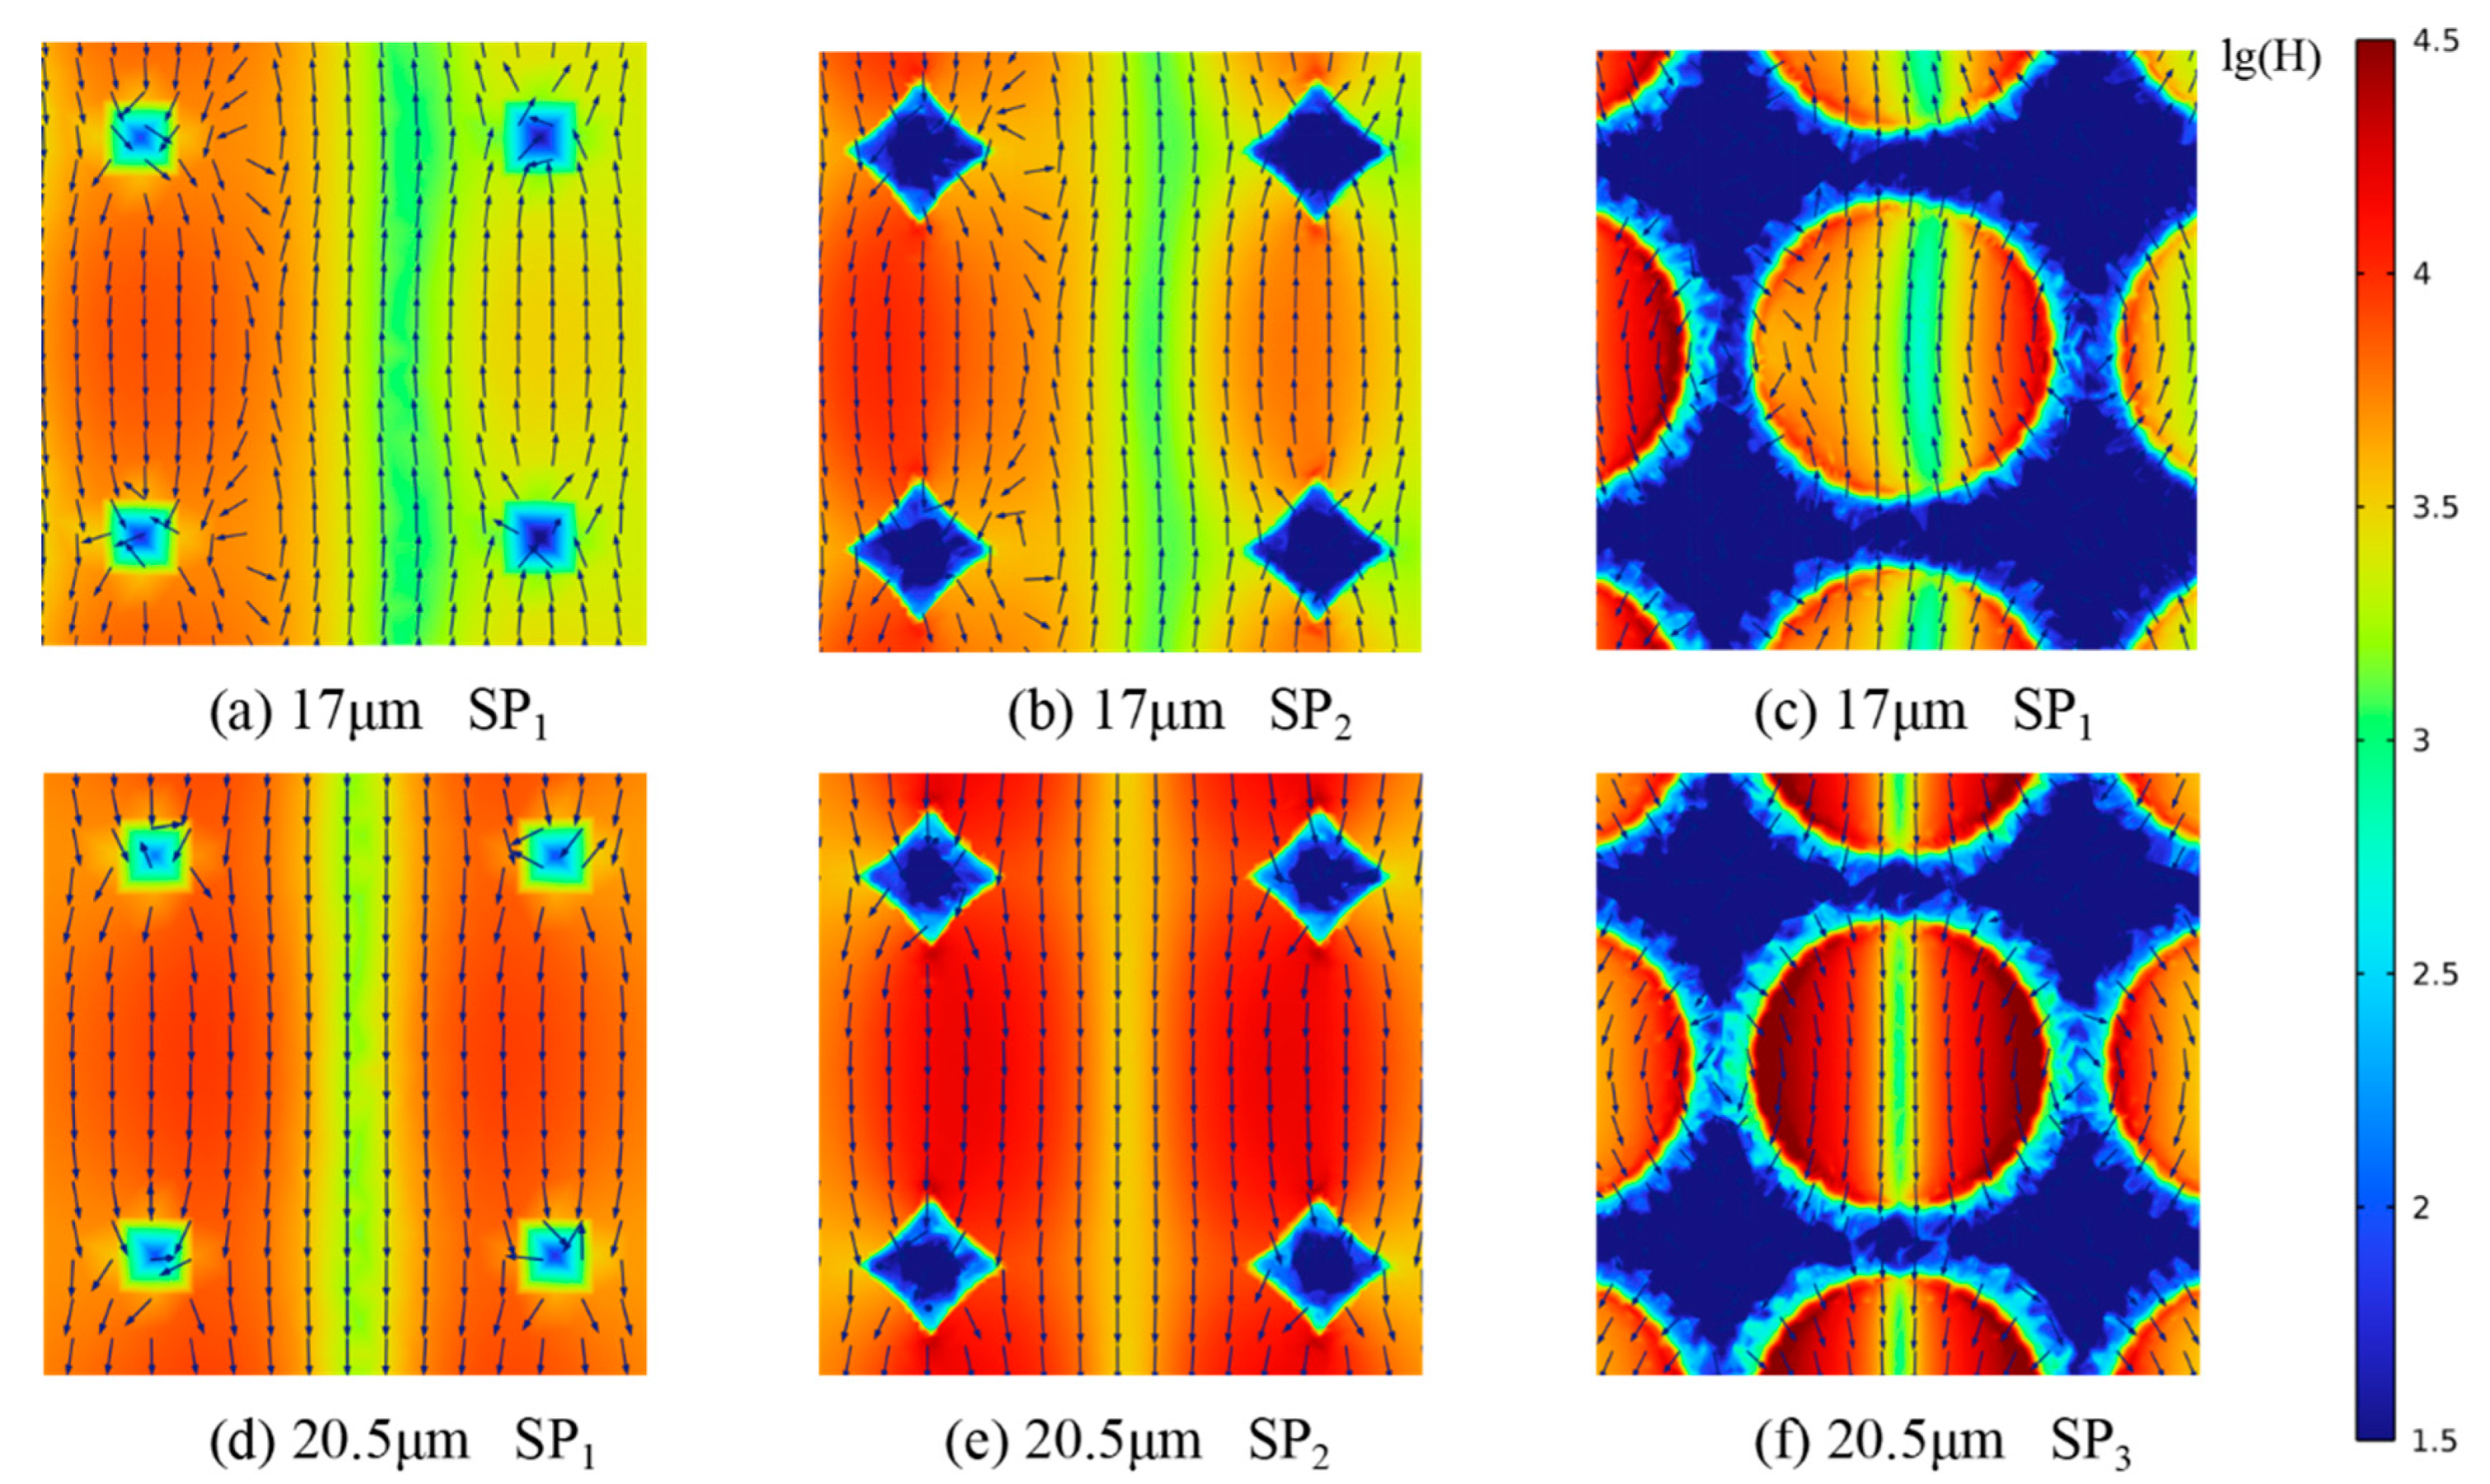
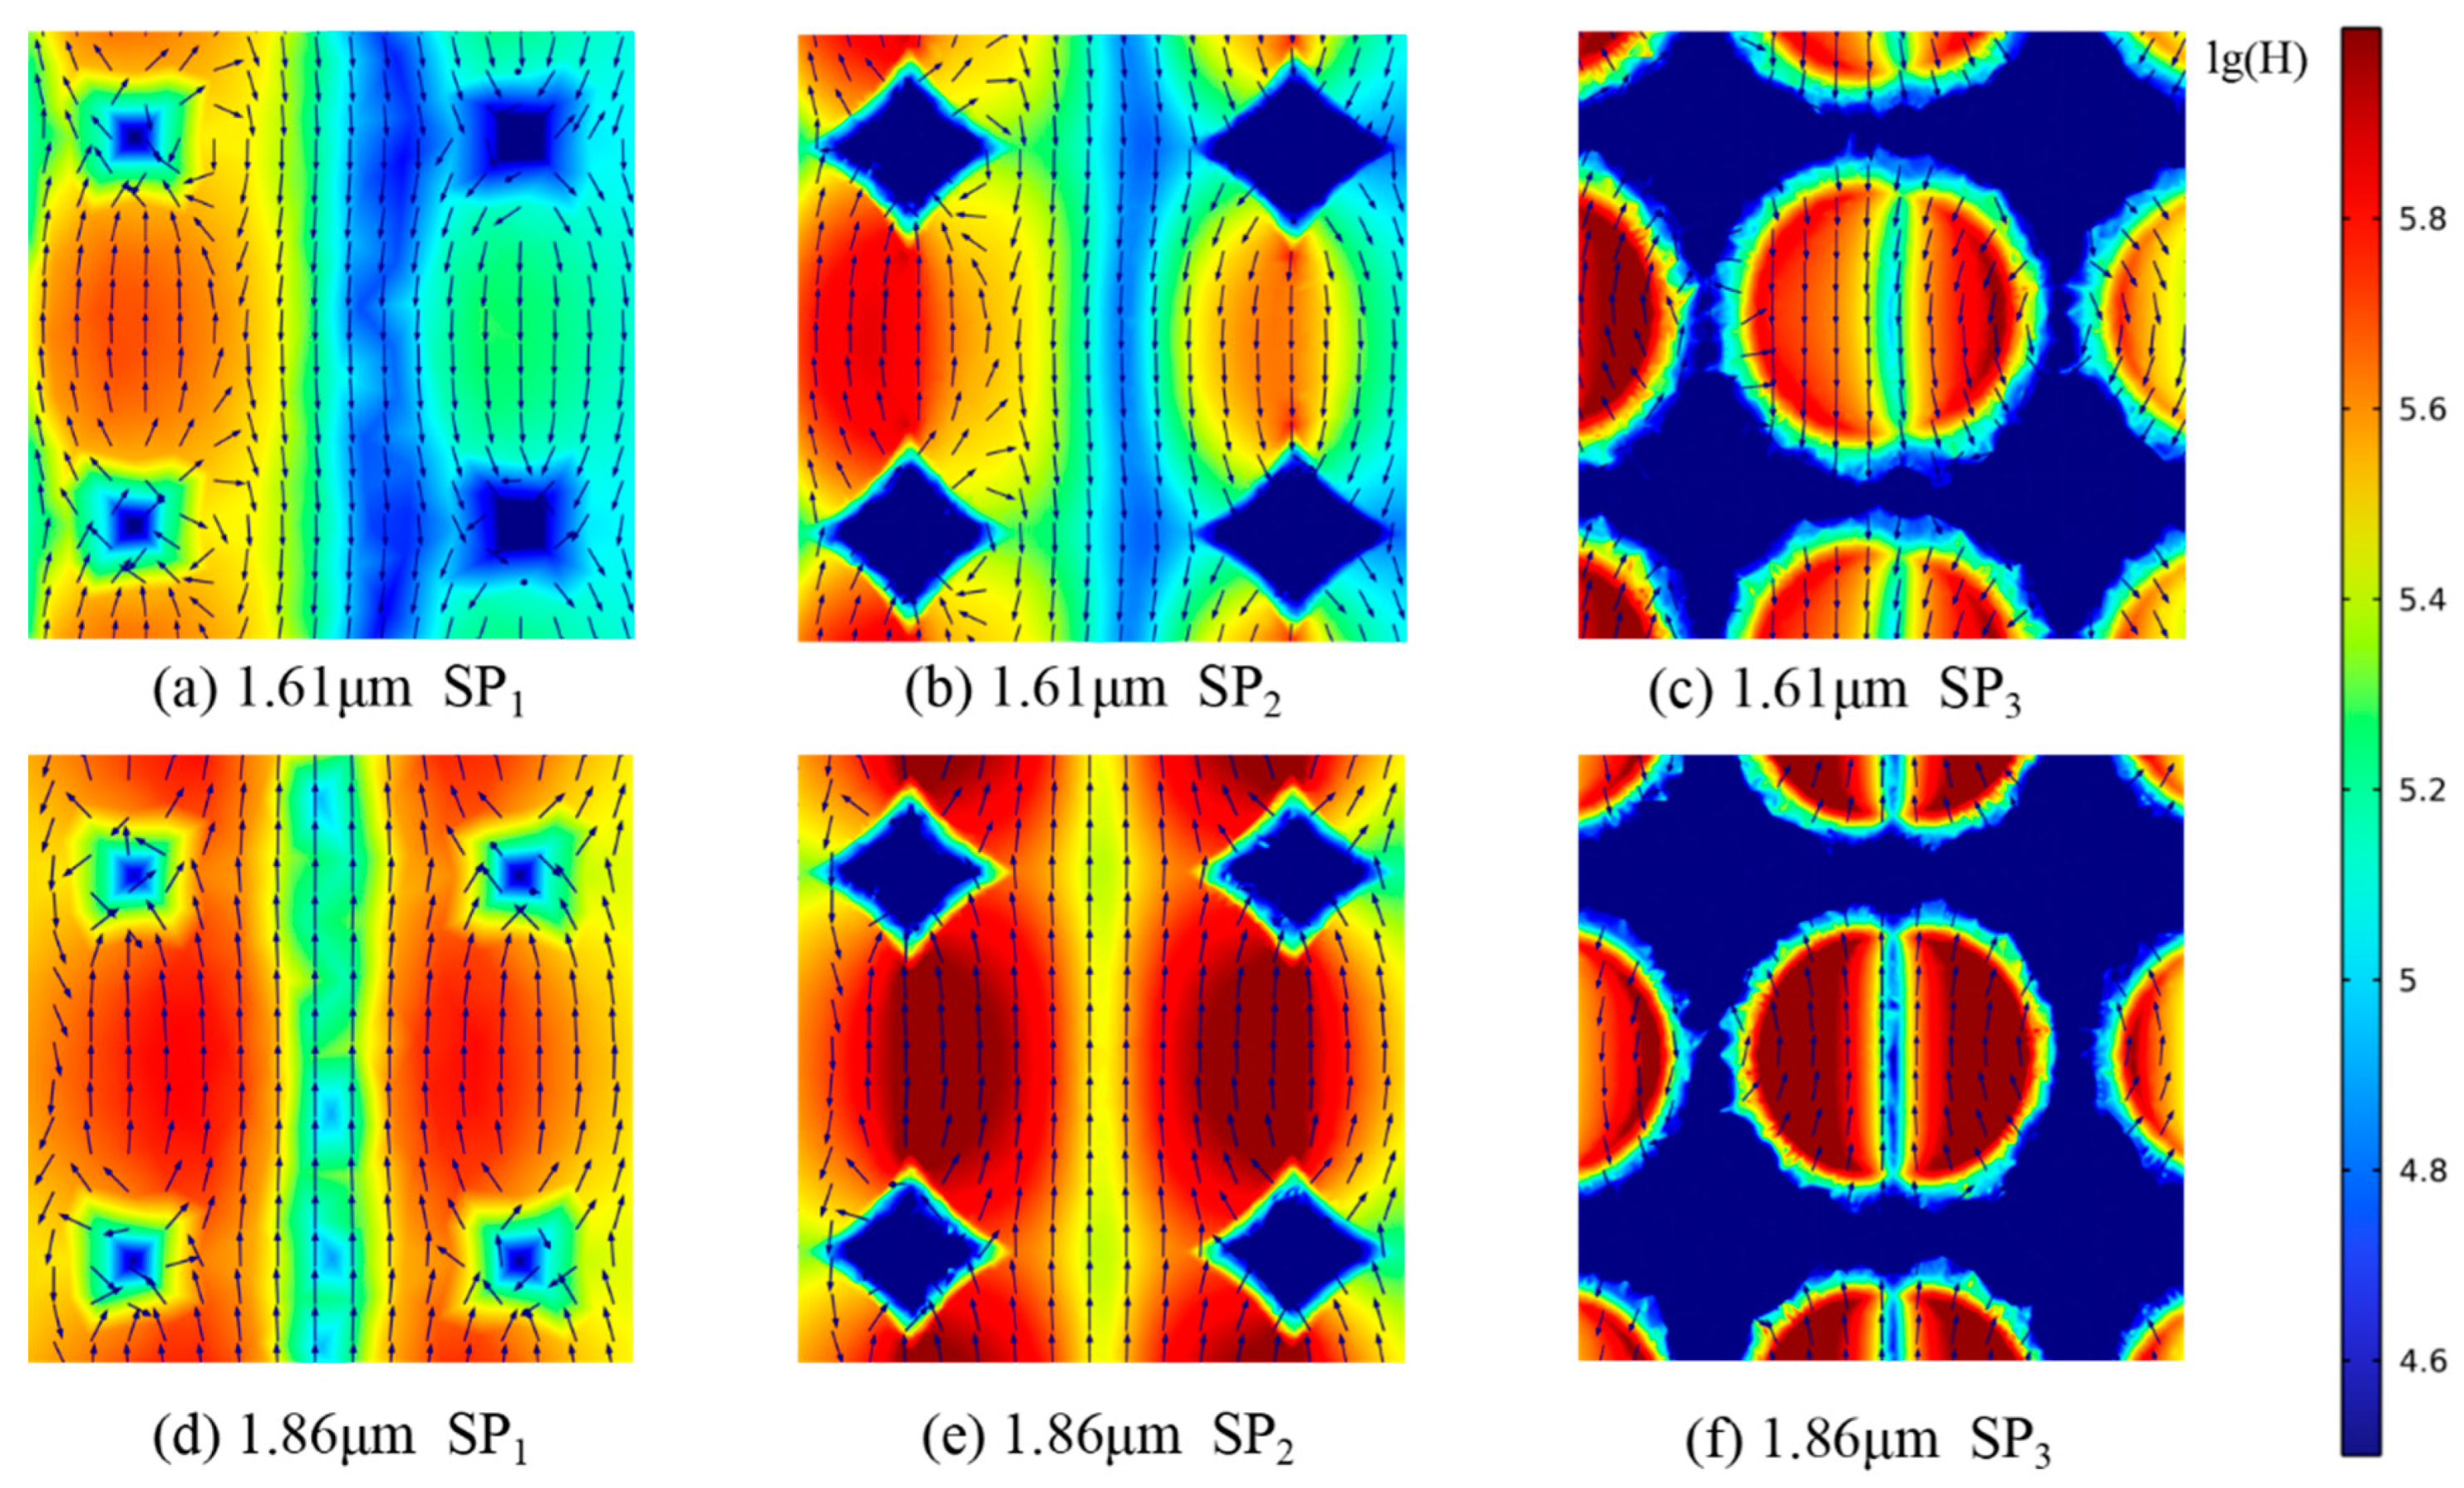
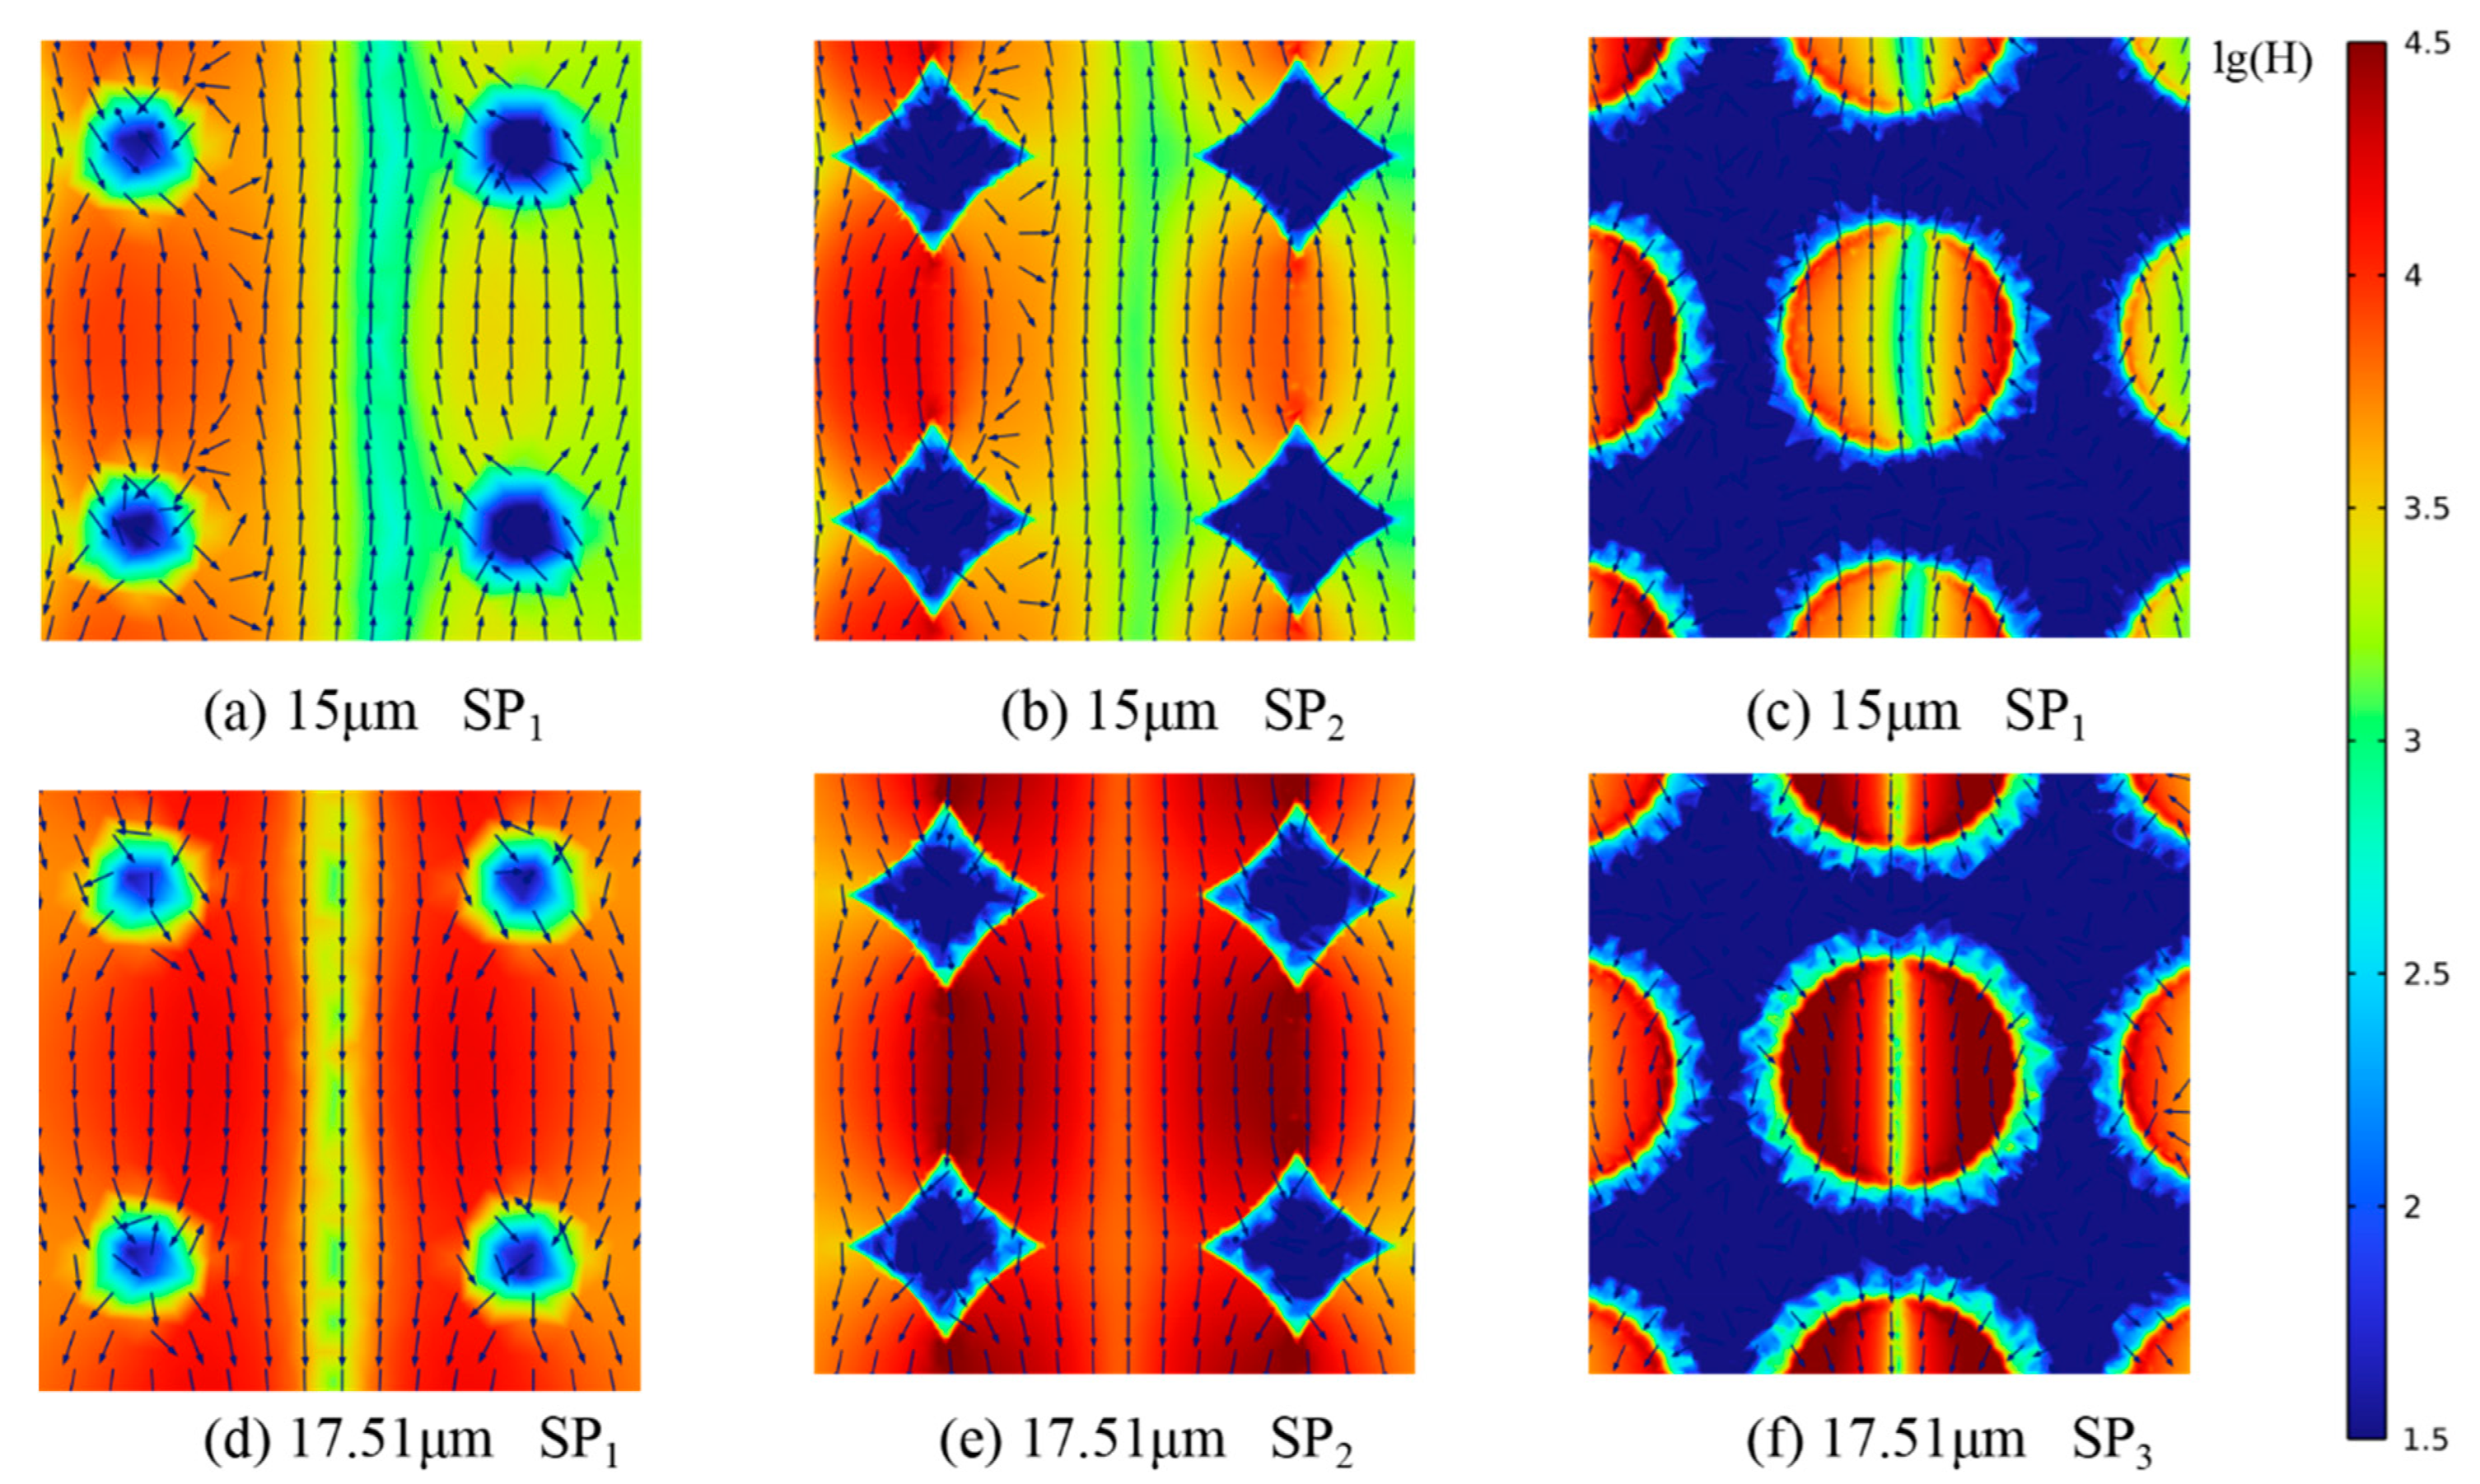
The spectral radiation characteristic contour map reveals that the surface plasmon polariton (SPP) resonance and the magnetic polariton (MP) resonance occur at the gas–solid interface, which significantly enhances the radiation dissipation at the gas–solid interface, improves the efficiency of radiation dissipation, and reduces the thermal conductivity of the materials.

Supplementary Materials

The following supporting information can be downloaded at: https://www.mdpi.com/article/10.3390/en18061529/s1. Refs. [29,44,45,46] are cited in Supplementary Materials file.

Author Contributions

Conceptualization, A.C. and H.Y.; methodology, A.C. and H.Y.; software, A.C. and J.C.; validation, M.L. and J.C.; formal analysis, A.C.; investigation, J.C.; data curation, M.L. and X.R.; writing—original draft preparation, A.C.; writing—review and editing, G.W. and H.Y.; funding acquisition, H.Y. All authors have read and agreed to the published version of the manuscript.

Funding

The authors are grateful to the Shandong Provincial Natural Science Foundation (No. ZR2023QE258) and the National Natural Science Foundation of China (No. 52406102).

Data Availability Statement

The original contributions presented in this study are included in the article/Supplementary Materials. Further inquiries can be directed to the corresponding author.

Conflicts of Interest

The authors declare no conflict of interest.

Nomenclature

Kthermal conductivityW/(m*K)
TtemperatureK
Rdiameter of holem
Dhmetameric sizem
ttimes
fitemperature evolution function-
τdimensional relaxation times
idiscrete direction-
xlocation vector-
eidiscrete velocity-
δttime step-
fieqlocal equilibrium function-
T(x,t)local temperatureK
clattice sound speed-
qdensity of heat sourceW/m2
σa,λspectral absorptionm−1
σs,λscattering coefficientm−1
σe,λspectral extinction coefficientm−1
Bmagnetic flux densityWb/m2
Delectric displacement vectorC/m2
Eelectric field vectorV/m
Hmagnetic field vectorA/m
Jcurrent densityA/m2
εpermittivityF/m
μpermeabilityH/m
σelectrical conductivityS/m
Aabsorption-
Rreflection-
Ttransmission-
Sincident energy flowW
nrefractive index-
Nparticle numbers-
∆Ttemperature differenceK
SQsquare hole
SCcircular hole
SOOctagonal hole
SHHexagonal hole
SDDodecagonal hole
Zcross-section
VSSAVolume-Specific Surface Area
ωκrad/κtotal
Superscript
*complex vector-
aabsorption-
iincident-
sscattering-
incincident-
scascattering-
Subscript
condconduction-
radthermal radiation-
totaltotal heat transfer-

References

  1. Yang, T.; Liu, W.; Kramer, G.J.; Sun, Q. Seasonal thermal energy storage: A techno-economic literature review. Renew. Sustain. Energy Rev. 2021, 139, 110732. [Google Scholar] [CrossRef]
  2. Wang, S.; Huang, Y.; Zhao, C.; Chang, E.; Ameli, A.; Naguib, H.E.; Park, C.B. Theoretical modeling and experimental verification of percolation threshold with MWCNTs’ rotation and translation around a growing bubble in conductive polymer composite foams. Compos. Sci. Technol. 2020, 199, 108345. [Google Scholar] [CrossRef]
  3. Khan, S.A.; Al-Ghamdi, S.G. Synthesis of graphene oxide nanofluid based micro-nano scale surfaces for high-performance nucleate boiling thermal management systems. Case Stud. Therm. Eng. 2021, 28, 101436. [Google Scholar] [CrossRef]
  4. Kumar, P.P.; Gireesha, B.; Venkatesh, P.; Keerthi, M. Comparative analysis of transient thermal behaviour and efficiency in longitudinal metal porous fin with combined heat and mass transfer under dehumidification conditions. Appl. Therm. Eng. 2025, 261, 125069. [Google Scholar] [CrossRef]
  5. Meng, J.; Yao, Z.; Du, H.; Lv, M. Thermal protection method of the solar array for stratospheric airships. Appl. Therm. Eng. 2017, 111, 802–810. [Google Scholar] [CrossRef]
  6. Awasthi, A.; Hwang, K.-I.; Jeon, Y. Performance improvement of novel latent thermal energy storage system with two-layer metal foam porosities. Case Stud. Therm. Eng. 2024, 60, 104668. [Google Scholar] [CrossRef]
  7. Khattar, M.Z.; Heyhat, M.M. Exergy, Economic and Environmental Analysis of a Direct Absorption Parabolic Trough Collector Filled with Porous Metal Foam. Energies 2022, 15, 8150. [Google Scholar] [CrossRef]
  8. Ke, H.; Zhou, X.; Liu, T.; Wang, Y.; Wang, H. Numerical Study of Heat and Mass Transfer in the Original Structure and Homogeneous Substitution Model for Three Dimensional Porous Metal Foam. Energies 2023, 16, 1114. [Google Scholar] [CrossRef]
  9. Dukhan, N. Equivalent parallel strands modeling of highly-porous media for two-dimensional heat transfer: Application to metal foam. Energies 2021, 14, 6308. [Google Scholar] [CrossRef]
  10. Ali, R.M.K.; Lafta Ghashim, S. Numerical analysis of the heat transfer enhancement by using metal foam. Case Stud. Therm. Eng. 2023, 49, 103336. [Google Scholar] [CrossRef]
  11. Liu, B.; Feng, J.; Wang, Z.-A.; Shi, G.-H. Numerical analysis of radiative transfer and prediction of spectral properties for combined material composed of nickel foam and TiO2 nanofluid. Int. J. Therm. Sci. 2024, 202, 109096. [Google Scholar] [CrossRef]
  12. Yu, H.; Zhang, H.; Wang, H.; Zhang, D. The equivalent thermal conductivity of the micro/nano scaled periodic cubic frame silver and its thermal radiation mechanism analysis. Energies 2021, 14, 4158. [Google Scholar] [CrossRef]
  13. Gong, P.; Wang, G.; Tran, M.-P.; Buahom, P.; Zhai, S.; Li, G.; Park, C.B. Advanced bimodal polystyrene/multi-walled carbon nanotube nanocomposite foams for thermal insulation. Carbon 2017, 120, 1–10. [Google Scholar] [CrossRef]
  14. Zhu, Y.; Yuan, J.-H.; Fang, W.-Y.; Sun, Z.-G.; Wang, J.J.A.S.S. A family of two-dimensional semiconductors with transition metal Kagome lattice, large power factor and ultralow lattice thermal conductivity. Appl. Surf. Sci. 2023, 636, 157817. [Google Scholar] [CrossRef]
  15. Liu, B.; Shi, J.; Liew, K.; Shen, S. Near-field radiative heat transfer for Si based metamaterials. Opt. Commun. 2014, 314, 57–65. [Google Scholar] [CrossRef]
  16. Kumar, V.; Raghuwanshi, S.K. Efficiency estimation and hardware implementation of solar PV module system assisted by using surface plasmon resonance sensor. Case Stud. Therm. Eng. 2023, 51, 103479. [Google Scholar] [CrossRef]
  17. Van Zwol, P.; Joulain, K.; Ben-Abdallah, P.; Chevrier, J. Phonon polaritons enhance near-field thermal transfer across the phase transition of VO2. Phys. Rev. B Condens. Matter Mater. Phys. 2011, 84, 161413. [Google Scholar] [CrossRef]
  18. Huang, J.; Xuan, Y.; Li, Q. Narrow-band spectral features of structured silver surface with rectangular resonant cavities. J. Quant. Spectrosc. Radiat. Transf. 2011, 112, 839–846. [Google Scholar] [CrossRef]
  19. Boomsma, K.; Poulikakos, D. On the effective thermal conductivity of a three-dimensionally structured fluid-saturated metal foam. Int. J. Heat Mass Transf. 2001, 44, 827–836. [Google Scholar] [CrossRef]
  20. Changqing, X.; Zhiqiang, L.; Lin, J.; Zhihua, W.; Longmao, Z. Theoretical Study and Numerical Simulation of Effective Thermal Conductivities of Open-Cell Metallic Foam. Rare Met. Mater. Eng. 2014, 43, 686–691. [Google Scholar]
  21. He, Y.-L.; Xie, T. Advances of thermal conductivity models of nanoscale silica aerogel insulation material. Appl. Therm. Eng. 2015, 81, 28–50. [Google Scholar] [CrossRef]
  22. Nie, Z.; Lin, Y.; Tong, Q. Numerical investigation of pressure drop and heat transfer through open cell foams with 3D Laguerre-Voronoi model. Int. J. Heat Mass Transf. 2017, 113, 819–839. [Google Scholar] [CrossRef]
  23. Xia, X.-L.; Liu, B.; Chen, X.; Sun, C. Prediction of spectral radiative property based on the microscopic ligament morphology and pore-level structure of open-cell alumina foam. Infrared Phys. Technol. 2022, 126, 104331. [Google Scholar] [CrossRef]
  24. Luo, M.; Wang, C.; Zhao, J.; Liu, L. Characteristics of effective thermal conductivity of porous materials considering thermal radiation: A pore-level analysis. Int. J. Heat Mass Transf. 2022, 188, 122597. [Google Scholar] [CrossRef]
  25. Fan, C.; Li, X.-L.; Xia, X.-L.; Sun, C. Tomography-based pore level analysis of combined conductive-radiative heat transfer in an open-cell metallic foam. Int. J. Heat Mass Transf. 2020, 159, 120122. [Google Scholar] [CrossRef]
  26. Lin, Y.; Yang, C.; Zhang, W.; Fukumoto, K.; Saito, Y.; Machida, H.; Norinaga, K. Estimation of effective thermal conductivity in open-cell foam with hierarchical pore structure using lattice Boltzmann method. Appl. Therm. Eng. 2023, 218, 119314. [Google Scholar] [CrossRef]
  27. Chen, S.; Ai, B.; Li, Y.; Huang, X.; Yang, X. The effective thermal conductivity of random isotropic porous media analysis and prediction. Eng. Anal. Bound. Elem. 2024, 167, 105895. [Google Scholar] [CrossRef]
  28. Yu, H.; Zhang, H.; Zhao, J.; Liu, J.; Xia, X.; Wu, X. Thermal conductivity of micro/nano-porous polymers: Prediction models and applications. Front. Phys. 2022, 17, 23202. [Google Scholar] [CrossRef]
  29. D’Orazio, A.; Succi, S. Boundary conditions for thermal lattice Boltzmann simulations. In Computational Science—ICCS 2003 International Conference Melbourne, Australia and St. Petersburg, Russia June 2–4, 2003 Proceedings, Part I; Springer: Berlin/Heidelberg, Germany, 2003; pp. 977–986. [Google Scholar]
  30. Lu, J.; Kan, A.; Zhu, W.; Yuan, Y. Numerical investigation on effective thermal conductivity of fibrous porous medium under vacuum using Lattice-Boltzmann method. Int. J. Therm. Sci. 2021, 160, 106682. [Google Scholar] [CrossRef]
  31. Qu, Z.; Fu, Y.; Liu, Y.; Zhou, L. Approach for predicting effective thermal conductivity of aerogel materials through a modified lattice Boltzmann method. Appl. Therm. Eng. 2018, 132, 730–739. [Google Scholar] [CrossRef]
  32. Wang, M.; Pan, N. Modeling and prediction of the effective thermal conductivity of random open-cell porous foams. Int. J. Heat Mass Transf. 2008, 51, 1325–1331. [Google Scholar] [CrossRef]
  33. Shen, S.; Narayanaswamy, A.; Chen, G. Surface phonon polaritons mediated energy transfer between nanoscale gaps. Nano Lett. 2009, 9, 2909–2913. [Google Scholar] [CrossRef] [PubMed]
  34. Howell, J.R.; Mengüç, M.P.; Daun, K.; Siegel, R. Thermal Radiation Heat Transfer; CRC Press: Boca Raton, FL, USA, 2020. [Google Scholar]
  35. Bernardo, V.; Martin-de Leon, J.; Pinto, J.; Schade, U.; Rodriguez-Perez, M.A. On the interaction of infrared radiation and nanocellular polymers: First experimental determination of the extinction coefficient. Colloids Surf. A Physicochem. Eng. Asp. 2020, 600, 124937. [Google Scholar] [CrossRef]
  36. Zhang, Z.M. Nano/Microscale Heat Transfer; Springer: Berlin/Heidelberg, Germany, 2007; Volume 410. [Google Scholar]
  37. Yu, H.; Zhang, H.; Xia, X. A fractal-skeleton model of high porosity macroporous aluminum and its heat transfer characterizes. J. Therm. Anal. Calorim. 2020, 141, 351–360. [Google Scholar] [CrossRef]
  38. Liu, Y.; Jin, R.; Qiu, J.; Liu, L. Spectral radiative properties of a nickel porous microstructure and magnetic polariton resonance for light trapping. Int. J. Heat Mass Transf. 2016, 98, 833–844. [Google Scholar] [CrossRef]
  39. Huang, Y.; Ringe, E.; Hou, M.; Ma, L.; Zhang, Z. Near-field mapping of three-dimensional surface charge poles for hybridized plasmon modes. AIP Adv. 2015, 5, 107221. [Google Scholar] [CrossRef]
  40. Abuserwal, A.F.; Luna, E.M.E.; Goodall, R.; Woolley, R. The effective thermal conductivity of open cell replicated aluminium metal sponges. Int. J. Heat Mass Transf. 2017, 108, 1439–1448. [Google Scholar] [CrossRef]
  41. Bhattacharya, A.; Calmidi, V.V.; Mahajan, R.L. Thermophysical properties of high porosity metal foams. Int. J. Heat Mass Transf. 2002, 45, 1017–1031. [Google Scholar] [CrossRef]
  42. Dukhan, N.; Chen, K.-C. Heat transfer measurements in metal foam subjected to constant heat flux. Exp. Therm. Fluid Sci. 2007, 32, 624–631. [Google Scholar] [CrossRef]
  43. Yang, X.H.; Bai, J.X.; Yan, H.B.; Kuang, J.J.; Lu, T.J.; Kim, T. An Analytical Unit Cell Model for the Effective Thermal Conductivity of High Porosity Open-Cell Metal Foams. Transp. Porous Media 2014, 102, 403–426. [Google Scholar] [CrossRef]
  44. Wang, J.; Wang, M.; Li, Z. A lattice Boltzmann algorithm for fluid–solid conjugate heat transfer. Int. J. Therm. Sci. 2007, 46, 228–234. [Google Scholar] [CrossRef]
  45. Zou, Q.; He, X. On pressure and velocity boundary conditions for the lattice Boltzmann BGK model. Phys. Fluids 1997, 9, 1591–1598. [Google Scholar] [CrossRef]
  46. Sacks, Z.S.; Kingsland, D.M.; Lee, R.; Lee, J.F. A perfectly matched anisotropic absorber for use as an absorbing boundary condition. IEEE Trans. Antennas Propag. 1995, 43, 1460–1463. [Google Scholar] [CrossRef]
Figure 1. Schematic diagram of heat transfer mechanism of the microporous metals. (a) primary heat transfer behaviors; (b) surface plasmon resonance.
Energies 18 01529 g001
Figure 2. Calculation process diagram.
Energies 18 01529 g002
Figure 3. Flow diagram of the equivalent thermal conductivity calculation progress.
Energies 18 01529 g003
Figure 4. Comparison of calculated results and experimental data for the equivalent thermal conductivity: (a) medium porosity model validation; (b) high porosity model validation.
Energies 18 01529 g004
Figure 5. The thermal conductivity of open cell Al foam versus cell size and porosity: (a) the total thermal conductivity; (b) the conductive thermal conductivity; (c) the radiative thermal conductivity; (d) the ratio of the radiation conductivity to the total equivalent thermal conductivity.
Energies 18 01529 g005
Figure 6. Relationship between temperature and thermal conductivity of open-cell foam: (a) the total thermal conductivity; (b) the conductive thermal conductivity; (c) the radiative thermal conductivity; (d) the ratio of the radiation conductivity to the total equivalent thermal conductivity.
Energies 18 01529 g006
Figure 7. Schematic diagram of different open-cell models and the VSSA ratio.
Energies 18 01529 g007
Figure 8. Relationship between volume-specific surface area and thermal conductivity of open-cell foam: (a) the total thermal conductivity; (b) the conductive thermal conductivity; (c) the radiative thermal conductivity; (d) the ratio of the radiation conductivity to the total equivalent thermal conductivity.
Energies 18 01529 g008
Figure 9. Relationship between refractive index and thermal conductivity: (a) equivalent thermal conductivity; (b) conductive and radiative thermal conductivity.
Energies 18 01529 g009
Figure 10. Relationship between extinction coefficient and thermal conductivity: (a) equivalent thermal conductivity; (b) conductive and radiative thermal conductivity.
Energies 18 01529 g010
Figure 11. Relationship between spectral characteristics and wavelength of open-cell foam: (a) φ = 90% Dh = 1 μm; (b) φ = 90% Dh = 10 μm; (c) φ = 80% Dh = 1 μm; (d) φ = 80% Dh = 10 μm.
Energies 18 01529 g011
Figure 12. Cross-section schematic.
Energies 18 01529 g012
Figure 13. Magnetic field strength and electric field distribution φ = 90% Dh = 1 μm.
Energies 18 01529 g013
Figure 14. Magnetic field strength and electric field distribution φ = 90% Dh = 10 μm.
Energies 18 01529 g014
Figure 15. Magnetic field strength and electric field distribution φ = 80% Dh = 1 μm.
Energies 18 01529 g015
Figure 16. Magnetic field strength and electric field distribution φ = 80% Dh = 10 μm.
Energies 18 01529 g016
Table 1. Radiation dissipation efficiency φ = 90% Dh = 1 μm.
λ = 1.8 SP1λ = 1.8 SP2λ = 1.8 SP3λ = 2.2 SP1λ = 2.2 SP2λ = 2.2 SP3
η (%)23.6528.0146.7122.7829.1948.34
Table 2. Radiation dissipation efficiency φ = 90% Dh = 10 μm.
λ = 17 SP1λ = 17 SP2λ = 17 SP3λ = 20.5 SP1λ = 20.5 SP2λ = 20.5 SP3
η (%)16.2721.2640.6820.7927.8642.09
Table 3. Radiation dissipation efficiency φ = 80% Dh = 1 μm.
λ = 1.61 SP1λ = 1.61 SP2λ = 1.61 SP3λ = 1.86 SP1λ = 1.86 SP2λ = 1.86 SP3
η (%)29.6231.3468.1032.1235.3570.78
Table 4. Radiation dissipation efficiency φ = 80% Dh = 10 μm.
λ = 15 SP1λ = 15 SP2λ = 15 SP3λ = 17.5 SP1λ = 17.5 SP2λ = 17.5 SP3
η (%)27.6529.5560.1029.6831.4960.78
Disclaimer/Publisher’s Note: The statements, opinions and data contained in all publications are solely those of the individual author(s) and contributor(s) and not of MDPI and/or the editor(s). MDPI and/or the editor(s) disclaim responsibility for any injury to people or property resulting from any ideas, methods, instructions or products referred to in the content.

