
A Cost-Optimizing Analysis of Energy Storage Technologies and Transmission Lines for Decarbonizing the UK Power System by 2035


Abstract
1. Introduction
- P2Mobility: Using Electric Vehicle (EV) batteries as floating daily energy storage that can be returned to the grid during times of low generation [7].
- P2Gas: Transforming electricity into renewable hydrogen produced from electrolysis, allowing seasonal energy storage when large quantities are stored underground as compressed gas [8].
- Conceptual studies that analyze the applications and limitations of various flexibility options or examine the features and capabilities of currently available models to simulate and understand how future energy systems would function.
- Implementation of energy models to microgrids.
- National or regional energy system modelling.
2. Materials and Methods
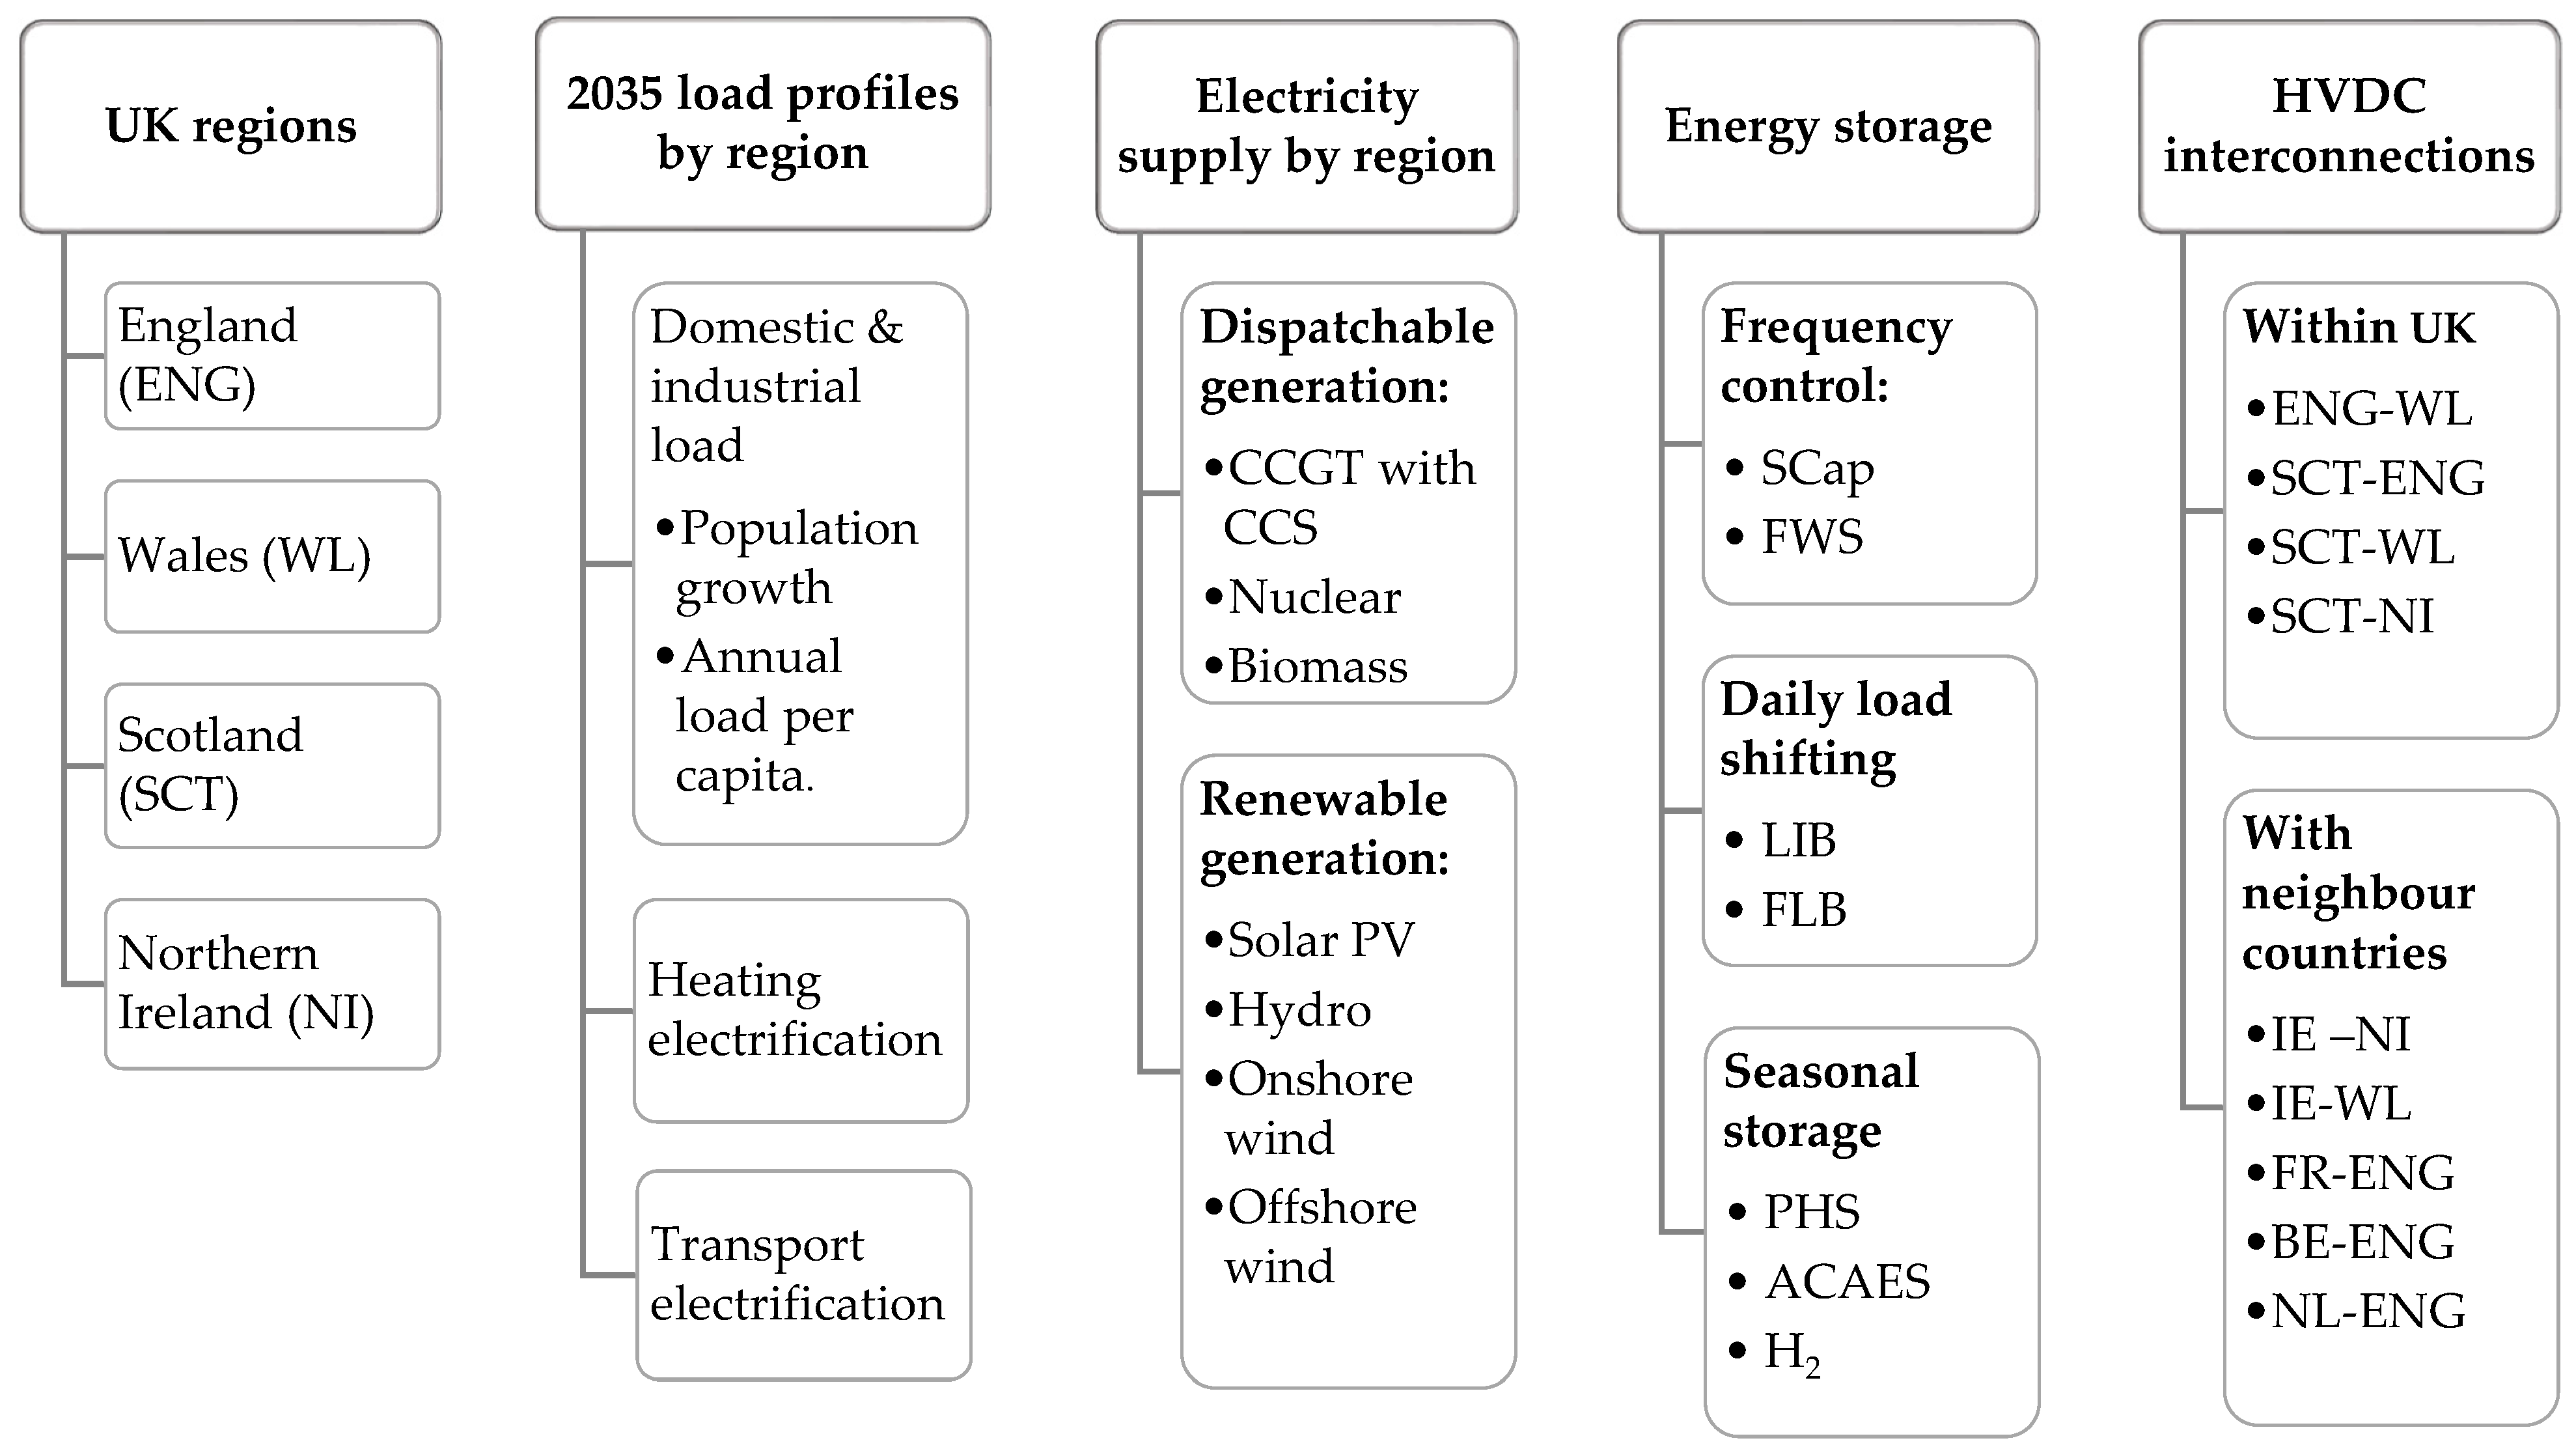
- Stage 1: Represents the basic power system composed of the estimated 2035 load and the available power generation technologies for each of the UK regions. In this stage, each region behaves as an independent grid.
- Stage 2: Builds upon stage 1, integrating energy storage technologies.
- Stage 3: Builds upon stage 2, adding grid interconnections between the UK regions and with neighbour countries such as Ireland, Belgium, France, and the Netherlands.
Model Inputs
- Domestic and industrial electricity consumption, forecasted from population growth trends [33,34,35,36] and estimated annual load per capita for the four regions [37,38]: Based on an analysis of data from 2009 to 2019, a decreasing trend in electricity consumption per capita in the range of −1.7% to −2% was identified for all UK regions. This trend was assumed to continue until 2035 assuming further implementation of energy efficiency measures;
- Heating electrification corresponding to 30% of households [1];
- Transport electrification corresponding to 50% of the car fleet [1] and 13% of the bus fleet.
3. Results
3.1. Baseline Scenario
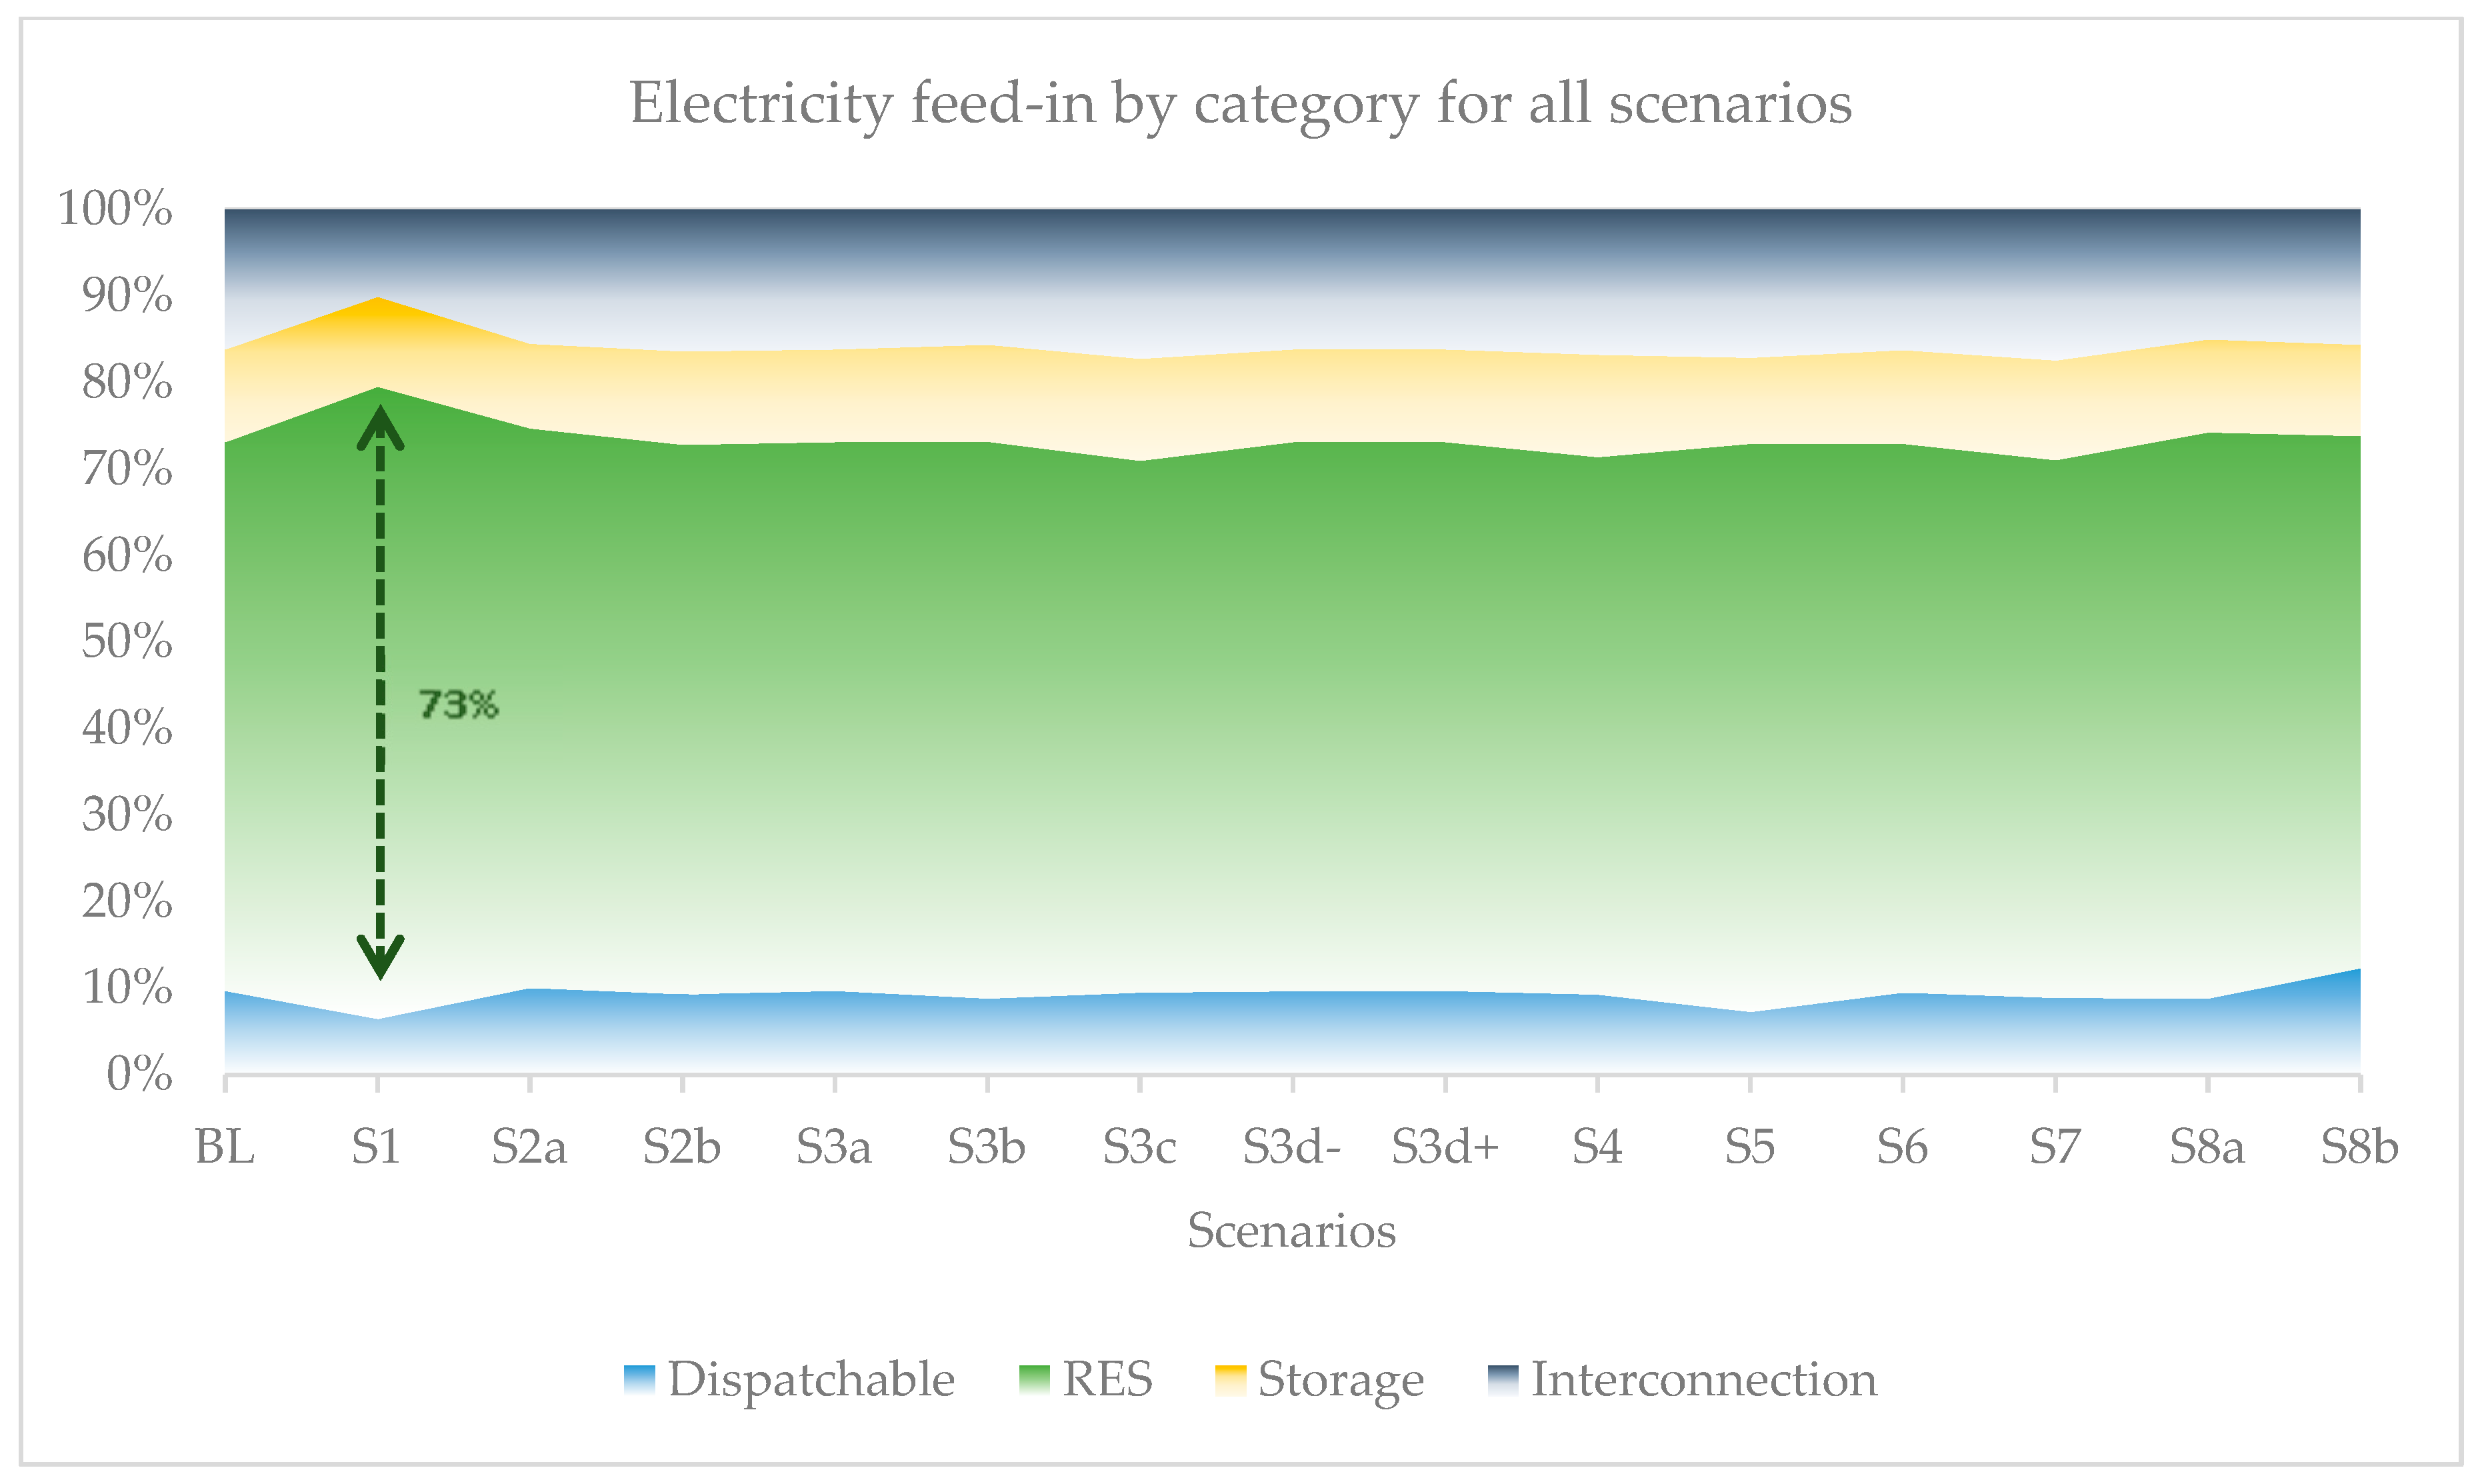
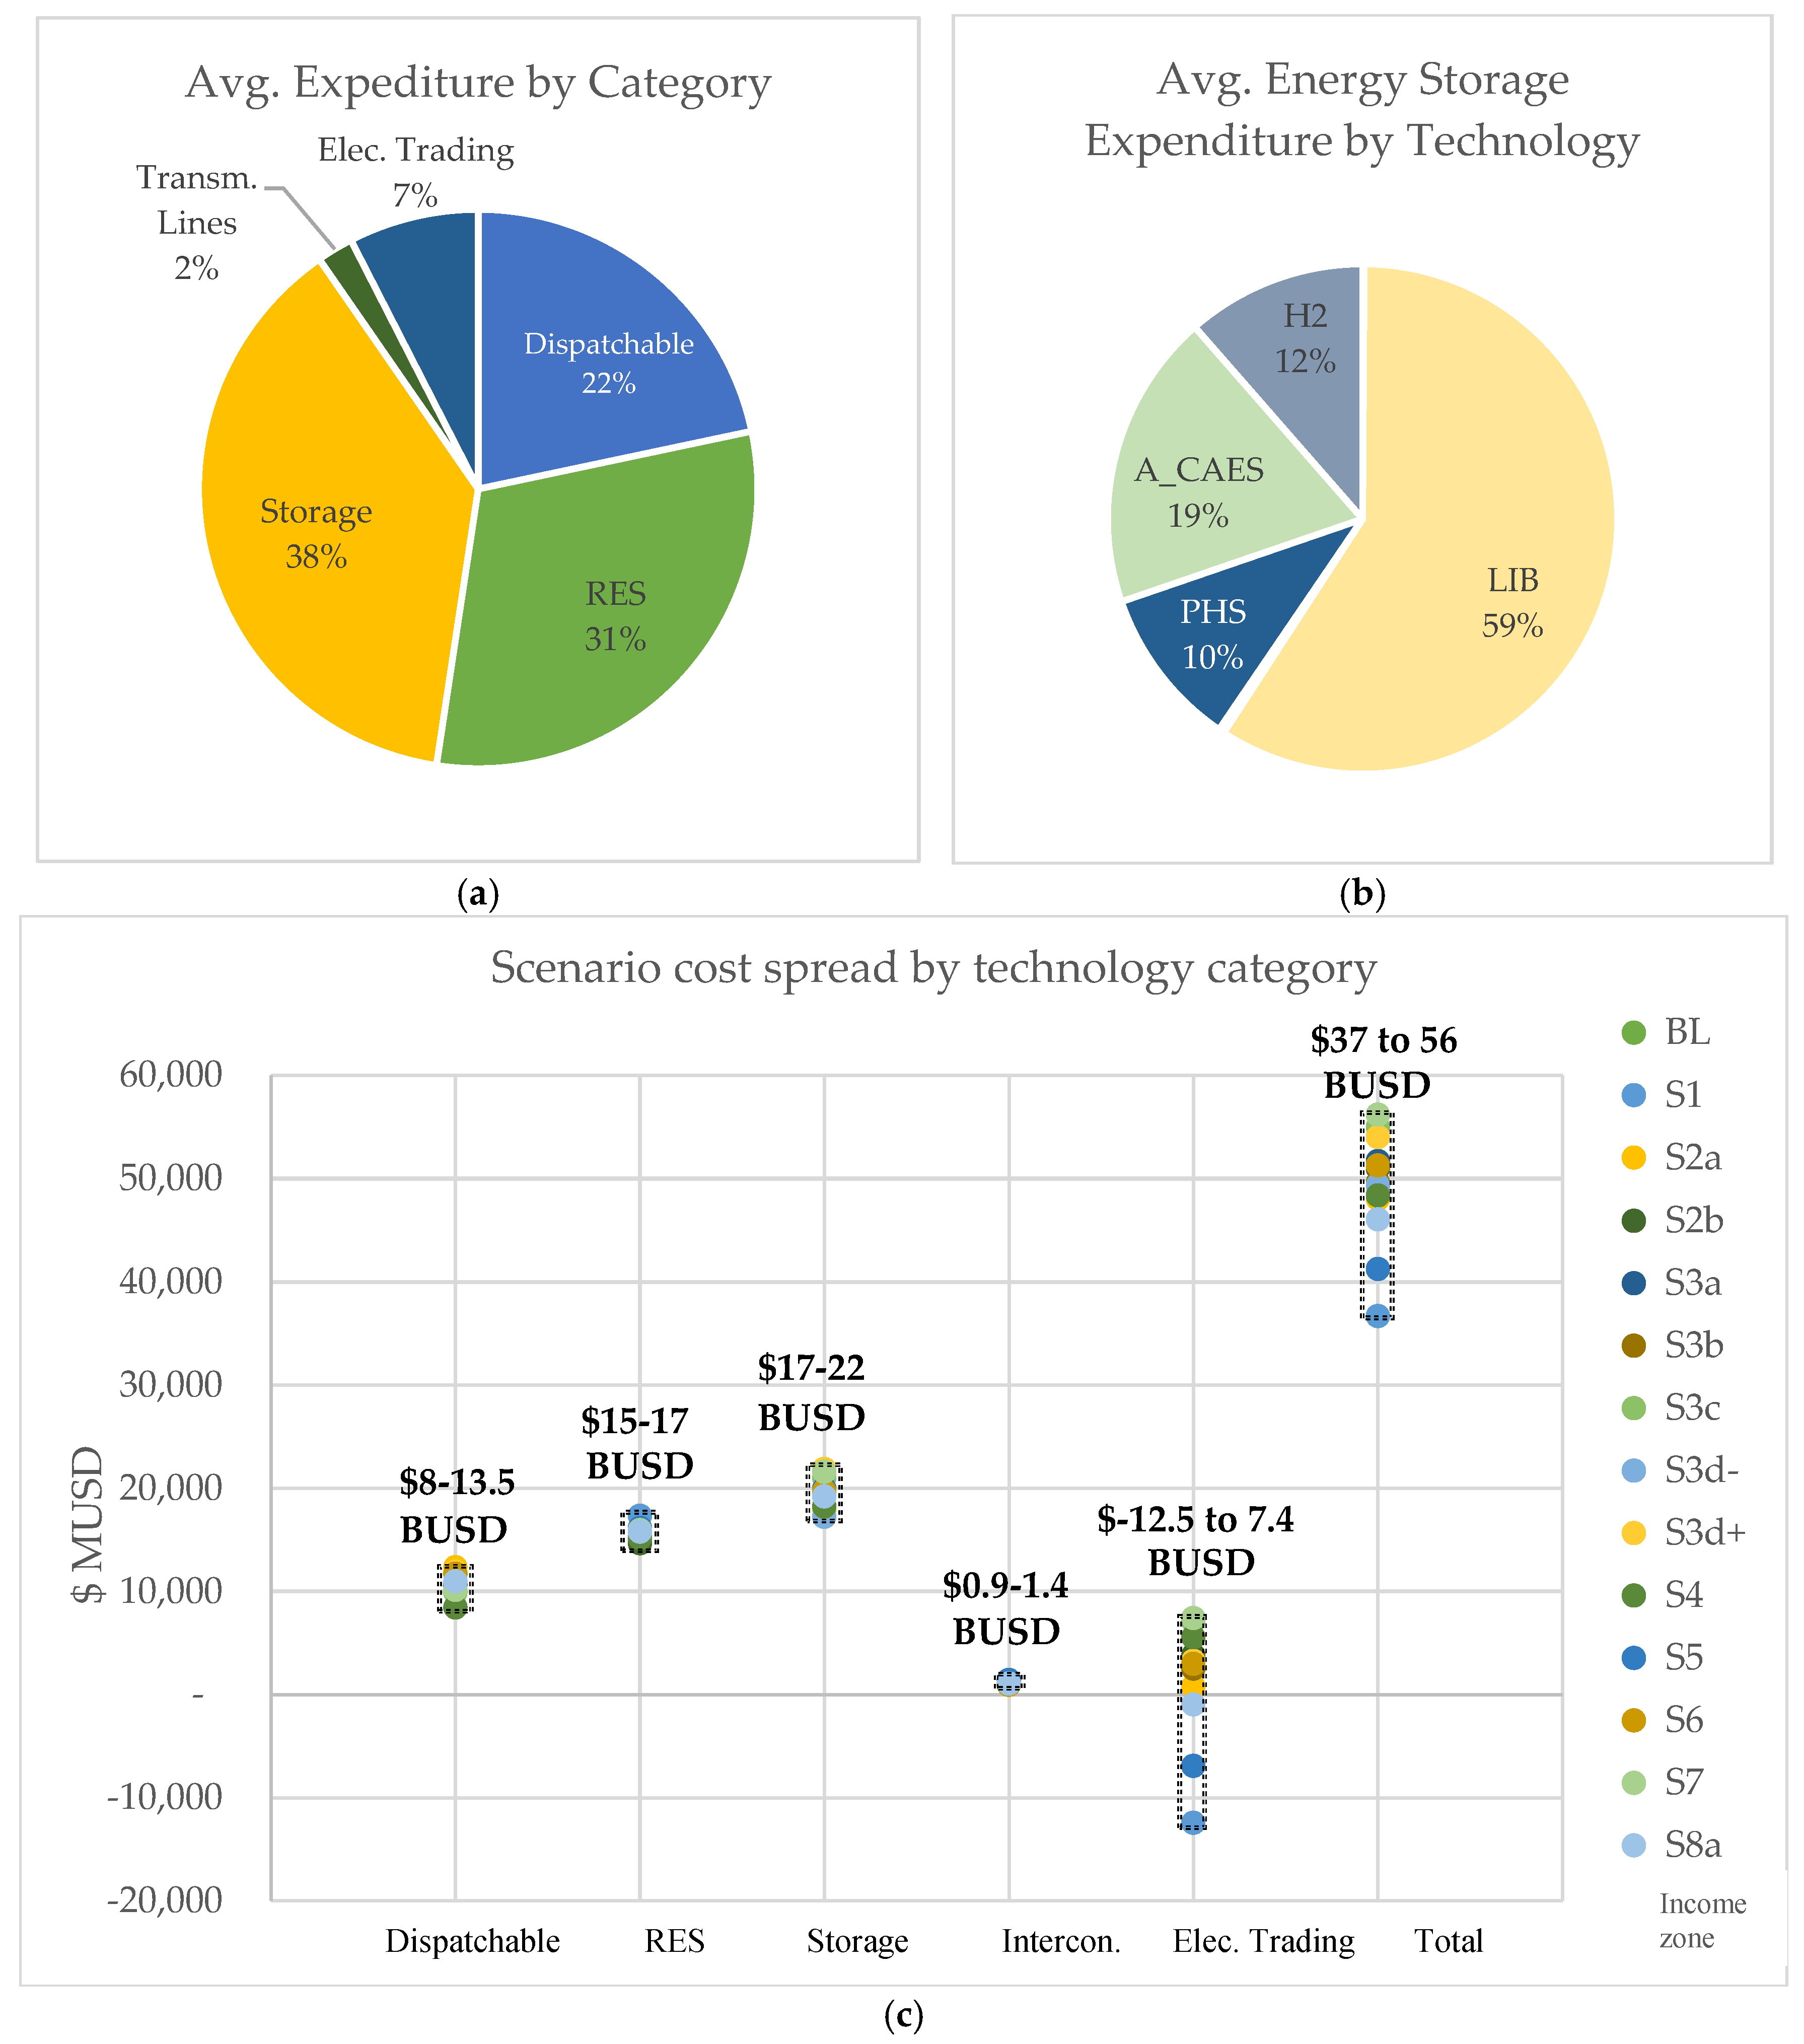
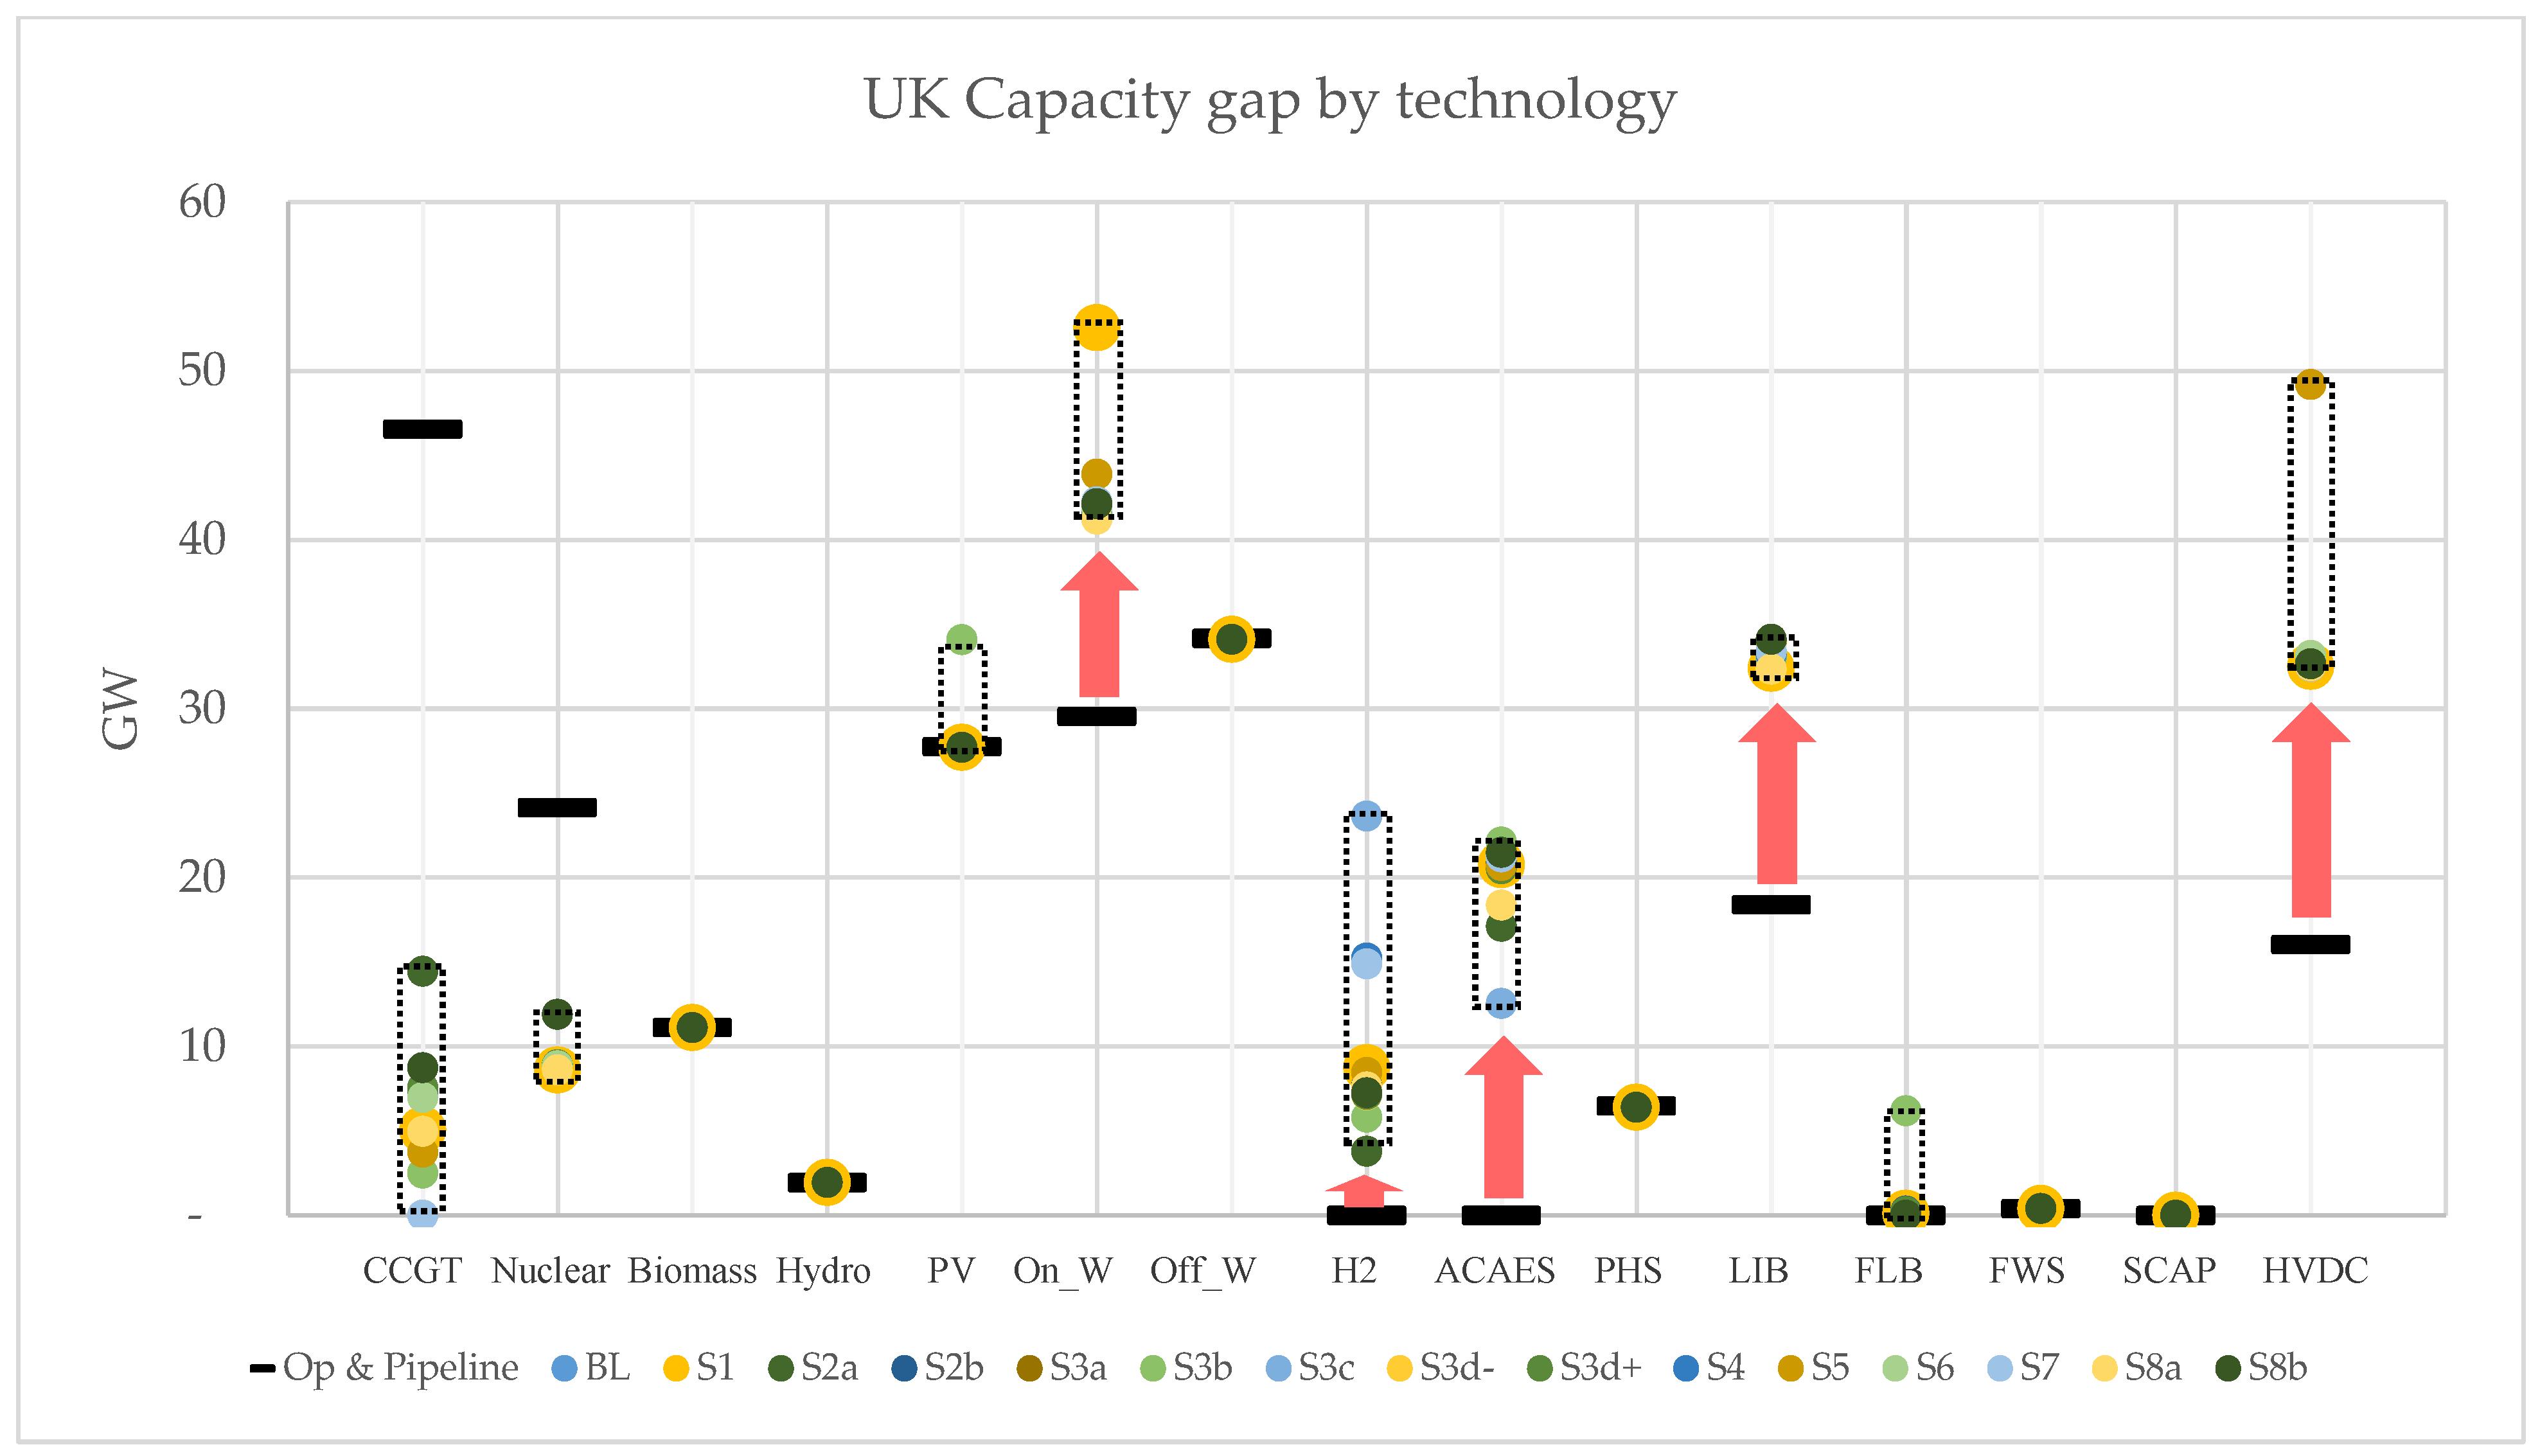
3.2. Sensitivity Analysis
4. Discussion
4.1. Results Analysis
4.2. Uncertainties and Limitations
4.3. Project Contribution
5. Conclusions
Author Contributions
Funding
Data Availability Statement
Conflicts of Interest
Appendix A

| Technology | Fuel Type | Fuel Efficiency [%] | Input Fuel [GWh] | Fuel Cost [MMUSD/GWh] | Fuel Limit [TWh] |
|---|---|---|---|---|---|
| CCGT with CCS [64] | NG | 47 [64] | 2.13 | 0.0382 [65] | No limit |
| Nuclear [66] | U235 | 35 [67] | 2.85 | 0.0046 [68] | No limit |
| Biomass [64] | Wood | 29 [64] | 3.45 | 0.0308 [69] | 170 [70] |
| Wind Data | Turbine Diameter [m] | Hub Height (Z) [m] | Rated Power [MW] | Cut-in Speed [m/s] | Cut-out Speed [m/s] | Air Density [kg/m3] |
|---|---|---|---|---|---|---|
| Onshore | 150 [71,72] | 165 | 6 [71,72] | 3 [72] | 25 [72] | 1.225 |
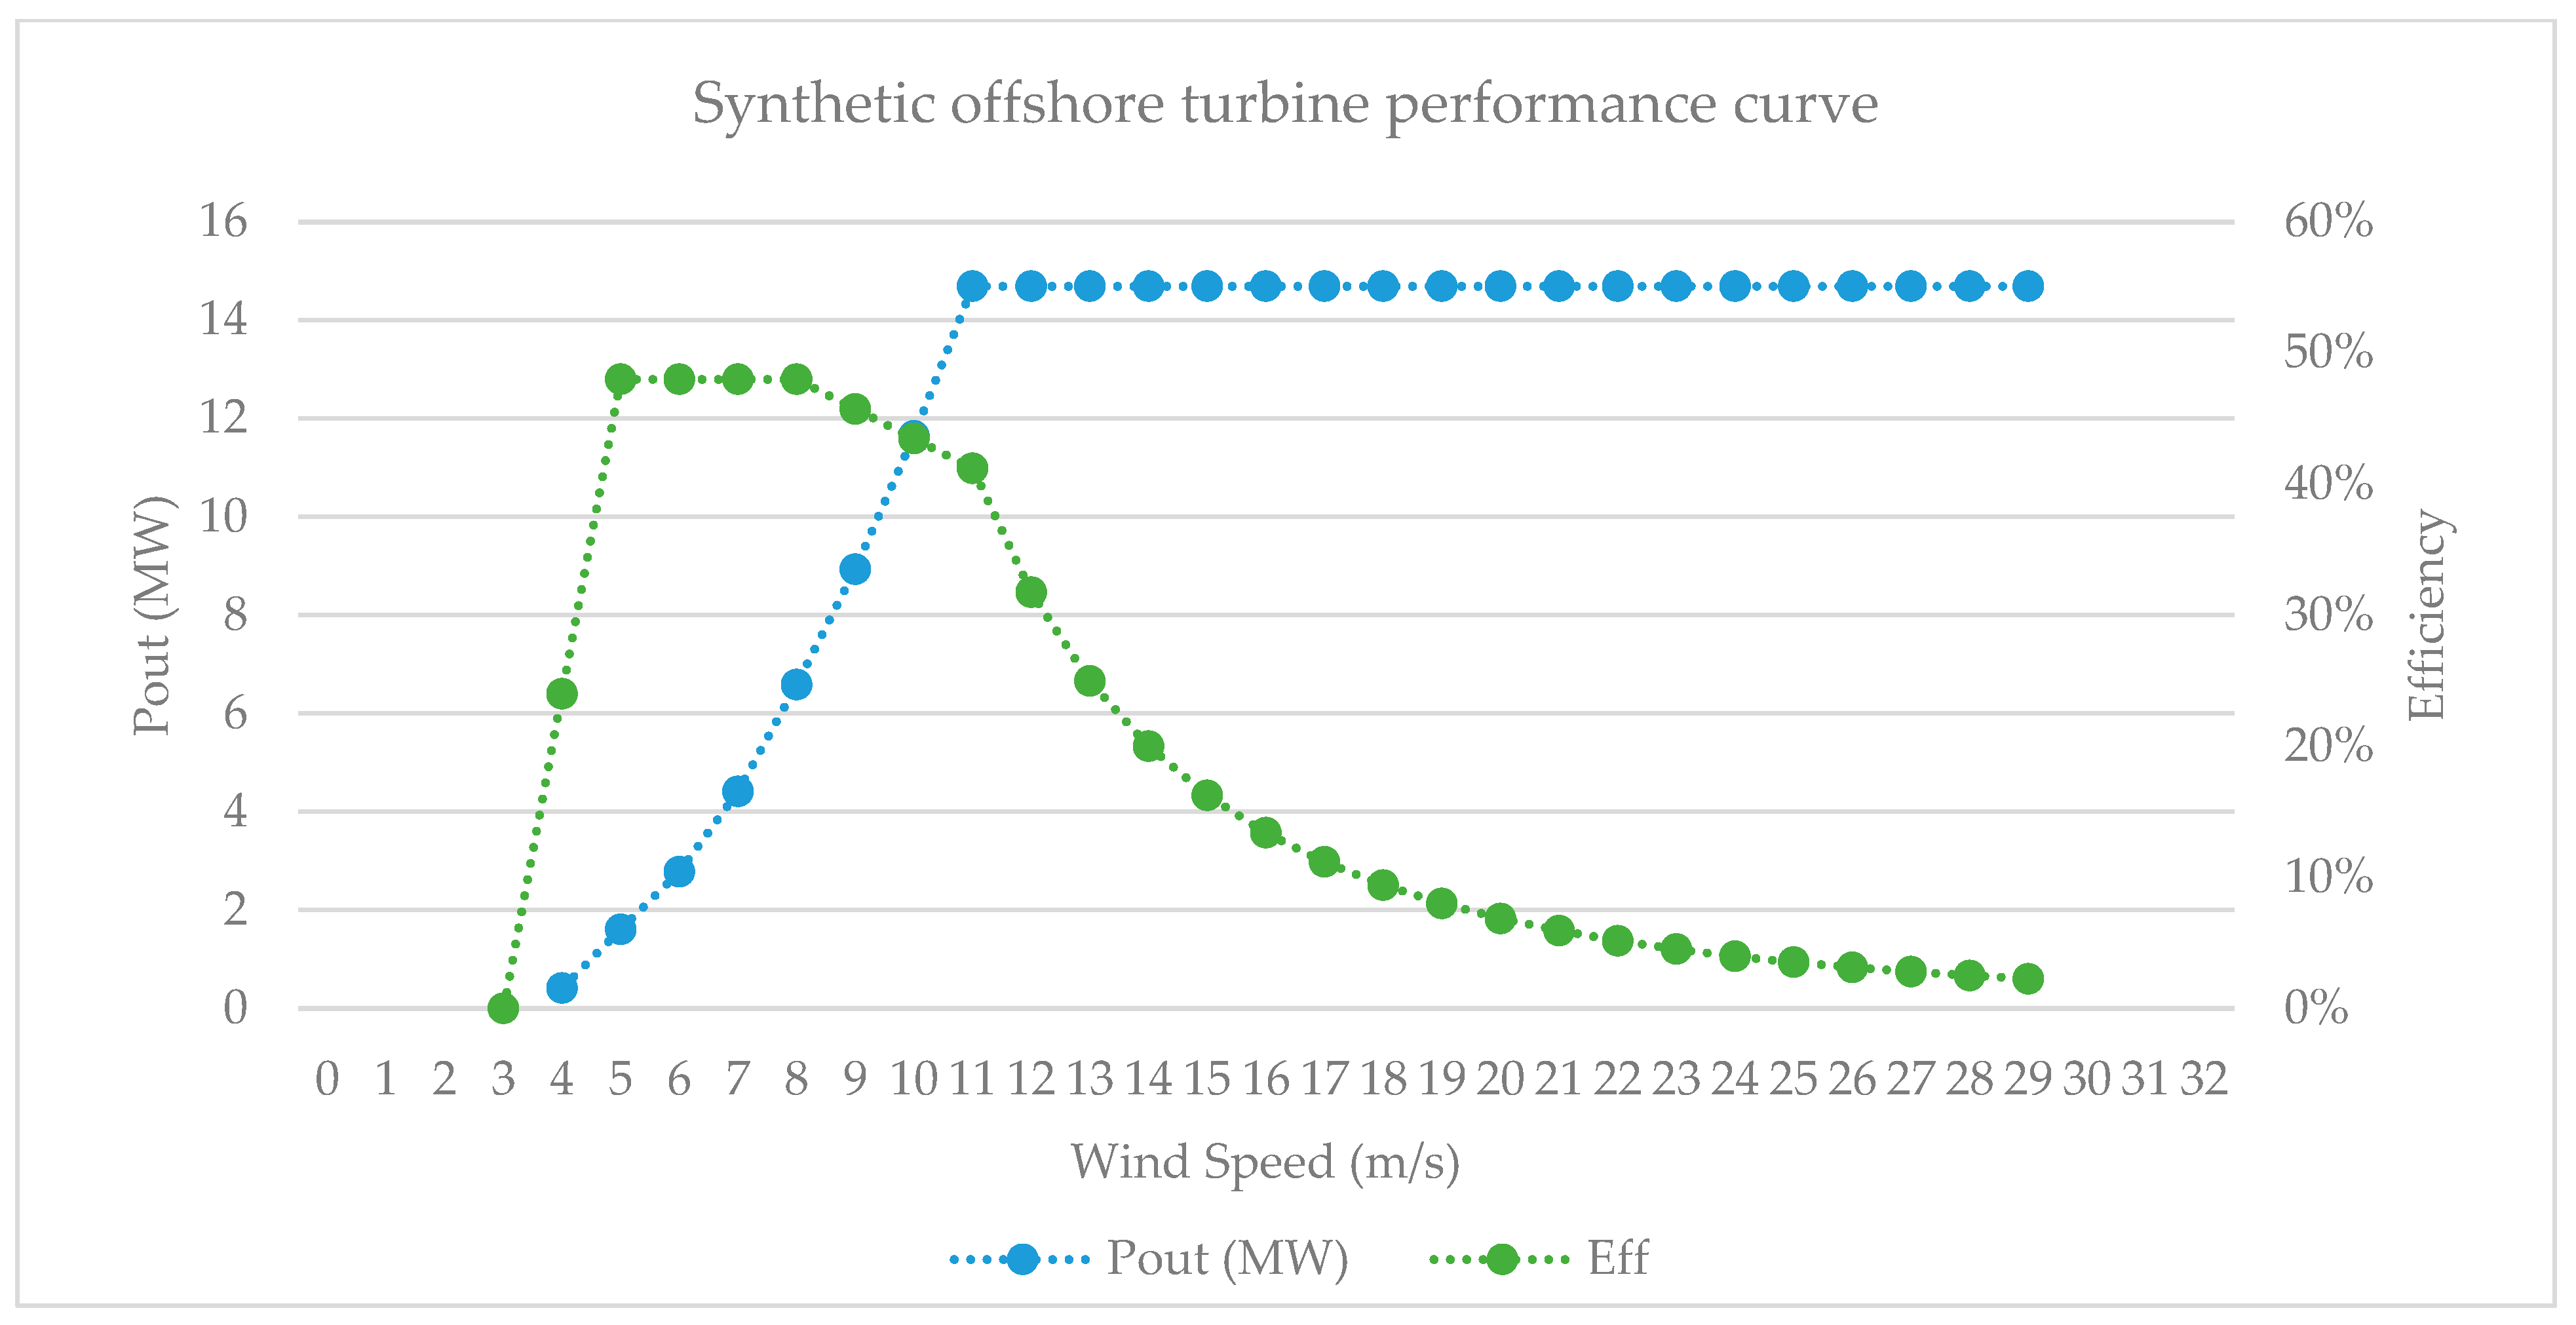
| Offshore | 236 [73,74] | 260 | 14.7 [73,74] | 3 [74] | 30 [74] |

| Technology | Operating Lifetime [Yrs] | Amortization Time [Yrs] | CAPEX [MUSD/GW] | OPEX [MUSD/GW/Yr] | Financing Rate % |
|---|---|---|---|---|---|
| CCGTs with CCS [64] | 25 | 25 | 1715 | 37.1 | 7.3 |
| Nuclear [66] | 60 | 30 | 3600 | 77 | 7 |
| PV [64] | 35 | 25 | 458 | 11.7 | 5 |
| Wind_Onsh [64] | 25 | 25 | 1336 | 39.5 | 5.2 |
| Wind_Off [64] | 30 | 30 | 1611 | 123.2 | 6.3 |
| Hydro [66] | 80 | 40 | 4269 | 63 | 5.4 |
| Biomass [64] | 25 | 25 | 4086 | 125.7 | 7.9 |
| Storage Type | Application | Response Time | Lifetime [Yrs] | Round-Trip Eff. [%] | Power/Unit | Energy Storage/Unit |
|---|---|---|---|---|---|---|
| SCap [75] | Frequency Control | 0.016 s | 16 | 92 | 3 MW [76] | 17.2 KWh [76] |
| FWS [75] | 0.25 s | 20 | 86 | 250 KW [77] | 25 KWh [77] | |
| LIB [78] | Daily Load Shifting | 1–4 s | 10 | 88 | 100 MW [79] | 400 MWh ** [79] |
| FLB [78] | 1–4 s | 15 | 70 | 300 MW [75] | 1.2 GWh [75] | |
| PHS [78] | Seasonal Storage | 0.5–8 min | 40 | 80 | 400 MW [75] | 5.5 GWh [75] |
| ACAES [78] | 3–10 min | 25 | 68 [80] | 300 MW [75] | 5 GWh [75] | |
| H2-RSOFC * [77,81,82] | 0.5–10s | 30 [83] | 40 [82] | 35 MW [84] | 50 GWh [84] |
| Storage Type | Yr of Estimate | Converter CAPEX [MUSD/GW] | Storage CAPEX [MUSD/GWh] | Fixed OPEX [MUSD/GW/yr] | Variable OPEX [CAPEX %] | Financing Rate [%] |
|---|---|---|---|---|---|---|
| SCap [75] | 2025 | 835 | 66,640 | 1 | 1% | 10% |
| FWS [75] | 2014 | 376 | 3686 | 4.9 [77] | 1% | 10% |
| LIB [78] | 2030 | 71 | 252 | 0.71 [26] | 1% | 7% |
| FLB [78] | 2030 | 116 | 307 | 9.26 | 1% | 10% |
| PHS [78] | 2035 | 4531 | 0.011 | 35.9 | 1% | 5.4% |
| ACAES [78] | 2030 | 1089 | 80 [26] | 9.82 | 1% | 10% |
| H2-RSOFC * [77,81,82] | 2035 | 1750 | 0.21 [48] | 61.25 | 3.5% | 10% [83] |
| Component | Loss Coefficient (Per GWh of Electricity Flow) | Lifetime [Yrs] | CAPEX | OPEX | Financing Rate |
|---|---|---|---|---|---|
| AC/DC station | 14.5 MWh/h | 40 | 182 MUSD/station | 1.1 MUSD/Line-yr | 7% |
| Land transmission | 34 KWh/h km | 40 | 0.43 MUSD/Km | 3.5 KUSD/Km-yr | 7% |
| Sea transmission | 26 KWh/h-km | 40 | 2.9 MUSD/Km | 23.8 KUSD/Km-yr | 7% |
References
- GOV.UK. Net Zero Strategy: Build Back Greener; Department for Business, Energy & Industrial Strategy: London, UK, 2021. Available online: https://www.gov.uk/government/publications/net-zero-strategy (accessed on 16 October 2022).
- NGESO. Future Energy Scenarios. Available online: https://www.nationalgrideso.com/future-energy/future-energy-scenarios (accessed on 4 December 2022).
- Scholz, Y.; Gils, H.C.; Pietzcker, R.C. Application of a high-detail energy system model to derive power sector characteristics at high wind and solar shares. Energy Econ. 2017, 64, 568–582. [Google Scholar] [CrossRef]
- Kondziella, H.; Bruckner, T. Flexibility requirements of renewable energy based electricity systems—A review of research results and methodologies. Renew. Sustain. Energy Rev. 2016, 53, 10–22. [Google Scholar] [CrossRef]
- Cruz, M.R.M.; Fitiwi, D.Z.; Santos, S.F.; Catalão, J.P.S. A comprehensive survey of flexibility options for supporting the low-carbon energy future. Renew. Sustain. Energy Rev. 2018, 97, 338–353. [Google Scholar] [CrossRef]
- Lund, P.D.; Lindgren, J.; Mikkola, J.; Salpakari, J. Review of energy system flexibility measures to enable high levels of variable renewable electricity. Renew. Sustain. Energy Rev. 2015, 45, 785–807. [Google Scholar] [CrossRef]
- Fattahi, A.; Sijm, J.; Faaij, A. A systemic approach to analyze integrated energy system modeling tools: A review of national models. Renew. Sustain. Energy Rev. 2020, 133, 110195. [Google Scholar] [CrossRef]
- Buttler, A.; Spliethoff, H. Current status of water electrolysis for energy storage, grid balancing and sector coupling via power-to-gas and power-to-liquids: A review. Renew. Sustain. Energy Rev. 2018, 82, 2440–2454. [Google Scholar] [CrossRef]
- Böhm, H.; Moser, S.; Puschnigg, S.; Zauner, A. Power-to-hydrogen & district heating: Technology-based and infrastructure-oriented analysis of (future) sector coupling potentials. Int. J. Hydrogen Energy 2021, 46, 31938–31951. [Google Scholar] [CrossRef]
- Schweiger, G.; Rantzer, J.; Ericsson, K.; Lauenburg, P. The potential of power-to-heat in Swedish district heating systems. Energy 2017, 137, 661–669. [Google Scholar] [CrossRef]
- Sijm, J.; Koutstaal, P.; Özdemir, Ö.; van Hout, M. Energy Transition Implications for Demand and Supply of Power System Flexibility: A Case Study of the Netherlands within an EU Electricity Market and Trading Context; Springer International Publishing: New York, NY, USA, 2019; pp. 363–394. [Google Scholar] [CrossRef]
- Agrawal, R.; Kishore Singh, C.; Goyal, A. Economic Benefits of Implementing Demand Response in Congested Network of Deregulated Power Market; Springer: Singapore, 2021; Volume 721, pp. 395–403. [Google Scholar]
- Sprake, D.; Vagapov, Y.; Lupin, S.; Anuchin, A. Housing Estate Energy Storage Feasibility for a 2050 Scenario. In Proceedings of the 2017 Internet Technologies and Application, Wrexham, UK, 12–15 September 2017; IEEE: Piscataway, NJ, USA, 2017; pp. 137–142. [Google Scholar] [CrossRef]
- Bistline, J. Variability in Deeply Decarbonized Electricity Systems. Environ. Sci. Technol. 2021, 55, 5629–5635. [Google Scholar] [CrossRef]
- Després, J.; Mima, S.; Kitous, A.; Criqui, P.; Hadjsaid, N.; Noirot, I. Storage as a flexibility option in power systems with high shares of variable renewable energy sources: A POLES-based analysis. Energy Econ. 2017, 64, 638–650. [Google Scholar] [CrossRef]
- Anastasovski, A.; Andreucci, M.B.; Kádár, J.; Delli Paoli, M. Energy Storage in Urban Areas: The Role of Energy Storage Facilities, a Review. Energies 2024, 17, 1117. [Google Scholar] [CrossRef]
- NREL. Electrification & Decarbonization: Exploring US Energy Use and Greenhouse Gas Emissions in Scenarios with Widespread Electrification and Power Sector Decarbonization; National Renewable Energy Laboratory: Applewood, Colorado, 2017. Available online: https://www.nrel.gov/docs/fy17osti/68214.pdf (accessed on 10 April 2022).
- IEA. Net Zero by 2050, A Roadmap for the Global Energy Sector—4th Revision; International Energy Association: Paris, France, 2021; Volume 2022, Available online: https://iea.blob.core.windows.net/assets/deebef5d-0c34-4539-9d0c-10b13d840027/NetZeroby2050-ARoadmapfortheGlobalEnergySector_CORR.pdf (accessed on 25 May 2022).
- Heilmann, C.; Friedl, G. Factors influencing the economic success of grid-to-vehicle and vehicle-to-grid applications—A review and meta-analysis. Renew. Sustain. Energy Rev. 2021, 145, 111115. [Google Scholar] [CrossRef]
- Bistline, J.; Blanford, G.; Mai, T.; Merrick, J. Modeling variable renewable energy and storage in the power sector. Energy Policy 2021, 156, 112424. [Google Scholar] [CrossRef]
- Gils, H.C.; Scholz, Y.; Pregger, T.; Luca de Tena, D.; Heide, D. Integrated modelling of variable renewable energy-based power supply in Europe. Energy 2017, 123, 173–188. [Google Scholar] [CrossRef]
- Sánchez Diéguez, M.; Fattahi, A.; Sijm, J.; Morales España, G.; Faaij, A. Modelling of decarbonisation transition in national integrated energy system with hourly operational resolution. Adv. Appl. Energy 2021, 3, 100043. [Google Scholar] [CrossRef]
- Després, J.; Hadjsaid, N.; Criqui, P.; Noirot, I. Modelling the impacts of variable renewable sources on the power sector: Reconsidering the typology of energy modelling tools. Energy 2015, 80, 486–495. [Google Scholar] [CrossRef]
- Gils, H.C.; Pregger, T.; Flachsbarth, F.; Jentsch, M.; Dierstein, C. Comparison of spatially and temporally resolved energy system models with a focus on Germany’s future power supply. Appl. Energy 2019, 255, 113889. [Google Scholar] [CrossRef]
- Gils, H.C.; Gardian, H.; Schmugge, J. Interaction of hydrogen infrastructures with other sector coupling options towards a zero-emission energy system in Germany. Renew. Energy 2021, 180, 140–156. [Google Scholar] [CrossRef]
- Moser, M.; Gils, H.-C.; Pivaro, G. A sensitivity analysis on large-scale electrical energy storage requirements in Europe under consideration of innovative storage technologies. J. Clean. Prod. 2020, 269, 122261. [Google Scholar] [CrossRef]
- Hoody, P.; Chiasson, A.; Brecha, R.J. The Transition to a Renewable Energy Electric Grid in the Caribbean Island Nation of Antigua and Barbuda. Energies 2023, 16, 6206. [Google Scholar] [CrossRef]
- Xiao, M.; Wetzel, M.; Pregger, T.; Simon, S.; Scholz, Y. Modeling the Supply of Renewable Electricity to Metropolitan Regions in China. Energies 2020, 13, 3042. [Google Scholar] [CrossRef]
- DLR. Energy System Model REMix; Deutsches Zentrum für Luft und Raumfahrt: Cologne (Köln), Germany, 2023. Available online: https://www.dlr.de/en/ve/research-and-transfer/research-infrastructure/modelling-tools/remix (accessed on 26 February 2025).
- System, G.-G.A.M. System Overview. Available online: https://www.gams.com/products/gams/gams-language/ (accessed on 4 March 2025).
- IBM. IBM ILOG CPLEX Optimizer. Available online: https://www.ibm.com/products/ilog-cplex-optimization-studio (accessed on 26 February 2025).
- Connolly, D.; Hansen, K.; Drysdale, D.; Lund, H.; Mathiesen, B.V.; Werner, S.; Persson, U.; Möller, B.; Wilke, O.G.; Bettgenhäuser, K.; et al. Heat Roadmap Europe 3 and STRATEGO WP2 Main Report—Enhanced Heating and Cooling Plans to Quantify the Impact of Increased Energy Efficiency in EU Member States: Translating the Heat Roadmap Europe Methodology to Member State Level. 2015. Available online: https://heatroadmap.eu/wp-content/uploads/2018/11/STRATEGO-WP2-Country-Report-Croatia.pdf (accessed on 12 September 2022).
- ONS. England Population Mid-Year Estimate; Office for National Statistics: London, UK, 2022. Available online: https://www.ons.gov.uk/peoplepopulationandcommunity/populationandmigration/populationestimates/timeseries/enpop/pop (accessed on 18 September 2022).
- ONS. Wales Population Mid-Year Estimate; Office for National Statistics: London, UK, 2022. Available online: https://www.ons.gov.uk/peoplepopulationandcommunity/populationandmigration/populationestimates/timeseries/wapop/pop (accessed on 18 September 2022).
- ONS. Scotland Population Mid-Year Estimate; Office for National Statistics: London, UK, 2022. Available online: https://www.ons.gov.uk/peoplepopulationandcommunity/populationandmigration/populationestimates/timeseries/scpop/pop (accessed on 19 September 2022).
- ONS. Northern Island Population Mid-Year Estimate; Office for National Statistics: London, UK, 2022. Available online: https://www.ons.gov.uk/peoplepopulationandcommunity/populationandmigration/populationestimates/timeseries/nipop/pop (accessed on 18 September 2022).
- GOV.UK. National Statistics, Energy Trends: UK Electricity; Department for Business, Energy & Industrial Strategy: London, UK, 2022. Available online: https://www.gov.uk/government/statistics/electricity-section-5-energy-trends (accessed on 15 September 2022).
- GOV.UK. Total Final Energy Consumption at Regional and Local Authority Level: 2005 to 2019; Department for Business, Energy & Industrial Strategy: London, UK, 2021. Available online: https://www.gov.uk/government/statistics/total-final-energy-consumption-at-regional-and-local-authority-level-2005-to-2019 (accessed on 15 September 2022).
- PVGIS. Photovoltaic Geographical Information System; European Commission, EU Science Hub: Brussels, Belgium, 2022. Available online: https://re.jrc.ec.europa.eu/pvg_tools/en/#HR (accessed on 8 June 2022).
- NEWA. New European Wind Atlas. Available online: https://map.neweuropeanwindatlas.eu/ (accessed on 12 June 2022).
- Shu, Z.R.; Jesson, M. Estimation of Weibull parameters for wind energy analysis across the UK. J. Renew. Sustain. Energy 2021, 13, 023303. [Google Scholar] [CrossRef]
- GOV.UK. Renewable Energy Planning Database: Quarterly Extract; Department for Business, Energy & Industrial Strategy: London, UK, 2022. Available online: https://www.gov.uk/government/publications/renewable-energy-planning-database-monthly-extract (accessed on 20 August 2022).
- IAEA. Power Reactor Information System (PRIS)—The Database on Nuclear Power Reactors; International Atomic Energy Agency: Vienna, Austria, 2022; Available online: https://pris.iaea.org/pris/ (accessed on 23 May 2023).
- Eurostat. Electricity Production Capacities by Main Fuel Groups and Operator. Available online: https://ec.europa.eu/eurostat/databrowser/view/NRG_INF_EPC__custom_3714481/default/table (accessed on 12 October 2022).
- Ireland, G.o. Section 18—Electricity Regulation Act, 1999. Available online: https://www.irishstatutebook.ie/eli/1999/act/23/section/18/enacted/en/html#sec18 (accessed on 10 May 2023).
- GOV.UK. Giving Local People the Final Say Over Onshore Wind Farms; Ministry of Housing, Communities & Local Government: London, UK, 2015. Available online: https://www.gov.uk/government/news/giving-local-people-the-final-say-over-onshore-wind-farms (accessed on 11 December 2022).
- exchangerates.org.uk. Currency Exchange Rates, Currency UK. Available online: https://www.exchangerates.org.uk/currency/currency-exchange-rates.html (accessed on 18 September 2022).
- Tarkowski, R. Underground hydrogen storage: Characteristics and prospects. Renew. Sustain. Energy Rev. 2019, 105, 86–94. [Google Scholar] [CrossRef]
- Evans, D.; Parkes, D.; Dooner, M.; Williamson, P.; Williams, J.; Busby, J.; He, W.; Wang, J.; Garvey, S. Salt cavern exergy storage capacity potential of uk massively bedded halites, using compressed air energy storage (Caes). Appl. Sci. 2021, 11, 4728. [Google Scholar] [CrossRef]
- HyUnder. Executive Summary—Assessment of the Potential, the Actors and Relevant Business Cases for Large Scale and Long Term Storage of Renewable Electricity by Hydrogen Underground Storage in Europe. 2014. Available online: https://hyunder.eu/wp-content/uploads/2016/01/D8.1_HyUnder-Executive-Summary.pdf (accessed on 31 May 2023).
- Mouli-Castillo, J.; Heinemann, N.; Edlmann, K. Corrigendum to ‘Mapping geological hydrogen storage capacity and regional heating demands: An applied UK case study’. [Appl. Energy 283 (2021) 116348]. Appl. Energy 2021, 288, 116609. [Google Scholar] [CrossRef]
- OFGEM. Interconnectors; Office of Gas and Electricity Markets: London, UK, 2022. Available online: https://www.ofgem.gov.uk/energy-policy-and-regulation/policy-and-regulatory-programmes/interconnectors (accessed on 7 November 2022).
- GOV.UK. Quarterly Energy Prices: March 2023. Available online: https://assets.publishing.service.gov.uk/government/uploads/system/uploads/attachment_data/file/1146323/quarterly-energy-prices-march-2023.pdf (accessed on 14 June 2023).
- BBC. Call for Onshore Wind Farm Planning Rules to be Changed; BBC News: London, UK, 2023; Available online: https://www.bbc.com/news/business-65312044 (accessed on 8 June 2023).
- TheGuardian. Sunak Set to End Ban on New Onshore Windfarms in Face of Tory Rebellion. Available online: https://www.theguardian.com/environment/2022/dec/06/sunak-set-end-ban-new-onshore-windfarms-england-tory-rebellion (accessed on 11 December 2022).
- Energy&Climate. Ban on Onshore Wind Could Cost £800 Million this Winter. Available online: https://eciu.net/media/press-releases/2022/ban-on-onshore-wind-could-cost-800-million-this-winter#:~:text=Taken%20together%2C%20the%20England%20ban%20and%20the%20UK-wide,wind%20capacity%20%28equivalent%20to%204.1million%20homes%E2%80%99%20winter%20power%29 (accessed on 11 December 2022).
- GOV.UK. Imports, Exports and Transfers of Electricity (ET 5.6—Quarterly). Available online: https://assets.publishing.service.gov.uk/media/6762b2fe3229e84d9bbde776/ET_5.6_DEC_24.xlsx (accessed on 11 December 2022).
- ESO. Sccotish Boundaries. Available online: https://www.nationalgrideso.com/research-publications/etys/electricity-transmission-network-requirements/scottish-boundaries (accessed on 7 November 2022).
- Scafidi, J.; Wilkinson, M.; Gilfillan, S.M.V.; Heinemann, N.; Haszeldine, R.S. A quantitative assessment of the hydrogen storage capacity of the UK continental shelf. Int. J. Hydrogen Energy 2021, 46, 8629–8639. [Google Scholar] [CrossRef]
- Hauch, A.; Küngas, R.; Blennow, P.; Hansen, A.B.; Hansen, J.B.; Mathiesen, B.V.; Mogensen, M.B. Recent advances in solid oxide cell technology for electrolysis. Science 2020, 370, eaba6118. [Google Scholar] [CrossRef]
- Mary, B. Solid-Oxide Breakthroughs Promise Cleaner Hydrogen Production. Chemical Engineering Online Magazine. Available online: https://www.chemengonline.com/solid-oxide-breakthroughs-promise-cleaner-hydrogen-production/#disqus-anchor (accessed on 9 March 2025).
- Bianchi, F.R.; Bosio, B. Operating Principles, Performance and Technology Readiness Level of Reversible Solid Oxide Cells. Sustainability 2021, 13, 4777. [Google Scholar] [CrossRef]
- Mogensen, M.B.; Chen, M.; Frandsen, H.L.; Graves, C.; Hansen, J.B.; Hansen, K.V.; Hauch, A.; Jacobsen, T.; Jensen, S.H.; Skafte, T.L.; et al. Reversible solid-oxide cells for clean and sustainable energy. Clean Energy 2019, 3, 175–201. [Google Scholar] [CrossRef]
- BEIS Electricity Generation Costs 2020. UK Department for Business Energy and Industrial Strategy. 2020. Available online: https://www.gov.uk/government/publications/beis-electricity-generation-costs-2020 (accessed on 9 March 2025).
- GOV.UK. Prices of Fuels Purchased by Major Power Producers; Department for Business, Energy & Industrial Strategy: London, UK, 2022. Available online: https://www.gov.uk/government/statistical-data-sets/prices-of-fuels-purchased-by-major-power-producers (accessed on 20 September 2022).
- IEA. Projected Costs of Generating Electricity, 2020 ed.; International Energy Agency: Paris, France; Nuclear Energy Agency: Boulogne-Billancourt, France, 2020. [Google Scholar]
- nuclearpower.com. Energy Conversion and Storage Efficiency. Available online: https://www.nuclear-power.com/energy-conversion-and-storage-efficiency/ (accessed on 20 September 2022).
- worldnuclear.org. Economics of Nuclear Power; World Nuclear Association: London, UK, 2022; Available online: https://world-nuclear.org/information-library/economic-aspects/economics-of-nuclear-power.aspx (accessed on 19 September 2022).
- IRENA. Renewable Power Generation Costs in 2021; International Renewable Energy Agency: Paris, France, 2022. [Google Scholar]
- REE. Biomass Feedstock Availability, Final Report. Ricardo Energy & Environment. Available online: https://assets.publishing.service.gov.uk/government/uploads/system/uploads/attachment_data/file/597387/Biomass_feedstock_availability_final_report_for_publication.pdf (accessed on 22 October 2022).
- Siemens_Gamesa. SG 6.6-155—Onshore Wind Turbine. Available online: https://www.siemensgamesa.com/en-int/products-and-services/onshore/wind-turbine-sg-5-8-155 (accessed on 1 July 2022).
- Vestas. V150 6.0MW. Available online: https://www.vestas.com/en/products/enventus-platform/v150-6-0 (accessed on 24 June 2022).
- Siemens_Gamesa. SG 14-222 DD—Offshore Wind Turbine. Available online: https://www.siemensgamesa.com/products-and-services/offshore/wind-turbine-sg-14-222-dd (accessed on 1 July 2022).
- Vestas. V236-15MW. Available online: https://www.vestas.com/en/products/offshore/V236-15MW/V236-15MW (accessed on 1 July 2022).
- ENERGY.GOV. Energy Storage Technology and Cost Characterization Report; Office of Energy Efficiency and Renewable Energy: Washington, DC, USA, 2019. Available online: https://www.energy.gov/eere/water/downloads/energy-storage-technology-and-cost-characterization-report (accessed on 20 October 2022).
- Agbedahunsi, A.T. Frequency Control for Microgrids Using Enhanced Statcom and Supercapacitor Energy Storage. 2013. Available online: https://core.ac.uk/download/pdf/33566165.pdf (accessed on 9 March 2025).
- Carlsson, J.; Perez Fortes, M.d.M.; Marco, G.d.; Giuntoli, J.; Jakubcionis, M.; Jäger-Waldau, A.; Lacal Arántegui, R.; Lazarou, S.; Magagna, D.; Moles, C.; et al. Energy Technology Reference Indicator (ETRI) Projections for 2010–2050; EUR 26950; Publications Office of the European Union: Luxembourg, 2014. [Google Scholar]
- ENERGY.GOV. 2020 Grid Energy Storage Technology Cost and Performance Assessment. Available online: https://www.energy.gov/energy-storage-grand-challenge/downloads/2020-grid-energy-storage-technology-cost-and-performance (accessed on 5 November 2022).
- NS_Energy. Moss Landing Battery Storage Project. Available online: https://www.nsenergybusiness.com/projects/moss-landing/ (accessed on 5 November 2022).
- Geissbühler, L.; Becattini, V.; Zanganeh, G.; Zavattoni, S.; Barbato, M.; Haselbacher, A.; Steinfeld, A. Pilot-scale demonstration of advanced adiabatic compressed air energy storage, Part 1: Plant description and tests with sensible thermal-energy storage. J. Energy Storage 2018, 17, 129–139. [Google Scholar] [CrossRef]
- Bizon, N. Fuel Cell Renewable Hybrid Power Systems; Multidisciplinary Digital Publishing Institute: Basel, Switzerland, 2021. [Google Scholar]
- Wei, M.; Levis, G.; Mayyas, A. Reversible Fuel Cell Cost Analysis; Lawrence Berkeley National Laboratory: US Department of Energy—Hydrogen and Fuel Cell Technologies Office: Berkeley, CA, USA, 2020. Available online: https://www.hydrogen.energy.gov/pdfs/review20/fc332_wei_2020_o.pdf (accessed on 30 May 2023).
- GOV.UK. Hydrogen Production Costs 2021; Department for Business, Energy & Industrial Strategy: London, UK, 2022. Available online: https://www.gov.uk/government/publications/hydrogen-production-costs-2021 (accessed on 28 October 2022).
- ESN. Mitsubishi Power Selects Emerson to Automate Utah Green Hydrogen Project; Energy Storage News: London, UK, 2022; Available online: https://www.energy-storage.news/mitsubishi-power-selects-emerson-to-automate-utah-green-hydrogen-project/ (accessed on 6 November 2022).


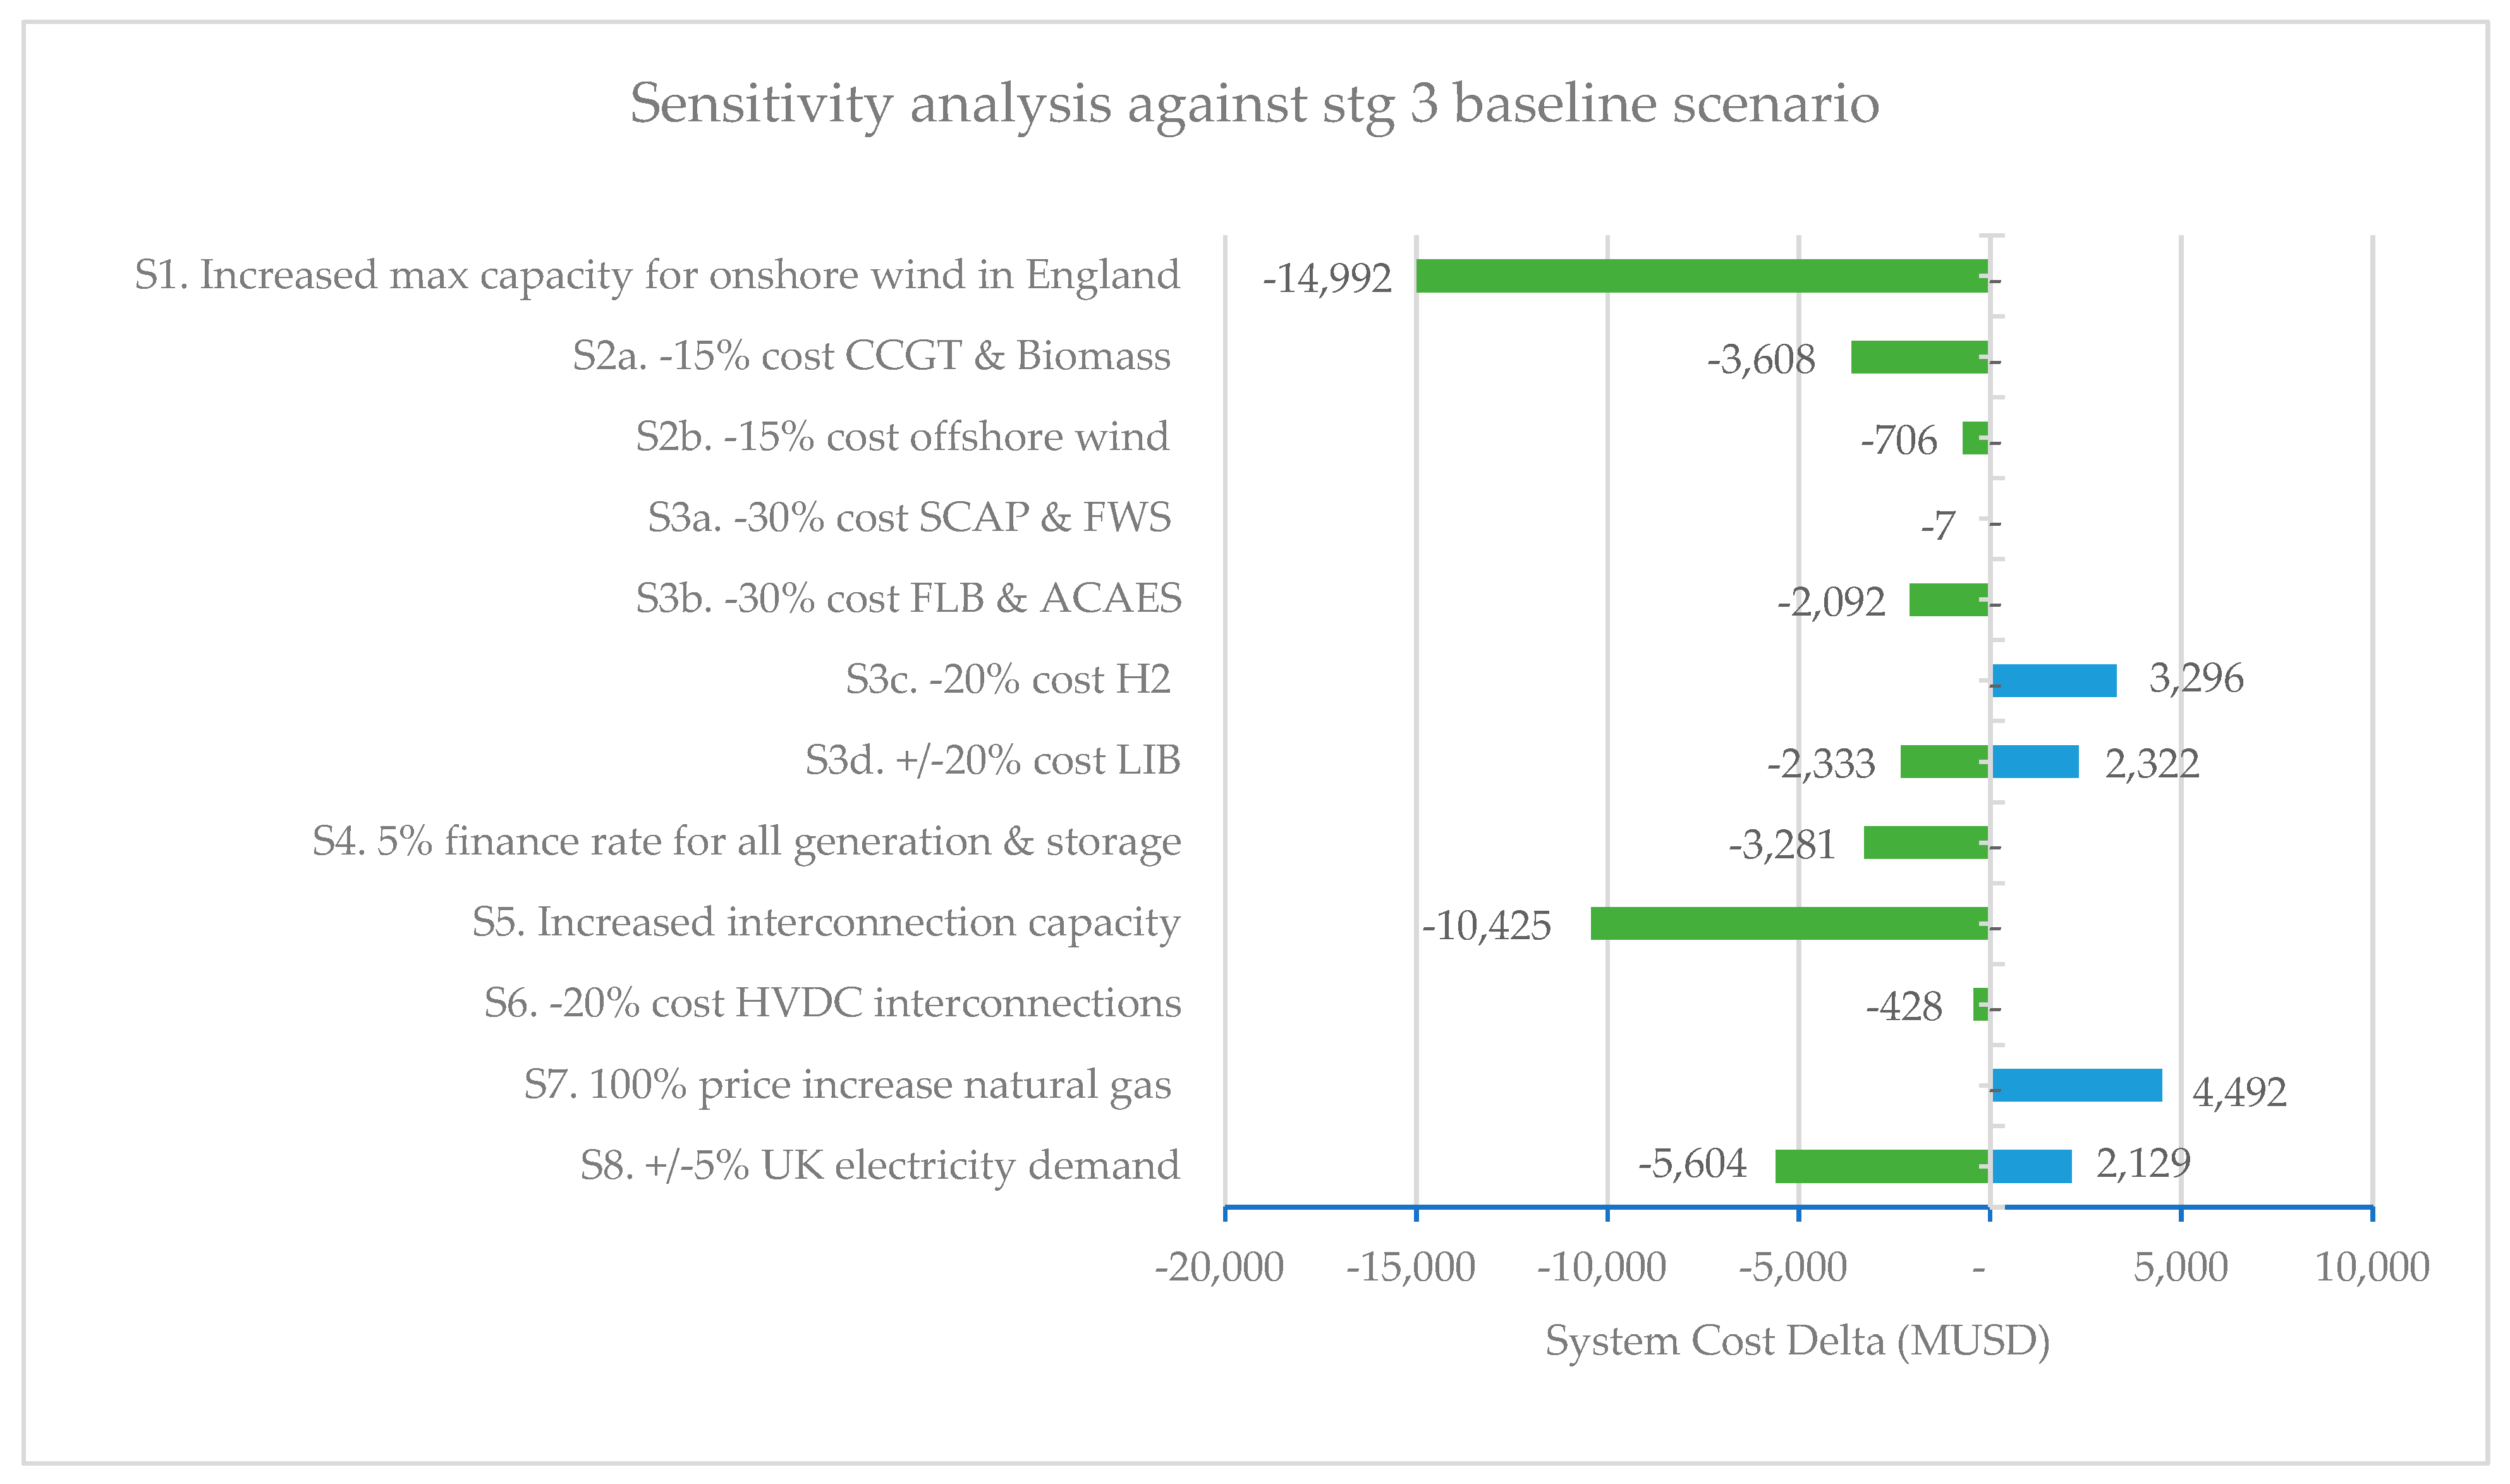

| Scenario | Type | Description |
|---|---|---|
| 1 | Capacity constraint | Increased maximum allowable onshore wind capacity in England and Wales due to relaxation of planning rules. |
| 2a | Generation Cost reduction | Reduced CAPEX and OPEX by 15% for following dispatchable generation technologies: CCGTs with CCUS, and biomass. |
| 2b | Reduced CAPEX and OPEX by 15% for offshore wind. | |
| 3a | Energy storage Cost reduction | Reduced CAPEX and OPEX by 30% for supercapacitors and flywheels. |
| 3b | Reduced CAPEX and OPEX by 30% for FLBs and ACAES. | |
| 3c | Reduced CAPEX and OPEX by 20% for H2. | |
| 3d | +/− 20% CAPEX and OPEX variation for LIBs. | |
| 4 | Lower finance rates | Homogenization of financing rate to 5% for all generation and storage technologies. |
| 5 | Capacity constraint | Increased maximum allowable capacity of interconnections. |
| 6 | Cost reduction—interconnections | Reduce interconnection cost by 20%. |
| 7 | Fuel price increase | Natural gas price increase by 100%. |
| 8 | Load variation | +/− 5% variation in electricity demand. |
Disclaimer/Publisher’s Note: The statements, opinions and data contained in all publications are solely those of the individual author(s) and contributor(s) and not of MDPI and/or the editor(s). MDPI and/or the editor(s) disclaim responsibility for any injury to people or property resulting from any ideas, methods, instructions or products referred to in the content. |
© 2025 by the authors. Licensee MDPI, Basel, Switzerland. This article is an open access article distributed under the terms and conditions of the Creative Commons Attribution (CC BY) license (https://creativecommons.org/licenses/by/4.0/).
Share and Cite
Jerez, L.E.C.; Nour, M. A Cost-Optimizing Analysis of Energy Storage Technologies and Transmission Lines for Decarbonizing the UK Power System by 2035. Energies 2025, 18, 1489. https://doi.org/10.3390/en18061489
Jerez LEC, Nour M. A Cost-Optimizing Analysis of Energy Storage Technologies and Transmission Lines for Decarbonizing the UK Power System by 2035. Energies. 2025; 18(6):1489. https://doi.org/10.3390/en18061489
Chicago/Turabian StyleJerez, Liliana E. Calderon, and Mutasim Nour. 2025. "A Cost-Optimizing Analysis of Energy Storage Technologies and Transmission Lines for Decarbonizing the UK Power System by 2035" Energies 18, no. 6: 1489. https://doi.org/10.3390/en18061489
APA StyleJerez, L. E. C., & Nour, M. (2025). A Cost-Optimizing Analysis of Energy Storage Technologies and Transmission Lines for Decarbonizing the UK Power System by 2035. Energies, 18(6), 1489. https://doi.org/10.3390/en18061489