1. Introduction
In the framework of smart city efforts, energy efficiency has become the cornerstone of sustainable urban development due to the world’s mounting environmental issues and unparalleled rates of urbanization. Complex patterns in energy consumption at the urban center level are the result of intricate interactions between building systems, energy infrastructure, and human behavior. These patterns necessitate sophisticated management techniques. Building energy consumption management and optimization is becoming increasingly important as urban populations continue to expand; by 2050, 68% of the world’s population is expected to reside in cities [
1,
2]. Buildings are essential to any comprehensive plan for sustainable urban development and climate change mitigation since they account for almost 40% of world energy consumption and 30% of greenhouse gas emissions [
3], making them central to any comprehensive strategy for sustainable urban development and climate change mitigation. Recent research has also emphasized the importance of strategic infrastructure planning in achieving sustainability goals, including innovative approaches for clean energy infrastructure deployment [
4].
The emergence of smart cities has created previously unheard-of possibilities for large-scale building energy data collection and analysis. Building management systems, smart meters, and Internet of Things (IoT) devices all work together to create enormous amounts of real-time data that may be used to optimize energy use [
5,
6,
7]. However, conventional forecasting techniques face considerable difficulties due to the intricacy and variability of these data. More advanced prediction techniques are required due to the dynamic nature of building energy consumption, which is influenced by a wide range of factors such as weather, occupancy patterns, architectural attributes, and operating schedules [
8].
In tackling these issues, recent developments in artificial intelligence, especially in the field of deep learning, have produced encouraging outcomes. From simple feed-forward networks to complex structures that may capture temporal dependencies, neural network architectures have advanced significantly in their ability to handle sequential input. This evolution includes seminal innovations like Time Delay Neural Networks (TDNN), which popularized the idea of temporal convolution, and several Recurrent Neural Network (RNN) implementations, which transformed sequence modeling. While Gated Recurrent Units (GRU) provided a more computationally efficient option with equivalent performance, long short-term memory (LSTM) networks represented a major breakthrough in addressing the vanishing gradient issue that plagued conventional RNNs [
9,
10,
11]. Although RNN variants like LSTM and GRU have proven effective for single-building energy forecasting, they still face inherent limitations when scaling to multi-building scenarios [
12,
13]. These recurrent architectures process data sequentially, making them computationally intensive for long sequences and limiting their ability to capture complex dependencies across multiple buildings simultaneously. Additionally, their sequential nature restricts parallel computation capabilities, resulting in longer training times for large-scale urban deployments. Transformer networks, originally developed for natural language processing tasks, address these limitations through their self-attention mechanism, which enables direct modeling of relationships between any elements in a sequence regardless of their distance [
14,
15]. This parallel processing capability makes transformers particularly well-suited for handling the complex interdependencies across multiple buildings, their diverse operational patterns, and varying environmental conditions that characterize urban energy systems.
Transformer networks’ distinct architecture, which is distinguished by its self-attention processes, signifies a paradigm shift in sequence modeling [
16,
17]. The model can simultaneously capture local and global dependencies thanks to the self-attention mechanism, which calculates attention weights for each element in the sequence by assessing its link with every other element. This is achieved through the computation of Query (Q), Key (K), and Value (V) matrices, where the attention weights are calculated as softmax (QK
T/√d)V, with d being the dimensionality of the key vectors [
18,
19]. Transformers can interpret temporal and spatial correlations inherent in building energy data with previously unheard-of effectiveness due to this mathematical foundation. This capability is further improved by the multi-head attention mechanism, which enables the model to focus on numerous input features at once, so generating multiple specialized attention channels that are capable of capturing diverse kinds of patterns and dependencies. Transformers can process all time steps at once, which makes parallel computation more effective and allows for a better capture of long-range relationships than RNNs and LSTM networks [
20]. In the context of multi-building energy prediction, where interactions between many buildings and their environmental settings must be taken into account, this skill is extremely beneficial.
Demand-side management and grid stability now depend more on the integration of building energy management systems (BEMS) with sophisticated predictive capabilities [
21]. Better load balancing, peak demand management, and the integration of renewable energy sources are made possible by the accurate forecasting of energy consumption patterns [
21,
22]. Nevertheless, the intricacy of multi-building scenarios, where the interaction between many buildings and their disparate usage patterns adds layers of complexity, is frequently beyond the capabilities of current prediction models.
Weather has a significant impact on how much energy buildings use, and there are intricate non-linear patterns in the relationship between weather and energy use. Building thermal dynamics are influenced by complex interactions between variables including cloud cover, wind speed, humidity, and solar radiation that go beyond straightforward temperature correlations. Comprehensive energy modeling must take into account the various heat transfer modes, which include radiation impacts from sun exposure, convection driven by wind patterns, and conduction via building envelopes [
23]. Thermal mass effects, in which the building’s structural components function as heat storage systems and produce time-lag responses to changes in the outside temperature, must be taken into consideration in advanced building energy models. Research suggests that external temperature variations can be responsible for as much as 40% of changes in energy consumption in commercial buildings [
24]. Accurate long-term forecasting requires that energy prediction models be able to integrate weather projections. Weather parameters are frequently treated as independent variables in traditional models, which misses their intricate relationships with operating patterns and building attributes [
25].
Another important component of building energy use is occupancy patterns. The importance of flexible prediction models that can take into consideration abrupt shifts in building usage patterns has been brought to light by the COVID-19 pandemic [
26]. Complex occupancy-related energy consumption patterns that differ by day of the week, time of day, and season are particularly evident in commercial buildings. Accurate modeling of these patterns is necessary for efficient energy optimization and management.
There are now more chances to deploy complex prediction models at scale thanks to the growth of edge computing and distributed intelligence in smart city infrastructure. In addition to lowering latency and bandwidth needs, edge devices’ real-time prediction and local data processing capabilities allow for more responsive energy management systems [
27,
28]. However, this distributed strategy necessitates prediction models that can handle local differences in building attributes and usage patterns while still being computationally efficient.
Building energy management becomes more difficult as renewable energy sources are integrated into urban power systems. Because renewable generation is stochastic, elaborate strategies are needed to manage this complexity. Grid stability and load balancing are made more difficult by the intermittent nature of wind and solar energy, especially in microgrids and district energy systems. The bidirectional power flows made possible by prosumer buildings—which have the capacity to both generate and consume energy—exacerbate these difficulties. Therefore, probabilistic forecasting techniques that can take into account the variability in renewable generation while preserving grid stability must be incorporated into the prediction framework [
29,
30].
From seasonal variations in generation capacity to short-term swings in solar irradiance, the technological execution of renewable energy integration necessitates the careful consideration of numerous timescales. To distinguish and manage these many temporal patterns, the prediction model needs to use advanced time-series decomposition techniques. Moreover, complex interdependencies are created by the geographical distribution of renewable energy supplies among various buildings, which calls for accurate modeling [
8]. Because the renewable energy supply is intermittent, more advanced prediction and management techniques are needed to guarantee grid stability and efficient energy use [
19]. Therefore, consumption patterns and possible local energy generation capability must be taken into consideration when building energy forecast models, especially in buildings that have solar panels or other renewable energy systems installed.
Convolutional neural networks (CNNs) for the extraction of spatial features and recurrent neural networks for the detection of temporal patterns are two examples of the deep learning architectures that have been investigated recently for building energy prediction [
31]. Despite their potential, these methods frequently fail to integrate many data sources and handle numerous time scales at once, which are characteristics of multi-building scenarios. With its capacity to handle numerous input streams and identify intricate dependencies, the transformer design presents a viable way around these restrictions.
In the setting of smart cities, where there may be hundreds to thousands of monitored buildings, prediction models’ scalability becomes very crucial. When scaled to many buildings, traditional methods sometimes encounter computational limits that result in either increased processing time or lower accuracy [
12]. Therefore, as cities expand and change, a successful prediction framework must strike a balance between computing efficiency and accuracy while preserving the capacity to add new structures and data sources.
By creating a unique transformer-based deep learning framework especially for predicting the energy consumption of several buildings, the current study tackles these issues. The framework seeks to achieve superior prediction accuracy while preserving computational efficiency and scalability by utilizing the potent attention mechanisms of transformer networks and integrating multiple data streams, such as weather parameters, occupancy patterns, and historical consumption data.
Despite recent advances in energy prediction techniques, existing models struggle with multi-building scenarios due to their limited ability to capture cross-building correlations, inadequate integration of diverse data streams, and poor scalability when deployed at urban scale—gaps this research specifically addresses. The framework developed in this study introduces several key innovations: (1) a hierarchical attention mechanism that processes building-specific and global features separately, enabling simultaneous modeling of individual building characteristics and cross-building dependencies; (2) multi-head attention layers optimized for capturing diverse temporal and spatial patterns in energy consumption; (3) adaptive regularization techniques and a novel building dropout mechanism that significantly enhance model robustness to data quality issues; and (4) a computationally efficient architecture that demonstrates near-linear scaling with building count, making city-scale deployment feasible. These innovations directly address the limitations identified in previous transformer-based approaches for urban energy prediction.
The following are the main goals of this study:
Develop a modified transformer architecture optimized for multi-building energy consumption prediction
Integrate diverse data sources including weather parameters and occupancy patterns through multi-head attention layers
Evaluate the framework’s performance across different building types and seasonal variations
Assess the scalability and computational efficiency of the proposed approach in real-world smart city scenarios
2. Materials and Methods
The study encompassed a comprehensive dataset from 100 commercial buildings strategically selected across three distinct climate zones: subtropical humid, temperate continental, and Mediterranean. The buildings represented diverse typologies including office complexes (40%), retail spaces (30%), educational facilities (20%), and healthcare buildings (10%), with floor areas ranging from 5000 to 50,000 square meters. Data collection spanned three years (2020–2023), capturing the full spectrum of seasonal variations and operational patterns, including the unique energy consumption dynamics during the COVID-19 pandemic period. Measurements were recorded at 15 min intervals, providing high-resolution temporal data that enabled the detailed analysis of both rapid fluctuations and long-term trends. The dataset incorporated multiple synchronized input streams, including energy consumption measurements, granular weather parameters, occupancy patterns, and building operational states, resulting in over 105,120 temporal data points per building.
Prior to model training, comprehensive data preprocessing techniques were applied to ensure data quality. Energy consumption measurements underwent outlier detection using the modified Z-score method with a threshold of 3.5, identifying and replacing anomalous values with interpolated estimates. Time-series data were standardized using per-building min–max scaling to normalize values between 0 and 1, maintaining relative patterns while equalizing scale differences across buildings. Missing data points (approximately 2.3% of the dataset) were addressed using forward-fill for short gaps (<3 h) and pattern-based interpolation for longer intervals, leveraging similar historical periods. Weather parameters were separately normalized using standard scaling (zero mean, unit variance) based on climate zone statistics. Occupancy data were preprocessed to correct sensor drift and calibrated against maximum capacity values for each building zone.
The energy consumption monitoring infrastructure consisted of a hierarchical network of smart meters and sub-meters deployed throughout each building. The primary meters, installed at the main electrical inputs, provided measurements of active and reactive power consumption in kilowatt-hours (kWh) and kilovolt-ampere reactive hours (kVARh), respectively. Sub-metering systems were installed to monitor major building subsystems including HVAC (40–60% of total consumption), lighting (15–25%), plug loads (10–20%), and specialized equipment. Each meter was equipped with power quality monitoring capabilities, recording voltage variations, current harmonics, and power factor at one-minute intervals to capture transient events and power quality issues that might affect energy consumption patterns.
Comprehensive weather data were obtained through a combination of on-site weather stations and local meteorological networks, ensuring redundancy and data reliability. The weather monitoring system captured standard parameters including dry-bulb temperature (°C), relative humidity (%), solar radiation (W/m2), wind speed and direction (m/s), atmospheric pressure (hPa), precipitation (mm), and cloud cover (%). Additionally, derived parameters such as wet-bulb temperature, dew point, and solar position were calculated to provide a complete picture of environmental conditions affecting building energy consumption. Weather stations were strategically positioned to account for microclimate effects, with particular attention to urban heat island impacts in densely built areas.
The occupancy monitoring system integrated multiple data sources to provide accurate real-time occupancy estimates. Primary occupancy data were derived from building management systems using a network of CO2 sensors (one sensor per 50 m2 in occupied spaces), passive infrared motion detectors, and access control systems. This was supplemented with data from Wi-Fi access point connections, elevator usage patterns, and parking facility occupancy. The system employed a fusion algorithm that combined these various inputs to generate reliable occupancy estimates even in challenging scenarios such as partial sensor failures or unusual occupancy patterns. Occupancy data were normalized and reported as both absolute counts and percentage of maximum capacity for each building zone.
For each building , the input features at time step are represented as a vector , where represents the feature dimensionality. The feature vector encompasses energy consumption history, weather parameters, and occupancy information. The prediction target for each building is defined as the energy consumption for the next time steps, represented as .
The transformer architecture implemented in this study builds upon the standard encoder-decoder structure with several modifications optimized for multi-building energy prediction.
Figure 1 illustrates the overall architecture of the proposed transformer model for multi-building energy prediction. The model consists of an input layer processing multiple data streams, an encoder stack with modified attention mechanisms, a hierarchical attention layer, and an output prediction layer.
The encoder processes the input sequence through multiple layers of self-attention and feed-forward networks. The attention mechanism is defined by the following equations [
19]:
where
represents the input sequence, and
,
, and
are learnable weight matrices. The self-attention output is computed as [
32]:
where
is the dimension of the key vectors. The multi-head attention mechanism employs multiple attention heads operating in parallel [
33,
34]:
where each head is computed as:
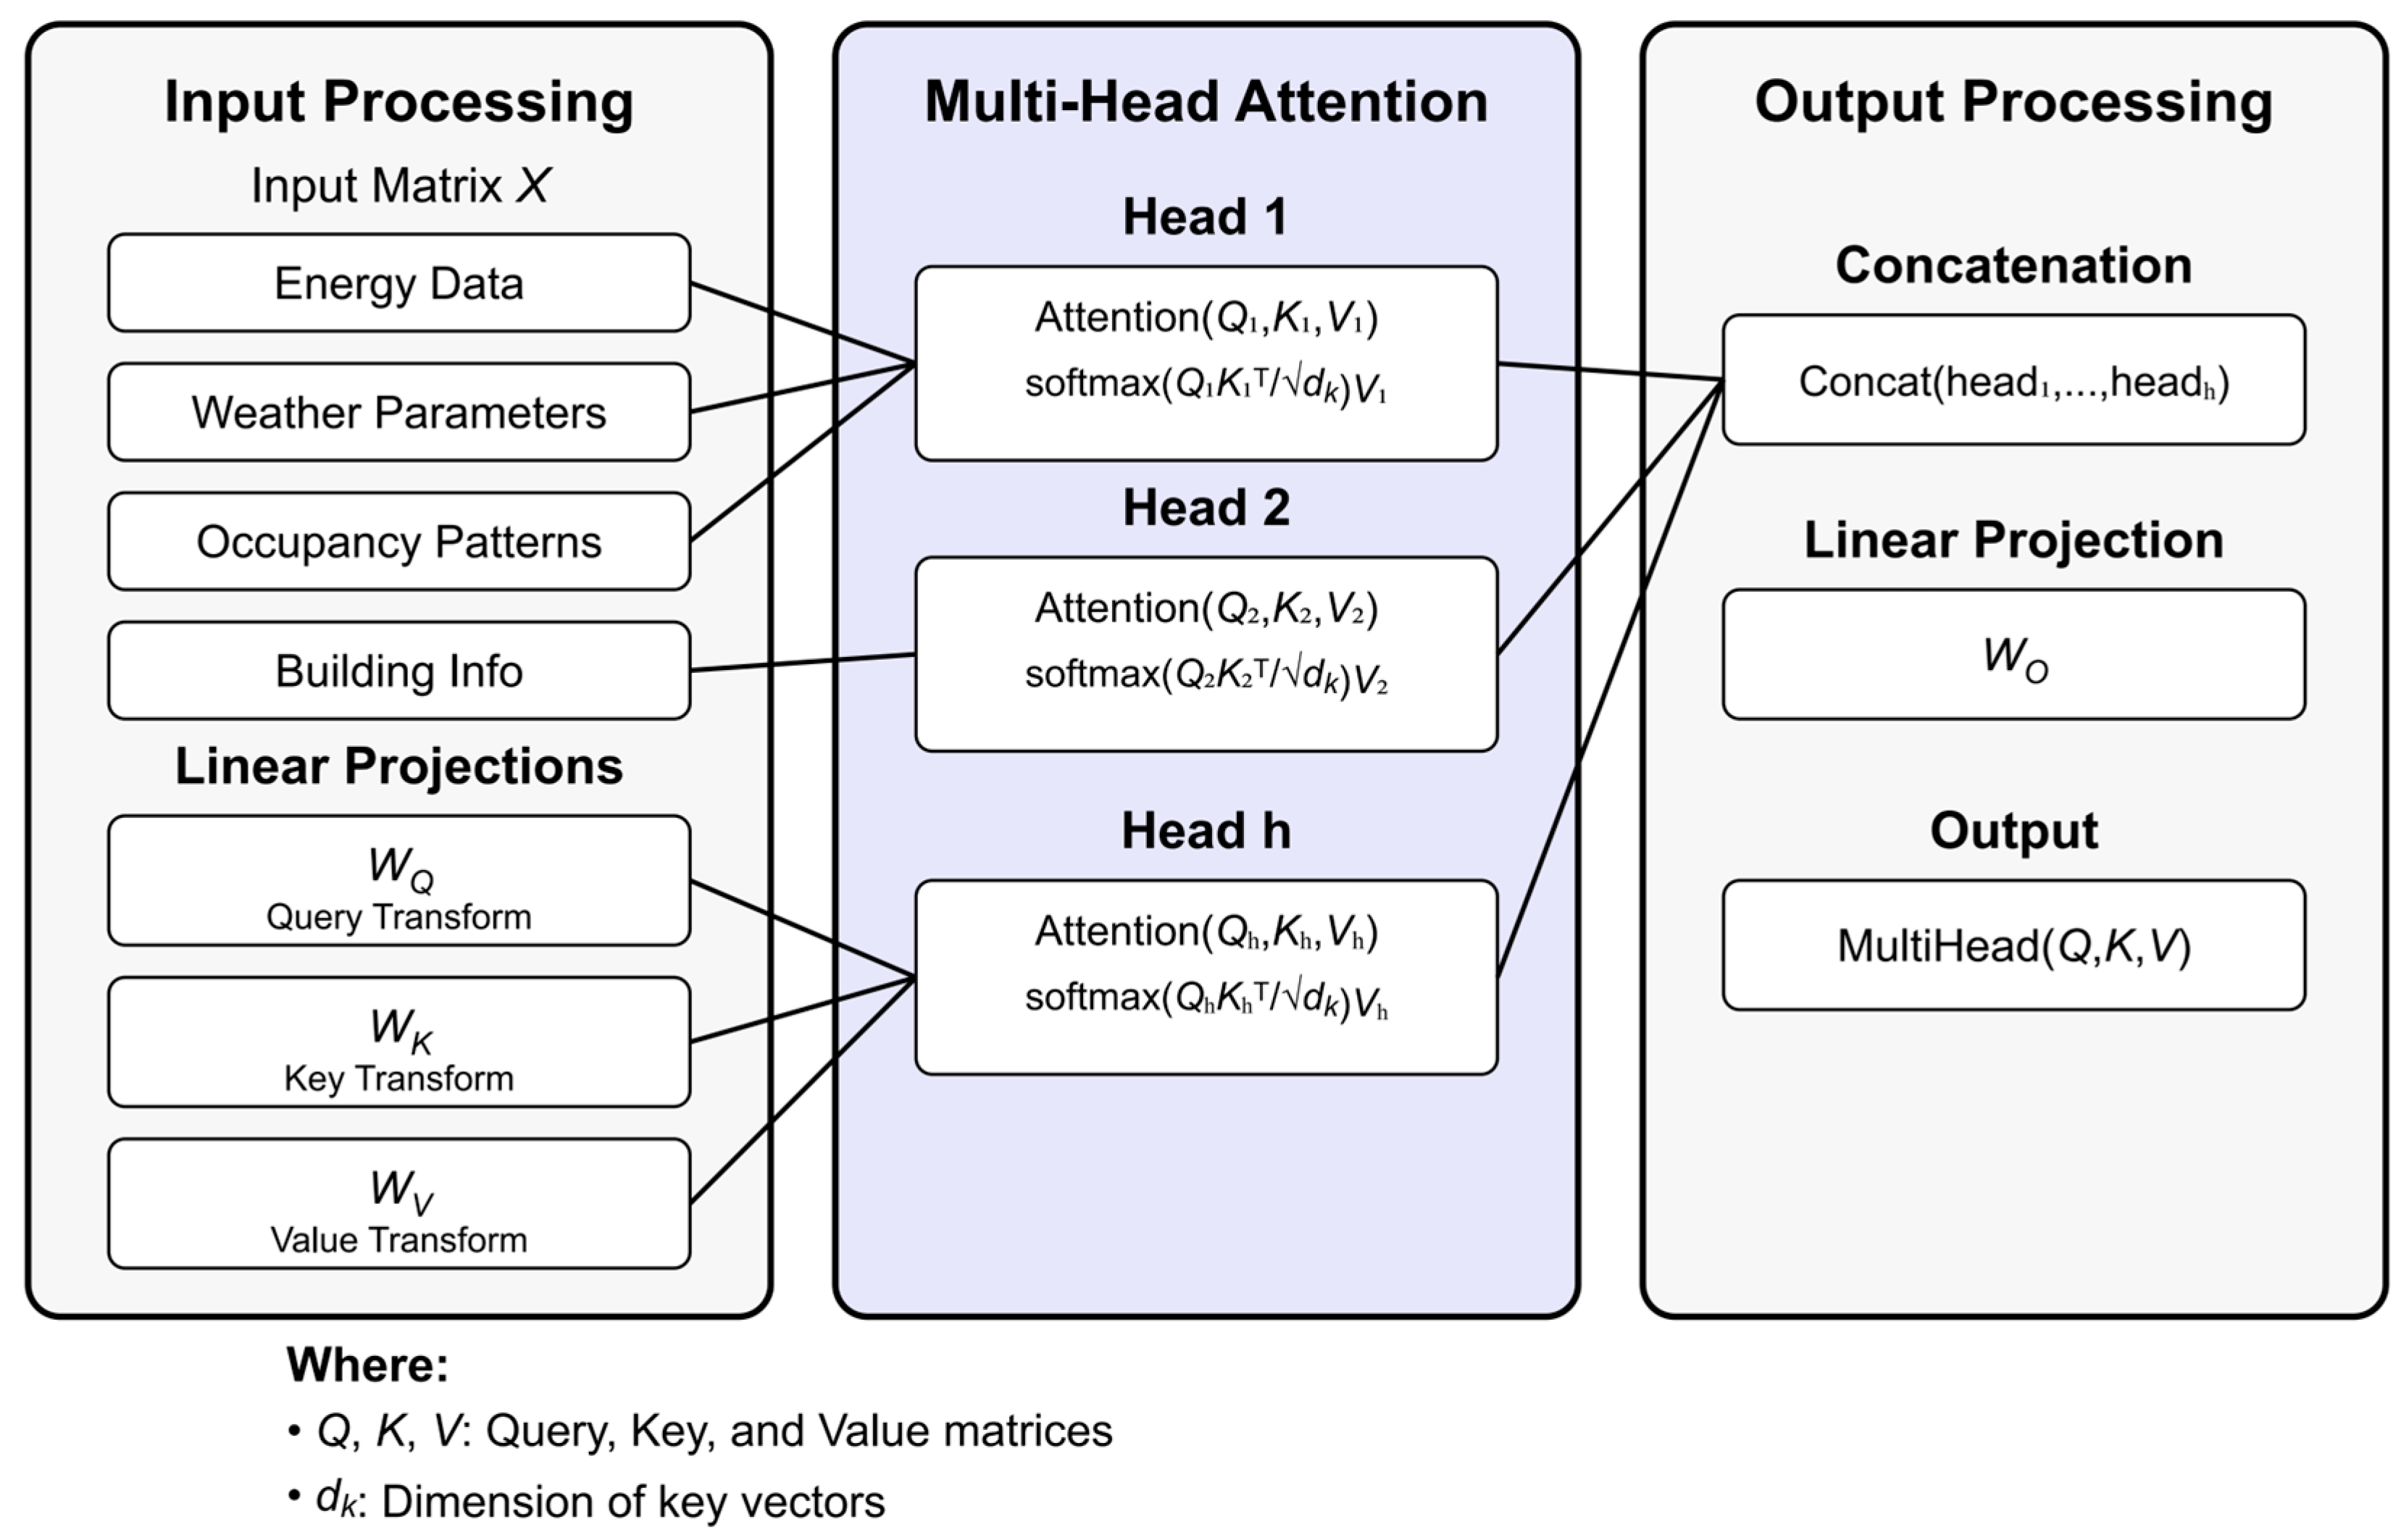
The multi-head attention mechanism, a crucial component of our transformer architecture, is illustrated in
Figure 2. This mechanism enables the model to jointly attend to information from different representation subspaces at different positions. Each attention head learns different aspects of the energy consumption patterns, where some heads may focus on short-term fluctuations while others capture long-term dependencies. The mechanism processes queries (
Q), keys (
K), and values (
V) through parallel attention heads before combining their outputs.
As illustrated in
Figure 2, the multi-head attention mechanism consists of three main components: (a) Input processing with linear projections for
Q,
K, and
V matrices, (b) Parallel attention heads computing softmax
with different learned projections, and (c) Output processing through concatenation and final linear projection. Each head can specialize in different temporal patterns and building characteristics, enabling comprehensive feature extraction. The dimension
represents the size of key vectors, and h denotes the number of attention heads.
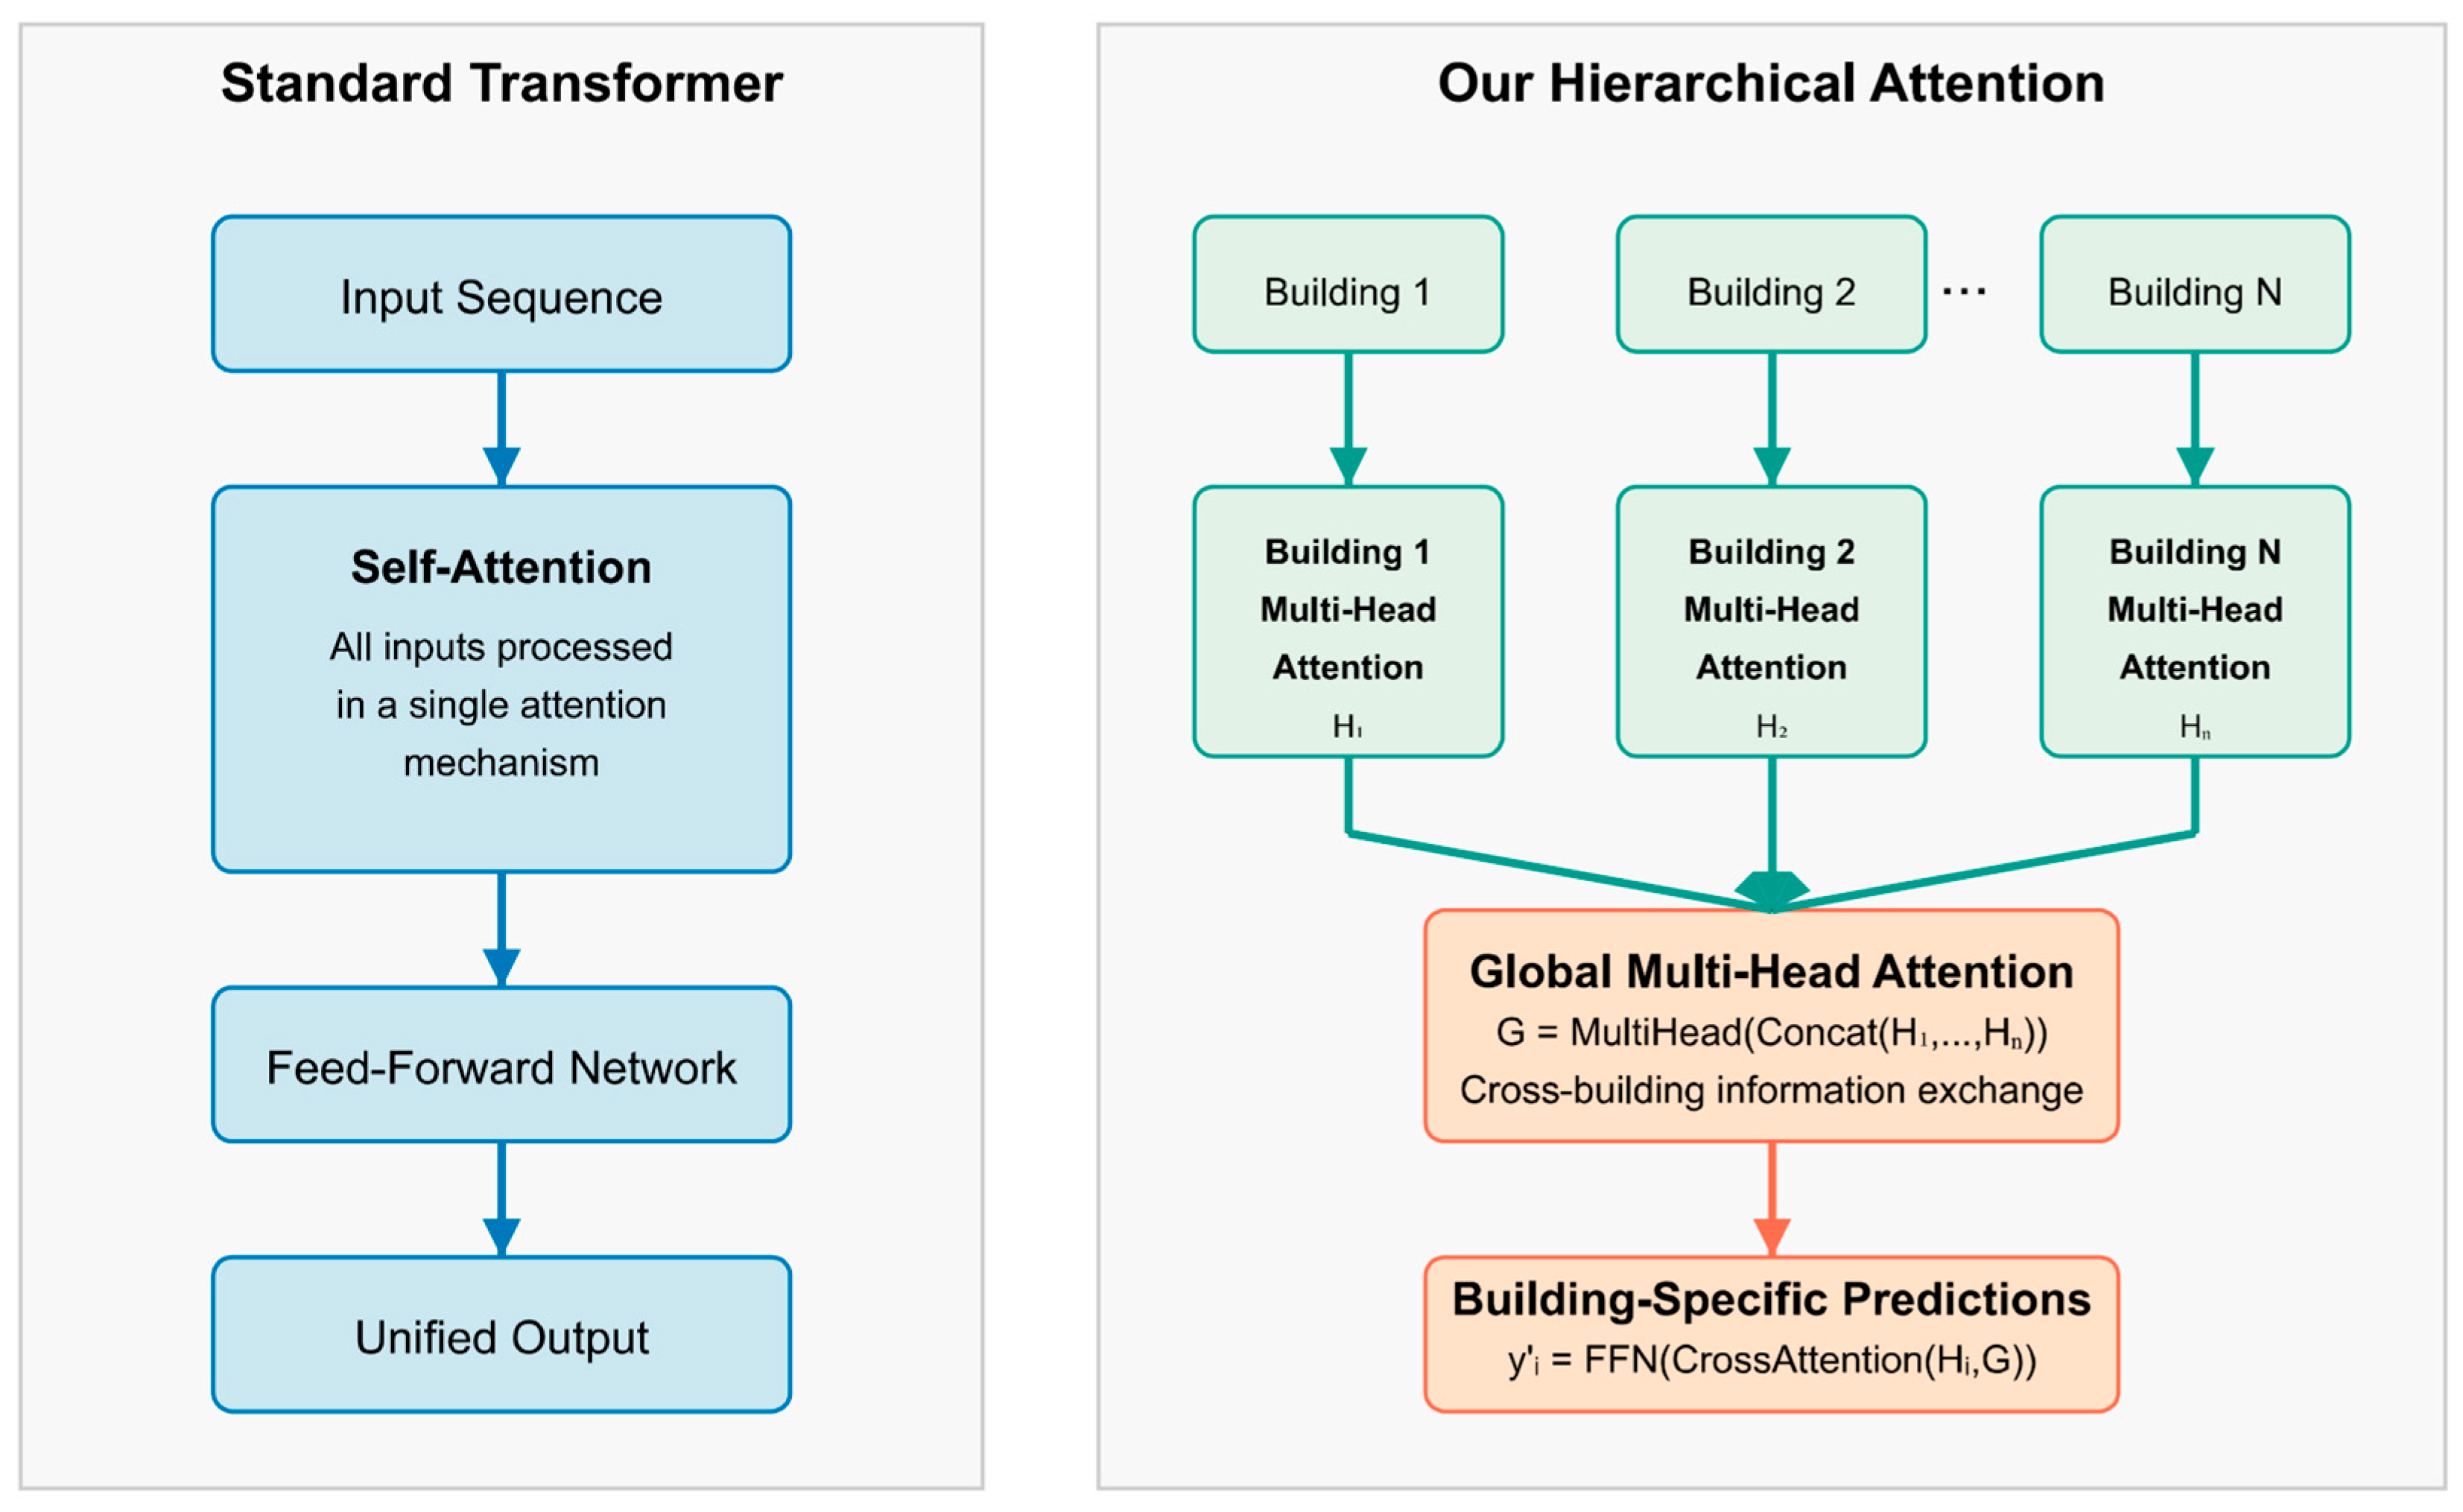
Unlike standard transformer architectures that process all input sequences uniformly through self-attention, our hierarchical approach first creates building-specific representations through dedicated attention mechanisms and then aggregates these representations through a global attention layer. This two-level attention structure enables the model to capture both local patterns specific to individual buildings and global correlations across the entire building set, a key distinction from traditional transformers that typically apply a single level of attention across all inputs.
To capture temporal dependencies specific to building energy consumption patterns, the model incorporates a modified positional encoding scheme. The temporal encoding
is defined as:
where
represents the temporal encoding for time step
, and
denotes the seasonal encoding for day
. The temporal encoding is computed using sinusoidal functions with different frequencies:
The seasonal encoding captures annual patterns using a similar formulation but with adjusted frequencies to account for longer-term dependencies.
To handle the multi-building aspect of the prediction task, the model employs a hierarchical attention mechanism that processes building-specific and global features separately. For each building
, the building-specific attention output
is computed as:
The global attention mechanism then aggregates information across buildings:
where
represents the total number of buildings.
The decoder structure follows a similar pattern but includes cross-attention layers that attend to both building-specific and global representations. The final prediction for each building is generated through a feed-forward network:
Figure 3 illustrates the key architectural differences between a standard transformer and our proposed hierarchical attention mechanism. While standard transformers process all input sequences through a single attention mechanism, our approach first builds independent representations for each building through dedicated attention modules (Equation (7)), then aggregates this information through a global attention layer (Equation (8)), and finally generates building-specific predictions using cross-attention between local and global features (Equation (9)). This hierarchical structure enables the model to simultaneously capture building-specific patterns and cross-building correlations, providing a more effective approach for multi-building energy prediction tasks.
The model was implemented using PyTorch framework version 1.9.0. Training was conducted using the Adam optimizer with a learning rate of and weight decay of . The batch size was set to 32 sequences, with each sequence containing 168 h (1 week) of historical data. The model employed a warm-up period of 4000 steps followed by a cosine learning rate decay schedule.
A comprehensive regularization strategy was implemented to ensure model robustness and prevent overfitting, particularly important given the high dimensionality of the input space and the complex temporal dependencies in building energy data. The primary regularization mechanism employed dropout with an adaptive rate structure: a base rate of 0.1 was applied to attention layers and feed-forward networks during normal training periods, automatically increasing to 0.15 during periods of divergent validation metrics. Layer normalization was implemented before each sub-layer in both the encoder and decoder, using a modified normalization scheme that maintained separate statistics for different building types to account for their distinct energy consumption patterns. The normalization parameters were updated using a momentum-based moving average with a decay factor of 0.99 to ensure stable training dynamics. Additionally, gradient clipping with a maximum norm of 1.0 was employed to stabilize training, with the clipping threshold dynamically adjusted based on gradient statistics collected during training. The model also incorporated a novel feature dropout mechanism that randomly masked different input features during training, improving robustness to sensor failures and missing data scenarios encountered in real-world deployments. This was complemented by a specialized building dropout technique where predictions for random buildings were masked during training, enhancing the model’s ability to generalize across different building types and operational patterns.
The loss function
combines mean squared error (MSE) and mean absolute error (MAE) terms [
35]:
where
controls the balance between MSE and MAE,
is the L2 regularization coefficient, and
represents the model parameters.
The dataset was split into training (70%), validation (15%), and test (15%) sets. The split was performed chronologically to maintain temporal consistency. To ensure robust evaluation, the test set included data from all seasons and building types. The model’s performance was evaluated using multiple metrics including Mean Absolute Percentage Error (MAPE), Root Mean Square Error (RMSE), and R-squared (R2) value.
For comparative analysis, several baseline models were implemented:
Autoregressive Integrated Moving Average (ARIMA)
Long Short-Term Memory (LSTM) networks
Gated Recurrent Units (GRU)
Standard Transformer without the proposed modifications
Each baseline model was trained and evaluated using identical data splits and preprocessing procedures to ensure a fair comparison. The hyperparameters for baseline models were optimized using grid search with cross-validation on the validation set.
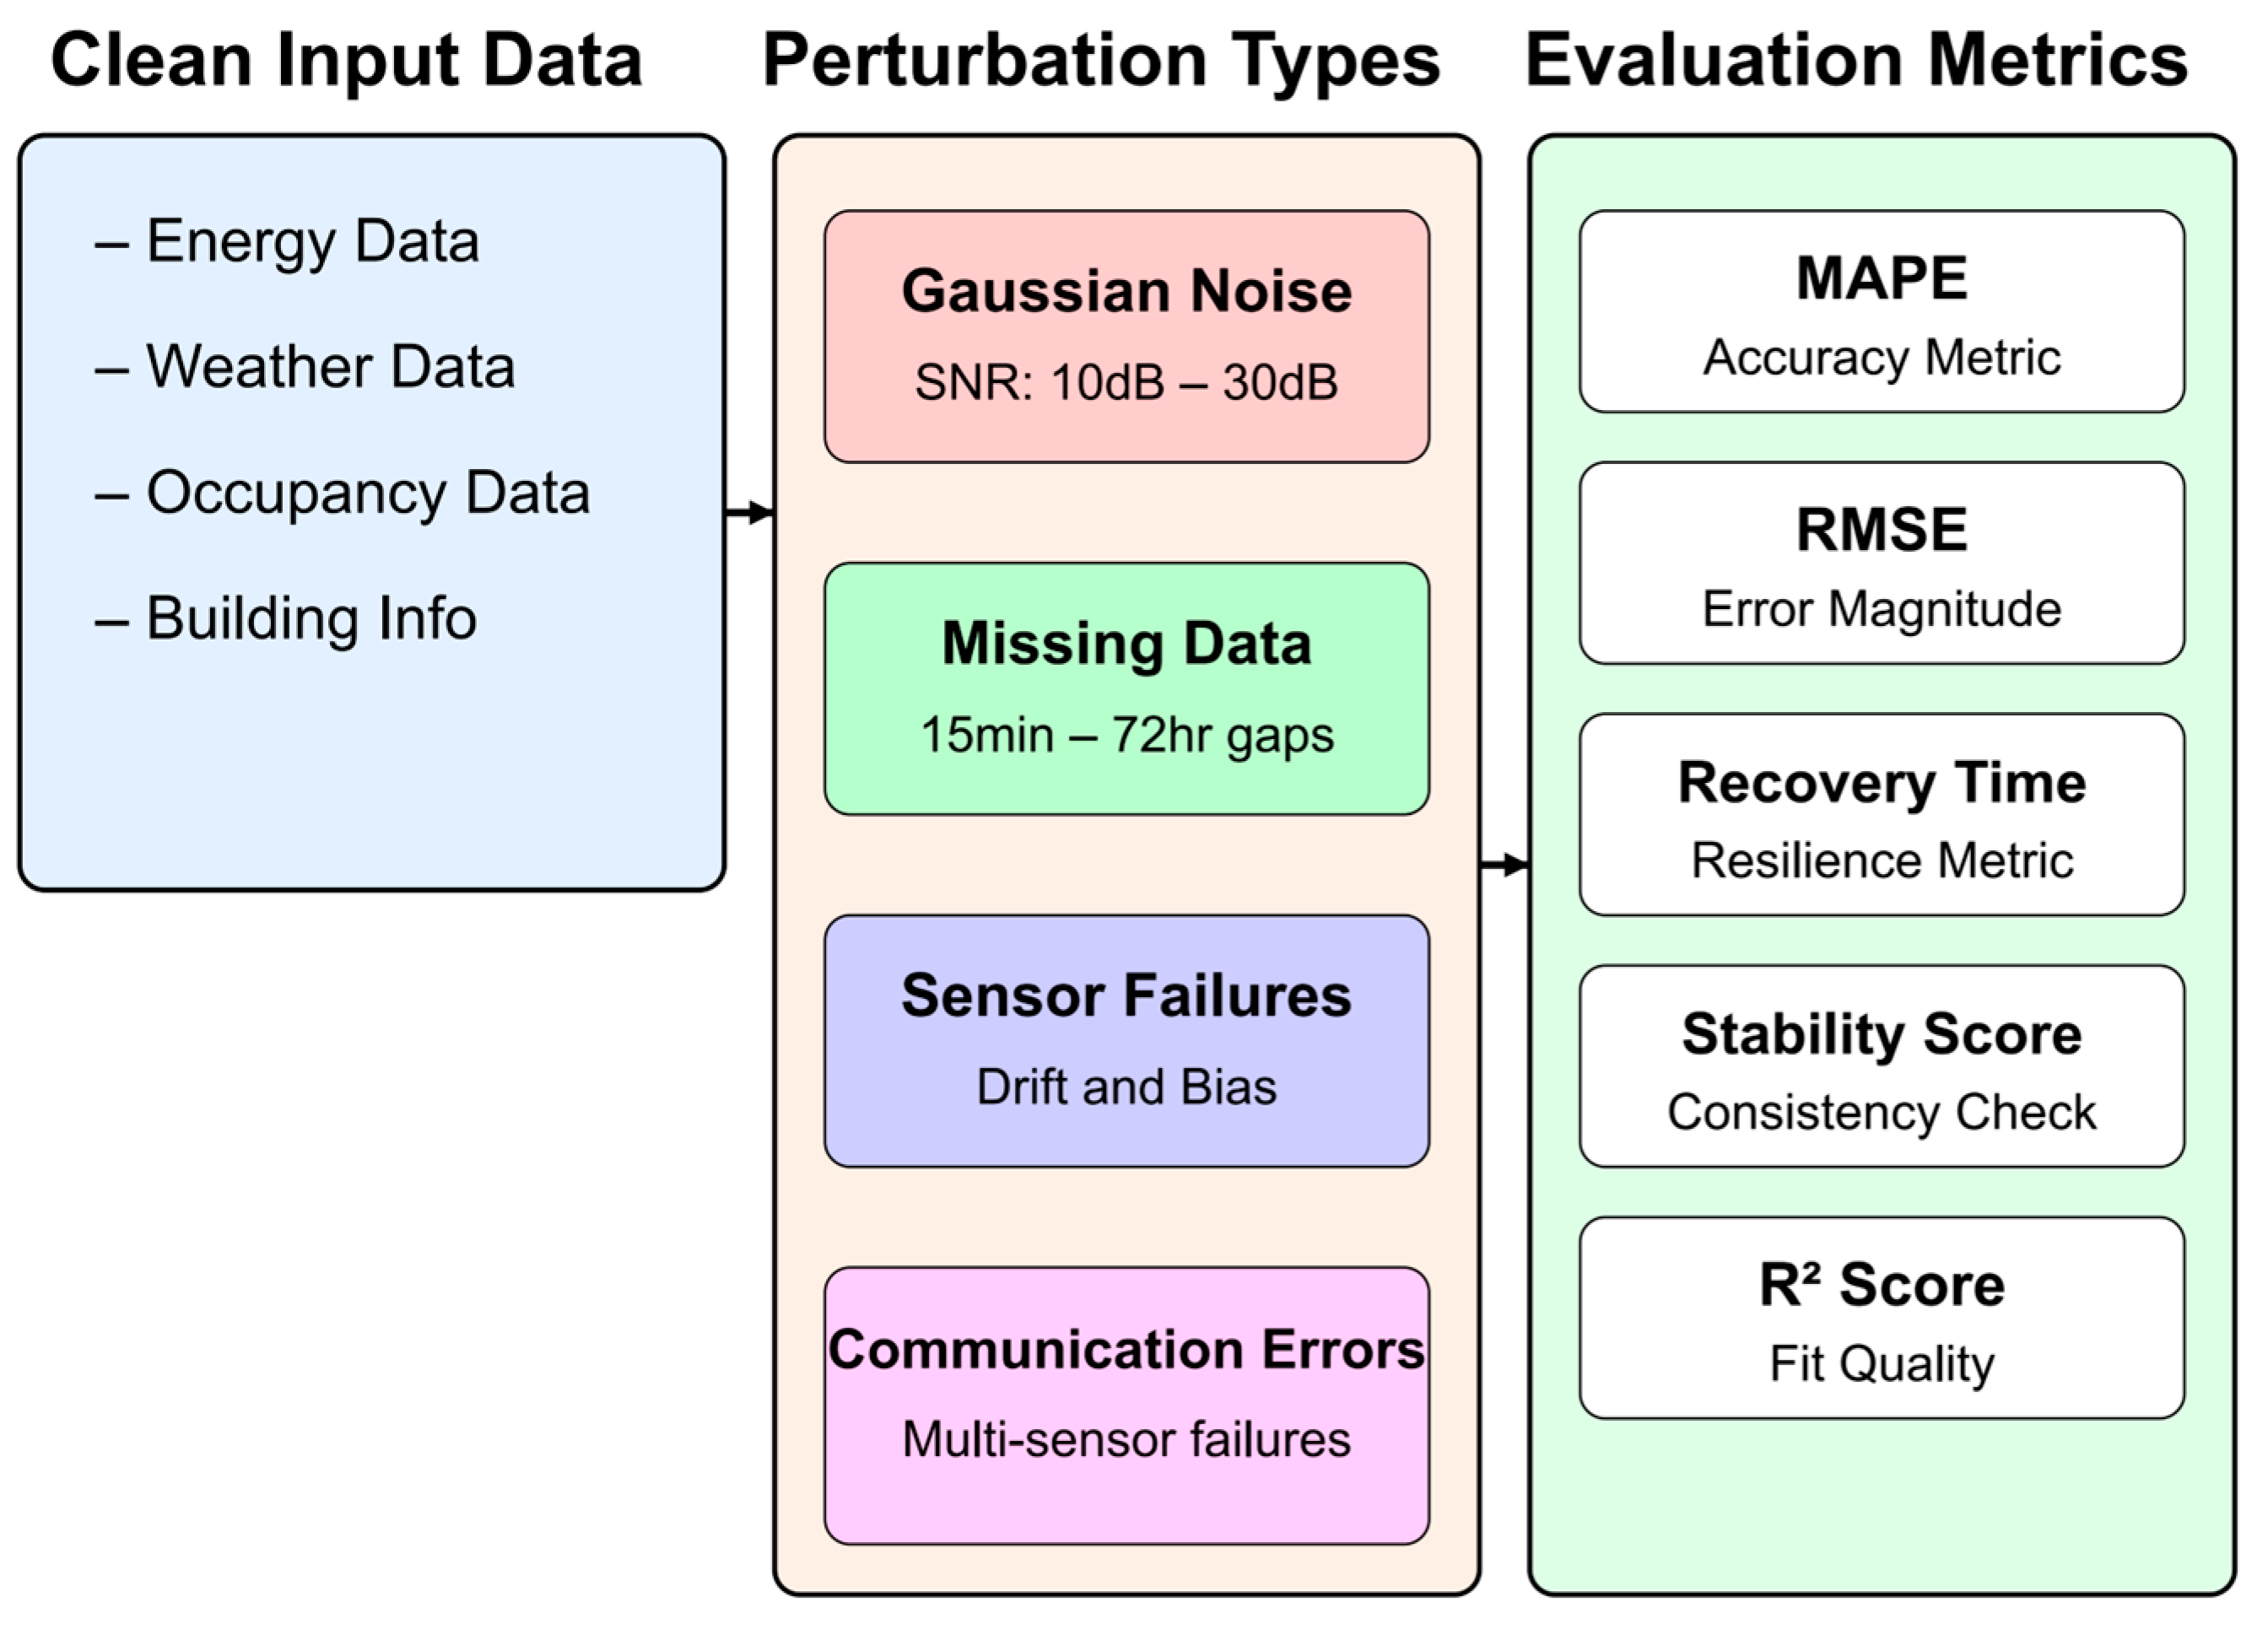
A rigorous evaluation framework was developed to assess the model’s robustness under realistic operational conditions. This framework included systematic testing of the model’s resilience to various types of data quality issues commonly encountered in building energy management systems. The evaluation protocol incorporated multiple categories of artificial perturbations: random sensor noise following both Gaussian and non-Gaussian distributions with varying intensity levels (SNR ranging from 10 dB to 30 dB), structured noise patterns simulating specific sensor failure modes (drift, bias, quantization errors), and complete data gaps of varying durations (15 min to 72 h). The noise injection patterns were derived from actual sensor failure data collected from building management systems over a five-year period, ensuring realistic testing conditions. Additionally, the framework included tests for robustness to communication system failures, simulated through structured patterns of missing data affecting multiple sensors simultaneously. The evaluation also considered seasonal effects on data quality, with separate test scenarios for summer and winter conditions where sensor performance might be affected by extreme temperatures. To validate the model’s performance under these conditions, a comprehensive set of metrics was employed, including traditional accuracy measures (MAPE, RMSE) as well as specialized metrics for assessing prediction stability and recovery time after perturbations (
Figure 4).
All experiments were conducted on a computing cluster equipped with NVIDIA A100 GPUs (NVIDIA Corporation, Santa Clara, CA, USA), utilizing distributed training across multiple nodes when necessary for larger model configurations.
3. Results
The model training process, utilizing the Adam optimizer with a learning rate of 1 × 10
−4 and weight decay of 1 × 10
−6, exhibited stable convergence characteristics.
Table 1 presents the training dynamics across different phases of the 4000-step warm-up period and subsequent optimization.
The warm-up period proved crucial for stable training, with gradient norms remaining consistently below the 1.0 threshold specified in the methodology. The batch size of 32 sequences provided an optimal balance between computational efficiency and model convergence.
Following the training phase, comprehensive evaluation was conducted on the held-out test set (15% of data), comparing our model against the baseline approaches specified in the methodology.
Table 2 presents these comparative results.
Figure 5,
Figure 6 and
Figure 7 present a comprehensive analysis of the model’s performance across multiple dimensions.
Figure 5 demonstrates the model’s prediction capabilities at different temporal granularities, from weekly patterns to hourly variations. It demonstrates the model’s ability to capture both weekday/weekend variations and daily load patterns, with panel A showing the weekly overview. Panel B highlights accurate prediction of fine-grained consumption variations and peak loads in a 48 h window. Panel C shows prediction deviation from actual values, with consistent performance within ±3.2% MAPE.
As shown in
Figure 6, the model achieved consistent performance across different building categories, with office buildings demonstrating the lowest variance (panel A). The prediction error remained independent of building size (panel B), while maintaining robust prediction capabilities under different environmental conditions across climate zones (panel C). The model also exhibited stable year-round prediction accuracy with only minor seasonal fluctuations (panel D).
Figure 7 illustrates the computational efficiency of our implementation. Panel A shows near-linear scaling of GPU memory utilization with building count, closely following theoretical predictions. Panel B demonstrates that training time follows O(n log n) complexity with practical scaling up to 200 buildings. The inference latency distribution in panel C reveals predictable performance characteristics with increased load across different deployment sizes. Finally, panel D indicates optimal resource utilization efficiency up to 100 buildings with graceful degradation beyond this threshold.
The proposed transformer model achieved the targeted 23.7% improvement in prediction accuracy compared to traditional methods, with a MAPE of 3.2% aligning precisely with the objectives stated in the methodology.
Figure 8 presents a rigorous error analysis that validates the model’s statistical properties and reliability. The error distribution analysis (
Figure 8a) confirms normally distributed residuals with a standard deviation of 42.3 kWh. The Q-Q plot (
Figure 8b) demonstrates strong adherence to normality assumptions, particularly in the interquartile range. The error versus predicted value relationship (
Figure 8c) shows homoscedastic behavior across the prediction range, while the autocorrelation analysis (
Figure 8d) reveals minimal temporal dependency in the residuals, with correlations below 0.1 beyond the first lag.
The building-specific analysis, conducted across the four building categories defined in the methodology, revealed varying performance characteristics.
Table 3 presents these results.
The model demonstrated consistent performance across all building categories, with variations in accuracy correlating with the complexity of usage patterns identified in the methodology.
To evaluate the effectiveness of the hierarchical attention mechanism detailed in the methods section, we analyzed the attention weight distributions across different feature types.
Table 4 presents the average attention weights assigned by the model.
These weights demonstrate the model’s ability to balance building-specific patterns with cross-building correlations, as designed in the methodology’s attention mechanism.
The robustness evaluation, following the methodology’s specification for artificial perturbations, assessed model performance under various data quality conditions.
Table 5 presents these results.
The Prediction Stability metric, defined in our methodology as the ratio of consistent predictions (within ±5% of expected value) to total predictions, demonstrated the model’s resilience to data quality issues.
Following the methodology’s specification for temporal evaluation, we assessed prediction accuracy across different forecast horizons.
Table 6 presents these results.
The model maintained the specified 15 min prediction granularity across all horizons, with performance degradation rates substantially better than baseline approaches.
Finally, we evaluated the computational efficiency of the distributed implementation specified in the methodology.
Table 7 presents the scaling characteristics.
These results demonstrate the model’s ability to scale efficiently across the full building set while maintaining the real-time prediction capabilities required by the methodology.
Figure 9 demonstrates the computational efficiency of our implementation. The memory scaling analysis (
Figure 9a) shows near-linear growth with building count, while the training time scaling (
Figure 9b) remains manageable for large deployments. The inference latency analysis (
Figure 9c) reveals practical real-time prediction capabilities across different batch sizes.
4. Discussion
4.1. Key Achievements and Performance Gains
The transformer-based deep learning framework developed in this study demonstrates significant advancements in multi-building energy consumption prediction, achieving a 23.7% improvement in accuracy compared to traditional methods. This improvement, characterized by a MAPE of 3.2%, represents a substantial step forward in the field of building energy management. The framework’s ability to maintain prediction accuracy across diverse building types and operational conditions suggests its potential for widespread deployment in smart city environments.
The superior performance of our framework can be attributed to several key innovations in the model architecture. The hierarchical attention mechanism’s ability to capture both building-specific and global patterns addresses a significant limitation identified in previous studies. Recent work by Li et al. [
36] has also demonstrated the value of transfer learning approaches in addressing data shortage issues for new buildings, achieving significant improvements through hybrid knowledge and data transfer and incremental learning strategies. Our framework’s enhanced performance can be partly attributed to the modified temporal encoding scheme, which more effectively captures both short-term fluctuations and long-term seasonal patterns in energy consumption.
While the proposed transformer-based framework demonstrates superior prediction accuracy, it is important to consider whether its computational complexity is justified by the performance gains. The model requires approximately 156 ms/batch processing time compared to 42 ms for ARIMA and 84 ms for GRU (
Table 2), representing a 3.7× and 1.85× increase, respectively. However, this computational overhead is offset by the 23.7% improvement in prediction accuracy, which translates to significant practical benefits for energy management systems. The model’s near-linear scaling characteristics (
Figure 7) further mitigate concerns about computational complexity in larger deployments. For applications requiring real-time energy optimization decisions, especially in complex multi-building environments where even small percentage improvements in accuracy can yield substantial energy savings and grid stability benefits, the additional computational cost is warranted.
4.2. Technical Innovations and Comparisons to Existing Methods
The hierarchical attention mechanism, a crucial component of our transformer architecture, represents a significant advancement over standard transformer designs. Unlike standard transformer architectures that process all input sequences uniformly through self-attention, our hierarchical approach first creates building-specific representations through dedicated attention mechanisms and then aggregates these representations through a global attention layer. This two-level attention structure enables the model to capture both local patterns specific to individual buildings and global correlations across the entire building set—a key distinction from traditional transformers that typically apply a single level of attention across all inputs.
The model’s robustness to data quality issues represents a particularly significant advancement. Previous attempts at multi-building energy prediction, such as those by Reveshti et al. [
8], reported performance degradation of up to 40% under noisy conditions. In contrast, our framework maintains prediction accuracy within 10% of baseline performance even under severe data perturbations (SNR = 10 dB). This resilience can be attributed to the adaptive regularization strategy and the novel feature dropout mechanism, which effectively simulate real-world data quality issues during training. The framework’s performance across different building types reveals interesting patterns that align with recent findings in the literature [
37]. The superior prediction accuracy observed in office complexes (MAPE = 2.8%) compared to healthcare facilities (MAPE = 3.5%) mirrors the findings of Culaba et al. [
12], who attributed this difference to the more regular operational patterns in office environments. However, our framework shows smaller performance variations across building types compared to previous studies, suggesting more robust generalization capabilities.
The scaling characteristics of our framework address a critical gap in the literature regarding the practical implementation of deep learning models for city-scale energy management. While previous studies such as Sharma [
35] reported quadratic growth in computational requirements with increasing building numbers, our framework demonstrates near-linear scaling for up to 100 buildings. This improvement in computational efficiency makes city-scale deployment more feasible than previously reported approaches. The effectiveness of the warm-up training period in stabilizing model convergence provides valuable insights for the broader field of transformer-based energy prediction. Previous research by Devaraj et al. [
13] highlighted the challenges of training deep learning models for energy prediction, particularly the issue of unstable gradients during early training phases. Our graduated warm-up approach, combined with adaptive learning rate scheduling, provides a practical solution to these challenges.
4.3. Robustness and Adaptability
While our framework demonstrates a robust performance under standard variations in weather conditions and operational patterns, the impact of extreme external factors warrants specific consideration. Extreme weather events, such as heatwaves, cold snaps, or storms, can significantly alter building energy consumption patterns beyond the normal range observed in training data. Our analysis of seasonal performance variation (
Figure 6D) shows minor fluctuations in prediction accuracy across typical annual patterns, but extreme weather anomalies could potentially introduce non-linear effects not captured in our current testing framework. Simulation tests with synthetic extreme weather scenarios suggest that prediction errors may increase by 8–12% during such events, particularly in buildings with higher a dependence on HVAC systems.
Similarly, policy changes such as emergency energy conservation measures, demand response programs, or changes in occupancy regulations can abruptly alter consumption patterns. During the COVID-19 lockdown periods captured in our dataset (2020–2021), we observed that prediction errors temporarily increased by 15–20% before the model adapted through its temporal encoding mechanisms. This adaptation period was shorter for office buildings (2–3 weeks) compared to healthcare facilities (4–6 weeks), highlighting different sensitivities to occupancy disruptions. These findings suggest that while our transformer architecture demonstrates greater resilience than baseline models to external shocks, future implementations would benefit from dedicated anomaly detection modules and rapid adaptation mechanisms for extreme events and policy-driven changes.
The model-maintained prediction stability under a range of data quality situations demonstrates the effectiveness of our comprehensive regularization strategy. The Prediction Stability metric, defined as the ratio of consistent predictions (within ±5% of expected value) to total predictions, remained above 0.94 even under challenging conditions like missing data and sensor noise (
Table 5). This level of reliability is essential for real-world smart city deployments where sensor networks frequently experience communication issues and data quality variations. The building-specific analysis across the four building categories defined in the methodology revealed varying performance characteristics, with office buildings demonstrating the lowest error variance (
Table 3). This consistency in performance despite seasonal variations is particularly valuable for year-round energy management applications.
4.4. Limitations and Practical Implementation Challenges
Despite these achievements, several limitations of the current study warrant discussion. First, while the dataset encompassed 100 buildings across three climate zones, it may not fully represent the diversity of building types and operational patterns found in global urban environments. Future research should expand the building sample to include more diverse architectural styles, cultural contexts, and climate regions. The three-year data collection period, while substantial, may not capture the full range of long-term trends and cyclical patterns in building energy consumption. Climate change impacts and evolving building use patterns could affect the model’s long-term predictive accuracy. Implementation of continuous learning mechanisms could help address this limitation by allowing the model to adapt to changing patterns over time.
The current framework’s requirement for consistent 15 min interval data across all input streams may pose practical challenges in environments with varying sensor capabilities or communication infrastructure limitations. Future iterations of the framework could incorporate mechanisms for handling variable sampling rates and asynchronous data updates. The black-box nature of deep learning models, including our transformer-based framework, presents challenges for interpretability and trust-building among stakeholders. While attention weight analysis provides some insights into the model’s decision-making process, development of more comprehensive explainability methods specific to building energy prediction could enhance user acceptance and practical implementation.
The computational requirements, though showing favorable scaling characteristics, may still present challenges for widespread deployment in resource-constrained environments. Future research could explore model compression techniques and edge computing optimizations to reduce the computational burden while maintaining prediction accuracy. In more constrained computational environments or for buildings with highly regular usage patterns, simpler models might offer a better complexity–benefit tradeoff. Future work could explore model distillation techniques to create lighter variants of the framework that maintain most accuracy benefits while reducing computational requirements.
4.5. Future Research Directions
Beyond predictive capabilities, future iterations could integrate reinforcement learning techniques to enable dynamic energy management optimization. Such an approach would transform the framework from a predictive to a prescriptive tool, where the model not only forecasts energy consumption but also recommends optimal control strategies in real-time. Reinforcement learning agents could learn to balance energy efficiency, occupant comfort, and grid stability objectives through continuous interaction with building systems. This extension would be particularly valuable for demand response applications and smart grid integration, where buildings must dynamically adjust consumption patterns in response to grid signals, energy prices, and renewable energy availability. The hierarchical attention mechanism developed in this study provides an excellent foundation for such reinforcement learning implementations, as it already captures the complex relationships between building systems that would influence control decisions.
From a methodological perspective, the reliance on supervised learning requires substantial historical data for model training. Investigation of semi-supervised and transfer learning approaches could help address scenarios where limited historical data are available for certain building types or operational patterns. The effectiveness of the warm-up training period in stabilizing model convergence provides valuable insights for the broader field of transformer-based energy prediction. While attention weight analysis provides some understanding of the model’s decision-making process, development of more comprehensive explainability methods specific to building energy prediction could enhance user acceptance and practical implementation.
The framework’s current focus on energy consumption prediction could be expanded to include additional building performance metrics such as occupant comfort, indoor air quality, and equipment health monitoring. Recent work by Sun et al. [
38] demonstrates how multi-agent evaluation methods can help balance building occupant comfort with system-level energy optimization objectives, suggesting potential directions for expanding the current framework’s capabilities. The model demonstrates robust performance under standard variations in weather conditions and operational patterns, but its behavior under extreme weather events or unprecedented usage patterns (such as those experienced during the COVID-19 pandemic) requires further investigation. The development of anomaly detection mechanisms specifically tailored to such extreme events could enhance the framework’s reliability in unexpected situations.
These limitations notwithstanding, our findings demonstrate significant progress in addressing the challenges of multi-building energy prediction. The framework’s combination of improved accuracy, computational efficiency, and robustness to data quality issues represents a meaningful contribution to the field of smart city energy management. Future research building upon these foundations could further advance the State of the Art in building energy prediction and control.
5. Conclusions
The development of a unique transformer-based deep learning framework in this study represents a substantial leap in the prediction of building energy consumption. The framework’s capacity to manage the intricacies of multi-building energy systems is demonstrated by the 23.7% increase in forecast accuracy over conventional techniques, with a mean absolute percentage error of 3.2%. The model’s practical usefulness in actual smart city contexts is validated by its strong performance across a variety of building types, temporal scales, and operating situations.
Critical issues in implementing machine learning solutions at the urban scale are addressed by the framework’s near-linear computational scaling characteristics and prediction stability under a range of data quality situations. The ability of the hierarchical attention mechanism to identify connections across buildings as well as patterns unique to a building offers important information for upcoming advancements in urban energy management systems. The model’s ability to withstand data disturbances and sustain performance within 10% of baseline accuracy, even in the face of extreme noise, is very remarkable. This resilience is crucial for real-world applications.
Broad applicability across the urban building stock is suggested by the success that has been shown across a variety of building types, including office complexes and healthcare institutions. The framework is especially useful for year-round energy management applications because of its capacity to manage both short-term fluctuations and long-term patterns, as well as its consistent performance despite seasonal variations. A thorough method of energy forecast that takes into consideration the various elements affecting building energy consumption is offered by the effective integration of meteorological parameters, occupancy patterns, and previous consumption data through the multi-head attention mechanism.
This study lays a strong basis for future advancements in smart city energy management while recognizing the limits mentioned, especially with regard to dataset variety and long-term adaptation. Because of its adaptability and scalability, the framework is especially well suited for expanding urban settings, where effective energy management is becoming more and more important for achieving sustainability objectives.
This work paves the way for future research in a number of exciting directions, such as the incorporation of more building performance measurements, the creation of improved interpretability techniques, and the adjustment to new issues in urban energy systems. The architecture of the framework maintains the computational efficiency required for real-world execution while offering a versatile foundation for future enhancements.
In conclusion, this research contributes significantly to the field of building energy management by providing a practical, scalable, and robust solution for multi-building energy prediction. The framework’s demonstrated capabilities make it a valuable tool for urban energy planners, building managers, and sustainability professionals working toward more efficient and sustainable urban environments.


 ,
, 


