Article

Assessment of Energy Consumption and Greenhouse Gas Emissions in a UK Quick-Service Restaurant Using EnergyPlus †

by
Elias Eid
1,2,*,
Alan Foster
1,
Graciela Alvarez
2,
Robin Campbell
1 and
Judith Evans
1
1
School of Engineering and Design, London South Bank University, Churchill Building, Bristol BS40 5DU, UK
2
Unité de Génie des Procédés FRIgorifiques pour la Sécurité Alimentaire et l’Environnement (FRISE), Institut National de Recherche pour l’Agriculture, l’Alimentation et l’Environnement (INRAE), Université Paris-Saclay, 92761 Antony, France
*
Author to whom correspondence should be addressed.
This article is a revised and expanded version of a paper entitled ‘Modelling of energy use and greenhouse gas emissions from a quick service restaurant’, which was presented at 8th IIR International Conference on Sustainability and the Cold Chain, Tokyo, Japan, 9–11 June 2024.
Energies 2025, 18(6), 1377; https://doi.org/10.3390/en18061377
Submission received: 31 January 2025 / Revised: 24 February 2025 / Accepted: 6 March 2025 / Published: 11 March 2025
(This article belongs to the Section B: Energy and Environment)

Abstract

:
To reduce energy consumption and greenhouse gas emissions, the adoption of efficient refrigeration and cooking equipment and other innovative technologies need to be considered in the food service sector. In quick-service restaurants (QSRs), there is a strong interaction between the structure, internal machinery, and heating, ventilation, and air conditioning (HVAC) system. The impact of these interactions in a UK-based QSR was modelled using EnergyPlus™ 2022 v22.2.0. The modelling examined the effects of applying carbon reduction technologies, predicted climate change impacts, and electrical grid carbon intensity (EGCI) from 2022 to 2050. The findings revealed that among the individual technologies applied, an enhanced efficiency of 20% in refrigeration and kitchen equipment gave the most favourable outcome, contributing to a 15.7% reduction in carbon emissions. The results also showed that climate change impacts on the energy consumption of the QSR were minimal. Additionally, combining technologies could achieve savings of 35.9% in carbon emissions, while predicted changes in the EGCI could potentially yield a 98% reduction in carbon emissions between 2022 and 2050. The findings highlight the significance of the early adoption of carbon reduction technologies to minimise cumulative emissions. These insights offer a foundation for developing more effective carbon reduction strategies in the food service sector.

1. Introduction

Studies indicate that 26–35% of global greenhouse gas (GHG) emissions can be attributed to food and agriculture, with approximately 18–29% of these emissions arising from the food supply chain [1,2]. According to Foster et al. [3], refrigeration-related GHG emissions in the UK food service sector accounted for 1.93 MtCO2e in 2019. Hence, it remains essential to identify methods to reduce these emissions within the food service sector.
The food service industry encompasses various subsectors, including restaurants, pubs, clubs, cafes, hotels, leisure establishments, staff canteens, and those in the health care and education sectors. Within this industry, food and beverages are primarily kept refrigerated using small-scale systems using integrated refrigeration systems such as beverage coolers and food display cases, as well as small split systems like cellar coolers in pubs and compact walk-in cold stores [3]. Around 73% of gas consumption is attributed to cooking, while over half of the electricity used in restaurants is dedicated to cooking and refrigeration [4].
Commercial kitchens in buildings are among the most resource-intensive users of gas, water, and electricity in the UK [5,6]. They can therefore significantly contribute to reducing carbon emissions, since they surpass energy benchmarks (in kWh/m2) by more than ten times compared to most other commercial premises. These studies reported that fast-food outlets typically had a typical benchmark of 890 kWh/m2/year of total floor area. Those with good practices reduced this figure to 820 kWh/m2/year. Mudie et al. [6] suggested that a kWh/m2 benchmark for kitchen size was likely to be a more reliable metric for the energy used in restaurants, with an estimated figure of 4750 kWh/m2/year for kitchen size, while Gunasegaran et al. [7] used energy data from 130 restaurants and computed the building energy index, which ranged in between 650 and 1000 kWh/m2/year.
The market size of the quick-service restaurant (QSR) industry worldwide reached USD 978.4 billion in 2023 [8]. Given the significant impact of this sector, it is crucial to study and model QSRs to better understand their energy performance and identify opportunities for improvements. While progress has been made in developing modelling tools to estimate the energy performance of buildings, current research has not fully addressed the unique needs of QSRs. Although extensive research has been conducted on building energy performance, only two papers in the literature were identified that addressed the modelling of restaurants. A study by Hai et al. [9] explored the energy performance of a near-zero-energy building restaurant, integrating solar panels, hydrogen storage, and grid electricity. Using TRNSYS, the researchers simulated energy consumption for refrigeration, HVAC, lighting, and hot water systems over a year. MATLAB was used to assess thermal comfort. The study demonstrated that renewable energy integration significantly reduced emissions, offering insights into sustainable strategies for energy modelling. Udin et al. [10] conducted a building energy performance analysis by considering different categories of buildings for a restaurant and a hospital. The study objectives were met by introducing a new approach that used various modelling tools and identified potential envelope materials for energy renovation. Additionally, a calibration and validation study was performed to evaluate the model performance. Lollini et al. [11] modelled a small restaurant and different offices to demonstrate the potential energy savings and operational benefits of dynamic glazing systems in a real small-scale commercial setting.
Despite these efforts, a research gap persists in the modelling of QSRs, as recent studies focus on different objectives and areas of investigation. The application of various technologies both individually and together, such as the use of renewable energy sources, economizers in HVAC, low global warming potential (GWP) refrigerants, and changing the deadband temperature of the QSR, have not been explored. No studies have investigated how integrating these different technologies through modelling could enable QSRs to achieve carbon neutrality by 2050, considering factors like climate change and projected electrical grid carbon intensity (EGCI). This study aims to bridge this research gap by developing a comprehensive energy performance model for QSRs, exploring the potential of integrating multiple technologies to reduce carbon emissions.
Eid et al. [12] developed and validated a building energy simulation using EnergyPlus for a supermarket in Paris, examining the impact of various technologies such as doors on chilled cabinets and the use of R-744 refrigerant, while incorporating projections to 2050 that account for climate change and predicted EGCI. By focusing on the specific challenges faced by QSRs and using modelling tools similar to those used by Eid et al. [12] in a supermarket context, this research not only enhances the understanding of energy performance in QSRs but also identifies actionable strategies for achieving carbon neutrality in this critical sector. This paper employs a similar approach but focuses on a QSR and employs different technologies. The work aims to evaluate the potential for reducing carbon emissions in the UK QSR and to assess how close to carbon neutrality could be achieved by 2050. The authors have previously conducted research assessing the carbon neutrality of the QSR by 2050 [13]. This paper builds upon that study, using fundamental data collected as preliminary considerations while incorporating further analyses and additional insights.

2. Materials and Methods
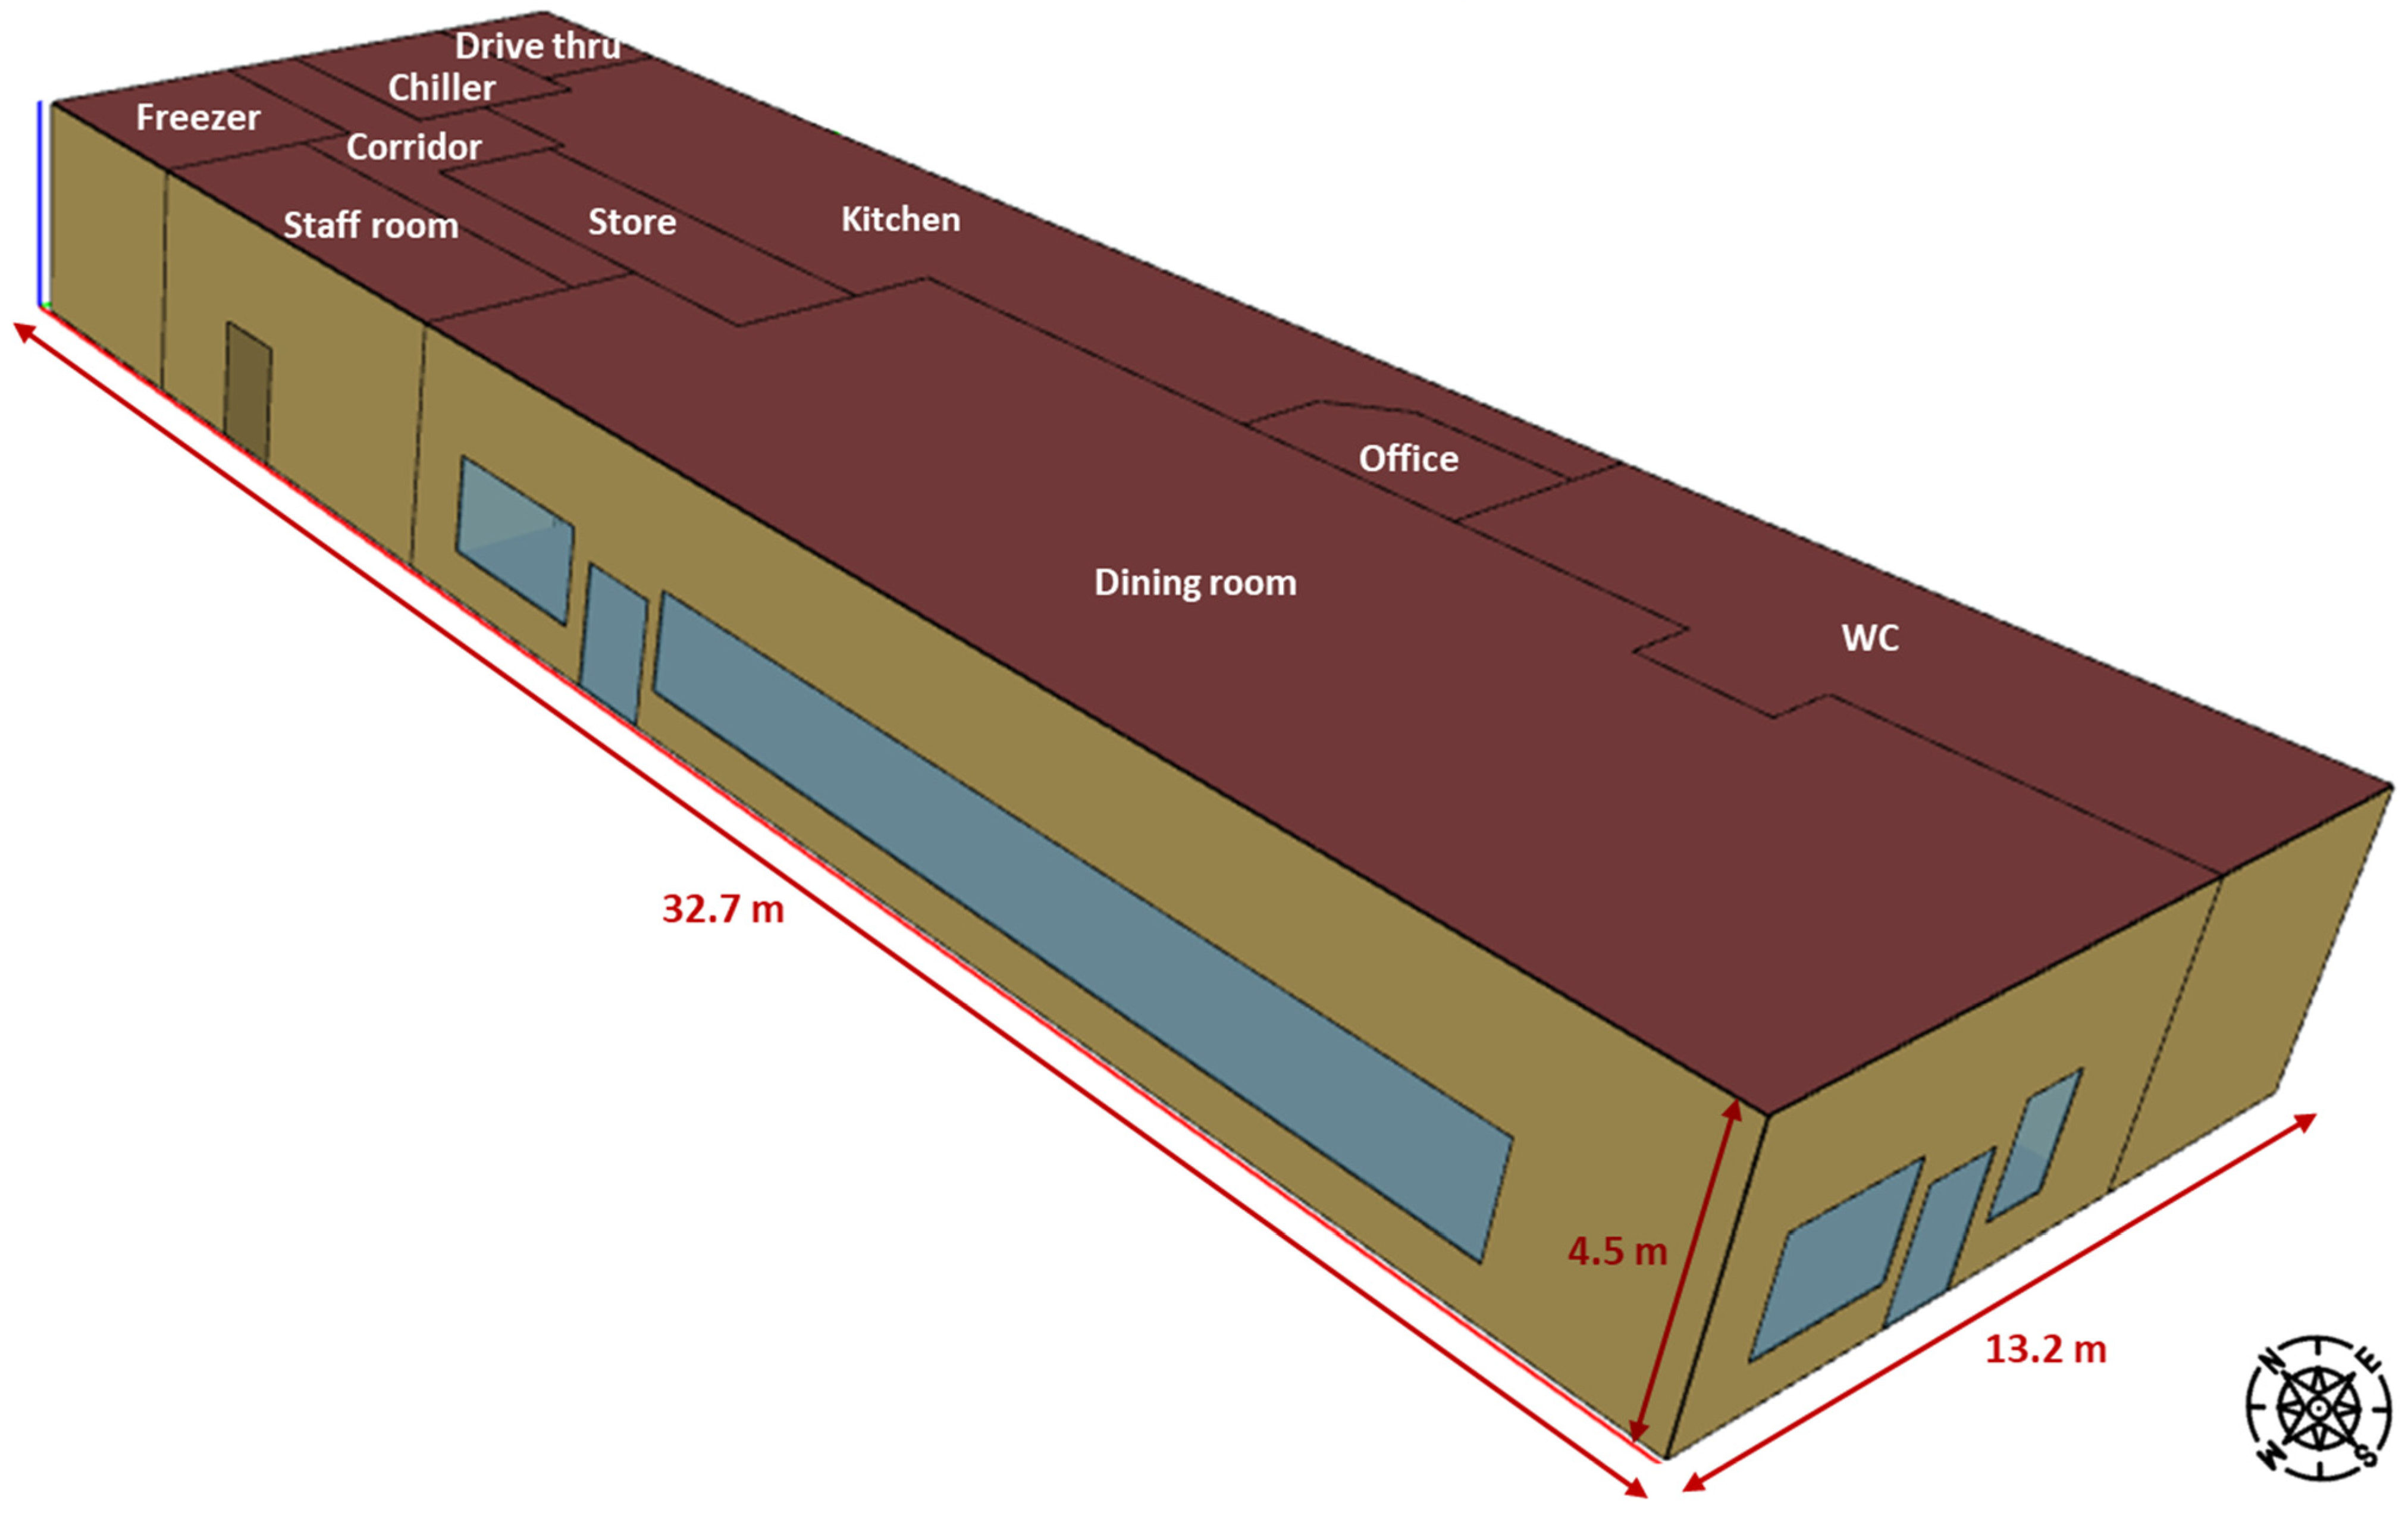
A QSR located in the UK was modelled using EnergyPlus, which is a widely used and extensively validated building energy simulation tool developed by the U.S. Department of Energy [14] and is recognised as an industry-standard software for energy modelling. It has been rigorously tested against empirical data and benchmarked using ASHRAE Standard 140, which ensures its accuracy in simulating various building energy performance parameters. Section 2.1 provides information about the QSR. Section 2.2.3 demonstrates the model inputs, outlining parameters sourced from references, real QSR data, assumptions, expert advice, or default values provided by EnergyPlus. The documentation of the U.S. Department of Energy highlights all the equations used to estimate the various loads across all modelled scenarios in EnergyPlus [14].

2.1. QSR Details

The QSR modelled was located in London and was part of a major fast-food chain. The floor area of the QSR was 431 m2, and the reported total electric energy consumption was 555,377 kWh/year in 2022. No gas was used for heating or cooking, as all energy demands were met using electricity, with heating supplied by heat pumps. Details on the space types and geometry derived from architectural plans are provided in Section 2.2.2, while the measured monthly energy consumption is presented in Section 3.1.
Mudie et al. [6] compared benchmarks among licensed restaurants and pubs, plotting annual electricity use against total floor and kitchen areas. They found that establishments with similar total floor areas consumed between 180,000 and 560,000 kWh annually, while those with comparable kitchen sizes had annual usage ranging from 120,000 to 560,000 kWh. Additionally, it was reported in a Building Energy Efficiency Survey (BEES) that 5 million m2 of restaurants and takeaways consume 5890 GWh of total energy per year [15]. This results in an energy use intensity (EUI) of 1178 kWh/m2/year, which is 9% lower than the 1289 kWh/m2/year observed in this study. These results show that the measured energy consumption of 555,377 kWh/year for the QSR is at the upper end of the reported ranges. This high figure is attributed to its position among the top 10% sales of the chain, resulting in very high turnover.

2.2. Modelling of the QSR

2.2.1. Methodology

The total energy consumption was calculated using EnergyPlus™ 2022 v22.2.0. SketchUp Pro 2023 (Trimble Inc. Westminster, CO, USA) was employed for drawing and creating the model geometry, while OpenStudio 2023 v1.5.0 (by NREL, ANL, LBNL, ORNL, and PNNL) was used to incorporate and adjust various properties such as weather files, construction, materials, occupancy, internal loads, schedules, water systems, HVAC, and refrigeration systems. The environmental impact was characterised by the total equivalent warming impact (TEWI).

2.2.2. Geometry

The geometry was derived from architectural plans containing all the required dimensions. The QSR had a floor area of 431 m2 and was divided into 10 zones, chiller, corridor, dining room, drive thru, freezer, kitchen, office, staff room, store, and WC, with areas of 16 m2, 25 m2, 179 m2, 10 m2, 18 m2, 88 m2, 9 m2, 25 m2, 21 m2, and 40 m2, respectively (Figure 1). The height of all zones was 4.5 m.

2.2.3. Model Inputs

This section presents the model inputs. Further and more detailed information is provided in Table 1.
The London weather file for the period 2011–2030 was used in the QSR simulation to reflect the most current climatic conditions. The historical EnergyPlus weather files based on data from 1976 to 2005 were shifted to the 2011–2030 period, considering historical climate change (https://weathershift.com/, accessed on 2 November 2023). The methodology for this process is detailed in Dickinson and Brannon [16]. The weather files for future periods were averaged over specific time spans to represent expected climatic conditions for each projected period. The median year of each range was used as the terminology in this paper to represent the entire range. For instance, 2020 represents an average of climate conditions for the period 2011–2030, and so forth.
OpenStudio encompassed various parameters such as the outlet operational hours, occupancy, lighting, equipment usage, and specific operation times for various components. All electrical devices were added in OpenStudio as electrical input loads. Information on electrical equipment was not provided, so EnergyPlus default values were used instead. The initial results demonstrated that the modelled total annual energy consumption was significantly lower than the measured QSR data. On further investigation, the QSR owner indicated that kitchen equipment was the largest contributor to energy usage, exceeding that of the HVAC systems. Therefore, it was assumed that the difference might be the quantity of the electrical load in the kitchen. To address this, the electrical load in the kitchen was increased to fit the measured annual total energy consumption reported by the QSR.
To define the envelope of the QSR, a recent standard construction set from the American Society of Heating, Refrigeration and Air Conditioning Engineers (ASHRAE) within the library was employed (90.1-2019—ASHRAE 169-2013), using materials from OpenStudio’s built-in libraries. These default materials included concrete, gypsum, typical insulated wood, etc.
The hot water system included a pump and an electrical resistive water heater on the supply side. The daily water consumption was provided by the QSR owner.
By default, HVAC systems and components such as flow rates and heating and cooling capacities were “auto sized” by EnergyPlus using sizing algorithms. These were derived from heating and cooling loads at design conditions from the weather files. The HVAC aimed to control each thermal zone via a thermostat set point. All thermal zones were controlled. Heating was electrical from heat pumps. Two packaged rooftop heat pump units (PRHPs) were considered, with one unit serving the kitchen and the other serving the dining room. The supply side of these HVAC systems had a cooling coil, a heat pump, a supply fan, and an outside air system. On the demand side, the kitchen and the dining rooms were connected using zone air terminal units. Each of the remaining areas were regulated by a packaged terminal heat pump unit (PTHP), which was a ductless, through-the-wall heating and cooling system.
The coefficient of performance (COP) of the heat pump was calculated based on the outside dry-bulb temperature (Td) using a cubic equation with default coefficients in EnergyPlus, as shown in Equation (1):
C O P T , h = C O P r , h 1.192 3.004 e 2 T d + 1.037 e 3 T d 2 2.333 e 5 T d 3
where COPT,h is the heating COP at different temperatures and COPr,h is at rated conditions based on standardised testing environments and industry practices applied by EnergyPlus (outdoor air dry-bulb temperature of 8.33 °C).
The COP of the cooling coil was calculated based on Td and wet-bulb temperatures (Tw) using a biquadratic equation with default coefficients in EnergyPlus, as shown in Equation (2):
C O P T , h = C O P r , c 0.3424 + 3.488 e 2 T w 6.237 e 4 T w 2 + 4.977 e 3 T d + 4.379 e 4 T d 2 7.280 e 4 T w T d
where COPT,c is the COP at different temperatures and COPr,c is at rated conditions based on standardised testing environments by industry practices applied by EnergyPlus (air entering the cooling coil at a 19.4 °C wet-bulb temperature and air entering the outdoor condenser coil at a 35 °C dry-bulb temperature).
The QSR had two cold stores, a chiller and a freezer, using R-448A direct expansion (DX) refrigeration systems. A condensing unit served the low temperature (LT) needs of the freezer, and another served the medium temperature (MT) requirements of the chiller. Each system was equipped with an air-cooled condenser with a variable-velocity fan and one compressor. Each compressor in EnergyPlus’s library has two bicubic performance curves, determined by its model number (as outlined in Table 1), which were used to calculate power and capacity based on evaporative and condensing temperatures. The compressors were selected based on the total capacity load of the freezer and chiller, as shown in Table 1, to ensure proper sizing. Consequently, compressors with slightly higher capacities were chosen from the list to meet the load requirements, with nominal capacities of 1.22 kW for the chiller and 1.64 kW for the freezer. The sizing of the condensers was determined by considering a temperature difference of 10 K between the condensing temperature and the ambient temperature. The maximum rated fan power was assumed to be 3% of the heat rejection based on Foster et al. [17]. The refrigerant charge was calculated using the F-Gas refrigerant charge calculator excel file (https://www.realalternatives.eu/app/images/Tools/fgas-refrigerant-calculator.xls, accessed on 5 December 2023).
Figure 2 shows the refrigeration DX systems of the chiller and the freezer.
Details of the model inputs are presented in Table 1.
Table 1. Model inputs.
VARIABLESINPUTSSOURCE
Opening hours From 6 a.m. to 10 p.m. (Monday–Sunday)QSR data
Internal heat loads Lighting load consumption (kWh/year)Electric load consumption (kWh/year)
Corridor436194EnergyPlus default
Dining room718930,066EnergyPlus default
Drive thru233350EnergyPlus default
Kitchen5494343,783After adjusting with QSR data
Office206308EnergyPlus default
Staff room561844EnergyPlus default
Store558372EnergyPlus default
WC930133EnergyPlus default
Heating thermostat (°C)21 (kitchen)
20 (all the other areas)
QSR data
Cooling thermostat (°C)23 (all the areas)QSR data
HVAC systemCooling rated COP3Goel et al. [18]
Heating rated COP3.4Goel et al. [18]
Fan total efficiency0.7EnergyPlus default
Heating design supply T (°C)40EnergyPlus default
Cooling design supply T (°C)15EnergyPlus default
Hot water systemWater consumption (L/day)2200QSR data
Specific heat capacity of water (J.K−1.kg−1)4.185At 35.6 °C
Inlet T (°C)11.15Mean ambient T
Target T (°C)60EnergyPlus default
Refrigeration system
(R-448A)
CompressorsChiller:
Copeland-COPELAWELD-60 Hz MEDIUM_RS43C1E-IAA
Freezer:
Copeland-COPELAMETIC-60 Hz LOW_KALA-016E-TAC
Assumption
Evaporating T (°C)Chiller/freezer: −8/−33[19]
Minimum condensing T (°C)21Peterson et al. [20]
Refrigerant charge (kg)3.2 Assumption
Refrigerant leakage for cold stores (%/year)10Brown et al. [21]
Cold stores
(Chiller and freezer)
Total area (m2)Chiller/freezer: 16/18QSR data
Operating T (°C)Chiller/freezer: 3/−18QSR data
Height
of doors (m)
2QSR data
Total cooling
capacity (kW)
Chiller/freezer: 1/1.25QSR data
Fan (W)735EnergyPlus default
Light (W)120EnergyPlus default
Defrost (W)2500EnergyPlus default
Insulated floor heat transfer coefficient (U) (W/m2.K)0.207EnergyPlus default
Insulated surface U facing zone (W/m2.K)0.235EnergyPlus default
Stocking door U facing zone (W/m2.K)0.3785EnergyPlus default

2.3. Modelling Technologies

The impact of various carbon saving technologies was examined individually and together to assess their effects. The technologies examined were as follows:
-
Technology 1: Increase the deadband temperature of the HVAC by 2 K by increasing cooling and decreasing heating set points by 1 K.
-
Technology 2: Low GWP refrigerant (GWP =150). It was assumed that the QSR’s energy usage would be the same as that of the baseline running on R-448A (GWP = 1273).
-
Technology 3: 10% more efficient refrigeration and kitchen equipment.
-
Technology 4: 20% more efficient refrigeration and kitchen equipment.
-
Technology 5: Economizer in the HVAC. Fixed dry-bulb economizers with a high-limit dry-bulb control set at 24 °C were integrated into the HVAC systems of both the kitchen and dining areas. These used outside air to provide free cooling when external air conditions were favourable (below 21 °C), instead of relying on the mechanical cooling of the air conditioning.
-
Technology 6: Solar photovoltaic (PV) panels were installed on the QSR’s roof, covering approximately 65% of the total roof area (280.2 m2). This percentage was selected based on the findings of Gagnon et al. [22], who indicated that around 60–65% of commercial roof space is generally suitable for PV installations. The electricity generated was calculated using the RETScreen v9.0 software tool. RETScreen uses published local data for daily solar radiation on a horizontal surface in kWh/m2/day for each month. The monthly output was calculated based on the fixed orientation of the PV panels, which were positioned at a 15° angle to the horizontal plane, with their location in London, and an assumed efficiency of 15%. The total output for the year was the sum of these values. It is known that the monthly generation from RETScreen was always lower than the monthly consumption of the QSR. However, it is uncertain if peak generation ever exceeded consumption, so it has been assumed that all generation was used on-site, and none was exported.
-
Technology 7: All the technologies above were combined in a single model to understand their potential impact on energy use and carbon emissions.

2.4. Climate Change

London weather files for the period 2041–2060 were used to evaluate the effects of climate change on the QSR using the same methodology as for 2020. The 2050 weather files employed representative concentration pathways (RCP) 4.5 and 8.5. RCP 4.5, according to the Intergovernmental Panel on Climate Change (IPCC), highlights moderate emissions peaking around 2040 and then decreasing. RCP 8.5 portrays a significant increase in emissions. The objective was to examine how climate change affects the energy demand of the QSR.
Figure 3 illustrates the monthly average Td for 2020 and projected conditions in 2050 under RCP 4.5 and RCP 8.5 scenarios in London, UK.

2.5. Electrical Grid Decarbonisation

This study analysed the impact of the UK’s future EGCI between 2022 and 2050. This was carried out to determine and demonstrate the decarbonisation potential of the baseline scenario (with no technological interventions) and Technology 7, where all the carbon-saving technologies were implemented together. The EGCI for the UK was predicted between 2022 and 2050 and was taken from the UK Department of Energy Security & Net Zero [23] and is presented in Section 2.6.

2.6. TEWI

The TEWI characterises CO2e emissions and is a useful tool to study the impact of systems on global warming. The TEWI combines the direct and indirect emissions of CO2e. The TEWI is shown in Equation (3):
T E W I = G W P × m × L + ( E × β )
where the TEWI is the mass of CO2e produced during a year (kg); G W P × m × L is the direct emissions of CO2e due to refrigerant leakage; ( E × β ) is the indirect emissions of CO2e associated with electrical energy consumption; GWP is the Global Warming Potential of the refrigerant; m is the refrigerant charge of the QSR (kg); L is the leakage rate per year (%/year); E is the electrical energy consumption per year of the QSR (kWh/year); and β is the CO2e equivalent emissions per kWh of electrical energy produced (kg CO2e/kWh), taken from Table 2. A GWP of 1273 (100-year horizon) for R-448A was taken from the IPCC AR5 report [24].
Table 2 summarises the predicted EGCI for the UK between 2022 and 2050.

3. Results and Discussion

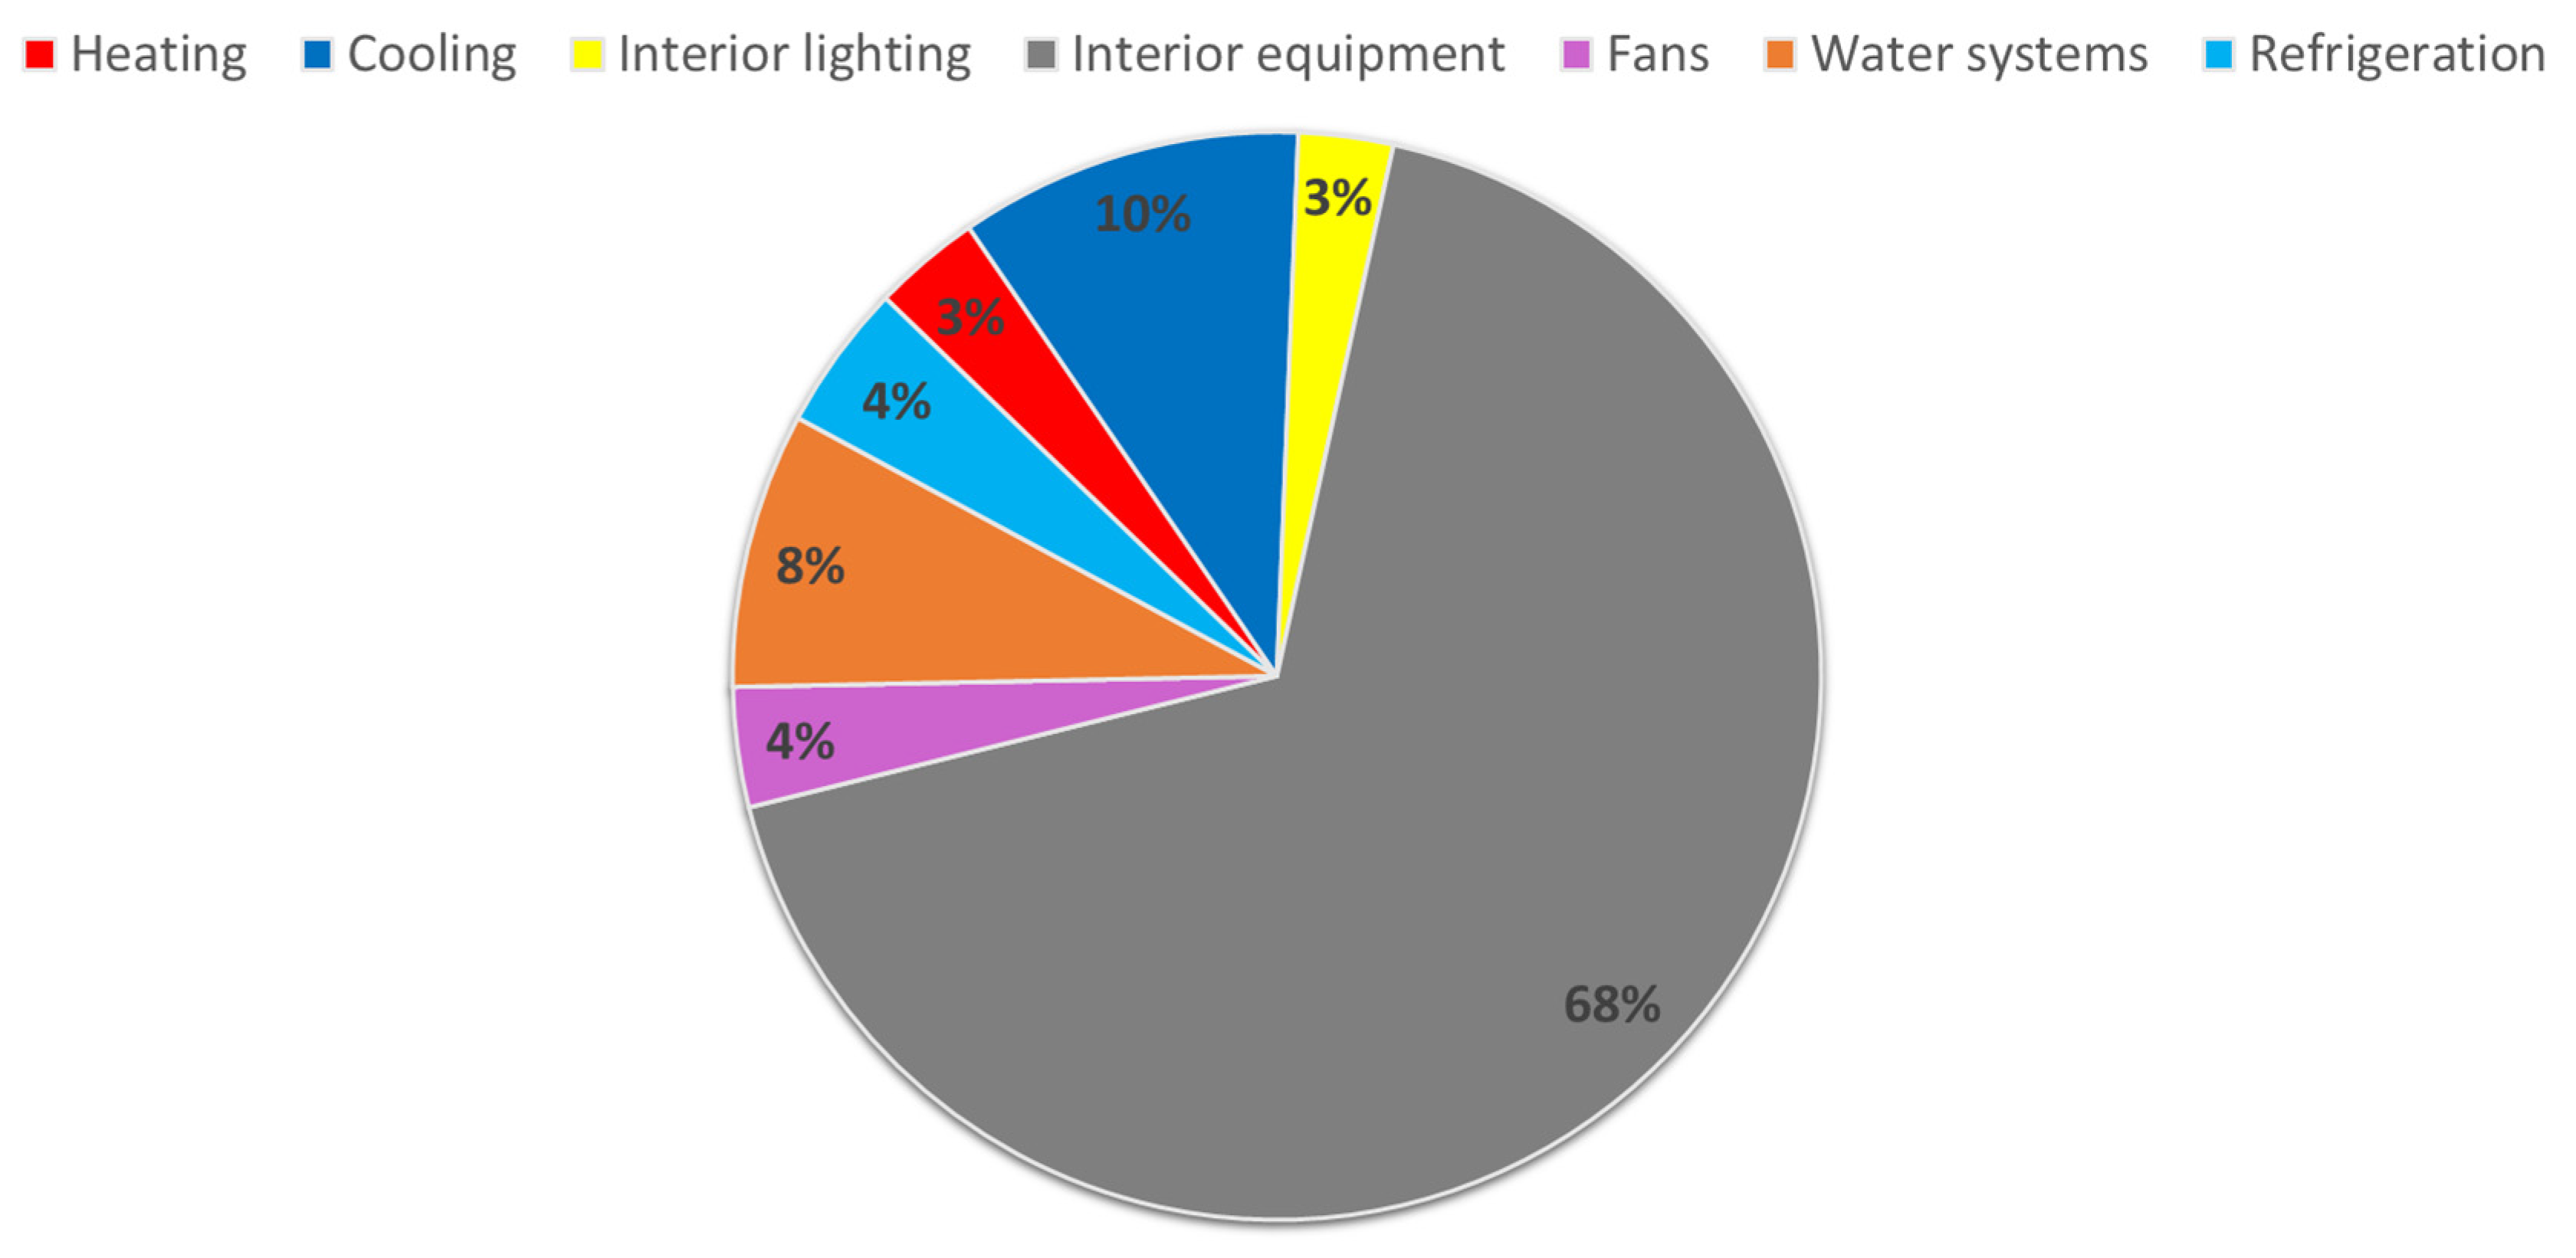
3.1. Baseline Simulation Results

The energy consumption predicted by the model for each month in 2022 was compared to the measured data (Table 3). The reason for the very good alignment between the two total annual energy consumptions is because the electrical equipment load was increased until the two values matched, as stated in Section 2.2.3. While the overall annual energy consumption predicted by the model closely aligns with the measured data, some monthly variations were observed, particularly in March, where the simulated energy consumption was 10.8% higher than the measured values. These discrepancies may be attributed to seasonal operational differences, such as fluctuations in heating/cooling requirements, variations in customer activity, or equipment usage patterns that were not explicitly accounted for in the model. Additionally, since the total energy values represent the entire QSR and only the kitchen equipment load was adjusted, while other loads were based on EnergyPlus ASHRAE defaults, this may have contributed to the observed differences.
Figure 4 presents a detailed monthly energy breakdown, while Figure 5 illustrates the distribution of annual energy consumption across the different energy users in the QSR. The majority of the simulated QSR energy consumption (68% over the year) was consumed by interior equipment, particularly kitchen equipment (for example, a range of cooking, refrigeration, and cleaning equipment). The internal heat loads from this equipment, particularly in the kitchen, meant that cooling rather than heating was required throughout the year, especially during the summer and even in the winter. A negligible amount of heating was observed during the summer months, with a small amount being used between 12 am and 6 am (during the closed period). Refrigeration, though a small portion of the overall energy usage (4%), showed a slight increase in consumption during the summer months due to higher ambient temperatures. The CO2e emissions were predicted to be 88.2 t CO2e in 2022.

3.2. Carbon Reduction Technologies

Table 4 presents the impact of carbon reduction technologies applied individually to the baseline model and then combined to assess their impacts on energy use and carbon emissions.
Technology 1 led to a 17.4% reduction in heating, a 7.4% reduction in cooling, and an 11.6% reduction in fan consumption. Despite this, the overall energy consumption only showed a 1.7% reduction, primarily because interior equipment had the greatest impact on energy usage, accounting for 68% of the QSR’s total energy consumption. Cooling accounted for 10%, heating for 3%, and fans for 4%, which contributed to the minimal reduction. Consequently, the QSR’s TEWI was reduced by 1.7% compared to the baseline.
Technology 2 achieved a 0.5% reduction in CO2e emissions. Despite direct emissions due to refrigerant leakage being reduced by 88%, they originally accounted for only 0.5% of the total emissions.
Technologies 3 and 4 both impacted heating, cooling, and fan energy use. In Technology 3, heating increased by 1.7%, cooling decreased by 10.4%, and fan energy consumption dropped by 5.5%. For Technology 4, heating increased by 3.9%, while cooling and fan energy consumption saw reductions of 20.8% and 11.6%, respectively. Technology 3 resulted in a 7.9% reduction in total energy consumption and carbon emissions, while Technology 4 led to a 15.7% decrease in overall energy consumption and carbon emissions.
Technology 5 resulted in a 74.2% reduction in cooling consumption and a 7.5% decrease in total energy consumption. The cooling usage in the QSR was primarily influenced by the high heat output from the electrical loads in the kitchen, which demanded extensive cooling throughout the year. However, with the addition of an economizer, the necessity for mechanical cooling decreased, especially during colder months. Consequently, the TEWI was reduced by 7.5%.
Technology 6 achieved a 7.2% reduction in annual energy consumption and carbon emissions. The monthly energy savings showed significant seasonal variation. The highest savings were observed in June (13.8%), while the lowest occurred in December (2.3%), highlighting the seasonal impact on solar energy production.
Technology 7 gave a 35.6% reduction in total energy consumption compared to the baseline scenario. Consequently, carbon emissions were reduced by 35.9%.

3.3. Impact of Climate Change

The annual average temperature rises from 11.15 °C in 2020 to 11.66 °C under RCP 4.5 and 12.10 °C under RCP 8.5. As seen in Figure 3, the most significant differences occur during the summer months (June to August), with temperatures rising by 0.5–0.9 °C under RCP 4.5 and 1.2–1.4 °C under RCP 8.5 compared to the 2020 baseline. Table 5 presents the QSR energy consumption when the 2050 weather files were used, compared to 2020. “Others” refers to interior lighting, equipment, fans, and water systems, which remained unchanged. While variations were observed in heating, cooling, and refrigeration energy consumption, the rise in total energy consumption was only 0.02% for the most dramatic climate (RCP 8.5) and 0.04% for the least dramatic (RCP 4.5). This was attributed to the fact that heating, cooling, and refrigeration energy consumption, which should be affected by climate change, constituted a minor proportion (17.8%) of the overall energy use in the QSR. Therefore, climate change had minimal impact on the total annual energy consumption of the QSR in the UK. Similarly, Eid et al. [12] analysed the effect of climate change on a supermarket in Paris from 2020 to 2050 (RCP 4.5) and found that the total energy consumption increased by only 0.37%, indicating a similarly minimal effect on the store in Paris.

3.4. Impact of Electrical Grid Decarbonisation

Changes to the EGCI were applied from 2022 to 2050 (Table 2) to the baseline and Technology 7 models using the 2020 weather file. The predicted CO2e emissions for the baseline QSR decreased significantly from 88.2 t CO2e in 2022 to 2.1 t CO2e in 2050 (a reduction of 97.6%). Similarly, for Technology 7, the emissions reduced from 56.5 t CO2e in 2022 to 1.1 t CO2e in 2050 (a reduction of 98.0%) (Figure 6). The results highlight the potential for achieving near-zero carbon emissions in both scenarios by 2050, either by doing nothing or employing combined technologies. By integrating the 5th-order polynomial equations representing the CO2e emission curves in Figure 6 for both the baseline scenario and Technology 7, cumulative carbon emissions from 2022 to 2050 were calculated. The integration of the baseline scenario yielded 686 t CO2e, reflecting the total emissions over the given period. In comparison, the integration for Technology 7 produced a total of 426 t CO2e. This significant 37.9% reduction in cumulative carbon emissions demonstrated the potential impact of applying more advanced technologies to improve energy efficiency and sustainability in the QSR.

4. Conclusions

The main objective of this work was to model a baseline QSR using EnergyPlus and to analyse the impacts of various carbon reduction technologies. Additionally, it aimed to evaluate the effect of climate change on the energy usage in 2050 and to assess how close to carbon neutrality the QSR could get by 2050, considering the predicted changes to the EGCI from 2022 to 2050. Among the findings are the following:
  • Projections in the UK EGCI achieved a total reduction of 98% in CO2e emissions from 2022 to 2050.
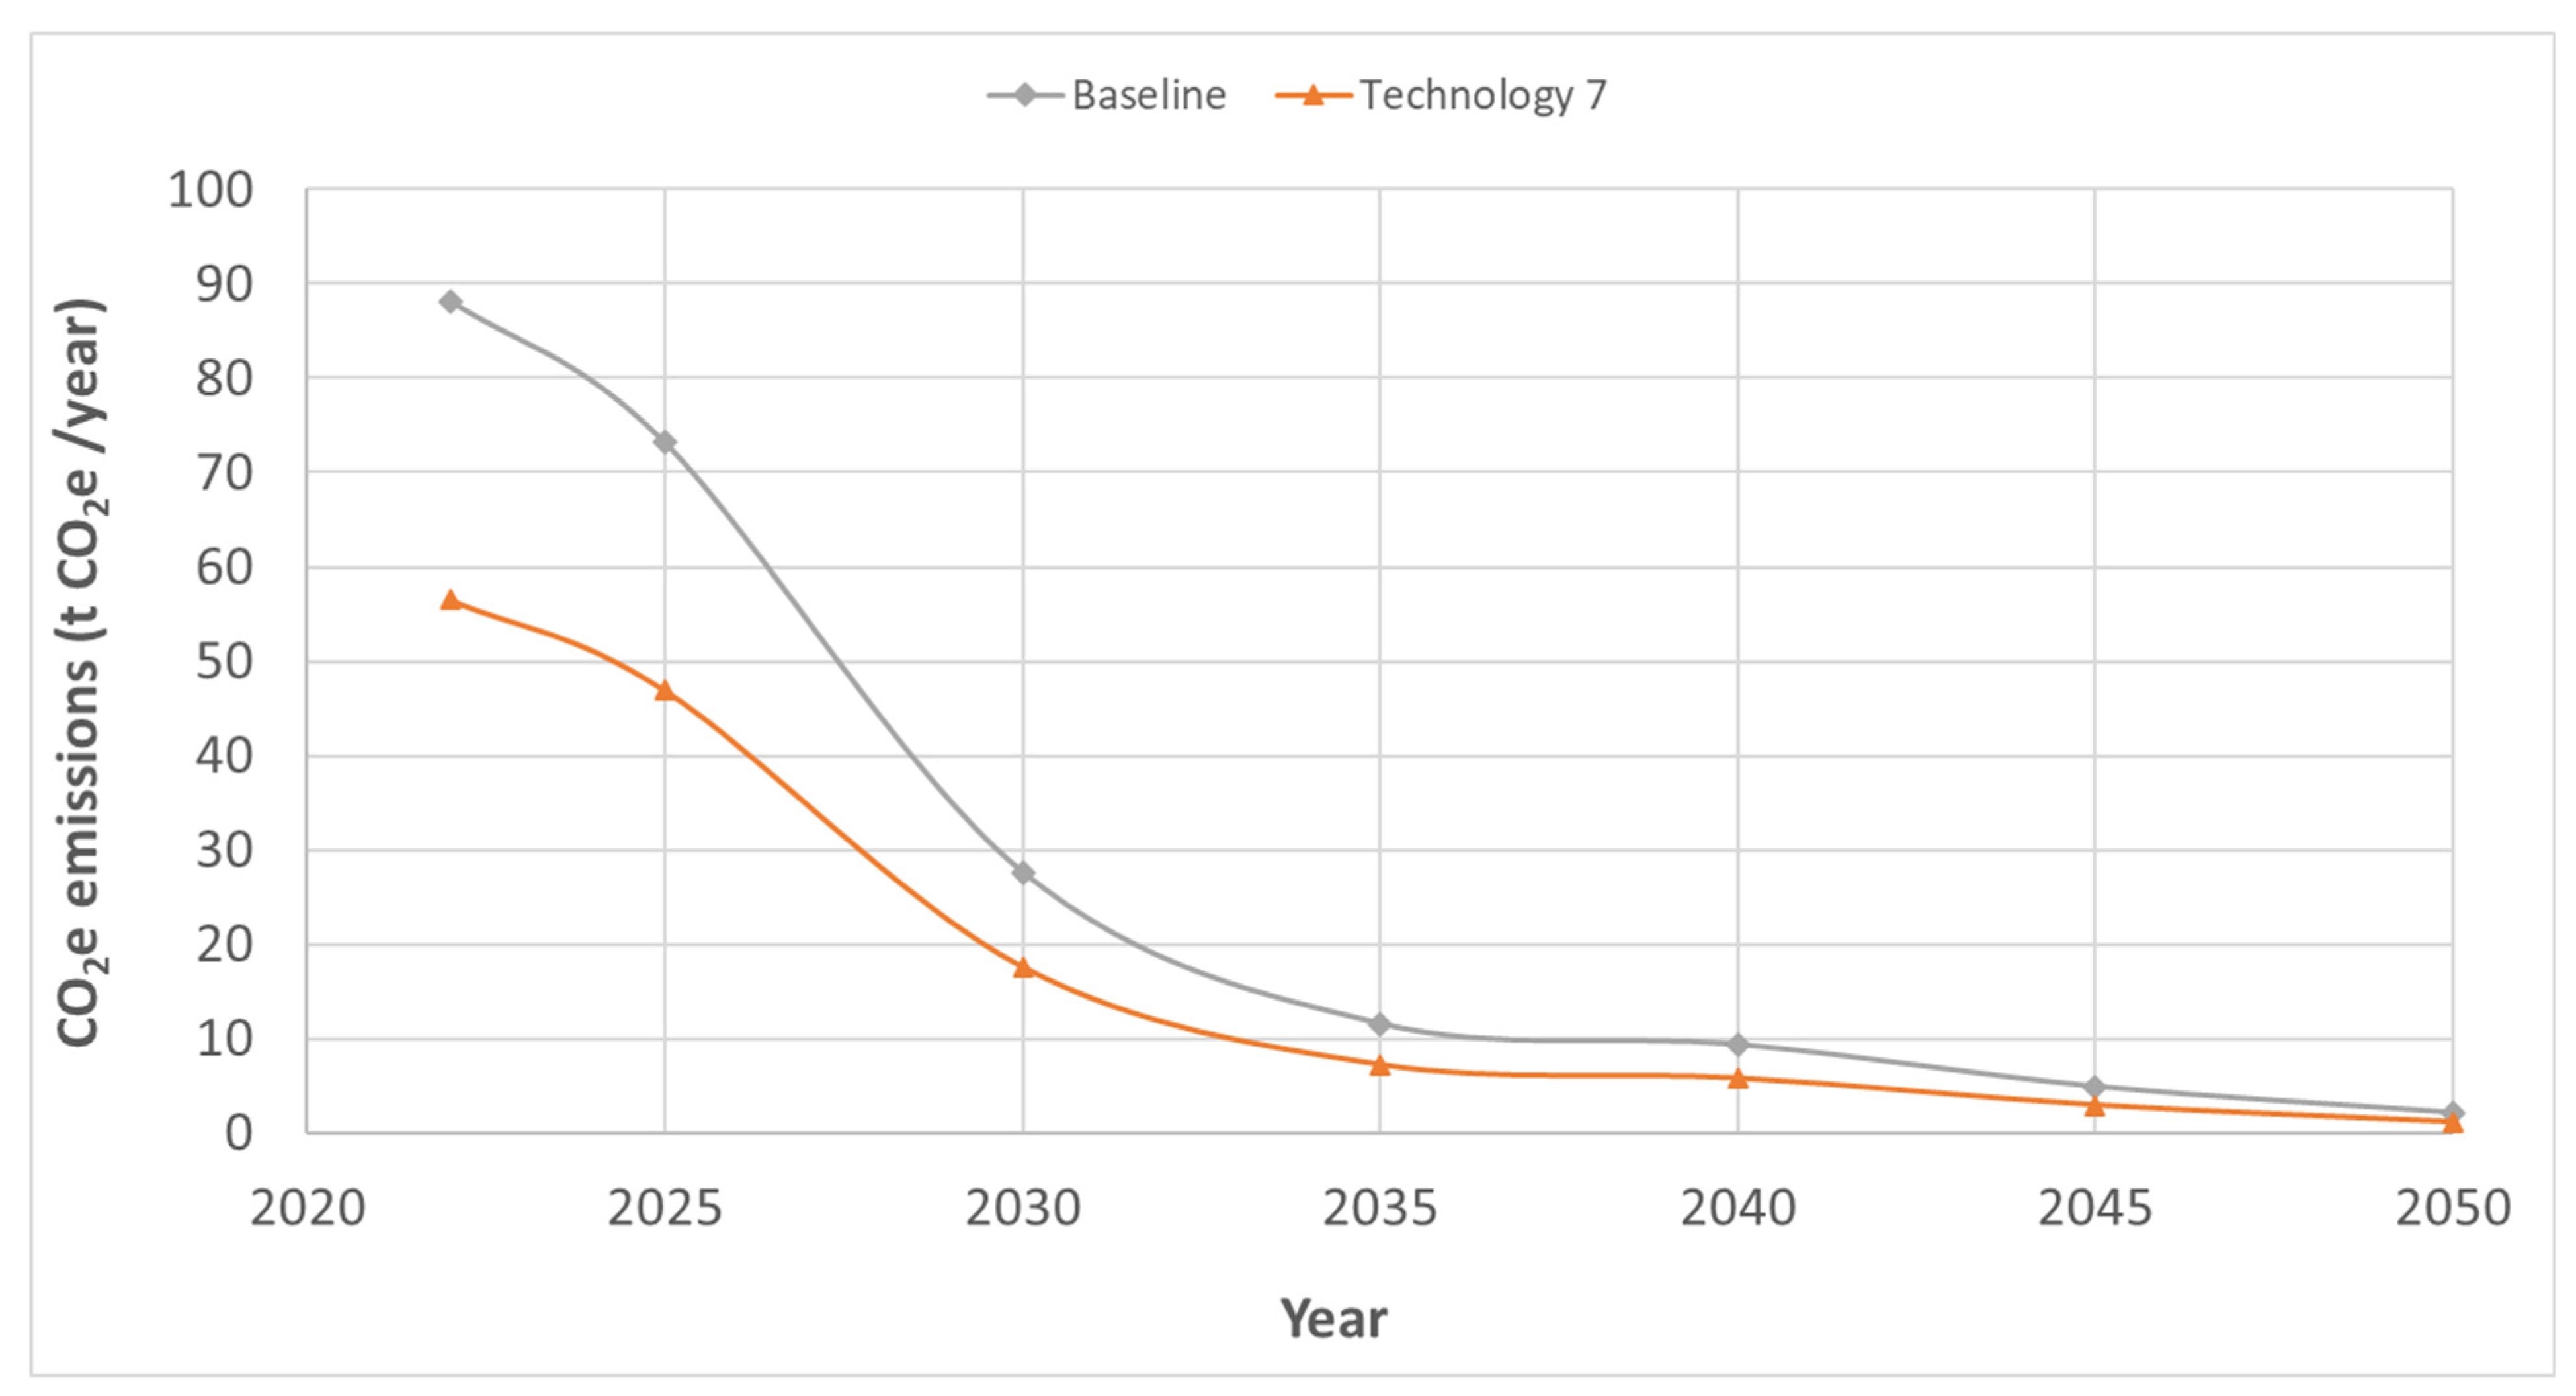
  • The integration of Technology 7 (all the technologies combined) achieved a substantial 35.9% decrease in CO2e emissions.
  • Implementing 20% higher efficiency equipment resulted in a 15.7% reduction in CO2e emissions, while 10% more efficient equipment led to a 7.9% reduction.
  • Incorporating economizers into HVAC systems significantly reduced cooling consumption by 74.2%, resulting in a 7.5% decrease in CO2e emissions.
  • Adding solar panels to the QSR’s roof contributed to a 7.2% reduction in CO2e emissions, demonstrating the feasibility of solar PV technology even in regions far from the equator.
  • Increasing the deadband temperature of the QSR by 2 K resulted in a 1.7% reduction in carbon emissions.
  • The use of a low GWP refrigerant had a minimal impact on emissions, reducing them by only 0.5% due to the small refrigerant charge in the cold stores.
  • The impact of climate change on the total annual energy consumption in the QSR of the UK was minimal, with increases of only 0.02% under RCP 8.5 and 0.04% under RCP 4.5.
  • Kitchen equipment was identified as the largest contributor to energy usage in the QSR.
It was clear that without implementing any technologies, the QSR could potentially reach near-zero carbon emissions by 2050 purely through the projected changes in the EGCI. However, delaying or failing to implement these technologies would result in higher cumulative carbon emissions. Adopting all technologies led to a considerable 37.9% decrease in cumulative carbon emissions compared to the baseline, emphasising its importance for long-term environmental benefits. This underscores the significance of initiating technology implementations as soon as possible to reduce cumulative emissions and ensure energy savings.
Although this study provides valuable insights into carbon reduction strategies for QSRs, further research is needed to enhance and expand these findings. Future research could investigate a broader range of carbon reduction technologies and improve the accuracy of QSR energy modelling by integrating more real-time operational data, including detailed monthly energy metrics. Additionally, a dynamic assessment of the effect of solar power on imported and exported power could provide deeper insights into renewable energy integration. Linking equipment efficiency to predicted future efficiencies would also help refine long-term energy consumption forecasts. Moreover, better data, particularly on kitchen equipment loads, would improve model precision. While this study focused on a single UK QSR, expanding the modelling approach to various QSR layouts would help generalise the findings and allow for broader applicability and validation. Addressing these areas in future research can refine and enhance carbon reduction strategies for QSRs, supporting a more effective transition toward sustainability in the food service sector.

Author Contributions

Conceptualization, E.E., A.F. and J.E.; methodology, E.E., A.F. and J.E.; software, E.E.; validation, E.E.; formal analysis, E.E.; investigation, E.E. and R.C.; data curation, E.E.; writing—original draft preparation, E.E.; writing—review and editing, E.E., A.F., G.A. and J.E.; supervision, A.F. and J.E.; project administration, J.E.; funding acquisition, J.E. All authors have read and agreed to the published version of the manuscript.

Funding

The work within this paper received funding from the European Union’s Horizon 2020 research and innovation programme under grant agreement No. 101036588 and UK Engineering and Physical Sciences Research Council (EPSRC) grant (EP/V042548/1).

Data Availability Statement

The original contributions presented in the study are included in the article, further inquiries can be directed to the corresponding author.

Conflicts of Interest

The authors declare no conflicts of interest.

Nomenclature

Abbreviations
ANLArgonne National Laboratory
ASHRAEAmerican Society of Heating, Refrigeration and Airconditioning Engineers
BEESBuilding Energy Efficiency Survey
BEISBusiness, Energy and Industrial Strategy
COPCoefficient Of Performance
CO2Carbon Dioxide
DXDirect expansion
EGCIElectrical grid carbon intensity
EUEuropean Union
EUIEnergy use intensity
GHGGreenhouse gas
GWPGlobal Warming Potential
HVACHeating, ventilation, and air conditioning
IPCCIntergovernmental Panel on Climate Change
LBNLLawrence Berkeley National Laboratory
LTLow temperature
MTMedium temperature
NGNatural Gas
NRELNational Renewable Energy Laboratory
ORNLOak Ridge National Laboratory
PVPhotovoltaic
PNNLPacific Northwest National Laboratory
PRHPPackaged rooftop heat pump
PTHPPackaged terminal heat pump
QSRQuick-service restaurant
RCPRepresentative concentration pathway
TEWITotal equivalent warming impact
UKUnited Kingdom
Greek Symbol
βIndirect emission factor [kg CO2e/kWh]
Symbols
EElectrical consumption [kWh/year]
LLeakage rate [%/year]
mRefrigerant charge [kg]
TTemperature [°C]
UHeat transfer coefficient [W/m2.K]
Subscripts
cCooling
dDry bulb
hHeating
rRated conditions
TTemperature
wWet bulb

References

  1. Poore, J.; Nemecek, T. Reducing food’s environmental impacts through producers and consumers. Science 2018, 360, 987–992. [Google Scholar] [CrossRef] [PubMed]
  2. Crippa, M.; Solazzo, E.; Guizzardi, D.; Monforti-Ferrario, F.; Tubiello, F.N.; Leip, A.J.N.F. Food systems are responsible for a third of global anthropogenic GHG emissions. Nat. Food 2021, 2, 198–209. [Google Scholar] [CrossRef] [PubMed]
  3. Foster, A.; Brown, T.; Evans, J. Carbon emissions from refrigeration used in the UK food industry. Int. J. Refrig. 2023, 150, 297–303. [Google Scholar]
  4. UNOX. Energy Savings and Lower CO2 Emissions in Catering: The 5 Steps That Can Reduce the Carbon Footprint of Your Business. 2023. Available online: https://www.unox.com/en_gb/blog/reduce-carbon-footprint-of-business-in-5-steps/ (accessed on 13 November 2023).
  5. CIBSE. Guide F Energy Efficiency in Buildings; The Chartered Institution of Building Services Engineers (CIBSE): London, UK, 2012. [Google Scholar]
  6. Mudie, S.A.; Essah, E.; Grandison, A.; Felgate, R. Benchmarking energy use in licensed restaurants and pubs. In Proceedings of the CIBSE Technical Symposium, Liverpool, UK, 11–12 April 2013. [Google Scholar]
  7. Gunasegaran, M.K.; Hasanuzzaman, M.; Tan, C.; Bakar, A.H.A.; Ponniah, V. Energy Consumption, Energy Analysis, and Solar Energy Integration for Commercial Building Restaurants. Energies 2023, 16, 7145. [Google Scholar] [CrossRef]
  8. Statista. Market Size of the Quick Service Restaurant Industry Worldwide in 2022 and 2023. 2023. Available online: https://www.statista.com/statistics/1186194/fast-food-restaurant-industry-market-size-global/ (accessed on 2 May 2024).
  9. Hai, T.; Alenizi, F.A.; Mohammed, A.H.; Singh, P.K.; Metwally, A.S.M.; Ullah, M. Optimal design modeling of an energy system for a near-zero energy restaurant with green hydrogen energy storage systems. Fuel 2023, 351, 128896. [Google Scholar] [CrossRef]
  10. Uddin, M.N.; Ruva, I.J.; Syed, M.A.; Hossain, D.; Akter, R.; Tamanna, N.; Rahman, A.; Saka, A. Occupant centric energy renovation strategy for hospital and restaurant building envelop using distinct modellingtools: A case study from low-income cultural context. Energy Build. 2022, 272, 112338. [Google Scholar] [CrossRef]
  11. Lollini, R.; Danza, L.; Meroni, I. Energy efficiency of a dynamic glazing system. Sol. Energy 2010, 84, 526–537. [Google Scholar] [CrossRef]
  12. Eid, E.; Foster, A.; Alvarez, G.; Ndoye, F.-T.; Leducq, D.; Evans, J. Modelling energy consumption in a Paris supermarket to reduce energy use and greenhouse gas emissions using EnergyPlus. Int. J. Refrig. 2024, 168, 1–8. [Google Scholar] [CrossRef]
  13. Eid, E.; Foster, A.; Alvarez, G.; Campbell, R.; Evans, J. Modelling of energy use and greenhouse gas emissions from a quick service restaurant. In Proceedings of the 8th IIR International Conference on Sustainability and the Cold Chain 2024, Tokyo, Japan, 9 June–11 July 2024. [Google Scholar] [CrossRef]
  14. U.S. Department of Energy. EnergyPlus Version 24.1.0 Documentation. Engineering Reference. 2024. Available online: https://energyplus.net/assets/nrel_custom/pdfs/pdfs_v24.1.0/EngineeringReference.pdf (accessed on 5 May 2024).
  15. Department for Business, Energy & Industrial Strategy. Building Energy Efficiency Survey BEES: Hospitality Sector, 2014–15; Department for Business, Energy & Industrial Strategy: London, UK, 2016.
  16. Dickinson, R.; Brannon, B. Generating future weather files for resilience. In Proceedings of the International Conference on Passive and Low Energy Architecture, Los Angeles, CA, USA, 11–13 July 2016; pp. 11–13. [Google Scholar]
  17. Foster, A.; Hammond, E.; Brown, T.; Maidment, G.; Evans, J. Technological Options for Retail Refrigeration; International Institute of Refrigeration/London South Bank University: London, UK, 2018. [Google Scholar]
  18. Goel, S.; Rosenberg, M.I.; Eley, C. Ansi/Ashrae/Ies Standard 90.1-2016 Performance Rating Method Reference Manual (No. PNNL-26917); Pacific Northwest National Lab (PNNL): Richland, WA, USA, 2017. [Google Scholar]
  19. Emerson. CO2 Product Guide 2021 for Refrigeration Applications. 2021. Available online: https://media.copeland.com/693d2049-68af-411e-8b72-b16b010424f7/TGE175-CO2-Product-Guide-EN-2102.pdf (accessed on 13 August 2022).
  20. Petersen, M.; Pottker, G.; Sethi, A.; Yana Motta, S.F. Refrigerants with Low Environmental Impact for Commercial Refrigeration Systems. In Proceedings of the International Refrigeration and Air Conditioning Conference, West Lafayette, IN, USA, 9–12 July 2018. [Google Scholar]
  21. Brown, P.; Cardenas, L.; Choudrie, S.; Del Vento, S.; Karagianni, E.; MacCarthy, J.; Mullen, P.; Passant, N.; Richmond, B.; Smith, H.; et al. UK Greenhouse Gas Inventory, 1990 to 2019, Annual Report for Submission under the Framework Convention on Climate Change 2021; Ricardo Energy & Environment: Oxford, UK, 2021; ISBN 978-0-9933975-7-8. [Google Scholar]
  22. Gagnon, P.; Margolis, R.; Melius, J.; Phillips, C.; Elmore, R. Rooftop Solar Photovoltaic Technical Potential in the United States. A Detailed Assessment (No. NREL/TP-6A20-65298); National Renewable Energy Lab (NREL): Golden, CO, USA, 2016. [Google Scholar]
  23. UK Department for Energy Security & Net Zero. Green Book Supplementary Guidance: Valuation of Energy Use and Greenhouse Gas Emissions for Appraisal. 2023. Available online: www.gov.uk (accessed on 8 March 2024).
  24. IPCC. Climate Change: The Physical Science Basis. Contribution of Working Group I to the Fifth Assessment Report of the Intergovernmental Panel on Climate Change; Stocker, T.F., Qin, D., Plattner, G.-K., Tignor, M., Allen, S.K., Boschung, J., Nauels, A., Xia, Y., Bex, V., Midgley, P.M., Eds.; Cambridge University Press: Cambridge, UK; New York, NY, USA, 2013; p. 1535. Available online: https://www.ipcc.ch/report/ar5/wg1/ (accessed on 12 December 2023).
Figure 1. Geometry of the QSR with its space types, adapted from [13].
Energies 18 01377 g001
Figure 2. Chiller and freezer refrigeration DX systems.
Energies 18 01377 g002
Figure 3. Monthly average Td from 2020 and 2050 weather files in London, UK.
Energies 18 01377 g003
Figure 4. Monthly energy breakdown of the QSR.
Energies 18 01377 g004
Figure 5. Percentage breakdown of the annual energy consumption in the QSR, adapted from [13].
Energies 18 01377 g005
Figure 6. Predicted CO2e emissions in the UK QSR from 2022 to 2050.
Energies 18 01377 g006
Table 2. Predicted EGCI for the UK.
2022202520302035204020452050
β U K   (kg CO2e/kWh)0.1580.1310.0490.0200.0160.0080.003
Table 3. Monthly data of the measured and simulated UK QSR [13].
MonthMeasured Data (kWh)Simulated Data (kWh)% Difference
Jan45,33847,3624.5%
Feb41,34043,0034.0%
Mar42,09846,64610.8%
Apr47,90045,307−5.4%
May48,34547,064−2.6%
Jun45,86045,794−0.1%
Jul51,76348,122−7.0%
Aug50,59747,761−5.6%
Sep46,01045,440−1.2%
Oct45,86546,6281.7%
Nov44,21045,1932.2%
Dec46,05147,2942.7%
Total555,377555,6140.04%
Table 4. Annual energy consumption with various applied technologies, categorised by energy use components.
TechnologyBaseline1234567
Energy consumption (MWh/year)
Heating17.814.717.818.118.518.117.816.0
Cooling56.652.456.650.744.814.656.68.8
Interior lighting15.615.615.615.615.615.615.615.6
Interior equipment376.1376.1376.1341.3307.3376.1376.1279.8
Fans19.817.519.818.717.519.819.814.6
Water systems45.545.545.545.545.545.545.545.5
Refrigeration24.224.224.221.819.424.224.217.4
Solar PV panels------−40.1−40.1
Total555.6546.0555.6511.7468.6513.9515.5357.6
TEWI (t CO2e/year)
88.286.787.881.274.481.681.956.5
% Reduction in CO2e emissions compared to the baseline-1.70.57.915.77.57.235.9
Table 5. Differences in the QSR energy use using the 2050 weather files compared to the baseline, adapted from [13].
Energy Consumption (MWh/Year)
20202050 (RCP 4.5)2050 (RCP 8.5)
% Change % Change
Heating17.816.5−7.30%15.1−15.17%
Cooling56.657.92.30%59.14.42%
Refrigeration24.224.40.83%24.51.24%
Others457.0457.00.00%457.00.00%
Total555.6555.80.04%555.70.02%
Disclaimer/Publisher’s Note: The statements, opinions and data contained in all publications are solely those of the individual author(s) and contributor(s) and not of MDPI and/or the editor(s). MDPI and/or the editor(s) disclaim responsibility for any injury to people or property resulting from any ideas, methods, instructions or products referred to in the content.

