1. Introduction
1.1. Background
The growing need for sustainable energy solutions has accelerated the global shift towards renewable energy sources, driven primarily by concerns about greenhouse gas emissions, climate change, and the depletion of fossil fuels. The International Renewable Energy Agency (IRENA) [
1] predicts that renewables will dominate the global electricity market. Among the various renewable energy technologies, solar photovoltaic (PV) systems hold the most promise, because they can be adapted to meet small- and large-scale energy demands and play a key role in reducing carbon emissions and dependence on fossil fuels [
2]. In spite of its immense potential, solar PV energy faces significant challenges due to its intermittent and non-linear nature. The power output of PV systems is heavily influenced by meteorological factors, such as solar irradiance, temperature, wind speed, and humidity [
3]. These factors are inherently variable and stochastic. This variability has implications for energy planning, grid stability, and real-time energy management. As a result, accurate forecasting of solar PV power output has become critical to balancing energy supply and demand, minimizing grid instability and avoiding market penalties caused by fluctuations in power generation [
4]. Moreover, accurate forecasting is critical in modern energy systems to help grid operators manage real-time energy distribution, load balancing, and power stabilization [
5]. In decentralized smart grid systems, it is equally important for optimizing energy storage, managing energy exchanges, and increasing the efficiency of self-consumption [
6].
Forecasting techniques are generally divided into direct (data-driven) and indirect (weather-based) approaches, the suitability of which depends on the forecast horizon and the specific characteristics of the system [
7]. Within the direct approach, forecasts can be made using traditional methods or machine learning techniques [
8]. Traditional methods, such as physical and statistical models, often struggle to accurately capture the complex, non-linear relationships between meteorological variables and PV system performance [
9]. Recent advances have shifted the focus to machine learning (ML)-based methods, which excel at modelling dynamic and intricate relationships within large datasets [
2,
10,
11]. Compared to traditional approaches, ML techniques have demonstrated significant improvements in prediction accuracy. By using historical weather data and real-time PV system performance, these models can effectively predict power generation under different environmental conditions [
12].
1.2. Techniques in PV Power Prediction
Data-driven approaches to photovoltaic power forecasting use different methodologies. For example, study [
8] uses a NARX (non-linear autoregressive network) to predict the short-term PV power and battery state of charge (SoC), achieving high accuracy (R-values: 0.9969–0.9971 for PV power and 0.9990–0.9996 for SoC) with low MSE. Predictions at 5 min intervals optimize energy management in an off-grid solar EV charging station, integrating the 3Ds (Decarbonization, Digitalization, and Decentralization) energy model to improve renewable energy use and grid reliability. A study referenced in [
5] proposed a hybrid deep learning framework that integrates convolutional neural networks (CNNs) with attention-based long short-term memory (A-LSTM) networks and an autoregressive (AR) model. The proposed model shows superior performance when compared to other state-of-the-art models for the prediction of solar photovoltaic (PV), solar thermal, and wind power generation. Study [
13] addresses PV power predictions for new sites with limited data. The proposed ADCNN-BiLSTM model reconstructs the input data using an LSTM-based attention mechanism, extracts spatial/temporal features, and maps them to the PV power predictions. The paper [
14] proposes a deep learning model for short-term PV power predictions using a CNN-LSTM network and spatio-temporal feature fusion. It enhances accuracy through the integration of data from correlated stations and meteorological inputs, validated by real-world analysis.
Based on previous studies, machine learning and deep learning can be used to predict PV power. Some studies suggest improving these methods by clustering input data to increase speed and accuracy. For example, reference [
15] proposed a clustering-based approach that grouped days by weather conditions and improved the accuracy of PV power predictions compared to non-clustering and statistical models. In another approach, using a clustering solution to improve PV power forecasting, a study in reference [
16] explores clustering-based methods to enhance short-term photovoltaic (PV) power generation forecasting. The authors employ weather condition clustering, specifically using the K-means algorithm, to group data samples based on meteorological features, such as temperature, humidity, and wind speed. The findings demonstrate that clustering-based models outperform single general models, particularly in regions with varying weather conditions, highlighting the potential of combining clustering and machine learning for reliable renewable energy forecasting. Reference [
17] demonstrates that hybrid hierarchical K-means clustering improves the segmentation of the data and shows that a multi-phase hybrid approach improves the prediction of solar PV power and reduces the errors through machine learning. A summary of this literature work can be seen in
Table 1.
1.3. Objectives and Novelty
This study investigates the effectiveness of machine learning models in predicting PV power generation, with a particular focus on how clustering techniques improve prediction accuracy. The primary objective is to predict PV power output based on weather data, where the forecast horizon is determined by the availability of weather forecasts. Trained on historical PV power and weather data at 1 h intervals, the models generate forecasts for multiple time horizons, including short-term (1 h ahead) forecasts, medium-term (3 h and 6 h ahead) forecasts, and day-ahead (24 h ahead) forecasts, depending on the weather forecast data provided to the model. By identifying the most effective machine learning model and evaluating its integration with clustering methods, this study aims to optimize forecast accuracy over different time horizons and different input data characteristics.
Based on the defined objectives, our work is divided into two stages. In the first stage, we explore the potential of advanced machine learning (ML) models for short-term solar PV power prediction. These models include support vector machines (SVMs), random forests, decision trees, and multilayer perceptron (MLP) networks. Their performance is evaluated based on prediction accuracy, taking into account the challenges posed by solar intermittency. The final step in this phase is to select the best performing model for further optimization. In the second stage, we implement clustering techniques to segment the input weather dataset, grouping similar data points to create subset datasets based on assigned clusters. For each of the clusters, we develop an individual prediction model using the best performing architecture that was identified in the first step. The primary objective of this workflow is to assess whether the clustering approach improves model performance. Improved forecast accuracy, enhanced grid reliability, and optimized use of renewable energy are the expected outcomes of this research. Ultimately, this research will contribute to the transition towards clean energy systems by enabling more efficient integration of solar PV into existing power grids and the promotion of sustainable energy management.
The rest of this paper is organized as follows: a brief description of the dataset and machine learning is presented in
Section 2, the details of the proposed methodology are outlined in
Section 3, and
Section 4 presents the results and discussion, and the last section summarizes the conclusions of this paper.
2. Dataset and Machine Learning Model
2.1. Dataset
The primary objective of this study is to predict PV power generation based on available weather data. Therefore, the collection of a relevant dataset was crucial. In this research, we used two datasets that combine PV power production data from a solar PV installation with measured weather parameters. Both datasets are measured at Palermo. Previous research has shown that weather parameters have a significant impact on the power output of PV systems. Key factors include temperature; solar radiation (insolation, direct radiation, and diffuse radiation); cloud cover; wind speed; humidity; air pressure; solar elevation; precipitation; UV index; and dew point. However, due to certain limitations, this study focuses on only a subset of the weather parameters available in the dataset. Specifically, in addition to PV power generation data, it includes solar irradiance (insolation, direct, and diffuse); solar elevation; temperature; and wind speed.
The dataset was recorded at hourly intervals over a period of 16 years, from 1 January 2005 to 31 December 2020. The PV system used in this study was installed at an elevation of 57 meters above sea level, with a tilt angle of 38 degrees and an azimuth angle of 0 degrees. It has a rated power of 1 kWp and an estimated system loss of 14%. To ensure a comprehensive understanding of the influencing factors, this dataset serves as the basis for analyzing the relationship between selected weather variables and PV power generation.
Table 2 provides an example of the dataset, showing all the variables recorded at hourly intervals for this study, along with a detailed description below.
Time: time recorded at 1 h intervals;
P: PV system power (W);
Gb(i): beam (direct) irradiance on the inclined plane (plane of the array) (W/m2);
Gd(i): diffuse irradiance on the inclined plane (plane of the array) (W/m²);
Gr(i): reflected irradiance on the inclined plane (plane of the array) (W/m²);
H_sun: sun elevation (degree);
T2m: 2 m air temperature (degree Celsius);
WS10m: 10 m total wind speed (m/s).
2.2. Machine Learning Model
This section provides a comprehensive description of the algorithms used in this study. It is divided into two subsections. The first subsection deals with the clustering algorithm. The clustering algorithm groups weather data and PV power generation based on the similarity of their characteristics. The second subsection describes the predictive model used in this study, specifically multilayer perceptron (MLP) for predicting PV power generation. A detailed explanation of these algorithms is given in the following sections.
2.2.1. K-means Clustering
Clustering is a fundamental technique in data science. It is used to identify patterns, discover relationships, and segment data into meaningful groups without pre-defined labels. Among the various clustering algorithms available, K-means clustering stands out as one of the most widely used methods in a wide range of domains due to its simplicity, efficiency, and effectiveness. The standard K-means algorithm requires the calculation of the distance between each data point and the centroids of all the clusters at each iteration [
18]. The algorithm of K-means clustering work is in an iterative process, and the first step is to define the number of Ks as the optimal number of clusters in which we will group the data. Then, centroids are initialized by selecting random data points for each cluster. Each data object is then assigned to the nearest cluster center. This is typically determined using the Euclidean distance (see Equation (1)) to measure the proximity between data points and cluster centers. Once all data objects have been assigned, this phase is complete, resulting in an initial grouping. The algorithm then recalculates the centroids by averaging the data points within each cluster. This iterative process continues until the objective function converges to its minimum value. In Equation (1),
represents the Euclidean distance (or straight-line distance) between two points, X and Y. The coordinates
define the first point in a k-dimensional space, while
represent the coordinates of the second point in the same space.
In this study, rather than relying on random selection of the number of Ks as the optimal number of clusters as previously described, we used the elbow method as a visual approach to determine the optimal number of clusters for the K-means algorithm. This method examines the relationship between the number of clusters and the within-cluster sum of squares (WCSSs), which is a measure of the variance within each cluster. To implement this, we used the Clustering Visualizer provided by the Yellowbrick library [
19], and after obtaining the desired number of clusters, we could implement it into the K-means algorithm. In this study, we used the K-means algorithm provided by the scikit learn library [
20,
21]. The implementation and detail process of this approach is presented in the Algorithm 1 below.
| Algorithm 1: Elbow method and K-means clustering |
| # Elbow Method to Determine Optimal Number of Clusters |
| Input | Weather data |
| Output | Graphical plot for the elbow method and the optimal number of clusters |
| Algorithm steps | Build K-Means Algorithm: Use the K-means clustering method. Integrate Visualization Tool: Utilize the Yellowbrick library to generate the elbow plot. Input Data and Range: Provide the weather data and the specified range of k values to the algorithm. Generate Output: Plot the elbow curve, identify the “elbow point” (optimal k), and return the optimal number of clusters.
|
| # Assign Cluster Labels Using K-means Clustering |
| Input | Weather data |
| Output | Cluster labels for each data point |
| Algorithm steps | Initialize: Specify the desired number of clusters (k) based on the elbow method results. Build K-means Algorithm: Set up and configure the K-means clustering model. Fit the Model: Train the K-means algorithm on the input weather data. Assign Labels: Generate and assign cluster labels to each data point of weather data and PV power output data.
|
| End Process | |
2.2.2. Multilayer Perceptron Model
Multilayer perceptron (MLP) is a feed-forward neural network. It is widely used in machine learning, particularly for regression and classification tasks. By capturing complex relationships between both linear and non-linear features in the data, this model generates outputs from inputs. It follows a hierarchical structure that consists of three basic layers: the input layer, the hidden layers, and the output layer. The computational process takes place within the neurons of the hidden and output layers, following the mathematical operation outlined in Equation (2) to produce the output (
y). In this equation,
f(.) represents the activation function, while
j denotes the index of the input features, ranging from 1 to
n, where
n is the total number of input features. The weight assigned to the
j-th input is represented by
wj, and
Xj corresponds to the
j-th input feature. In addition,
b is the bias term, which contributes to the shifting of the activation function in order to improve the learning efficiency.
In this study, we used a multilayer perceptron (MLP) model for a regression task. The model was implemented using the Keras library [
22], and the detailed architecture of this model is presented in
Table 3. In the technical workflow, the model takes a weather dataset as input and produces PV power generated as output. The underlying dataset is structured with X representing weather-related features and Y corresponding to PV power values. Further details of this process will be the subject of discussion in the next subsection.
3. Proposed Methodology
In this section, we present a detailed explanation of the proposed methodology for the prediction of PV power generation using a weather-related feature dataset. The availability of forecast weather data determines the prediction time horizon. The model is used to generate predictions for different time horizons by training the model on historical PV power and weather data recorded at 1 h intervals. In particular, based on the available forecast data, the model predicts the PV power for 1 h ahead (short-term), 3 h ahead, 6 h ahead, and 24 h ahead (day ahead), depending on available forecast weather data.
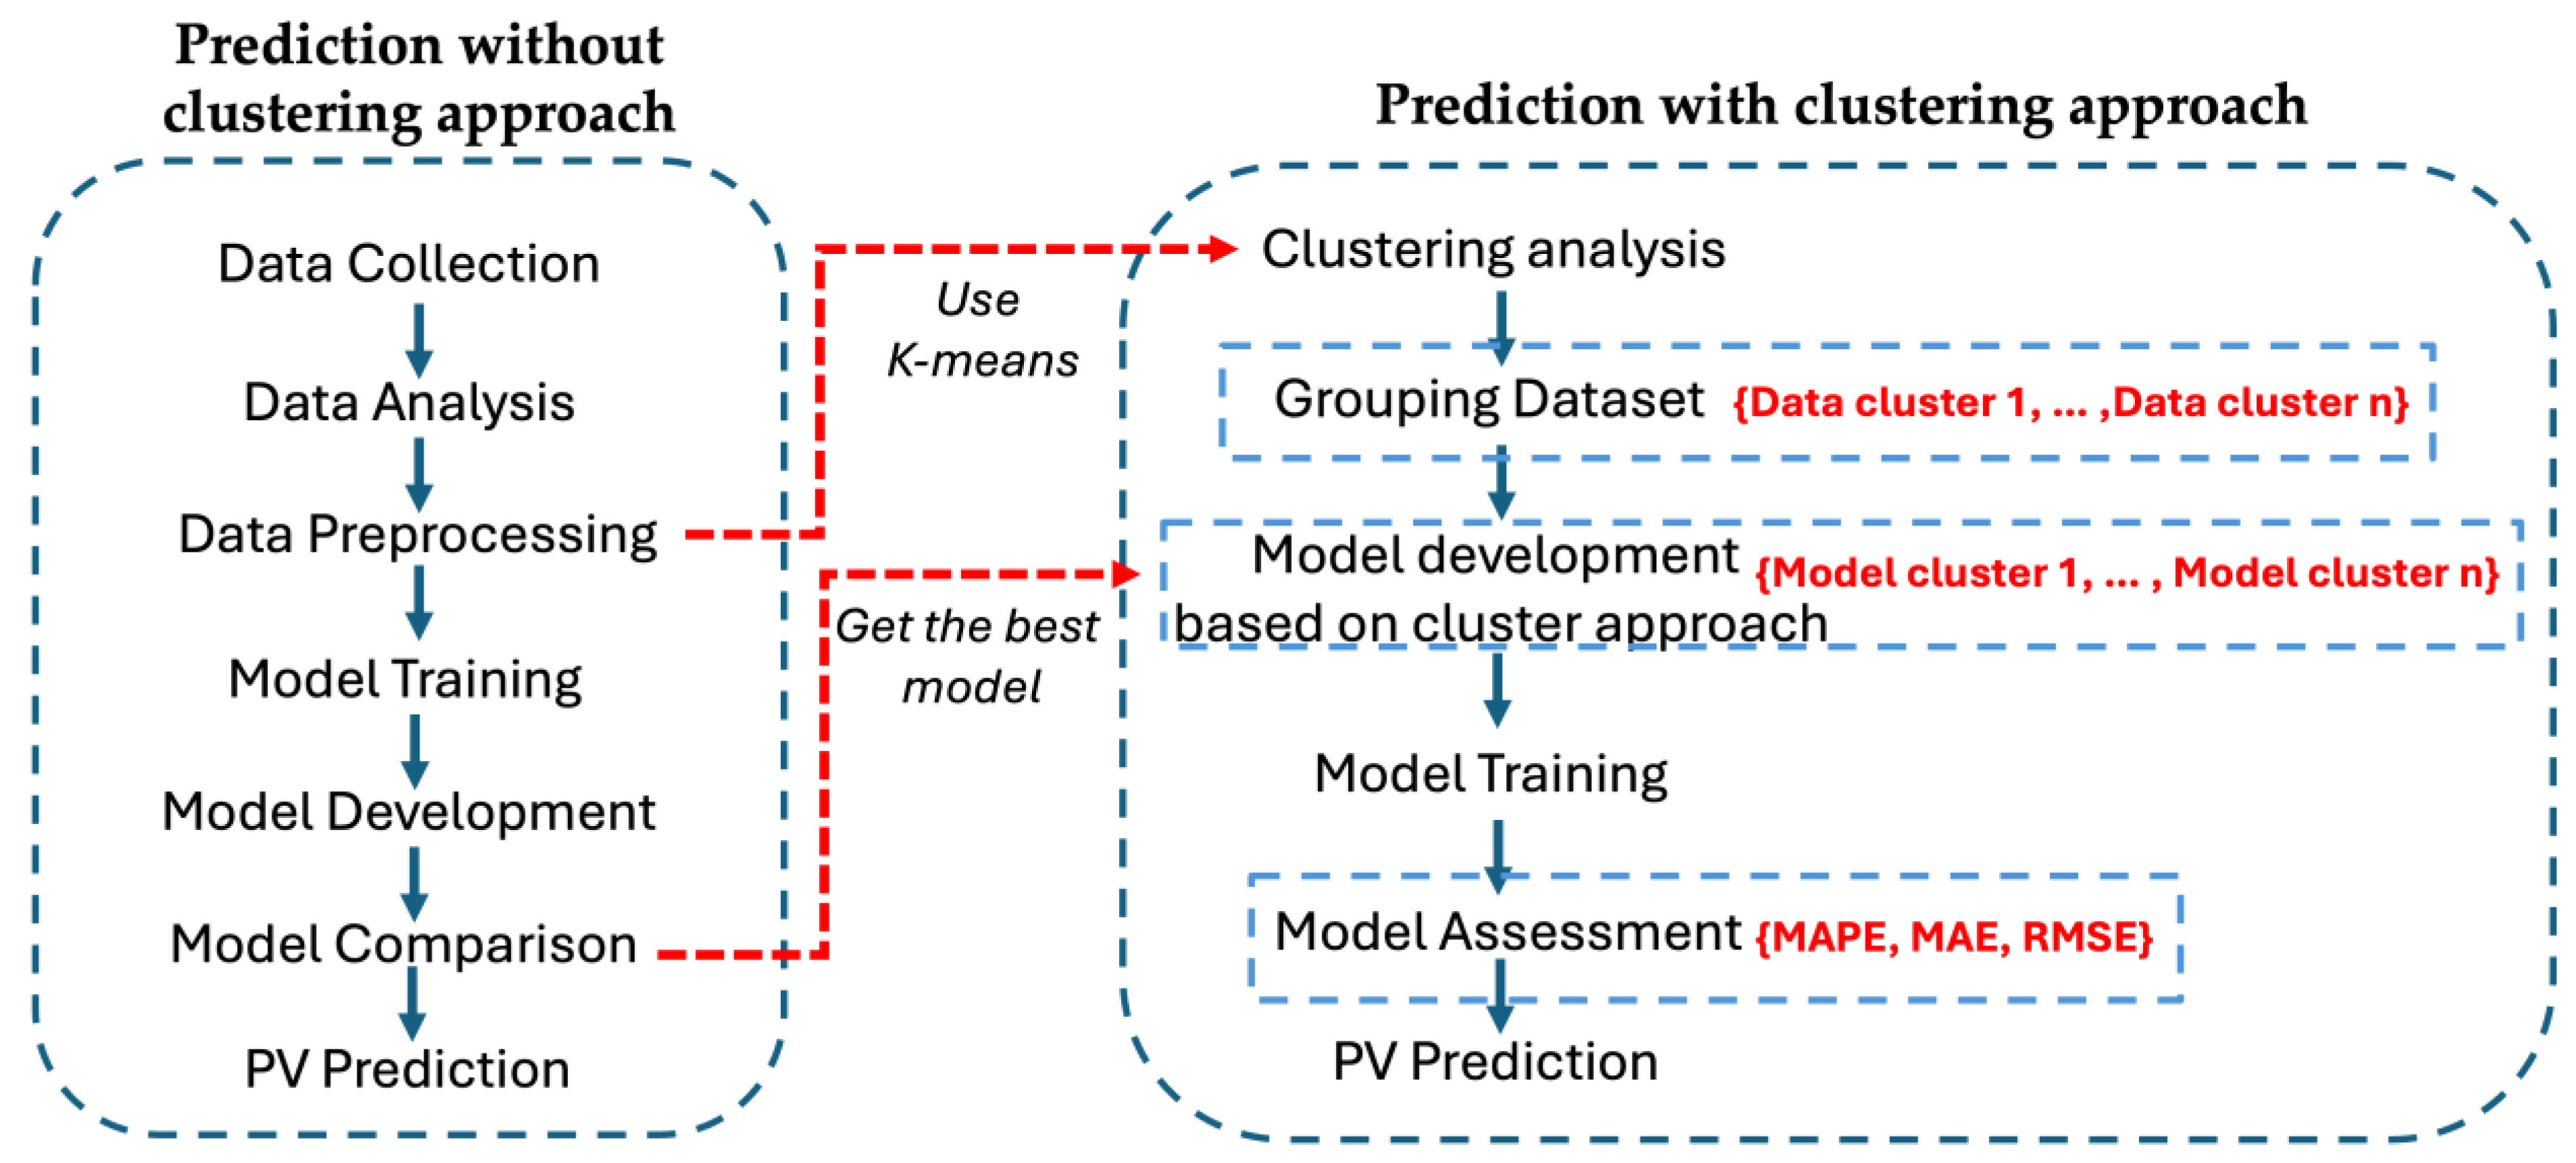
The forecasting process consists of two phases. In the first phase, a standard approach to PV power forecasting is used, which includes key steps, such as data collection, data analysis, pre-processing, model development, training, and evaluation. The objective of this phase is to identify the best performing model for PV power generation.
Building on the results of the first phase, the second phase investigates whether the performance of the selected model can be improved using a clustering-based approach. In this phase, the weather dataset and the corresponding PV power outputs were segmented into clusters based on the similarity of weather characteristics. In effect, the original dataset was divided into subsets corresponding to each cluster. This process involved the implementation of a clustering algorithm to group the data based on similarity of features. A separate model was then trained for each of the clusters, adhering to the architecture of the best performing model that was identified in the first phase. Finally, to evaluate the effectiveness of the clustering-based approach, the average prediction performance of the models across all clusters was assessed to determine its impact on improving the accuracy of PV power generation prediction.
An overview of this general concept is illustrated in
Figure 1 below, while
Table 4 provides a detailed outline of the steps required to implement the first stage of work and the second stage using a clustering algorithm, develops cluster-specific models, and analyzes their performance in comparison to the baseline model.
4. Results and Discussion
4.1. Prediction Result Without Clustering Approach
In this section, all the models developed have been trained on the weather dataset for the prediction of PV power generation.
Table 5 shows the performance evaluation of four models—Support Vector Regression (SVR), random forest (RF), decision tree (DT), and multilayer perceptron (MLP)—for this task. The models were evaluated using key metrics, such as the mean square error (MSE), the root mean square error (RMSE), and the mean absolute error (MAE). Among these models, the MLP showed the best performance and achieved the lowest error metrics with an MSE of 3.069, an RMSE of 1.752, and an MAE of 1.139. This reflects its superior prediction accuracy and minimal prediction error. The RF model also performed well, with slightly higher error metrics compared to the MLP (MSE = 7.009 and RMSE = 2.647). However, its MAE (1.122) was slightly better than that of the MLP.
The DT model performed moderately well. Its MSE was 25.58, RMSE was 5.057, and MAE was 2.231. On the other hand, with much higher error metrics (MSE = 2138.158, RMSE = 46.24, and MAE = 42.87), the SVR model showed the weakest performance.
Overall, the results indicate that the MLP model is the most effective for predicting PV power generation, achieving the lowest MSE and RMSE values and consistently outperforming other models across all evaluation metrics. These findings highlight the MLP model’s ability to minimize prediction errors and deliver highly accurate results. Due to its superior performance, the multilayer perceptron (MLP) model was selected as the baseline for PV power generation prediction in this study. Furthermore, the predictive performance of the MLP model for PV power generation based on selected weather parameters was considered for further improvement through a clustering approach.
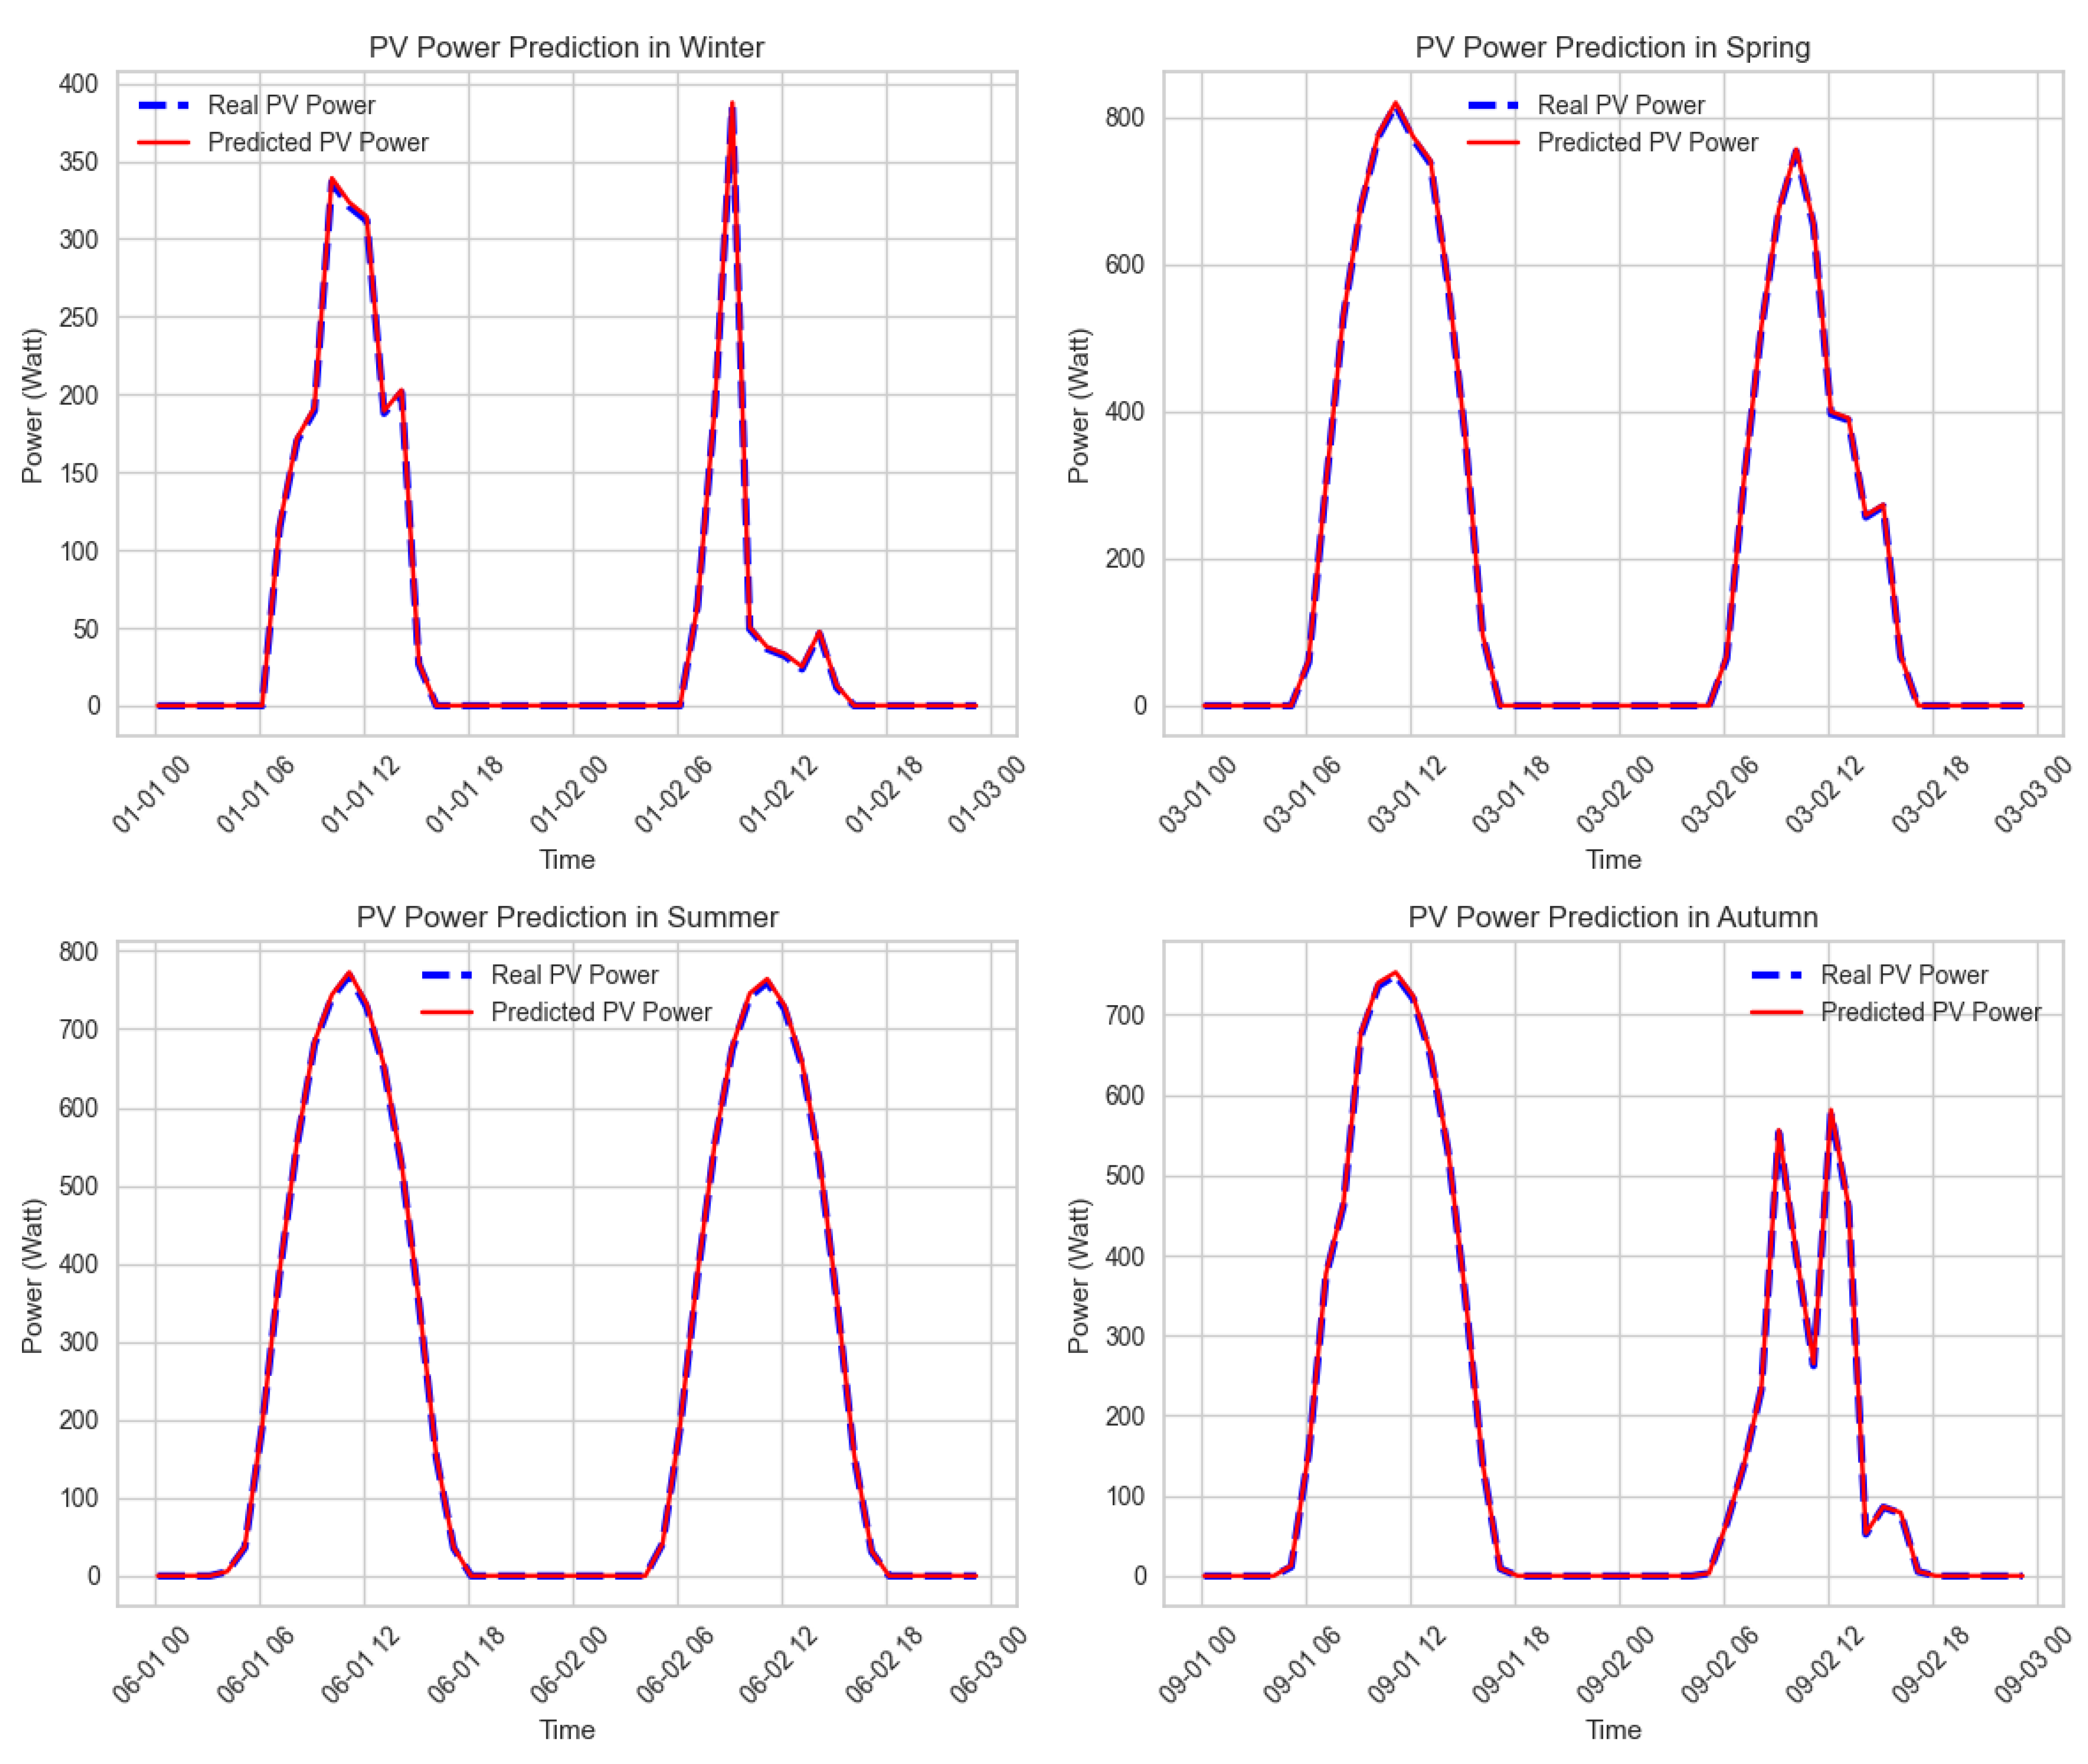
Figure 2 illustrates PV power predictions over a given period under varying seasonal conditions. At this stage, the MLP model relies solely on weather data to predict PV power outputs. It is therefore important to compare the model’s predictions with actual measurements over the analysis period.
Table 6 below shows a subset of values from the comparison between the MLP model’s PV power predictions and real data recorded on 1 January 2019 during winter conditions, which are part of the data shown in
Figure 2.
4.2. Improvement with Clustering Approach
4.2.1. Clustering Analysis
In order to further improve the accuracy of the model and in line with the research objectives, we propose to improve the MLP model using a clustering-based approach. In this phase, the clustering methodology will be implemented to refine the performance of the MLP model.
Before applying the clustering approach, it is crucial to identify weather parameters that have a strong correlation with PV power generation. This step ensures that the most relevant and influential features are considered, leading to more insightful and actionable results. By focusing on highly correlated features, the clustering algorithm can form meaningful groups, improving model performance. In contrast, weakly correlated features can introduce noise or redundancy, potentially reducing the effectiveness of clustering [
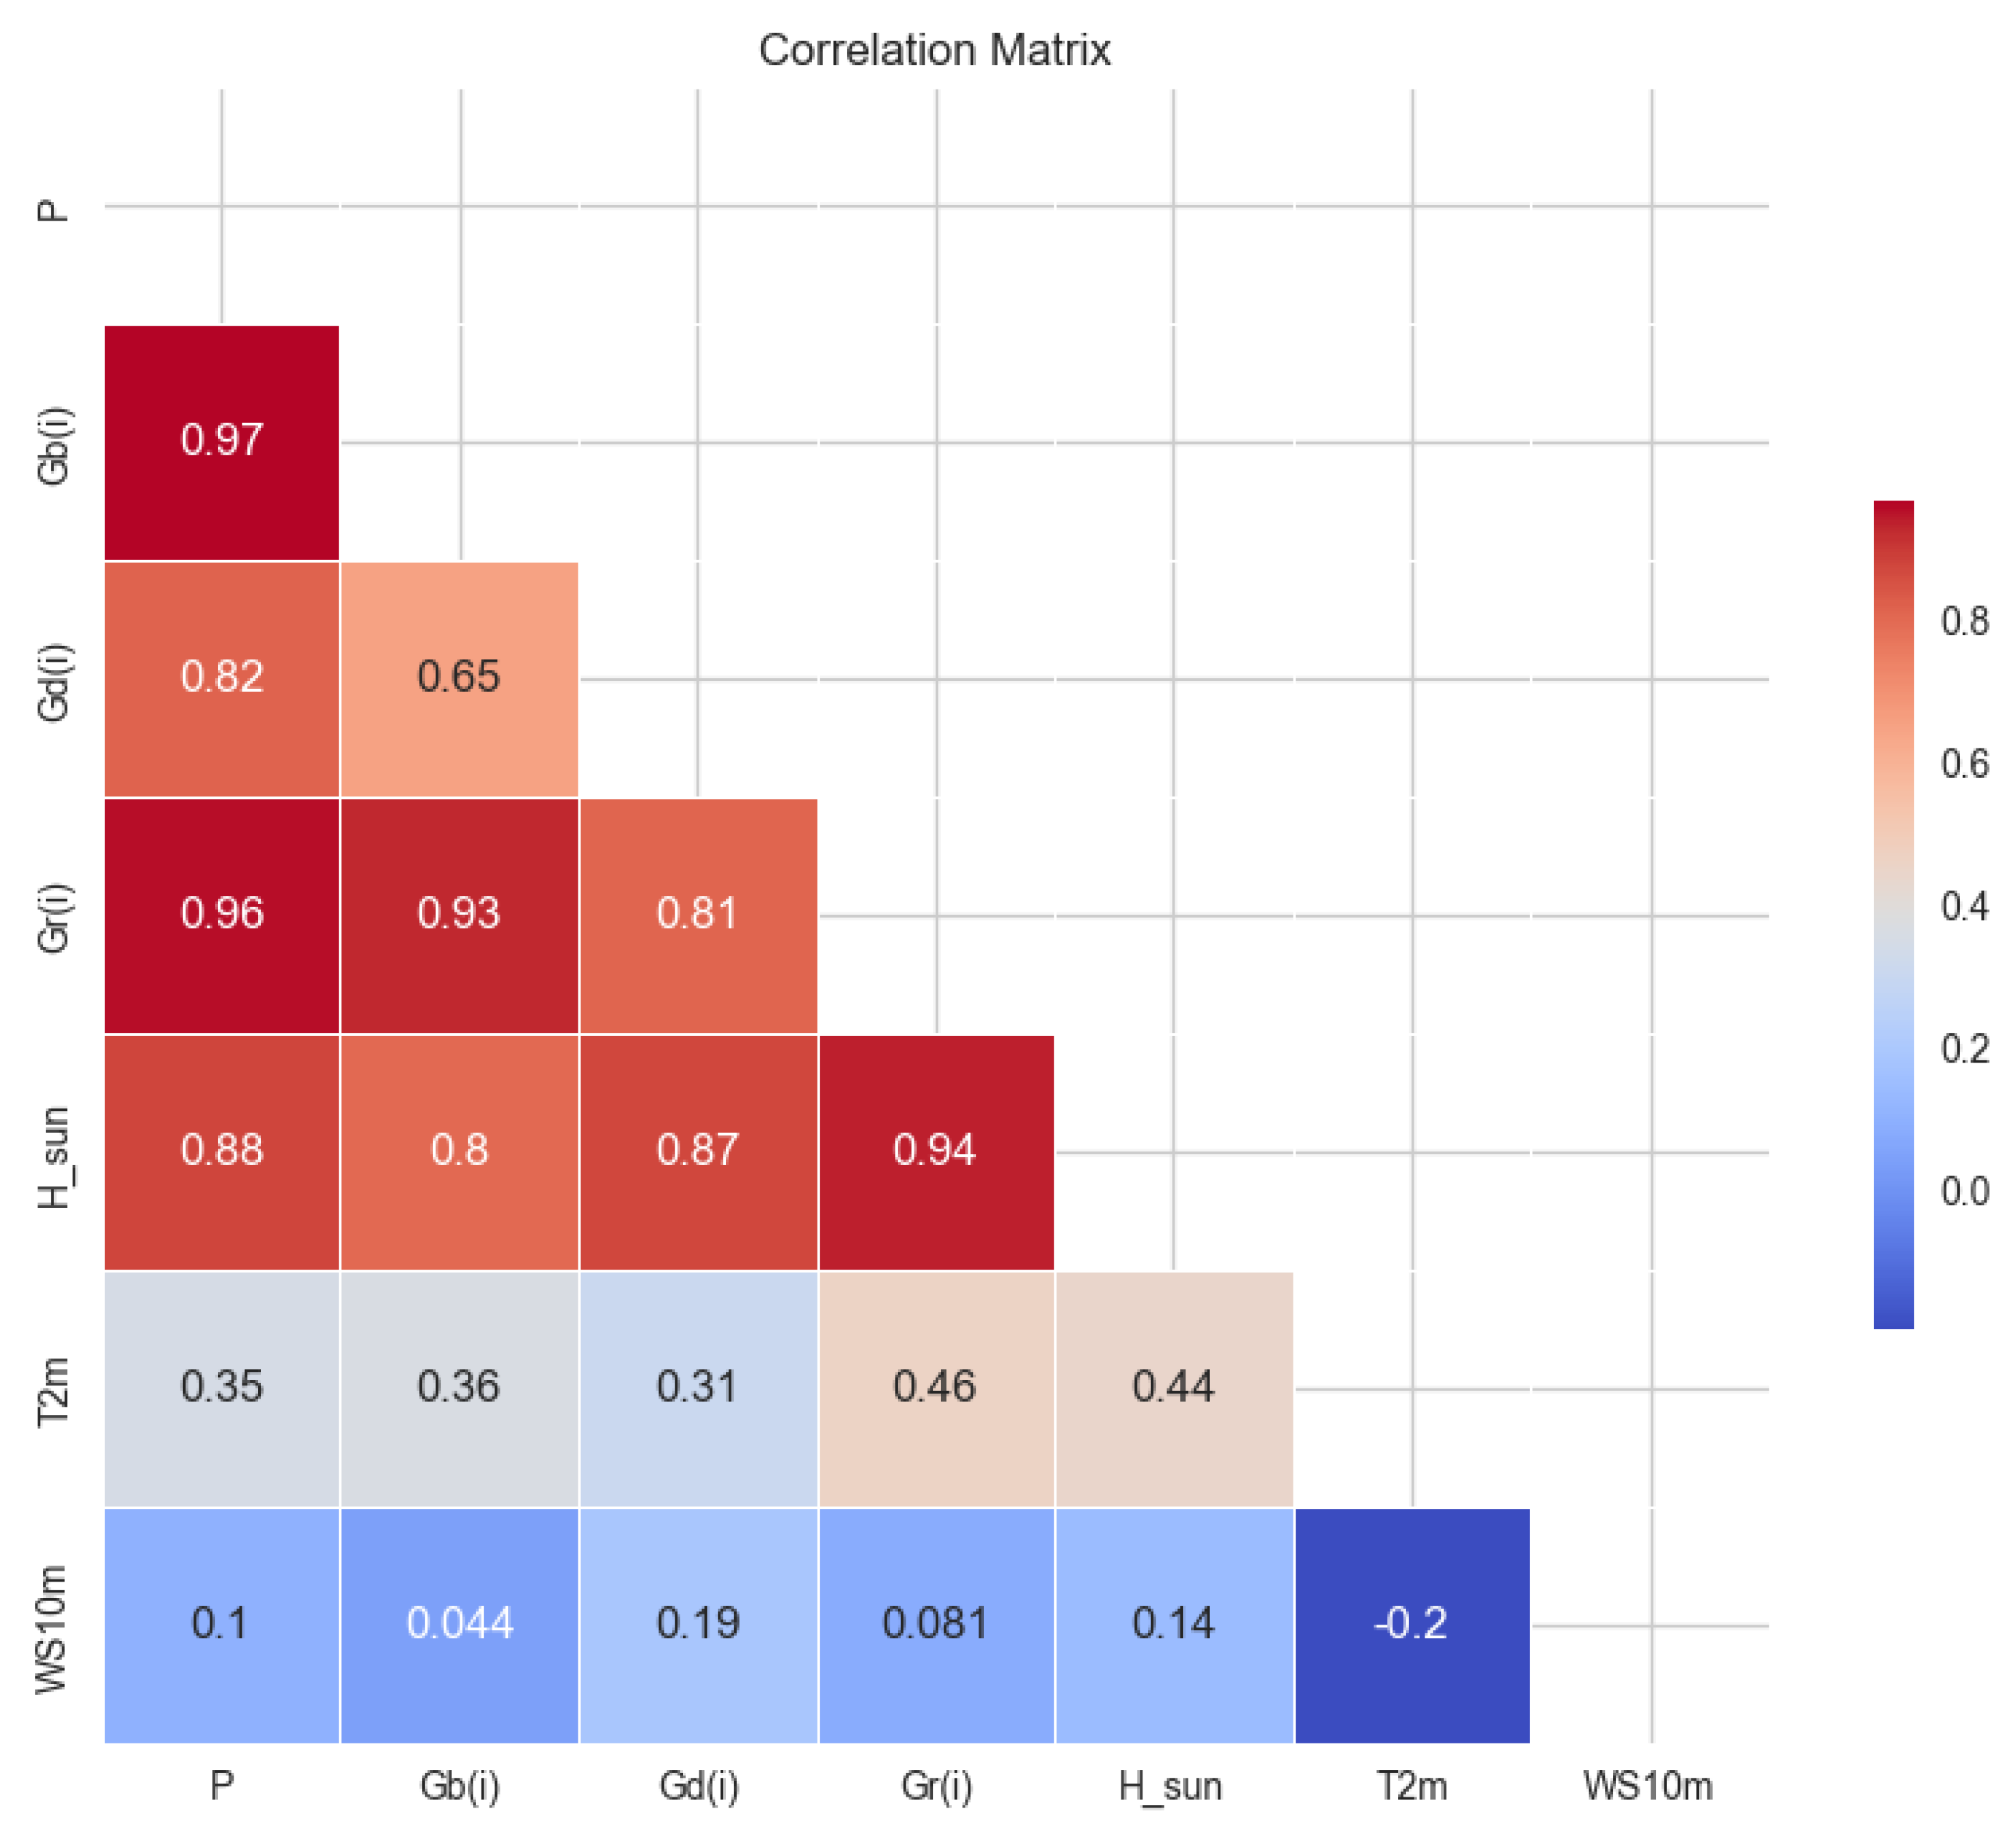
26]. In this study, we used the Pandas library as a data analysis tool to compute the correlation matrix, as shown in
Figure 3 below.
Figure 3 shows the correlation matrix for the weather characteristics and PV power generation. This provides a comprehensive visualization of the strength and direction of the relationships between the variables. Correlation values that are close to 1 indicate a strong positive relationship, while values that are close to −1 reflect a strong negative relationship. The analysis shows that specific weather characteristics, such as Gb(i), Gd(i), Gr(i), and H_sun, are strongly positively correlated with PV power generation, indicating their significant influence on performance. In contrast, indicating a limited impact on the prediction task, features such as WS10m and T2m show weaker or negligible correlations. These results are important for selecting relevant features for further modelling and clustering analyses. Accordingly, this study focuses on the weather features Gb(i), Gd(i), Gr(i), and H_sun for clustering work, grouping them based on their similarity to improve the predictive modelling process.
Once the most relevant features were identified, a separate dataset was created using only these selected features. The dataset was processed using the Yellowbrick library, with the elbow method used to determine the optimal number of clusters. The visualizer works by fitting the clustering model with a range of K values. In this study, a range of 1 to 9 was used. The detailed process is presented in the algorithm process shown in
Table 4. The visual output is presented as a line graph. The ‘elbow’—the inflection point on the curve—indicates the optimal number of clusters. If the graph resembles an arm, the elbow represents the point beyond which the addition of more clusters results in diminishing returns in model performance. In the visualization, this ‘elbow’ point is highlighted with a dashed line for easy identification.
Based on this analysis, it was determined that the dataset contained four clusters. The graph below (
Figure 4) illustrates the bias score obtained from the elbow method. This measures how well the clustering model fits the data. Lower scores indicate that data points are closer to their cluster centroids, indicating better cluster formation. However, beyond the elbow point, the rate of improvement slows, suggesting minimal benefit from adding more clusters. In this case, the optimal number of clusters is K = 4, which balances model complexity and performance. For comparison, reference [
15] used two weather variables:temperature and solar radiation to group days into clusters based on the similarity of selected weather parameters. They then used the Davies–Bouldin index to determine the optimal number of clusters, ultimately finding that K = 4 was also optimal in their case.
As shown in the methodology sequence in
Table 4, this process is a critical part of the clustering analysis. Following this, the dataset was grouped using the labels that were generated by the K-means algorithm. These labels were assigned to each row of the original dataset. The original dataset contains both weather characteristics and PV power. After labelling, the dataset was divided into four subsets based on each cluster assigned, each containing data points grouped by similarity. It is important to note that at this stage, we returned to working with the original dataset parameter, which includes all features, rather than the reduced feature set used for clustering.
4.2.2. PV Prediction with Clustering Approach
This section investigates the performance of the multilayer perceptron (MLP) model in predicting photovoltaic (PV) power with an additional clustering step. In particular, four individual MLP models were constructed and four partial datasets generated based on the clustering allocations. The structure of the original dataset, together with the four cluster-based subsets used in this study, is shown in
Table 7.
Once the subset datasets were created, each subset was fed into its corresponding MLP model, which was specifically designed for its respective cluster. The training process was carried out in a sequential manner, starting with the model for cluster 1 and working up to cluster 4. The same metrics used in the previous stage were used to evaluate the performance of each model.
The results show that the performance of the MLP models varies between the clusters in terms of all error metrics, as shown in
Table 8. The model specific to cluster 1 achieves the best performance with the lowest error levels (MSE: 0.037, RMSE: 0.194, and MAE: 0.071), followed by the models for cluster 4 and cluster 3. In contrast, the model for cluster 2 shows the weakest performance among the clusters. This suggests potential limitations of the clustering approach for this subset.
Despite this variation, the performance across all clusters and its average demonstrates the overall effectiveness of the clustering-based approach in improving prediction accuracy with the following results: MSE: 0.761, RMSE:0.756, and MAE: 0.647. These results suggest that tailoring MLP models to cluster-specific data characteristics can significantly improve prediction performance compared to a single generalized model trained on the entire dataset. However, further refinement is required. The configuration and architecture of the MLP model, including the choice of number of hidden layers and neurons, also affect its performance. In addition, the fitting process produces inconsistent results in some cases. This suggests that both the clustering methodology and the model design process have potential for improvement. The prediction of PV power based on weather parameters, grouped according to their similarity within clusters, is presented in
Figure 5. This figure illustrates the predicted PV power values alongside the actual power values, categorized according to their respective clusters.
In the previous discussion, it was observed that the MLP model achieves higher accuracy when using the clustering approach. However, it remains unclear whether this improvement is consistent across other machine learning models. To address this question, we conducted simulations to evaluate the performance of the MLP model compared to other models when employing the clustering approach. Specifically, all machine learning models utilized in this study were trained with the clustering method to determine whether the MLP model outperforms the others. The results of this comparison, presented in
Table 9, demonstrate the performance of the MLP model alongside other models trained with the clustering approach.
As shown in
Table 9, the other machine learning models utilized in this study, including SVR, RF, and DT, did not exhibit significant improvement when employing the clustering approach. Their performance metrics, such as MSE, RMSE, and MAE, were higher compared to the results presented in
Table 5. In contrast, the MLP model demonstrated enhanced performance with the clustering approach, highlighting its suitability for this method.
5. Conclusions
This study explores the use of machine learning models to predict photovoltaic (PV) power output based on weather parameters. It highlights the importance of weather characteristics in the prediction process. Among the models tested, multilayer perceptron (MLP) was found to have the strongest ability to capture the complex relationships between weather characteristics and PV power output. In order to improve the performance of MLP, a clustering-based approach was used. Weather parameters, in particular irradiance and sun elevation, were identified as key predictors. The K-means clustering algorithm was used to classify the weather data into four clusters, with the optimal number determined using the elbow method. The original dataset was segmented into subsets corresponding to each cluster, ensuring that each subset was used to train and test a model specifically designed for that cluster. Individual MLP models were then trained for each cluster, resulting in improved prediction accuracy compared to a single MLP model and other machine learning models, such as SVR, RF, and DT, which showed minimal benefit from the clustering approach. The study highlights that by training on more homogeneous subsets, clustering reduces data complexity and improves the predictive accuracy of the MLP model. However, to optimize performance and address inconsistencies in the model’s predictions, further refinements to the MLP architecture and clustering methodology are required.
Author Contributions
Conceptualization, F.A. and P.J.; data collection, V.S.; methodology, F.A.; data analysis, F.A.; writing—review and editing, F.A., P.J. and V.S.; visualization, F.A.; supervision, P.J. and V.S. All authors have read and agreed to the published version of the manuscript.
Funding
The work was supported by the project Minigrants for doctoral students of the Wroclaw University of Science and Technology.
Data Availability Statement
The dataset used in this study is available on request from the authors.
Conflicts of Interest
The authors declare no conflicts of interest.
References
- IRENA—International Renewable Energy Agency. Available online: https://www.irena.org/ (accessed on 1 January 2025).
- Thaker, J.; Höller, R. Hybrid model for intra-day probabilistic PV power forecast. Renew. Energy 2024, 232, 121057. [Google Scholar] [CrossRef]
- Shadid, R.; Khawaja, Y.; Bani-Abdullah, A.; Akho-Zahieh, M.; Allahham, A. Investigation of weather conditions on the output power of various photovoltaic systems. Renew. Energy 2023, 217, 119202. [Google Scholar] [CrossRef]
- Aksan, F.; Janik, P.; Pfeiffer, K.; Suresh, V.; Leonowicz, Z. Prediction of Regional PV Power Generation Based on LSTM-CNN. In Proceedings of the 2023 IEEE Asia Meeting on Environment and Electrical Engineering, EEE-AM 2023, Hanoi, Vietnam, 13–15 November 2023. [Google Scholar] [CrossRef]
- Zheng, J.; Du, J.; Wang, B.; Klemeš, J.J.; Liao, Q.; Liang, Y. A hybrid framework for forecasting power generation of multiple renewable energy sources. Renew. Sustain. Energy Rev. 2023, 172, 113046. [Google Scholar] [CrossRef]
- Ahmad, N.; Ghadi, Y.; Adnan, M.; Ali, M. Load Forecasting Techniques for Power System: Research Challenges and Survey. IEEE Access 2022, 10, 71054–71090. [Google Scholar] [CrossRef]
- Suresh, V.; Janik, P.; Rezmer, J.; Leonowicz, Z. Forecasting solar PV output using convolutional neural networks with a sliding window algorithm. Energies 2020, 13, 723. [Google Scholar] [CrossRef]
- Ghenai, C.; Ahmad, F.F.; Rejeb, O. Artificial neural network-based models for short term forecasting of solar PV power output and battery state of charge of solar electric vehicle charging station. Case Stud. Therm. Eng. 2024, 61, 105152. [Google Scholar] [CrossRef]
- Tarmanini, C.; Sarma, N.; Gezegin, C.; Ozgonenel, O. Short term load forecasting based on ARIMA and ANN approaches. Energy Rep. 2023, 9, 550–557. [Google Scholar] [CrossRef]
- Yu, J.; Li, X.; Yang, L.; Li, L.; Huang, Z.; Shen, K.; Yang, X.; Yang, X.; Xu, Z.; Zhang, D.; et al. Deep Learning Models for PV Power Forecasting: Review. Energies 2024, 17, 3973. [Google Scholar] [CrossRef]
- Li, P.; Zhou, K.; Lu, X.; Yang, S. A hybrid deep learning model for short-term PV power forecasting. Appl. Energy 2020, 259, 114216. [Google Scholar] [CrossRef]
- Suresh, V.; Aksan, F.; Janik, P.; Sikorski, T.; Revathi, B.S. Probabilistic LSTM-Autoencoder based hour-ahead solar power forecasting model for intra-day electricity market participation: A Polish case study. IEEE Access 2022, 10, 110628–110638. [Google Scholar] [CrossRef]
- Tang, Y.; Yang, K.; Zhang, S.; Zhang, Z. Photovoltaic power forecasting: A hybrid deep learning model incorporating transfer learning strategy. Renew. Sustain. Energy Rev. 2022, 162, 112473. [Google Scholar] [CrossRef]
- Xue, H.; Ma, J.; Zhang, J.; Jin, P.; Wu, J.; Du, F. Power Forecasting for Photovoltaic Microgrid Based on MultiScale CNN-LSTM Network Models. Energies 2024, 17, 3877. [Google Scholar] [CrossRef]
- Wang, Z.; Koprinska, I.; Rana, M. Clustering based methods for solar power forecasting. In Proceedings of the International Joint Conference on Neural Networks, Vancouver, BC, Canada, 24–29 July 2016; pp. 1487–1494. [Google Scholar] [CrossRef]
- Haljasmaa, K.I.; Bramm, A.M.; Matrenin, P.V.; Eroshenko, S.A. Weather Condition Clustering for Improvement of Photovoltaic Power Plant Generation Forecasting Accuracy. Algorithms 2024, 17, 419. [Google Scholar] [CrossRef]
- Arias, M.B.; Bae, S. Multiphase Solar Photovoltaic Prediction Model Based on Season, Hierarchical k-Means Clustering, GRA-PCC, SVM, Neural Network. Int. J. Energy Res. 2024, 2024, 3098943. [Google Scholar] [CrossRef]
- Shi, N.; Liu, X.; Guan, Y. Research on k-means clustering algorithm: An improved k-means clustering algorithm. In Proceedings of the 3rd International Symposium on Intelligent Information Technology and Security Informatics, IITSI, Jian, China, 2–4 April 2010; Volume 2010, pp. 63–67. [Google Scholar] [CrossRef]
- Elbow Method—Yellowbrick v1.5 Documentation. Available online: https://www.scikit-yb.org/en/latest/api/cluster/elbow.html (accessed on 26 December 2024).
- Arthur, D.; Vassilvitskii, S. How slow is the k-means method? In Proceedings of the Annual Symposium on Computational Geometry, Sedona, AZ, USA, 5–7 June 2006; Volume 2006, pp. 144–153. [Google Scholar] [CrossRef]
- KMeans—Scikit-Learn 1.5.2 Documentation. Available online: https://scikit-learn.org/1.5/modules/generated/sklearn.cluster.KMeans.html (accessed on 26 December 2024).
- Keras: Deep Learning for Humans. Available online: https://keras.io/ (accessed on 16 April 2023).
- Aksan, F.; Li, Y.; Suresh, V.; Janik, P. CNN-LSTM vs. LSTM-CNN to Predict Power Flow Direction: A Case Study of the High-Voltage Subnet of Northeast Germany. Sensors 2023, 23, 901. [Google Scholar] [CrossRef] [PubMed]
- Aksan, F.; Suresh, V.; Janik, P.; Sikorski, T. Load Forecasting for the Laser Metal Processing Industry Using VMD and Hybrid Deep Learning Models. Energies 2023, 16, 5381. [Google Scholar] [CrossRef]
- Scikit-Learn: Machine Learning in Python—Scikit-Learn 1.0.2 Documentation. Available online: https://scikit-learn.org/stable/ (accessed on 13 March 2022).
- Pandas—Python Data Analysis Library. Available online: https://pandas.pydata.org/ (accessed on 14 March 2022).
| Disclaimer/Publisher’s Note: The statements, opinions and data contained in all publications are solely those of the individual author(s) and contributor(s) and not of MDPI and/or the editor(s). MDPI and/or the editor(s) disclaim responsibility for any injury to people or property resulting from any ideas, methods, instructions or products referred to in the content. |
© 2025 by the authors. Licensee MDPI, Basel, Switzerland. This article is an open access article distributed under the terms and conditions of the Creative Commons Attribution (CC BY) license (https://creativecommons.org/licenses/by/4.0/).


