Assessment of Energy Consumption and Greenhouse Gas Emissions in a UK Quick-Service Restaurant Using EnergyPlus †
Abstract
1. Introduction
2. Materials and Methods
2.1. QSR Details
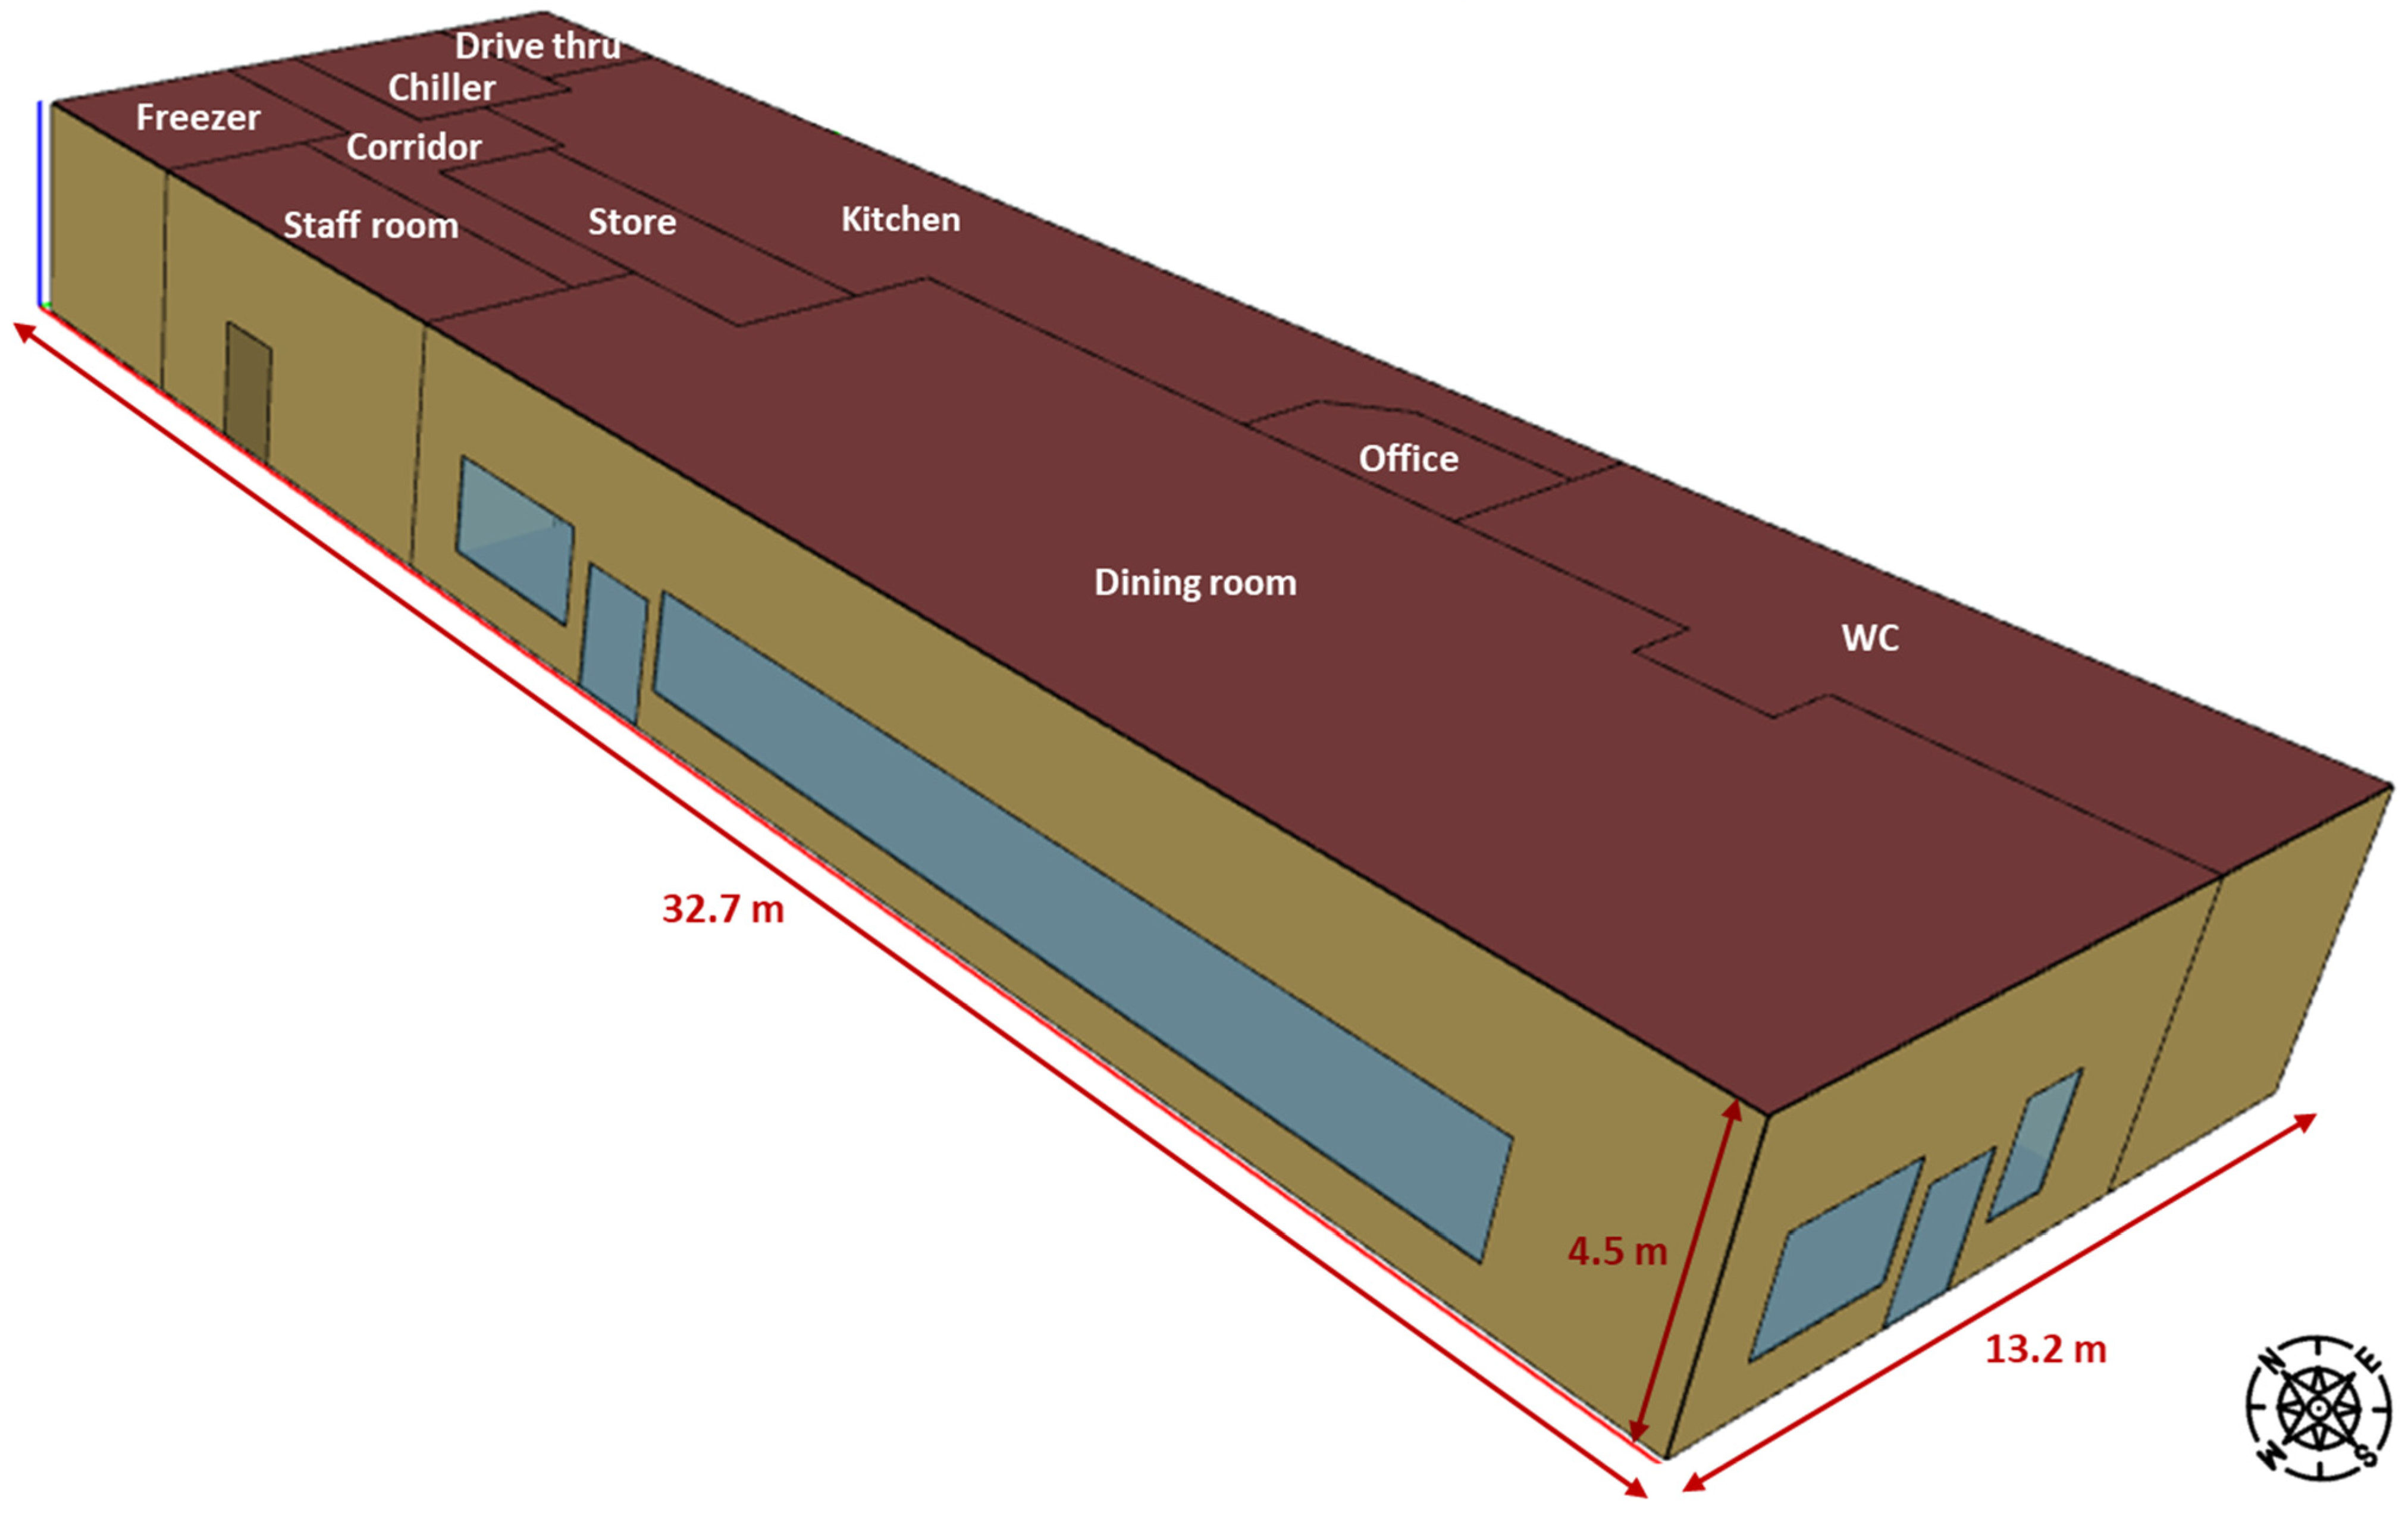
2.2. Modelling of the QSR
2.2.1. Methodology
2.2.2. Geometry
2.2.3. Model Inputs
| VARIABLES | INPUTS | SOURCE | |||
|---|---|---|---|---|---|
| Opening hours | From 6 a.m. to 10 p.m. (Monday–Sunday) | QSR data | |||
| Internal heat loads | Lighting load consumption (kWh/year) | Electric load consumption (kWh/year) | |||
| Corridor | 436 | 194 | EnergyPlus default | ||
| Dining room | 7189 | 30,066 | EnergyPlus default | ||
| Drive thru | 233 | 350 | EnergyPlus default | ||
| Kitchen | 5494 | 343,783 | After adjusting with QSR data | ||
| Office | 206 | 308 | EnergyPlus default | ||
| Staff room | 561 | 844 | EnergyPlus default | ||
| Store | 558 | 372 | EnergyPlus default | ||
| WC | 930 | 133 | EnergyPlus default | ||
| Heating thermostat (°C) | 21 (kitchen) 20 (all the other areas) | QSR data | |||
| Cooling thermostat (°C) | 23 (all the areas) | QSR data | |||
| HVAC system | Cooling rated COP | 3 | Goel et al. [18] | ||
| Heating rated COP | 3.4 | Goel et al. [18] | |||
| Fan total efficiency | 0.7 | EnergyPlus default | |||
| Heating design supply T (°C) | 40 | EnergyPlus default | |||
| Cooling design supply T (°C) | 15 | EnergyPlus default | |||
| Hot water system | Water consumption (L/day) | 2200 | QSR data | ||
| Specific heat capacity of water (J.K−1.kg−1) | 4.185 | At 35.6 °C | |||
| Inlet T (°C) | 11.15 | Mean ambient T | |||
| Target T (°C) | 60 | EnergyPlus default | |||
| Refrigeration system (R-448A) | Compressors | Chiller: Copeland-COPELAWELD-60 Hz MEDIUM_RS43C1E-IAA Freezer: Copeland-COPELAMETIC-60 Hz LOW_KALA-016E-TAC | Assumption | ||
| Evaporating T (°C) | Chiller/freezer: −8/−33 | [19] | |||
| Minimum condensing T (°C) | 21 | Peterson et al. [20] | |||
| Refrigerant charge (kg) | 3.2 | Assumption | |||
| Refrigerant leakage for cold stores (%/year) | 10 | Brown et al. [21] | |||
| Cold stores (Chiller and freezer) | Total area (m2) | Chiller/freezer: 16/18 | QSR data | ||
| Operating T (°C) | Chiller/freezer: 3/−18 | QSR data | |||
| Height of doors (m) | 2 | QSR data | |||
| Total cooling capacity (kW) | Chiller/freezer: 1/1.25 | QSR data | |||
| Fan (W) | 735 | EnergyPlus default | |||
| Light (W) | 120 | EnergyPlus default | |||
| Defrost (W) | 2500 | EnergyPlus default | |||
| Insulated floor heat transfer coefficient (U) (W/m2.K) | 0.207 | EnergyPlus default | |||
| Insulated surface U facing zone (W/m2.K) | 0.235 | EnergyPlus default | |||
| Stocking door U facing zone (W/m2.K) | 0.3785 | EnergyPlus default | |||
2.3. Modelling Technologies
- -
- Technology 1: Increase the deadband temperature of the HVAC by 2 K by increasing cooling and decreasing heating set points by 1 K.
- -
- Technology 2: Low GWP refrigerant (GWP =150). It was assumed that the QSR’s energy usage would be the same as that of the baseline running on R-448A (GWP = 1273).
- -
- Technology 3: 10% more efficient refrigeration and kitchen equipment.
- -
- Technology 4: 20% more efficient refrigeration and kitchen equipment.
- -
- Technology 5: Economizer in the HVAC. Fixed dry-bulb economizers with a high-limit dry-bulb control set at 24 °C were integrated into the HVAC systems of both the kitchen and dining areas. These used outside air to provide free cooling when external air conditions were favourable (below 21 °C), instead of relying on the mechanical cooling of the air conditioning.
- -
- Technology 6: Solar photovoltaic (PV) panels were installed on the QSR’s roof, covering approximately 65% of the total roof area (280.2 m2). This percentage was selected based on the findings of Gagnon et al. [22], who indicated that around 60–65% of commercial roof space is generally suitable for PV installations. The electricity generated was calculated using the RETScreen v9.0 software tool. RETScreen uses published local data for daily solar radiation on a horizontal surface in kWh/m2/day for each month. The monthly output was calculated based on the fixed orientation of the PV panels, which were positioned at a 15° angle to the horizontal plane, with their location in London, and an assumed efficiency of 15%. The total output for the year was the sum of these values. It is known that the monthly generation from RETScreen was always lower than the monthly consumption of the QSR. However, it is uncertain if peak generation ever exceeded consumption, so it has been assumed that all generation was used on-site, and none was exported.
- -
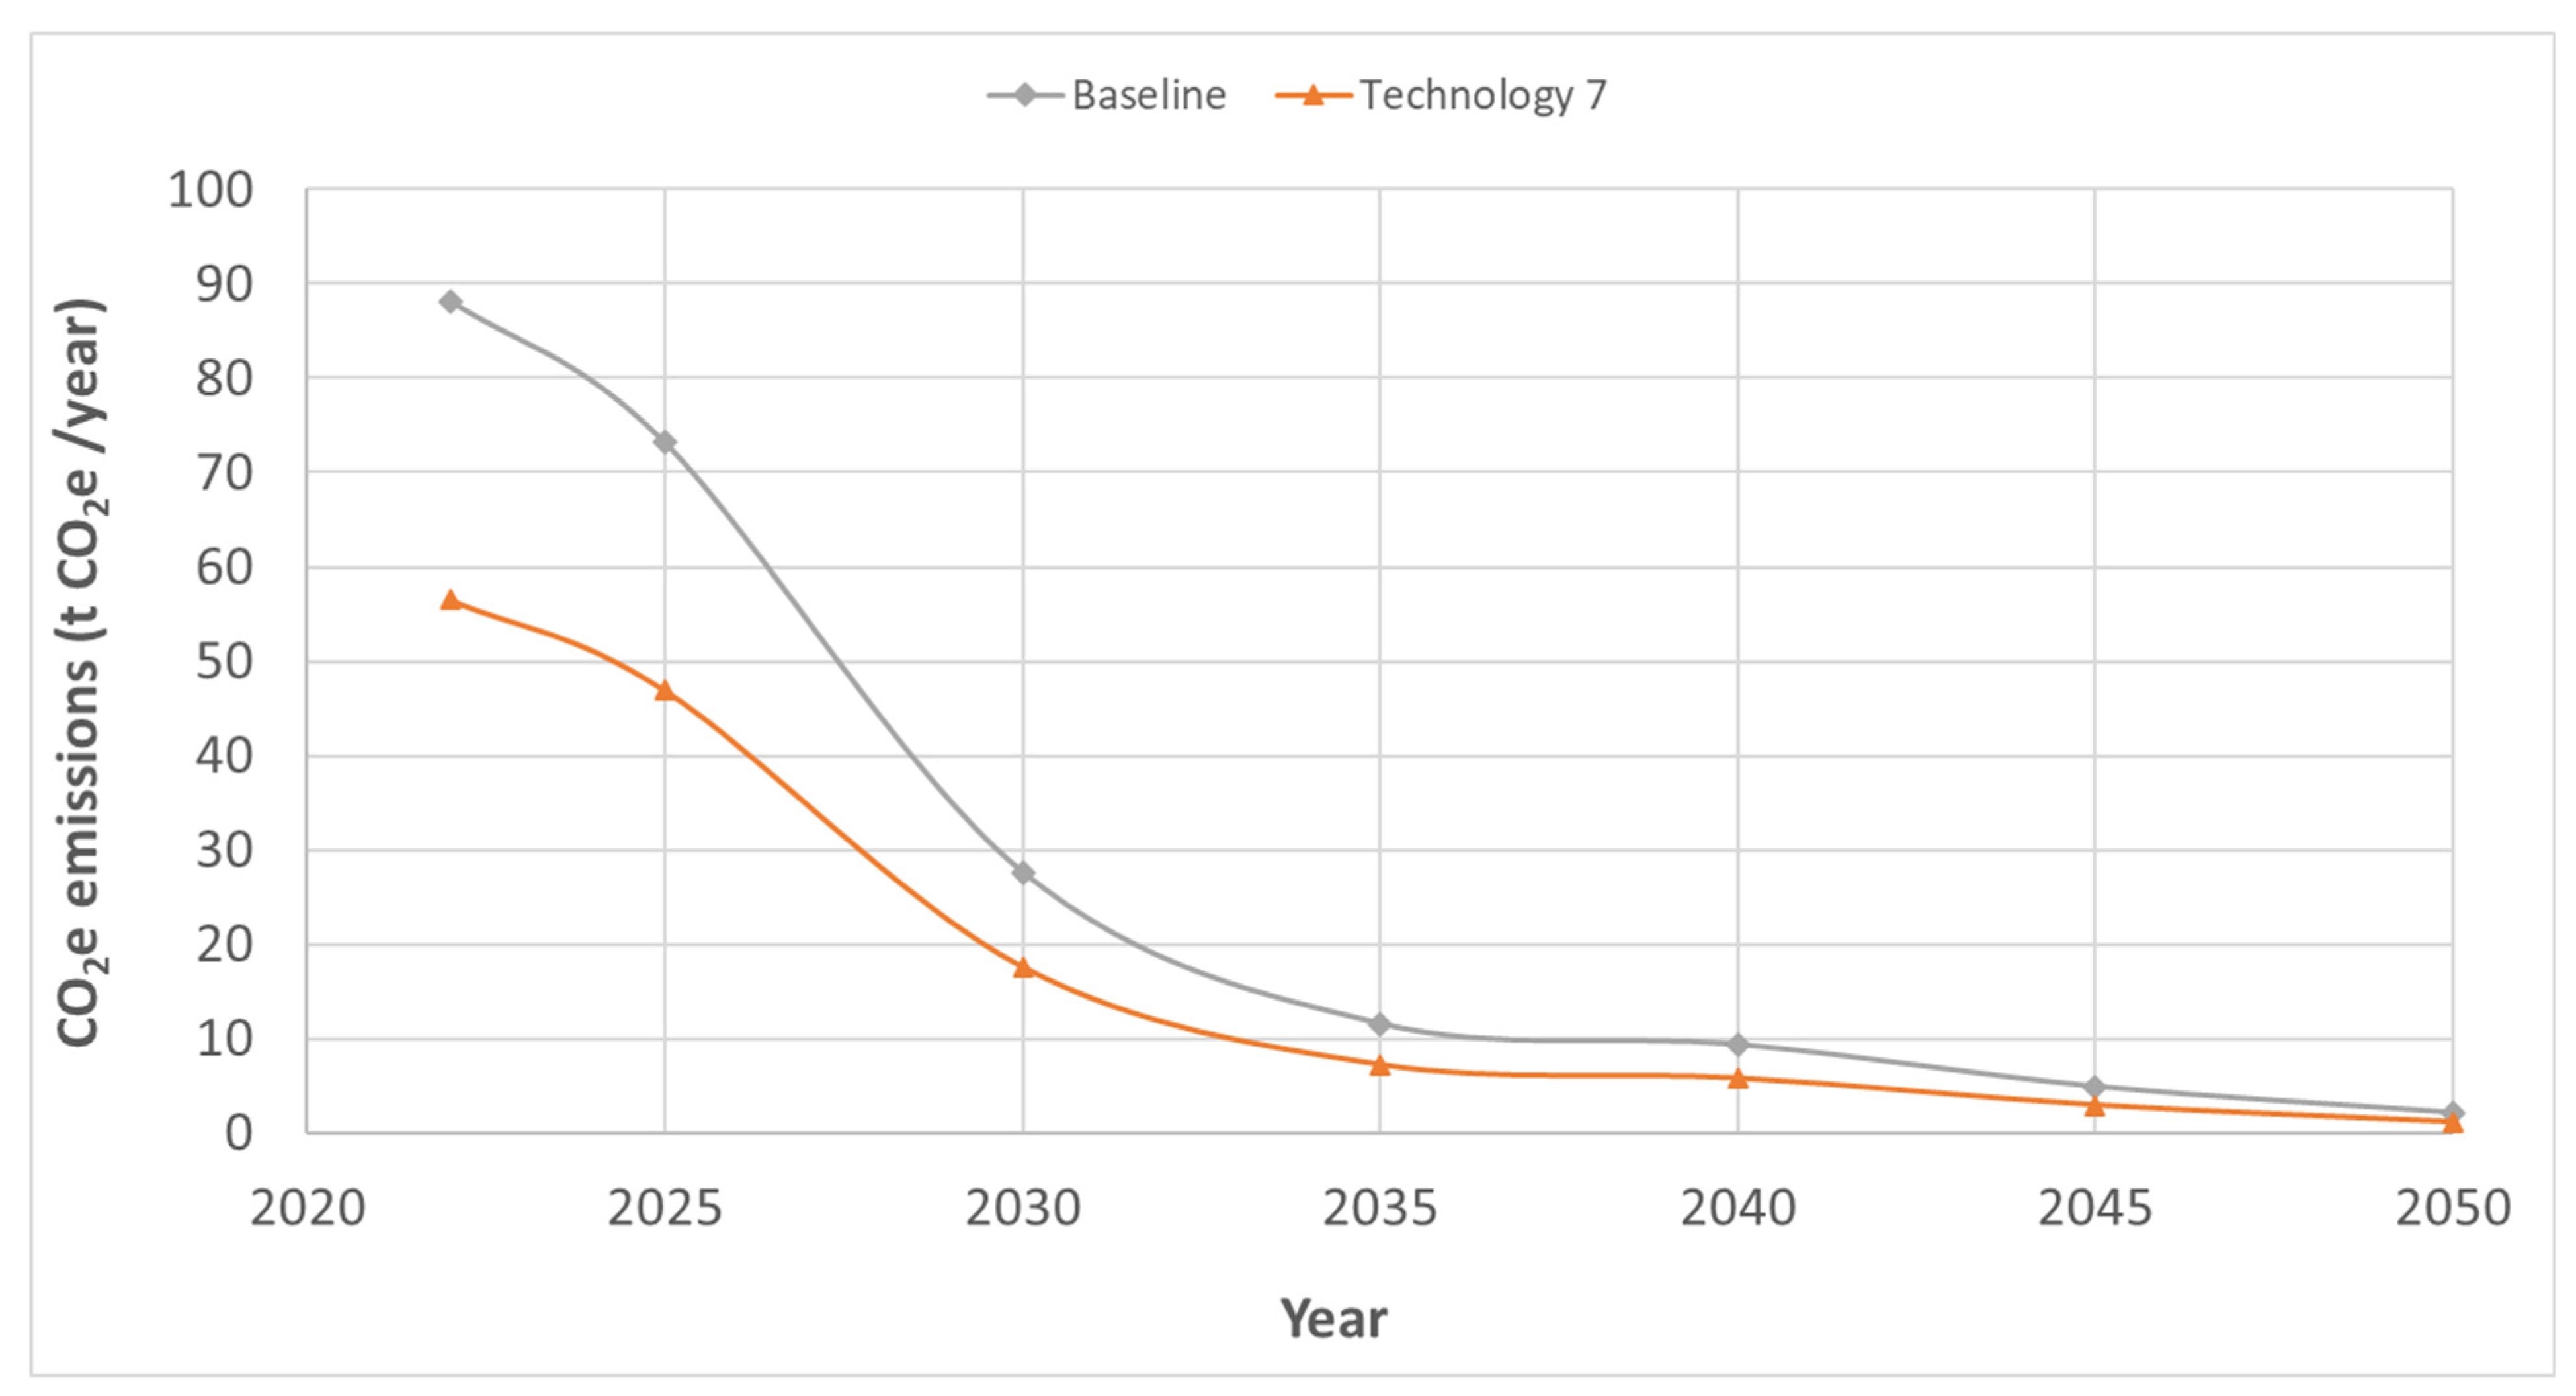
- Technology 7: All the technologies above were combined in a single model to understand their potential impact on energy use and carbon emissions.
2.4. Climate Change
2.5. Electrical Grid Decarbonisation
2.6. TEWI
3. Results and Discussion
3.1. Baseline Simulation Results
3.2. Carbon Reduction Technologies
3.3. Impact of Climate Change
3.4. Impact of Electrical Grid Decarbonisation
4. Conclusions
- Projections in the UK EGCI achieved a total reduction of 98% in CO2e emissions from 2022 to 2050.
- The integration of Technology 7 (all the technologies combined) achieved a substantial 35.9% decrease in CO2e emissions.
- Implementing 20% higher efficiency equipment resulted in a 15.7% reduction in CO2e emissions, while 10% more efficient equipment led to a 7.9% reduction.
- Incorporating economizers into HVAC systems significantly reduced cooling consumption by 74.2%, resulting in a 7.5% decrease in CO2e emissions.
- Adding solar panels to the QSR’s roof contributed to a 7.2% reduction in CO2e emissions, demonstrating the feasibility of solar PV technology even in regions far from the equator.
- Increasing the deadband temperature of the QSR by 2 K resulted in a 1.7% reduction in carbon emissions.
- The use of a low GWP refrigerant had a minimal impact on emissions, reducing them by only 0.5% due to the small refrigerant charge in the cold stores.
- The impact of climate change on the total annual energy consumption in the QSR of the UK was minimal, with increases of only 0.02% under RCP 8.5 and 0.04% under RCP 4.5.
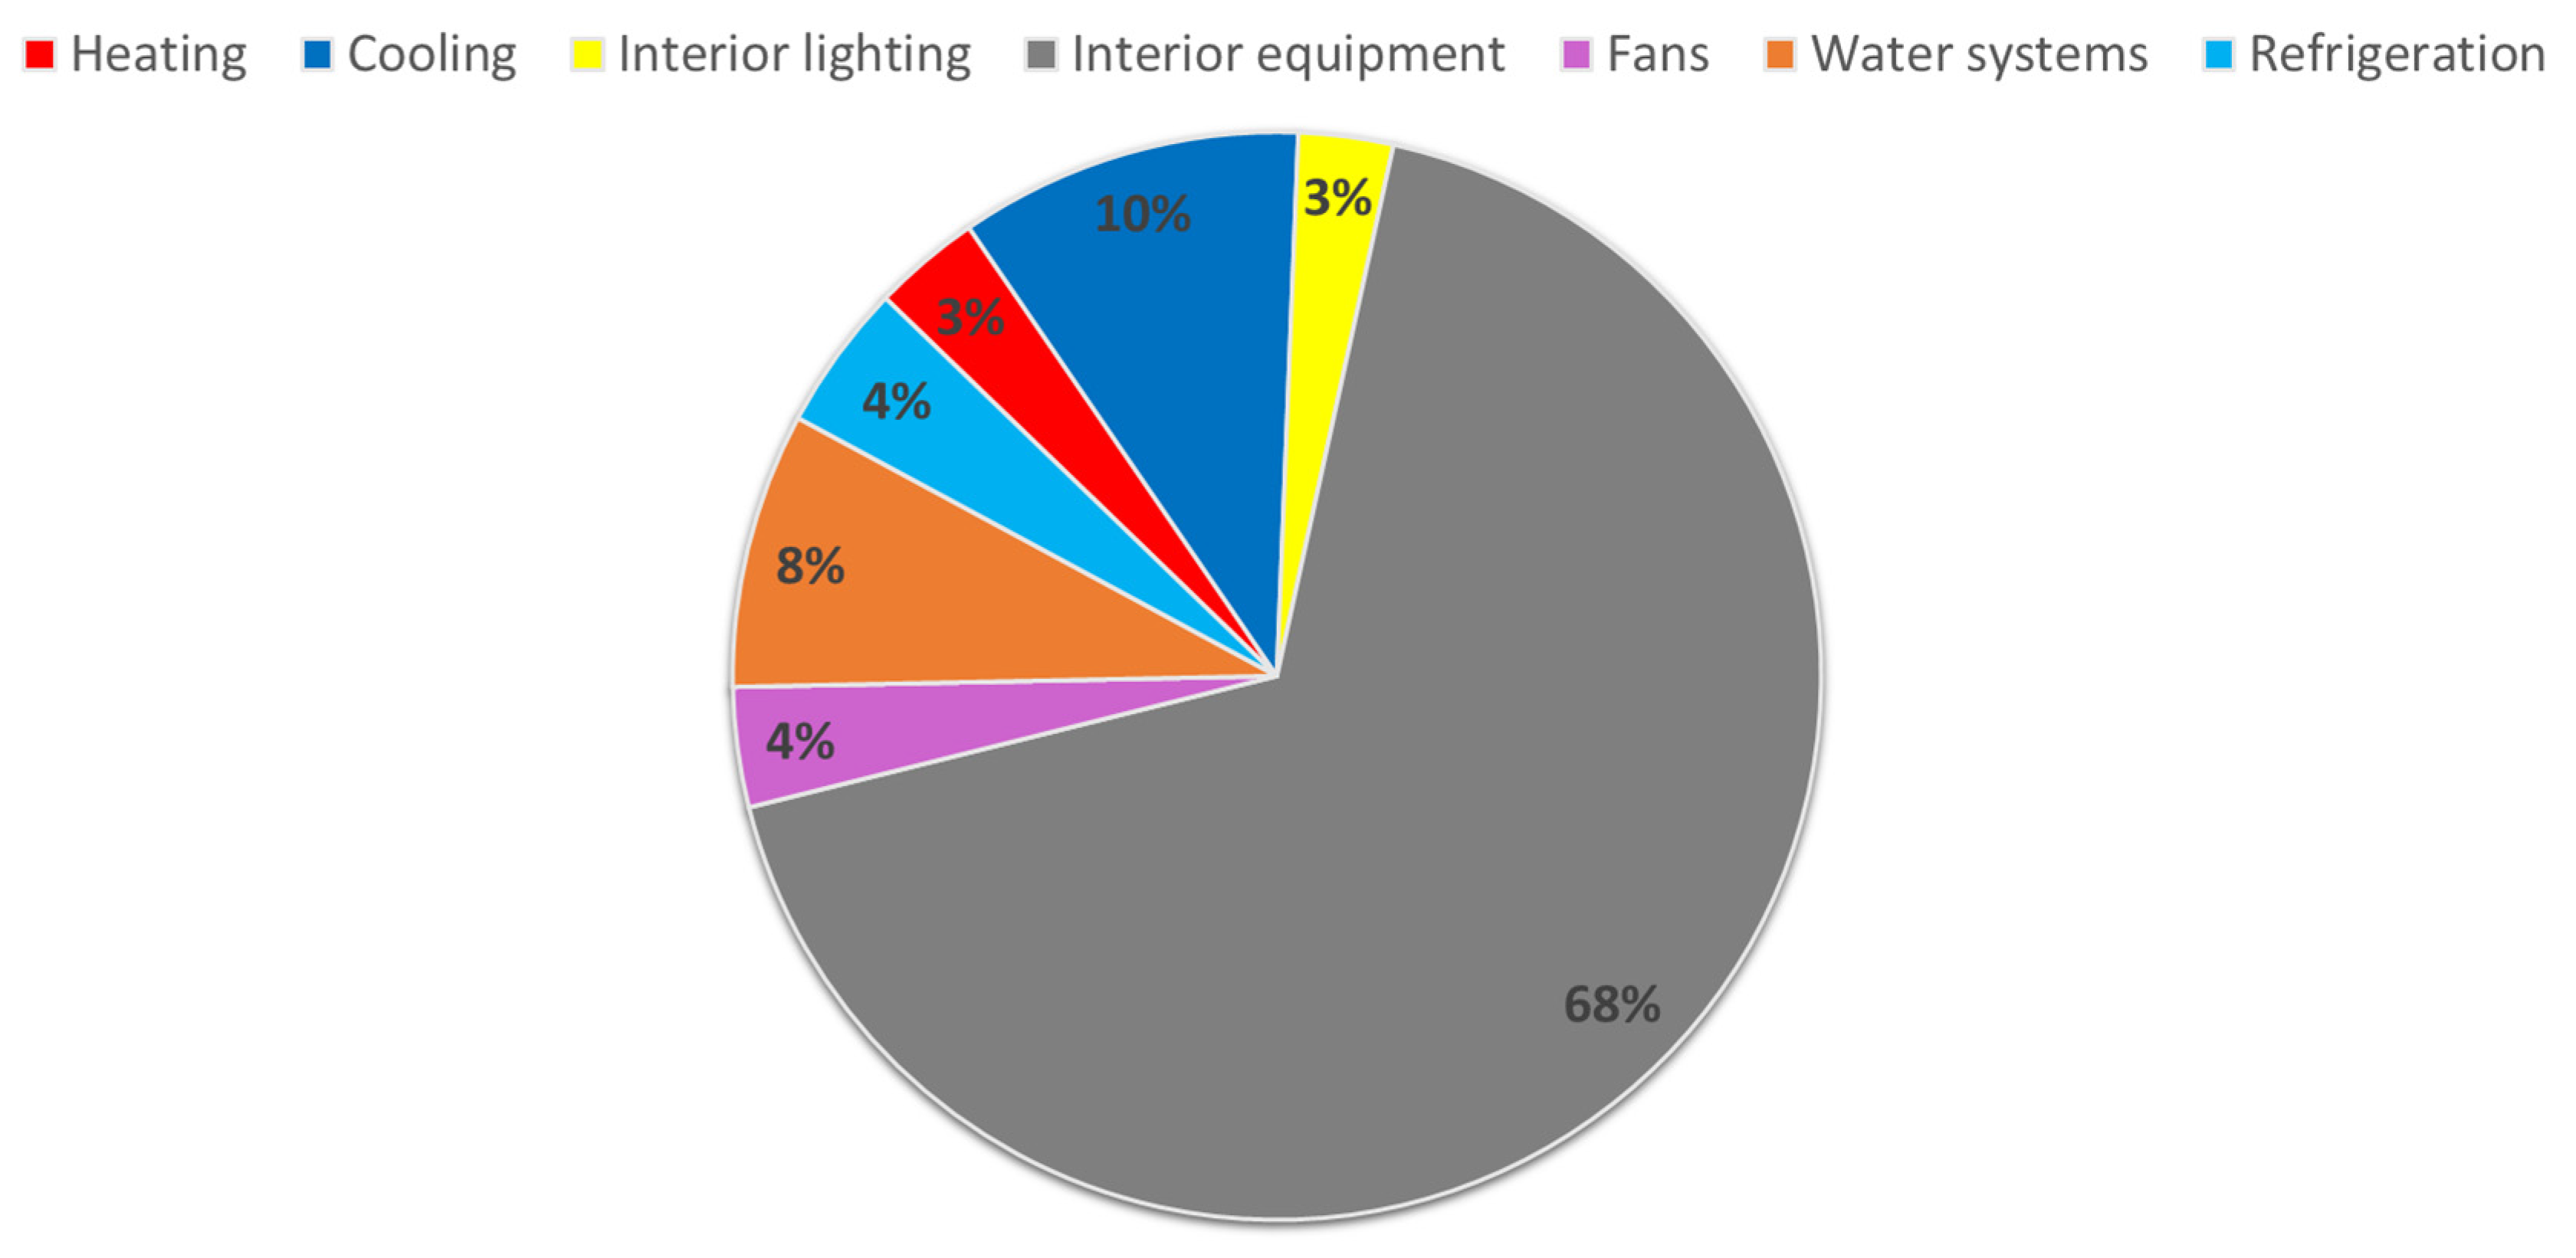
- Kitchen equipment was identified as the largest contributor to energy usage in the QSR.
Author Contributions
Funding
Data Availability Statement
Conflicts of Interest
Nomenclature
| Abbreviations | |
| ANL | Argonne National Laboratory |
| ASHRAE | American Society of Heating, Refrigeration and Airconditioning Engineers |
| BEES | Building Energy Efficiency Survey |
| BEIS | Business, Energy and Industrial Strategy |
| COP | Coefficient Of Performance |
| CO2 | Carbon Dioxide |
| DX | Direct expansion |
| EGCI | Electrical grid carbon intensity |
| EU | European Union |
| EUI | Energy use intensity |
| GHG | Greenhouse gas |
| GWP | Global Warming Potential |
| HVAC | Heating, ventilation, and air conditioning |
| IPCC | Intergovernmental Panel on Climate Change |
| LBNL | Lawrence Berkeley National Laboratory |
| LT | Low temperature |
| MT | Medium temperature |
| NG | Natural Gas |
| NREL | National Renewable Energy Laboratory |
| ORNL | Oak Ridge National Laboratory |
| PV | Photovoltaic |
| PNNL | Pacific Northwest National Laboratory |
| PRHP | Packaged rooftop heat pump |
| PTHP | Packaged terminal heat pump |
| QSR | Quick-service restaurant |
| RCP | Representative concentration pathway |
| TEWI | Total equivalent warming impact |
| UK | United Kingdom |
| Greek Symbol | |
| β | Indirect emission factor [kg CO2e/kWh] |
| Symbols | |
| E | Electrical consumption [kWh/year] |
| L | Leakage rate [%/year] |
| m | Refrigerant charge [kg] |
| T | Temperature [°C] |
| U | Heat transfer coefficient [W/m2.K] |
| Subscripts | |
| c | Cooling |
| d | Dry bulb |
| h | Heating |
| r | Rated conditions |
| T | Temperature |
| w | Wet bulb |
References
- Poore, J.; Nemecek, T. Reducing food’s environmental impacts through producers and consumers. Science 2018, 360, 987–992. [Google Scholar] [CrossRef] [PubMed]
- Crippa, M.; Solazzo, E.; Guizzardi, D.; Monforti-Ferrario, F.; Tubiello, F.N.; Leip, A.J.N.F. Food systems are responsible for a third of global anthropogenic GHG emissions. Nat. Food 2021, 2, 198–209. [Google Scholar] [CrossRef] [PubMed]
- Foster, A.; Brown, T.; Evans, J. Carbon emissions from refrigeration used in the UK food industry. Int. J. Refrig. 2023, 150, 297–303. [Google Scholar]
- UNOX. Energy Savings and Lower CO2 Emissions in Catering: The 5 Steps That Can Reduce the Carbon Footprint of Your Business. 2023. Available online: https://www.unox.com/en_gb/blog/reduce-carbon-footprint-of-business-in-5-steps/ (accessed on 13 November 2023).
- CIBSE. Guide F Energy Efficiency in Buildings; The Chartered Institution of Building Services Engineers (CIBSE): London, UK, 2012. [Google Scholar]
- Mudie, S.A.; Essah, E.; Grandison, A.; Felgate, R. Benchmarking energy use in licensed restaurants and pubs. In Proceedings of the CIBSE Technical Symposium, Liverpool, UK, 11–12 April 2013. [Google Scholar]
- Gunasegaran, M.K.; Hasanuzzaman, M.; Tan, C.; Bakar, A.H.A.; Ponniah, V. Energy Consumption, Energy Analysis, and Solar Energy Integration for Commercial Building Restaurants. Energies 2023, 16, 7145. [Google Scholar] [CrossRef]
- Statista. Market Size of the Quick Service Restaurant Industry Worldwide in 2022 and 2023. 2023. Available online: https://www.statista.com/statistics/1186194/fast-food-restaurant-industry-market-size-global/ (accessed on 2 May 2024).
- Hai, T.; Alenizi, F.A.; Mohammed, A.H.; Singh, P.K.; Metwally, A.S.M.; Ullah, M. Optimal design modeling of an energy system for a near-zero energy restaurant with green hydrogen energy storage systems. Fuel 2023, 351, 128896. [Google Scholar] [CrossRef]
- Uddin, M.N.; Ruva, I.J.; Syed, M.A.; Hossain, D.; Akter, R.; Tamanna, N.; Rahman, A.; Saka, A. Occupant centric energy renovation strategy for hospital and restaurant building envelop using distinct modellingtools: A case study from low-income cultural context. Energy Build. 2022, 272, 112338. [Google Scholar] [CrossRef]
- Lollini, R.; Danza, L.; Meroni, I. Energy efficiency of a dynamic glazing system. Sol. Energy 2010, 84, 526–537. [Google Scholar] [CrossRef]
- Eid, E.; Foster, A.; Alvarez, G.; Ndoye, F.-T.; Leducq, D.; Evans, J. Modelling energy consumption in a Paris supermarket to reduce energy use and greenhouse gas emissions using EnergyPlus. Int. J. Refrig. 2024, 168, 1–8. [Google Scholar] [CrossRef]
- Eid, E.; Foster, A.; Alvarez, G.; Campbell, R.; Evans, J. Modelling of energy use and greenhouse gas emissions from a quick service restaurant. In Proceedings of the 8th IIR International Conference on Sustainability and the Cold Chain 2024, Tokyo, Japan, 9 June–11 July 2024. [Google Scholar] [CrossRef]
- U.S. Department of Energy. EnergyPlus Version 24.1.0 Documentation. Engineering Reference. 2024. Available online: https://energyplus.net/assets/nrel_custom/pdfs/pdfs_v24.1.0/EngineeringReference.pdf (accessed on 5 May 2024).
- Department for Business, Energy & Industrial Strategy. Building Energy Efficiency Survey BEES: Hospitality Sector, 2014–15; Department for Business, Energy & Industrial Strategy: London, UK, 2016.
- Dickinson, R.; Brannon, B. Generating future weather files for resilience. In Proceedings of the International Conference on Passive and Low Energy Architecture, Los Angeles, CA, USA, 11–13 July 2016; pp. 11–13. [Google Scholar]
- Foster, A.; Hammond, E.; Brown, T.; Maidment, G.; Evans, J. Technological Options for Retail Refrigeration; International Institute of Refrigeration/London South Bank University: London, UK, 2018. [Google Scholar]
- Goel, S.; Rosenberg, M.I.; Eley, C. Ansi/Ashrae/Ies Standard 90.1-2016 Performance Rating Method Reference Manual (No. PNNL-26917); Pacific Northwest National Lab (PNNL): Richland, WA, USA, 2017. [Google Scholar]
- Emerson. CO2 Product Guide 2021 for Refrigeration Applications. 2021. Available online: https://media.copeland.com/693d2049-68af-411e-8b72-b16b010424f7/TGE175-CO2-Product-Guide-EN-2102.pdf (accessed on 13 August 2022).
- Petersen, M.; Pottker, G.; Sethi, A.; Yana Motta, S.F. Refrigerants with Low Environmental Impact for Commercial Refrigeration Systems. In Proceedings of the International Refrigeration and Air Conditioning Conference, West Lafayette, IN, USA, 9–12 July 2018. [Google Scholar]
- Brown, P.; Cardenas, L.; Choudrie, S.; Del Vento, S.; Karagianni, E.; MacCarthy, J.; Mullen, P.; Passant, N.; Richmond, B.; Smith, H.; et al. UK Greenhouse Gas Inventory, 1990 to 2019, Annual Report for Submission under the Framework Convention on Climate Change 2021; Ricardo Energy & Environment: Oxford, UK, 2021; ISBN 978-0-9933975-7-8. [Google Scholar]
- Gagnon, P.; Margolis, R.; Melius, J.; Phillips, C.; Elmore, R. Rooftop Solar Photovoltaic Technical Potential in the United States. A Detailed Assessment (No. NREL/TP-6A20-65298); National Renewable Energy Lab (NREL): Golden, CO, USA, 2016. [Google Scholar]
- UK Department for Energy Security & Net Zero. Green Book Supplementary Guidance: Valuation of Energy Use and Greenhouse Gas Emissions for Appraisal. 2023. Available online: www.gov.uk (accessed on 8 March 2024).
- IPCC. Climate Change: The Physical Science Basis. Contribution of Working Group I to the Fifth Assessment Report of the Intergovernmental Panel on Climate Change; Stocker, T.F., Qin, D., Plattner, G.-K., Tignor, M., Allen, S.K., Boschung, J., Nauels, A., Xia, Y., Bex, V., Midgley, P.M., Eds.; Cambridge University Press: Cambridge, UK; New York, NY, USA, 2013; p. 1535. Available online: https://www.ipcc.ch/report/ar5/wg1/ (accessed on 12 December 2023).


| 2022 | 2025 | 2030 | 2035 | 2040 | 2045 | 2050 | |
|---|---|---|---|---|---|---|---|
| (kg CO2e/kWh) | 0.158 | 0.131 | 0.049 | 0.020 | 0.016 | 0.008 | 0.003 |
| Month | Measured Data (kWh) | Simulated Data (kWh) | % Difference |
|---|---|---|---|
| Jan | 45,338 | 47,362 | 4.5% |
| Feb | 41,340 | 43,003 | 4.0% |
| Mar | 42,098 | 46,646 | 10.8% |
| Apr | 47,900 | 45,307 | −5.4% |
| May | 48,345 | 47,064 | −2.6% |
| Jun | 45,860 | 45,794 | −0.1% |
| Jul | 51,763 | 48,122 | −7.0% |
| Aug | 50,597 | 47,761 | −5.6% |
| Sep | 46,010 | 45,440 | −1.2% |
| Oct | 45,865 | 46,628 | 1.7% |
| Nov | 44,210 | 45,193 | 2.2% |
| Dec | 46,051 | 47,294 | 2.7% |
| Total | 555,377 | 555,614 | 0.04% |
| Technology | Baseline | 1 | 2 | 3 | 4 | 5 | 6 | 7 |
|---|---|---|---|---|---|---|---|---|
| Energy consumption (MWh/year) | ||||||||
| Heating | 17.8 | 14.7 | 17.8 | 18.1 | 18.5 | 18.1 | 17.8 | 16.0 |
| Cooling | 56.6 | 52.4 | 56.6 | 50.7 | 44.8 | 14.6 | 56.6 | 8.8 |
| Interior lighting | 15.6 | 15.6 | 15.6 | 15.6 | 15.6 | 15.6 | 15.6 | 15.6 |
| Interior equipment | 376.1 | 376.1 | 376.1 | 341.3 | 307.3 | 376.1 | 376.1 | 279.8 |
| Fans | 19.8 | 17.5 | 19.8 | 18.7 | 17.5 | 19.8 | 19.8 | 14.6 |
| Water systems | 45.5 | 45.5 | 45.5 | 45.5 | 45.5 | 45.5 | 45.5 | 45.5 |
| Refrigeration | 24.2 | 24.2 | 24.2 | 21.8 | 19.4 | 24.2 | 24.2 | 17.4 |
| Solar PV panels | - | - | - | - | - | - | −40.1 | −40.1 |
| Total | 555.6 | 546.0 | 555.6 | 511.7 | 468.6 | 513.9 | 515.5 | 357.6 |
| TEWI (t CO2e/year) | ||||||||
| 88.2 | 86.7 | 87.8 | 81.2 | 74.4 | 81.6 | 81.9 | 56.5 | |
| % Reduction in CO2e emissions compared to the baseline | - | 1.7 | 0.5 | 7.9 | 15.7 | 7.5 | 7.2 | 35.9 |
| Energy Consumption (MWh/Year) | |||||
|---|---|---|---|---|---|
| 2020 | 2050 (RCP 4.5) | 2050 (RCP 8.5) | |||
| % Change | % Change | ||||
| Heating | 17.8 | 16.5 | −7.30% | 15.1 | −15.17% |
| Cooling | 56.6 | 57.9 | 2.30% | 59.1 | 4.42% |
| Refrigeration | 24.2 | 24.4 | 0.83% | 24.5 | 1.24% |
| Others | 457.0 | 457.0 | 0.00% | 457.0 | 0.00% |
| Total | 555.6 | 555.8 | 0.04% | 555.7 | 0.02% |
Disclaimer/Publisher’s Note: The statements, opinions and data contained in all publications are solely those of the individual author(s) and contributor(s) and not of MDPI and/or the editor(s). MDPI and/or the editor(s) disclaim responsibility for any injury to people or property resulting from any ideas, methods, instructions or products referred to in the content. |
© 2025 by the authors. Licensee MDPI, Basel, Switzerland. This article is an open access article distributed under the terms and conditions of the Creative Commons Attribution (CC BY) license (https://creativecommons.org/licenses/by/4.0/).
Share and Cite
Eid, E.; Foster, A.; Alvarez, G.; Campbell, R.; Evans, J. Assessment of Energy Consumption and Greenhouse Gas Emissions in a UK Quick-Service Restaurant Using EnergyPlus. Energies 2025, 18, 1377. https://doi.org/10.3390/en18061377
Eid E, Foster A, Alvarez G, Campbell R, Evans J. Assessment of Energy Consumption and Greenhouse Gas Emissions in a UK Quick-Service Restaurant Using EnergyPlus. Energies. 2025; 18(6):1377. https://doi.org/10.3390/en18061377
Chicago/Turabian StyleEid, Elias, Alan Foster, Graciela Alvarez, Robin Campbell, and Judith Evans. 2025. "Assessment of Energy Consumption and Greenhouse Gas Emissions in a UK Quick-Service Restaurant Using EnergyPlus" Energies 18, no. 6: 1377. https://doi.org/10.3390/en18061377
APA StyleEid, E., Foster, A., Alvarez, G., Campbell, R., & Evans, J. (2025). Assessment of Energy Consumption and Greenhouse Gas Emissions in a UK Quick-Service Restaurant Using EnergyPlus. Energies, 18(6), 1377. https://doi.org/10.3390/en18061377


