

The Effect of Temperature and Current on the Insulation Performance of PE and PVC Power Cables: A Finite Element Approach


Abstract
1. Introduction
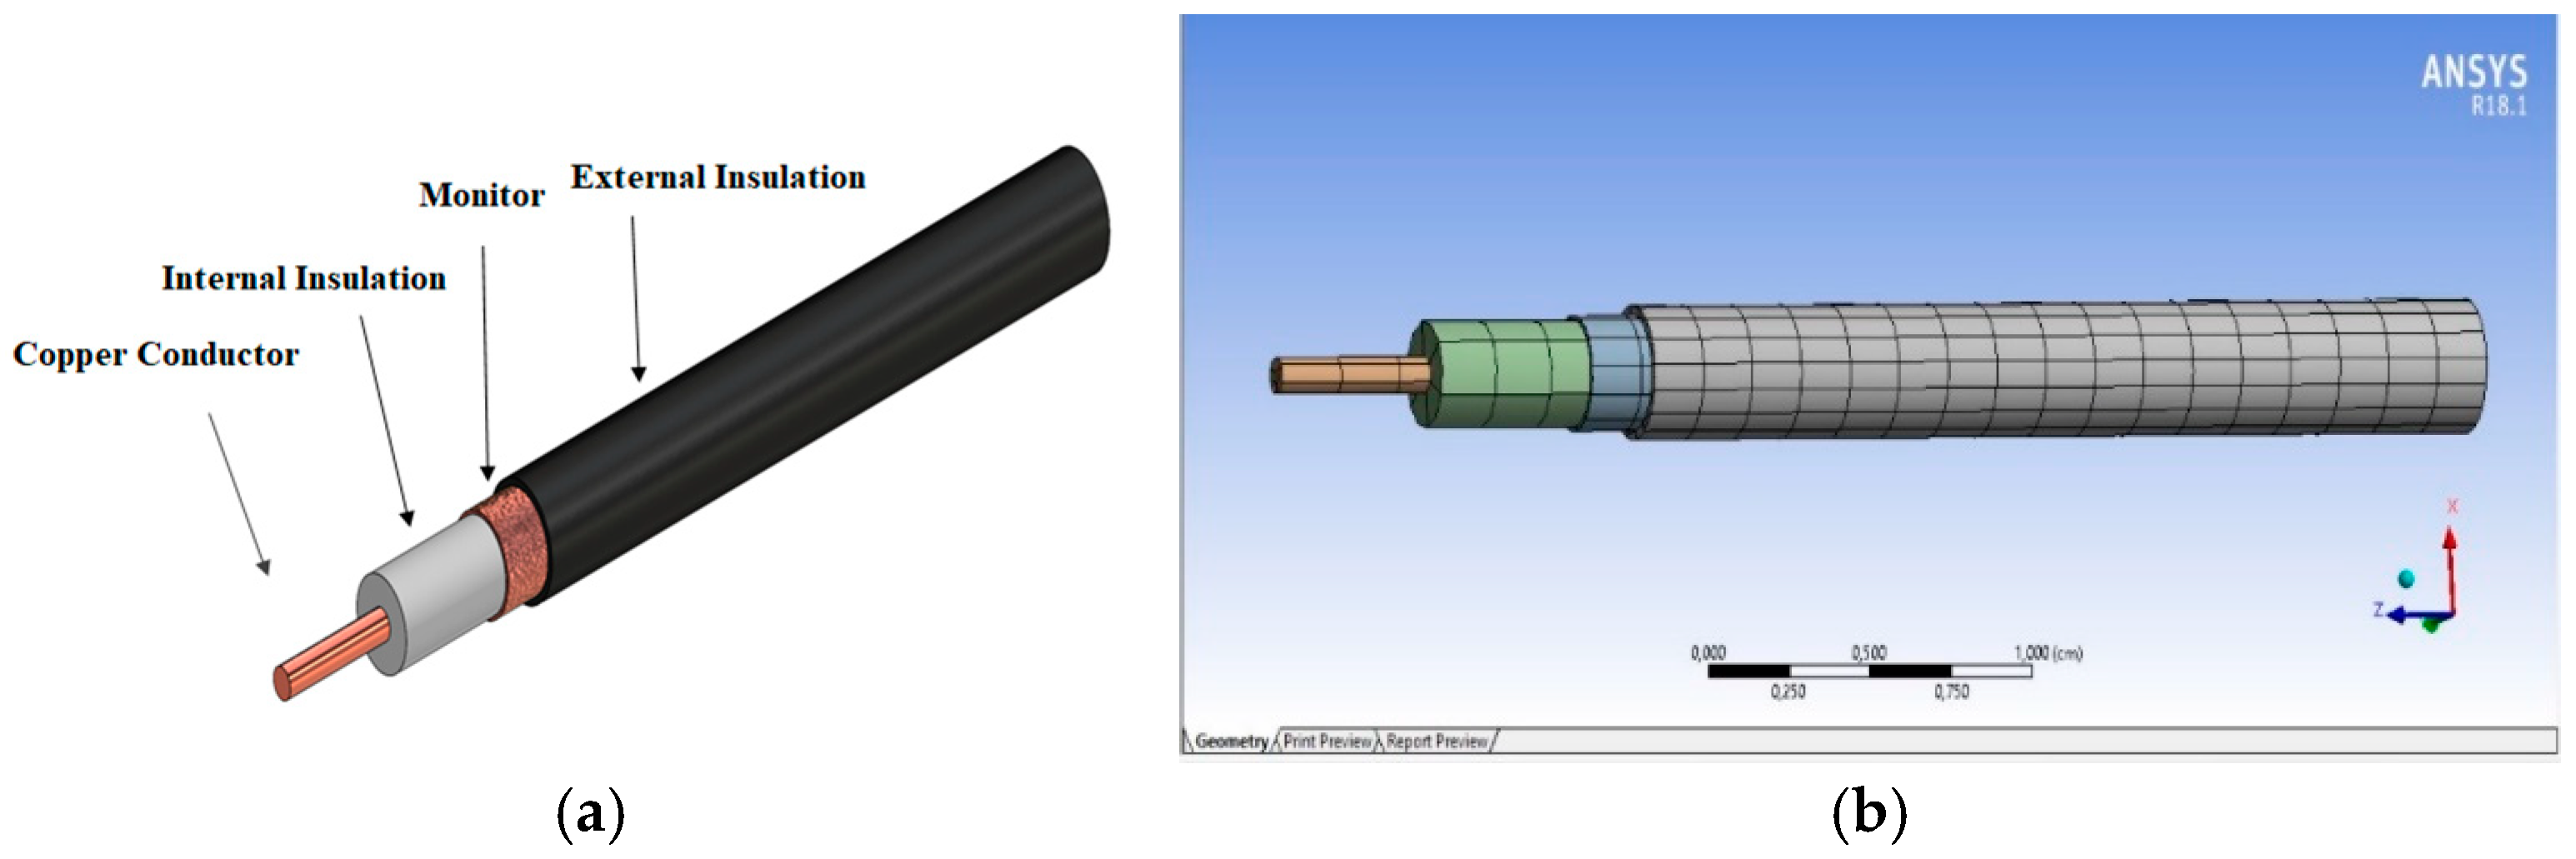
2. Materials and Methods
- ρ represents the density of the material;
- cₚ is the specific heat capacity;
- k is the thermal conductivity;
- T is the temperature;
- Q is the heat source term (in this case, the Joule heat).
3. Results and Discussion
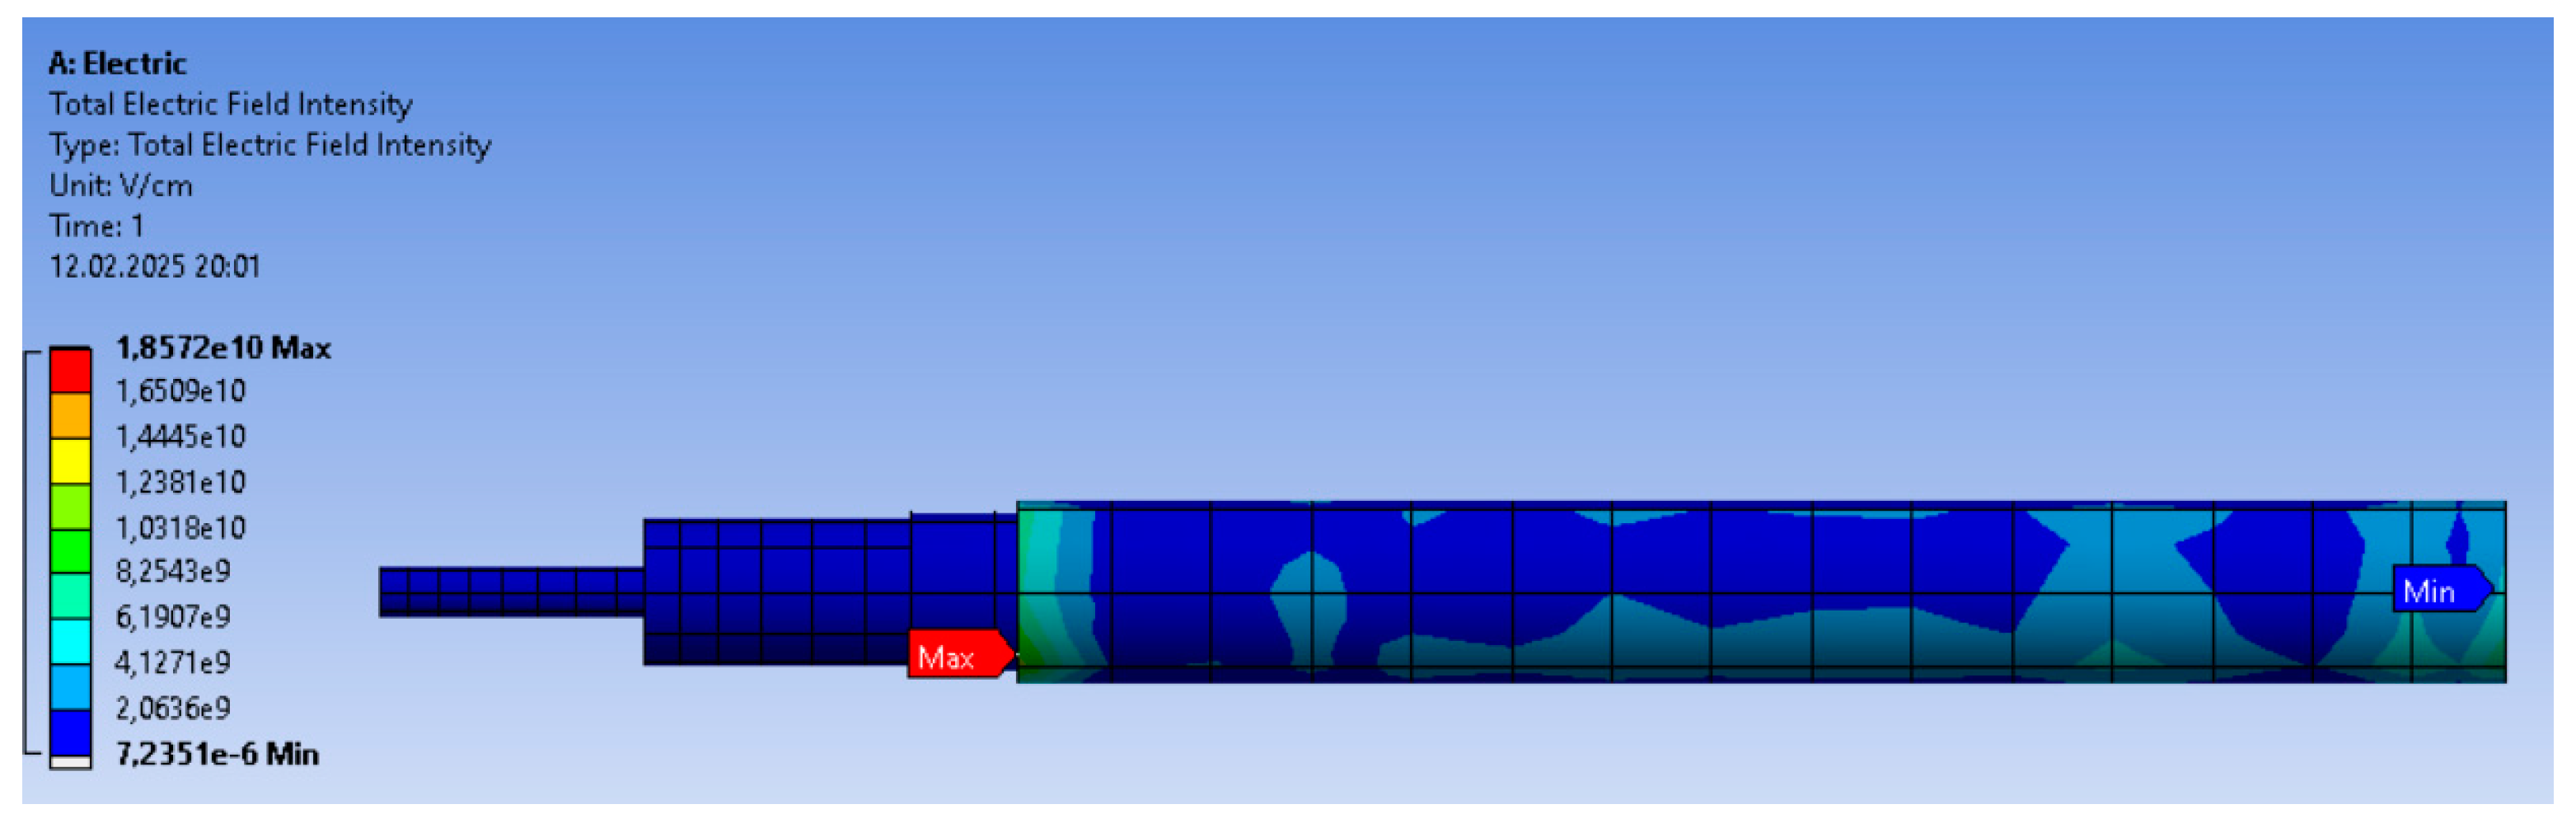
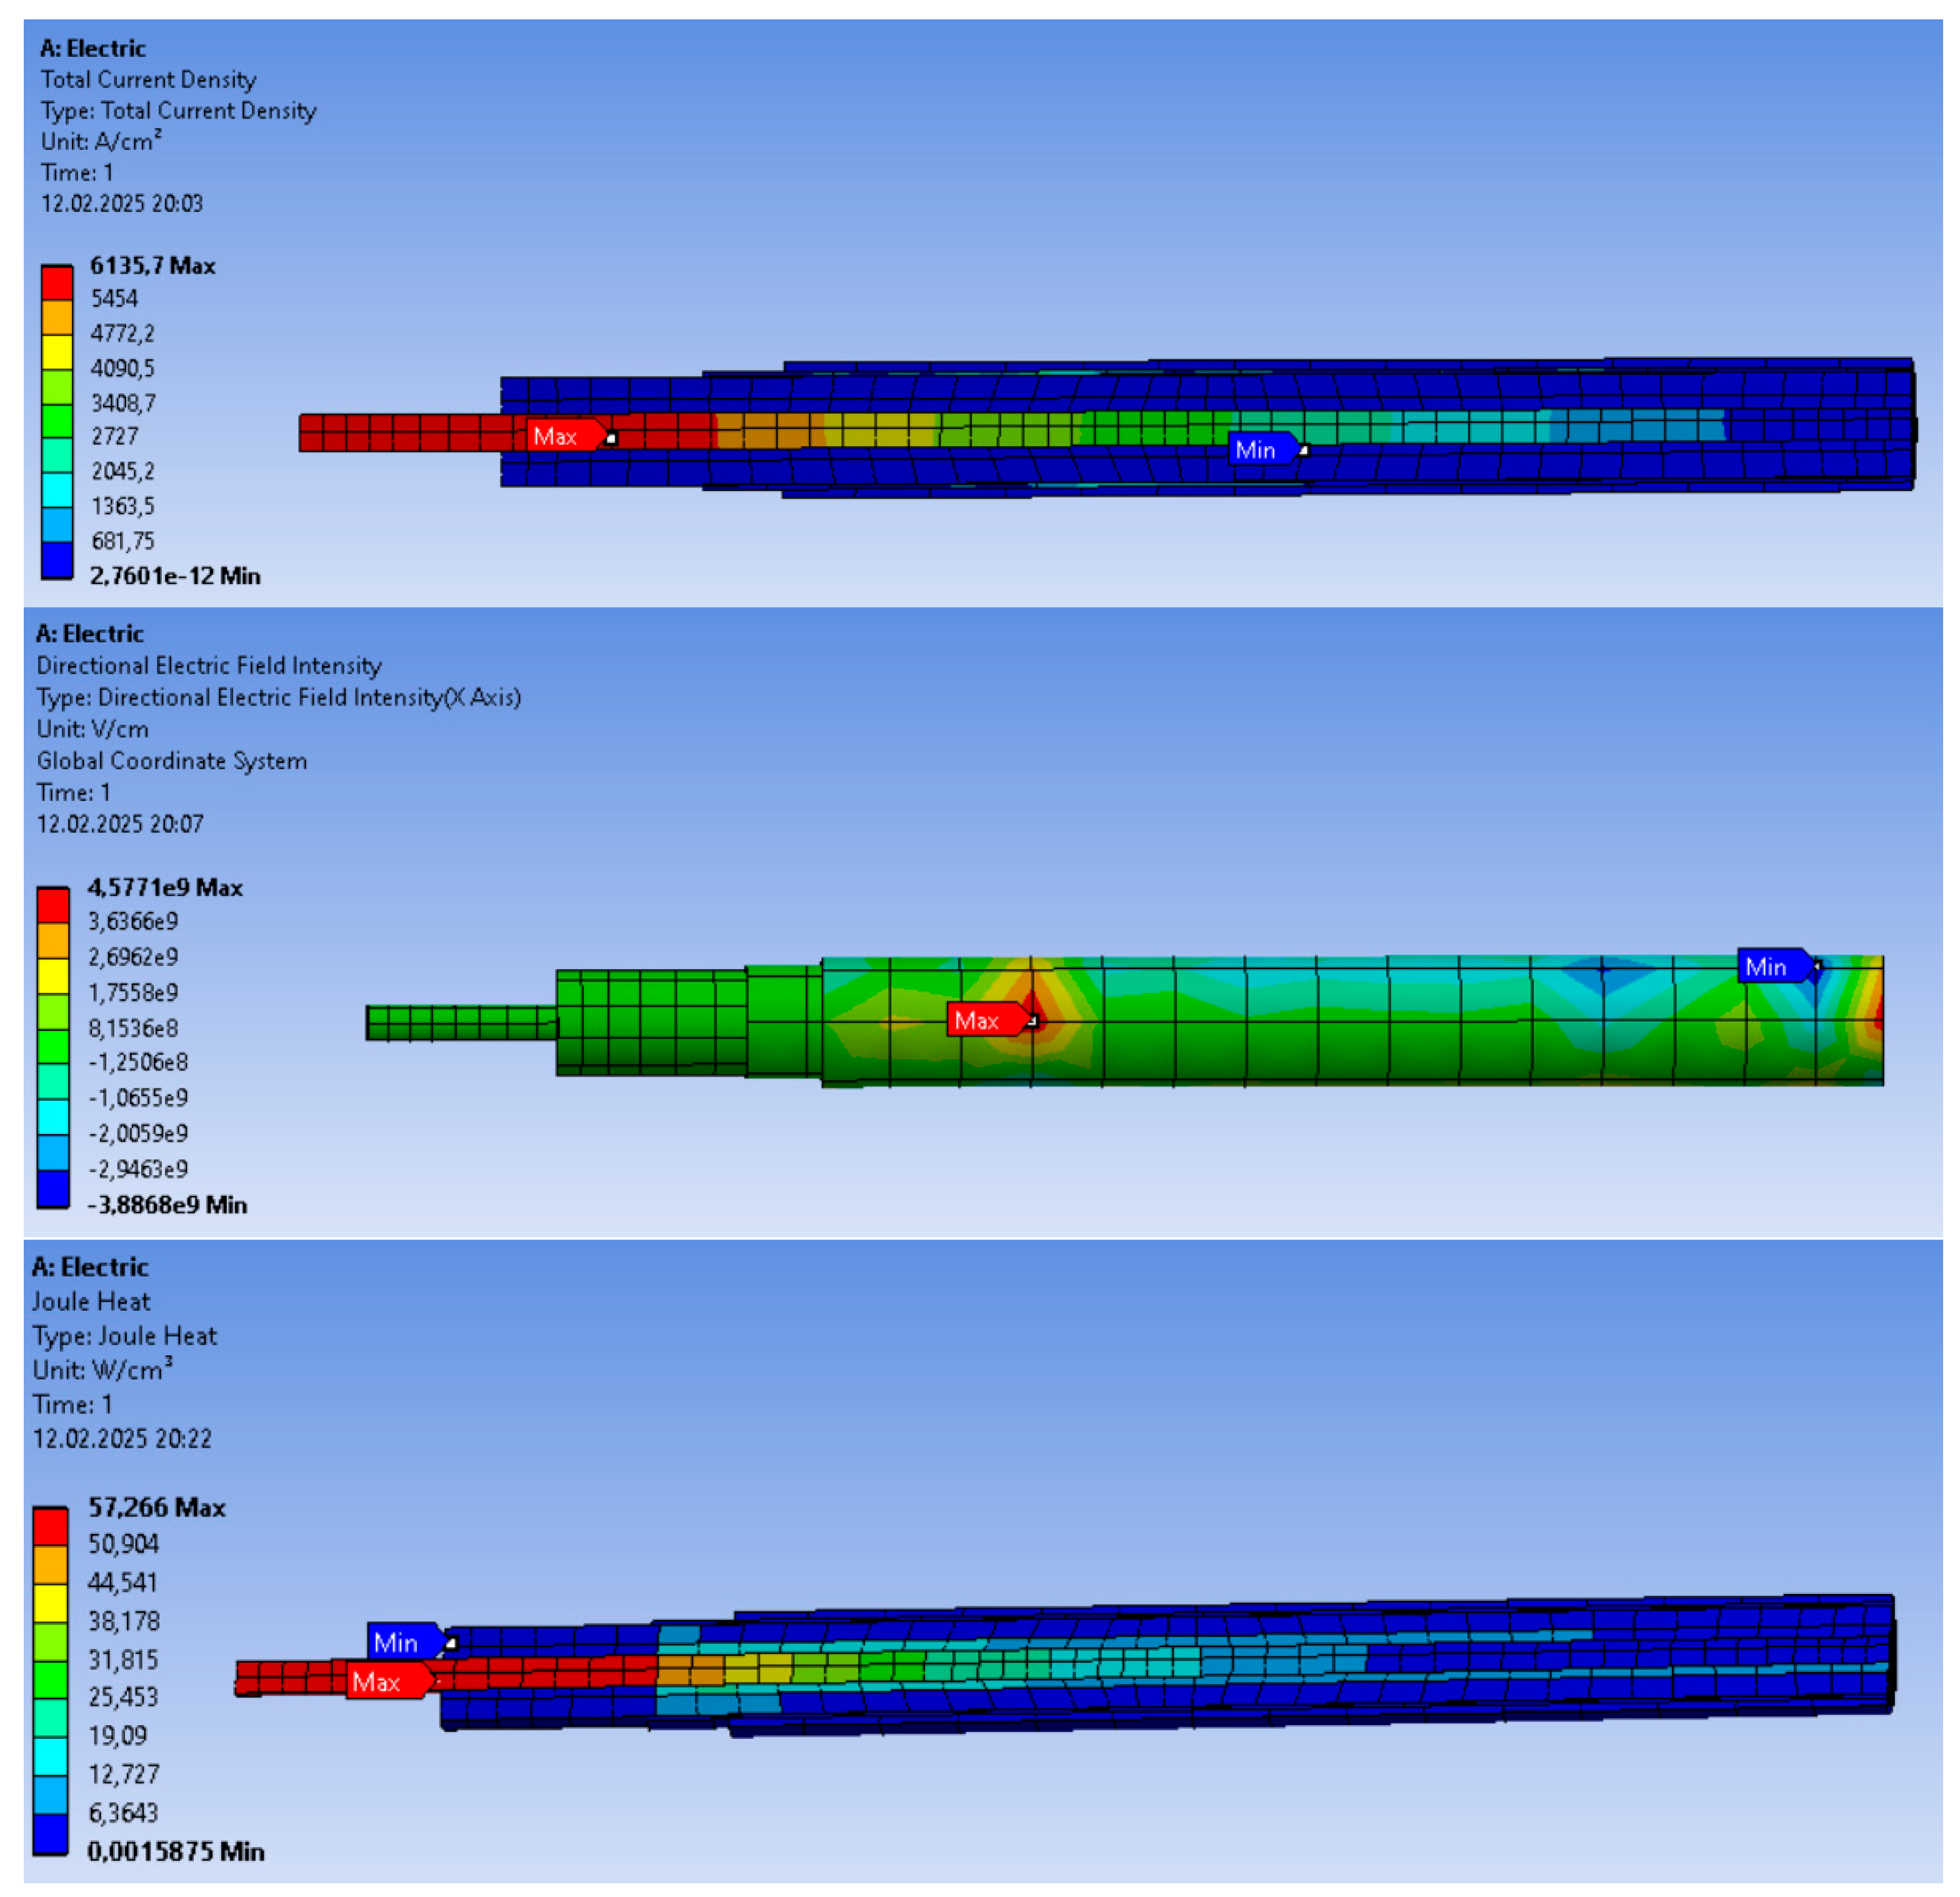
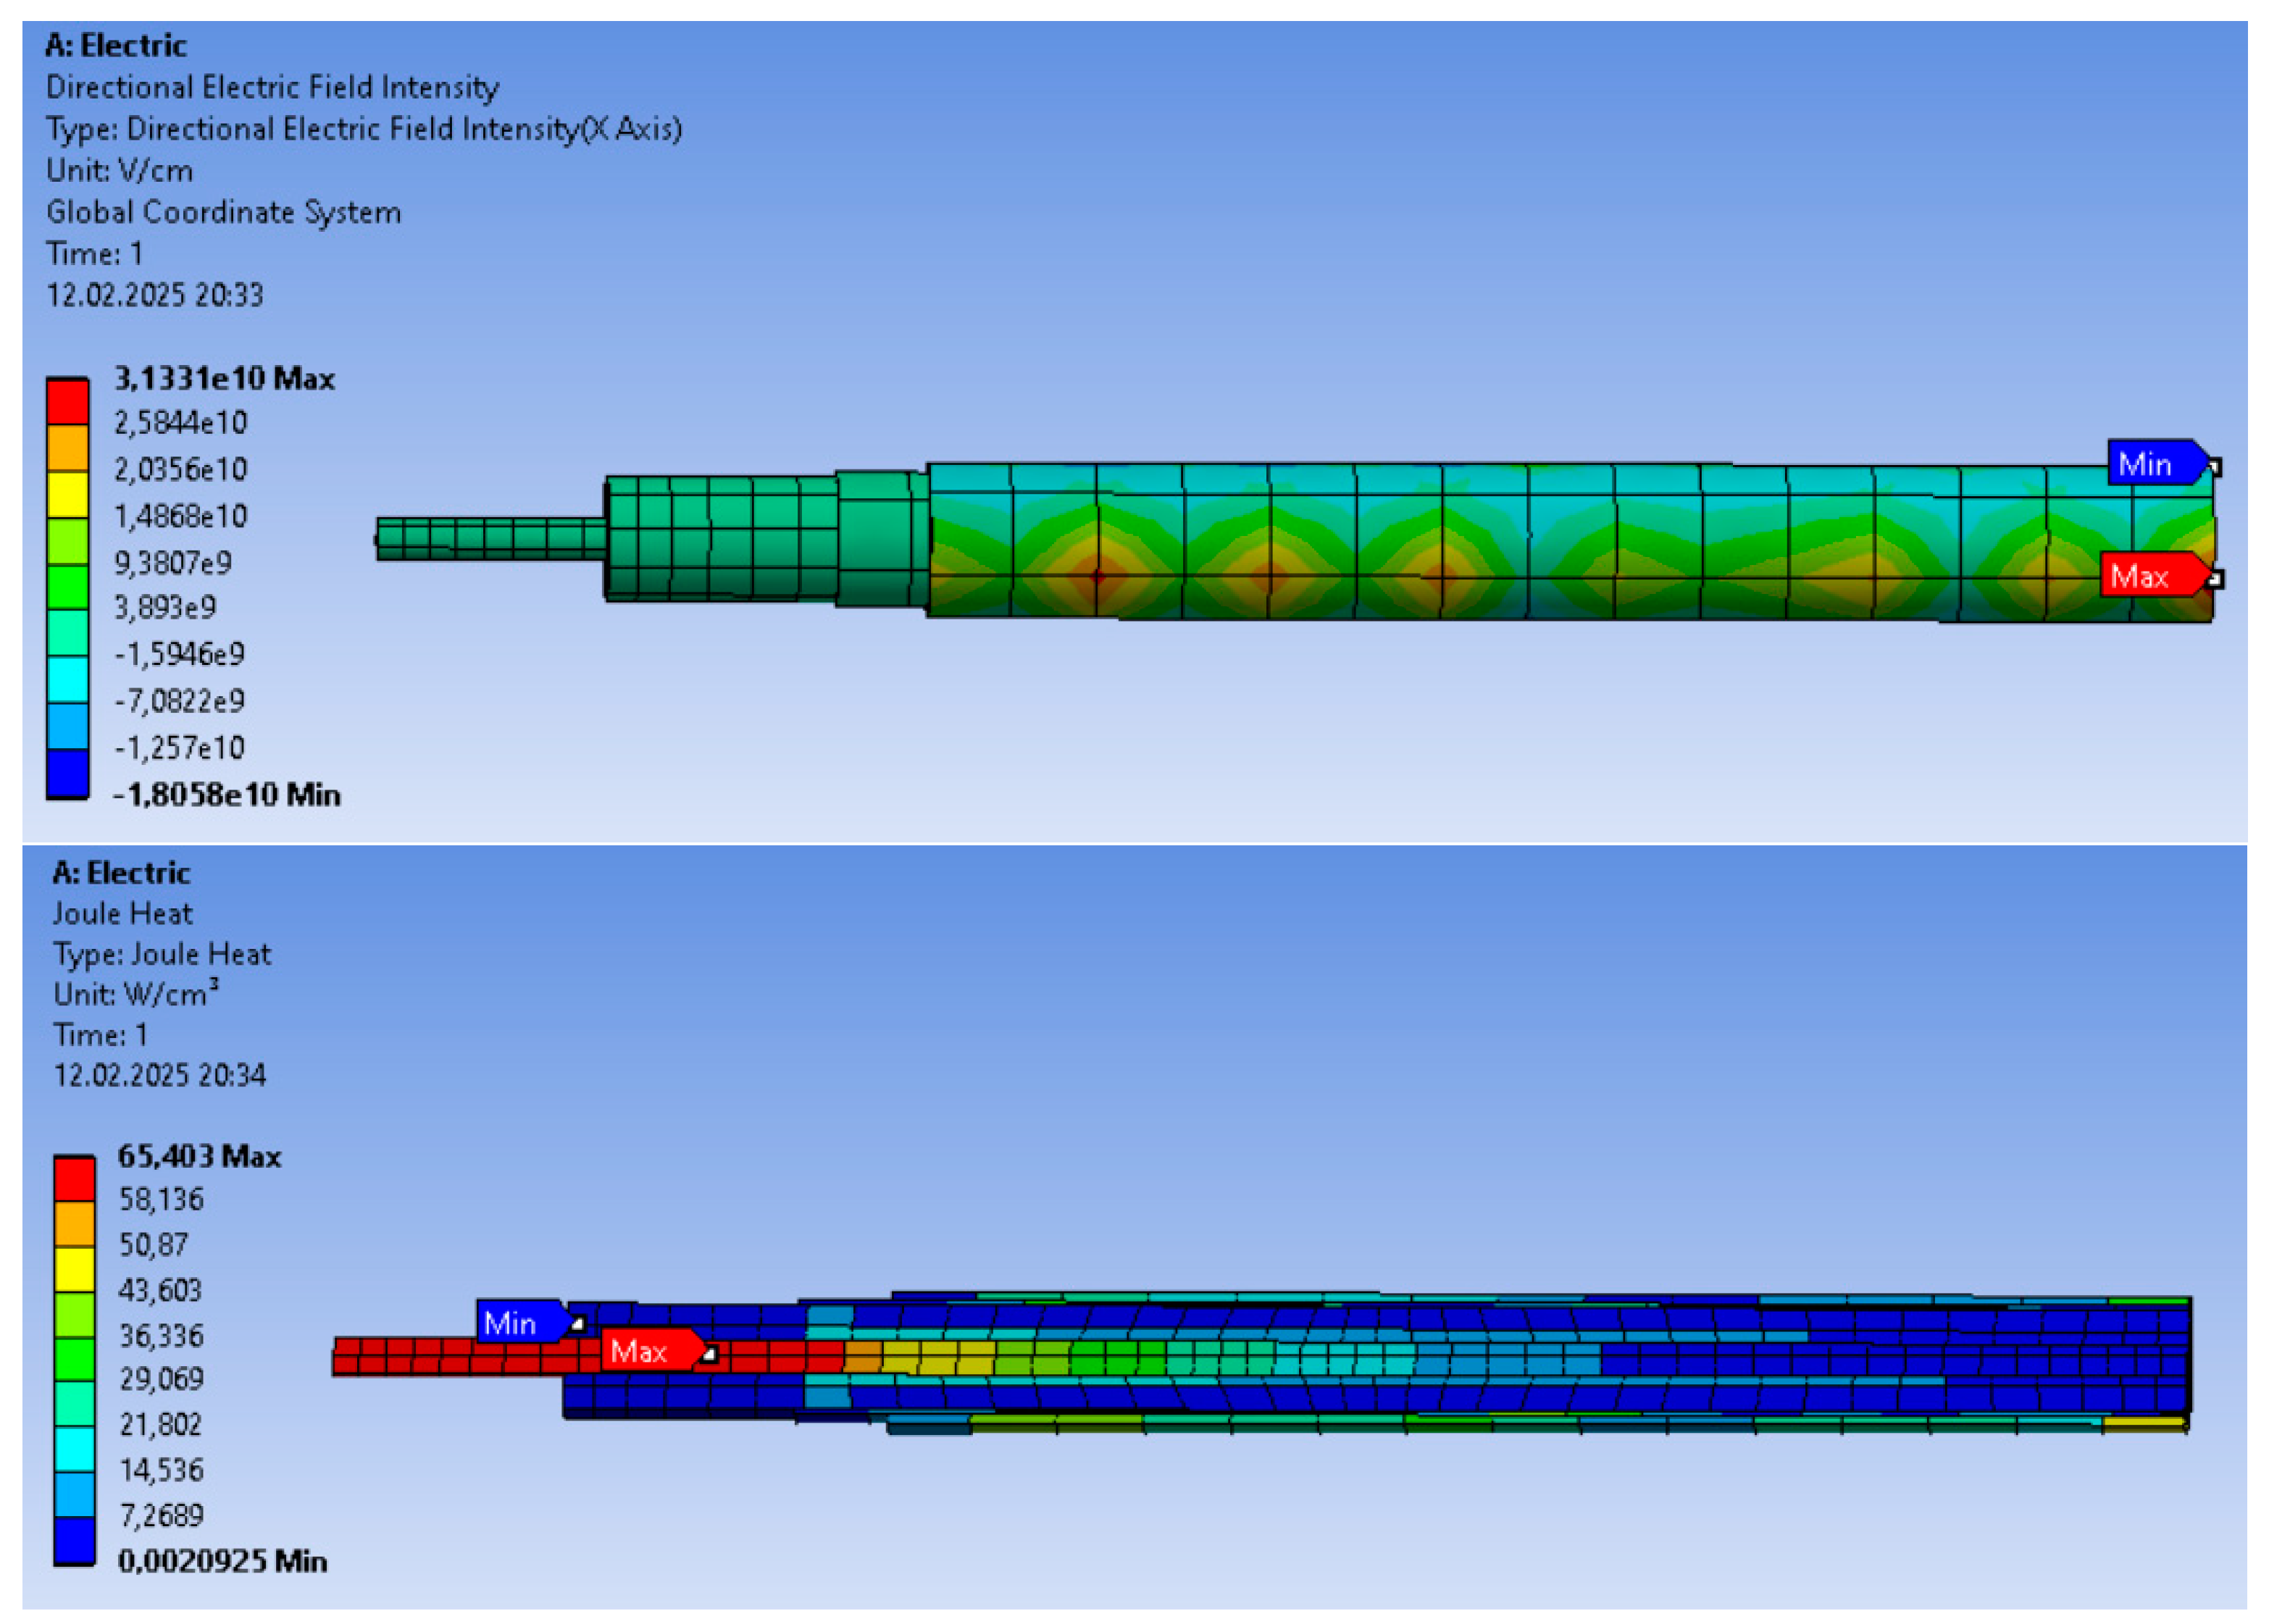
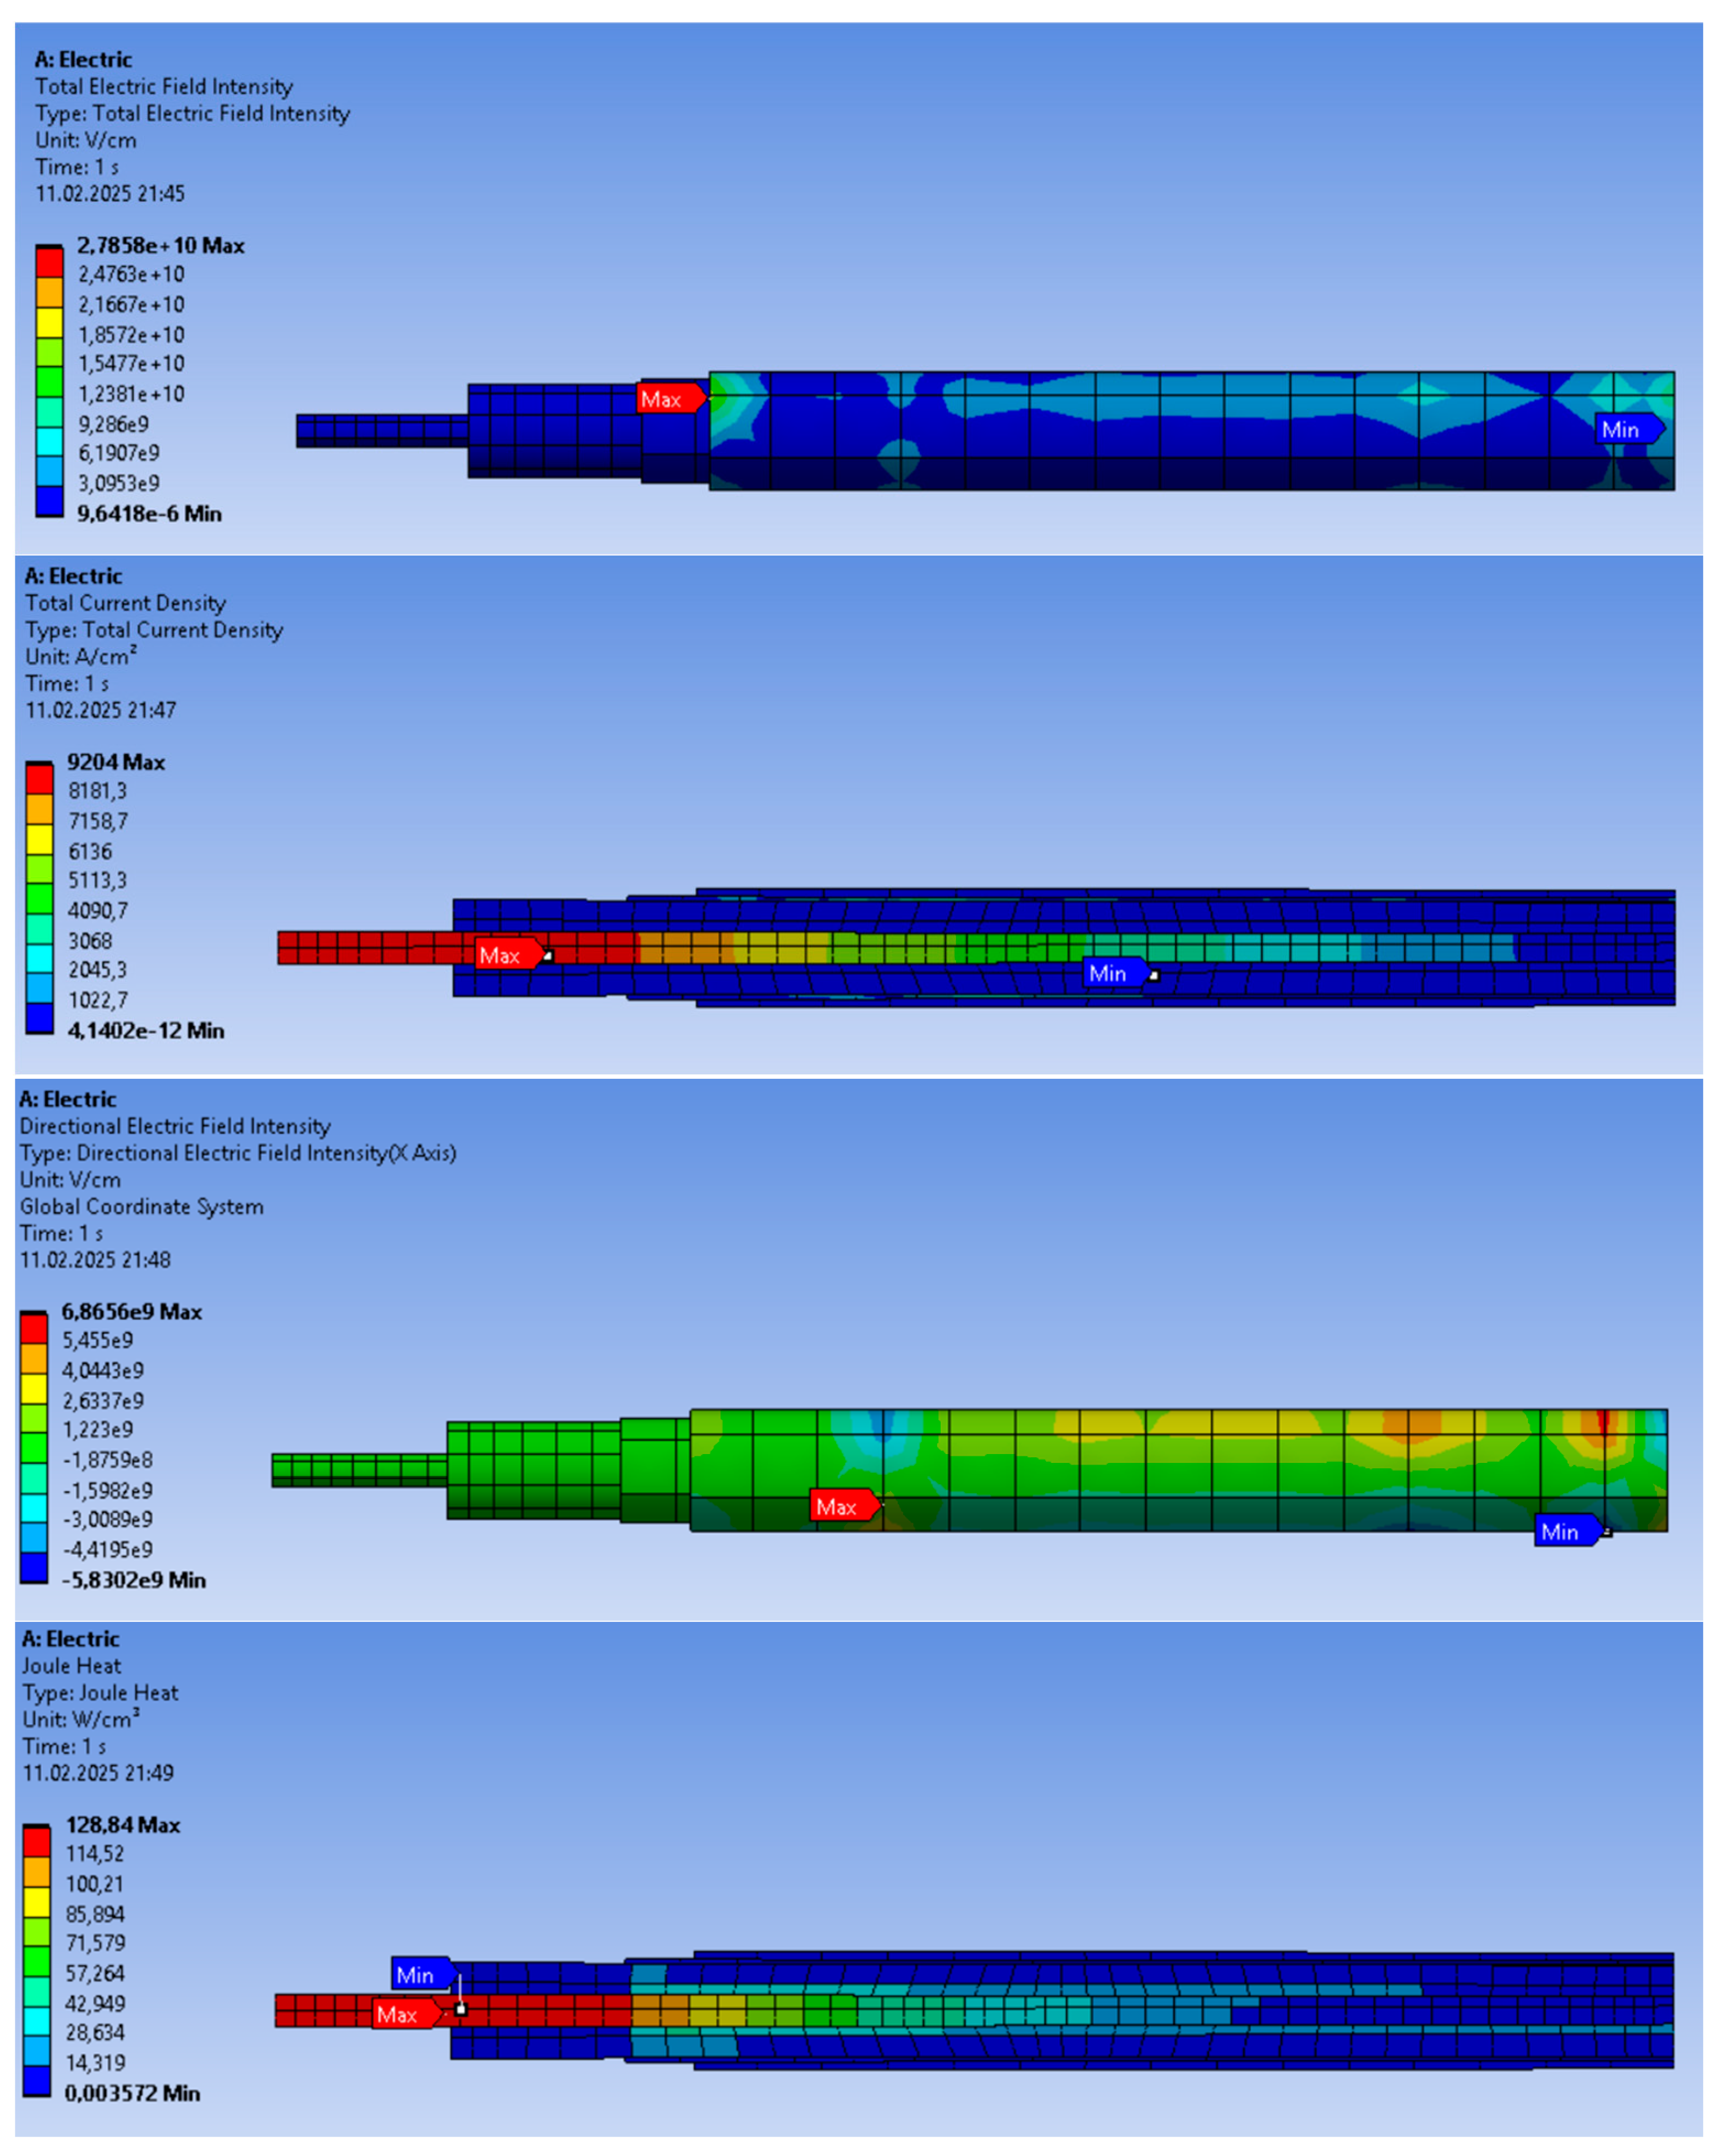
3.1. PE Simulation Results
3.1.1. Simulating Temperature Variations of PE
3.1.2. Simulating Current Variations of PE
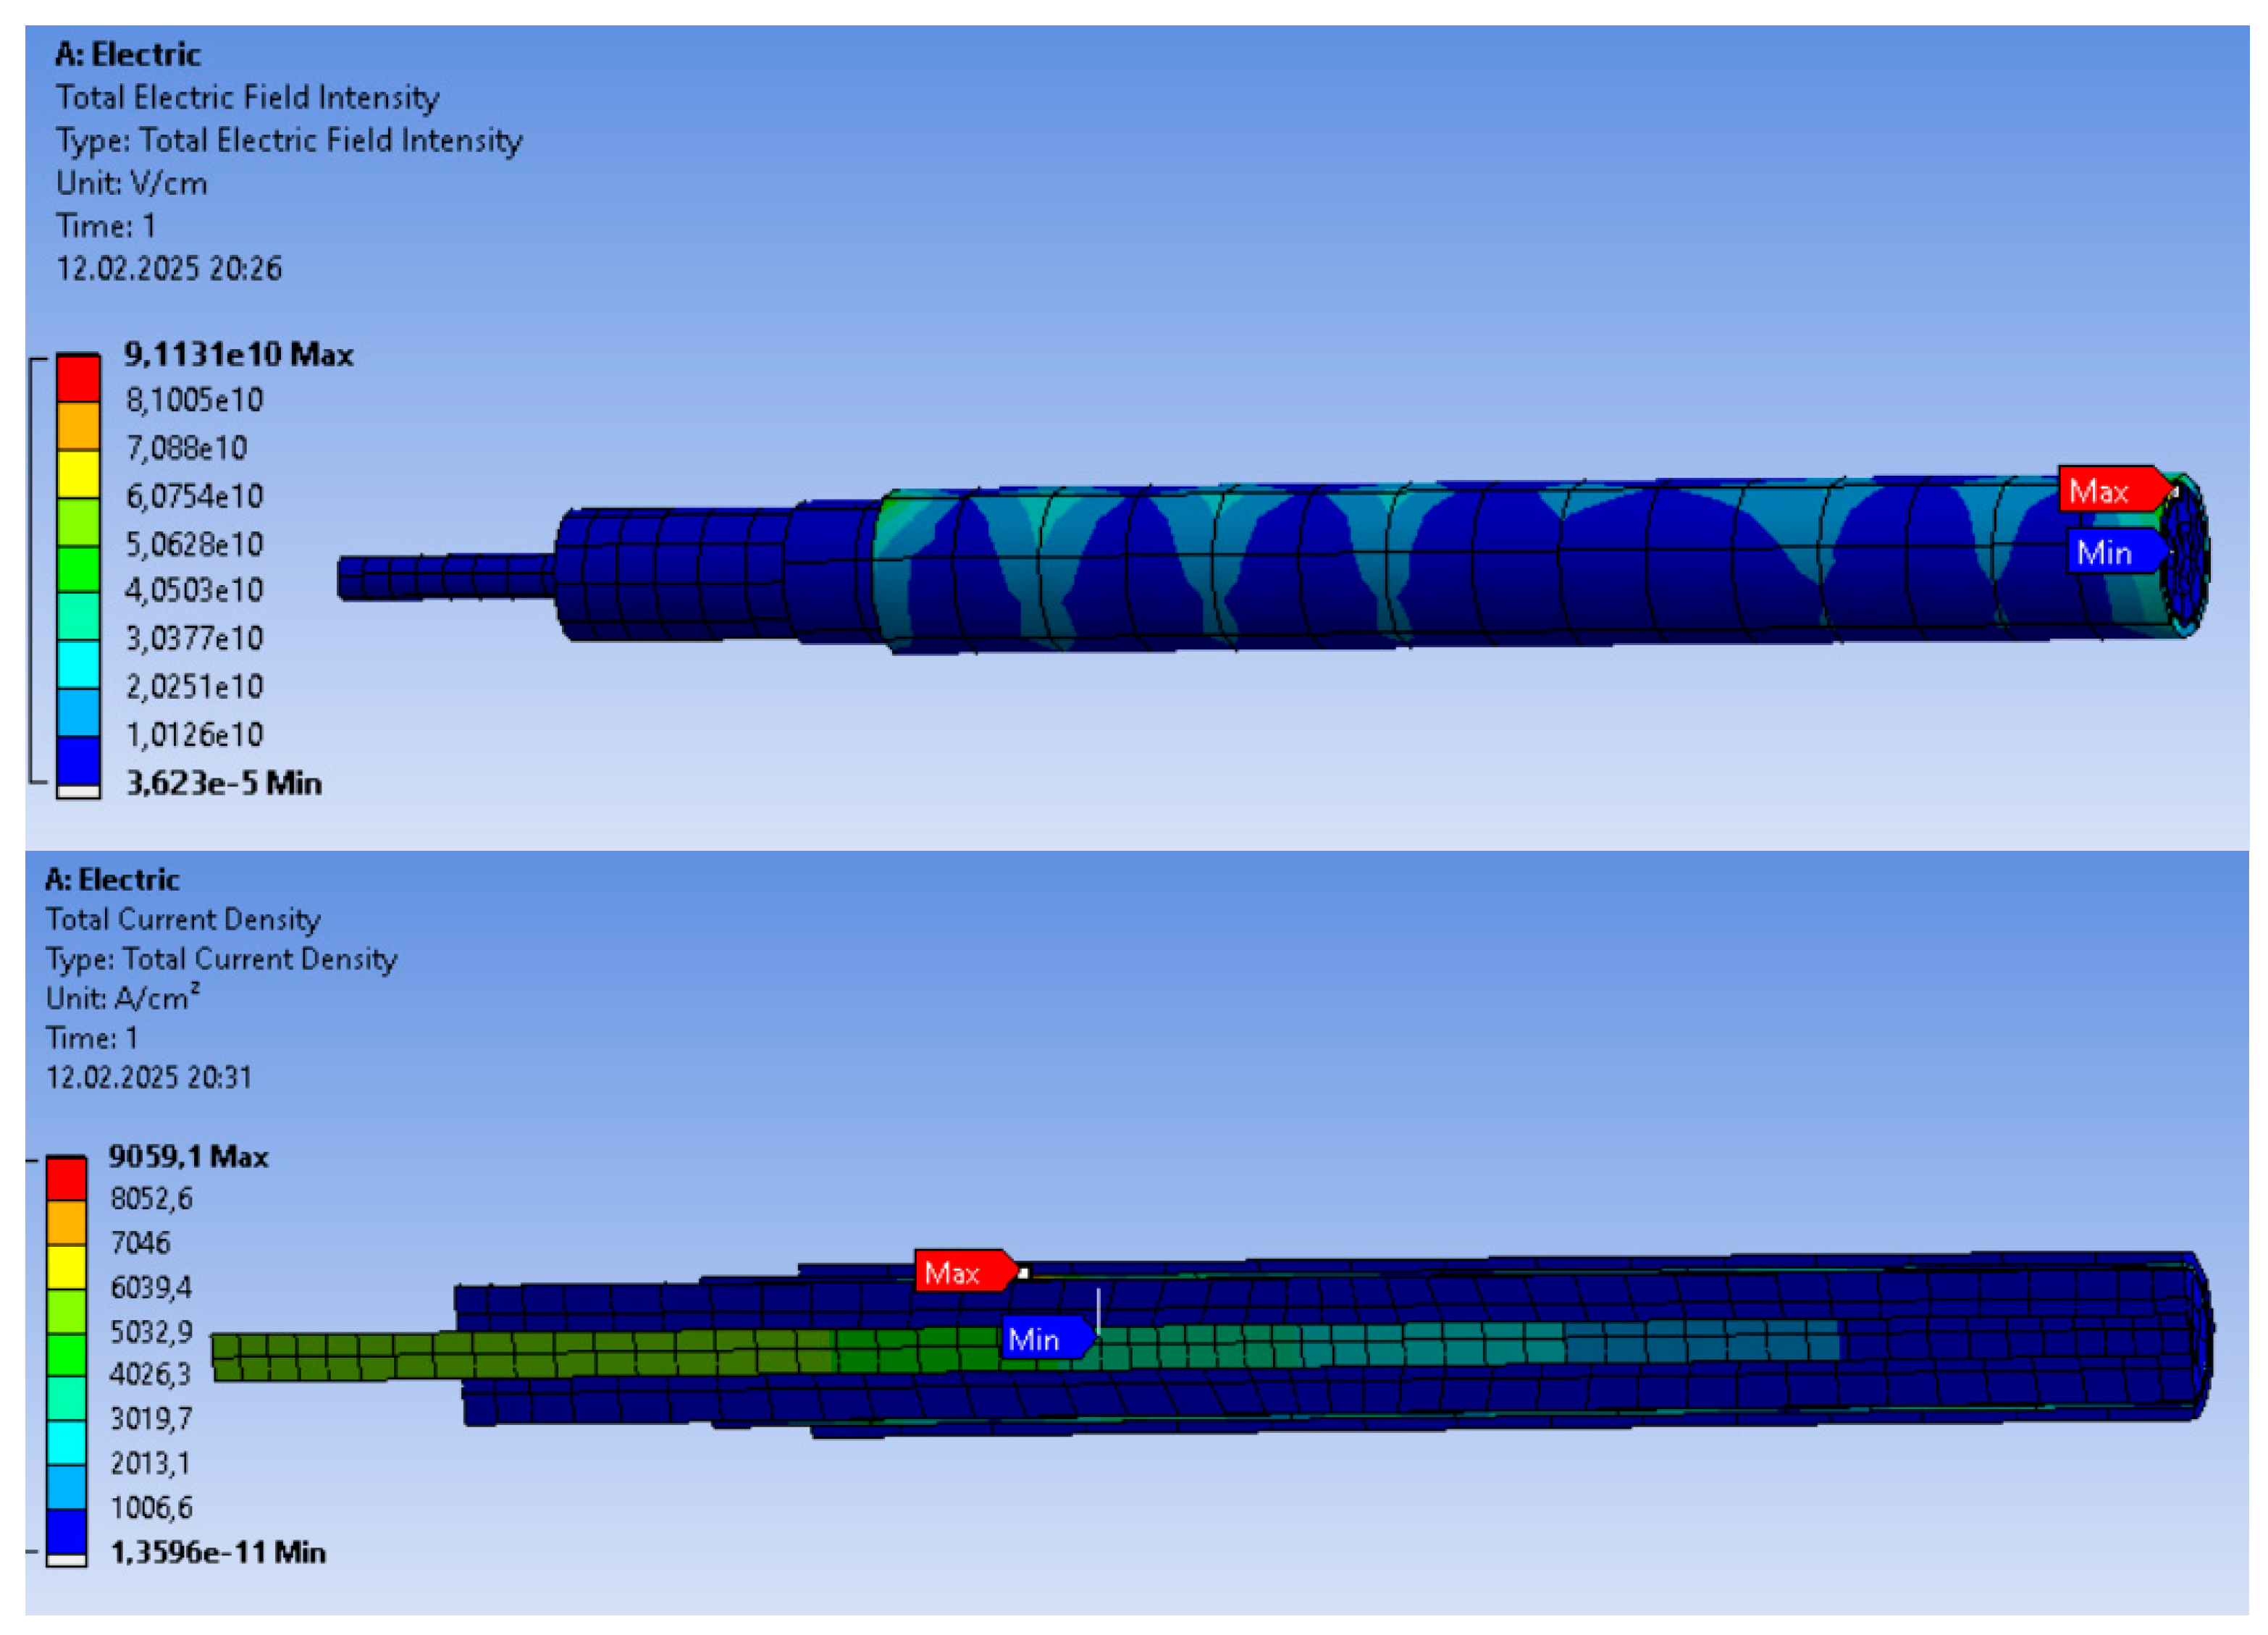
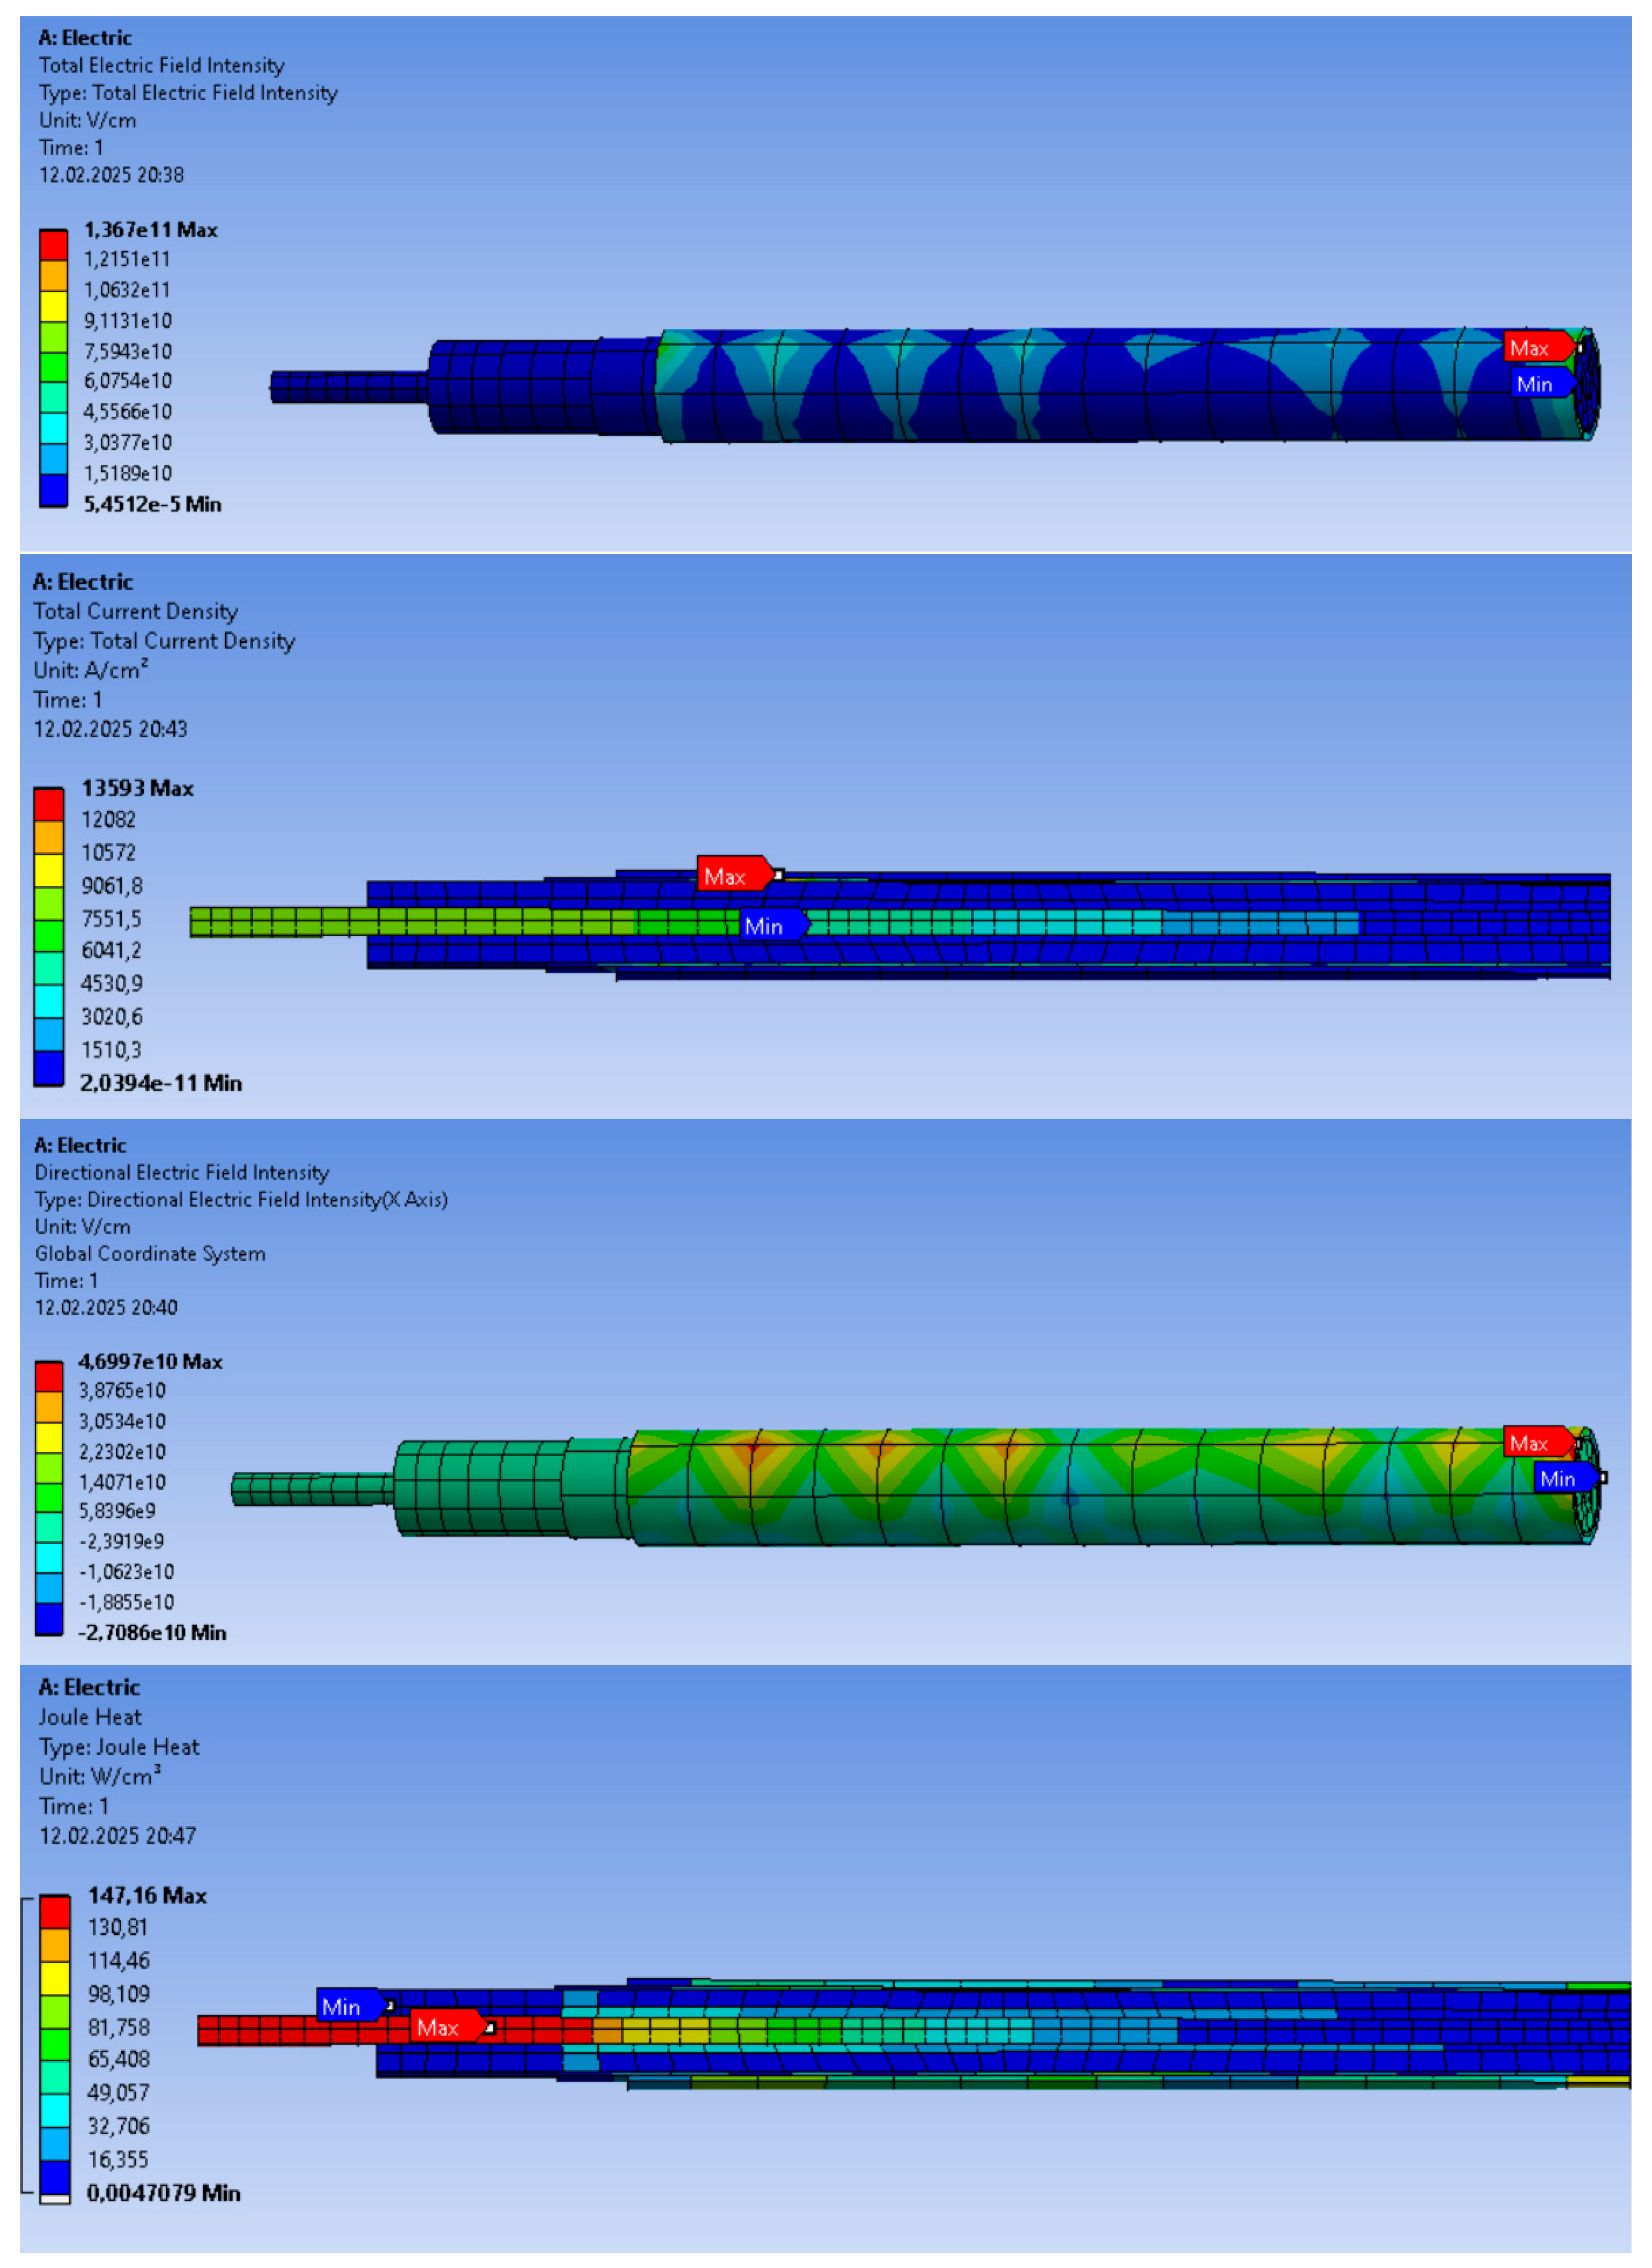
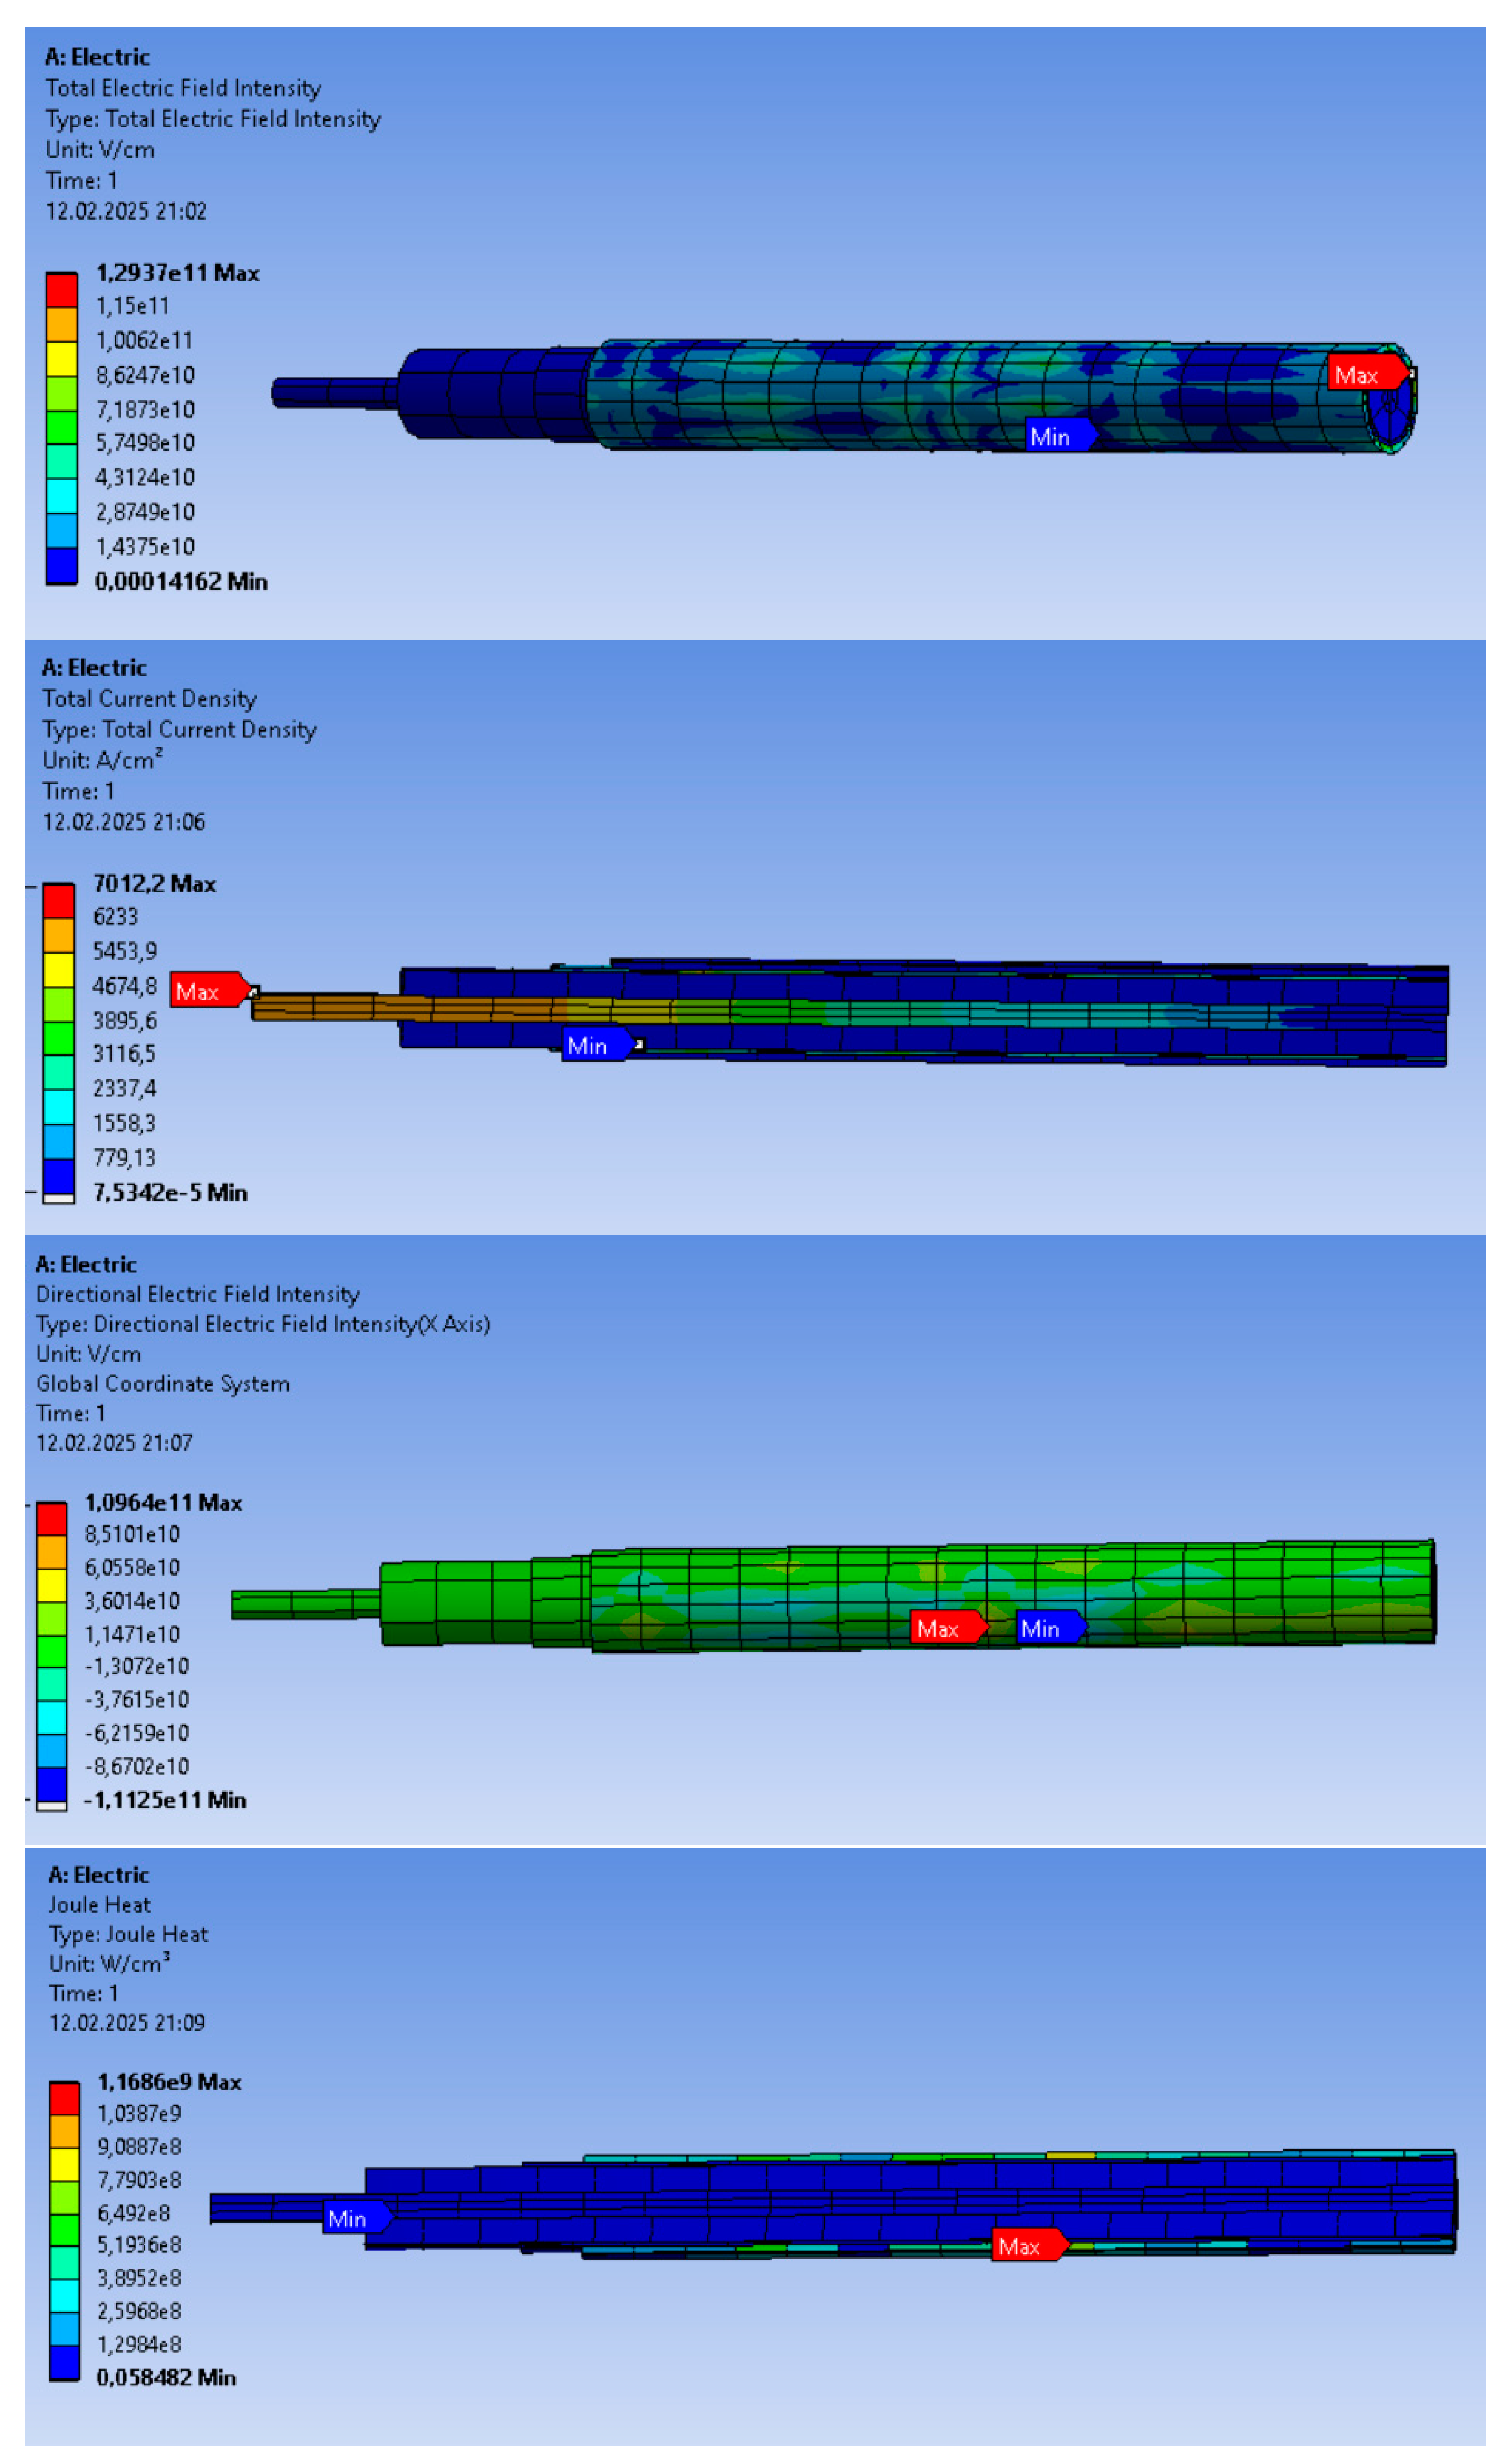
3.2. PVC Simulation Results
3.2.1. Simulating Temperature Variations of PVC
3.2.2. Simulating Current Variations of PVC
4. Conclusions
Author Contributions
Funding
Data Availability Statement
Conflicts of Interest
Abbreviations
| PE | Polyethylene |
| PVC | Polyvinyl chloride |
| A | Ampere |
| LD | Linear dichroism |
| XLPE | Cross-linked polyethylene |
References
- Pamuk, N. 2XS (FL) 2Y 87/150 (170) kV Yüksek Gerilim Güç Kablosu Yalıtım Arızasının İncelenmesi ve Elektriksel Ölçüm Testleri. Düzce Üniversitesi Bilim Teknol. Derg. 2014, 2, 284. [Google Scholar]
- Günday, A. Enerji Kablosunda Oluşan Sıcaklık ve Gerilmeleri Optik Fiberli Algılayıcılarla Algılama Benzetimleri. Master’s Thesis, Bursa Uludağ University, Bursa, Turkey, 2007. [Google Scholar]
- Chi, Q.G.; Yang, M.; Zhang, C.H.; Zhang, T.D.; Feng, Y.; Chen, Q.G. Nonlinear electrical conductivity and thermal properties of AgNPs/BN/EPDM composites for cable accessory. IEEE Trans. Dielectr. Electr. Insul. 2019, 26, 1081–1088. [Google Scholar] [CrossRef]
- He, D.; Meng, F.; Liu, H.; Li, Q.; Wang, X. The influence mechanism of semiconductive material on space charge accumulation in HVDC cable accessory. IEEE Trans. Dielectr. Electr. Insul. 2019, 26, 1479–1486. [Google Scholar] [CrossRef]
- Lin, C.; Zhen, L.; Wu, Y. Summary of research on online monitoring method of cable joint temperature. Electr. Eng. 2019, 20, 1–4, 9. [Google Scholar]
- Gan, D.; Zhang, L.; Zhang, R. Surface temperature distribution and statistical characteristics of cable joints under eccentric conditions. High Volt. Appar. 2019, 55, 117–123. [Google Scholar]
- Koçar, I.; Ertaş, A. Thermal Analysis for Determination of Current Carrying Capacity of PE and XLPE Insulated Power Cables Using Finite Element Method. In Proceedings of the 12th IEEE Mediterranean Electrotechnical Conference (IEEE Cat. No.04CH37521), Dubrovnik, Croatia, 12–15 May 2004; pp. 905–909. [Google Scholar]
- Azimuddin, A.; Refaat, S.S. A comprehensive model for electrical degradation of power cable insulation. In Proceedings of the 2022 IEEE Conference on Electrical Insulation and Dielectric Phenomena (CEIDP), Vancouver, BC, Canada, 12 December 2021; pp. 133–138. [Google Scholar] [CrossRef]
- You, F.; Yusoh, M.A.T.M.; Ali, N.H.B.N.; Yang, H. Analysis on Influencing Factors of Temperature Distribution of Shore Power Cable. IEEE Access 2024, 12, 137988–137999. [Google Scholar] [CrossRef]
- Sedaghat, A.; León, F. Thermal analysis of power cables in free air: Evaluation and Improvement of the IEC Standard Ampacity Calculations. IEEE Trans. Power Deliv. 2014, 29, 2306–2314. [Google Scholar] [CrossRef]
- Anders, G.J.; Napieralski, A. Calculation of the Internal Thermal Resistance and Ampacity of 3-core Screened Cables with Fillers. IEEE Trans. Power Deliv. 1999, 14, 729–734. [Google Scholar] [CrossRef]
- Hiranandani, A. Calculation of Conductor Temperatures and Ampacities of Cable Systems Using a Generalized Finite Difference Method. IEEE Trans. Power Deliv. 1991, 6, 15–24. [Google Scholar] [CrossRef]
- Haskew, T.A.; Carwile, R.F.; Grigsby, L.L. An Algorithm for Steady—State Therma Analysis of Electrical Cables with Radiation by Reduced Newton—Raphson Techniques. IEEE Trans. Power Deliv. 1994, 9, 526–533. [Google Scholar] [CrossRef]
- Anders, G.J.; Chaaban, M.; Bedard, N.; Ganton, R.W.D. New Approach to Ampacity Evaluation of Cables in Ducts Using Finite Element Technique. IEEE Trans. Power Deliv. 1987, 2, 969–975. [Google Scholar] [CrossRef]
- Hwang, C.C. Calculation of Thermal Fields of Underground Cable System with Consideration of Structural Steels Constructed in a Duct Bank. IEEE Proc. Gener. Transm. Distrib. 1997, 144, 541–543. [Google Scholar] [CrossRef]
- Hanna, M.A.; Chikhani, A.Y.; Salama, M.M.A. Effect of Geometry Between Cables on the Heat Dissipation from Underground Cable Systems. IEEE CNF 1993, 132, 433–436. [Google Scholar]
- Hwang, C.C.; Jiang, Y.H. Extensions to the Finite Element Method for Thermal Analysis of Underground Cable Systems. Electric Power Syst. Res. 2003, 64, 159–164. [Google Scholar] [CrossRef]
- Tao, L. Field Strength Simulation of Typical Defects in XLPE Cable. Acad. J. Eng. Technol. Sci. 2022, 5, 20–26. [Google Scholar]
- Tang, Y.; Gao, G.; Liu, K.; Chen, K.; Xie, Y.; Xin, D.; Wu, G. Electric field distribution and performance optimization of high-speed train cable terminal with internal defects. Eng. Fail. Anal. 2023, 151, 107360. [Google Scholar] [CrossRef]
- Liu-Fang, C.U. Fire hazard study of PVC wire under low times of overload condition. Insul. Mater. 2013, 46, 24–27. [Google Scholar]
- Karahan, M. Sonlu Elemanlar Metodu Kullanılarak Güç Kablolarının Isıl Analizi ve Akım Taşıma Kapasitesinin Değerlendirilmesi. Ph.D. Thesis, Marmara Universitesi, Istanbul, Turkey, 2007. [Google Scholar]
- TR 62095; Electric Cables—Calculations for Current Ratings—Finite Element Method. IEC: Geneva, Switzerland, 2003.
- Aydın, T. Bulanık Mantık Sınıflandırmadan Yararlanarak Kablo Malzemesi Seçimi. Ph.D. Thesis, Fen Bilimleri Enstitüsü, Istanbul, Turkey, 2004. [Google Scholar]
- George, J.; Anders, S. Rating of Power Cables in Unfavorable Thermal Environment; IEEE Press: Ottawa, ON, Canada, 2005. [Google Scholar]
- Heinhold, L. Power Cables and Their Applications; Siemens Aktiengesellschaft: Berlin/Munich, Germany, 1990. [Google Scholar]
- Ferree, J. Heat Dissipation of Electrical Connections with Horizontal Insulated Cable. In Proceedings of the IEEE 68th Holm Conference on Electrical Contacts (HOLM), New Orleans, LA, USA, 4 October 2023; pp. 1–8. [Google Scholar]
- Akbar, M.A.; Humaidi, S.; Tarigan, K.; Ramdan, D.; Frida, E.; Siregar, Y. Overcurrent effects on copper insulated PVC cables and fire resistance via thermal imaging and macrostructure analysis. Bull. Electr. Eng. Inform. 2025, 14, 1014–1025. [Google Scholar] [CrossRef]
- Deb, A.; Naskar, M. Recyclable Polymeric Cable Insulation Materials: A Comprehensive Review. Power Res. J. CPRI 2024, 113–122. [Google Scholar] [CrossRef]


| Application Area | Material | Young’s Module MPa | Poisson’s Ratio | Isotropic Thermal Conductivity W/(mm·°C) | Relative Dielectric Constant | Max. Endurance Temp (°C) | Thermal Conductivity Coefficient (W/mK) | Radius (mm) |
|---|---|---|---|---|---|---|---|---|
| Conductor | Copper | 1.1 × 10⁵ | 0.34 | 0.401 | _ | 200–250 °C | 400 | 0.47 |
| Internal Insulation | Silicone | - | - | 0.12400 | 11.7 | 150–200 °C | 148 | 1.37 |
| Shield | Copper | 1.1 × 10⁵ | 0.34 | 0.401 | _ | 200–250 °C | 400 | 1.49 |
| External Insulation | PE | 1100 | 0.42 | 0.00026 | 2.25–2.35 | 90 °C | 0.33 | 1.72 |
| PVC | 70 | 0.3 | _ | 3–4 | 80 °C | 0.14–0.19 |
| Parameter | 40 A-22 °C | 40 A-55 °C |
|---|---|---|
| Total Electric Field | 1.825 × 10¹² V/m | 8.311 × 10¹⁰ V/m |
| Directed Electric Field | 4.571 × 10¹² V/m | 2.371 × 10¹⁰ V/m |
| Current Density | 61.537 A/m2 | 99.594 A/m2 |
| Joule Heat | 51.246 W/m3 | 66.43 W/m3 |
| Parameter | 22 °C-40 A | 22 °C-60 A |
|---|---|---|
| Total Electric Field | 1.825 × 10¹² V/m | 2.198 × 10¹² V/m |
| Directed Electric Field | 4.571 × 10¹² V/m | 5.495 × 10¹² V/m |
| Current Density | 61.537 A/m2 | 92.094 A/m2 |
| Joule Heat | 51.246 W/m3 | 72.848 W/m3 |
| Parameter | 60 A-22 °C | 60 A-55 °C |
|---|---|---|
| Total Electric Field | 2.198 × 10¹² V/m | 1.345 × 10¹² V/m |
| Directed Electric Field | 5.495 × 10¹² V/m | 2.976 × 10¹² V/m |
| Current Density | 92.094 A/m2 | 91.7 09 A/m2 |
| Joule Heat | 72.848 W/m3 | 72.584 W/m3 |
| Parameter | PVC 40 A-22°C | PVC 40 A-55°C |
|---|---|---|
| Total Electric Field | 3.026 × 10¹¹ V/m | 1.239 × 10¹¹ V/m |
| Directed Electric Field | 9.047 × 10¹⁰ V/m | 1.094 × 10¹¹ V/m |
| Current Density | 8955 A/m2 | 30,122 A/m2 |
| Joule Heat | 4.59 × 10⁸ W/m3 | 1.16 × 10⁹ W/m3 |
| Parameter | PVC, 22 °C-40 A | PVC, 22 °C-60 A |
|---|---|---|
| Total Electric Field | 9.32 × 10¹⁰ V/m | 5.13 × 10¹² V/m |
| Directed Electric Field | 9.04 × 10¹⁰ V/m | 4.52 × 10¹² V/m |
| Current Density | 8.65 × 10³ A/m2 | 134.04 A/m2 |
| Joule Heat | 4.57 × 10⁶ W/m3 | 8.123 W/m3 |
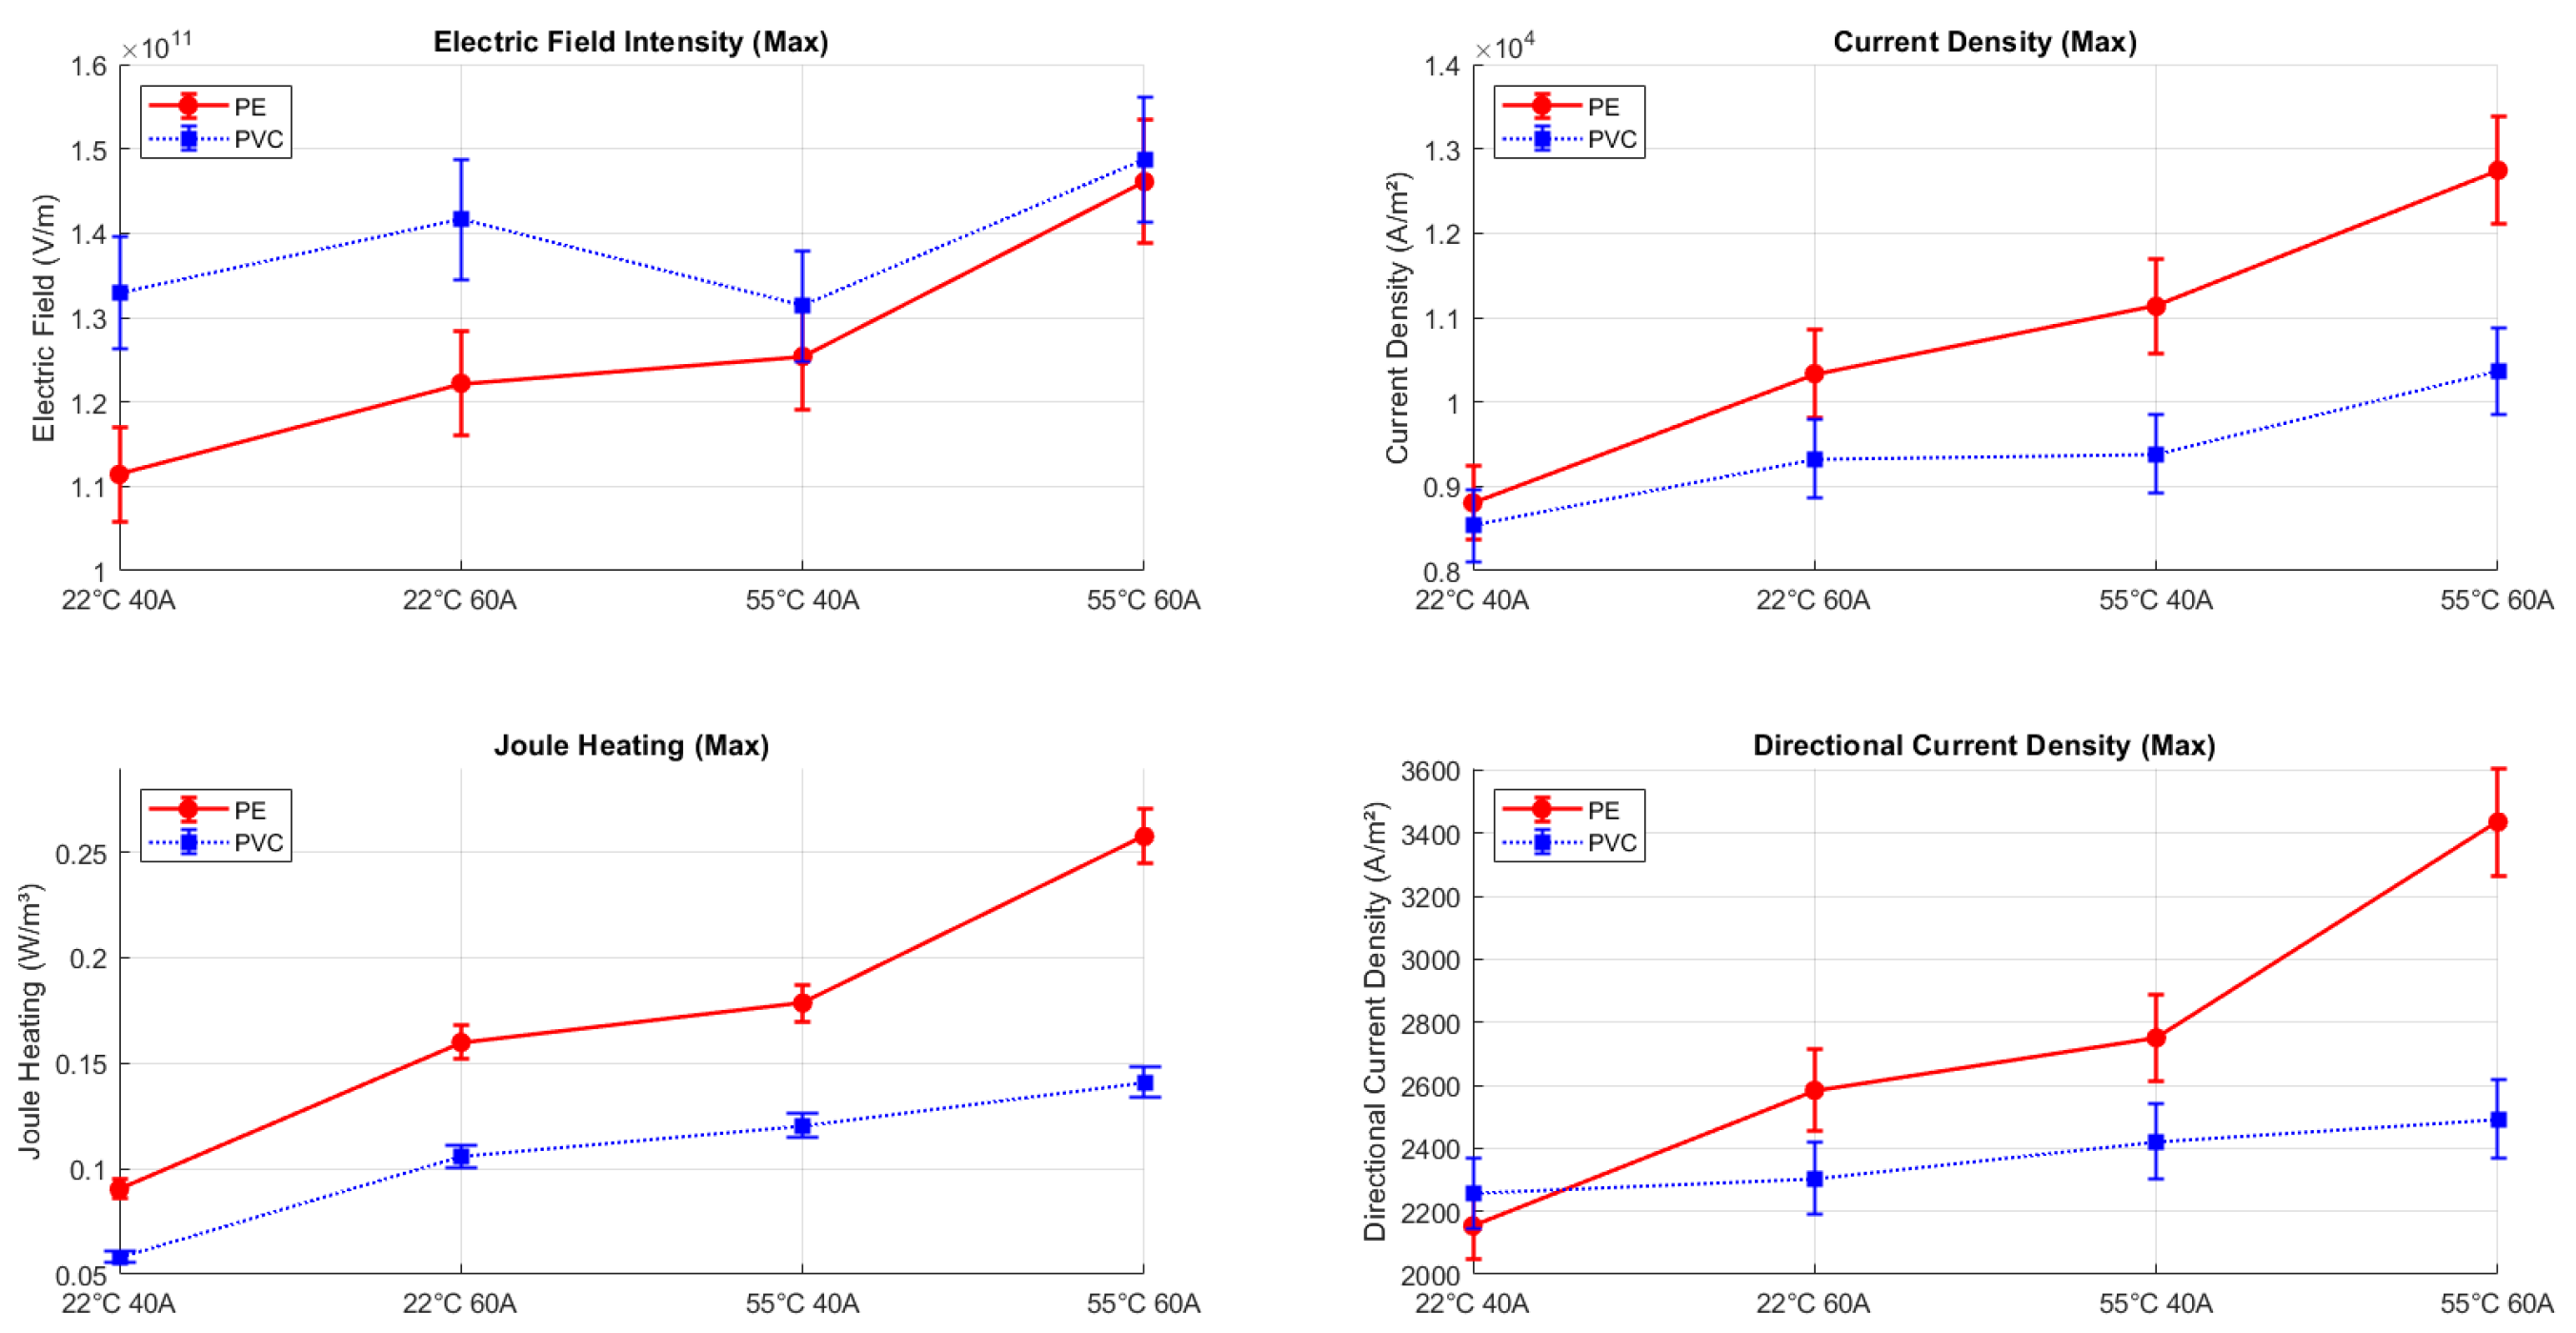
| Insulation Type | Current (A) | Temperature (°C) | Electric Field Intensity (Max) (V/m) | Electric Field Intensity (Min) (V/m) | Current Density (Max) (A/m2) | Current Density (Min) (A/m2) | Joule Heating (Max) (W/m2) | Joule Heating (Min) (W/m2) | Directional Electric Field Intensity (Max) (V/m) | Directional Electric Field Intensity (Min) (V/m) |
|---|---|---|---|---|---|---|---|---|---|---|
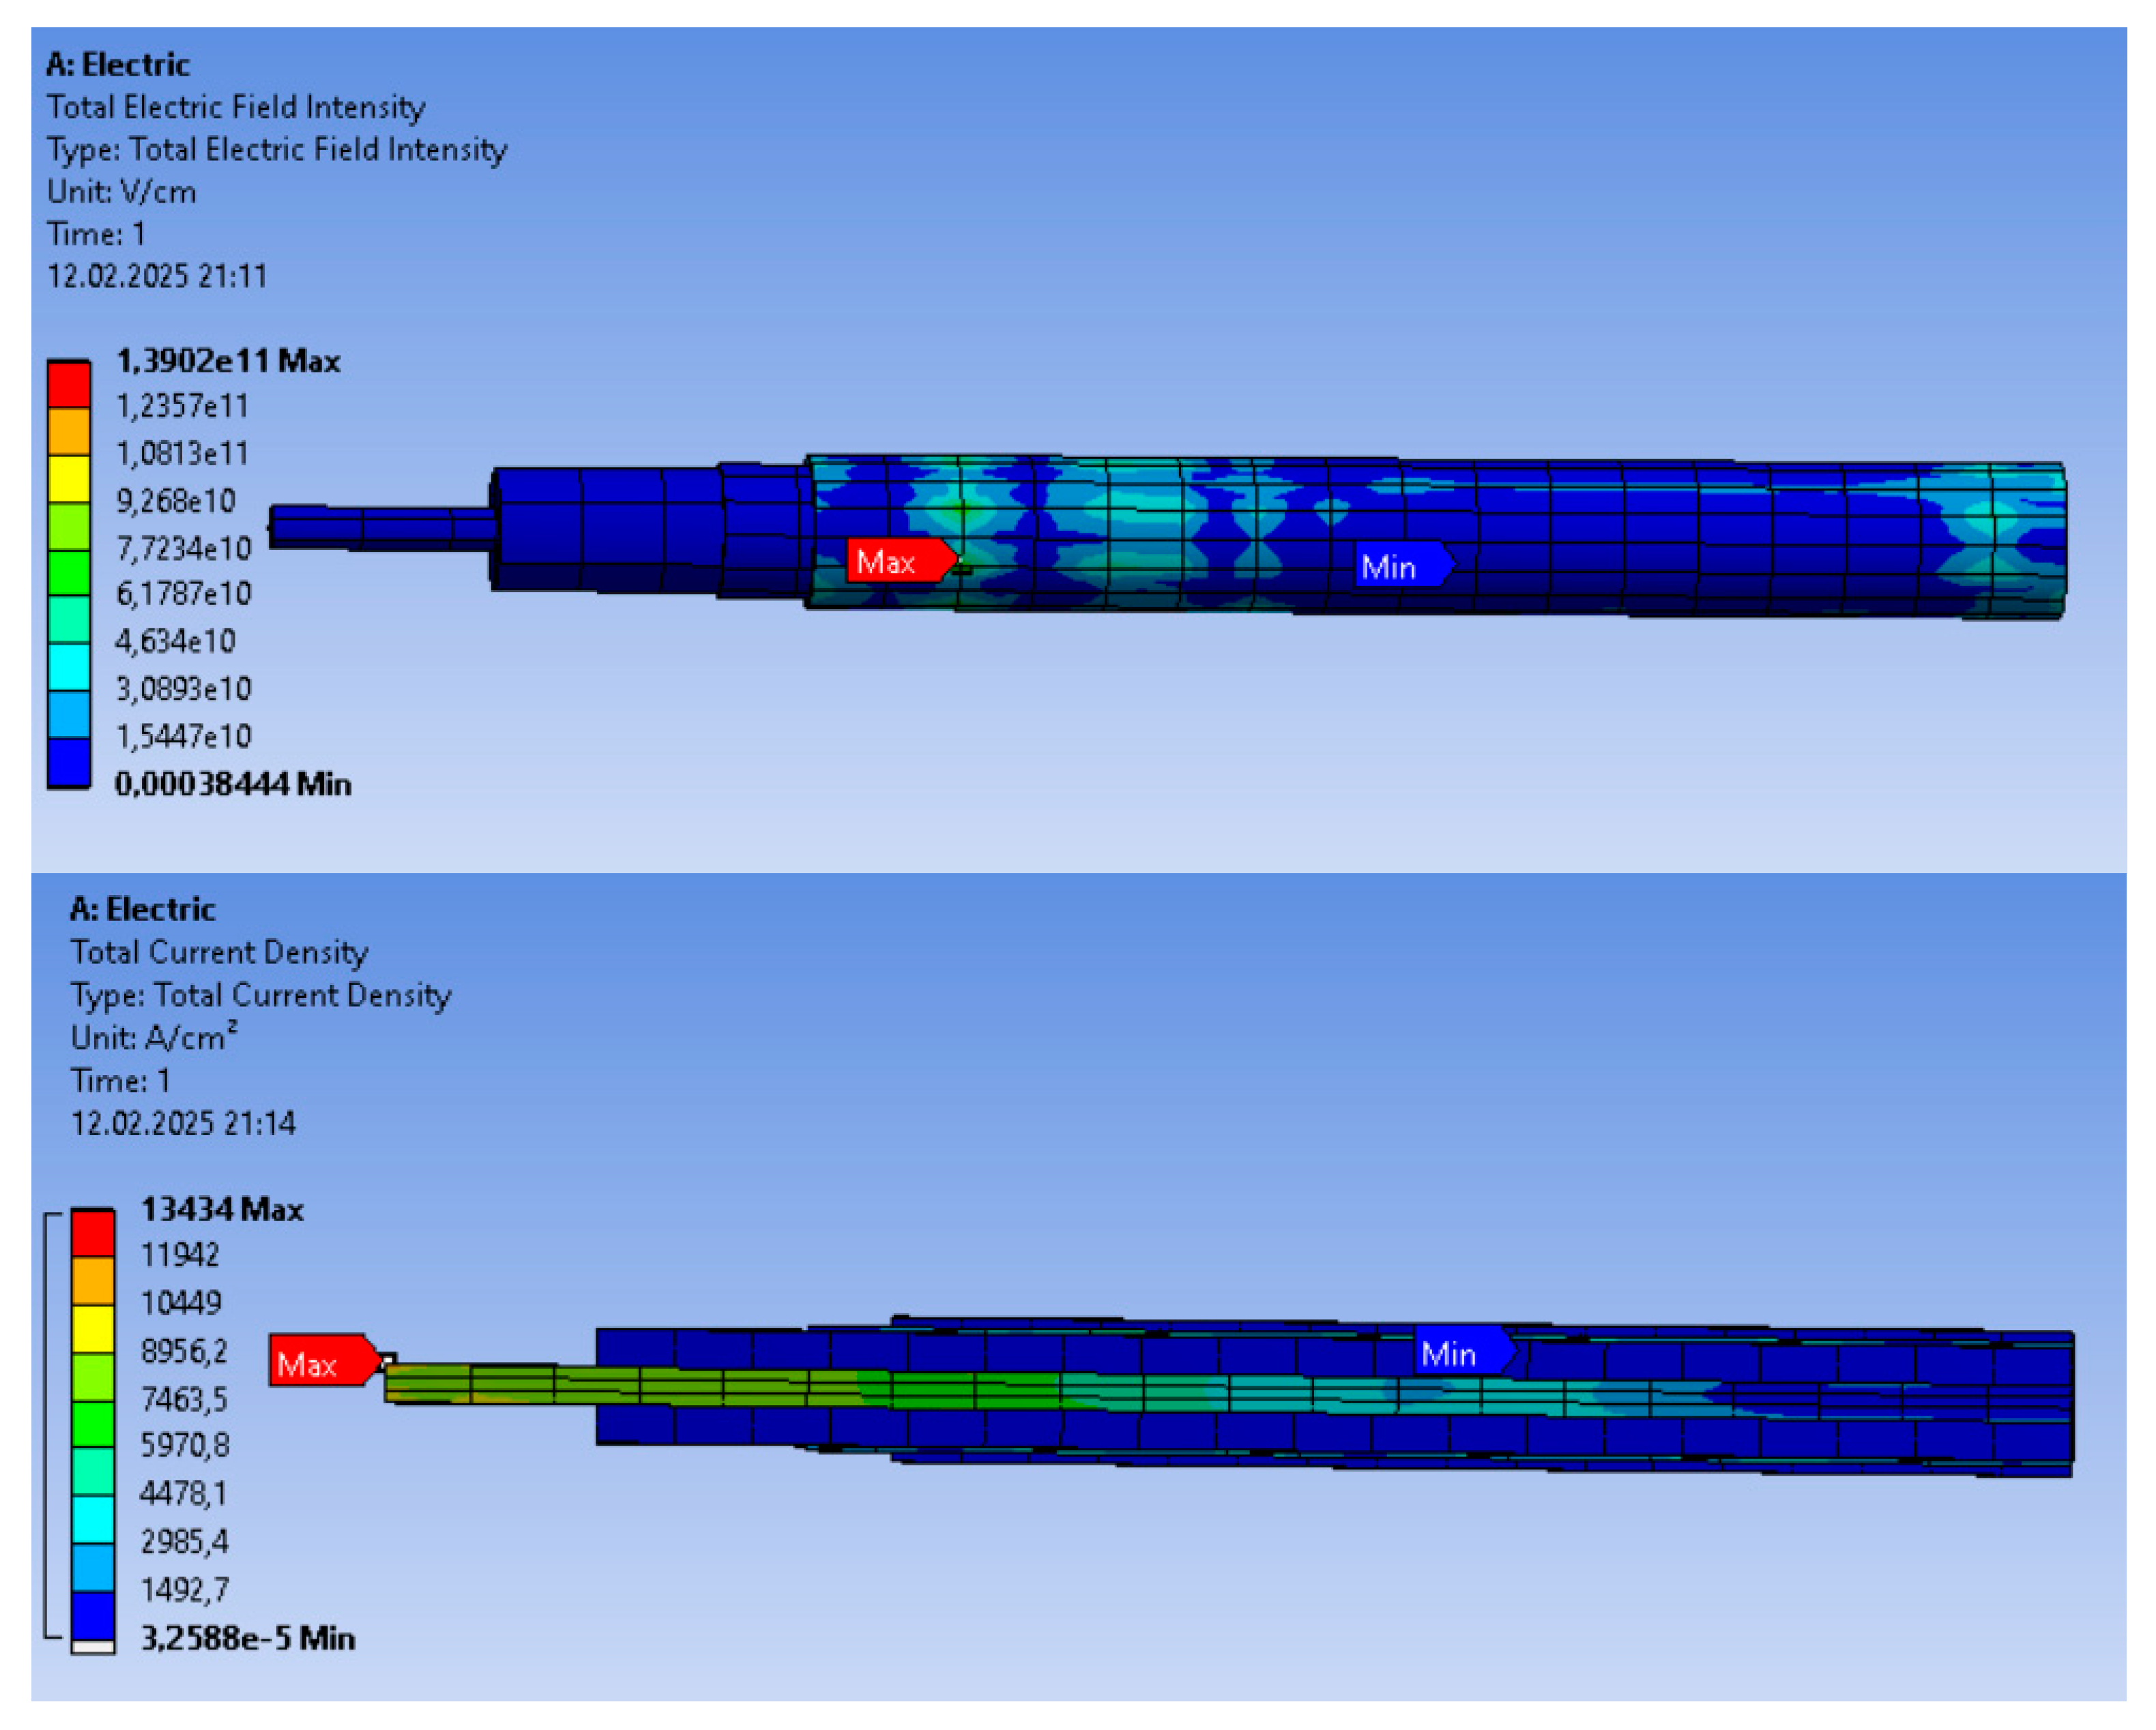
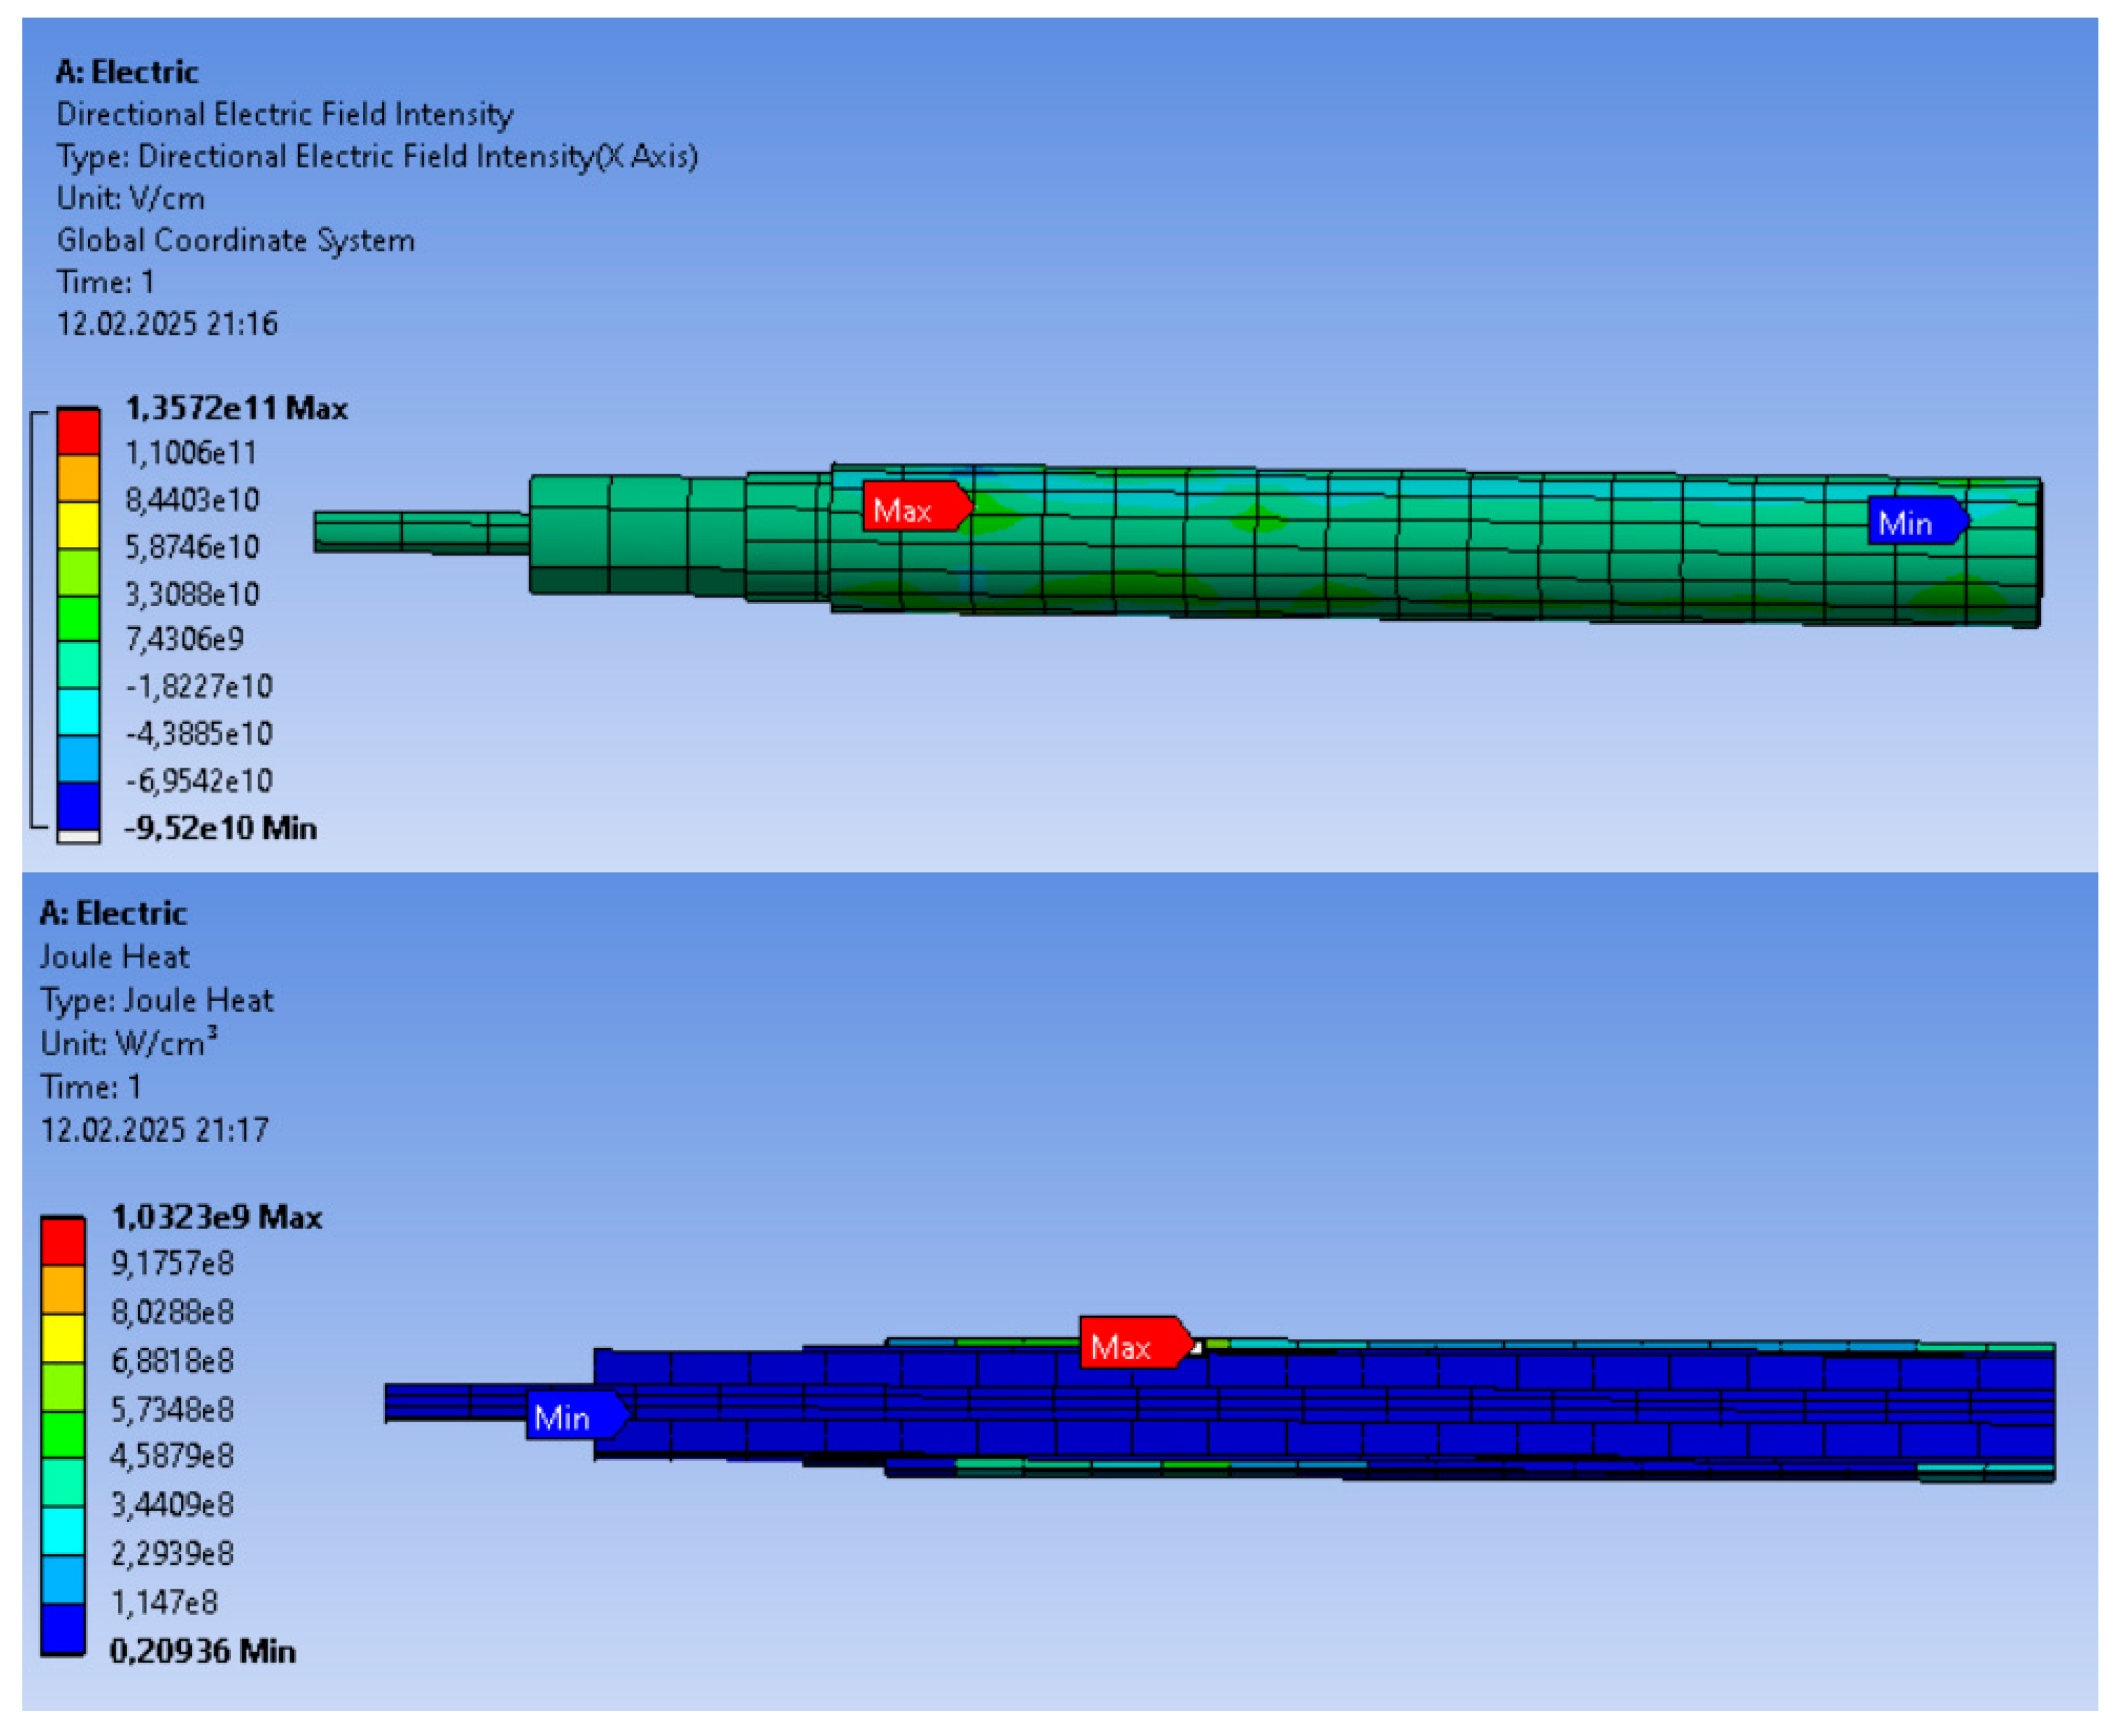
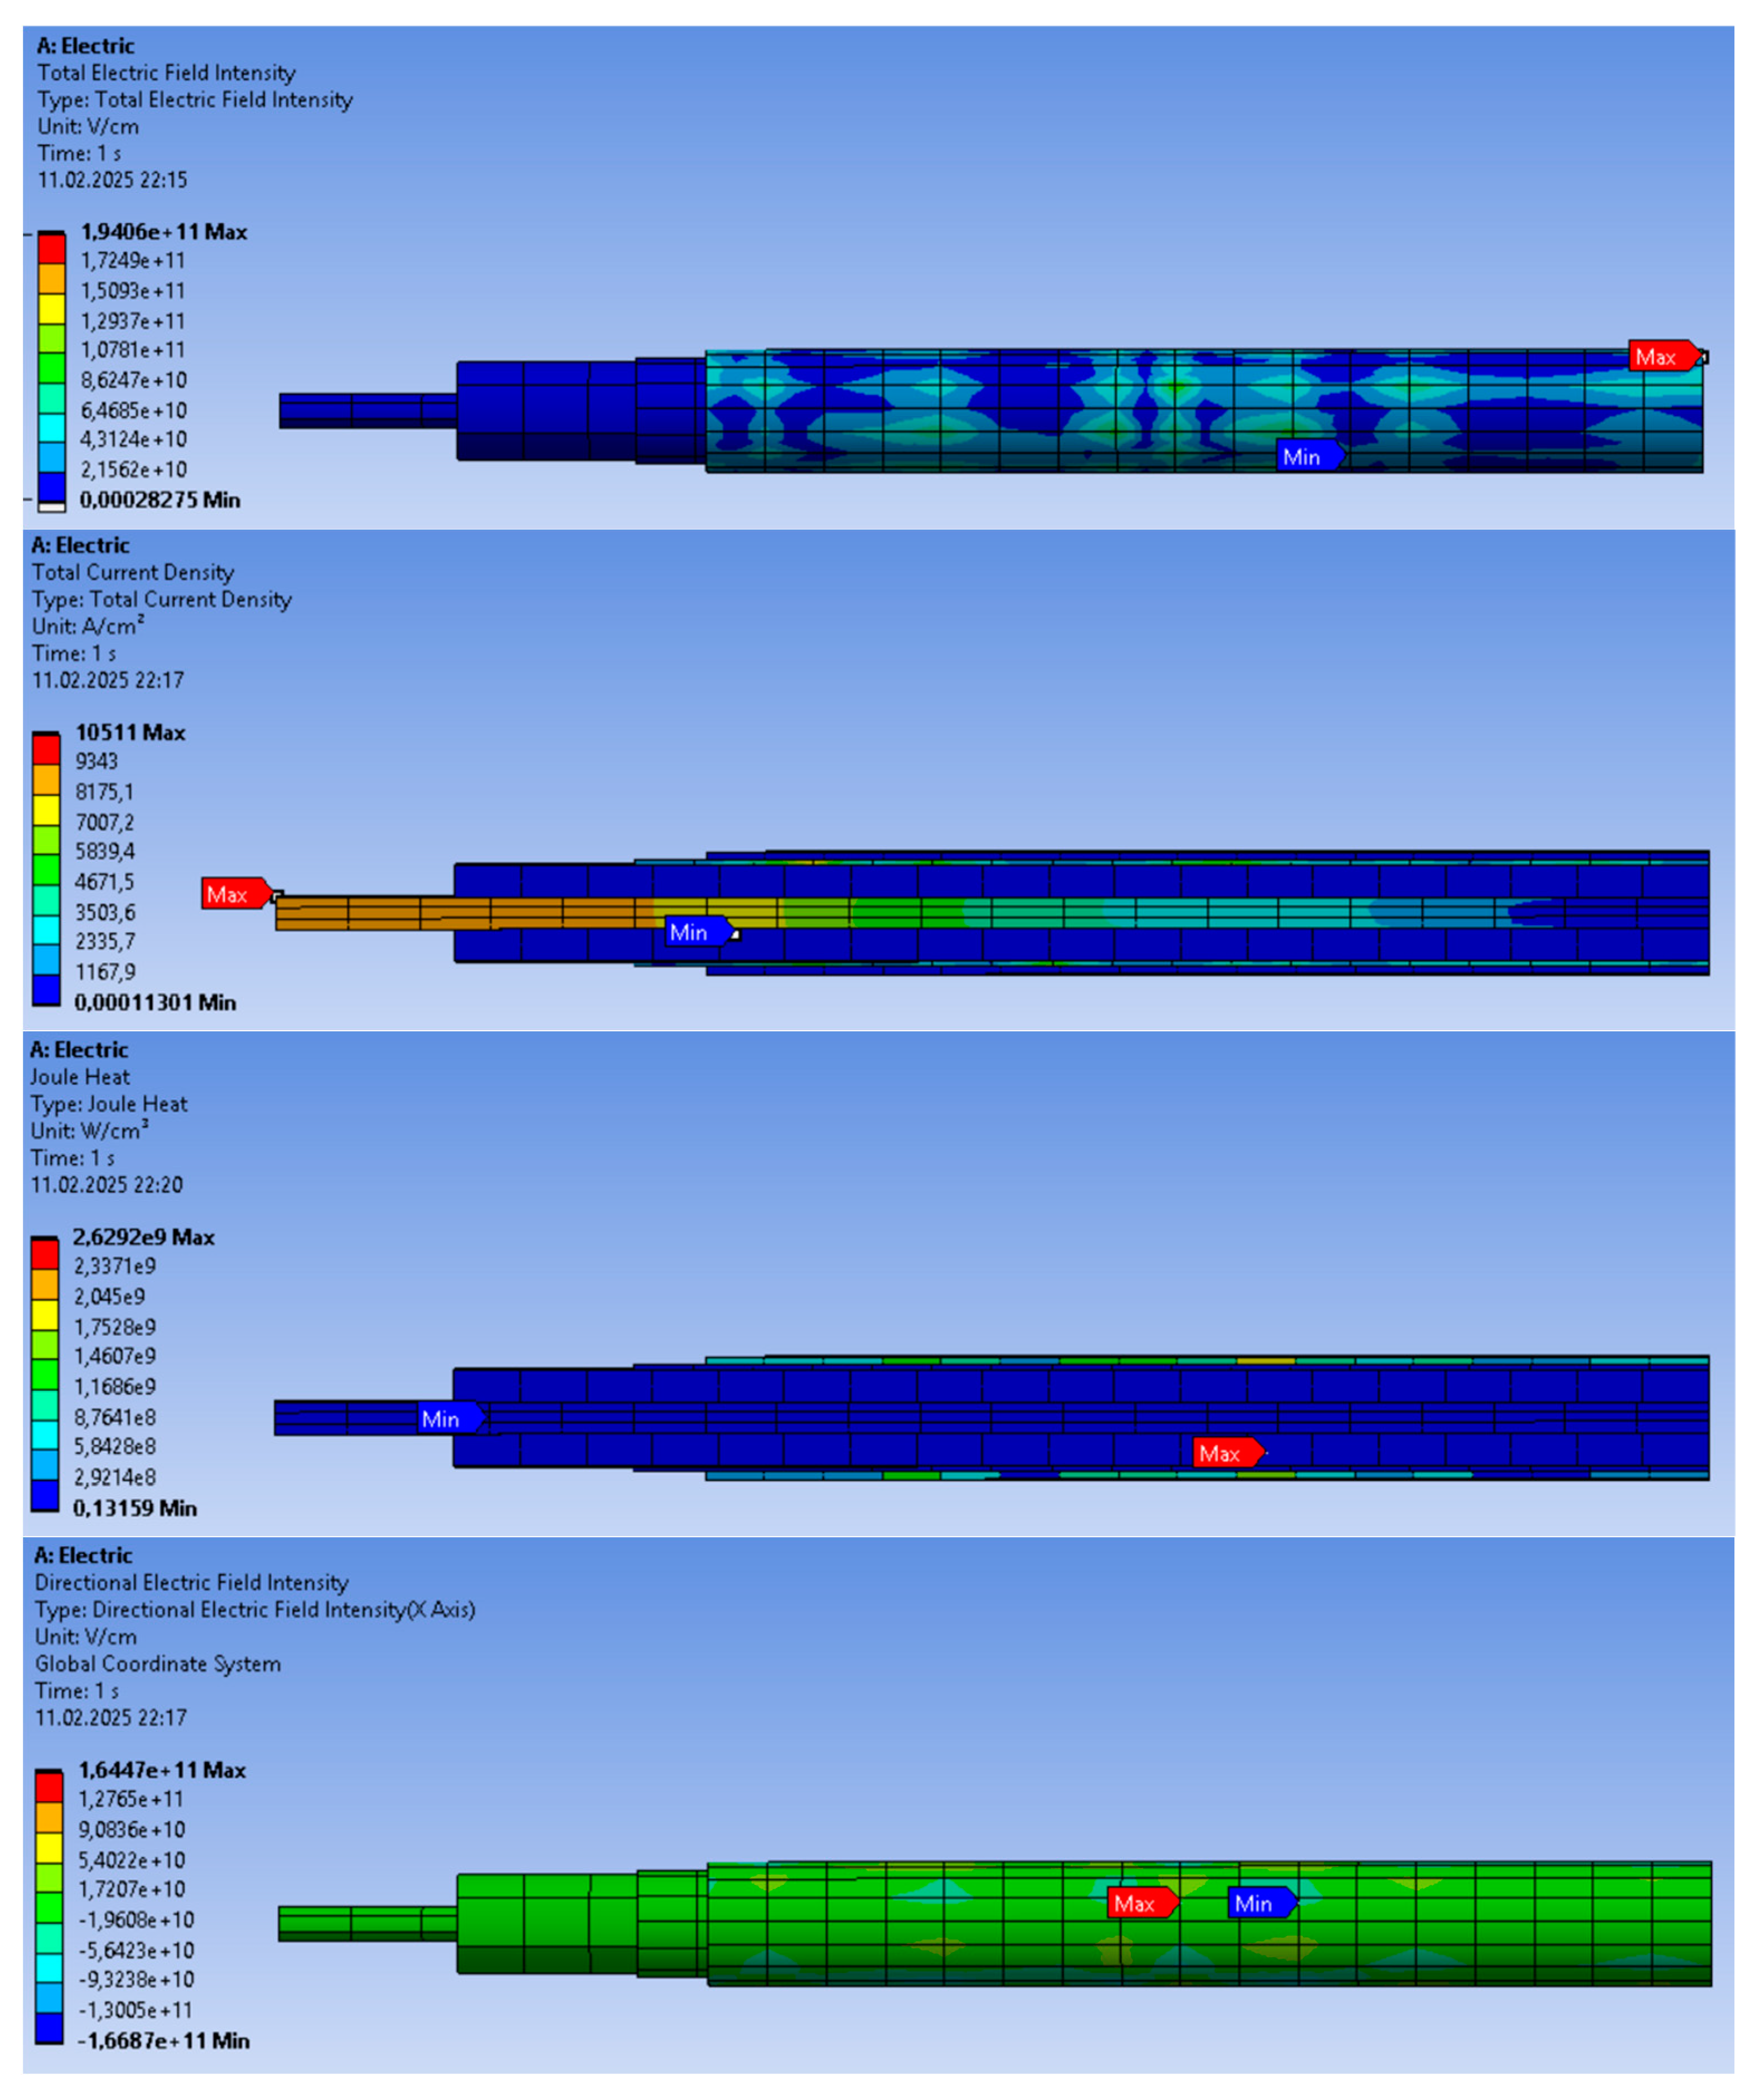
| PE | 40 | 22 °C | 1.1141 × 10¹¹ | 2.36 × 10⁹ | 8804 | 27.76 × 100 | 0.09031 | 3.18 × 10⁻3 | 2153.54 | −3.88 × 10⁹ |
| PVC | 40 | 22 °C | 1.3296 × 10¹¹ | 2.02 × 10⁹ | 8536 | 21.75 × 100 | 0.05832 | 8.93 × 10⁻3 | 2257.38 | −4.46 × 10⁹ |
| PE | 40 | 55 °C | 1.2539 × 10¹¹ | 3.52 × 10⁹ | 11,133 | 13.56 × 101 | 0.17853 | 5.92 × 10⁻3 | 2750.44 | −1.27 × 10⁹ |
| PVC | 40 | 55 °C | 1.3135 × 10¹¹ | 2.75 × 10⁹ | 9385 | 7.53 × 101 | 0.12063 | 1.14 × 10⁻² | 2421.17 | −1.12 × 10⁹ |
| PE | 60 | 22 °C | 1.2221 × 10¹¹ | 3.44 × 10⁹ | 10,335 | 14.14 × 101 | 0.15989 | 2.96 × 10⁻² | 2583.97 | −2.59 × 10⁹ |
| PVC | 60 | 22 °C | 1.4162 × 10¹¹ | 3.05 × 10⁹ | 9323 | 12.85 × 101 | 0.10604 | 2.50 × 10⁻² | 2304.88 | −2.98 × 10⁹ |
| PE | 60 | 55 °C | 1.4610 × 10¹¹ | 5.45 × 10⁹ | 12,745 | 20.49 × 101 | 0.25753 | 4.00 × 10⁻² | 3435.32 | −3.85 × 10⁹ |
| PVC | 60 | 55 °C | 1.4876 × 10¹¹ | 4.01 × 10⁹ | 10,361 | 13.25 × 101 | 0.14095 | 3.13 × 10⁻² | 2492.93 | −3.02 × 10⁹ |
| Condition | Parameter | PE | PVC |
|---|---|---|---|
| 22 °C, 40 A | Electric Field Intensity | Lower | Higher |
| Current Density | Slightly Higher | Lower | |
| Joule Heating | Higher | Lower | |
| Insulation Stability | Moderate | High | |
| 55 °C, 40 A | Electric Field Intensity | Higher | Lower |
| Current Density | Twice Higher | Lower | |
| Joule Heating | Three Times Higher | Lower | |
| Insulation Stability | Lower | High | |
| 22 °C, 60 A | Electric Field Intensity Increase | Moderate | 50% Increase |
| Current Density Increase | High | Higher Electrical Load | |
| Joule Heating | Increased | Further Increased | |
| Risk of Overheating | Higher | Higher But More Stable | |
| 55 °C, 60 A | Electric Field Intensity | Significantly Higher | Moderate |
| Current Density | Three Times Higher | Higher Electrical Load | |
| Joule Heating | Extremely High | Moderate | |
| Insulation Stability | Low | Stable |
Disclaimer/Publisher’s Note: The statements, opinions and data contained in all publications are solely those of the individual author(s) and contributor(s) and not of MDPI and/or the editor(s). MDPI and/or the editor(s) disclaim responsibility for any injury to people or property resulting from any ideas, methods, instructions or products referred to in the content. |
© 2025 by the authors. Licensee MDPI, Basel, Switzerland. This article is an open access article distributed under the terms and conditions of the Creative Commons Attribution (CC BY) license (https://creativecommons.org/licenses/by/4.0/).
Share and Cite
Koç, G.; Işık, Ö. The Effect of Temperature and Current on the Insulation Performance of PE and PVC Power Cables: A Finite Element Approach. Energies 2025, 18, 1366. https://doi.org/10.3390/en18061366
Koç G, Işık Ö. The Effect of Temperature and Current on the Insulation Performance of PE and PVC Power Cables: A Finite Element Approach. Energies. 2025; 18(6):1366. https://doi.org/10.3390/en18061366
Chicago/Turabian StyleKoç, Gökçe, and Ömer Işık. 2025. "The Effect of Temperature and Current on the Insulation Performance of PE and PVC Power Cables: A Finite Element Approach" Energies 18, no. 6: 1366. https://doi.org/10.3390/en18061366
APA StyleKoç, G., & Işık, Ö. (2025). The Effect of Temperature and Current on the Insulation Performance of PE and PVC Power Cables: A Finite Element Approach. Energies, 18(6), 1366. https://doi.org/10.3390/en18061366