Article

Identifying the Impact of New Digital Infrastructure on Urban Energy Consumption: Evidence from the Broadband China Strategy

School of Business, Xiangtan University, Xiangtan 411105, China
*
Author to whom correspondence should be addressed.
Energies 2025, 18(5), 1072; https://doi.org/10.3390/en18051072
Submission received: 27 January 2025 / Revised: 16 February 2025 / Accepted: 21 February 2025 / Published: 22 February 2025

Abstract

:
China aims for high-quality development by balancing energy use and economic growth, leveraging digital infrastructure to foster a resource-efficient, eco-friendly society and boost economic progress. In this context, by using panel data from 279 Chinese cities spanning 2006–2021, this study employs a multi-phase difference-in-differences (DID) technique to disclose how the Broadband China Pilot Policy (BCPP) affects energy consumption. The results reveal that the BCPP can greatly lower urban energy consumption, which is further validated by robustness tests, including PSM-DID estimation, Bacon decomposition, and placebo testing. Heterogeneity testing shows the BCPP significantly lowers energy consumption in large, eastern, non-resource-based, and high-digital inclusive finance cities compared to smaller, western, resource-based, and low-digital inclusive finance cities. Furthermore, the mechanism analysis indicates that the BCPP contributes to decreased urban energy use by transforming the industrial structure, enhancing financial growth, and improving green technology innovation. To effectively harmonize energy consumption with urban development, it is recommended to accelerate the advancement of digital infrastructure, tailor the industrial structure to meet local needs, and promote greater financial and green innovation development.

1. Introduction

Energy has increasingly become a crucial indicator for evaluating a nation’s overall strength and potential for growth, as it illustrates an essential position in economic development [1,2]. However, the transition in global energy consumption is accelerating due to environmental damage, energy scarcity, and the pressing challenges of climate change resulting from unsustainable energy practices. This transition is greatly critical for developing nations. To be specific, following the 1978 reform and opening up, the Chinese economy realized remarkable expansion, fueled by a robust industrial and investment-led model. Over the past few years, China has emerged in the disputed position as the world’s largest energy consumer [3]. Even more, official statistics from the 2024 China Statistical Yearbook to a greater extent disclosed that the country’s energy usage skyrocketed from 571.44 million tons of common coal in 1978 to a staggering 5720 million tons by 2023, with a 5.25% yearly growth rate. This relentless surge in energy consumption is pushing China ever closer to its ecological and resource limits. Alongside its commitment to peak carbon emissions, China has been steadily enhancing initiatives aimed at transforming its energy consumption structure [4]. The 20th National Congress of China, being properly held at a critical stage in China’s progress towards the 2nd centenary orientation, underscored the urgent need to hasten the energy transformation, tighten regulations on energy consumption and intensity, and prioritize the reduction of fossil fuel use. Given China’s distinctive dual economy, urban areas serve as the main hubs of energy consumption. However, numerous cities still grapple with inefficient energy usage and disparities in energy distribution. As the trend toward electrification in urban energy use progresses, other energy sources are increasingly pivoting away from fossil fuels in favor of electricity. Addressing the reduction of fossil fuel use in urban areas, optimizing energy usage regulations, and fostering a transition to low-carbon energy systems have become key priorities for the government and academia [5,6].
Following a phase of rapid expansion, China’s economy has gradually begun to focus on solid growth. Currently, the swift advancement of innovative technologies such as big data coupled with the Internet of Things is ushering individuals into the digital economy [7]. The digital network infrastructure serves as a vital conduit and central hub for the evolution of the digital landscape, playing a crucial role in reshaping the current industrial framework and economic system while promoting sustainable, high-quality growth [8,9]. More importantly, there is a strong consensus that network technology, acting as a fresh catalyst for economic progress, is poised to spark a new era of industrial and technological transformation, paving the way for significant economic shifts. From a global perspective, an increasing number of countries are starting to develop national plans for network infrastructure as a means to fulfil the technological strengths and stimulate economic growth [10]. In addition, despite China’s remarkable progress in enhancing its transportation infrastructure, such as highways, airports, and railways, there remain significant opportunities for improvement in network capabilities. When compared to more affluent nations, there is a considerable gap in network performance and service quality. Issues like slow internet speeds, inconsistent coverage, and uneven development between urban and rural areas continue to pose challenges. That being the case, the Chinese government gradually recognized the importance of broadband networks by formally integrating them into the national strategy with the launch of the Broadband China initiative in 2013. Between 2014 and 2016, three groups of 117 cities were selected to participate in the BCPP. Theoretically speaking, the rollout of the BCPP is expected to boost the number of broadband users, expand network coverage, and enhance connection speeds in these pilot cities. This initiative is expected to pave the way for optimizing resource allocation, promoting the effectiveness of technological advancements, facilitating the digital transformation for traditional industries, and ultimately lowering energy consumption in urban areas [11]. Consequently, has the new digital infrastructure established by the BCPP led to a decrease in urban energy use amid the rise of the digital economy? What mechanisms are at play? Furthermore, are there variations in the impact across different cities? Beyond enhancing the research on how digital network infrastructure affects the transformation of urban energy structures, addressing these questions can expand the rating of policy effects related to the execution of the BCPP, carrying important theoretical and practical significance [12,13].
This study focuses on how the BCPP affects urban energy consumption in China. Specifically, we use a multi-phase DID technique fully declared below to analyze the empirical effects for the BCPP on energy usage in urban areas, utilizing a balanced panel dataset from 279 Chinese cities spanning 2006–2021, with the BCPP serving as an external shock. Our research distinguishes itself from earlier studies through four primary aspects: First, we fully assess the total energy consumption (expressed in terms of common coal) across 279 cities in China, drawing from existing studies and data. This approach renders the energy consumption figures for each city clearer and more comparable. We achieve this by integrating energy conversion metrics from the Intergovernmental Panel on Climate Change (IPCC) affiliated with the United Nations with three types of urban energy usage: natural gas and liquefied petroleum gas combined with overall social electricity consumption. Second, we apply theories and empirical studies connected with the advance of new digital infrastructure to data collected from urban panels. This greatly enhances our analysis of digital infrastructure at the city level, closely linking its establishment to energy usage patterns, thereby offering empirical evidence to support the transition towards a more sustainable urban energy framework. Third, to assess the impact for the BCPP in lowering urban energy consumption, we adopt a multi-phase DID technique. The pathways and influencing factors are scrutinized through an event study methodology, paired with Propensity Score Matching DID (PSM-DID) and the Bacon decomposition technique. By integrating various econometric approaches, the study not only enhances the reliability of the findings but also offers a theoretical framework for the digital transformation of urban areas. Finally, the study discloses the policy benefits for the BCPP on energy consumption in different cities, taking into account aspects such as population size and landscape direction coupled with resource availability. The findings serve as a valuable resource for guiding the development of urban digital network infrastructure tailored to specific local conditions.
The rest of this study is formatted as such. The 2nd part offers a comprehensive review of the relevant literature concerning the BCPP and urban energy consumption. In the 3rd part, we delve deeper into the implementation of the BCPP and its impact on energy use in urban areas. The 4th part outlines the specifications of the multi-phase DID model, variables, and data. The 5th part presents an analysis of the empirical results. Finally, we conclude the study.

2. Literature Review

The connection between digital network infrastructure and energy consumption, in recent years, remains a hot topic among researchers. A literature review reveals that the related studies can be categorized into three groups: studies on the factors affecting energy use, studies on the effects for the implementation of the BCPP, and research on the application of the DID model. Below is a brief overview of the relevant literature.

2.1. Research on Factors Affecting Energy Consumption

Energy serves as a crucial element that enables a nation or region to achieve consistent growth in production by enhancing efficiency, optimizing industrial frameworks, and promoting sustainable social and economic progress. Currently, the academic com-munity is deeply engaged in exploring the various factors that impact energy consumption. Researchers primarily focus on the macroeconomic influences on energy usage, including aspects such as trade openness, technological advancement, financial growth, industrial composition, and overall economic development. Many scholars argued that economic growth tended to elevate local incomes and improve the operational conditions for businesses, but at the same time, it also increased the demand for energy in both production and daily life, ultimately raising energy consumption [14]. As an illustration, Shahbaz et al. [15] deliberated on the connection between the utilization of energy and economic development by employing the Dynamic Value at Risk (DVAR) model, analyzing cross-national panel data from 11 countries spanning the years 1972 to 2013. The report indicated that as economies grew, energy consumption had surged in various countries. Based on cross-nation panel data from 19 OECD economies spanning 1990–2020, Hondroyiannis et al. [16] found that economic growth has a significant impact on the use of sustainable energy. Additionally, Zhu and Shan [17] demonstrated that modifying industrial structures could substantially reduce energy consumption intensity, utilizing a multi-objective optimization model based on industry data from China covering the years 2005–2018. Brodny and Tutak [18] studied EU countries and found that improving energy efficiency in the industrial sector can help reduce energy consumption and have a positive impact on the entire industry and economy, using data from 1995 to 2019. Their research concluded that improving industrial structure can decrease regional energy consumption by boosting energy efficiency through technological advancements. Lastly, Topcu and Payne [19] analyzed cross-national panel datasets from 32 high-income countries during the period of 1990–2014, using a panel regression model to assess to what extent economic financing growth affects energy utilization. Their findings indicated that there is no significant statistical link between the two variables. However, many scholars remain doubtful. For example, using a sample from 30 Chinese provinces during the period of 2010–2020, Tang and Zhou [20] deliberated how green funding affects energy usage by utilizing the geographical Durbin model. The results revealed that the expansion of green finance not only significantly reduced energy consumption in the target areas but also created a ripple effect in neighboring regions. Similarly, utilizing a 2008–2021 sample dataset from 16 German states and the quantile regression technique, Muhammad and Hoffmann [21] explored the impacts for technological innovation in lowering renewable energy usage. The outcomes disclosed that innovations driven by research and development and patent filings can substantially enhance the adoption of renewable energy sources. In addition, Suraparaju et al. [22] found that technological advancements can convert waste into energy use, which to some extent alleviated energy shortages and sustainability issues. Meanwhile, numerous researchers have investigated the benefits for trade liberalization affecting energy consumption [23]. For example, Voumik et al. [24] deliberated how trade liberalization affects energy usage by analyzing Australia’s time series data spanning from 1972 to 2020, utilizing an autoregressive distributed lag model. Their findings indicate that greater trade openness leads to a notable increase in energy consumption. On a more granular level, the academic discourse has largely focused on the influences of factors such as household income and energy usage trends on overall energy consumption. Specifically, from the lens of household income, researchers propose that as household incomes rise, expenditure levels will also increase, consequently affecting energy consumption patterns. For instance, Baraya et al. [25] employed a binary logit regression analysis on energy consumption data from Nigeria and found that higher household incomes significantly boost energy usage within households. Research conducted by Guta et al. [26], to a greater extent, confirmed that boosting the use for liquefied petroleum gas can lead to a substantial reduction in energy consumption within households. Their conclusions stem from an analysis of panel data regarding the energy habits of rural residents in India during the period of 2015–2018. Similarly, Liu et al. [27] revealed that from a business view, economic agglomeration and energy usage exhibited a U-shaped connection, using a micro-survey dataset collected from Chinese industrial companies spanning 2003–2012. The relation was closely linked to the technological advancements and clustering patterns within the sector. Additionally, based on a household survey data, Tabata and Tsai [28] found that to some extent, energy use was related to household economic conditions, and the rise in energy prices made it easier for elderly households to fall into fuel poverty.

2.2. Research on the Effects for Broadband China Pilot Policy

Broadband networks, to some extent, serve as the backbone of the 4th Industrial Revolution, playing a crucial role in driving social and economic progress, modernizing industries, and boosting global competitiveness. Their impact on the advance of nations and regions is both significant and extensive. Thus, the academic community has conducted thorough investigations into the implementation of the Broadband China Strategy (BCPP). Researchers primarily focus on three key areas: the economic, environmental, and social implications of this strategy. From an economic perspective, scholars assess how the BCPP influences economic growth, income disparity, innovation, and entrepreneurship. For example, in a study conducted by Zhang [29] utilizing panel data from 31 provinces in China during the period of 2019–2020, it was found that the promotion of broadband can effectively mitigate economic losses in the country. Zhang et al. [30] utilized the DID technique to analyze the impact for BCPP execution on the overall factor productivity of Chinese firms from 2006 to 2018. Their findings indicated that this policy could significantly enhance overall factor productivity. In a separate study, Liang et al. [31] investigated the influence of the BCPP on income inequality, employing a 2010–2020 sample from 281 Chinese cities. They revealed that the policy, to some extent, has the potential to reduce income disparity considerably through improvements in labor technical structure and technological advancements. Additionally, Qiu et al. [32] indicated that broadband internet helps diminish income gaps in urban areas, drawing on urban data from China between 2005 and 2015 while also using the DID model. Further, Yang et al. [33] investigated the relationship between broadband internet access and entrepreneurial creativity among Chinese listed companies and prefecture-level cities, applying the Ordinary Least Squares (OLS) method. Their research concluded that broadband access fosters corporate innovation by enhancing R&D personnel and individual innovation efficiency. Finally, Luo et al. [11] examined the implications of the BCPP for entrepreneurship in China, again employing the DID model and analyzing data from 285 cities over the period of 2001–2018. The findings indicate that the strategy can significantly boost entrepreneurial efforts through financial advancements and the consolidation of human capital. Scholars primarily examine the implications of the BCPP on environmental pollution, focusing on its ecological consequences. For example, utilizing a 2006–2019 sample for 279 Chinese cities coupled with multi-phase DID technique, Zhou et al. [13] demonstrated that the BCPP, in a finer way, has fostered a harmonious balance between industrial growth and environmental safeguarding. Even more, this strategy notably alleviates environmental pollution and encourages resource recycling. Similarly, using a dataset from 286 cities across China during the period of 2010–2020 combined with multi-phase DID technique, Qu et al. [34] conducted an empirical analysis. Most importantly, they found that the BCPP scheme greatly enhanced urban environmental pollution management. Additionally, He et al. [35] constructed a DID model based on pollution data from Chinese firms collected between 2009 and 2015, revealing that the BCPP can significantly decrease corporate pollutants, particularly SO2 emissions. From a societal perspective, researchers have explored the influence of the BCPP on various aspects of local life, including marriage, employment, and health. Xu et al. [36] conducted a study by utilizing the DID model, drawing on a 2010–2020 China Family Panel Studies (CFPS) sample. Their findings revealed that advancements in digital infrastructure contributed to improved health outcomes for residents by increasing income levels and enhancing healthcare services. To fully identify the benefits for broadband advance on employment, Jin et al. [37] also applied the DID model, analyzing CFPS data from 2010 to 2018. They found that while the expansion of internet access positively influenced the employment rates of low-skilled workers, it did not significantly affect those of high-skilled workers. Similarly, Zheng et al. [38] utilized the Ordinary Least Squares (OLS) method on provincial data from 2002 to 2014 and found that the rise in broadband internet usage correlated with an increase in divorce rates, with effects varying based on communication methods, income brackets, and educational levels. Lastly, using dataset from 281 Chinese cities during the period of 2006–2020 coupled with a multi-phase DID technique, Xue et al. [39] disclosed that internet advance, to some extent, notably facilitated financial fraud in urban areas by fostering trust among strangers.

2.3. Application Research of the DID Model

To best our knowledge, the DID model represents a robust and scientific means for evaluating the genuine impact of a policy implemented by a nation or area on its target populations by incorporating policy and time dummy variables. This approach significantly improves the accuracy and effectiveness of the policy’s implementation. As a result, the DID model has garnered substantial attention from researchers and is commonly utilized across various fields, including economics, environmental studies, and health economics. For instance, Cengiz et al. [40] utilized the DID model to analyze data from 138 U.S. states between 1979 and 2016, concluding that the policy aimed at increasing the minimum wage did not influence employment levels. Similarly, by employing a 2005–2020 dataset from 30 Chinese areas combined with a DID technique, Wang et al. [41] discovered that the share of families owned by an individual, as influenced by the two-child policy, could lead to a reduction in energy consumption on a province scale. Furthermore, Shtele et al. [42] used the DID model to study the competitive effects of railway ticket prices in Italy, which can better evaluate the impact of changes in railway ticket price policies on the market. Xu et al. [43] utilized data from Chinese A-share mentioned firms spanning the period of 2012–2021 to create a DID model. Their findings revealed that bolstering innovation capabilities greatly boosted the labor income share for companies, particularly through the establishment of the National Big Data Comprehensive Experimental Zone. Dunbar et al. [44] used a DID model to study and found that after considering ESG risk, foundations perform better, thus having greater importance for investment performance. Additionally, Guo et al. [45] conducted a DID empirical study by utilizing a sample from 260 Chinese cities during the period of 2009–2020. Their outcomes disclosed that the Smart City initiative greatly enhanced environmental performance, particularly benefiting the ecological landscape. Even more, utilizing panel data from 256 cities across China from 2011 to 2020, Guo et al. [46] applied a DID approach and revealed that recent demonstration city initiatives greatly decreased urban pollutant emissions. In a parallel study, Zhang et al. [47] performed an empirical investigation with provincial-level data from 2005 to 2019, concluding that the emission trading system effectively lowered the costs associated with marginal emission reductions. Utilizing panel data from Chinese coastal towns between 2006 and 2020, Pan et al. [48] implemented the DID model, finding that the marine ecological compensation policy (MEC) effectively addressed the problem of pollution in coastal waters. Similarly, Park et al. [49] found that short-term smoking cessation has a positive impact on mental health using a DID model based on Korean health group survey data from 2011 to 2013 and 2016 to 2018. In another study, using the DID model, Zhao and Zheng [50] examined county-level data from China from 2015 to 2021, revealing that to some extent, the policy promoting closer integration between county and township health services boosted medical service capabilities. Finally, using sample from the United States spanning 2000–2008 coupled with a DID technique, Braghieri et al. [51] declared that Facebook promotions, in a finer way, negatively affected students’ mental health.
In summary, extensive research conducted by scholars has fully probed how the BCPP and energy consumption are related, yielding encouraging results. However, several challenges persist within these studies. To begin with, there is a lack of consensus on the appropriate methods for measuring energy usage. The academic community holds differing opinions on the scientific assessment of energy consumption, especially when it comes to gauging energy usage in China. Most analyses tend to focus on the current energy consumption landscape based on the specific national contexts of various countries. This situation hampers a thorough scientific understanding of regional energy consumption trends and the enhancement of energy efficiency. Furthermore, while researchers have delved deeply into the myriad factors that affect energy consumption, there remains a significant gap in the literature addressing urban energy consumption in China through the lens of building digital infrastructure, particularly regarding the Broadband China Strategy. This situation to some extent hampers the progress of understanding the data factors that influence environmental governance and promote sustainable economic development in our digital era. Furthermore, when it comes to research approaches, although some scholars have deliberated to what extent digital economic development affects energy consumption, there is a noticeable scarcity of relevant studies to disclose the benefits for the BCPP on energy governance by using a multi-phase DID technique. That being the case, this gap presents challenges for conducting a thorough scientific evaluation of the policy’s impact on both economic and environmental governance. Additionally, research on the mechanisms and pathways through which the BCPP affects urban energy consumption remains limited, and it has not captured significant attention within the academic community. This lack of focus obstructs the effective use of digital infrastructure, particularly the BCPP, in reducing energy consumption and enhancing energy efficiency. Therefore, we seek to address the shortcomings of the existing literature by disclosing the effects for BCPP execution on energy consumption in urban areas, adopting a multi-phase DID model.

3. Policy Background and Research Hypothesis

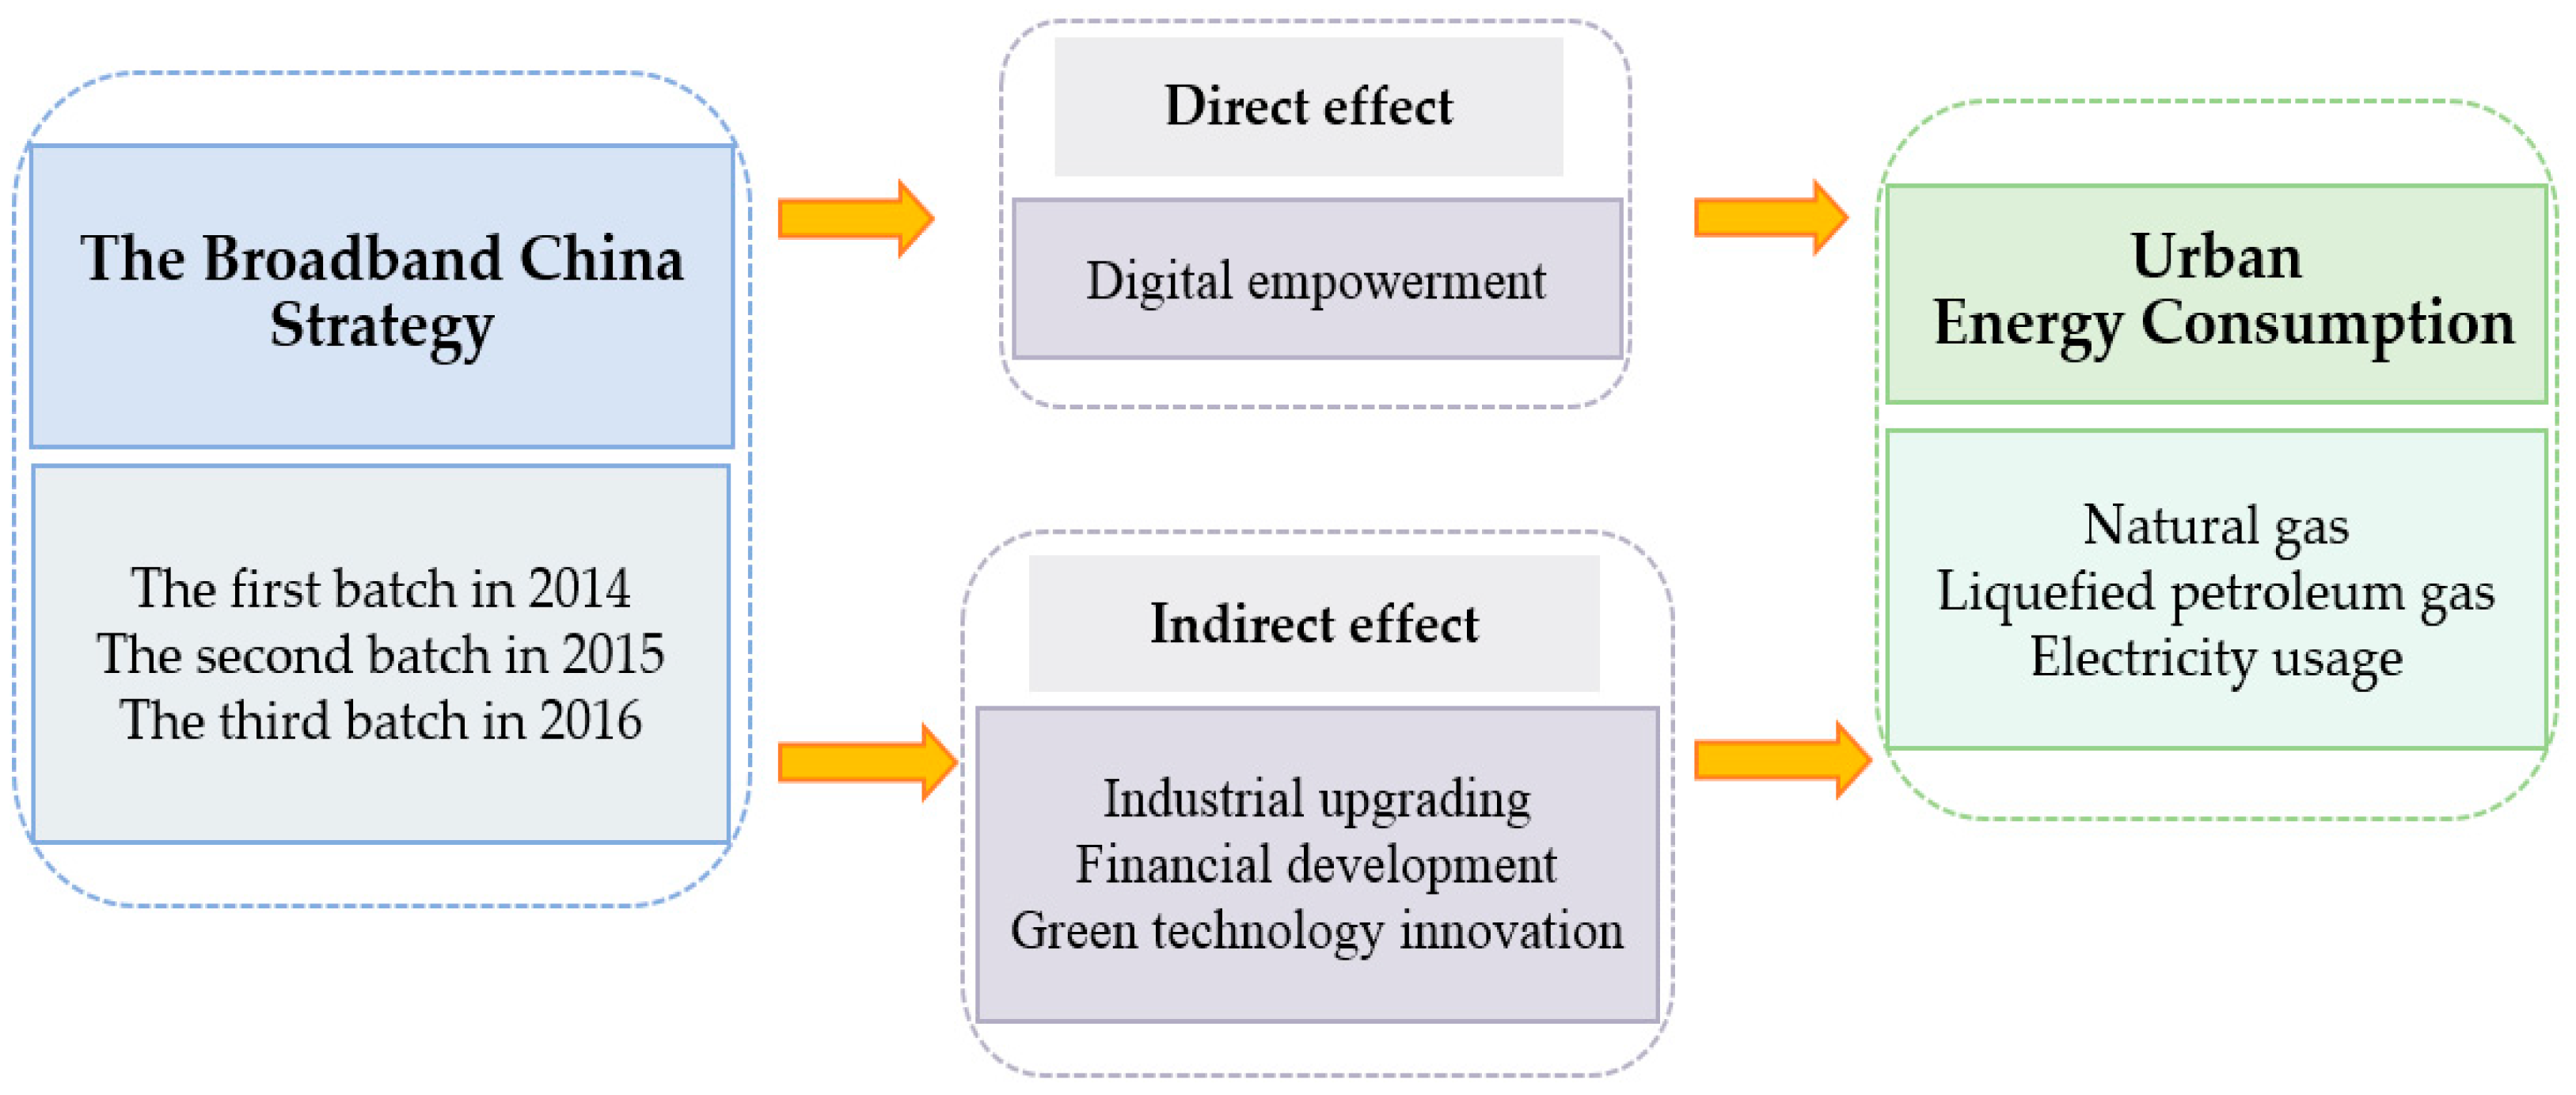
3.1. Policy Background for BCPP

In relation to digital age, the digital economy has surfaced as a vital tool for production and a key driver for economic growth. The swift development and widespread adoption of digital technologies, characterized by unique features and trends, play a critical role in advancing economy. It is clear that digital economy holds significant importance. To be precise, it not only acts as a fresh catalyst for increasing productivity but also contributes substantially to achieving high-quality economic growth. Technologies like the internet, big data, and broadband have become essential pillars for the digital economy’s expansion. Then, digital economy advance and broadband seem deeply interconnected. The speed and quality of broadband network services, in a general way, determine the breadth and depth for digital economy advance. Therefore, broadband construction is one of the important contents of improving digital infrastructure. At present, there is still a certain gap between Chinese broadband network access rate, internet penetration rate, and developed nations, for example, Europe combined with the United States. Following the 2013 introduction of the BCPP implementation plan in China, broadband has been recognized as a key national strategic public infrastructure. This vital digital resource not only supports basic needs such as food, clothing, shelter, and transportation but also propels the advancement of the nation’s high-tech sectors. The BCPP scheme aims to enhance urban areas with quicker and more efficient information transactions in cities and expand broadband access in rural areas while also accelerating the modernization of information networks to broadband standards. This initiative will pave the way for enhanced informatization, enabling seamless connectivity among various urban equipment, systems, and applications, while fully harnessing the potential of data across production, consumption, and other sectors. In 2014, 39 cities or groups were recognized as Broadband China Demonstration Cities. This number rose to 78 in 2015 and further increased to 117 in 2016. As illustrated in Figure 1, the pilot cities for Broadband China are spread across 30 provinces, accounting for 88.24% of all provinces in China. Among these, 11 provinces, including such cities as Beijing, Shenyang, Nanjing, and Tianjin, are located in the eastern region, while 19 provinces, including such cities as Wuhan, Changsha, Yinchuan, Guiyang, and Chengdu, represent the central and western areas. These pilot cities have set benchmarks in various aspects, including economics and environmental control. The BCPP has become increasingly integral to everyday life, contributing greatly to the expansion of broadband across the nation.

3.2. Theoretical Analysis and Research Hypothesis

The BCPP initiative, as a whole, greatly plays a critical part in enhancing Chinese digital infrastructure, with the potential to significantly elevate both digital accessibility and proficiency. By channeling substantial investments into essential digital assets such as data centers and broadband networks, this strategy has not only bolstered the communication capabilities but also established a robust basis for enhancing digital economy. Throughout its rollout, the BCPP has generated considerable digital dividends, which extend beyond mere economic growth and job creation. These dividends promise substantial benefits in terms of energy efficiency and environmental sustainability. Specifically, the BCPP can indirectly affect urban carbon emissions and offers crucial support in achieving the target of peaking carbon by promoting the modernization of industrial structures coupled with green innovation. In terms of industrial upgrading, traditional sectors have begun to evolve towards smarter and more eco-friendly practices due to the pervasive integration of digital technology. This shift not only reduces pollution but also enhances manufacturing efficiency and conserves energy. Furthermore, broadband networks facilitate the swift adoption and development of green technologies by providing robust data support for research, development, and application in environmental protection. In this way, the BCPP introduces new ideas and pathways for energy and environmental conservation while simultaneously driving digital economy. Consequently, we declare the proposition stated below in a finer way.
Hypothesis 1 (H1).
The BCPP can greatly lower energy consumption.
The implementation of the BCPP significantly influences the reduction of energy usage while fostering the modernization of the industrial framework. First, the BCPP scheme promotes advancements in industrial structure. Accelerating the development and deployment of digital infrastructure creates a robust platform for cutting-edge techniques like cloud computing and big data, which profoundly impact microeconomic entities. To be specific, cloud computing enhances data processing and storage capabilities, reduces the costs associated with information retrieval, and greatly improves resource allocation efficiency. This increase in information flow among businesses lays a solid foundation for transforming industrial structure into one that is more advanced and intelligent, thereby stimulating industrial innovation and facilitating the effective integration of information resources. Conversely, refining industrial structures contributes to a notable decrease in energy consumption. The hyperlink for cloud computing and big data revolutionized scientific research efforts. By leveraging these technologies, research institutions can accelerate technological advancements at an unprecedented pace, significantly shortening the R&D cycle and enhancing efficiency. This not only hastens the development and deployment for clean energy and green technology, but also to some extent leads to a substantial reduction in large-scale energy consumption through optimized industrial processes. For instance, as noted by Wu et al. [52] and Feng et al. [53], upgrading and transforming industrial practices can diminish dependence on fossil fuels, thereby contributing to lower energy consumption. Consequently, this study proposes Hypothesis 2.
Hypothesis 2 (H2).
By encouraging industrial structure upgrading, the BCPP can greatly lower urban energy consumption.
The groundwork for a new digital revolution in financial services has been laid by the widespread adoption and utilization of digital infrastructure, particularly through the internet and mobile networks. This transition has not only greatly enhanced the quality, efficiency, and accessibility for banking goods and services but has also hastened the pace of innovation in financial products and ongoing reforms within the financial markets. As the financial system evolves and innovative capabilities surge, the availability and attractiveness of green financing, a fresh financial model aimed at promoting environmental sustainability and the advancement of green technology, have seen substantial growth. With more financing options and investment avenues on the table, businesses are increasingly inclined to invest in eco-friendly projects. This shift has accelerated the transition towards greener practices, thereby fostering improvements in energy efficiency and reducing overall energy consumption in urban areas. Moreover, digital financial services have played a crucial role in enhancing transparency within financial markets, effectively addressing the challenges posed by information asymmetry. This development offers investors a more robust and clearer basis for evaluating projects, making it easier to identify and finance high-efficiency, energy-saving initiatives. Such advancements not only promote optimal resource allocation for sustainable development but also contribute to lowering energy usage. By fostering advanced financial development, the BCPP not only directly enhances the financial system’s efficiency but also indirectly propels the growth of green finance and encourages corporate sustainability efforts. The collective endeavor aims to greatly reduce urban energy usage and pollution emissions, laying a strong foundation for a low-carbon, sustainable, and environmentally friendly model of urban development. Thus, Hypothesis 3 is put out in this work.
Hypothesis 3 (H3).
By encouraging financial development, the BCPP can lower urban energy consumption.
With the rise in digitization and the growing impact of information technology, the BCPP lays a solid foundation for breakthroughs in green technology innovation. By building a state-of-the-art digital infrastructure, the strategy cuts down on information search costs. It promotes the rapid and widespread sharing of knowledge, data, and research related to green technology. This informatization effect not only knocks down technical barriers but also sparks technological collaboration and exchange, accelerating the development and adoption of green technologies. Green tech innovation is key to cutting energy consumption in cities. Creating and implementing effective energy utilization technologies drives demand for skilled workers and R&D investment. It also optimizes how resources are allocated, which boosts energy efficiency. What is more, green tech innovation has a significant spillover effect on surrounding regions. Through collaboration and the sharing of expertise, it can encourage eco-friendly development in neighboring areas, helping to bring down the city’s overall energy use. Specifically, green tech innovation affects energy efficiency by influencing resource allocation and optimizing industrial structures. It not only promotes the efficient flow and distribution of innovative components and improves energy use efficiency and effectiveness, but it also supports the shift towards high-value, low-energy consumption industries. Therefore, Hypothesis 4 is put forward as follows.
Hypothesis 4 (H4).
By promoting green technology innovation, the BCPP can lower urban energy consumption.
In summary, based on the above theoretical analysis, it is not difficult to find that the impacts of the BCPP on urban energy consumption can be divided into two channels: direct effect and indirect effect, which can be summarized as shown in Figure 2.

4. Methodology, Variable Description, and Data Sources

4.1. The Framework of Multi-Phase DID Model

Theoretical research stated above discloses that BCPP can notably lessen energy consumption. To verify this validity, following Xu et al. [36], we employed BCPP as a triggering event and constructed a multi-phase DID model to empirically gauge its effects on city energy use. This was performed to delve deeper into the potential causal link between the two variables. Here is the framework of the multi-phase DID model:
UECit = β0 + β1 × Broadit + β2 × Controlit + γi + λt + εit
where t stands for the year and i for the city. Urban energy usage declared above is represented by the explained variable, UECit. The variable Broadit indicates if the BCPP plan has been put into action. To be precise, if BCPP is executed for city i in year t, the value for variable Broadit equals one. Conversely, it remains zero. Even more, the influence for BCPP on energy consumption at the city level is reflected by β1. To be specific, BCPP exacerbates urban energy usage when β1 > 0. On the contrary, β1 < 0 signifies that BCPP lowers urban energy usage. The sign β2 declares the coefficients for all control variables. β0 is the constant term. In addition, γi and λt reflect the fixed effects of city (known as City FE hereinafter) combined with year (Year FE). What is more, εit is the random disturbance term. Then, Controlit stands for control variable set, which to a greater extent will exert an influence on urban energy consumption, such as economic development, market size, population scale, urbanization rate, and the degree for government fiscal intervention.

4.2. Variable Declaration

4.2.1. Explained Variable: Urban Energy Consumption (UEC)

For the record, the Chinese government has not yet released city-level data for energy consumption that can be directly used for academic research. However, certain scholars are leveraging satellite imagery for night light assessments and other indirect methods to reflect urban energy usage [54,55]. Most importantly, to exactly disclose the spatiotemporal evolution attributes for Chinese energy usage, referring to Xu and Huang [56], this study paid attention to gauging the energy consumption of cities at the prefecture level and higher, to be more precise, employing three key energy metrics: E1 for total natural gas supplies (10,000 cubic meters), E2 for total liquefied petroleum gas supplies (in tons), and E3 for overall electricity usage (10,000 kWh). Additionally, relying upon the energy conversion factors declared by the Chinese government, these figures are finally converted into the total energy usage at the city level (known as common coal in 10,000 tons), the expression for calculating total energy usage is:
TUEC = δ1 × E1 + δ1 × E2 + δ1 × E3
where TUEC reflects the total energy usage on a city scale. Especially, in China, the Ministry of Industry and Technology offers certain specific conversion factors for various energy sources into common coal, reflected as δ1, δ2, and δ3. To be precise, the factor δ1 for natural gas equals to 1.33 kg of common coal per cubic meter, the factor δ2 for liquefied petroleum gas equals to 1.7143 kg of common coal per kilogram, and the factor δ3 for total electricity amounts to 0.1229 kg of common coal per kilowatt hours. To obtain the per capita energy usage at the city level, the whole energy usage from three sources of urban energy relative to the population scale in each city has been standardized and logarithmized, ultimately being formed from the per capita energy consumption for each city required for empirical research. The results are exhibited in Figure 3.

4.2.2. Core Explanatory Variable: Broadband China Pilot Policy (BCPP)

The advance of digital economy appears inexorably linked to broadband. To be specific, the speed and quality of broadband network services greatly determine the breadth and depth for digital economy. Therefore, broadband construction is one of the important aspects for improving digital infrastructure. To accelerate broadband construction, in 2013, the Broadband China Action Scheme was laid out by the Chinese government, with the intention of promoting the healthy development of China’s broadband infrastructure construction. Subsequently, three waves of 117 BCPP pilot areas were selected in 2014, 2015, and 2016. As a non-national policy shock, it offers a good empirical field for assessing the energy effects of BCPP using a multi-phase DID model in this study. To avoid estimation errors caused by differences in administrative levels, we exclude autonomous prefectures, county-level cities, and some cities with severe data missing. In the empirical sample, 105 pilot cities coupled with 174 non-pilot cities are ultimately retained. The core explanatory variable Broad in Model (1) represents BCPP scheme, which is composed of the connection item for policy and time dummy variables (known as Policy and Time). To be more precise, regarding the assignment of variable Policy, if a city is selected as an experimental area for BCPP scheme, the value of Policy is one; otherwise, it remains zero. Regarding the assignment of time dummy variables Time, if a city becomes a trial area for BCPP in the current year, the value of Time is one for the present coupled with subsequent periods, or else it is zero. In this manner, the variable Broad stated in Model (1) is certainly obtained by multiplying variable Policy coupled with variable Time.

4.2.3. Control Variables

Given the distinctive dynamics of China’s economic growth, we incorporate a set of prefecture-level variables into our model to account for various factors that could influence urban energy consumption. These include market size (Exp), urbanization rate (Urban), government intervention degree (Gov), population scale (Pop), and economic development level (GDP). To be specific, market size (Exp) is expressed as the total expense of household consumption at the city level. Urbanization rate (Urban), as stated in Model (1), is reflected by the part of prefecture’s population in total that lives in urban areas. Government intervention (Gov), which to some extent measures the attitude towards accelerating energy structure transition, is represented by the percentage of local fiscal expenditure at the city level to its GDP in that year. Population scale (Pop) is expressed as the logarithm of permanent population at the prefecture level. Economic development level (GDP) is expressed as each city’s per capita regional gross domestic product (GDP).

4.3. Data Sources and Descriptive Statistics

To best our knowledge, as of 2023, China boasts a total of 293 cities, excluding autonomous prefectures, leagues, and regions. In light of data availability and comparability, we focused on a panel of 279 cities that meet or exceed the prefecture level, omitting 14 cities, such as Lvliang, Dingxi, Longnan, Zhongwei, Bijie, Tongren, etc., due to certain data deficiencies. The data under consideration ranged from 2006 to 2021. Notably, the original underlying data for Chinese urban energy use statistics can be categorized as two sources, namely China City Construction Statistics Yearbooks coupled with China Urban Statistics Yearbooks. In a similar way, the indicator data for BCPP plan was manually gathered and sorted from the government website of prefecture’s statistical bureau. Additionally, the other dataset for control variables was gathered from China Urban Statistics Yearbooks combined with EPS database. To effectively address missing data in specific years, we employed moving average and linear interpolation methods to fill it. Even more, given that the Chinese government has not yet released urban price indices, to eliminate the potential adverse effects from price changes on estimation results, we adopted the Consumer Price Index (CPI) of each province in 2006 as the standard and match it with the subordinate cities of each province to obtain the city level CPI based on 2006. In this manner, the total index was adopted to flatten all value variables and ultimately obtaining the actual variable data for each city. In addition, all variables stated in absolute terms have been logarithmically transformed to mitigate heteroscedasticity. The findings for each variable’s descriptive statistics are outlined in Table 1.

5. Empirical Results and Analysis

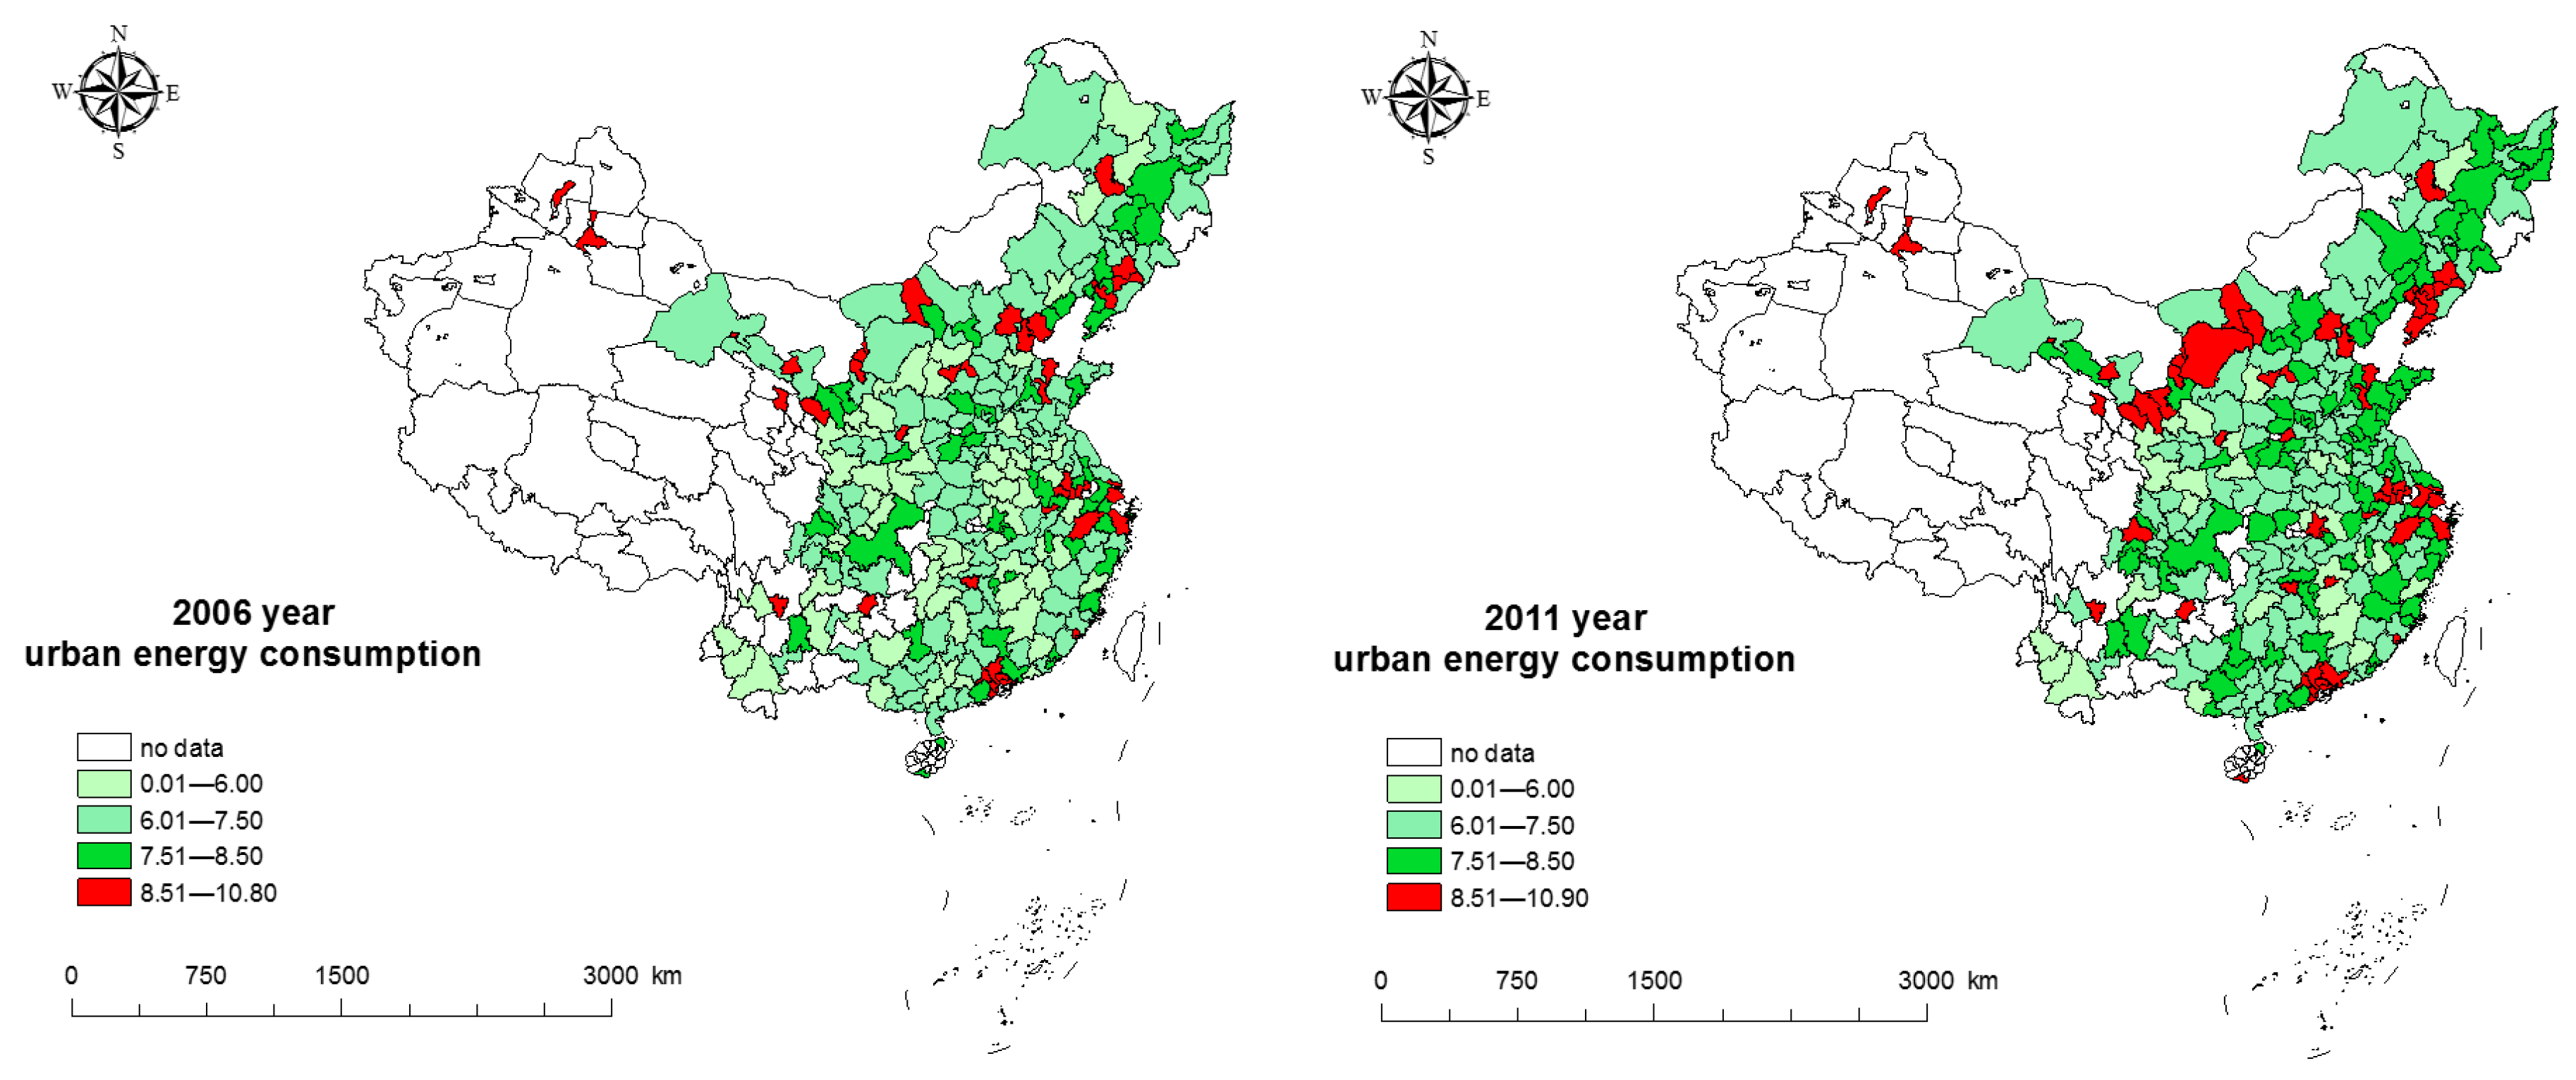
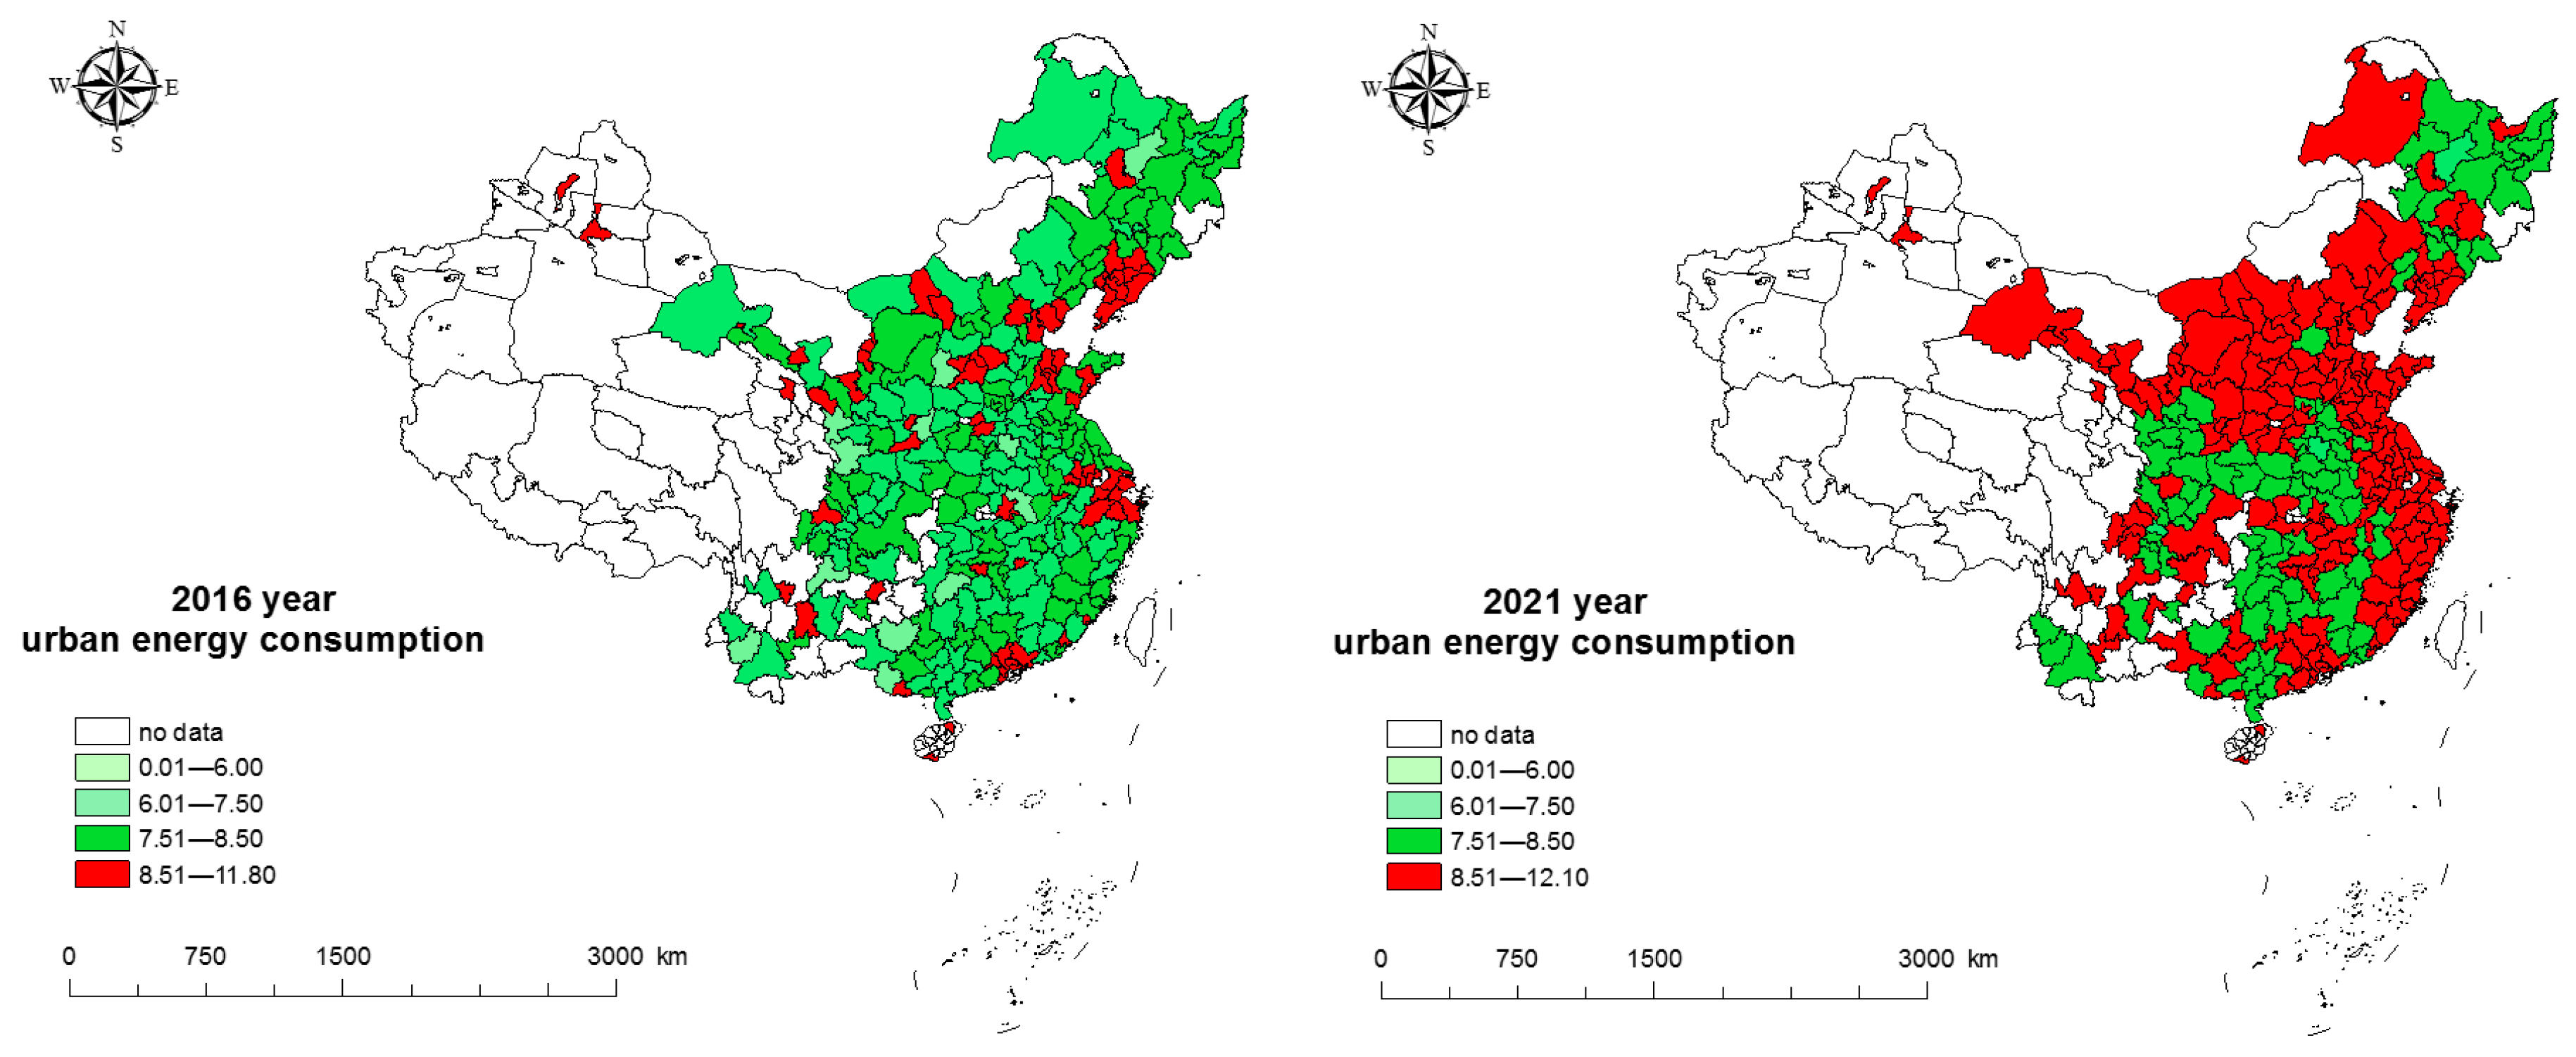
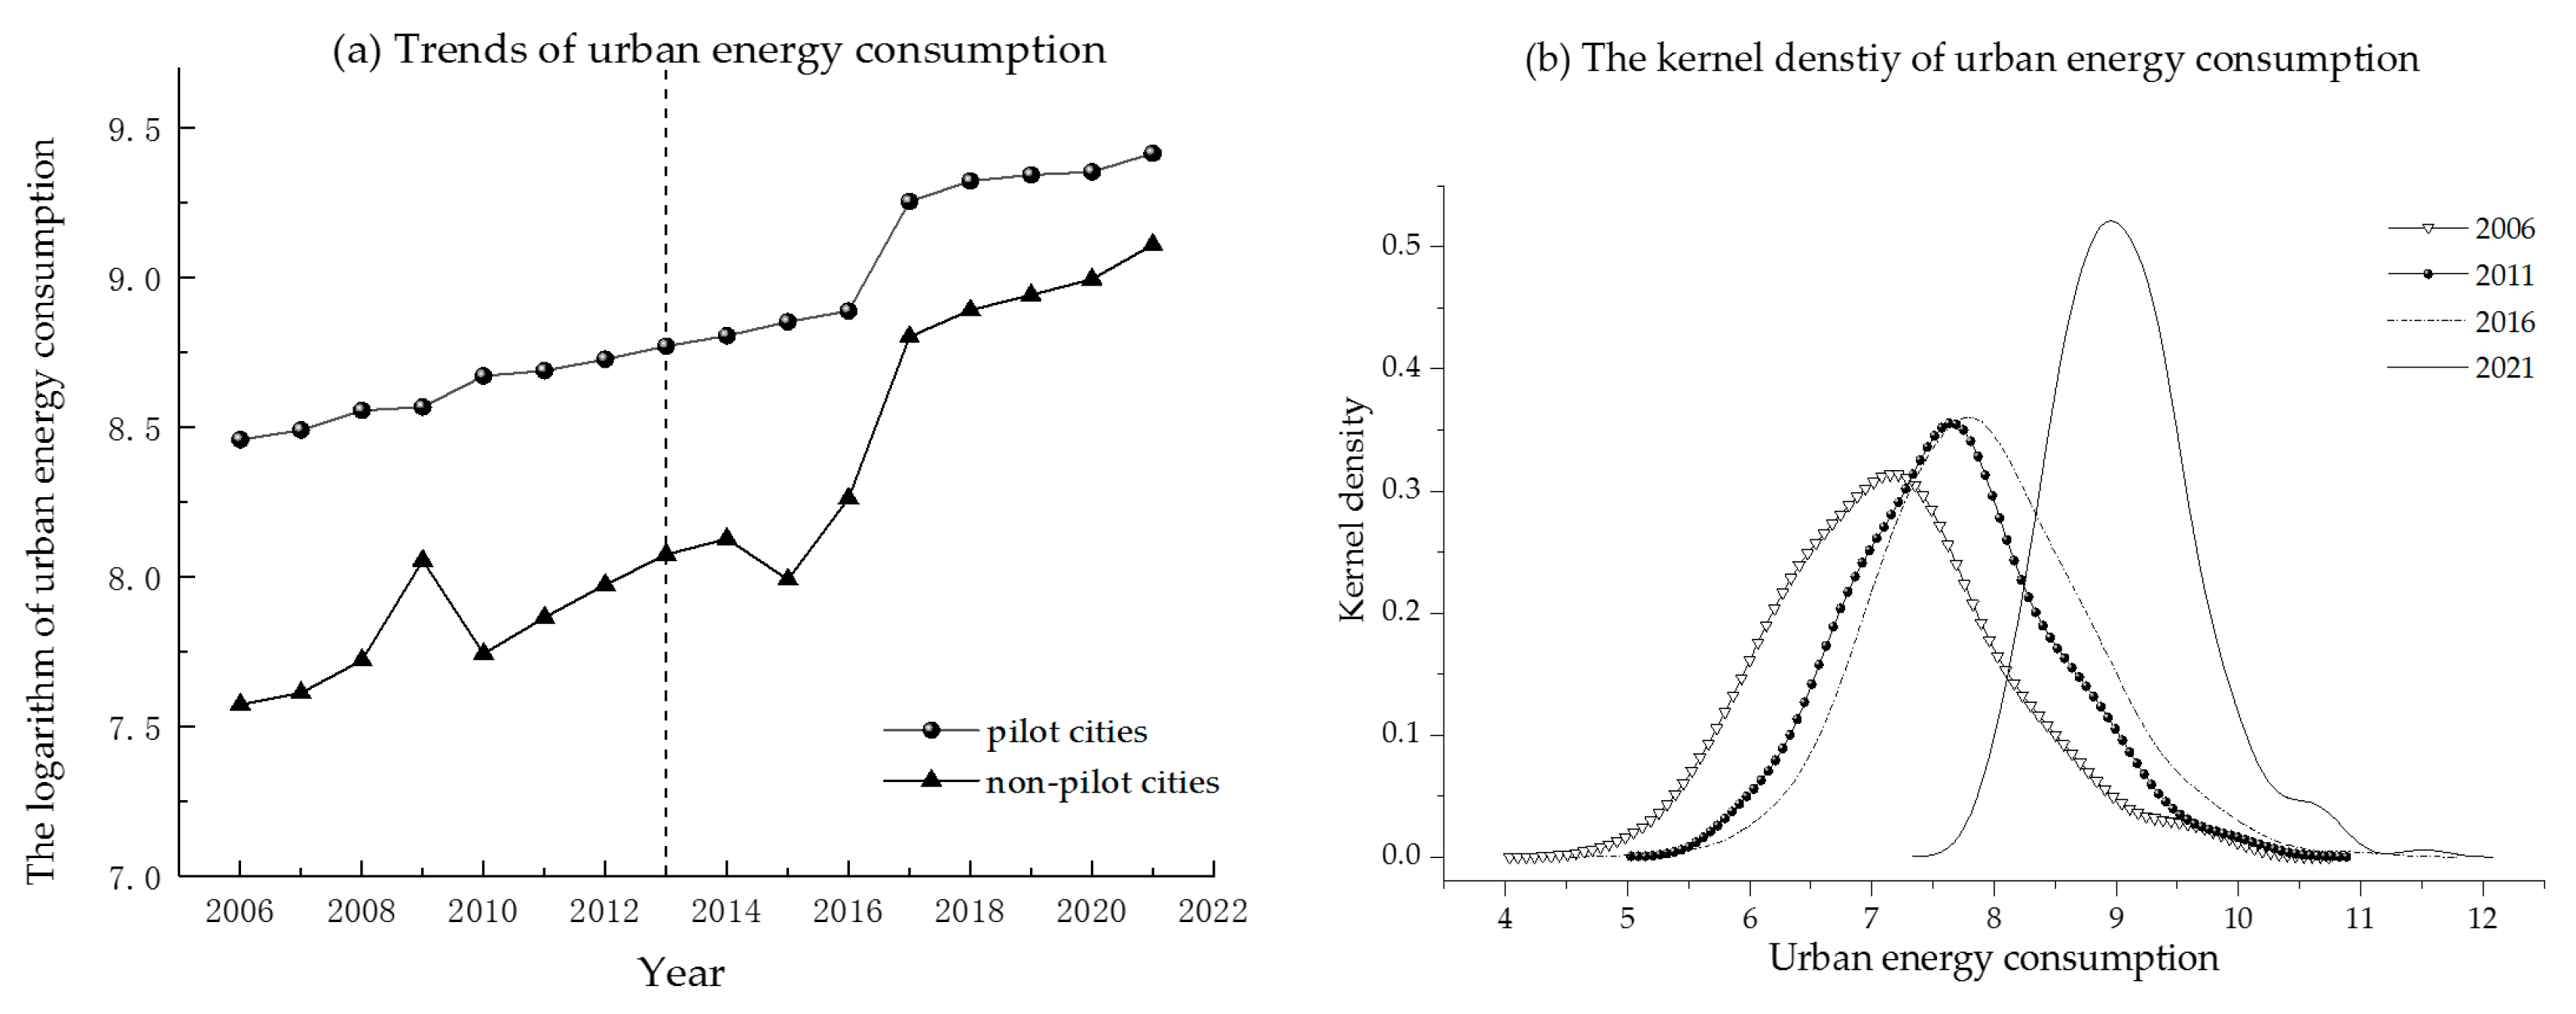
5.1. Temporal Evolution Trend for Urban Energy Consumption in China

To visibly illustrate the temporal evolution attributes for China’s urban energy consumption, following Xu and Huang [56], using the measurement data of per capita energy consumption from 279 cities previously stated, we generate the temporal trend chart and kernel density chart for urban energy usage, as depicted in Figure 4.
To be more precise, from the temporal evolution trend, as exhibited in Figure 4a, during the period of 2006–2021, urban energy usage on the whole reveals a continuous upward trend, and the energy usage for pilot areas is higher than that for non-pilot areas. Then, the result detects that with the sustained growth of the Chinese economy, urban development largely relies on the supply of energy. Therefore, in the future, the main battlefield to promote energy structure transformation to a greater extent will still be cities. From kernel dispersion, first, depicted by Figure 4b, the curves of urban energy usage generally shift to the right, indicating that urban energy consumption has been increasing year by year, similar to the results in Figure 4a. Second, the main peak for kernel density curves gradually increases, while the broadband gradually narrows, proving that urban energy usage exhibits a trend of clustering towards higher levels, and the gaps in energy usage among cities are gradually narrowing. Again, the curves during the period are unimodal, meaning that there is no significant multipolar differentiation. Finally, the curves on the whole exhibit a right-tailed distribution, implying that individual differences in urban energy usage are still significant, with some cities having much higher energy usage than others during the period.

5.2. Benchmark Regression Results

Even though the theoretical analysis stated above signifies that digital infrastructure construction can substantially lower urban energy usage, it has not been empirically verified, especially for developing countries. In this manner, adopting a bidirectional fixed effects technique and gradually adding control variables, we empirically probe how the BCPP affects urban energy consumption in accordance with Model (1), as displayed in Table 2.
To be specific, in Table 2, the effects for the BCPP on urban energy usage without introducing control variables is represented in Column (1). The impact for the BCPP on urban energy usage after adding factors such as economic development and market size is represented in Column (2). The impact for the BCPP on urban energy usage after introducing factors such as the economic development level, market size, population size, and urbanization rate is represented in Column (3). The impact for the BCPP on urban energy usage after introducing all control variables is represented in Column (4). The impact for the BCPP on urban energy usage after introducing all control variables and clustering them into cities is represented in Column (5). From the regression results declared above, it exhibits that in all models, the coefficient for the BCPP affecting urban energy usage remains notably negative. Taking Column 5 as an example, at the 1% level, the coefficient for the BCPP affecting urban energy usage appears −0.178. To a greater extent, it indicates that for each one standard deviation rise in the BCPP, urban energy usage will lower by 0.0541 (=−0.178 × 0.372/1.224) standard deviations, thus confirming Hypothesis 1 (H1). In other words, this reveals that facing the advance of digital economy, digital infrastructure improvement, especially the rise in broadband speed and service quality, greatly promotes the overflow and sharing of information knowledge, accelerates the progress and application of green energy-saving technologies, and further promotes digital transformation and energy-saving process innovation for industrial production, ultimately lowering urban energy consumption.
To sum up, the BCPP has made substantial strides in lowering energy consumption for urban areas, correlating to Duan et al.’s results [57]. Their research, which analyzed panel data from the Beijing–Tianjin–Hebei region spanning the period of 2010–2018, reveals that the digital economy remains vital in diminishing regional energy consumption intensity. Moreover, it can foster enhancements in energy efficiency in surrounding regions through the beneficial effects of technology spillover.

5.3. Robustness Tests

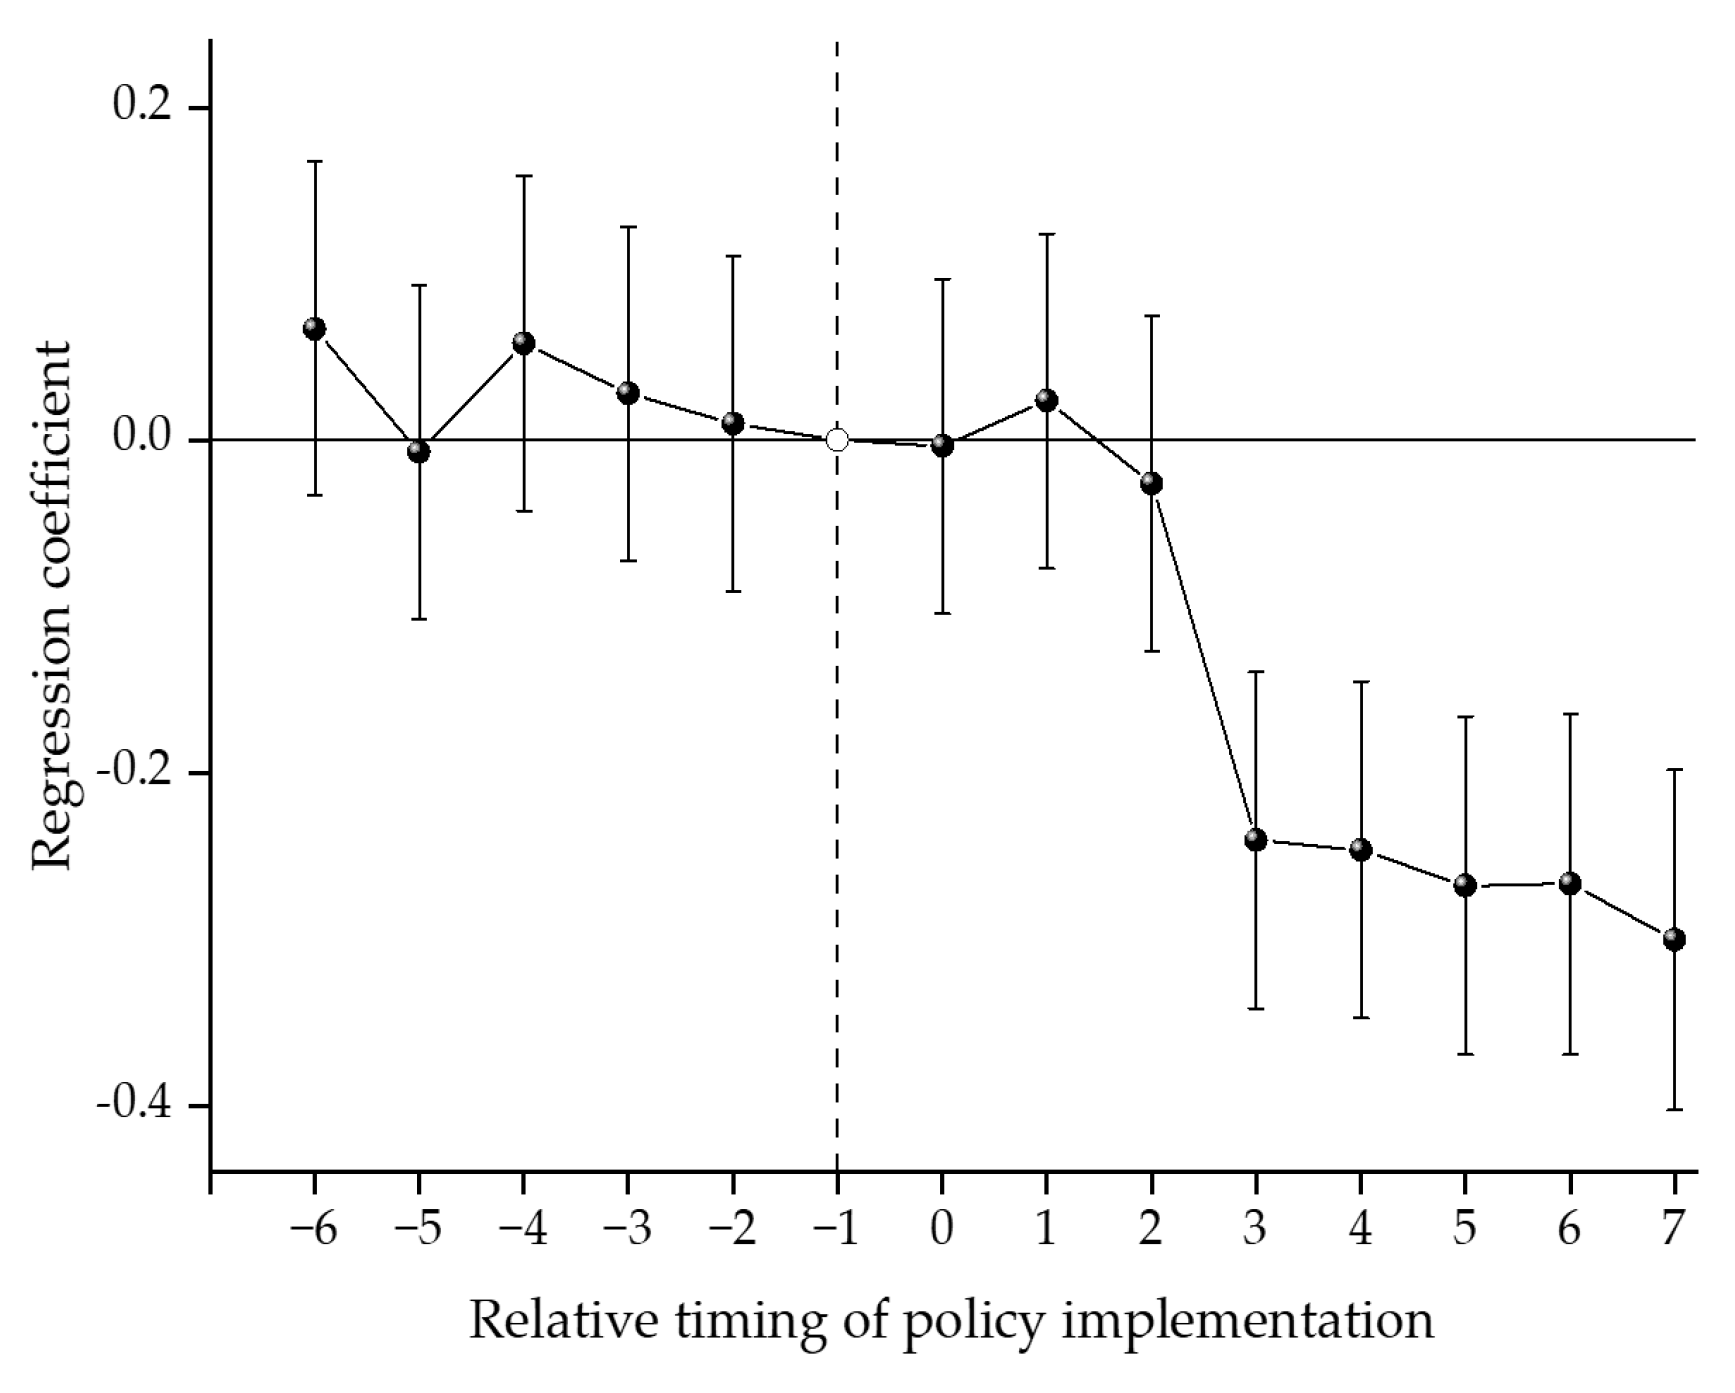
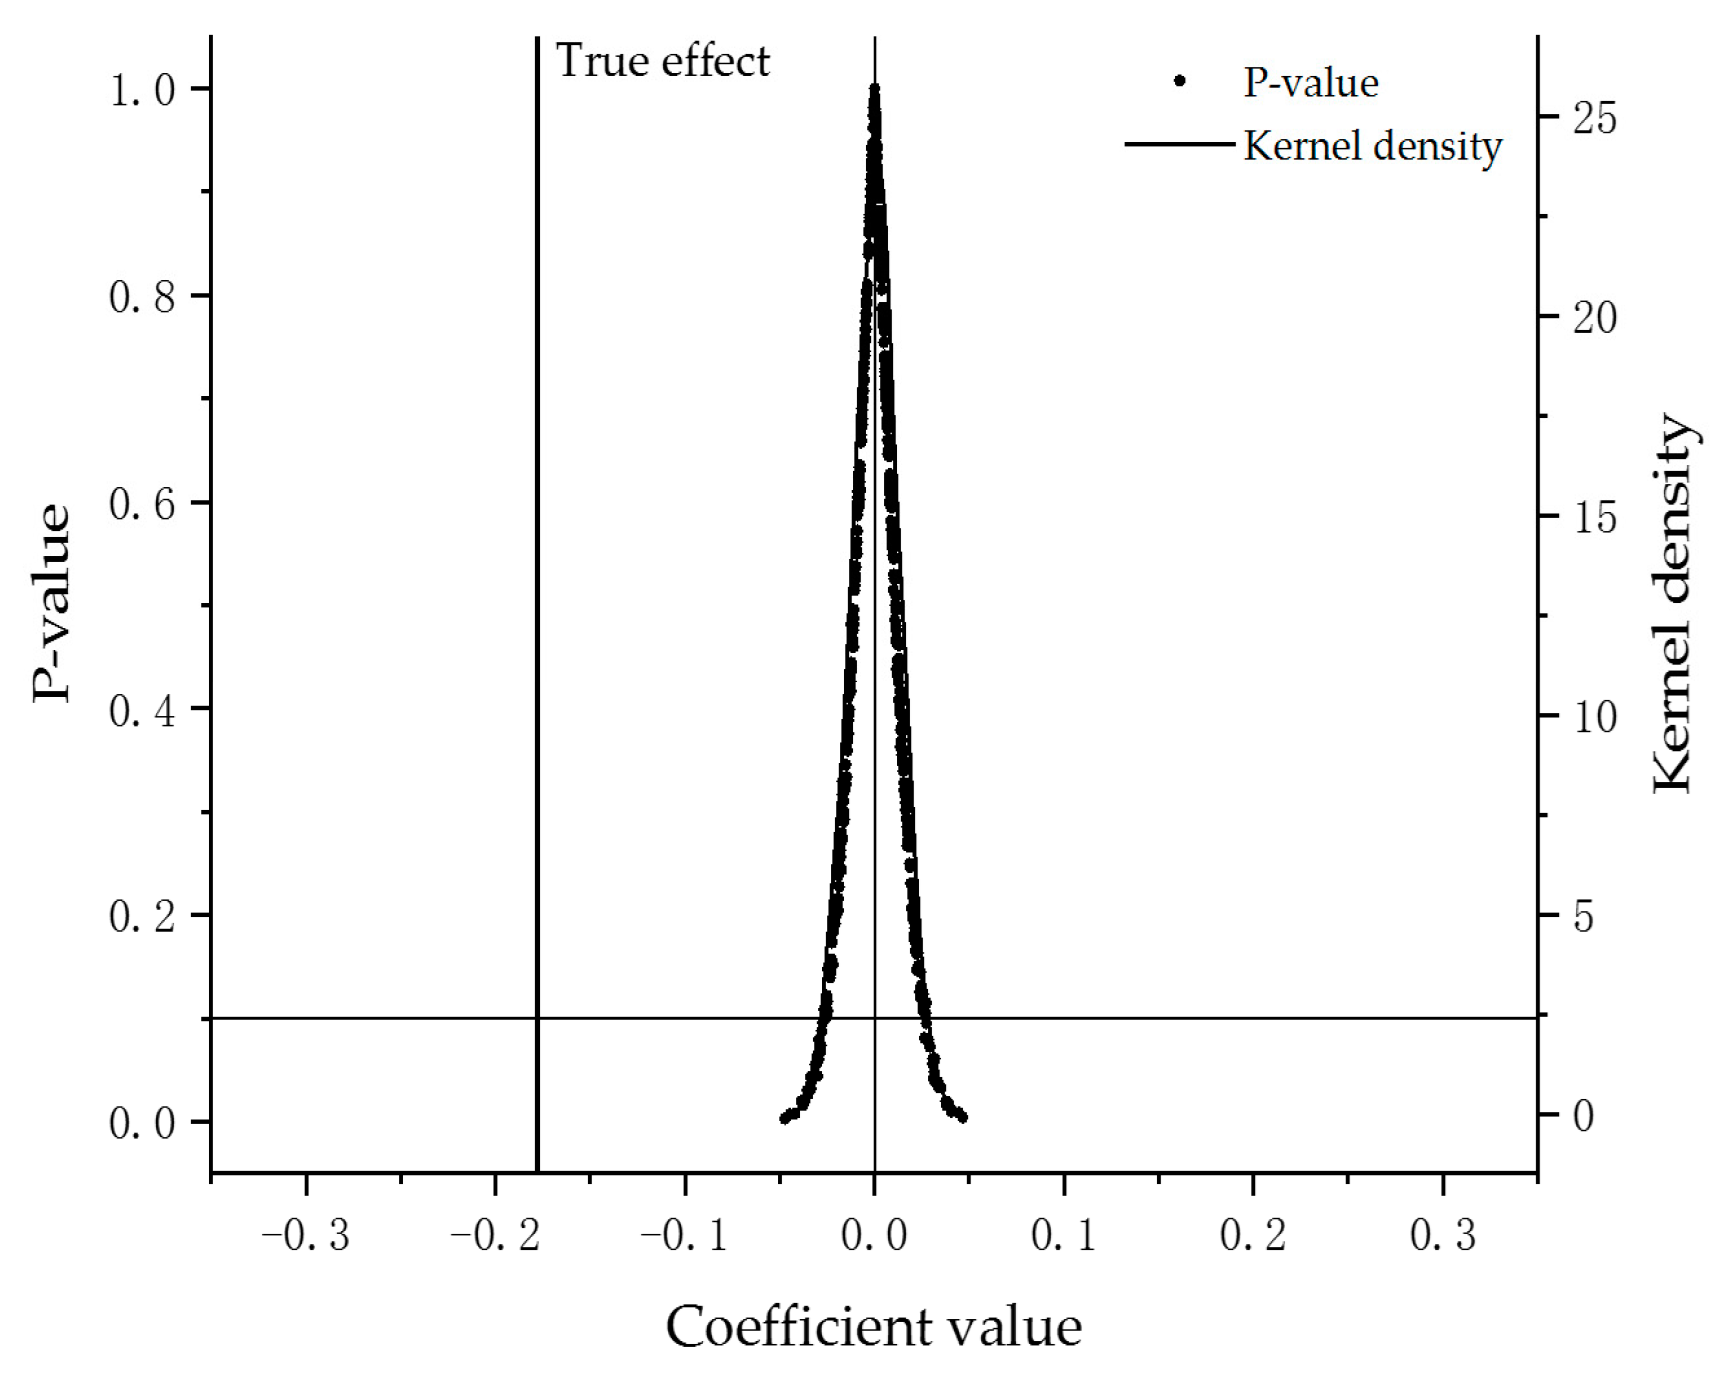
5.3.1. Parallel Trend Testing and Placebo Testing

While the DID model can mitigate endogeneity issues to a certain degree, its application relies on the experimental and control groups. Therefore, we test whether the impact of the BCPP on urban energy consumption is significantly negative by performing the parallel trend testing and the placebo testing, as shown in Figure 5 and Figure 6.
First, from the perspective of parallel trend testing, the test results confirm the parallel trend hypothesis. More precisely, this assumption posits that prior to the implementation of the policy, the overall trends in energy usage, either way, for both pilot and non-pilot cities are identical. Meanwhile, it is important to emphasize that the estimated findings declared above illustrate the common reaction impacts for the BCPP scheme on energy usage. However, they do not provide a precise explanation for the variations in energy usage, presented in benchmark regression, between pilot and non-pilot cities over different periods before BCPP execution. Therefore, following Beck et al. [58], as mentioned later, the research deeply analyzes the dynamic effects of the BCPP by using event study method. To be specific, Figure 5 reveals the parallel trend testing for the BCPP on energy usage. The outcomes declare that the values for the BCPP all remain not significant in the six periods before the policy, indicating stable energy usage trends in areas for pilots and non-pilots and supporting the parallel trend hypothesis. Additionally, the values for the BCPP that remain notably negative emerged from the 3rd year after the policy, exhibiting its effectiveness in lowering urban energy usage. In other words, it reveals that the BCPP may not produce positive effects in the short term, its long-term effect is notable, further confirming the necessity for digital infrastructure construction.
Second, from the perspective of placebo testing, the results exclude the interference of non-random factors, proving the reliability of the baseline regression results. To be more precise, the benchmark regression results show that the BCPP significantly has lowered urban energy usage and passed the parallel trend test. Although fixed effects and corresponding control variables have been selected in Model (1), there may still be some other unobservable exogenous factors unrelated to the BCPP that affect urban energy usage during the sample period. To lessen the possibility for regression errors derived from omitted factors and further demonstrate the reliability of the above outcomes, following Xu and Huang [56], we apply placebo testing by specifying trial teams at random. All things being equal, if pilot areas are randomly designated as the pseudo-trial team, it is expected that the treatment effect of the BCPP will not be tested. In the research sample, there are 105 pilot cities as a whole. In a finer way, the corresponding variety of cities are chosen as the pseudo-treatment team at random for testing; at this instant, other areas are chosen as the pseudo-control team. Even more, to further enhance the testing effect, the above process is repeated 1000 times. In this way, we probe the distribution chart for all coefficients, as depicted by Figure 6. To be specific, it discloses that the absolute values of policy effects are far from the true estimated result (−0.178), and are concentrated on both sides of 0. Meanwhile, the p-values for most regression coefficients are greater than 0.1. The above results reveal that the observed decrease in urban energy usage in this study is indeed due to the economic effects brought by the BCPP rather than some unobservable random factors. The placebo test results validate the robustness for the baseline result.

5.3.2. Policy Uniqueness Test

Considering the fact that other policies may affect urban energy usage, this can easily lead to estimation bias in the evaluation of BCPP effectiveness. Therefore, we further test three other policies that to some extent probably influence urban energy consumption during the sample period, including the Smart City Pilot Program (City_DID) launched by the Chinese government in 2012, the Big Data Pilot Zone Policy (Data_DID) delicately introduced in 2016, the Carbon Emissions Trading Policy (Trade_DID) issued by the Chinese government in 2013, the Green Finance Reform Innovation Pilot Zone Policy (Green_DID) implemented in 2017, and the New Energy Demonstration City Policy (Energy_DID) implemented in 2014. To eliminate the threats from these policies to the benefit of the BCPP, we also add the five policies into Model (1) for testing, as exhibited in Table 3.
Table 3, to be specific, outlines the estimated findings for the BCPP after excluding the threats from other related policies. In particular, Column (1) displays the test outcomes for the BCPP, taking into consideration the Smart City Pilot Program (City_DID) correlated with energy usage. The significantly negative estimation result for the BCPP (Broad) suggests that the benchmark findings hold strong. Column (2) illustrates the outcomes of the BCPP in light of the Big Data Pilot Zone Policy (Data_DID). More importantly, from the outcomes, even when the influence of these policies is discounted, the BCPP retains its effectiveness in lowering energy consumption. Column (3) details the BCPP results under the Carbon Emissions Trading Pilot Policy (Carbon_DID), revealing that its capacity to curb energy usage remains unchanged once this policy’s impacts are excluded. Column (4) shows the results of the Green Finance Reform Innovation Pilot Zone Policy (Green_DID), and the BCPP still has a negative effect on energy consumption. Column (5) shows the results after considering the New Energy Demonstration City Policy (Energy_DID) in the empirical model, and the BCPP still significantly reduces energy consumption. Additionally, Column (6) introduces dummy variables for the previously mentioned five policies, confirming that the initial regression outcomes remain consistent.

5.3.3. Other Robustness Tests

As of yet, we have deliberated that the BCPP to some extent greatly lowered urban energy consumption. To further confirm the reliability for the estimation outcomes mentioned above, with the findings presented in Table 4 and Table 5, this study conducts robustness tests from the following six directions.
First, this study conducts PSM-DID testing. The correlation between the explanatory variable and the residual term creates endogeneity problems due to selective bias in the regression analysis. This bias stems from the fact that the non-random assignment for experimental teams and control teams, coupled with their possession of disparate characteristics. To tackle samples choice differences, we use the propensity score matching technique (PSM) to align control teams with trial teams, ensuring that their characteristics are comparable. The findings are exhibited in Columns (1)–(3), which are derived using three techniques such as nearest neighbor identifying, kernel identifying, and radius identifying. The outcomes indicate that the estimated findings of the BCPP is notably negative, being the same as baseline estimation outcomes.
Second, this study replaces the explained variable for testing. We employ the energy consumption-to-GDP ratio to recalibrate the city’s energy usage metrics. The data are logarithmized before the regression analysis to lessen latent estimation errors in using per capita energy usage as an evaluation. The findings are outlined in Column (4). To be more precise, despite the differing scope for the explained variable, the robustness of the conclusion is maintained, as indicated by the policy dummy variable’s still notably negative coefficient.
Third, this study excludes the municipalities. To a greater extent, municipalities have more autonomy and higher administrative levels than other cities, which could influence the findings. Therefore, this study removes municipalities from the 279 cities and then performs a regression to investigate whether the research findings alter as a result of city changes. The findings are displayed in Column (5). To be more specific, the BCPP is −0.178 at the 1% level, proving that renovation in gauging mode for the dependent variable does not alter the benchmark findings. The conclusion is solid, and the negative estimated value for the BCPP exists as before.
Fourth, this study lags the control variables. The control variables in this study might be influenced by lurking variables, potentially affecting the results. To check if our model is robust, we ran a robustness test by adjusting the lag order of the control variables. Specifically, we lagged all control variables by one period and reran the regression. In Column (6), the BCPP still significantly puts the brakes on urban energy consumption, suggesting that our findings are pretty solid.
Fifth, this study shortens the data period for test. The effectiveness of a policy after implementation may be influenced by various complex factors in the current year. That being the case, there may be a time lag from receiving policy information to producing policy effects. To lessen the risk posed by endpoint values on the empirical outcomes, we recalibrate the sample period to span from 2008 to 2019 and conduct a re-estimation. The outcomes, being fully displayed in Column (7), disclose that the negative influence for the BCPP on urban energy use greatly remains, more importantly, reinforcing the reliability for benchmark regression results.
Sixth, the study excludes the expected effects for the BCPP. Generally, market entities will have expected effects on government policy tendencies. In this way, the BCPP, as a key infrastructure construction plan led by the government, requires a certain amount of time from planning to implementation. Therefore, the policy effects estimated earlier may be affected by the expected effects. Thus, we adopt two dummy variables Broad_F1 and Broad_F2 for the year or two before the BCPP and then add them as control variables into Model (1) for estimation. As fully outlined in Column (8), it discloses that in a finer way, the estimated values for these newly generated dummy variables are small and not statistically significant, indicating that the baseline regression results are less affected by expected effects and further verifying the reliability of parallel trend testing.
Finally, this study tests the heterogeneity treatment effects for the BCPP. The heterogeneity treatment effects of two-way fixed effect (TWFE) estimators, as exhibited by the multi-phase DID technique, may lead to notable differences in the impact of identical policy for various teams. Thus, following Goodman-Bacon [59], we use the decomposing technique to divide the experimental samples into three groups, namely treated-earlier individuals with treated-later individuals as the control team, treated-later individuals with treated-earlier individuals as the control team, and treated individuals with never-treated individuals as the control team. The possible biases in the TWFE estimator are further decomposed and tested, as shown in Table 5. It reveals that the estimated outcome from the treatment team coupled with the control team exhibits the greatest impact on the TWFE estimation results, with a weight of 0.9410. The second type of estimator that may cause bias is positive, but its weight only accounts for 0.0254%, and its impact is relatively small. Therefore, it indicates that there is a certain degree of heterogeneity in the treatment effect between groups, but it will not cause serious bias in the estimation results, and the baseline regression outcomes are reliable.

5.4. Heterogeneity Test

From the earlier analysis, the BCPP exhibits significant energy reduction benefits. Given distinct differences in the energy reduction, with the estimation results presented in Table 6, this paper performs the heterogeneity test on the effect of the BCPP scheme.
First, in terms of population size, demographic factors can affect technological progress, causing notable variations in energy consumption structure. Therefore, complying with Lee et al. [60], this study splits the entire dataset into two teams given whether the permanent population of urban areas exceeded 1 million in 2014, namely, 178 large areas (Large) and 101 other small- and medium-sized areas (Others), and a regression was conducted analysis on each team. As stated in Columns (1) and (2), the associated outcomes certainly exhibit the effects of the BCPP for different population size cities. By way of illustration, Column (1) discloses the outcomes for metropolises; at the same time, Column (2) outlines the outcomes for smaller urban areas. Compared to small- and medium-sized areas, we conclude that the BCPP scheme greatly lowers energy usage in large areas. The possible explanation is that densely populated cities tend to attract a concentration of scientific and technological talent, leading to robust capabilities in energy-saving technological innovation. Meanwhile, population agglomeration reduces the cost of energy infrastructure, promotes the efficient use of energy, and thus forms a comparative advantage in scale. Consequently, the benefits of the BCPP in lowering energy usage are particularly noticeable in populated urban areas.
Second, in terms of geographical location, the impact for the BCPP on energy consumption appears to vary between east China and west China, influenced by differences in urban development, innovation capabilities, and energy resources. Thus, referring to Xu and Huang [56], this study involves reevaluating the regression analysis by categorizing the sample cities into two groups: eastern areas split by the Hu Huanyong Line (Hu_Line East) coupled with western areas (Hu_Line West). To be specific, as displayed in Columns (3) and (4), the findings show that the BCPP, at the 1% level, greatly lowers energy usage in the eastern cities. Nevertheless, the BCPP’s effects in the western region are not significant. The possible reason is that due to rapid economic growth and high population density in eastern cities, coupled with abundant human capital, the BCPP has always been in a leading position for promoting energy-saving technology research. That being the case, the energy-saving effects for the BCPP scheme are relatively ideal.
Third, in terms of resource endowment, the energy-saving decisions for firms will be affected regarding natural resource endowment in cities, resulting in noticeable differences in the energy usage of cities due to different levels of resource abundance. Therefore, we divide the whole set into two distinct teams, 168 non-resource-based areas (Non_res) and 111 other areas that are resource-based (Res_based), and re-estimate them separately. In Table 6, with the outcomes stated in Columns (5) and (6), it reveals that the BCPP scheme greatly lowers energy usage in non-resource-based areas, whereas the impacts are not notable in resource-rich areas. The potential explanation is declared that non-resource-based areas flourish in a sound industrial structure and a favorable innovation environment, mainly relying on the tertiary industry to develop economies, and it is easier to achieve energy saving under the BCPP. However, in resource-based cities, they are prone to falling into the trap of resource curse and rely more on high-energy consumption industries, making it tougher to attain energy structure transformation.
Fourth, in terms of digital inclusive finance, digital inclusive finance supports the development of green technology innovation by providing low-cost and efficient financing services, thus affecting the energy consumption level of cities. Therefore, we divide the dataset into two groups according to the digital inclusive finance index, high digital inclusive finance group (High_Fin) and low digital inclusive finance group (Low_Fin), and then perform regressions separately. The results in Columns (7) and (8) of Table 6 show that the BCPP significantly reduces the energy consumption of cities with high digital inclusive finance levels while having little effect on the energy consumption of cities with low digital inclusive finance levels. This result may be due to the fact that digital inclusive finance can bring financing dividends to enterprises, alleviate corporate financing difficulties, promote technological innovation, and thus reduce urban energy intensity.

5.5. Mechanism Test

Although the basic regression results, to a greater extent, assert that the BCPP has effectively reduced urban energy consumption and improved energy usage conditions, what is the mechanism by which the BCPP at the city level affects energy usage? Therefore, integrating the theoretical analysis stated above with the study conducted by Huang et al. [61], the research conducts empirical testing from the three channels of industrial upgrading, financial development and green technology innovation, respectively. Specifically, industrial upgrading (Indus) is quantified by the share for the tertiary industry output on a city scale. By the same token, financial development (Finan), which reflects to what extent financial funding affects energy-saving transition, is declared by the ratio of banking loans to GDP on a prefecture scale. Green technology innovation (Green) is quantified by the number of green inventions obtained by the city. The results are displayed in Column (1), Column (4), and Column (7) of Table 7, respectively. To be precise, the BCPP variable is further examined for its impacts on energy usage by dividing it into two sub-samples according to the 70% quartile and above (high group) and the 30% quartile and below (low group) of the three mechanism variables. As stated in Columns (2)–(3), Columns (5)–(6), and Columns (8)–(9) of Table 7, respectively, the results further illustrate the robustness for industrial upgrading, financial development, and green technology innovation.
The regression findings of the mechanisms for the BCPP on urban energy usage are displayed in Table 7. To be specific, from the industrial upgrading effect, as shown in Column (1), the coefficient for the BCPP at the 5% level on industrial upgrading is notably positive. To some extent, it reveals that the BCPP greatly promotes industrial upgrading and helps to reduce energy usage on a prefecture scale. Furthermore, it is based on the results for the BCPP on energy usage grouped with the degree of industrial upgrading, as depicted by Columns (2)–(3). Even more, despite the presence of control variables, from a statistical view, the outcome for the BCPP on urban energy usage remains greatly negative in the high-industrial-structure-level group (Broad_high) but is not significant in the low group (Broad_low). To the best of our knowledge, it reveals that as the economy advances towards service-oriented, the industrial structure becomes more advanced, and the BCPP makes it easier to lessen energy usage, thus verifying Hypothesis 2 (H2). Subsequently, from financial development effects, as depicted by Column (4), the coefficient for the BCPP on financial development at the 1% level remains notably positive, indicating that the BCPP greatly promotes urban financial development, which is conducive to alleviate the financing constraints faced by enterprises in the process of energy-saving technology research, ultimately lowering energy usage. Even more, from the regression results of the BCPP on energy usage after dividing high and low groups based on the 70% along with 30% quantiles of the financial development level, as stated in Columns (5)–(6), regardless of whether control variables are included, from a statistical view, the value for the BCPP on energy usage remains greatly negative in the high group of financial development, with the exception of being insignificant in the low group. In other words, with the boost for financial development, the BCPP can notably lessen urban energy usage, thus verifying Hypothesis 3 (H3). From the perspective of the green technology innovation effect, as shown in Column (7), at the 1% level, the coefficient of the BCPP on green technology innovation is significantly positive, indicating that the BCPP significantly promotes urban green technology innovation. Further, cities are divided into two groups according to the level of green technology innovation, and their impact on energy consumption is analyzed. The results are shown in Columns (8)–(9). When adding or not adding control variables, the results of the high green technology innovation group are significantly negative, while the results of the low green technology innovation group are not significant, thus verifying Hypothesis 4 (H4). In addition, the Wald statistics in each model reject the linear constraint null hypothesis of the BCPP parameters, indicating that the model settings grouped by the mechanism variables are reasonable.

6. Conclusions and Policy Recommendations

Laying the groundwork for cutting-edge digital networks is pivotal to the prosperity of the Chinese economy. It is deeply entwined with our urban landscapes and business sectors, acting as a linchpin for China’s modernization and the birth of new opportunities. While it may not yet be backed by hard empirical evidence, the establishment of these digital networks has dramatically propelled our nation’s robust economic expansion and introduced innovative ideas for fostering a green and sustainable society. Consequently, using panel data spanning 2006 to 2021 from 279 Chinese cities, this study delves into the impacts for the BCPP on energy use by applying the multi-phase DID technique. To be more precise, the findings reveal that the BCPP has the potential to substantially lower urban energy consumption, which remains reliable even when subjected to robustness checks such as the placebo test, adjusting sample intervals, swapping out explanatory variables, and excluding certain municipalities. The heterogeneity test demonstrates that the BCPP exerts a more pronounced effect in lowering energy consumption for major cities, the eastern areas, and non-energy-intensive cities. Even more, the mechanism testing exhibits that the BCPP can decrease urban energy consumption by spurring financial growth and the transformation of industrial structures. Therefore, we declare the following suggestions.
First, we need to enhance energy efficiency across the board, promote integrated urban planning and development, and solidify our overarching strategic blueprint. We must fully leverage transformative digital tools like big data and cloud computing to kickstart the growth of green tech innovation and establish a robust, city-wide digital information network. Let us ensure that funding flows to green science and tech companies where it can truly make an impact. At the same time, we should implement incentives and strengthen efforts to conserve energy and protect the environment; this entails refining energy consumption through market-based approaches and fast-tracking the development of a new energy system primarily powered by renewable sources. We also need to spare no effort with targeted financial incentives and tax breaks. Furthermore, we should actively advocate for upgrades in traditional industries, guiding manufacturing, services, and agriculture towards higher-value activities; minimizing waste; streamlining production with lean principles; and intricately integrating digital and smart technologies. Above all, we must promote a simpler, greener, low-carbon lifestyle, raising public awareness through various channels—like media campaigns and school programs—to engage everyone in energy conservation and emission reduction.
Second, we need to double down on the demonstrative and leadership roles of the pilot cities within the BCPP initiative, making sure the pilot policies are fully implemented. Building regional big data hubs is crucial for boosting efficient data transmission and exchange. This involves not just pumping more money into supporting infrastructure but also fine-tuning the layout and integrating network resources. Let us set up a data exchange framework to promote open access and data integration while also fostering strong collaboration between businesses and academia. To really underpin information construction, we have to develop a comprehensive and trustworthy urban spatial database system that can handle diverse data from multiple sources and scales. When it comes to digital tech, we need to ramp up research and innovation as well as push for its broader application and demonstration. Think tax breaks and subsidies for universities and research institutions—that is how we build a thriving R&D ecosystem. Crucially, we must prioritize cultivating digital tech skills by revamping the curriculum for IT majors and creating more hands-on training. This ensures a steady stream of talent to fuel the BCPP. On top of that, let us accelerate the digital transformation of industrial enterprises, encouraging the seamless integration of cutting-edge technologies like 5G and AI into manufacturing. This will dramatically boost the manufacturing sector’s digital capabilities, network integration, and overall smart development.
Third, to really make progress, development plans need to be customized to each city’s specific situation. For instance, major cities, those in the east, and places with already strong digital finance should double down on their digital infrastructure. Think wider network coverage, better service, and smoother information flow—all to really fuel the green economy. Now, for cities not sitting on natural resources, the focus should be on building a brand-new digital economy, fostering innovation in tech and efficient industries, and weaning themselves off old-school energy sources. Small- to medium-sized cities, resource-dependent areas, and those in the central and western regions—especially those lagging in digital finance—need to play catch-up. That means boosting policy support and quickly upgrading their digital game. They could create special funds, start technology transfer projects, and invest in training the right talent to move them in the direction they need. Ultimately, we need to play to each region’s strengths and avoid a one-size-fits-all approach. Let us dig into what makes each area tick and explore digital transformations that actually make sense for them.
Finally, in order to reduce urban energy consumption, it is imperative to fully utilize the potential of improving and optimizing the urban industrial structure, expanding financial growth, and advancing green technological innovation. In particular, we should concentrate on increasing production efficiency and energy utilization efficiency, drastically reduce the share of high-energy-consuming and low-efficiency industries, rely on digital technology to propel the transformation of traditional industries into intelligent and high-end, and further increase policy support for high-tech and green technology industries. Simultaneously, we should expedite the financial sector’s overall digital transformation, actively promote green finance, leverage financial technology to maximize the effectiveness of capital allocation, and guarantee that energy-saving and carbon-reduction initiatives can secure adequate and affordable funding. In order to lead the ongoing reduction in energy consumption levels through technical iteration and upgrading, the government should also implement a number of incentives to encourage businesses to embrace cutting-edge digital technologies to innovate manufacturing processes and management models. Based on this, a robust assessment and feedback system ought to be put in place to continuously track the real effects of financial development and industrial structure modernization on energy usage and guarantee that the BCPP contributes the most to lowering urban energy usage.
Even though the study delved into the nexus between urban energy use and the BCPP and concluded that it can significantly lower urban energy consumption, there are still a couple of caveats to consider. First, the study focus on city-level data is not as pin-pointed as it should be. It should ideally delve into more granular details, like county, corporate, or household data. Second, the spatial spillovers of urban energy consumption have not been fully accounted for. Then, we plan to use a spatial DID technique combined with a time-varying geographic weight matrix to exert an inquiry into how the BCPP affects urban energy consumption in the future.

Author Contributions

Conceptualization, X.X.; methodology, X.X. and Q.M.; formal analysis, Q.M. and J.H.; data curation, Q.M.; writing—original draft preparation, Q.M. and J.H.; writing—review and editing, X.X.; funding acquisition, X.X. All authors have read and agreed to the published version of the manuscript.

Funding

The National Social Science Foundation of China (No. 19BRK036) and the Humanities and Social Science Youth Foundation of the Ministry of Education in China (No. 18YJC840047).

Institutional Review Board Statement

Not applicable.

Informed Consent Statement

Not applicable.

Data Availability Statement

The datasets and computer programs used in this study are available from the corresponding author upon reasonable requests.

Acknowledgments

We are sincerely grateful to editors and anonymous reviewers for their insightful suggestions. They made some pertinent comments on the previous version of this study and also gave us some suggestions and hints. We would also like to thank Yanqing Zhu, Cui Yuan, Tieshan Zhao, and Lingyun Huang for their research assistance. Nevertheless, any errors that remain in this paper are solely our responsibility.

Conflicts of Interest

The authors declare no conflicts of interest.

References

  1. Acheampong, A.O. Economic growth, CO2 emissions and energy consumption: What causes what and where? Energy Econ. 2018, 74, 677–692. [Google Scholar] [CrossRef]
  2. Borck, R.; Mulder, P. Energy policies and pollution in two developing country cities: A quantitative model. J. Dev. Econ. 2024, 171, 103348. [Google Scholar] [CrossRef]
  3. Huang, J.; Lai, Y.; Hu, H. The effect of technological factors and structural change on China’s energy intensity: Evidence from dynamic panel models. China Econ. Rev. 2020, 64, 101518. [Google Scholar] [CrossRef]
  4. Jia, C.; He, H.; Zhou, J.; Li, J.; Wei, Z.; Li, K.; Li, M. A novel deep reinforcement learning-based predictive energy management for fuel cell buses integrating speed and passenger prediction. Int. J. Hydrogen Energy 2025, 100, 456–465. [Google Scholar] [CrossRef]
  5. Chen, D.; Chen, S.; Jin, H.; Lu, Y. The impact of energy regulation on energy intensity and energy structure: Firm-level evidence from China. China Econ. Rev. 2020, 59, 101351. [Google Scholar] [CrossRef]
  6. Kilinc-Ata, N.; Proskuryakova, L.N. The contribution of energy policies to green energy transition in the Asia-Pacific region. Renew Energy 2024, 237, 121797. [Google Scholar] [CrossRef]
  7. Qin, B.; Yu, Y.; Ge, L.; Liu, Y.; Zheng, Y.; Liu, Z. The role of digital infrastructure construction on green city transformation: Does government governance matters? Cities 2024, 155, 105462. [Google Scholar] [CrossRef]
  8. Wang, B.; Wang, L.; Gong, B.; Yan, Z.; Hu, P. Does broadband internet infrastructure mitigate firm-level economic policy uncertainty? Evidence from the Broadband China Pilot Policy. Econ. Lett. 2023, 232, 111325. [Google Scholar] [CrossRef]
  9. Tian, Y.; Feng, C. How does internet development drive the sustainable economic growth of China? Evidence from internal-structural perspective of green total-factor productivity. Sci. Total Environ. 2023, 887, 164125. [Google Scholar] [CrossRef]
  10. Abdulqadir, I.A.; Asongu, S.A. The asymmetric effect of internet access on economic growth in sub-Saharan Africa. Econ. Anal. Policy 2022, 73, 44–61. [Google Scholar] [CrossRef]
  11. Luo, Q.; Hu, H.; Feng, D.; He, X. How does broadband infrastructure promote entrepreneurship in China: Evidence from a quasi-natural experiment. Telecommun. Policy 2022, 46, 102440. [Google Scholar] [CrossRef]
  12. Fan, L.; Zhang, Y.; Jin, M.; Ma, Q.; Zhao, J. Does New Digital Infrastructure Promote the Transformation of the Energy Structure? The Perspective of China’s Energy Industry Chain. Energies 2022, 15, 8784. [Google Scholar] [CrossRef]
  13. Zhou, X.; Qing, H.; Hu, Q.; Hu, Z.; Wen, C. The impact of digital infrastructure on industrial ecology: Evidence from broadband China strategy. J. Clean. Prod. 2024, 447, 141589. [Google Scholar] [CrossRef]
  14. Hardi, I.; Afjal, M.; Can, M.; Idroes, G.M.; Noviandy, T.R.; Idroes, R. Shadow economy, energy consumption, and ecological footprint in Indonesia. Sustain. Futures 2024, 8, 100343. [Google Scholar] [CrossRef]
  15. Shahbaz, M.; Mahalik, M.K.; Shah, S.H.; Sato, J.R. Time-varying analysis of CO2 emissions, energy consumption, and economic growth nexus: Statistical experience in next 11 countries. Energy Policy 2016, 98, 33–48. [Google Scholar] [CrossRef]
  16. Hondroyiannis, G.; Papapetrou, E.; Tsalaporta, P. Sustainable energy consumption and finance in the presence of risks: Towards a green economy. Renew. Energy 2024, 237, 121565. [Google Scholar] [CrossRef]
  17. Zhu, B.; Shan, H. Impacts of industrial structures reconstructing on carbon emission and energy consumption: A case of Beijing. J. Clean. Prod. 2020, 245, 118916. [Google Scholar] [CrossRef]
  18. Brodny, J.; Tutak, M. Analysis of the efficiency and structure of energy consumption in the industrial sector in the European Union countries between 1995 and 2019. Sci. Total Environ. 2022, 808, 152052. [Google Scholar] [CrossRef] [PubMed]
  19. Topcu, M.; Payne, J.E. The financial development–energy consumption nexus revisited. Energy Source Part B 2017, 12, 822–830. [Google Scholar] [CrossRef]
  20. Tang, X.; Zhou, X. Impact of green finance on renewable energy development: A spatiotemporal consistency perspective. Renew. Energy 2023, 204, 320–337. [Google Scholar] [CrossRef]
  21. Muhammad, S.; Hoffmann, C. From investment to impact: The role of green finance and technological innovation on German energy transition. Renew. Energy 2024, 237, 121665. [Google Scholar] [CrossRef]
  22. Suraparaju, S.K.; Samykano, M.; Dhivagar, R.; Natarajan, S.K.; Ghazali, M.F. Synergizing environmental and technological advances: Discarded transmission oil and paraffin wax as a phase change material for energy storage in solar distillation as a step towards sustainability. J. Energy Storage 2024, 85, 111046. [Google Scholar] [CrossRef]
  23. Qamaruzzaman, M. Driving energy transition in BRI nations: The role of education, globalization, trade liberalization, and financial deepening—A comprehensive linear and nonlinear approach. Energy Strategy Rev. 2025, 57, 101620. [Google Scholar] [CrossRef]
  24. Voumik, L.C.; Rahman, M.H.; Md, H.; Md, M.; Ridwan, M.; Akter, S.; Raihan, A. Toward a sustainable future: Examining the interconnectedness among Foreign Direct Investment (FDI), urbanization, trade openness, economic growth, and energy usage in Australia. Reg. Sustain. 2023, 4, 405–415. [Google Scholar] [CrossRef]
  25. Baraya, A.-A.S.; Handoyo, R.D.; Ibrahim, H.; Yusuf, A.A. Determinants of households’ energy consumption in Kebbi State Nigeria. Cogent. Econ. Financ. 2023, 11, 2242731. [Google Scholar] [CrossRef]
  26. Guta, D.; Zerriffi, H.; Baumgartner, J.; Jain, A.; Mani, S.; Jack, D.; Cater, E.; Shen, G.; Orgill-Meyer, J.; Rosenthal, J.; et al. The impact of LPG consumption on cooking energy efficiency: Evidence from rural Indian household panel data. World Dev. Perspect. 2024, 36, 100627. [Google Scholar] [CrossRef]
  27. Liu, K.; Liu, X.; Long, H.; Wang, D.; Zhang, G. Spatial agglomeration and energy efficiency: Evidence from China’s manufacturing enterprises. J. Clean. Prod. 2022, 380, 135109. [Google Scholar] [CrossRef]
  28. Tabata, T.; Tsai, P. Fuel poverty in Summer: An empirical analysis using microdata for Japan. Sci. Total Environ. 2020, 703, 135038. [Google Scholar] [CrossRef] [PubMed]
  29. Zhang, X. Broadband and economic growth in China: An empirical study during the COVID-19 pandemic period. Telemat. Inform. 2021, 58, 101533. [Google Scholar] [CrossRef]
  30. Zhang, L.; Tao, Y.; Nie, C. Does broadband infrastructure boost firm productivity? Evidence from a quasi-natural experiment in China. Financ. Res. Lett. 2022, 48, 102886. [Google Scholar] [CrossRef]
  31. Liang, D.; Liu, Y.; Zhou, M.; Zhao, L.; Li, X. Does digital infrastructure exacerbate income inequality? Evidence from the Broadband China Strategy. Struct. Change Econ. Dyn. 2024, 72, 360–373. [Google Scholar] [CrossRef]
  32. Qiu, L.; Zhong, S.; Sun, B. Blessing or curse? The effect of broadband Internet on China’s inter-city income inequality. Econ. Anal. Policy 2021, 72, 626–650. [Google Scholar] [CrossRef]
  33. Yang, M.; Zheng, S.; Zhou, L. Broadband internet and enterprise innovation. China Econ. Rev. 2022, 74, 101802. [Google Scholar] [CrossRef]
  34. Qu, L.; Shao, Y.; Liu, P. Research on the Impact of Digital Economy on Environmental Pollution Management—A Quasi-Natural Experiment from the “Broadband China” Pilot Policy. Pol. J. Environ. Stud. 2024, 33, 4311–4323. [Google Scholar] [CrossRef]
  35. He, W.; Wang, X.; Miao, M. Network infrastructure and corporate environmental performance: Empirical evidence from “Broadband China”. Energy Econ. 2024, 131, 107393. [Google Scholar] [CrossRef]
  36. Xu, Q.; Li, X.; Dong, Y.; Guo, F. How digital infrastructure development affects residents’ health: A quasi-natural experiment based on the “Broadband China” strategy. Cities 2025, 157, 105611. [Google Scholar] [CrossRef]
  37. Jin, X.; Ma, B.; Zhang, H. Impact of fast internet access on employment: Evidence from a broadband expansion in China. China Econ. Rev. 2023, 81, 102038. [Google Scholar] [CrossRef]
  38. Zheng, S.; Duan, Y.; Ward, M.R. The effect of broadband internet on divorce in China. Technol. Forecast. Soc. Chang. 2019, 139, 99–114. [Google Scholar] [CrossRef]
  39. Xue, Q.; Wang, H.; Wei, J. Internet technology and regional financial fraud: Evidence from Broadband expansion in China. J. Appl. Econ. 2023, 26, 2281167. [Google Scholar] [CrossRef]
  40. Cengiz, D.; Dube, A.; Lindner, A.; Zipperer, B. The Effect of Minimum Wages on Low-Wage Jobs*. Q. J. Econ. 2019, 134, 1405–1454. [Google Scholar] [CrossRef]
  41. Wang, Y.; Hou, L.; Hu, L.; Cai, W.; Xiao, D.; Chen, J.; Wang, C. Do areas with a higher proportion of single-person households save more on electricity consumption? Evidence from the difference-in-differences model. Energy Sustain. Dev. 2023, 77, 101350. [Google Scholar] [CrossRef]
  42. Shtele, E.; Beria, P.; Tolentino, S. The evaluation of competition effect on rail fares using the difference-in-difference method through symmetric and lagged spans. J. Rail Transp. Plan. Manag. 2024, 32, 100484. [Google Scholar] [CrossRef]
  43. Xu, Y.; Wei, Y.; Zeng, X.; Yu, H.; Chen, H. Big data development and labor income share: Evidence from China’s national big data comprehensive pilot zones. Econ. Anal. Policy 2024, 84, 1415–1437. [Google Scholar] [CrossRef]
  44. Dunbar, K.; Treku, D.; Sarnie, R.; Hoover, J. What does ESG risk premia tell us about mutual fund sustainability levels: A difference-in-differences analysis. Financ. Res. Lett. 2023, 57, 104262. [Google Scholar] [CrossRef]
  45. Guo, Q.; Zeng, D.; Lee, C.-C. Impact of smart city pilot on energy and environmental performance: China-based empirical evidence. Sustain. Cities Soc. 2023, 97, 104731. [Google Scholar] [CrossRef]
  46. Guo, B.; Yu, F.; Ji, L.; Wang, X. New energy demonstration city and urban pollutant emissions: An analysis based on a spatial difference-in-differences model. Int. Rev. Econ. Financ. 2024, 91, 287–298. [Google Scholar] [CrossRef]
  47. Zhang, H.; Tan, X.; Liu, Y.; He, C. Exploring the effect of emission trading system on marginal abatement cost-based on the frontier synthetic difference-in-differences model. J. Environ. Manag. 2023, 347, 119155. [Google Scholar] [CrossRef] [PubMed]
  48. Pan, X.; Wang, M.; Pu, C. Effect of marine ecological compensation policy on coastal water pollution: Evidence from China based on a multiple period difference-in-differences approach. Sci. Total Environ. 2024, 923, 171469. [Google Scholar] [CrossRef] [PubMed]
  49. Park, J.-S.; Lee, T.-H.; Park, I.-S. Net Effect of Short-Term Smoking Cessation on Mental Health Changes: Inverse Probability of Treatment Weighting and Difference-in-Differences Method. Int. J. Ment. Health Promot. 2024, 26, 745–755. [Google Scholar] [CrossRef]
  50. Zhao, J.; Zheng, J. Effective policy research of county and township health sector integration in China: Empirical evidence from the difference-in-differences model. Soc. Sci. Med. 2024, 348, 116797. [Google Scholar] [CrossRef]
  51. Braghieri, L.; Levy, R.; Makarin, A. Social Media and Mental Health. Am. Econ. Rev. 2022, 112, 3660–3693. [Google Scholar] [CrossRef]
  52. Wu, B.; Wang, Z.; Tian, Y.; Zheng, S. The impact of industrial transformation and upgrading on fossil energy elasticity in China. J. Clean. Prod. 2024, 434, 140287. [Google Scholar] [CrossRef]
  53. Feng, X.; Zhou, Q.; Lu, D.; Gu, J. Does increasing income have a positive impact on energy consumption? New evidence from China. Sustain. Futures 2024, 7, 100139. [Google Scholar] [CrossRef]
  54. Gallegos, J.; Borunda, M.; Garduno, R.; García-Beltrán, C.D. Spatial Intelligent Estimation of Energy Consumption. Lect. Notes Comput. 2024, 15247, 43–56. [Google Scholar] [CrossRef]
  55. Qi, Y.; Zhang, C.; Bai, T.; Xu, D. The impact of industry-favoring land allocation strategy on urban carbon emissions: A city-level empirical study in China. Environ. Dev. Sustain. 2024. [Google Scholar] [CrossRef]
  56. Xu, X.; Huang, L. How Does Environmental Protection Tax Affect Urban Energy Consumption in China? New Insights from the Intensity Difference-in-Differences Model. Sustainability 2024, 16, 4141. [Google Scholar] [CrossRef]
  57. Duan, H.; Sun, X. Research on Technology Spillover of Digital Economy Affecting Energy Consumption Intensity in Beijing–Tianjin–Hebei Region. Sustainability 2024, 16, 4562. [Google Scholar] [CrossRef]
  58. Beck, T.; Levine, R.; Levkov, A. Big Bad Banks? The Winners and Losers from Bank Deregulation in the United States. J. Financ. 2012, 65, 1637–1667. [Google Scholar] [CrossRef]
  59. Goodman-Bacon, A. Difference-in-Differences with Variation in Treatment Timing. J. Econom. 2021, 225, 254–277. [Google Scholar] [CrossRef]
  60. Lee, C.C.; Feng, Y.; Peng, D.Y. A green path towards sustainable development: The impact of low-carbon city pilot on energy transition. Energy Econ. 2022, 115, 106343. [Google Scholar] [CrossRef]
  61. Huang, J.B.; Wang, Y.J.; Luan, B.J.; Zou, H.; Wang, J. The energy intensity reduction effect of developing digital economy: Theory and empirical evidence from China. Energy Econ. 2023, 128, 107193. [Google Scholar] [CrossRef]
Figure 1. Geographical distribution for BCPP.
Energies 18 01072 g001
Figure 2. Theoretical analysis framework diagram.
Energies 18 01072 g002
Figure 3. The spatial distribution for Chinese urban energy consumption during the period of 2006–2021.
Energies 18 01072 g003aEnergies 18 01072 g003b
Figure 4. The temporal evolution trend for Chinese urban energy usage during the period of 2006–2021.
Energies 18 01072 g004
Figure 5. Parallel trend testing.
Energies 18 01072 g005
Figure 6. Placebo testing.
Energies 18 01072 g006
Table 1. Descriptive statistics.
VariableDefinitionSample SizeMeanStd. Dev.MinMax
UECUrban energy consumption44647.8841.2244.03812.141
BroadBroadband China Pilot Policy44640.1650.37201
GDPEconomic development level446410.4960.7098.15013.056
ExpTotal consumption expense44641.6300.8310.0014.822
PopUrban registered population44645.8920.6832.8688.136
UrbanUrbanization rate44640.4180.1070.1090.693
GovGovernment fiscal support44640.1810.0940.0431.485
Table 2. Benchmark regression results.
Variable(1)(2)(3)(4)(5)
Broad−0.254 ***−0.201 ***−0.187 ***−0.178 ***−0.178 ***
(0.023)(0.023)(0.022)(0.023)(0.054)
GDP 0.680 ***0.565 ***0.589 ***0.589 ***
(0.037)(0.038)(0.039)(0.081)
Exp −0.171 ***−0.75 *−0.040−0.040
(0.037)(0.039)(0.040)(0.075)
Pop −0.654 ***−0.626 ***−0.626 ***
(0.100)(0.101)(0.201)
Urban 1.542 ***1.532 ***1.532 ***
(0.167)(0.167)(0.299)
Gov 0.488 ***0.488
(0.151)(0.302)
_Cons7.081 ***0.750 ***5.042 ***4.552 ***4.552 ***
(0.023)(0.345)(0.720)(0.735)(1.466)
Year FEYesYesYesYesYes
City FEYesYesYesYesYes
N44644464446444644464
R20.7290.7500.7580.7580.758
Note: * and *** indicate significance at the 10% and 1% levels, respectively. The values in brackets are statistical standard errors.
Table 3. Policy uniqueness testing results.
Variable(1)(2)(3)(4)(5)(6)
Broad−0.173 ***−0.178 ***−0.176 ***−0.180 ***−0.171 ***−0.164 ***
(0.023)(0.023)(0.023)(0.054)(0.054)(0.054)
City_DID−0.050 ** −0.047
(0.023) (0.048)
Data_DID 0.003 0.019
(0.025) (0.066)
Trade_DID −0.058 * −0.078
(0.033) (0.063)
Green_DID −0.241 ** −0.259 **
(0.117) (0.111)
Energy_DID −0.118 *−0.120 **
(0.061)(0.061)
_Cons4.535 ***4.548 ***4.413 ***4.452 ***4.365 ***4.031 ***
(0.735)(0.736)(0.739)(1.484)(1.464)(1.455)
Control variableYesYesYesYesYesYes
Year FEYesYesYesYesYesYes
City FEYesYesYesYesYesYes
N446444644464446444644464
R20.7590.7580.7580.7590.7590.761
Note: *, **, and *** indicate significance at the 10%, 5%, and 1% levels, respectively. The values in brackets are statistical standard errors.
Table 4. Robustness test results.
VariablePSM-DIDReplacing the Variable UECExcluding the MunicipalitiesLagging Control VariablesAdjusting the Sample PeriodExcluding the Expected Effect
(1)(2)(3)(4)(5)(6)(7)(8)
Broad−0.167 ***−0.146 ***−0.175 ***−0.024 ***−0.178 ***−0.189 ***−0.140 ***−0.058 **
(0.023)(0.028)(0.023)(0.004)(0.023)(0.023)(0.024)(0.023)
Broad_F1 −0.034
(0.036)
Broad_F2 0.007
(0.032)
_Cons3.448 ***8.362 ***4.120 ***0.6424.509 ***4.622 ***7.575 ***2.229 ***
(0.775)(0.992)(0.756)(0.121)(0.737)(0.776)(0.900)(0.493)
Control variableYesYesYesYesYesYesYesYes
Year FEYesYesYesYesYesYesYesYes
City FEYesYesYesYesYesYesYesYes
N44072949445844644400418533484464
R20.7630.6990.7590.3040.7600.75370.7110.749
Note: ** and *** indicate significance at the 5% and 1% levels, respectively. The values in brackets are statistical standard errors.
Table 5. Bacon decomposition results.
Testing TypeEstimatorWeight
Treated earlier vs. later−0.05960.0335
Treated later vs. earlier0.25000.0254
Treated vs. never treated−0.27420.9410
Table 6. Heterogeneity analysis results.
Population SizeGeographical LocationResource EndowmentDigital Inclusive Finance
(1)(2)(3)(4)(5)(6)(7)(8)
LargeOthersHu_Line EastHu_Line WestNon_ResRes_BasedHigh_FinLow_Fin
Broad−0.151 ***−0.134−0.215 ***−0.776−0.219 ***−0.098−0.206 ***−0.112
(0.057)(0.123)(0.056)(0.270)(0.062)(0.105)(0.066)(0.096)
_Cons7.282 ***0.3594.354 ***1.0308.935 ***0.2358.837 ***−4.721 *
(1.742)(2.943)(1.496)(4.659)(2.115)(2.472)(1.559)(2.536)
Control variableYesYesYesYesYesYesYesYes
Year FEYesYesYesYesYesYesYesYes
City FEYesYesYesYesYesYesYesYes
N2848161641283362688177622242240
R20.7560.7860.7770.6730.7900.7300.7440.786
Note: * and *** indicates significance at the 10% and 1% level. The values in brackets are statistical standard errors.
Table 7. Mechanism test results.
VariableIndustrial UpgradingFinancial DevelopmentGreen Technology Innovation
IndusUECUECFinanUECUECGreenUECUEC
(1)(2)(3)(4)(5)(6)(7)(8)(9)
Broad0.026 ** 0.139 *** 0.168 ***
(0.013) (0.012) (0.021)
Broad_high −0.222 ***−0.136 *** −0.250 ***−0.149 *** −0.351 ***−0.245 ***
(0.029)(0.028) (0.027)(0.027) (0.027)(0.026)
Broad_low −0.059−0.009 0.079−0.072 −0.011−0.033
(0.060)(0.057) (0.106)(0.101) (0.073)(0.070)
_Cons6.928 ***7.081 ***4.498 ***−2.875 ***7.081 ***4.417 ***0.093 ***7.081 ***4.564 ***
(0.423)(0.023)(0.739)(0.378)(0.023)(0.738)(0.681)(0.023)(0.734)
Control variableYesNoYesYesNoYesYesNoYes
Year FEYesYesYesYesYesYesYesYesYes
City FEYesYesYesYesYesYesYesYesYes
N446444644464446444644464446444644464
R20.6180.7250.7560.3820.7270.7560.6920.7330.756
Note: ** and *** indicate significance at the 5% and 1% levels, respectively. The values in brackets are statistical standard errors.
Disclaimer/Publisher’s Note: The statements, opinions and data contained in all publications are solely those of the individual author(s) and contributor(s) and not of MDPI and/or the editor(s). MDPI and/or the editor(s) disclaim responsibility for any injury to people or property resulting from any ideas, methods, instructions or products referred to in the content.

