1. Introduction
Digitization techniques encompass a broad field of knowledge, covering various areas. For instance, today, electrical systems are designed using digital techniques to support supervision, control, and protection actions [
1,
2]. Measurement systems have become the gateway to digitization processes in power systems, primarily due to their interface characteristics with generation and load. Several synchronized phasor measurement systems have recently been proposed to change how electrical variables are observed [
3]. Analog instrumentation gave way to digital instrumentation, allowing greater granularity and temporal synchronization of measurements [
3,
4]. In recent years, optical instrumentation and measurement systems have emerged, fully engaged in the digitization movement, to be used in power systems, primarily for supervision, control, and protection [
5]. Power system equipment is commonly designed based on standard static ratings, respecting the generation and demand constraints for steady-state regimes or adverse conditions. To improve the system’s performance and customer service, real-time monitoring and measurement of high-voltage equipment (e.g., cables, insulators, transformers, switchgear) are of interest to prevent unexpected physical failures, reduce outage times, and save on operational costs. Conversely, quantifying and identifying equipment deterioration is a complex task since electric power devices may be subjected to different phenomena, which can be modeled using distinct mapping variable techniques, such as sensing temperature, vibration, mechanical strain, contamination, and corrosion [
6]. According to the technological literature, condition monitoring systems should comprise four main components for developing a real-time transmission line (TL) monitoring system: (1) sensors, (2) data acquisition, (3) fault detection, and (4) event diagnosis [
7]. Towards a condition monitoring system based on optical technology, aiming to support voltage classes equal to or higher than 230 kV, this paper presents a singular measurement infrastructure for real-time monitoring of TL. The monitoring system is called the TECCON Monitoring System (TECCON MS), and it is based on an active polymeric insulator serving as an interface between the optical fiber sensors and the TL, increasing efficiency, reliability, and security. TECCON MS directly measures the electrical current, mechanical strain, conductor temperature, and weather conditions, including wind speed and direction, atmospheric pressure, humidity, precipitation, dew point, and ambient temperature. Fiber Bragg grating (FBG) optical sensors are used for deformation (mechanical strain) and conductor temperature measurements [
8,
9,
10]. Optical instrumentation is gradually supplanting electronic sensors in TL applications, paving the way for a new generation of condition monitoring systems primarily based on optical technologies. The remainder of this manuscript is organized as follows:
Section 2 presents the fundamentals of current, mechanical strain, and conductor temperature sensing by optical fiber sensors;
Section 3 outlines existing TL monitoring systems;
Section 4 briefly presents the proposed TECCON MS;
Section 5 presents the potential results and some discussions regarding the implementation of the TECCON MS on a 230 kV section of the Brazilian grid;
Section 6 outlines future applications and final remarks;
Section 7 clarifies the number of academic outcomes, including patents, generated from the TECCON project.
3. Condition Monitoring of Transmission Lines
There are different ways to monitor power system component conditions. Studies concerning structural health monitoring of overhead TL conventionally address the physical conditions of conductors, insulators, and supporting structures (towers). Many existing devices have been used to monitor conductor internal damage (corrosion and bulges, for instance), sag, strain, temperature, etc. For example, the Overhead Line Corrosion Detector System (CORMON), developed in the United Kingdom, can detect the loss of galvanizing zinc on the steel inner strands of aluminum-conductor steel-reinforced (ACSR) cables [
16]. Other monitoring systems use robots capable of detecting defects within wires, namely, the LineScout Technology, developed by Quebec Hydro [
17], which is applied for conductor de-icing and maintenance. Thermal imaging systems to detect hot spots originating from conductor faults are also widely used in condition monitoring systems [
18,
19].
Insulators, used to withstand the electrical and mechanical forces of TL, play an essential role in these systems. Growth in the usage of composite insulators in high-voltage TL makes the condition monitoring task harder due to the intrinsic characteristics of this kind of insulator and the available methodologies able to detect physical anomalies [
19,
20]. From a long-term perspective, exposure to distinct environmental conditions (dust, fog, rain) and high electrical and mechanical stress may endanger the integrity of polymeric insulators. Flashover and flashunder (full or partial interface breakdown between the housing and the rod) situations are some examples of failures [
19,
20]. Traditional techniques used to prevent insulator conductive defects and, as a consequence, interruption of energy supply are (1) visual inspection, (2) infrared thermography, (3) ultraviolet detection, (4) electric field measurements, and (5) leakage current measurements [
19,
21]. In addition, OFS with either punctual (FBG) or distributed (Brillouin, Rayleigh, Raman) sensors might be used to measure conductor strain induced by icing, temperature, or current loads [
22], as well as to investigate insulator contamination, internal strain, and temperature distribution (an information set useful to determine cracks) [
23]. Therefore, real-time (e.g., in the one-second range) condition monitoring enables a diagnostic tool to estimate the state of the overhead lines in asset management centers (AMC), generally located at substations [
24].
Considering the wide variety of possible system condition monitoring methods, some commercial devices are already used on TL to diagnose the system’s actual state or ampacity level, such as Overhead Transmission Line Monitoring (OTLM) [
25] and Overhead Line Monitoring (OHLM) [
26]. OTLM measures only the conductor’s temperature directly, while OHLM uses sensors over the line to measure the current, temperature, and mechanical tension.
4. TECCON Monitoring System
Bearing the principles previously discussed in mind, several challenges need to be overcome to build a measurement infrastructure for real-time monitoring of TL. For instance, processing optical/analog signals from sensor arrangements, ensuring a continuous and reliable energy supply, and establishing a robust communication system to send the local information (usually on towers) to the substations or control room. These systems should be installed remotely on a specific TL span. Usually, critical spans and the location of the electronic components on the tower must be chosen precisely to avoid mechanical constraints and electromagnetic interferences.
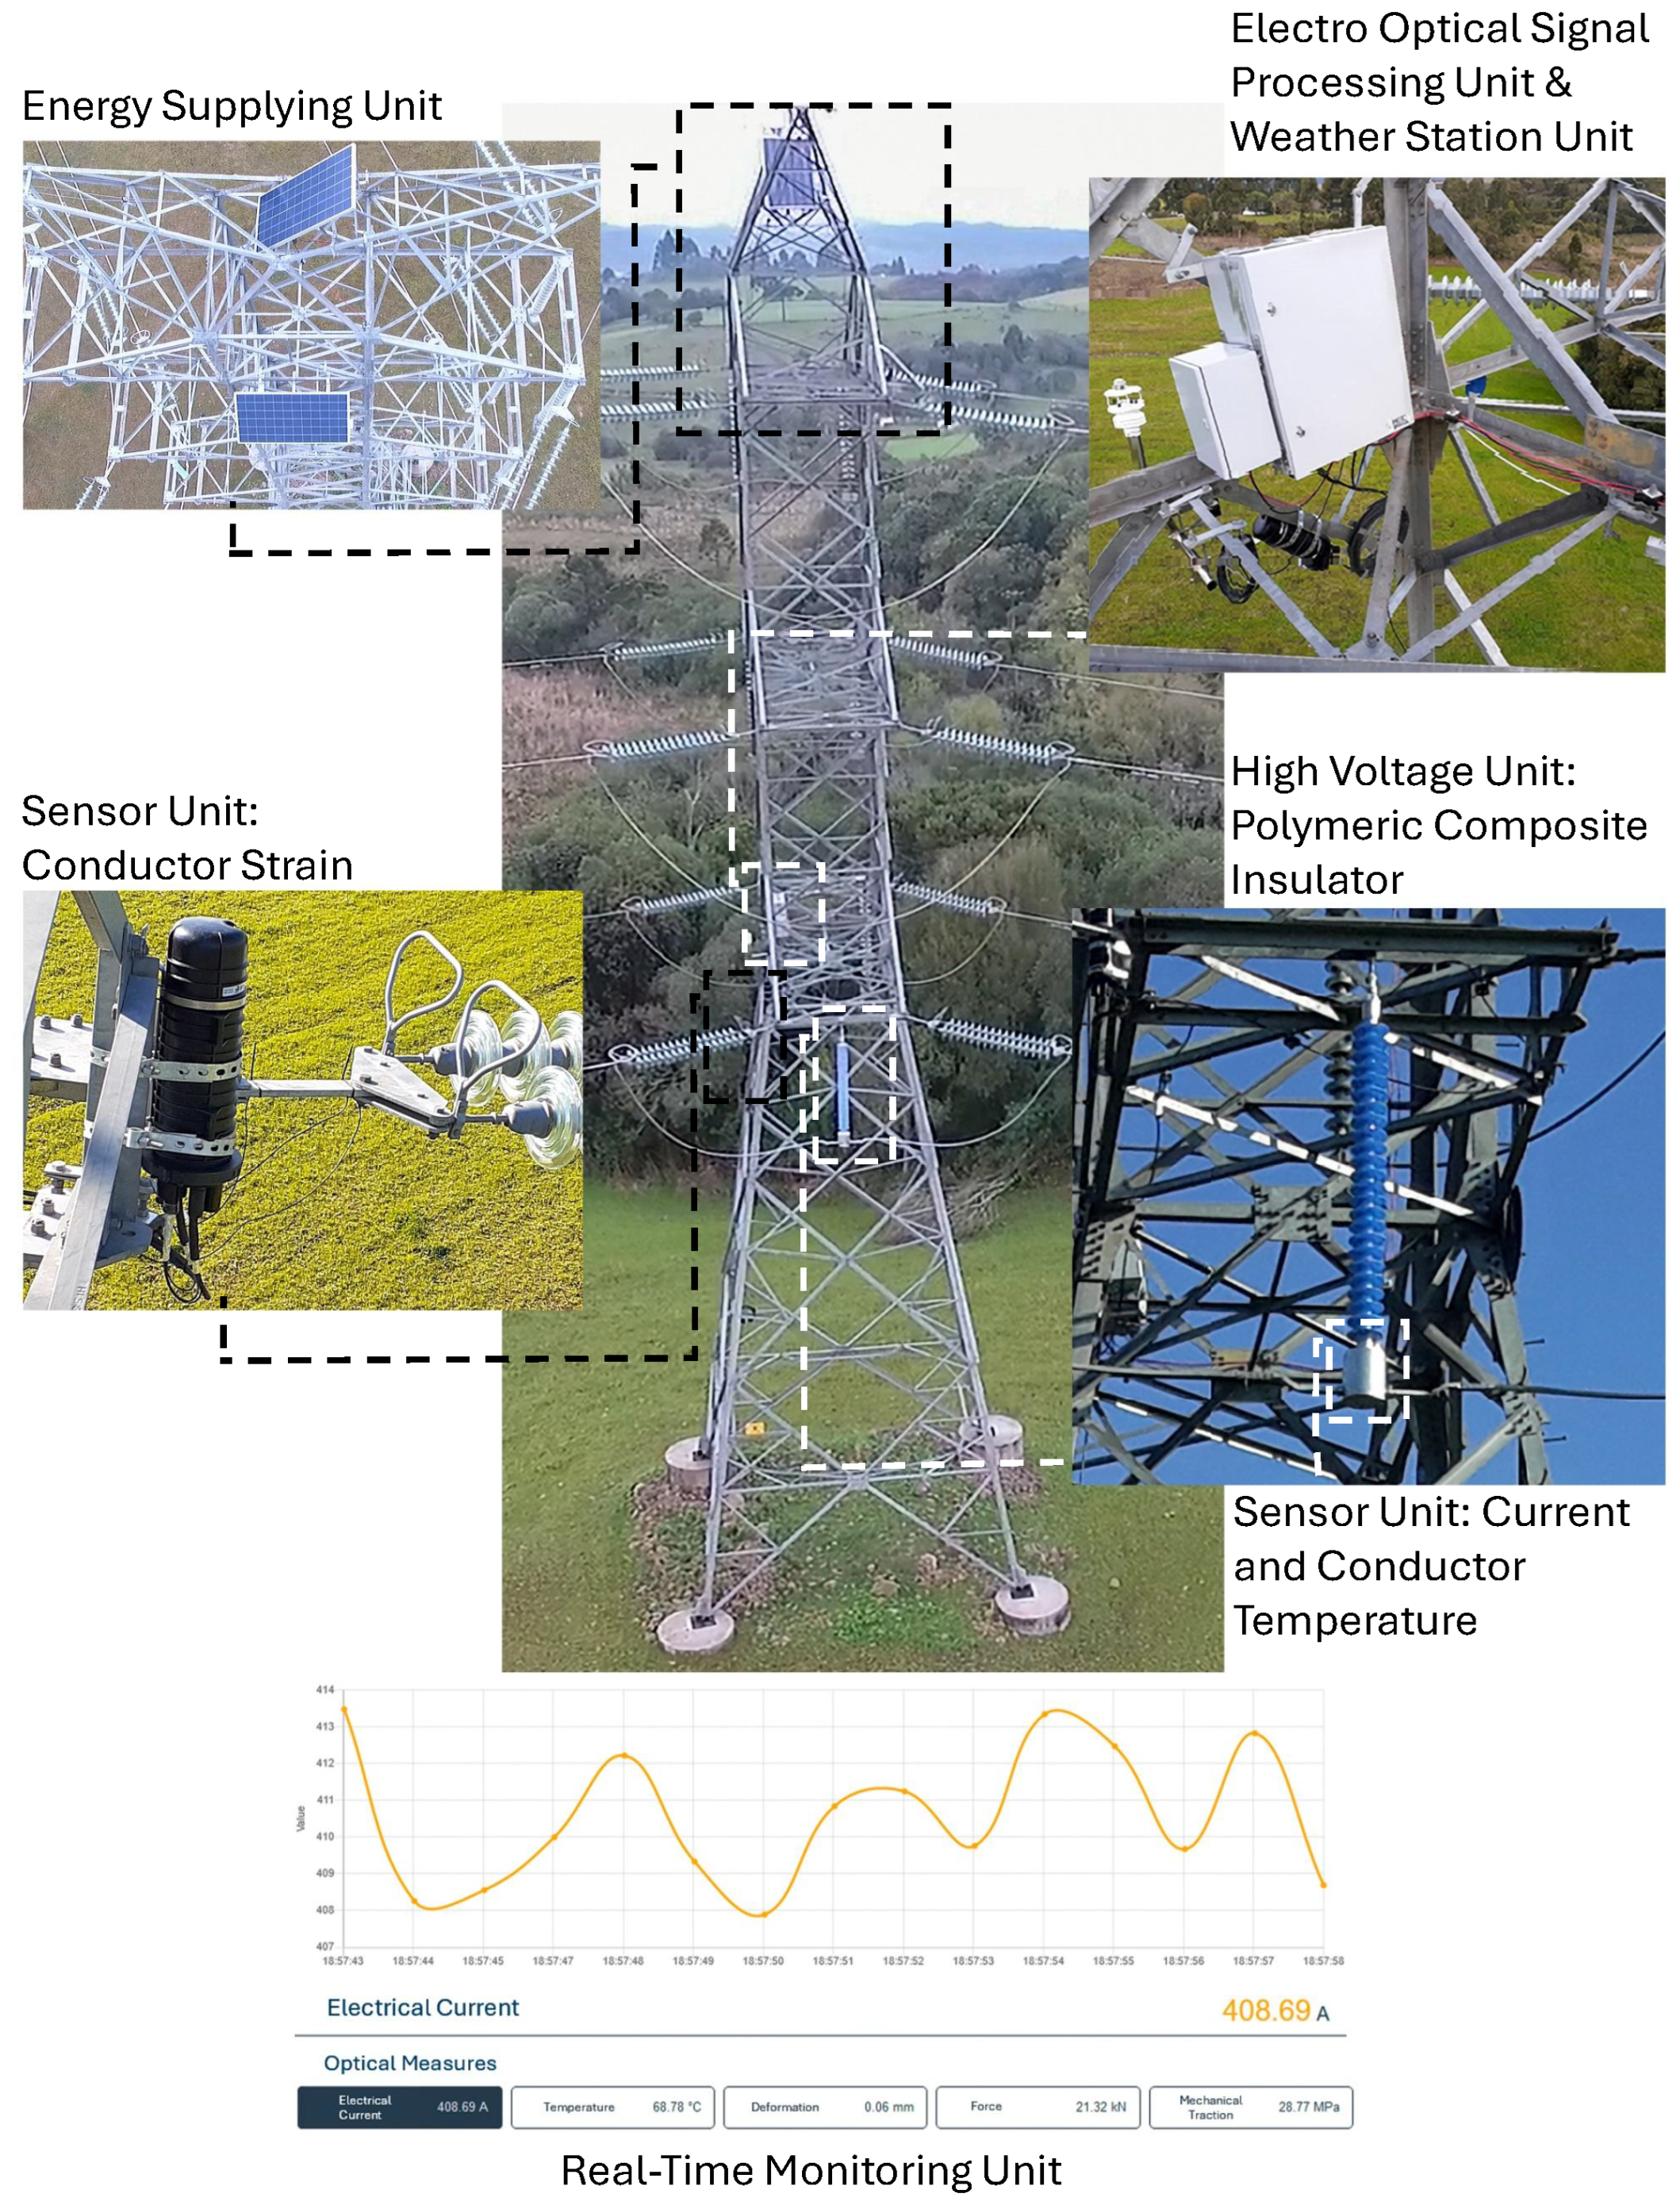
The TECCON MS uses a polymeric insulator that interfaces the OFS and the TL. The OFS are prepared to measure electric current, mechanical strain, and conductor temperature. In the same TL span, a meteorological station unit measures another set of variables, such as wind speed and direction, atmospheric pressure, humidity, precipitation, dew point, and ambient temperature. The entire solution for the TL monitoring application is shown in
Figure 3 and can be split into six units: (1) High-voltage unit; (2) sensing unit; (3) electro-optical signals processing unit (EOSPU); (4) energy-supplying unit; (5) real-time monitoring unit; and (6) weather station unit.
4.1. High-Voltage Unit
The proposed polymeric composite insulator is an active grid component that provides a paradigm shift and gathers information along the TL. The idea was to embed part of the measurement solution in the insulator. Project requirements imply a polymeric insulator, mainly due to the need to embed an optical fiber through the entire length of the insulator core. The conductor current and temperature sensors are placed on a sensor-dedicated housing mounted on the bottom of the insulator [
27]. The insulator, with embedded fiber sensors, is designed to be placed on the auxiliary insulator string (jumper insulator) at an anchorage tower. Consequently, the tower must have a splicing box for fiber optics to receive the optical circuits. The TL needs an optical ground wire (OPGW) to broadcast data to the AMC.
The new insulator responds perfectly to the usual functions of an insulator [
28]. To ensure the safety and reliability of the developed prototype and consequently of the power system in which its installed, several electrical and mechanical tests (and pre-stressing procedures) have been conducted [
5]. Most of these tests are described in Brazilian and European standards [
28]: dielectric strength; steep-front impulse voltage test; DC inclined-plane tracking and erosion test; partial discharge tests; 1000 h salt fog test; impulse voltage tests; flammability test; dimensional check; interface adhesion strength test; tests on interfaces and connections of end fittings; assembled core load-time tests; and galvanizing test.
In addition to the standardized tests, compatibility tests have also been carried out. The purpose of these additional tests was to verify the operation of the entire TECCON MS assembly, allowing the detection of eventual improvement points. Furthermore, in the electrical compatibility tests [
27], current and voltage impulse applications have been performed during the data acquisition process, allowing the consistency of the data acquisition during fast events to be verified, as well as the behavior of the electronic components during these events.
4.2. Sensing Unit
The sensing unit comprises the real-time apparatus for measuring electrical current, conductor strain, and conductor temperature using optical fiber sensor technology. Electrical current and conductor temperature are measured directly at the TL conductor. Conductor strain is measured using an anchorage hardware component, where the deformation is assessed with a weldable FBG sensor. This latter measure allows us to estimate conductor stress–strain behavior and mainly monitor sag during the TL operation phase.
Historically, for most overhead transmission lines, the sag of conductors is measured during the construction phase when the conductors are not energized. Once the transmission line starts the operation phase, conductors may be subject to high temperatures, varying the sag and compromising the minimum electrical clearance. With the TECCON MS, real-time monitoring of sag is possible.
4.3. Electro-Optical Signal Processing Unit
This unit is the brain of the remote monitoring system. It is responsible for obtaining information from the optical sensors and the weather station unit and managing the power supply for both components. The EOSPU is composed of three major parts: (1) analog signal conditioning circuits, (2) digital module, and (3) power supply circuits. All these parts are integrated into a printed circuit board (PCB) developed exclusively for the TECCON MS.
Analog signal conditioning is responsible for obtaining the analog signals from photodetectors, amplifying filters, and converting them to digital samples. Then, the digital module is accountable for pre-processing these samples and controlling all configurable parts of the EOSPU, such as the programmable gains of the amplifiers and the analog-to-digital converters. Furthermore, the digital module communicates with the weather station via the RS-485 communication protocol and obtains local weather data. Finally, the digital module packs all the information (from optical sensors, whether station and configuration data) into Ethernet frames and sends it to an Ethernet-to-fiber media converter, which sends the data via an OPGW link to the control center on the substation.
The EOSPU is housed in a customized enclosure designed to hold multiple mounting plates. It features an International Protection Marking (IP) 67 and a heat dissipation control mechanism.
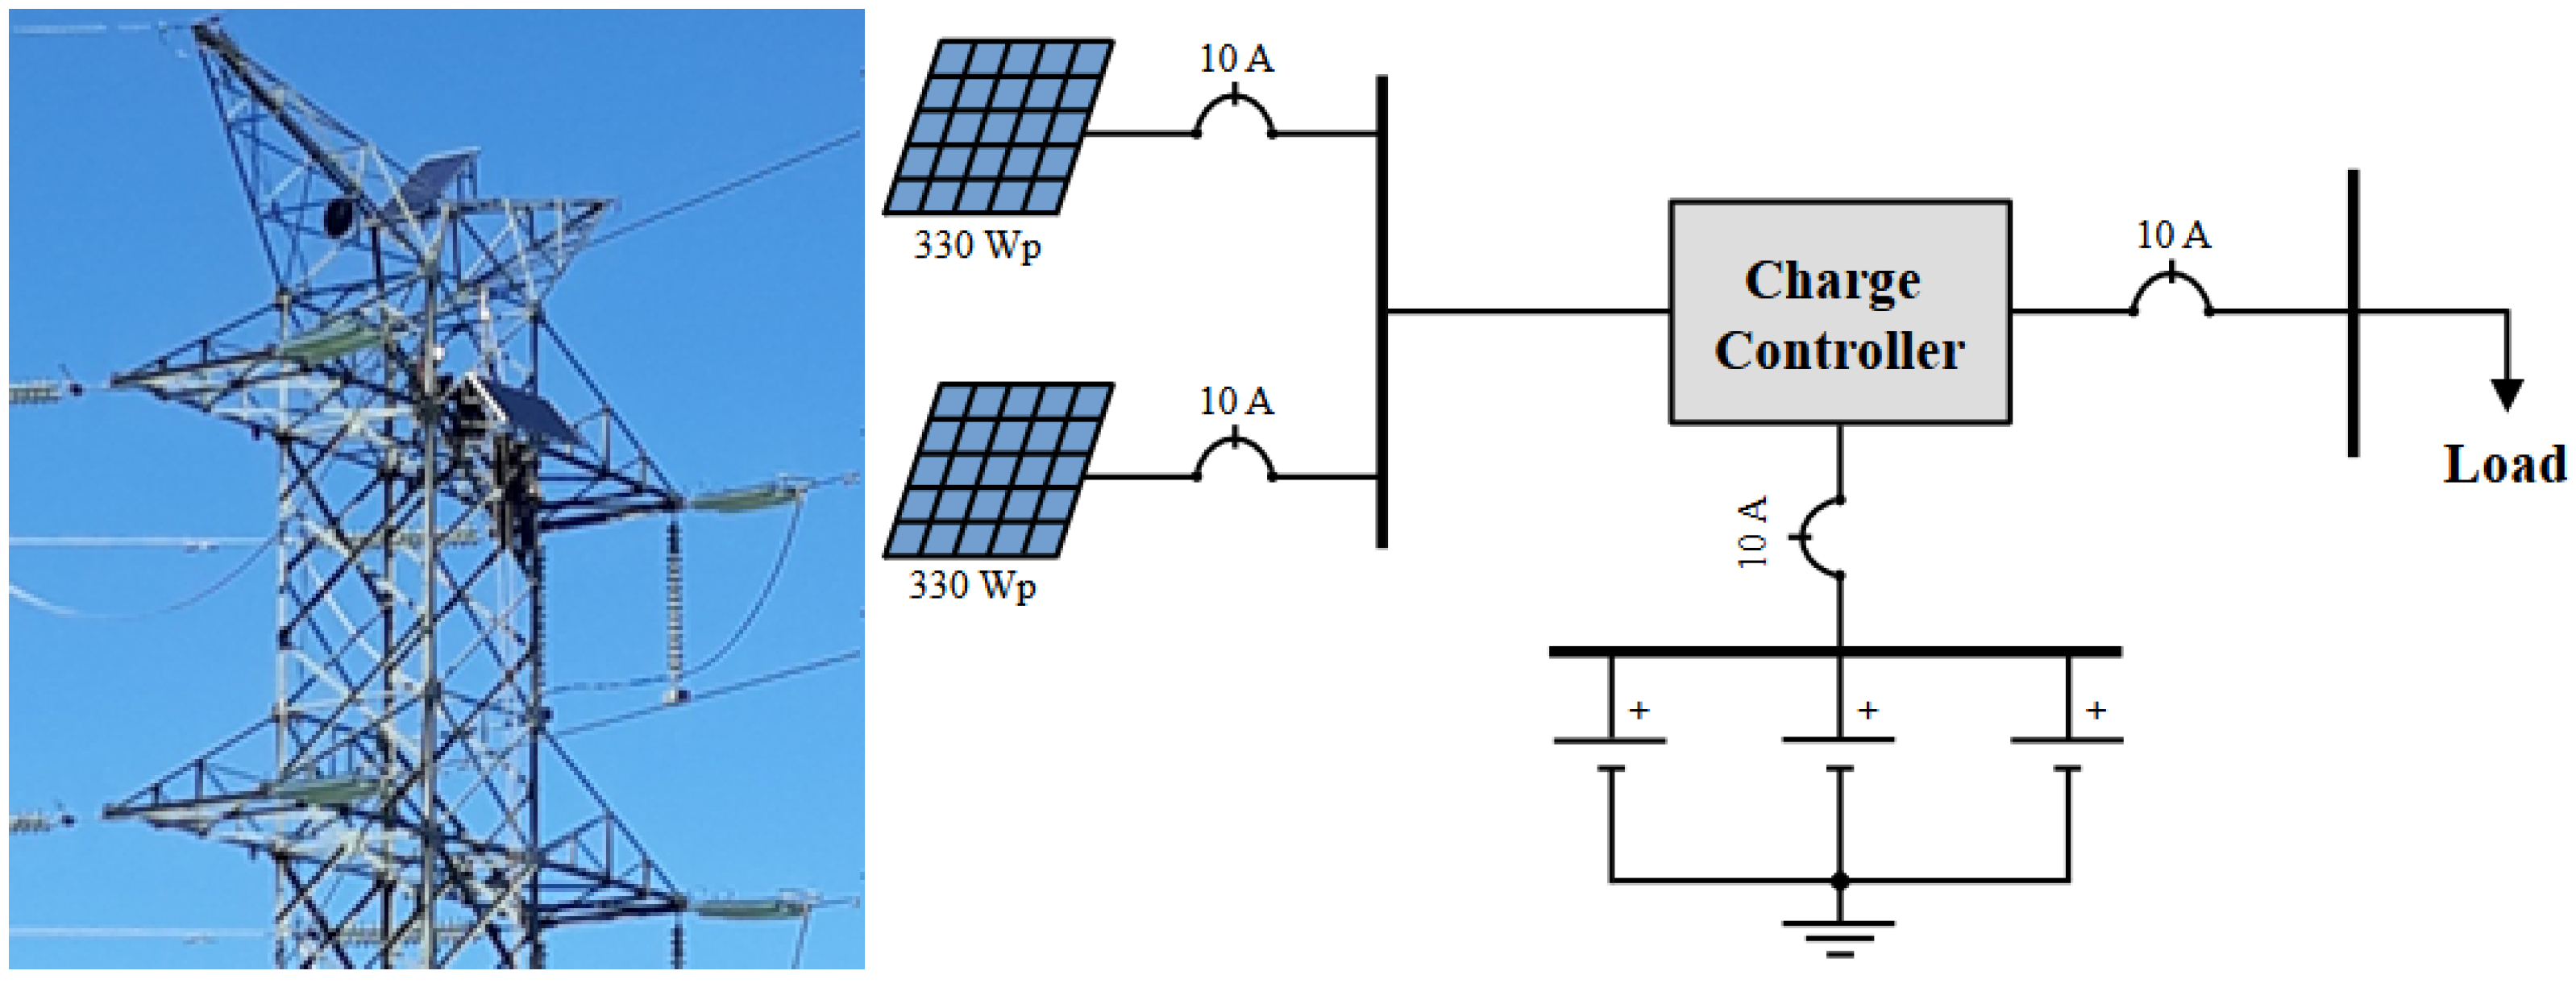
4.4. Energy-Supplying Unit
Photovoltaic panels and a storage system (lithium-ion battery) with a load controller comprise the energy-supplying unit. This energy-supplying system can be projected to have one to five days of autonomy, depending on the project requirements. The battery, maximum power point tracking (MPPT) load controller, and circuit breakers are packed in a case with IP 66, similar to the enclosure of the EOSPU. They consist of a battery bank with multiple independent cells, managed by a charge controller and powered by two 330 Wp solar panels installed at the top of the transmission tower (see
Figure 4). The electronic board can control the interconnected loads, and, as a last resort, necessary disconnections are performed to maintain system operation. The system’s load includes the weather station, the EOSPU (with its photodetectors and optical source), and one optical fiber media converter (communication system). The power supply system was explicitly designed to support the TECCON system, providing power autonomy for the entire system for up to three days without load.
4.5. Real-Time Monitoring Unit
This unit comprises the communication channel and supervisory control made in the AMC. OPGW implements the communication system as a data transmission system, which is the ground or guard cable on TL. All TL information achieved through the optical sensors is broadcast to the substation’s control center. Information acquired on the EOSPU is encapsulated in Sampled Values (SV) messages up to the first media converter to transform the electric signal into an optical signal. A fiber optical distribution panel (FODP), generally called a splicing box, receives the fiber termination to connect with the OPGW to transmit the message to the next media converter located at the substation. There, the signal is converted from an optical to an electric signal before the information arrives at the server (AMC). The IEC 61850 standard [
29] is applied as a communication protocol, and the entire communication system has a power consumption of 2 W. A web application has been developed to provide user functionalities to monitor electrical current, wind speed and direction, cable and environment temperature, and the cable’s mechanical traction.
These data help us identify potential deterioration, overheating, and the real-time ampacity level of the TL. The web application has some functionalities, including real-time measurements, statistic signal data, fault detection, and conductor condition monitoring. Furthermore, the AMC has a state estimator that rejects gross errors and calculates the heat balance in the TL in real time, i.e., performs a dynamic line rating (DLR) to determine the line condition in terms of load level [
24].
4.6. Weather Station Unit
Environmental variables are captured directly by the weather station unit, which has specific sensors to handle variables such as atmospheric pressure, ambient temperature, wind speed and direction, and other issues. The weather station unit is installed locally on the same transmission tower as the TECCON MS. This device can collect variables sampled at a frequency of 1 Hz, which are encapsulated and prepared for sending via the SV protocol. After gathering, it is sent to the real-time unit at the substation via the OPGW cable. In the real-time unit, the message is delivered via the Ethernet protocol to be appropriately decoded, stored, and displayed in the application interface. The major set of environment variables used by TECCON MS may be summarized as wind speed and direction, atmospheric pressure, humidity, rain precipitation, dew point, and ambient temperature, which are used in different computing applications.
4.7. TECCON MS Data Flow
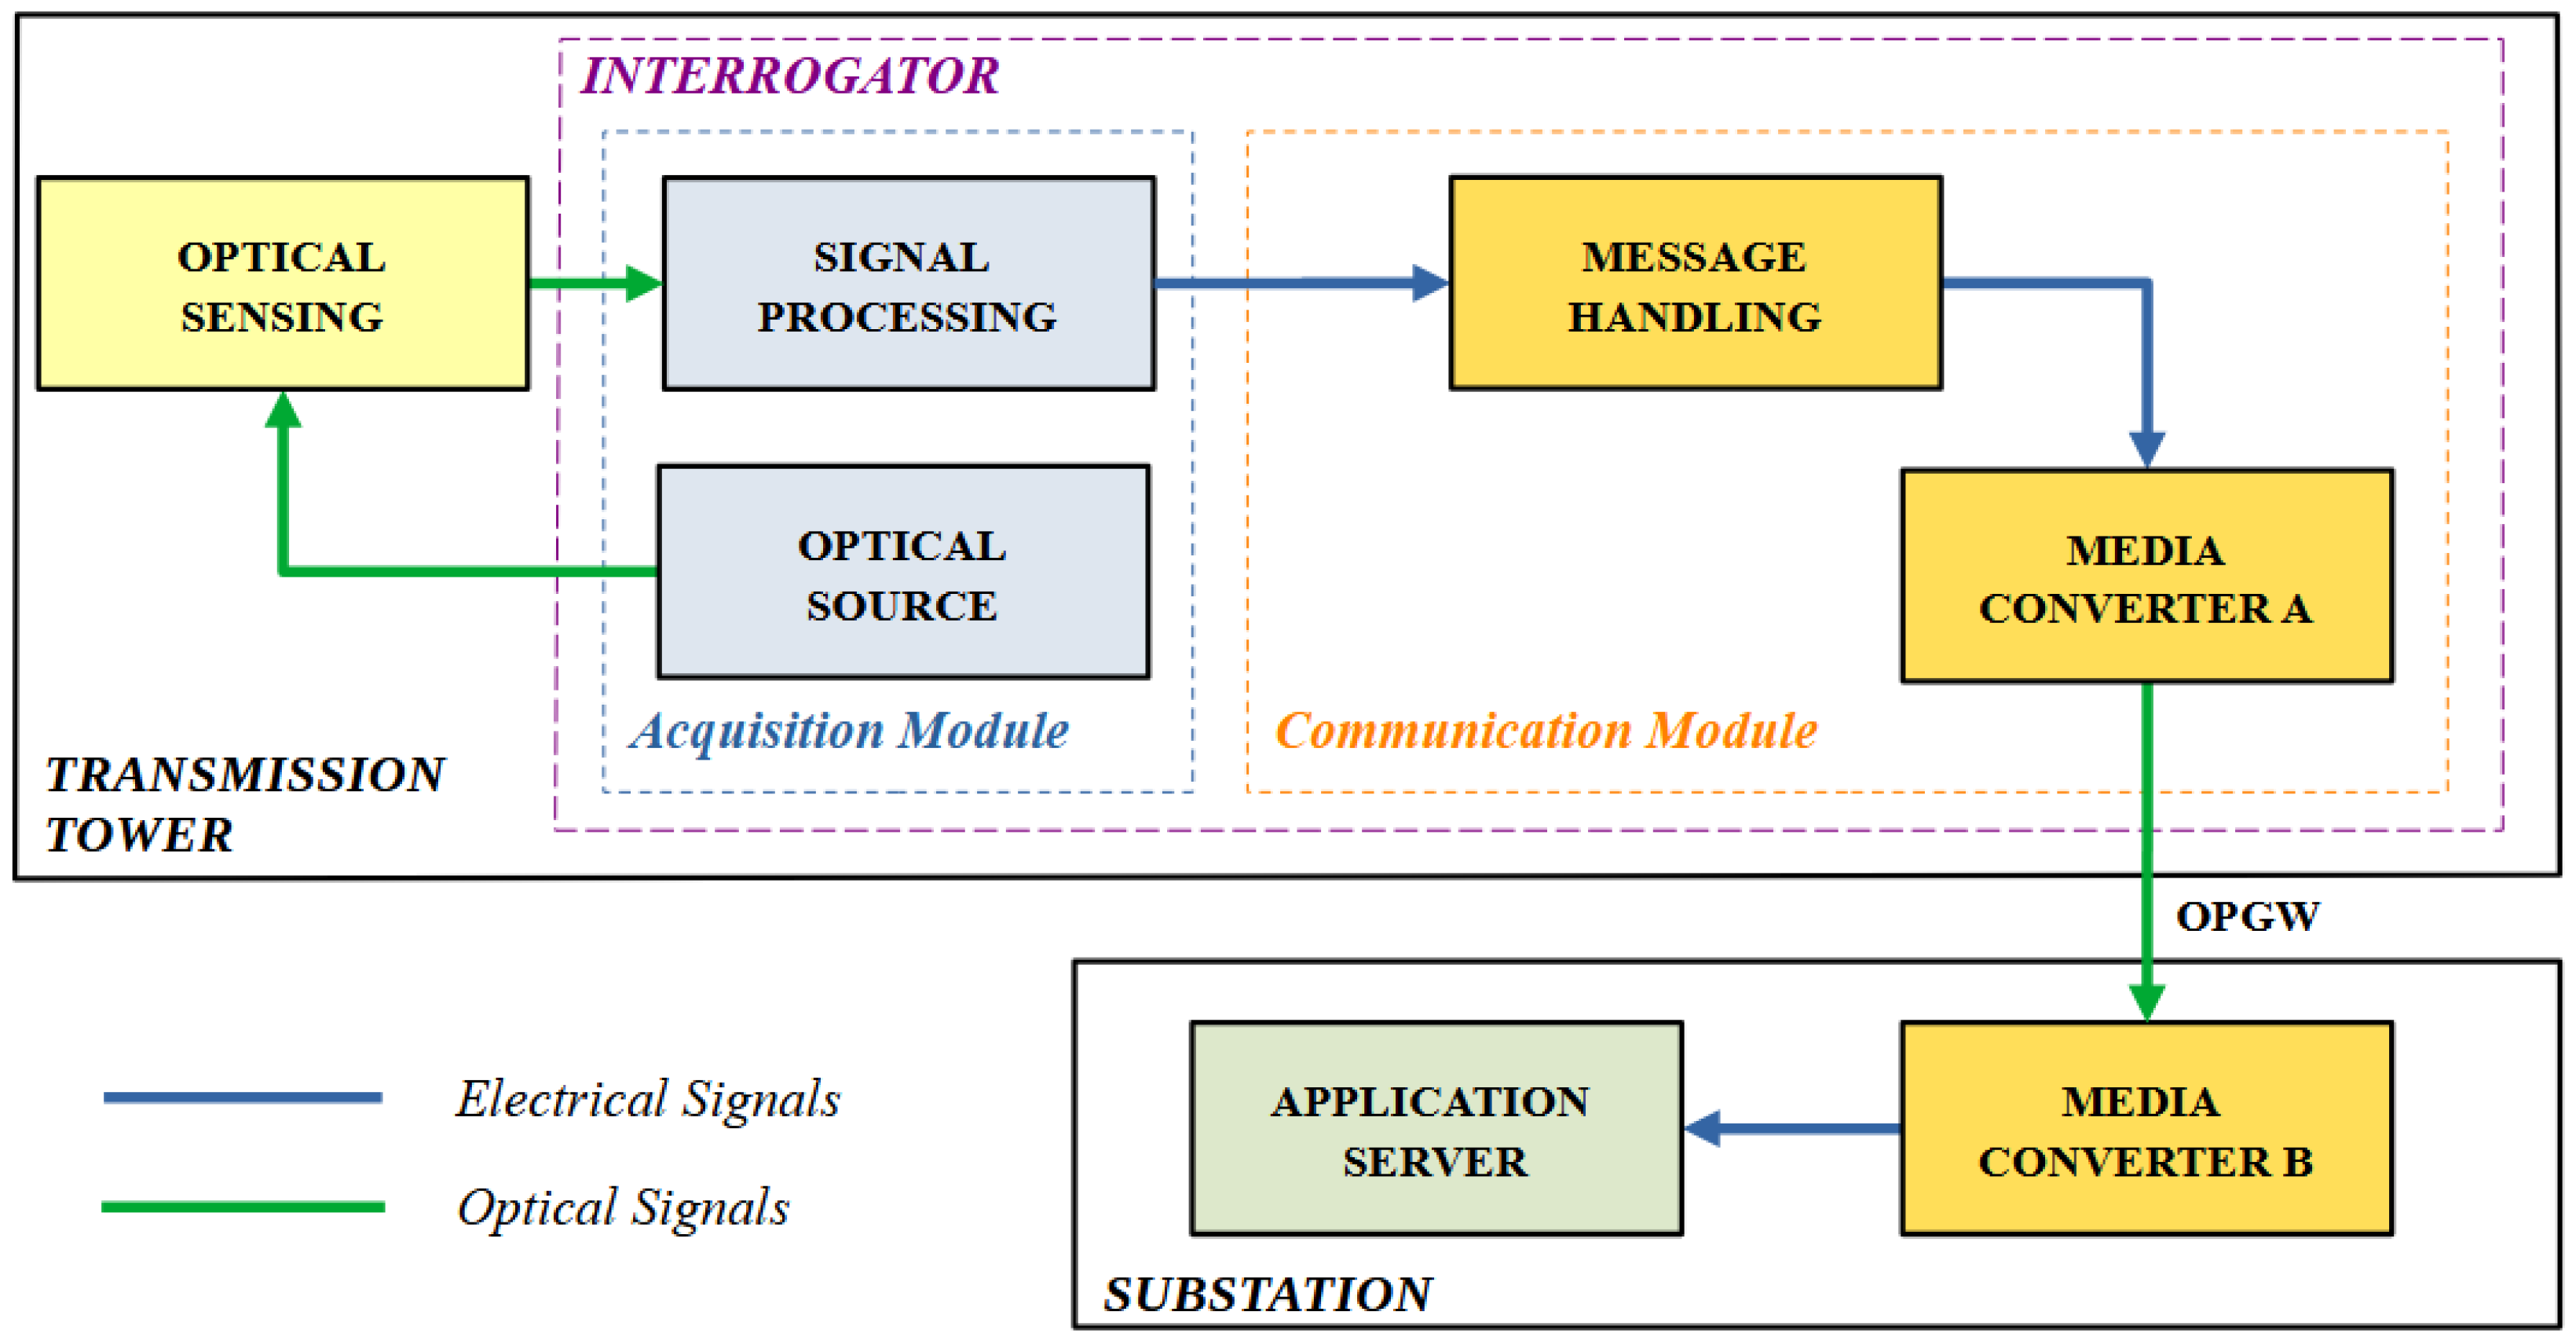
After examining the TECCON MS units,
Figure 5 illustrates the data flow used in the solution’s implementation, categorizing it into electrical and optical signals.
The optical source is primarily responsible for constantly interrogating the optical sensors, which respond with the variables electric current, conductor temperature, and mechanical strain, which are sent to the PCB. The PCB performs the signal transduction and proper electronic processing in the transmission tower. Before sending the data, it is necessary to encapsulate the message to organize the data in the SV protocol. The message organizes the optical variables, environmental variables, and programmed gains of each variable to be sent to the communication module. Media converter A performs the optical conversion to enable data transmission via OPGW cable. There is also a media converter B at the substation, which returns the signal to the electrical domain to be stored and made available on the application server.
Figure 6 shows an overview of the TECCON MS in the field. As previously discussed, the system is decoupled into two parts: transmission tower and substation components. Over the past four years, TECCON MS has been subjected to various adverse weather conditions, which have captured essential measurements for the composition of resilience indicators for the transmission line in southern Brazil. During this period, no sensor failures were recorded nor was the system affected by extreme weather conditions. The encapsulation of the sensors and optical–electronic circuits ensures additional protection for the essential elements of the TECCON system.
5. Results and Discussion
Validation efforts for a system such as TECCON MS are not simple. Firstly, comparison with other systems needs to be adapted to the standards of existing systems. The granularity of measurements is also challenging since TECCON MS uses high-resolution measurements. Another critical point is to find systems that perform high-resolution measurements of deformation and temperature, as is the case with TECCON MS. However, it is essential to establish a basis for comparison to verify the measurements’ reliability.
A validation process considering the electric current variable is feasible since several monitoring systems offer this measurement through conventional instruments, such as current and voltage transformers appropriate for the task. In this sense, the TECCON MS system can be compared with a system widely used by transmission companies in Brazil.
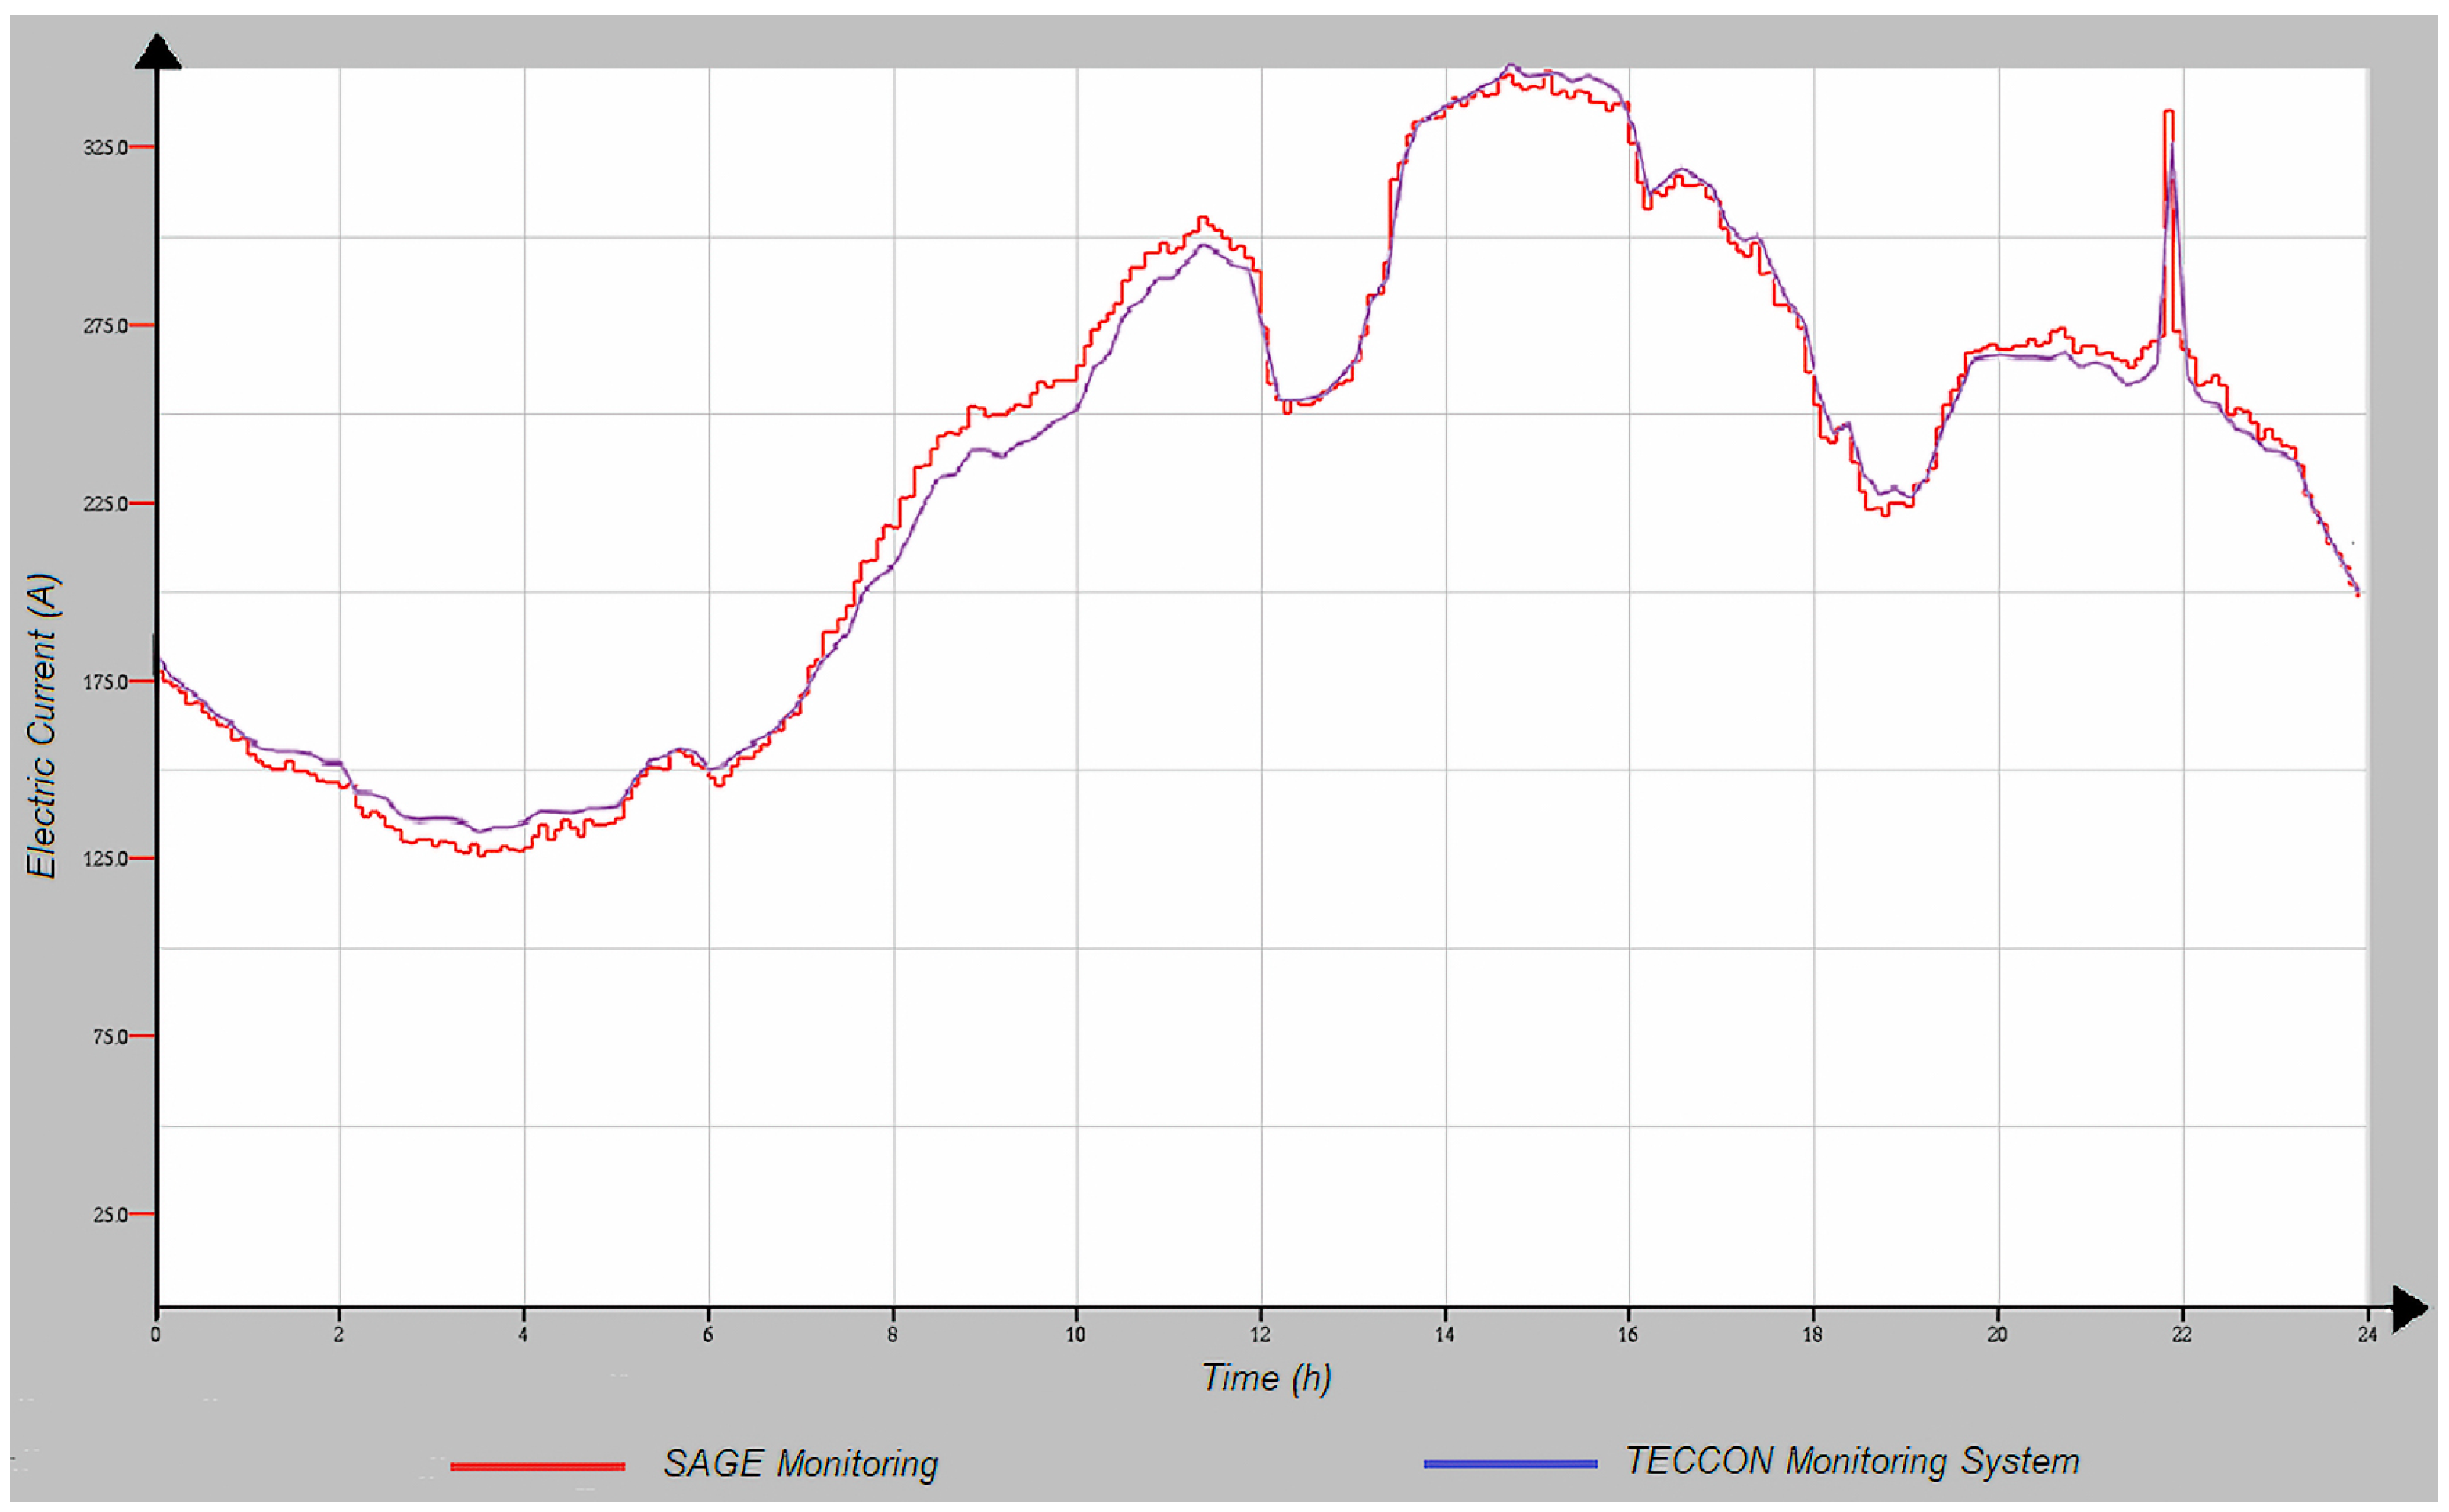
Data from the Open Energy Management System (SAGE), based on the asset manager’s SCADA system, can be used, selecting the same evaluation day. In this context,
Figure 7 compares the electric current amplitude of TECCON MS (in blue) and SAGE (in red).
Adherence to the presented profiles for transmission system monitoring is observed, demonstrating accuracy, with minor deviations from the actual measured electric current profile. Most of these deviations are justified by granularity differences. Whereas TECCON MS uses high measurement resolution (high data acquisition rates), the SCADA system is integrated every 1 s. The comparison confirms the robustness of the TECCON MS implementation.
A TL’s design, implementation, and operation comprise distinct and complex life-cycle stages of power system assets. These stages encompass the planning and construction phases, after which come the operation and maintenance phase. In this last phase, the asset (TL) is handed over to the operator and asset manager for exploration. Understanding the complex relationships between electrical, thermal, and mechanical variables is challenging during the operating and maintenance phase.
The TECCON MS solution offers a framework for evaluating the relationships between observable variables in a TL.
Figure 8 illustrates the main qualitative relationships regarding the variables presented in this work. The direct relationships are organized intuitively using arrows, considering the monitored and estimated variables, including environmental and operational ones.
Bearing the relationships established in
Figure 8 in mind, the TECCON MS can generate alarms upon identification of variations and events considered significant to be evaluated, following the criteria of the TL management company. Initially, the sentence “significant to be evaluated” expresses variable values far from the daily average of each variable monitored throughout the observations.
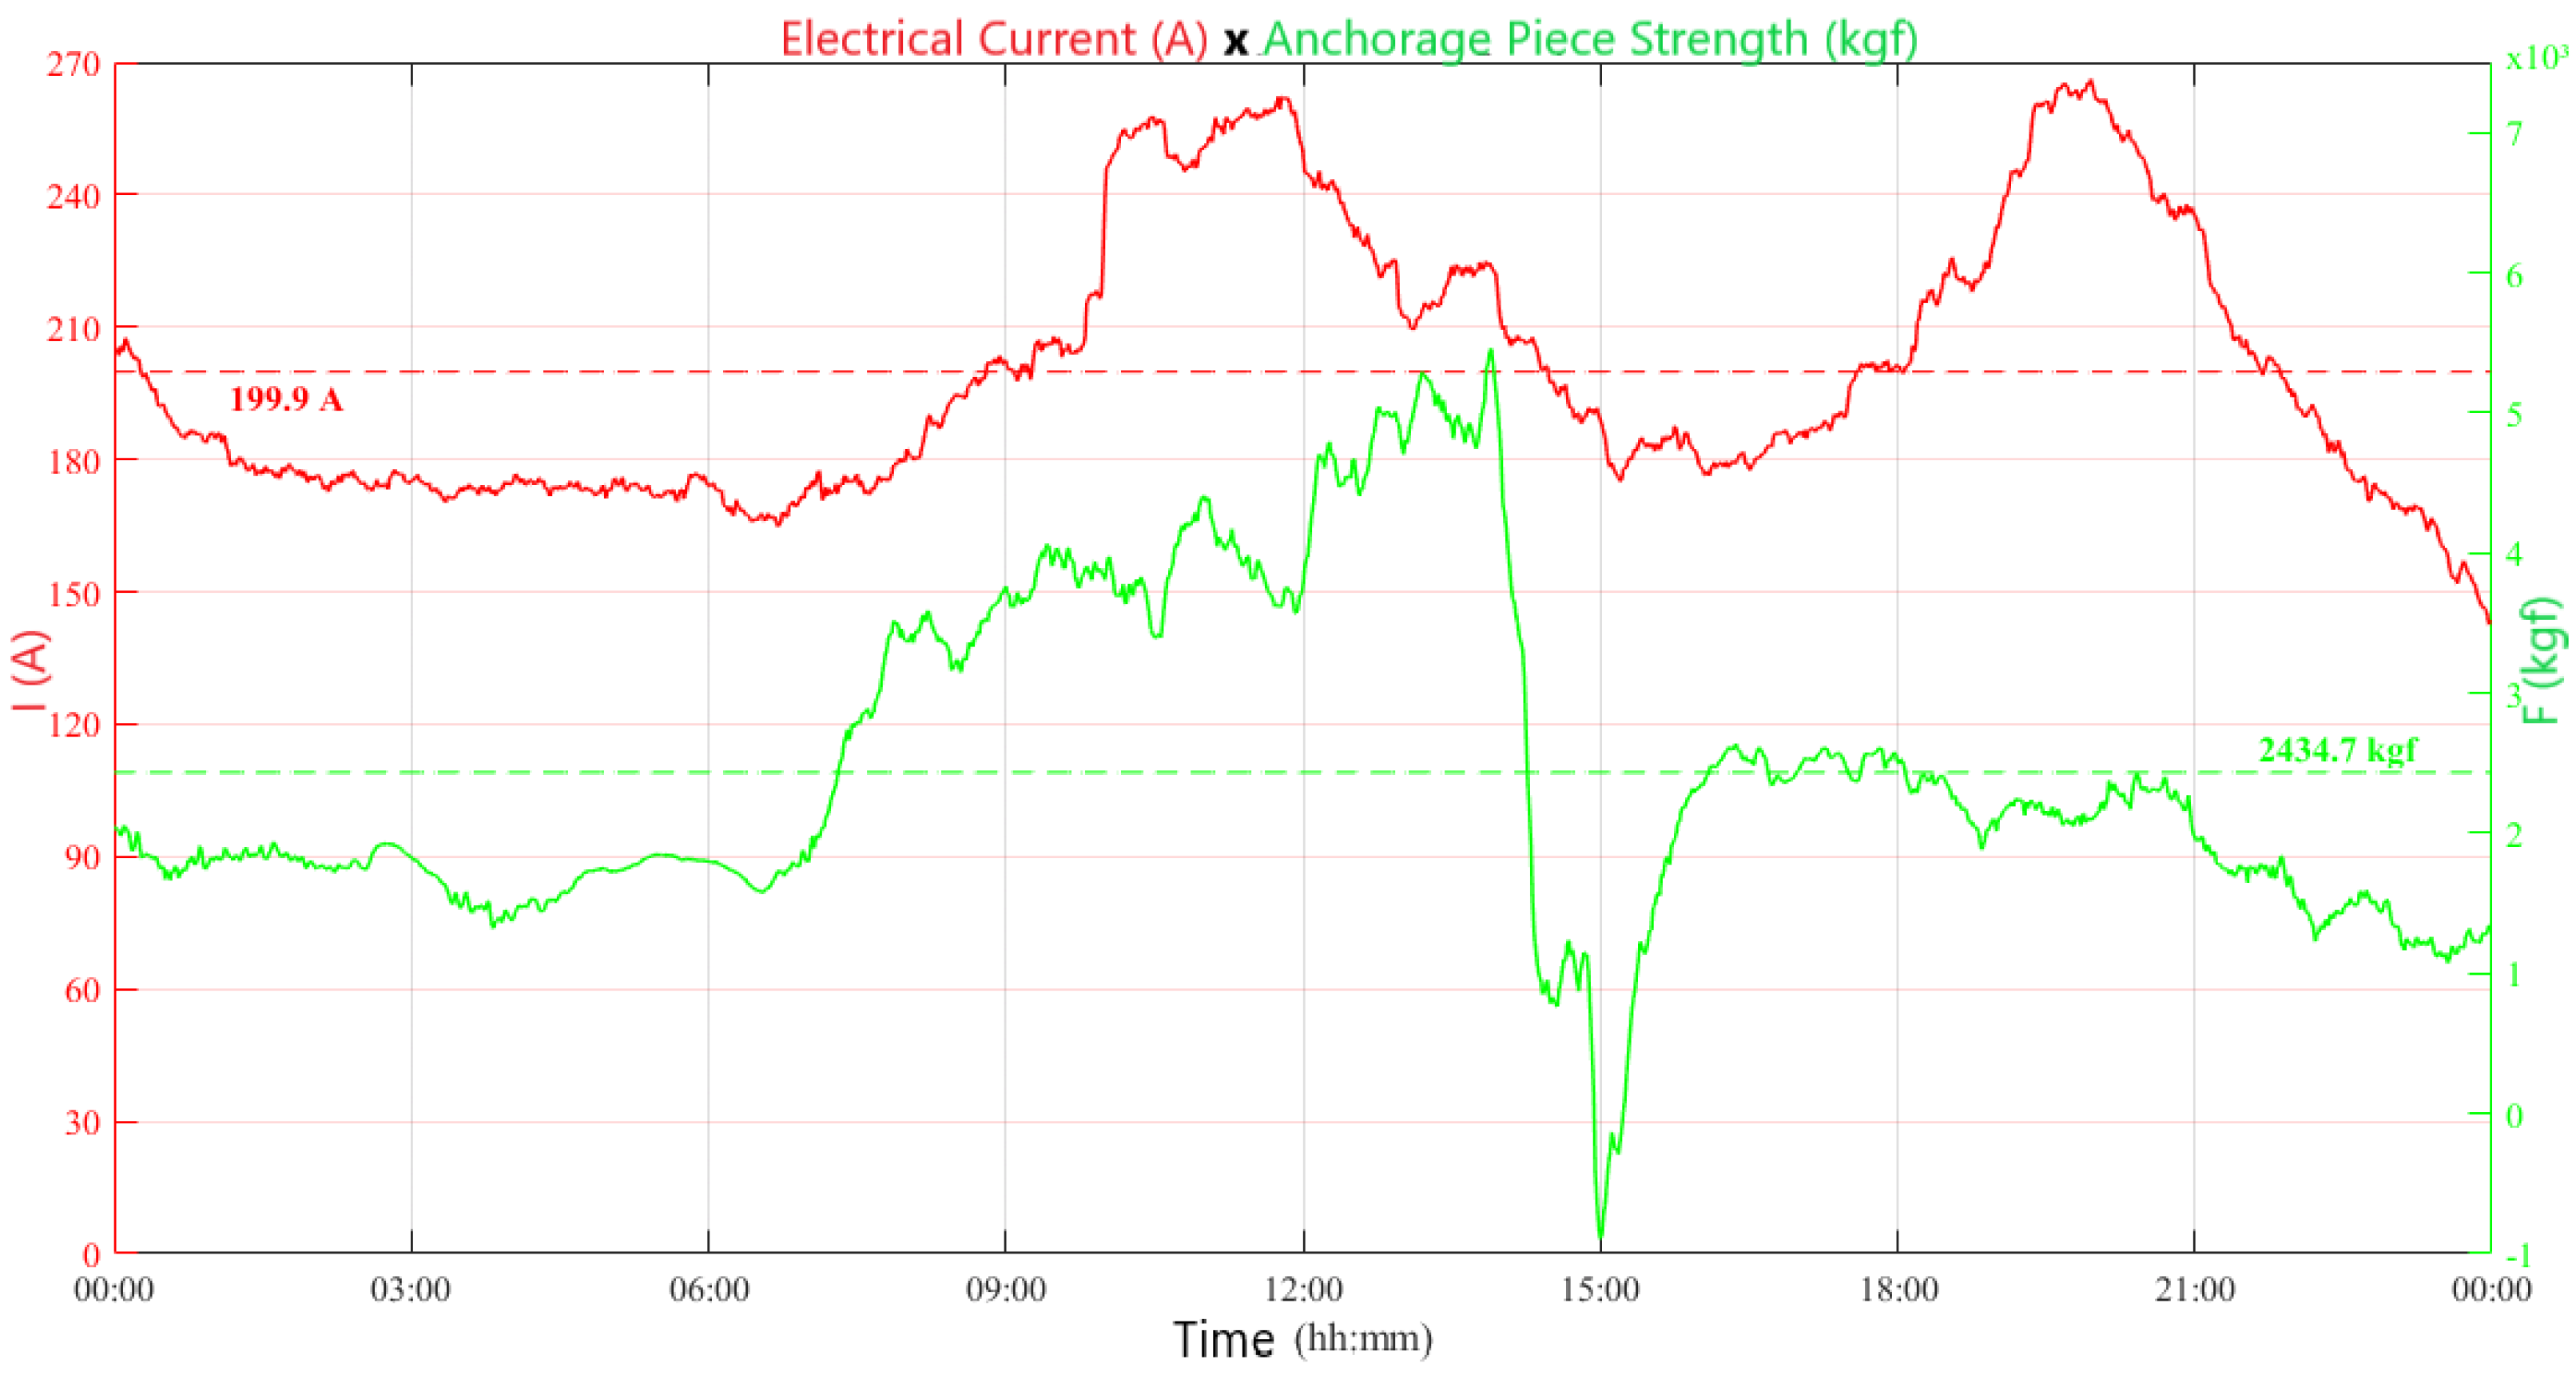
Following this simple criterion, a significant mechanical variation is assumed as an example for discussion, as described: the deformation sensor installed in the TL anchorage piece identifies a significant variation in the anchorage force, and immediately, the real-time monitoring system sends a warning to the company’s management team. In
Figure 9, the most prominent average increase in the anchorage strength is shown in green. It began around 6:32 a.m. (1576 kgf), evolving with alternations until reaching its maximum value of 5446 kgf at 1:54 p.m. This sample marks the beginning of the significant variation identified by the TECCOM MS. Later, within the same day, the phenomenon persisted with a sudden alternation and changing the anchorage strength direction from elevation to a reduction from 3:00 p.m. (−890 kgf), and also changing the phenomenon from traction to compression, returning to the average value at 4:06 p.m.
It is noted that the identified phenomenon lasted nearly three hours in the afternoon of that day. Therefore,
Figure 9 illustrates the behavior of the electrical current (in red) during the same observation period, with the same temporal granularity as the anchorage force. Both variables demonstrate elevated levels (direct relationship) from 6:00 a.m. to 12:00 p.m. on this day. However, this scenario is reversed between 12:00 p.m. and 1:54 p.m. (maximum anchorage force), returning to a direct relationship when both return to operating at reduced levels between 1:54 p.m. and 3:00 p.m. (minimum anchorage force). After reaching the minimum daily value, the anchorage force returns to the average value at 4:06 p.m. In this sense, the electric current remains constant, with slight variations around 180 A. Thus, there is no significant association between the behaviors of the anchoring force and electric current variables. This finding is evident in
Figure 9, specifically between 6:00 p.m. and 7:30 p.m., when there is a noticeable increase in electric current, similar to the rise observed between 6:00 a.m. and 12:00 p.m.; however, in this case, both variables have different behaviors from those observed previously.
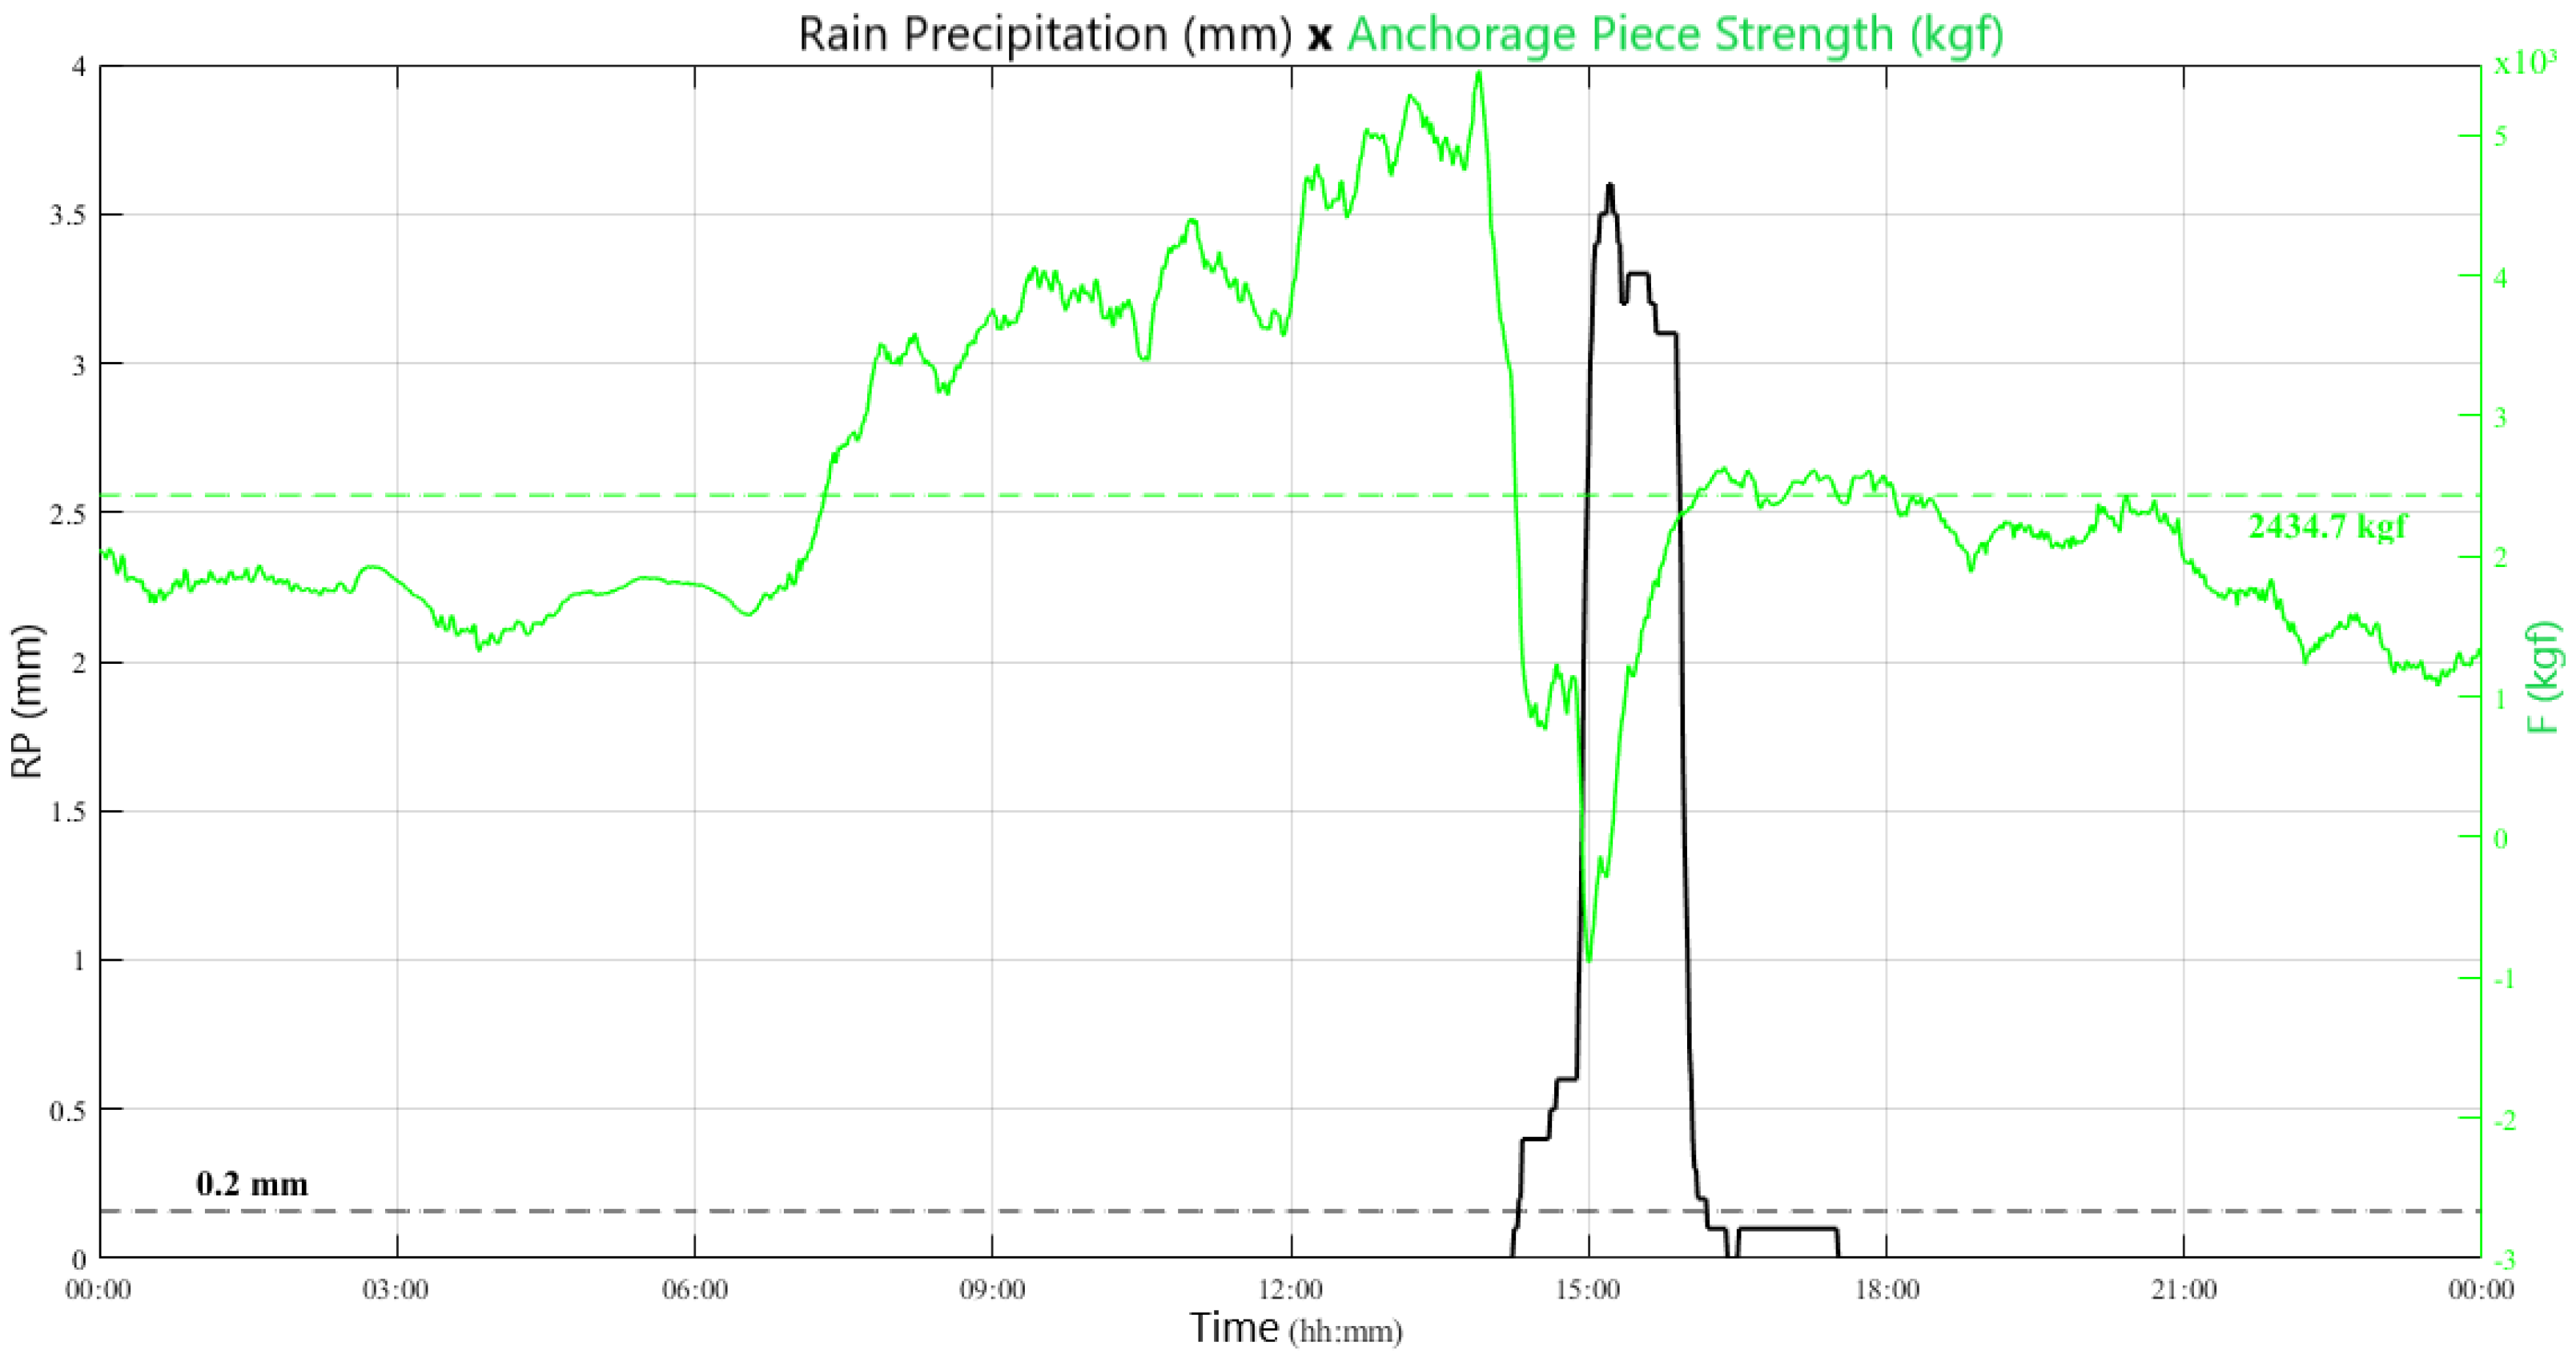
Different selection criteria were considered to assess the environmental variables in relation to the anchorage force, with the aim of identifying the most relevant variables for the context of the variation in the anchorage force. One of the relevant conditions was the occurrence of rainfall during the strength reduction period, with the rainfall variable expected to have a high degree of association with the anchorage force. Thus, the TECCON MS observes and records the occurrence of rainfall during the period of the observed phenomenon.
Figure 10 highlights the beginning of the rainfall at 2:15 p.m., when the anchorage force is in the period of severe reduction, as described previously. The most intense increase in rainfall occurs between 2:55 p.m. and 2:57 p.m. when the anchorage force variable suddenly reverses. Between 2:58 p.m. and 3:14 p.m., there is an increase in rainfall in the region, reaching its daily maximum of 3.6 mm, then reducing until 4:23 p.m., when the final rainfall occurs. In this same period, the anchorage force reaches its minimum value at 3:00 p.m. (−890 kgf), rising from then on and promoting a new reversal of direction at 3:14 p.m., varying until reaching the daily average value at 4:06 p.m. (2434.7 kgf).
Evaluating another environmental variable directly related to the deformation in the TL anchoring piece is essential to better understand the phenomenon observed in the anchoring force.
Figure 11 illustrates the behavior of the ambient temperature within the same period and with the same temporal granularity as the anchoring force. It can be seen that the shape of the variation in the ambient temperature is very similar to the shape of the variation in the anchoring force. Both variables have a high degree of association when their behaviors are qualitatively compared. Another relevant point to highlight is the fact that the two monitored quantities come from different sources: (a) the ambient temperature comes from the sensors of the weather station unit (meteorological station); (b) the anchoring force comes from the sensing unit (optical sensing) of the TECCON MS.
Figure 11 also highlights that both variables increase at around 6:00 a.m., with great coherence in their trajectories. Also, in
Figure 11, it can be observed that both the anchoring force (in green) and the ambient temperature (in magenta) present maximum daily values of 5446 kg and 26 °C, respectively, at the same time, at 1:54 p.m. From then, they begin a sudden reduction process until 3:00 p.m., when the anchoring force reaches its minimum of −890 kgf.
For a few moments, the mechanical traction (+) sensing on the anchorage piece assumes a mechanical compression (-) force behavior in the same anchorage piece. This sharp reduction is observed until 2:59 p.m. At this point, the ambient temperature reaches approximately 16 °C. This large variation in ambient temperature (from 26 °C to 16 °C in approximately 1 h) is linked to other meteorological phenomena, which were also captured by TECCON MS. Considerable gusts of wind were observed, with speeds and directions that caused distinct movements in the TL conductors (variations in the virtual weight of the cable were identified). As previously discussed, the occurrence of rain coinciding with the reversal of the force acting on the anchorage piece suggests that both atmospheric pressure and relative humidity played a role in influencing this anchoring force. From 4:00 p.m., both variables return to their average values of 2434.7 kgf and 18.9 °C, respectively. From 9:00 p.m., a new drop in the ambient temperature of the TL is observed, which is accompanied by the anchoring force.
Considering the measurements presented in
Figure 6,
Figure 7 and
Figure 8 and the analyses of the variables’ relationships, the high degree of association between ambient temperature and anchoring force variables for this specific monitored day can be identified.
The previous evaluation can be expressed using correlation analysis [
30], which mathematically assesses the association between two or more variables, determining the degree (weight) and direction of the effect (direct or inverse).
Table 1 and
Table 2 illustrate the hourly correlations, for the observed day, between the anchoring force and various captured variables during the occurrence period of the phenomenon (from 2:00 to 4:59 p.m.), considering the Pearson (
), Spearman (
), and Kendall (
) methods [
30].
Firstly, the strong relationship between the anchoring force and ambient temperature from 3:00–3:59 p.m. is confirmed by correlation analysis, regardless of the method used. The Spearman coefficient of 0.9909 is highlighted. This relationship is justified and evidenced by the adherence between these variables, as illustrated in
Figure 11. The change in correlation between the anchoring force and electric current transitions from a strong and direct degree (2:00–2:59 p.m.) to a moderate and direct degree between 3:00 and 3:59 p.m. Further shifting to a moderate and inverse degree from 4:00 to 4:59 p.m. These relationships can be observed in the variations in the respective variables in
Figure 9. Note that the Pearson’s linear correlation of 0.7901 best represents the correlation between these variables. The correlation between anchoring force and wind speed indicates either nonexistent or weak correlation levels despite substantial changes in wind speed for the TL during this specific period.
As observed, integrating analyses from the mechanical and thermal domains into the electrical domain improves the observability of transmission line assets in situations usually estimated intuitively. These scenarios significantly impact system operation and expansion, yet traditional real-time monitoring systems often do not evaluate them.
6. Final Remarks
The TECCON MS digitizes and automates TL monitoring using optical technology. Its real application is a good way to assess sensing variables such as conductor temperature, electrical current, and mechanical traction and estimated variables such as clearances and sags of the TL span. When the environment variables are also assessed, they complete the understanding of the TL behavior. Moreover, this new real-time monitoring system can provide information to the DLR application, an important tool currently used by planners to avoid the need for new line corridors and to increase the line operation limits with no aging or conductor deterioration.
As a third dimension of application, the TECCON MS provides sufficient information for condition-based monitoring systems since the system provides specific data about the line conductor, which can indicate possible future failures. Therefore, the TECCON MS targets supporting control, protection, and failure detection. Future works will include a study of resilience parameters for transmission facilities and a set of novel optical sensors in the TECCON MS to monitor the insulator’s pollution level, leakage current, partial discharges in the TL, and conductor vibration. This prototype of TECCON MS was designed to operate on a 230 kV line in southern Brazil. Although the technological maturity level has been classified as TRL 7 (real-world testing), the system needs to be expanded, first to its three-phase version, and subsequently tested at other points in the Brazilian 230 kV network. Additionally, TECCON MS should be tested on Brazil’s 500 kV network to prepare studies on the system’s scalability. Adding TECCON MS to power systems may improve network observability and controllability, impacting transmission system resilience. By spreading the TECCON MS in the transmission system, power systems can become more flexible, resilient, and controllable.


 ,
, 


