1. Introduction
With the continuous advancement and research of renewable energy, the installed capacities of wind turbines and photovoltaic (PV) systems have been steadily increasing, leading to a rising proportion of renewable energy in power generation. However, renewable energy generation often experiences power surpluses during peak production periods and fails to meet load demands during low production periods [
1]. To address this issue, an efficient energy storage system is essential to store excess electricity during production peaks and release it during high-demand periods, thereby ensuring power balance within the system. Hydrogen produced through water electrolysis powered by renewable energy, referred to as green hydrogen, represents a clean secondary energy source. By utilizing green hydrogen, hydrogen energy storage systems composed of hydrogen production and storage units can effectively address the challenges of integrating wind and solar energy into power systems [
2,
3,
4].
Power generation using wind and solar resources exhibits significant instability, and the overcharging or over-discharging of lithium batteries and hydrogen storage tanks can lead to frequent start-stop operations of electrolyzers and fuel cells, thereby reducing the lifespan of battery energy storage systems [
5,
6,
7]. Controlling and coordinating system operation based on the state of charge (SOC) of batteries and the hydrogen state of storage tanks is critical for maintaining DC bus voltage stability and achieving reasonable power distribution during power fluctuations. This is an important research direction for hydrogen energy storage systems in the future [
5,
8,
9].
Currently, in the area of power coordination control for hydrogen-containing energy storage microgrid systems, several approaches have been explored: In [
10], a hydrogen energy utilization system combining photovoltaic and fuel cell technologies was developed. Power allocation is achieved by utilizing the difference between the state of charge (SOC), photovoltaic output power, and load power, effectively harnessing surplus photovoltaic energy that does not meet grid quality standards. However, this method only considers the SOC and neglects the hydrogen storage tank state, limiting its ability to accurately allocate power between batteries and fuel cells. In [
11], a hybrid energy storage photovoltaic microgrid system was designed, incorporating lithium batteries, supercapacitors, and hydrogen energy storage (comprising electrolyzers, hydrogen storage tanks, and micro gas turbines). In this system, lithium batteries stabilize the system through power exchange, supercapacitors handle high-frequency power fluctuations, and hydrogen energy storage absorbs excess solar and wind energy while compensating for system shortages. A power allocation strategy considering both the SOC (battery state of charge) and LOH (hydrogen storage tank state of hydrogen) ensures that the lithium battery SOC remains within a reasonable range, thereby extending battery lifespan. In [
12], a fuzzy control-based approach was proposed, where the SOC and SOH (state of health) serve as inputs for power allocation and coordination. By comparing their respective range intervals, this method achieves more precise power distribution. It effectively determines how to allocate surplus power between lithium batteries and electrolyzers during renewable energy surpluses and how to compensate power shortages between fuel cells and lithium batteries during deficits. Additionally, the heat generated by fuel cell operation is utilized to construct a clean and integrated energy system.
In summary, current research on coordinated control strategies for DC microgrids primarily focuses on reducing bus voltage fluctuations and mitigating power fluctuations. Therefore, this paper proposes a coordinated control strategy for a DC microgrid with hydrogen energy storage by considering the state of charge (SOC) of lithium batteries, the hydrogen state of storage tanks, and the characteristics of system equipment. First, fuzzy control is utilized with the SOC and SOH (state of health) as inputs to optimize power allocation between hydrogen energy storage units and lithium battery storage units. During system power shortages, multiple fuel cell stacks are introduced, and system power is re-optimized based on SOC and SOH. Additionally, operating conditions are categorized to ensure that SOC and SOH remain within reasonable ranges, thereby maintaining system stability. Finally, the feasibility of the proposed control strategy is validated using the MATLAB/Simulink simulation platform.
2. System Model
2.1. Overall System Structure
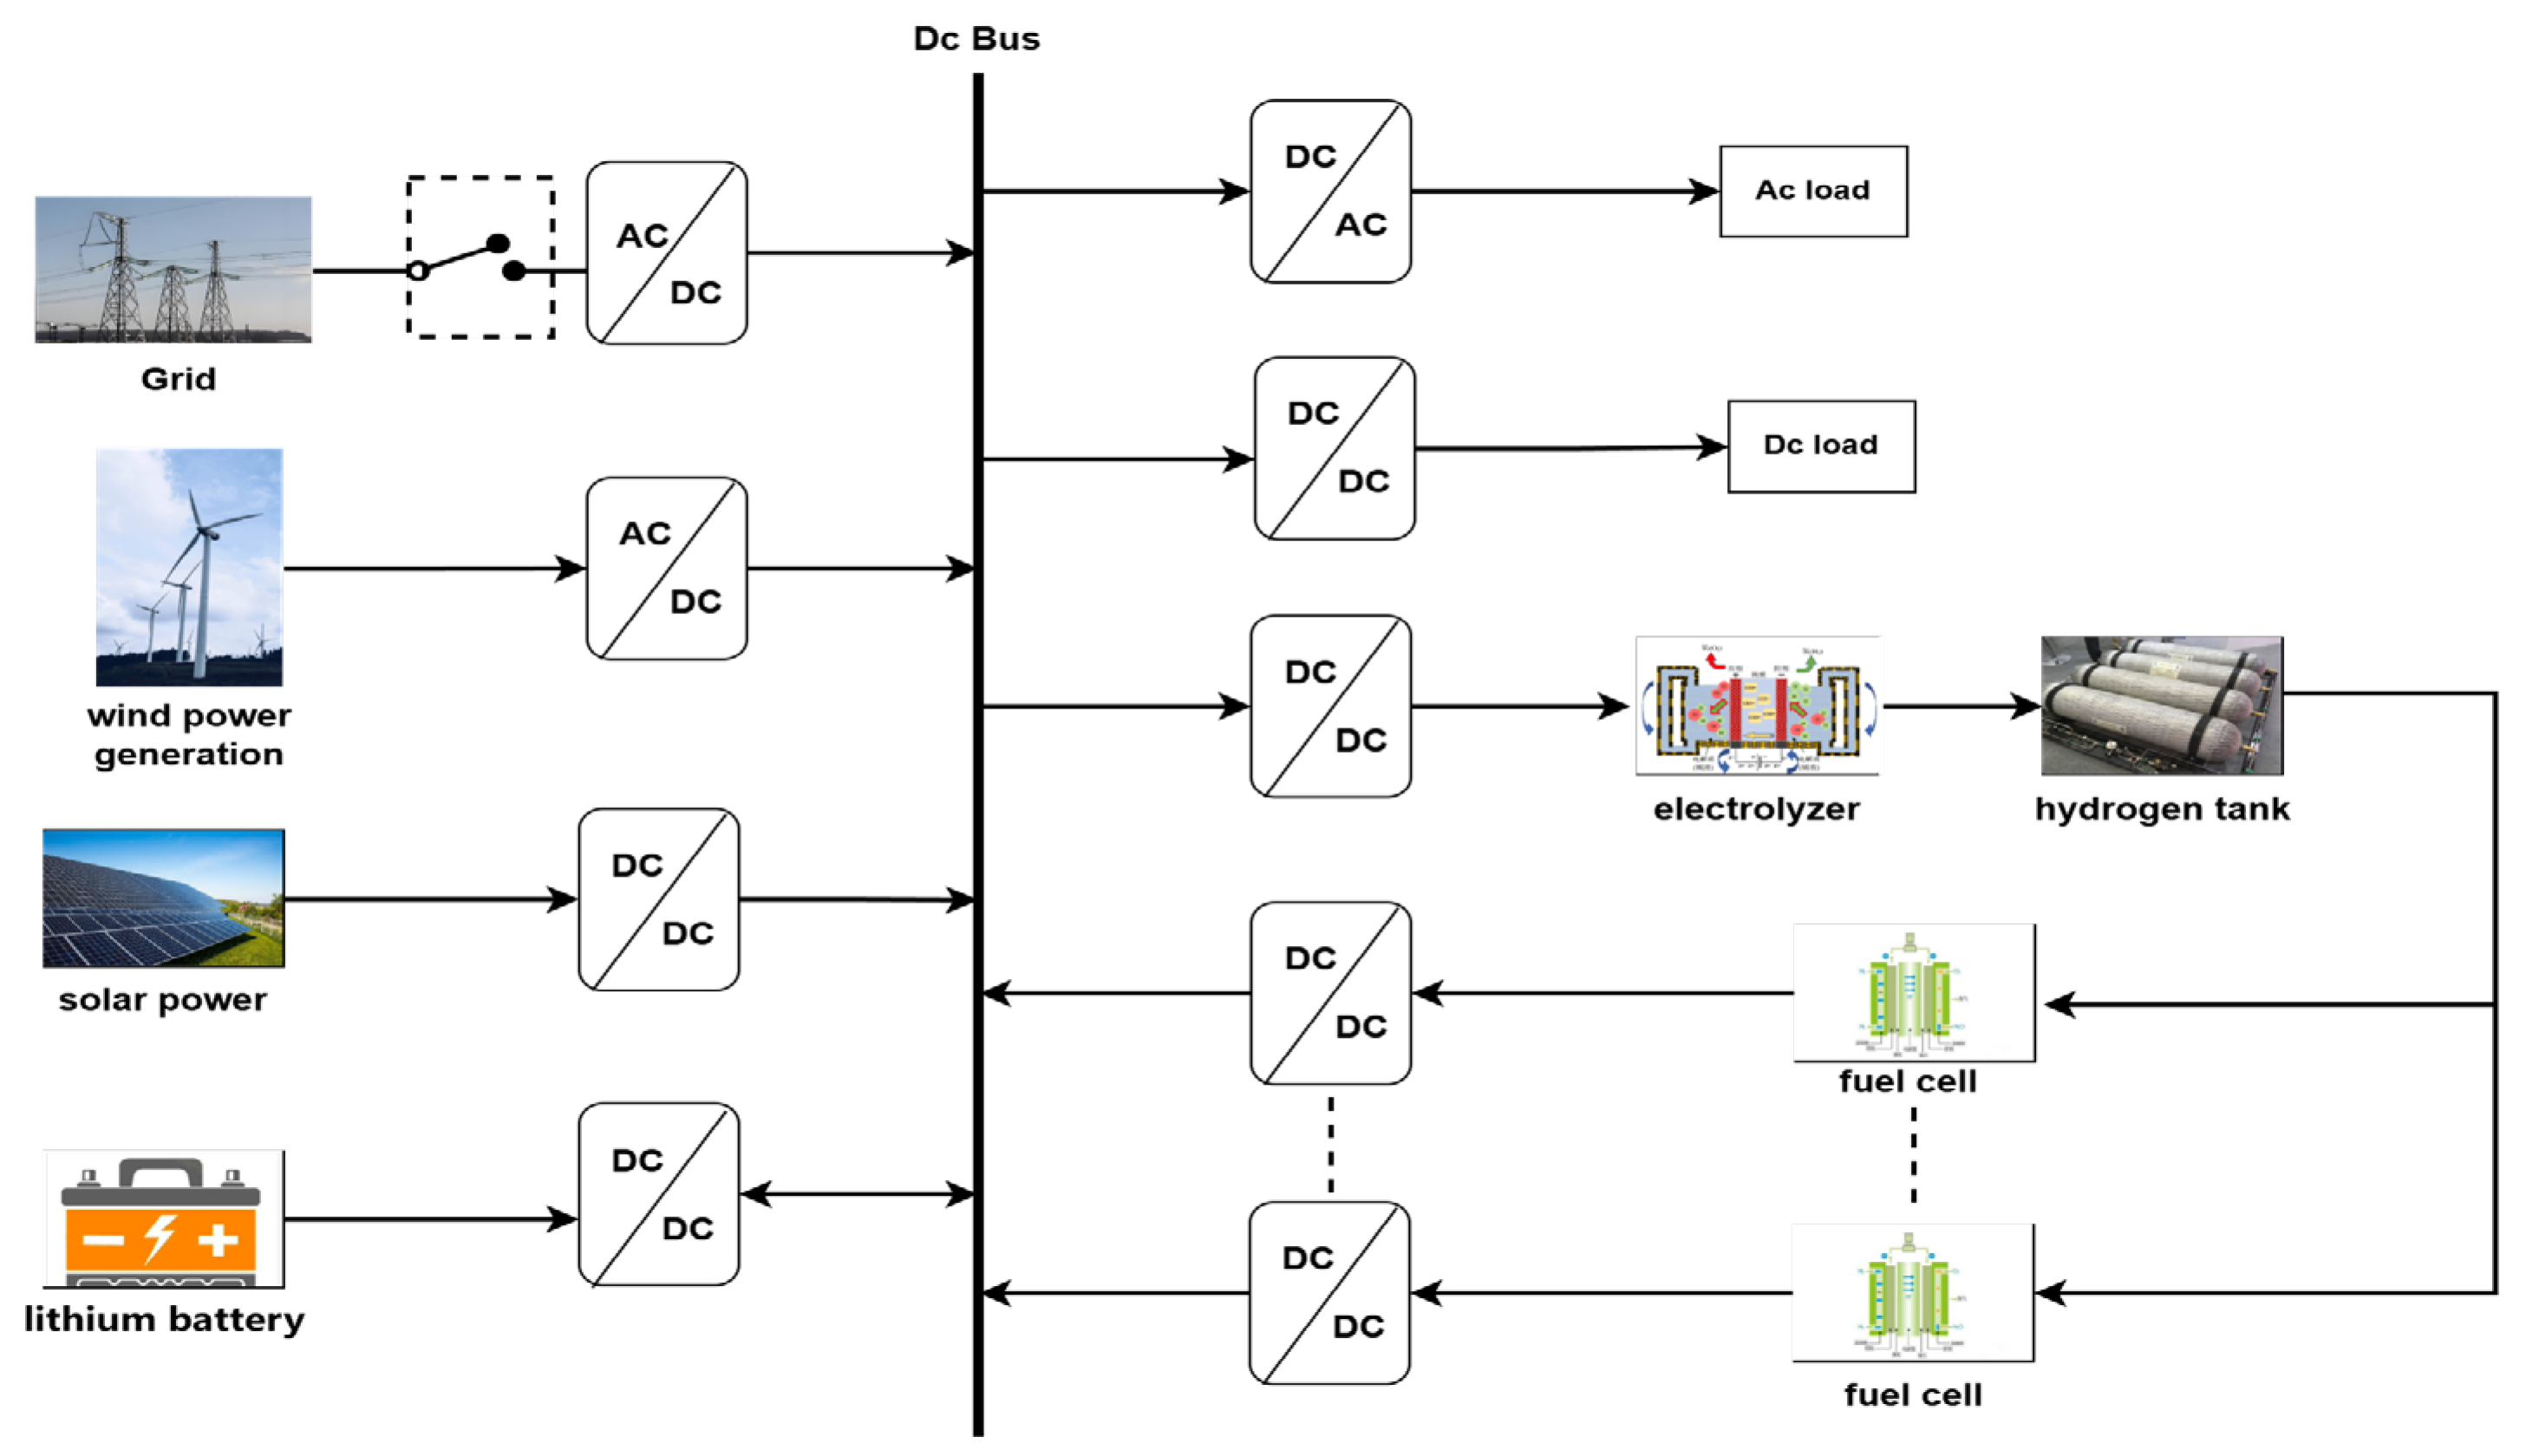
The structure of the DC microgrid with hydrogen energy storage is shown in
Figure 1. It consists of wind turbines, photovoltaic (PV) arrays, AC/DC loads, lithium battery energy storage, and a hydrogen energy storage system composed of electrolyzers, hydrogen storage tanks, and multiple fuel cell stacks. Wind and PV generation are connected to the DC bus through inverters and rectifiers to supply power to the DC loads. When wind and solar resources are abundant, surplus electricity is used for water electrolysis in electrolyzers to produce hydrogen, which is then stored in hydrogen storage tanks. When wind and solar resources are insufficient and the system cannot meet the power demand, the multiple fuel cell stacks generate electricity by consuming stored hydrogen to compensate for the power deficit in the loads [
2,
13,
14].
2.2. Lithium Battery Energy Storage Model
Lithium battery energy storage is one of the mainstream energy storage technologies due to its advantages, such as high energy density, long lifespan, high efficiency, fast response capability, and environmental friendliness. It can complement and coordinate with hydrogen energy storage by leveraging its rapid response characteristics. The mathematical models for its voltage and state of charge (SOC) are as follows [
15,
16]:
In the equation, represents the open-circuit voltage, is the instantaneous current, denotes the internal resistance of the battery, is the polarization voltage of the battery. Additionally, , and represent the capacitance, voltage, and power of the lithium battery energy storage system at time t, respectively.
2.3. Fuel Cell Model
The output voltage of a single fuel cell can be expressed as:
In the equation, represents the Nernst voltage, is the activation loss voltage, is the ohmic overvoltage, and is the concentration loss voltage
2.4. Hydrogen Storage Tank Model
The pressure of the hydrogen storage tank is given by the following equation:
In the equation, is the temperature of the hydrogen storage tank; R is the universal gas constant; V is the volume of the hydrogen storage tank; N is the hydrogen inflow rate.
2.5. Electrolyzer Model
PEM (Proton Exchange Membrane) electrolyzers, with their high efficiency, fast response, environmental friendliness, and safety advantages, are highly suitable for various applications in hydrogen production, especially in distributed energy systems and scenarios where safety and compactness are critical. The basic voltage model of a PEM electrolyzer is given as [
17]:
In the equation, is the open-circuit voltage, is the activation overvoltage at the anode and cathode, is the ohmic overvoltage, and is the concentration overvoltage.
3. Fuzzy Control and Multi-Stack Fuel Cell Power Allocation Method
3.1. Fuzzy Control Power Allocation
Fuzzy control is known for its intuitiveness, ease of understanding, independence from precise models, strong robustness, low computational complexity, and extensive engineering application experience. Fuel cell systems, on the other hand, typically exhibit complex dynamic characteristics, including nonlinear behavior of the cells, uncertainty in power output, and fluctuations caused by environmental factors such as temperature and load variations. Fuzzy control effectively handles these uncertainties and nonlinear issues by relying on empirical rules and fuzzy logic to regulate system outputs, thereby adapting to complex operating conditions. Therefore, fuzzy control can be utilized for power allocation between two energy storage units. First, define the differential power of the system as
Pd:
In the equation, is the wind power generation output; is the photovoltaic power generation output; is the load demand power.
Using fuzzy control theory, with SOC (state of charge) and SOH (state of health) as inputs, and the power distribution coefficient K as the output, the system can ensure that all devices operate within a reasonable range, avoiding overcharging and overdischarging.
When
Pd > 0, it indicates that the system has sufficient wind and solar resources. In this case, the power can be jointly handled by the electrolyzer for water electrolysis to produce hydrogen and the lithium battery for charging.
When
Pd < 0, it indicates that the system cannot meet the load demand. In this case, the power deficit must be compensated by power generation from the fuel cell and discharge from the lithium battery.
3.2. Fuzzy Control Parameter Settings
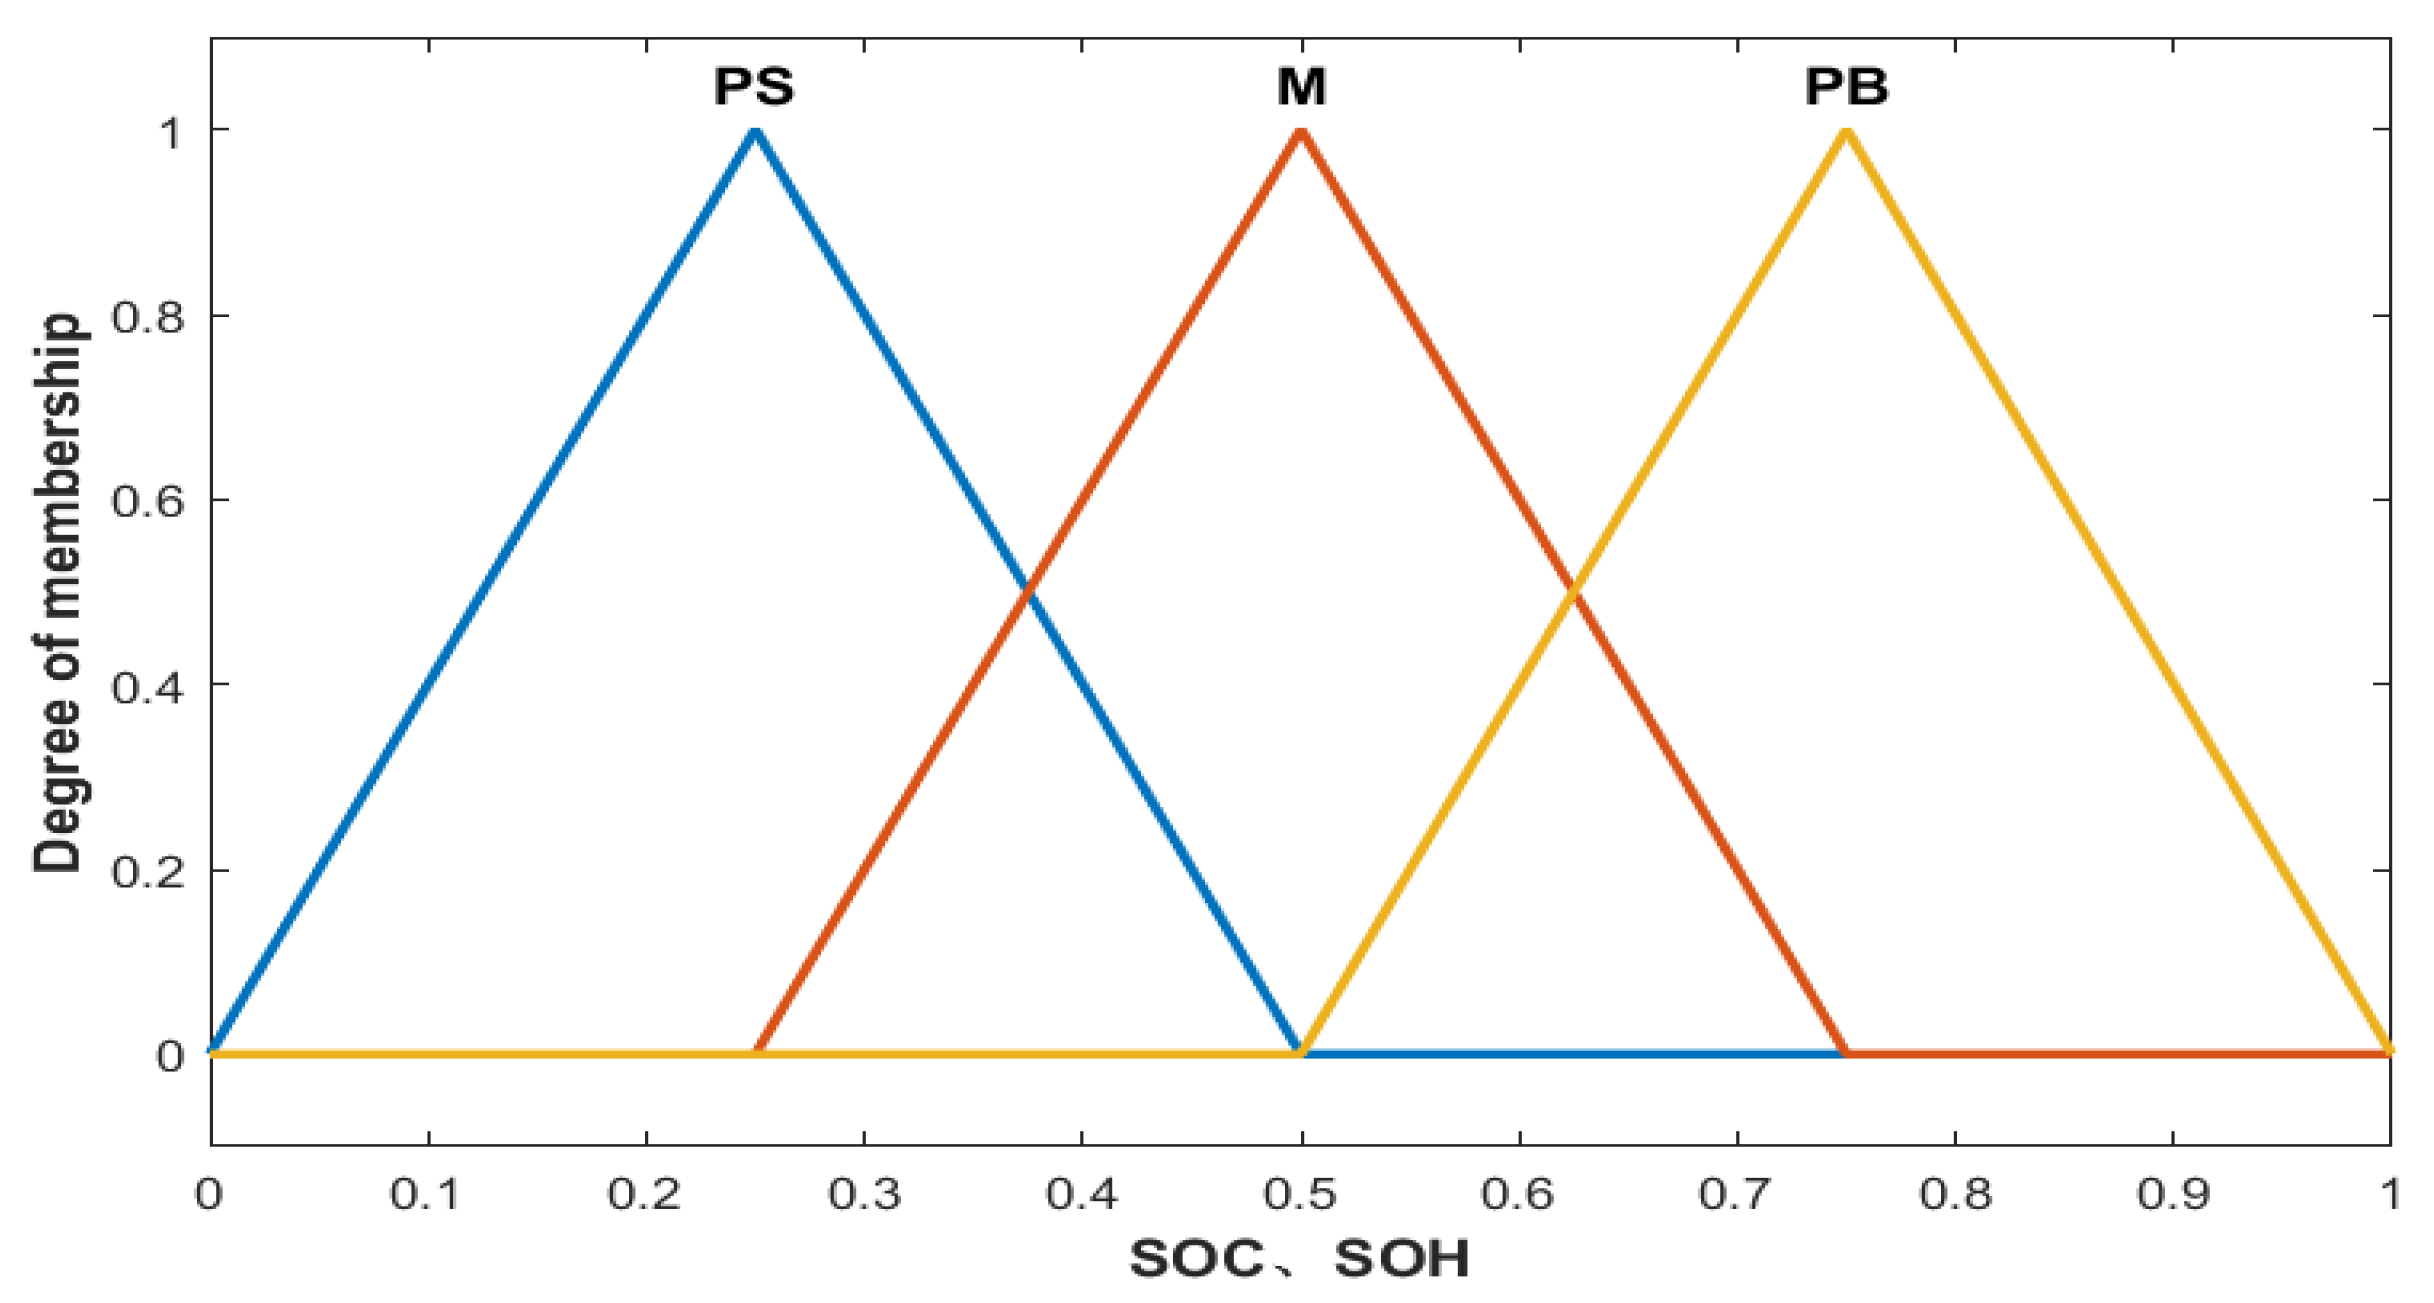
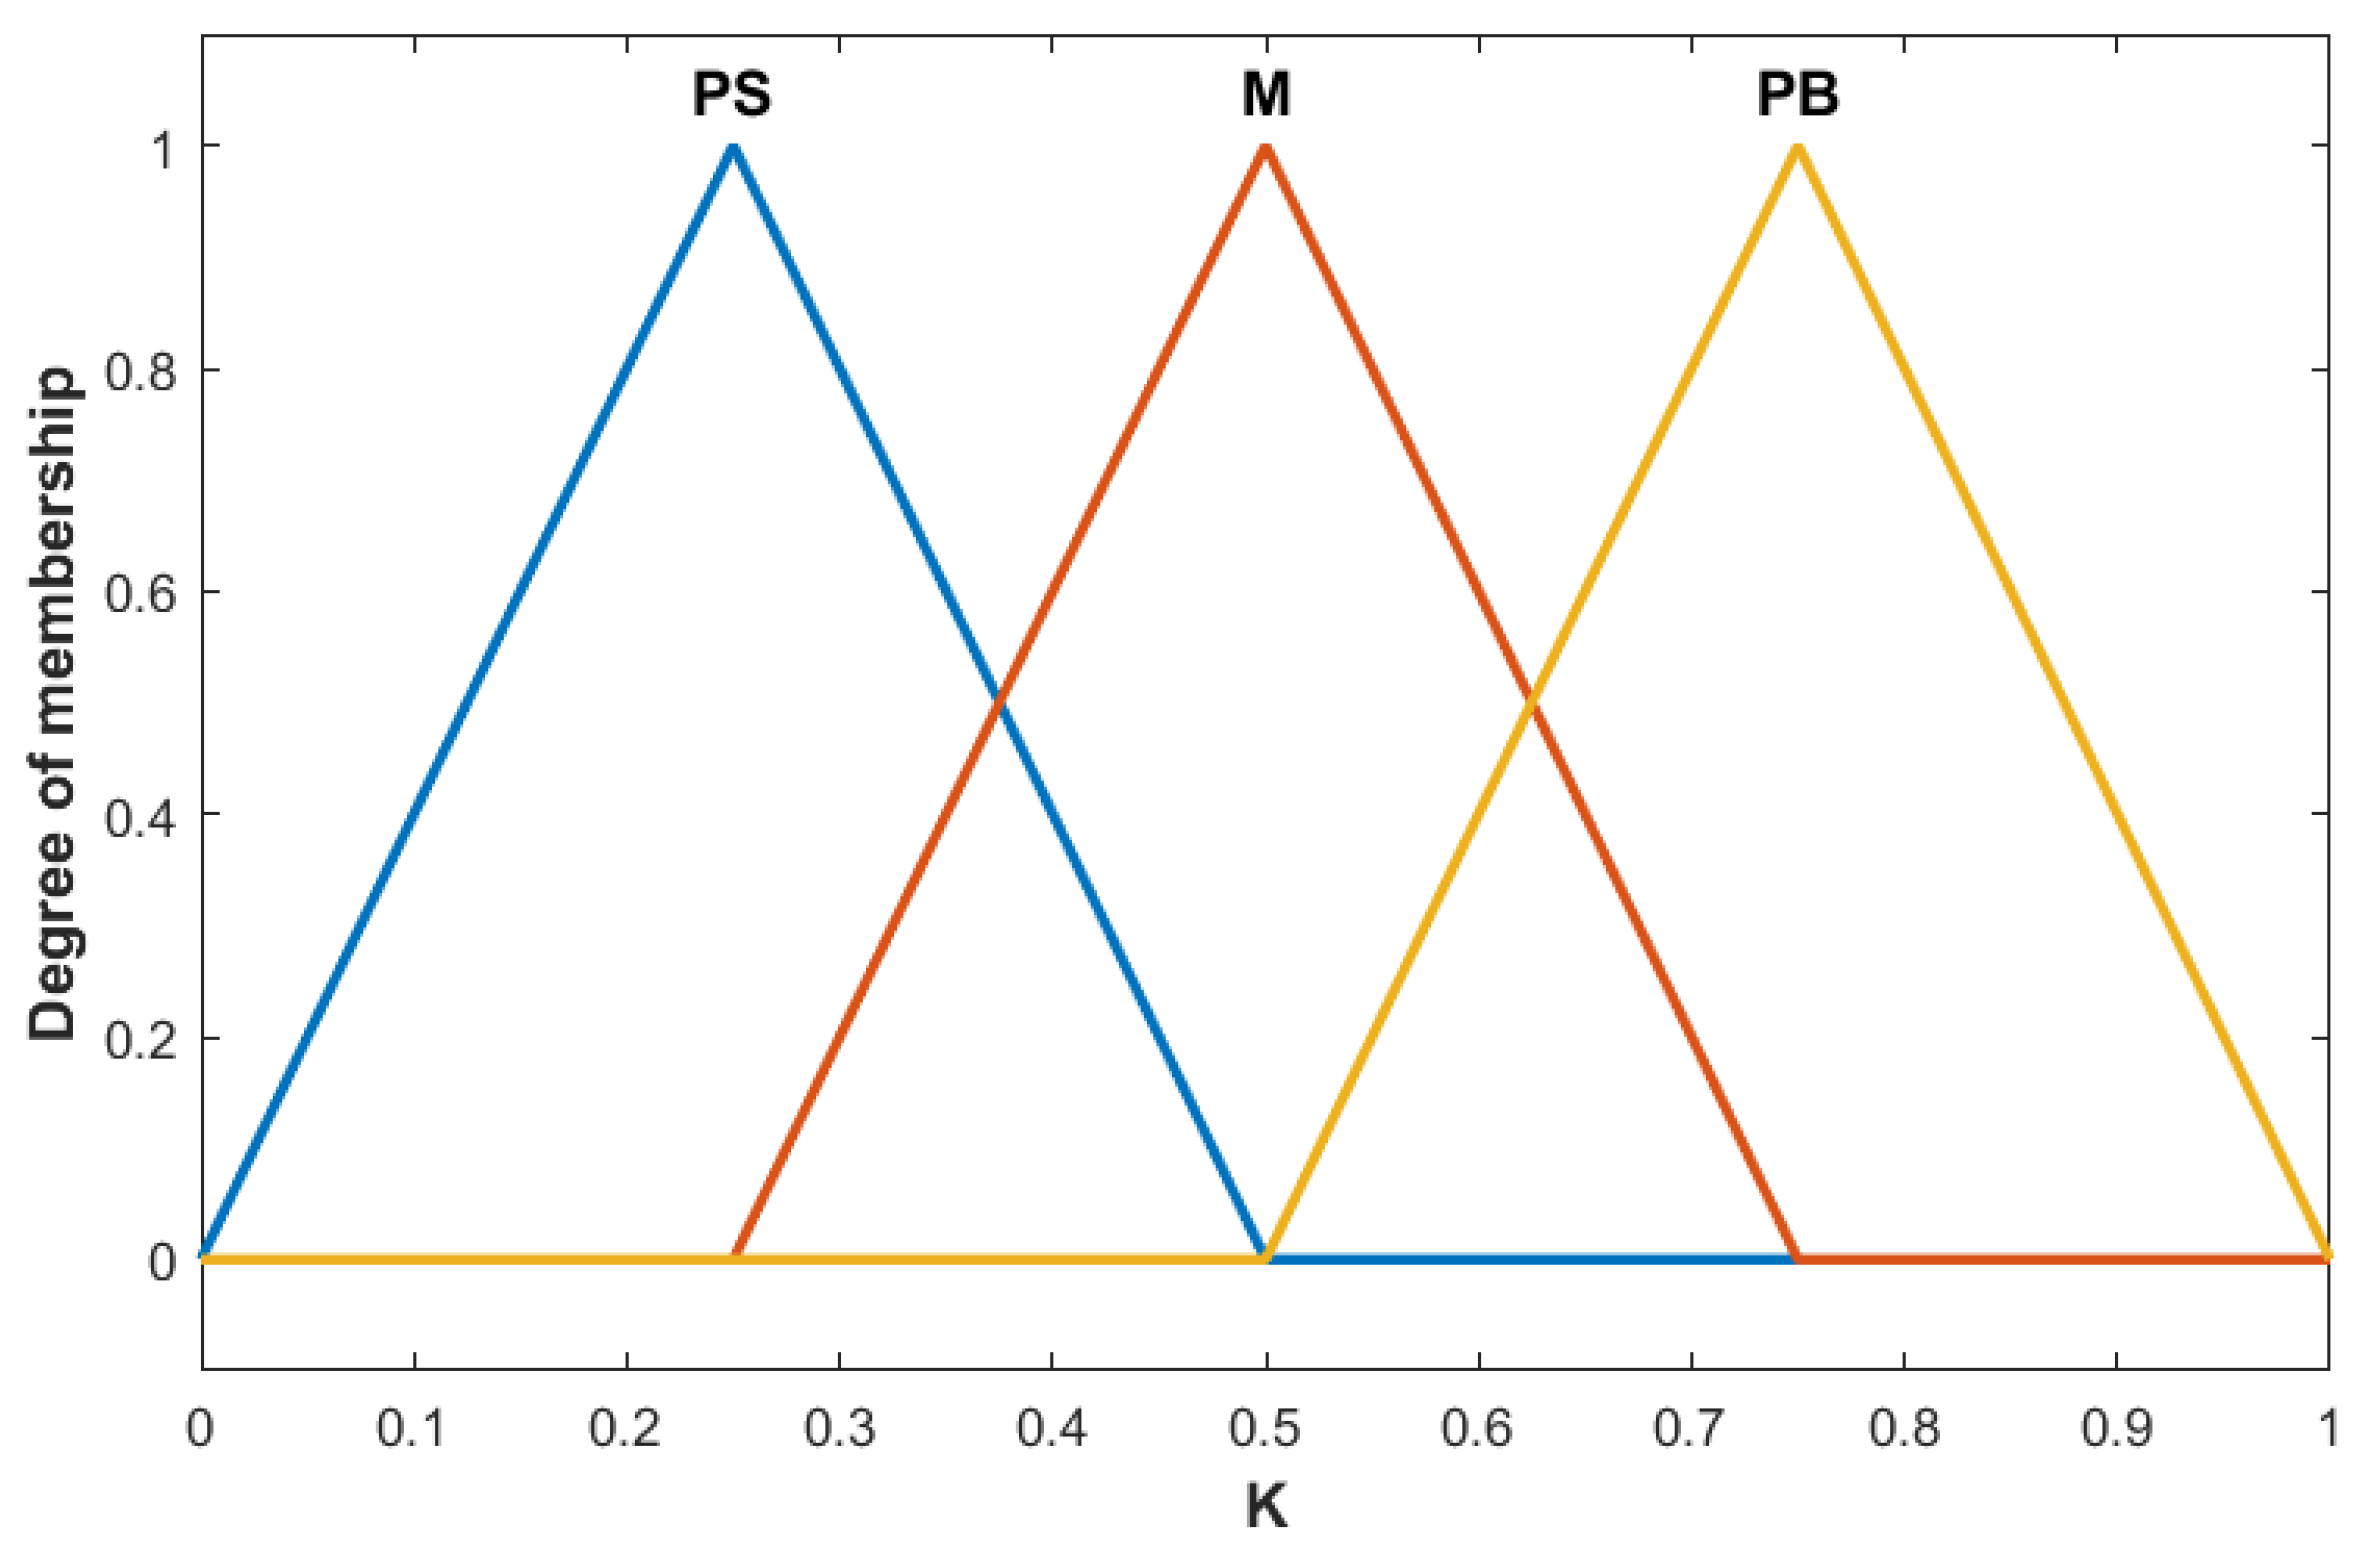
First, the SOC (state of charge) and the SOH (state of health) are used as the input variables for the fuzzy controller, and the power distribution coefficient (K) is the output variable. The domains of both the input and output variables are defined as [0, 1], and each domain is divided into three subsets, namely (PS, M, PB), representing (Positive Small, Positive Medium, Positive Big). The input and output variables both use triangular membership functions, as shown in
Figure 2 and
Figure 3.
3.3. Fuzzy Control Rules
The operation of the system is determined by the differential power within the system, which decides whether the electrolyzer and fuel cell are operating. Based on the differential power, the fuzzy controller is divided into two modules: the PE module and the FC module. The PE module primarily optimizes the power distribution between the lithium battery unit and the electrolyzer unit. Specifically, when Pd > 0, the electrolyzer is activated to produce hydrogen and work alongside the lithium battery to absorb excess power. The FC module optimizes the power distribution between the lithium battery unit and the fuel cell unit. When Pd < 0, the fuel cell is activated to generate power, and it works together with the lithium battery to compensate for the power deficit.
When there is an excess of system differential power, the SOC and SOH are used to optimize the power distribution between the electrolyzer and lithium battery. When the SOH is large and the SOC is small, the SOC is assigned as PS, and the SOH as PB. In this case, the lithium battery takes on more power, and the output distribution factor K is set to PB. Conversely, when the SOC is large and the SOH is small, the SOC is assigned as PB, and the SOH as PS. In this case, the electrolyzer takes on more power, and the output distribution factor K is set to PS. When the SOC is M, the output distribution factor K depends mainly on the SOH. If the SOH is PS, the distribution factor K is PS, meaning the electrolyzer takes on more power to produce hydrogen. If the SOH is PB, the distribution factor K is PB, meaning the lithium battery takes on more power to avoid excessive pressure in the hydrogen storage tank. Similarly, when the SOH is M, the distribution factor depends mainly on the SOC. If the SOC is PS, the distribution factor K is PB, indicating that the lithium battery takes on more power to charge. If the SOC is PB, the distribution factor K is PS, indicating that the lithium battery takes on less power to avoid deep charging. When both the SOC and the SOH are PS, M, or PB, the power is distributed evenly between the electrolyzer and the lithium battery, and the output distribution factor is set to M.
Similarly, when there is a shortage of system differential power, the SOC and the SOH are used to optimize the power distribution between the fuel cell and the lithium battery. When the SOH is large and the SOC is small, the SOC is assigned as PS, and the SOH as PB. In this case, the fuel cell outputs more power, and the output distribution factor K is set to PS. Conversely, when the SOC is large and the SOH is small, the SOC is assigned as PB, and the SOH as PS. In this case, the lithium battery outputs more power, and the output distribution factor K is set to PB. When the SOC is M, the distribution factor K depends mainly on the SOH. If the SOH is PS, the distribution factor K is PB, indicating that the fuel cell will output less power for discharging. If the SOH is PB, the distribution factor K is PS, indicating the fuel cell will output more power for discharging to avoid excessive pressure in the hydrogen storage tank. When the SOH is M, the distribution factor depends mainly on the SOC. If the SOC is PS, the distribution factor K is PS, indicating that the lithium battery unit will take on less power to discharge, preventing excessive discharge. If the SOC is PB, K is PB, indicating that the lithium battery unit will take on more power to discharge, preventing overcharging. When both the SOC and the SOH are PS, M, or PB, the power is distributed evenly between the fuel cell and the lithium battery, and the output distribution factor is set to M. The fuzzy control rules are summarized in the
Table 1 and
Table 2 below:
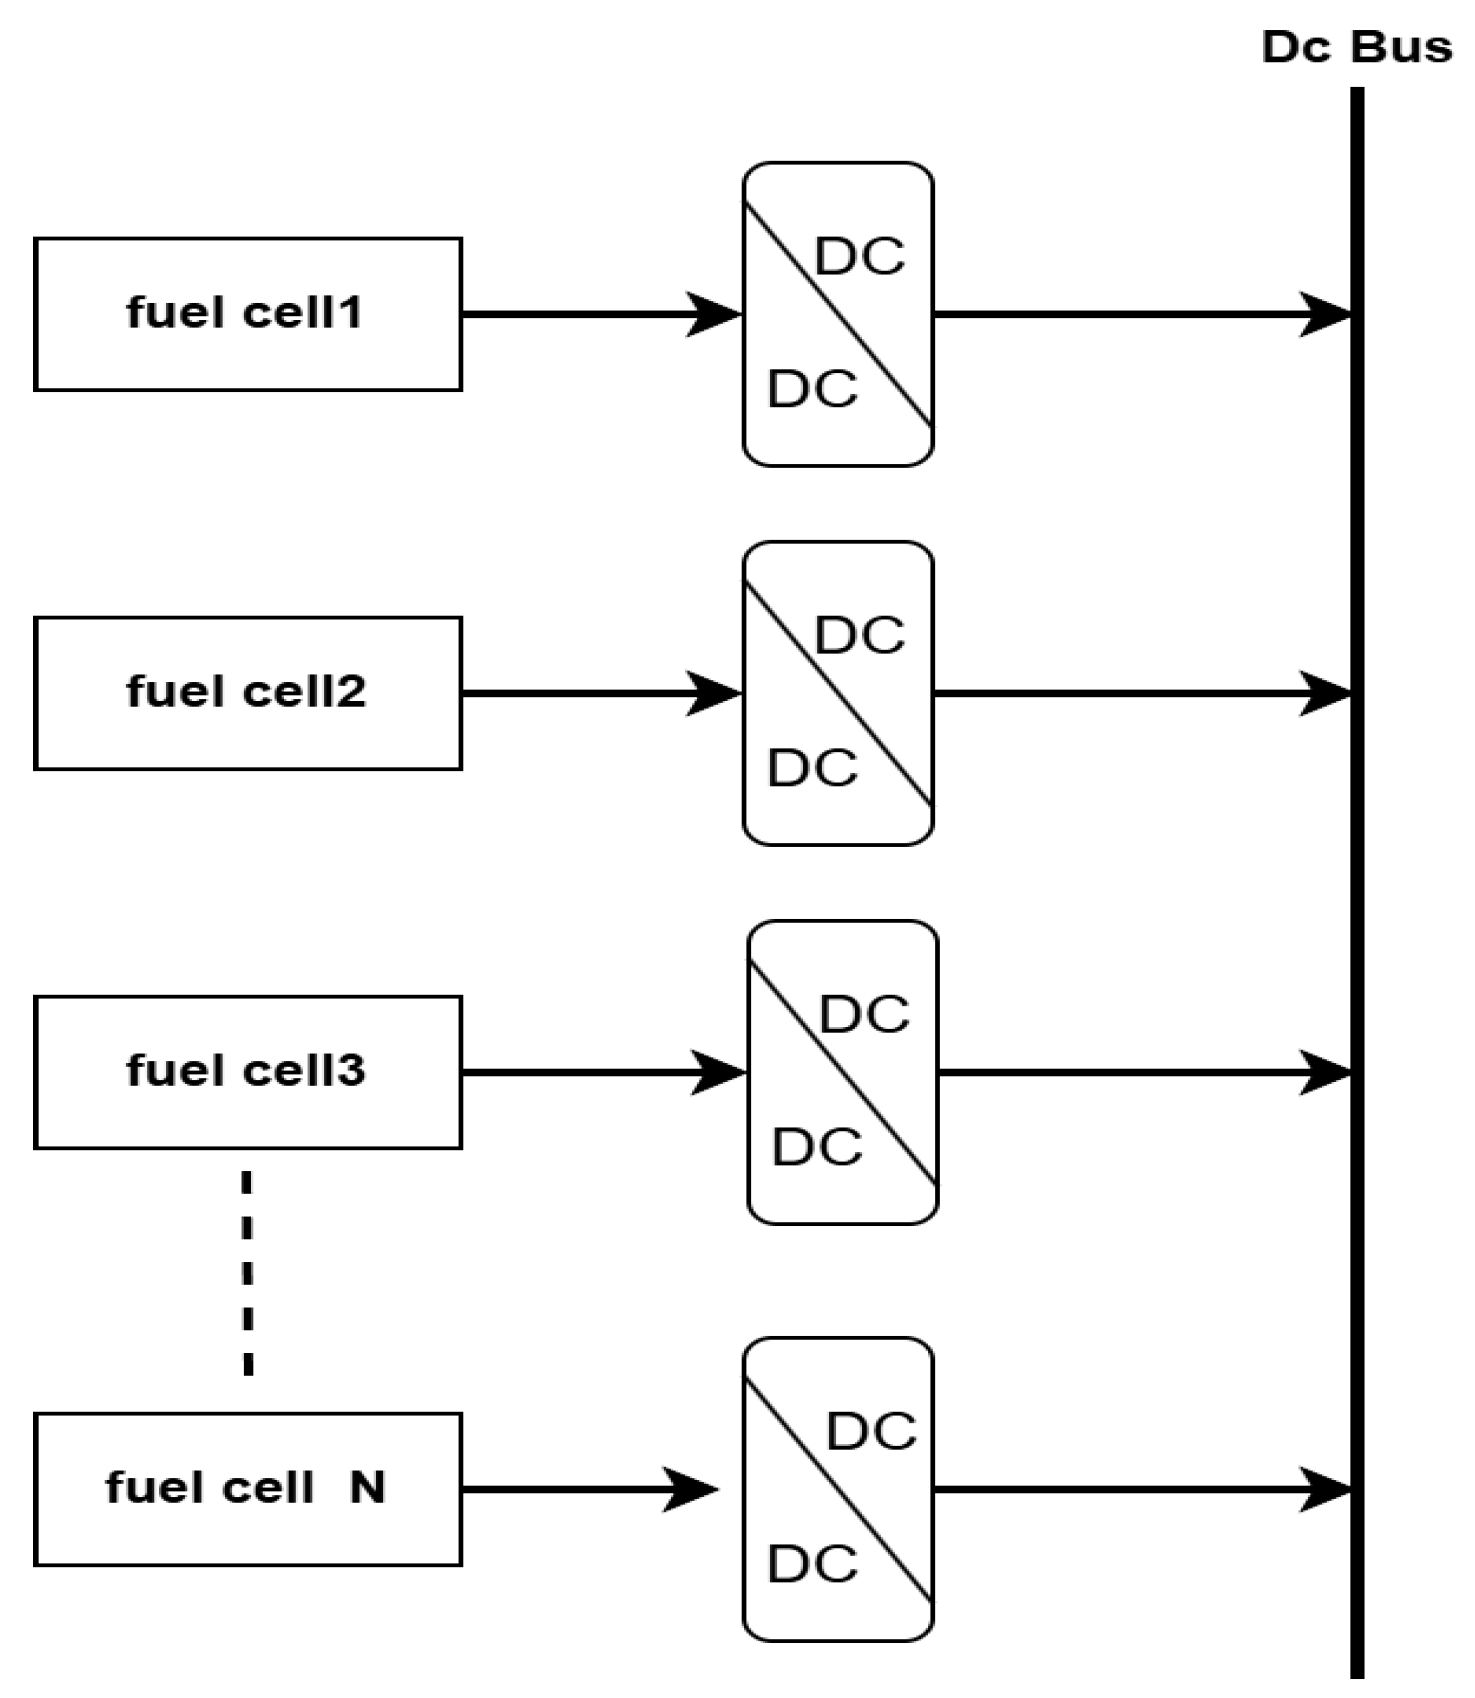
3.4. Multi-Stack Fuel Cell System
Compared to single-stack fuel cells, multi-stack fuel cells offer higher reliability and stability. Due to their redundant design, the system can continue to operate even if one of the stacks fails [
18,
19,
20]. Additionally, the power distribution among the stacks is flexible, optimizing the power of each stack to achieve higher overall efficiency and longer system lifespan [
21,
22]. These features make multi-stack fuel cells an ideal solution for green energy applications, offering both flexibility and high efficiency. The structural diagram of the multi-stack fuel cell system is shown in
Figure 4.
3.5. Multi-Stack Fuel Cell Power Distribution Strategy
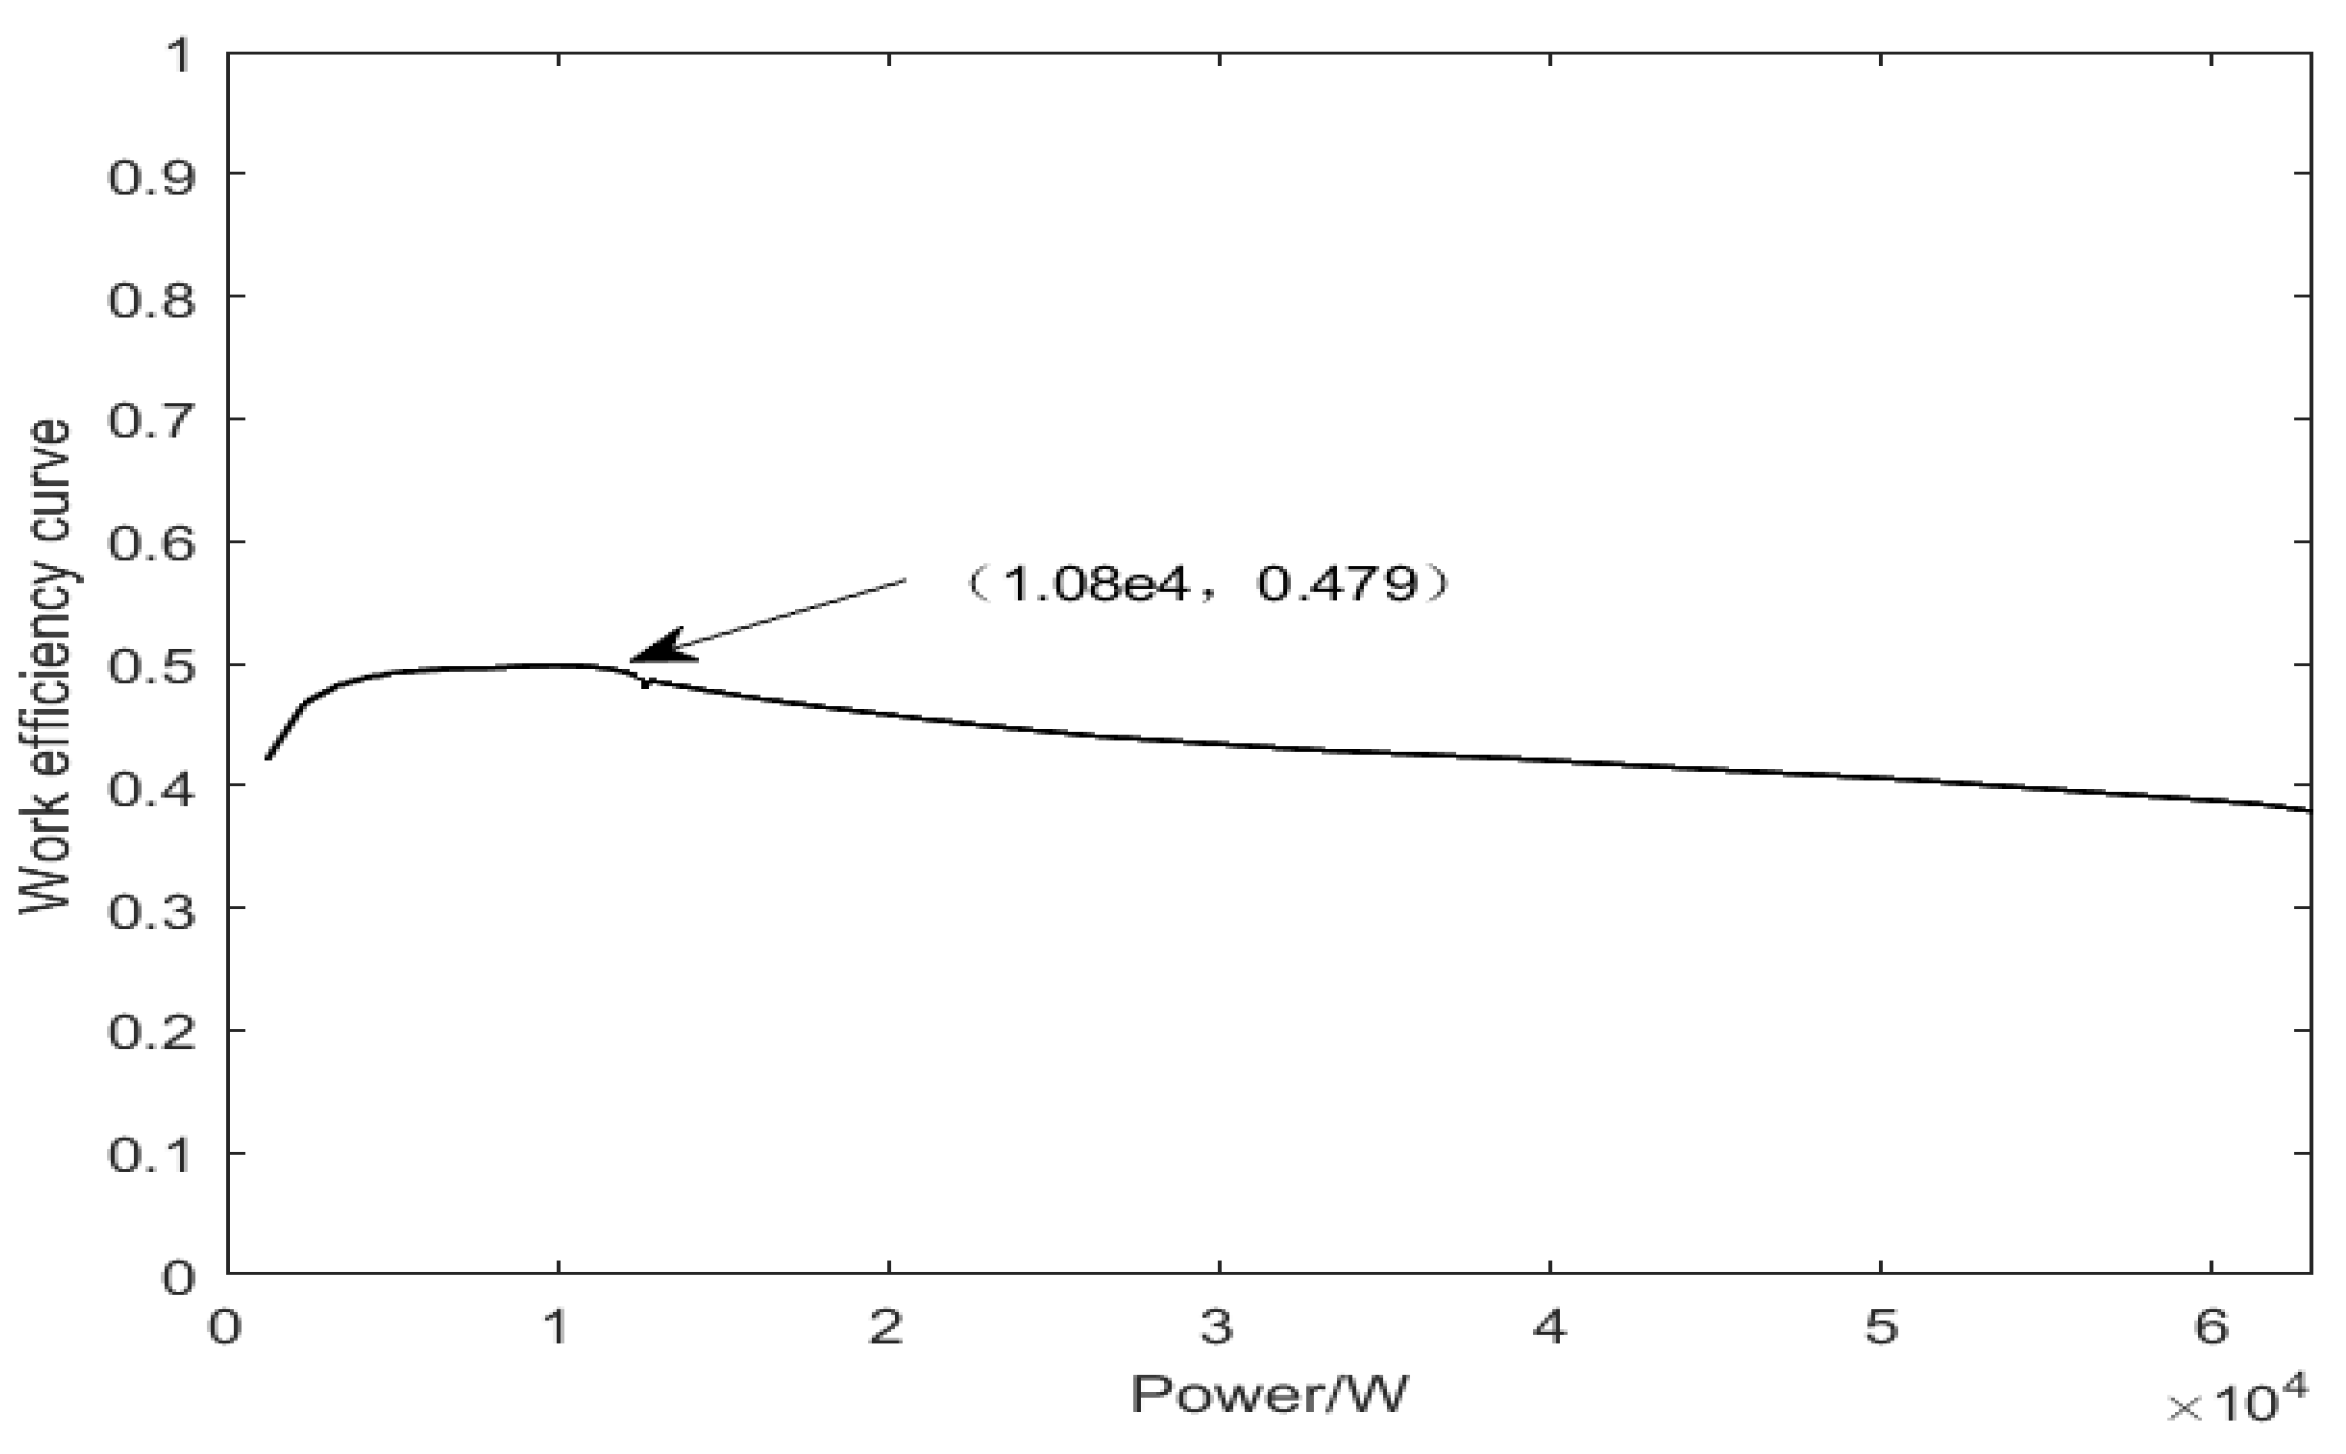
By constructing a fuel cell model, the working characteristics of the fuel cell are analyzed, and the working efficiency of the fuel cell is calculated [
23,
24,
25]:
In the equation, is the fuel cell stack conversion efficiency; is the fuel utilization efficiency of the fuel cell; is the fuel cell stack voltage; is the auxiliary machine efficiency.
The calculated analysis of the above data is shown in
Figure 5.
From the simulation results shown in the above figure, it can be seen that the optimal working efficiency point for the fuel cell occurs at 1.08 × 10⁴ W, with a corresponding efficiency of 0.479. Therefore, each fuel cell is set to 10 kW to ensure that it operates at its optimal efficiency point. The stacks in hydrogen equipment (such as electrolyzers and fuel cell stacks) may experience performance degradation over long-term operation. The control system must ensure that the stacks operate at their optimal efficiency point and undergo regular maintenance to extend their service life.
4. System Coordinated Control Strategy
4.1. Operational Condition Classification
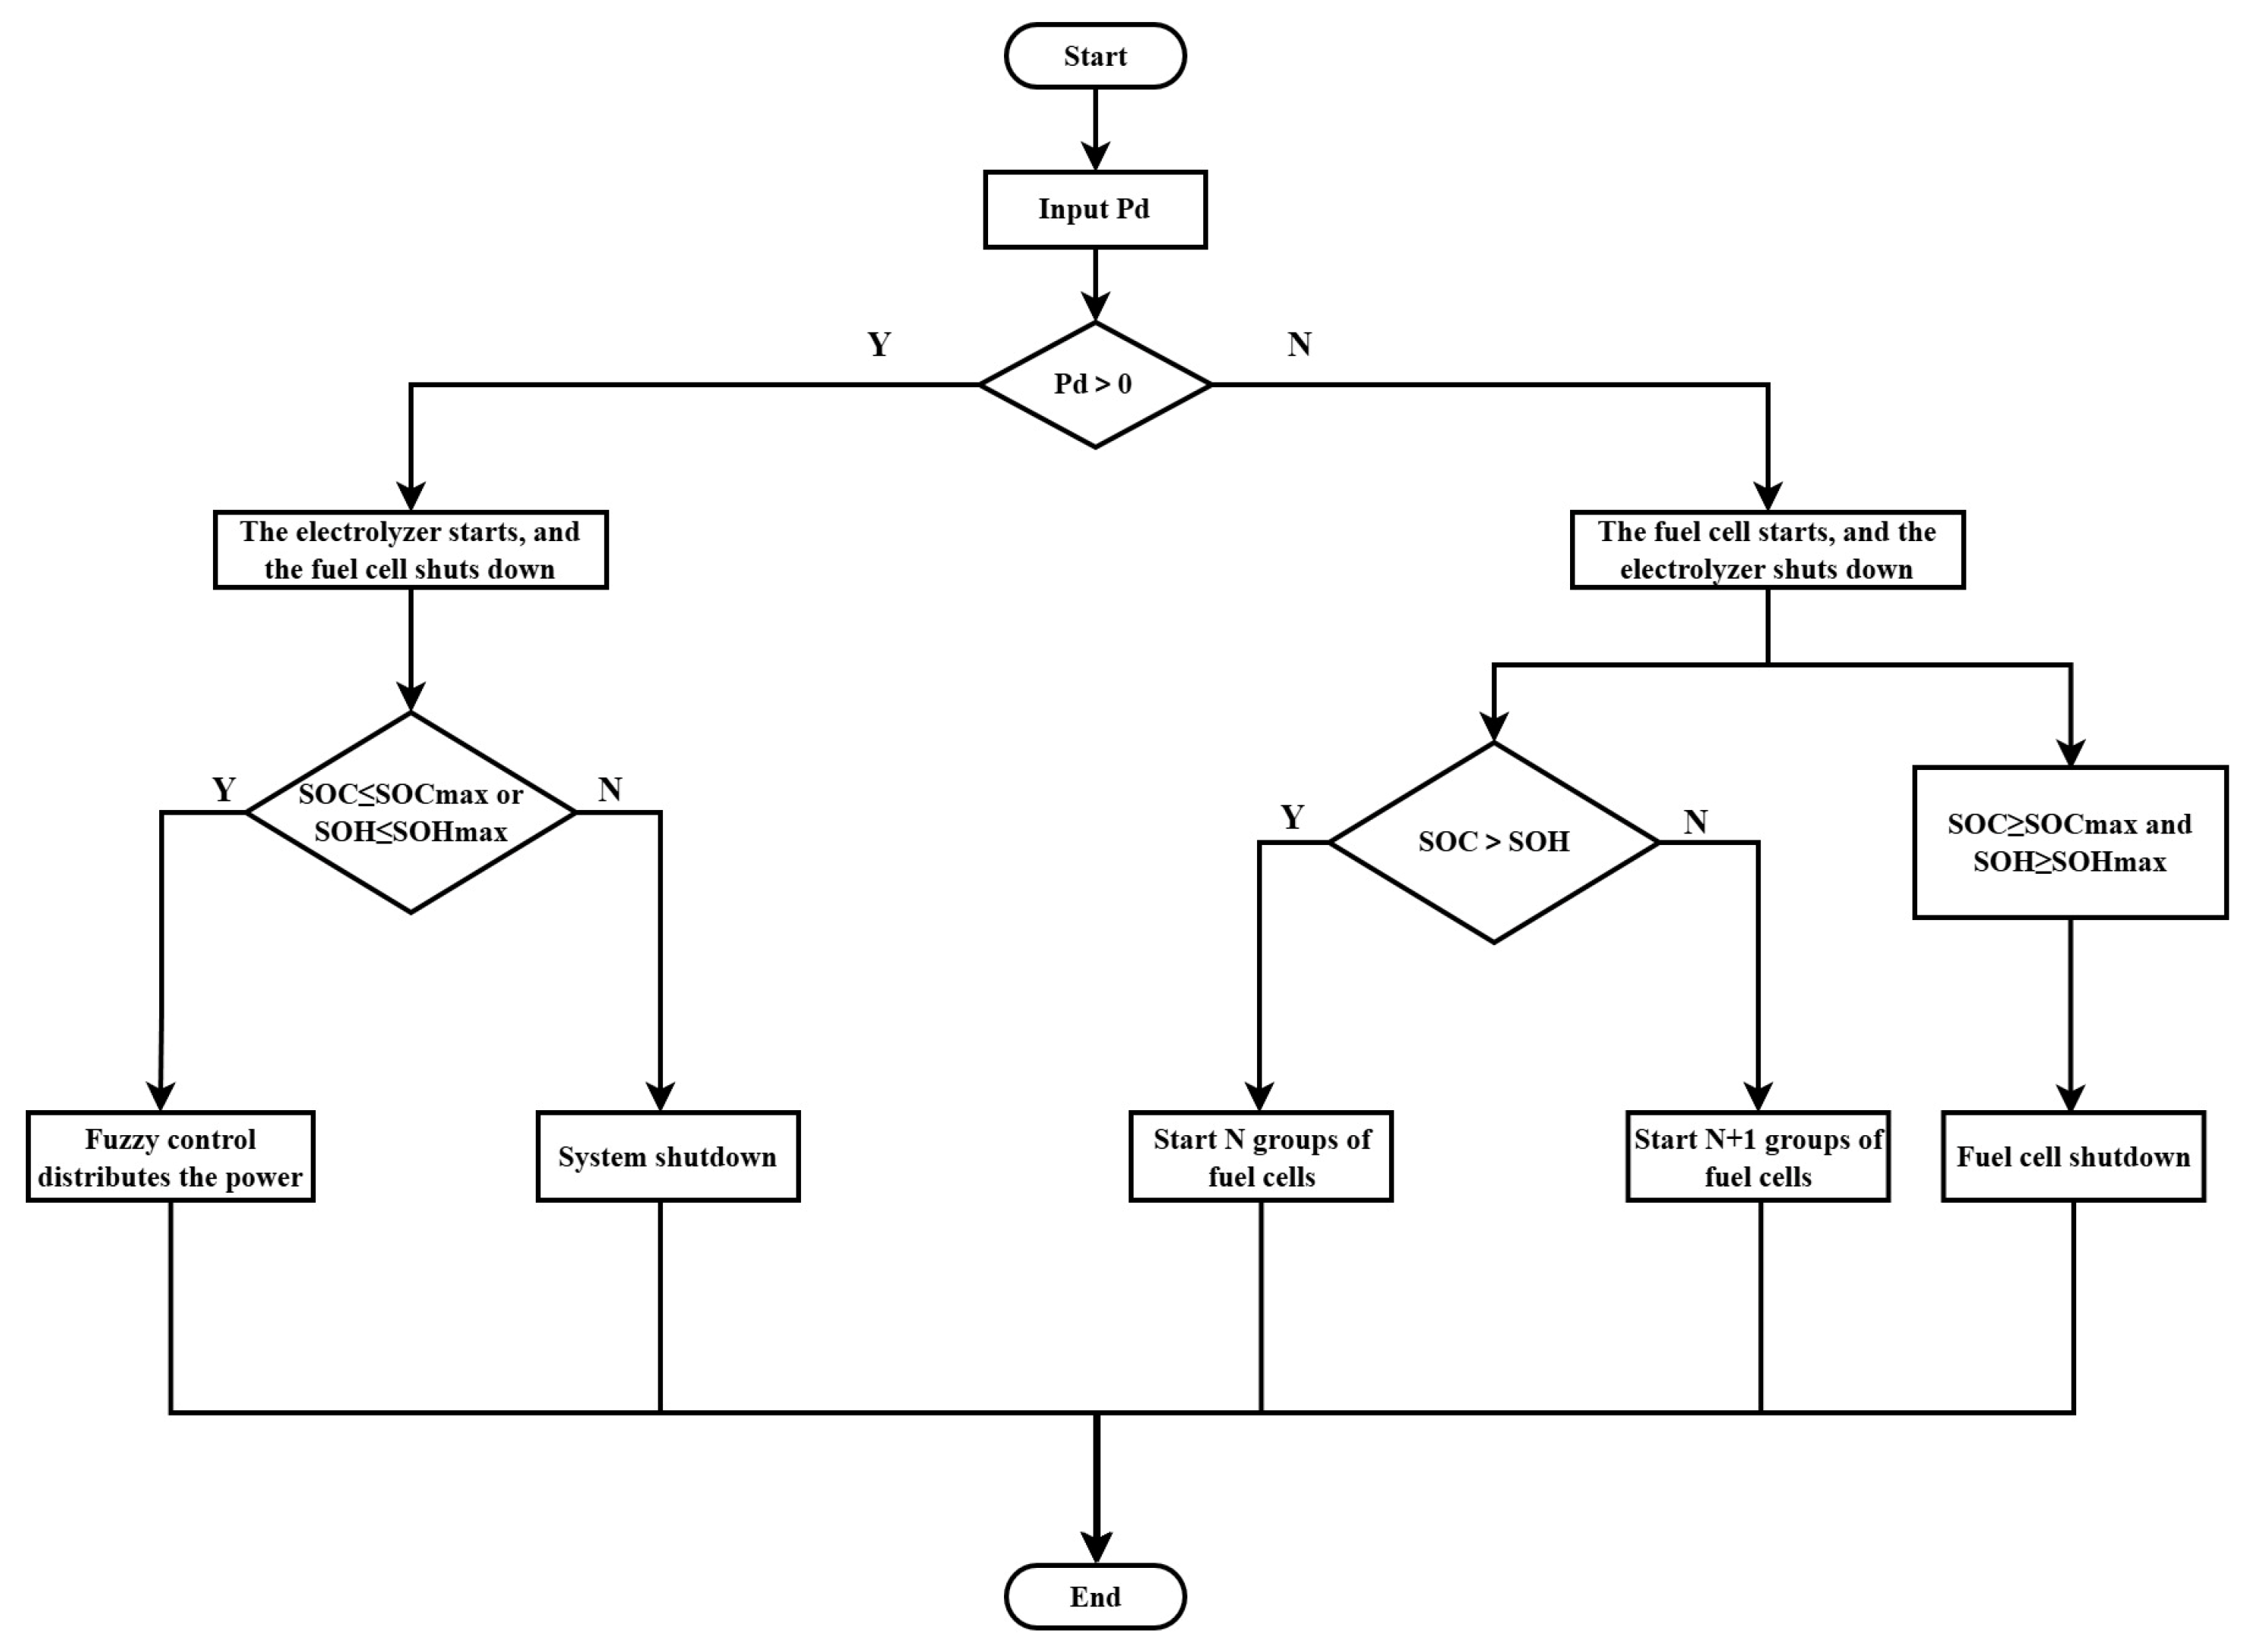
State 1: Pd > 0; the SOC and the SOH are within reasonable ranges; the electrolyzer starts while the fuel cell is shut down, and the power of the electrolyzer and the lithium battery is distributed using fuzzy control.
State 2: Pd > 0; the SOH and the SOC are high, and the system is shut down.
State 3: Pd < 0; the SOH ≥ the SOC; the fuel cell starts, and the electrolyzer shuts down. The fuel cell power is initially distributed using fuzzy control, followed by analysis to select N+1 groups of fuel cells operating at their highest efficiency points.
State 4: Pd < 0; the SOH < the SOC; the fuel cell starts, and the electrolyzer shuts down. The fuel cell power is initially distributed using fuzzy control, followed by analysis to select N groups of fuel cells operating at their highest efficiency points.
State 5: Pd < 0; the SOH and the SOC are relatively high; the fuel cell shuts down, and the lithium battery supplies all the deficit power.
4.2. System Regulation Control Strategy Flowchart
Based on the analysis of the above operating conditions, the specific flowchart of the system control strategy is shown in
Figure 6.
5. Simulation Results Analysis
5.1. Simulation Within the Normal Range
To validate the proposed control strategy, it is assumed that the variations in key variables, such as hydrogen pressure and temperature, have a minimal impact on system performance, and thus, their effects are simplified. It is assumed that hydrogen is maintained within a stable operating pressure range during both storage and release, and the influence of pressure fluctuations caused by gas compression or expansion on system performance is ignored. It is assumed that temperature variations during hydrogen storage and use are negligible, and the effect of temperature on hydrogen density and storage capacity is not considered. Set SOC = 0.4; SOH = 0.5; and the other parameters are as shown in
Table 3:
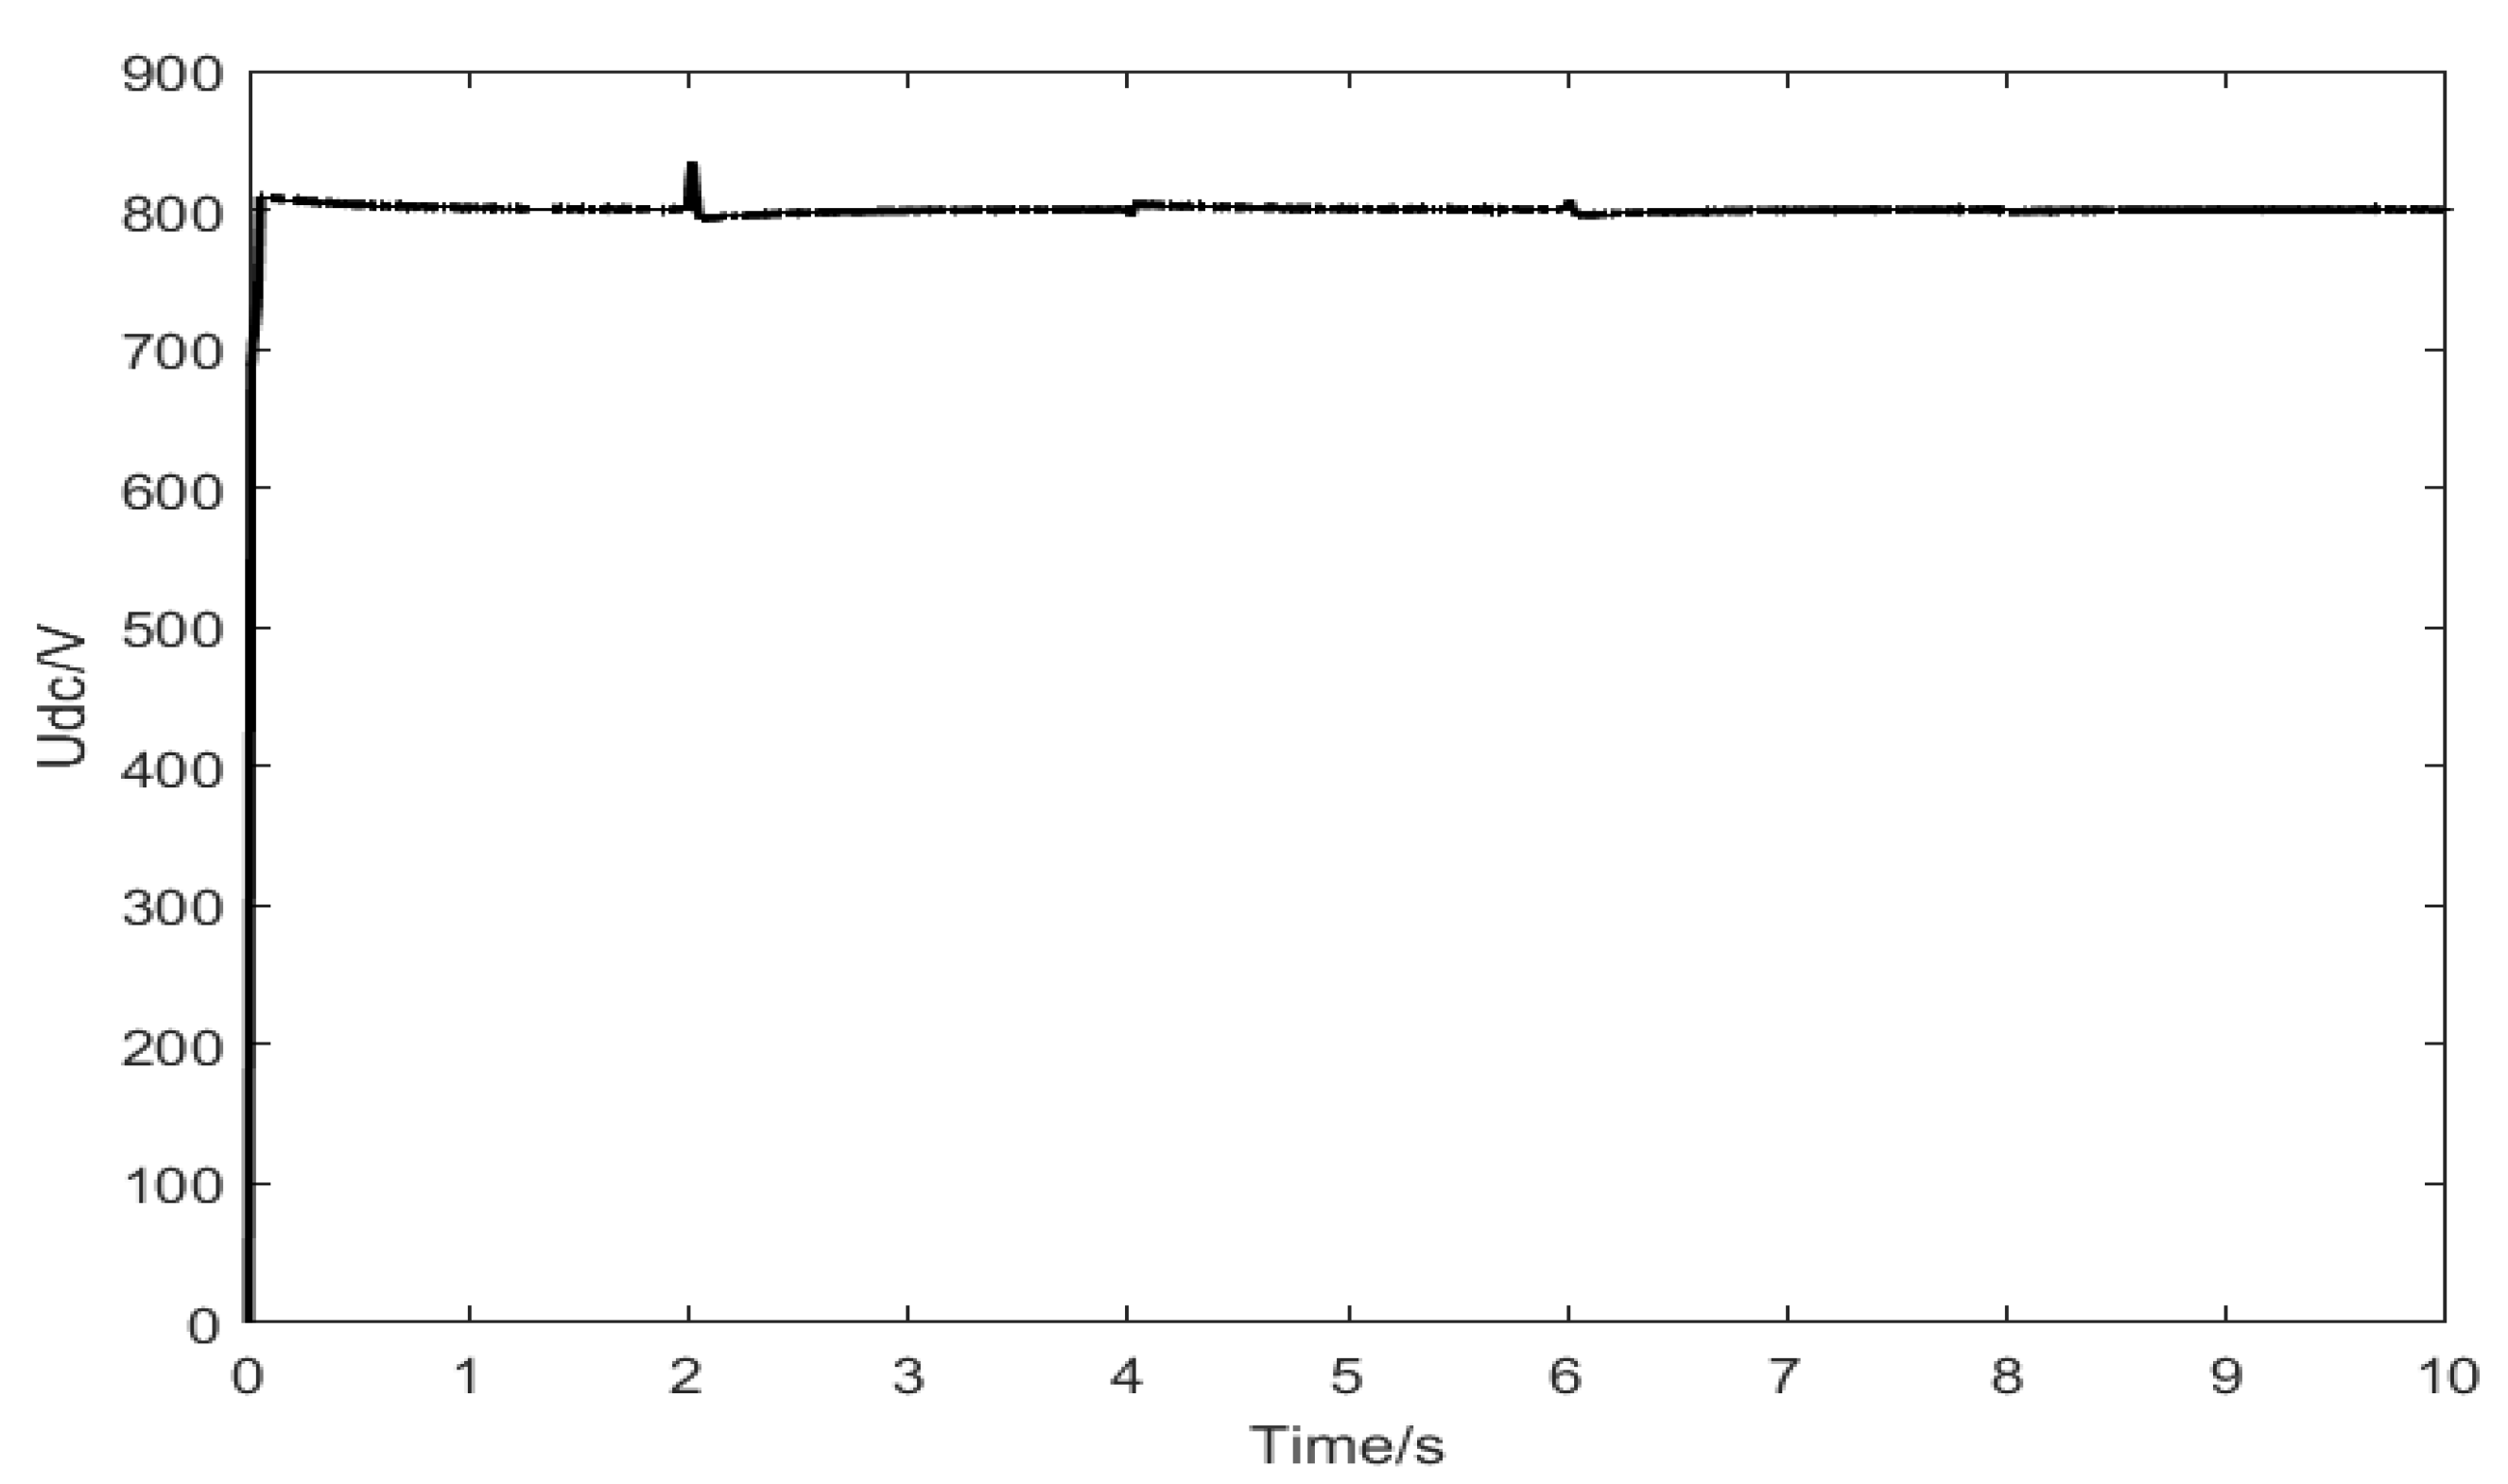
The simulation analysis was conducted, ensuring that the system’s DC bus remains stable, with voltage fluctuations maintained within ±5%. The DC bus voltage is shown in
Figure 7:
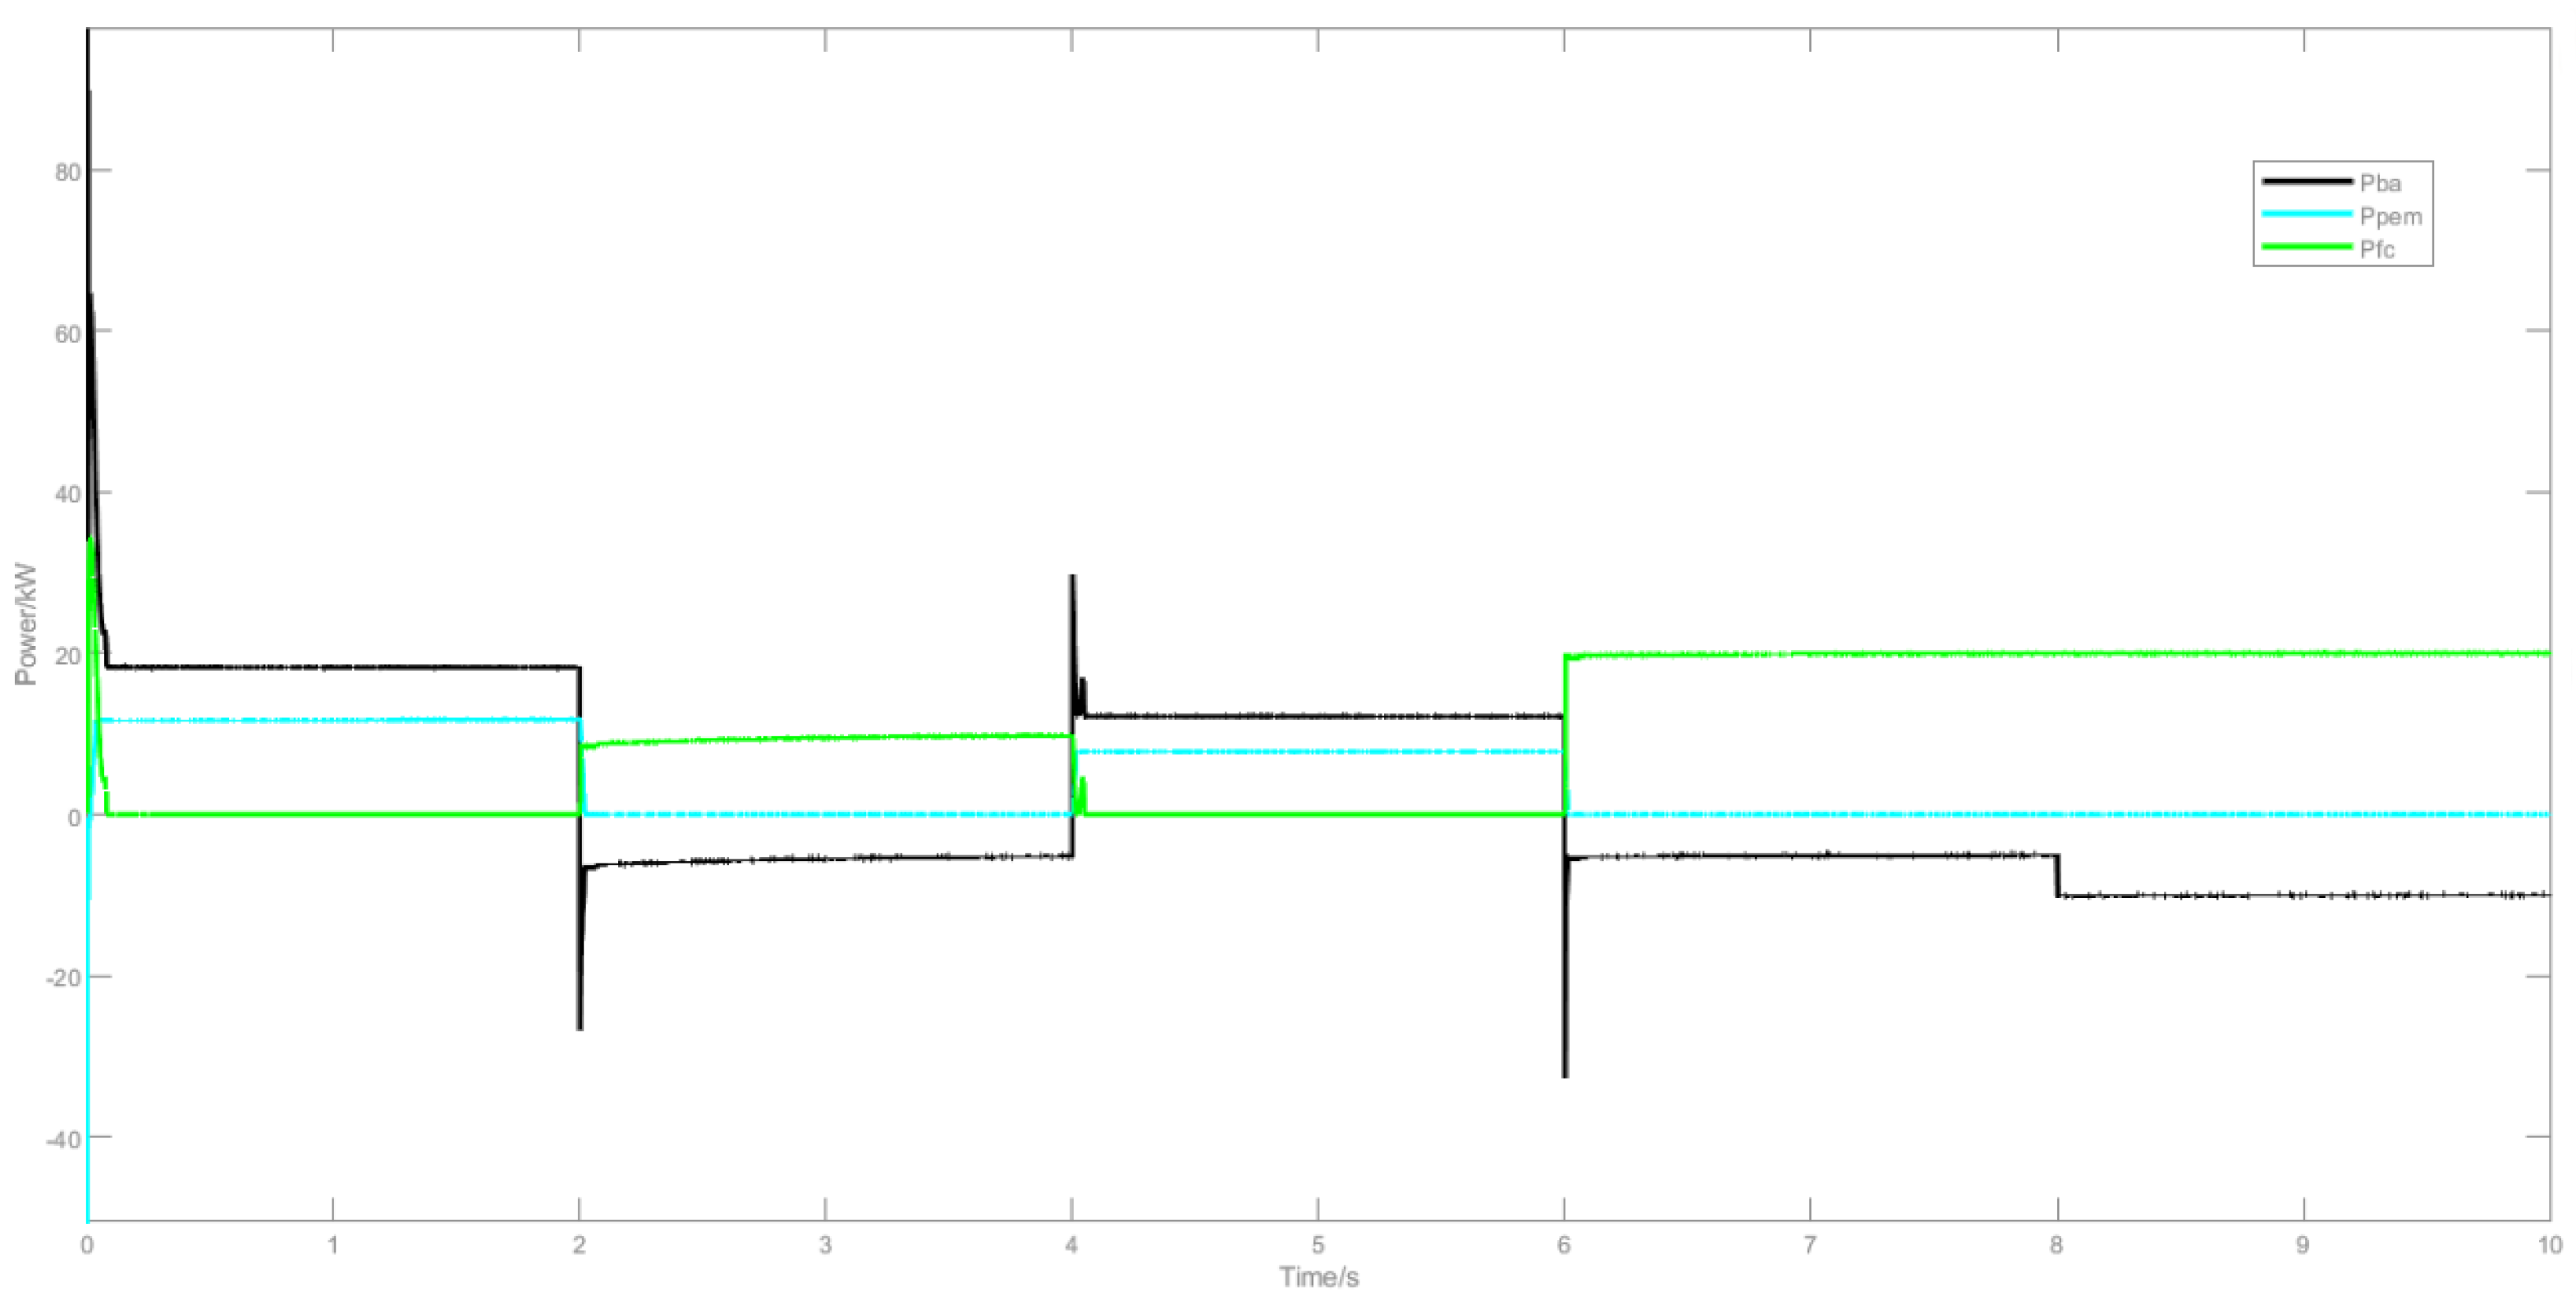
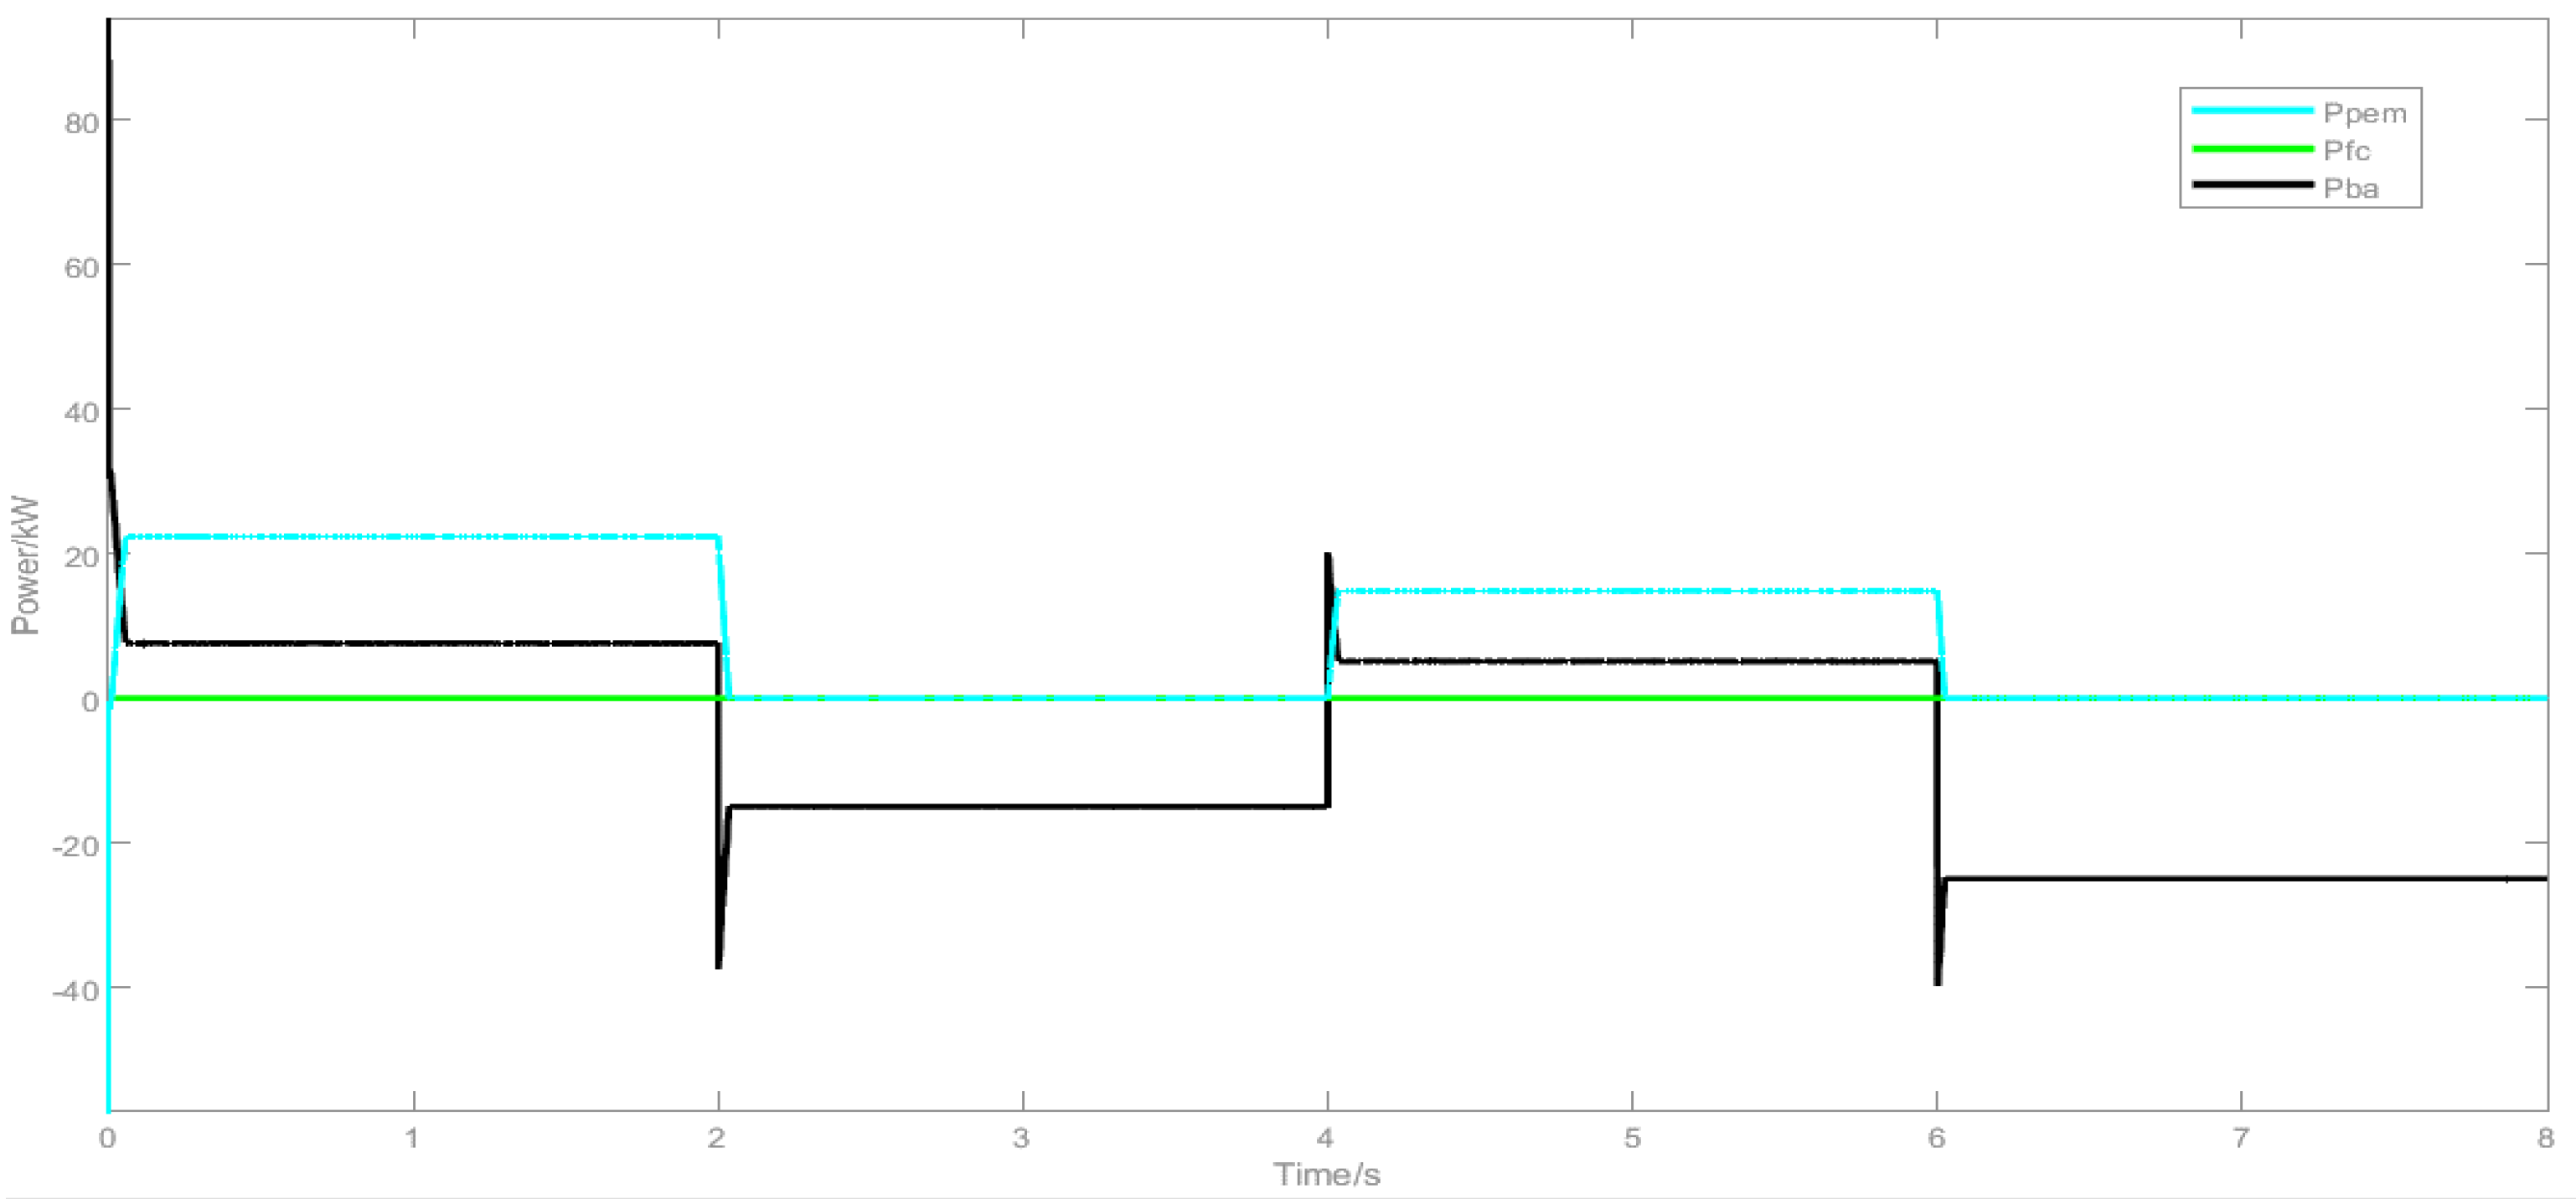
According to
Figure 8 and
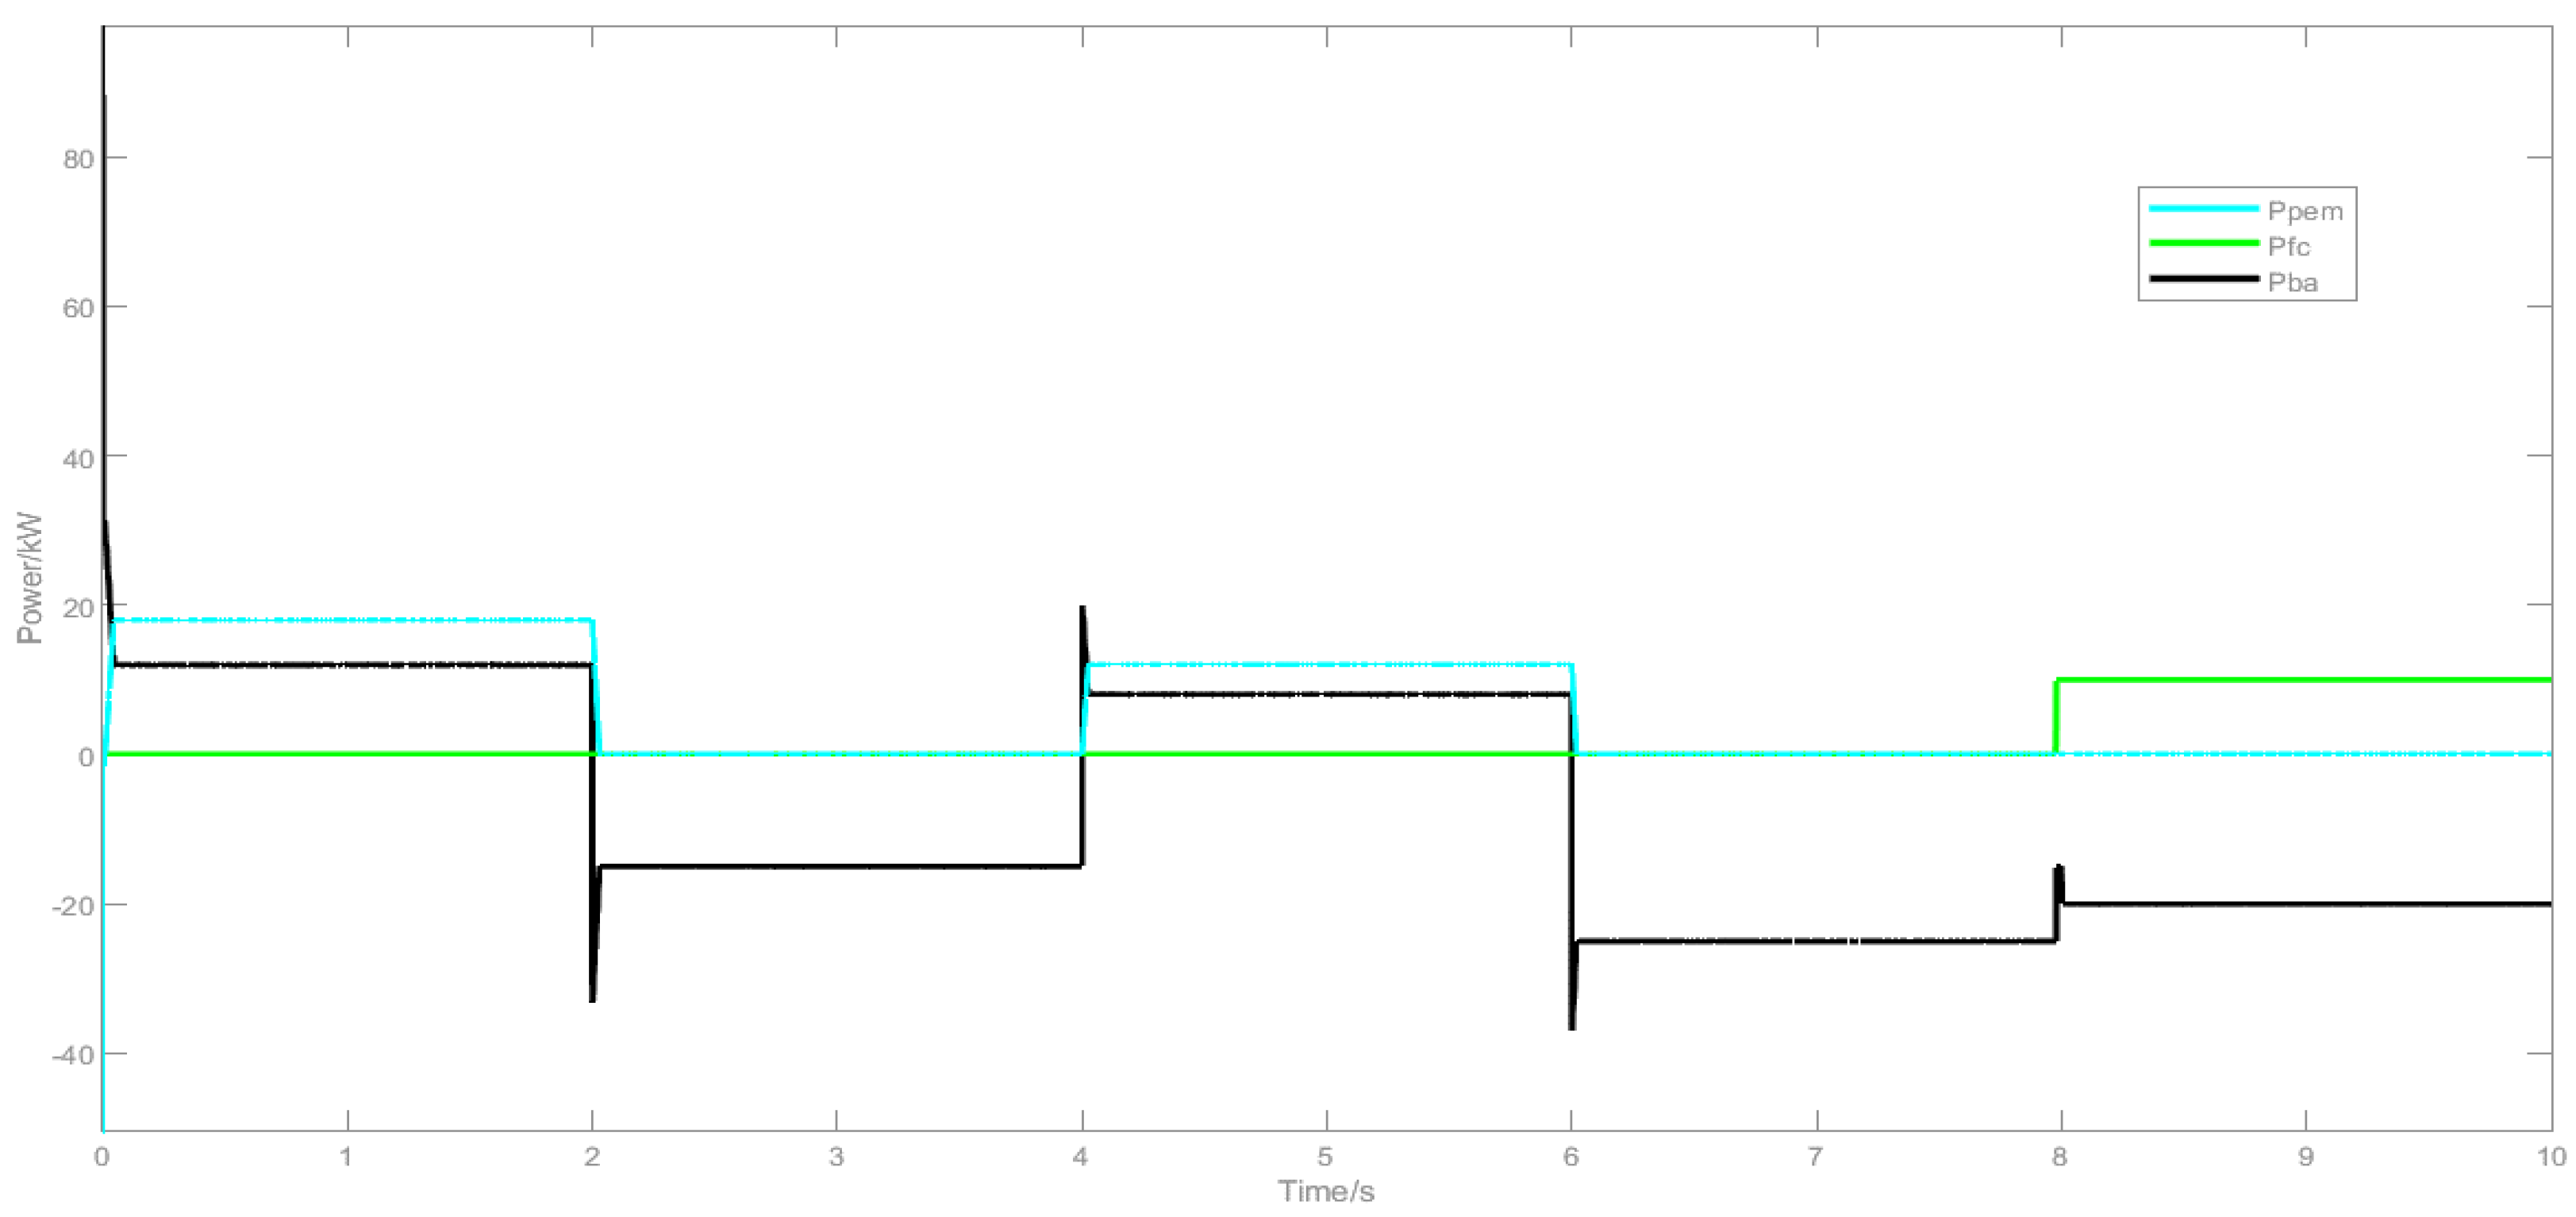
Figure 9, from 0 to 2 s, the system operates in State 1. Since the SOC < the SOH, the power allocated to the lithium battery through fuzzy control is higher than that of the electrolyzer. From 2 to 4 s, the system operates in State 3, with a power shortage. Both the fuel cell and lithium battery provide power, and the fuzzy control allocates 9 kW of power to the fuel cell. At this point, N+1 fuel cell stacks are activated, which corresponds to one fuel cell stack. From 4 to 6 s, the system returns to Condition 1, where the power allocated to the lithium battery is higher than that of the electrolyzer. From 6 to 10 s, the system switches back to State 3, and N+1 fuel cell stacks are activated, corresponding to two fuel cell stacks. During the periods from 6 to 8 s and 8 to 10 s, the fuzzy control allocates fuel cell power of 15 kW and 18 kW, respectively, thus starting two fuel cell stacks.
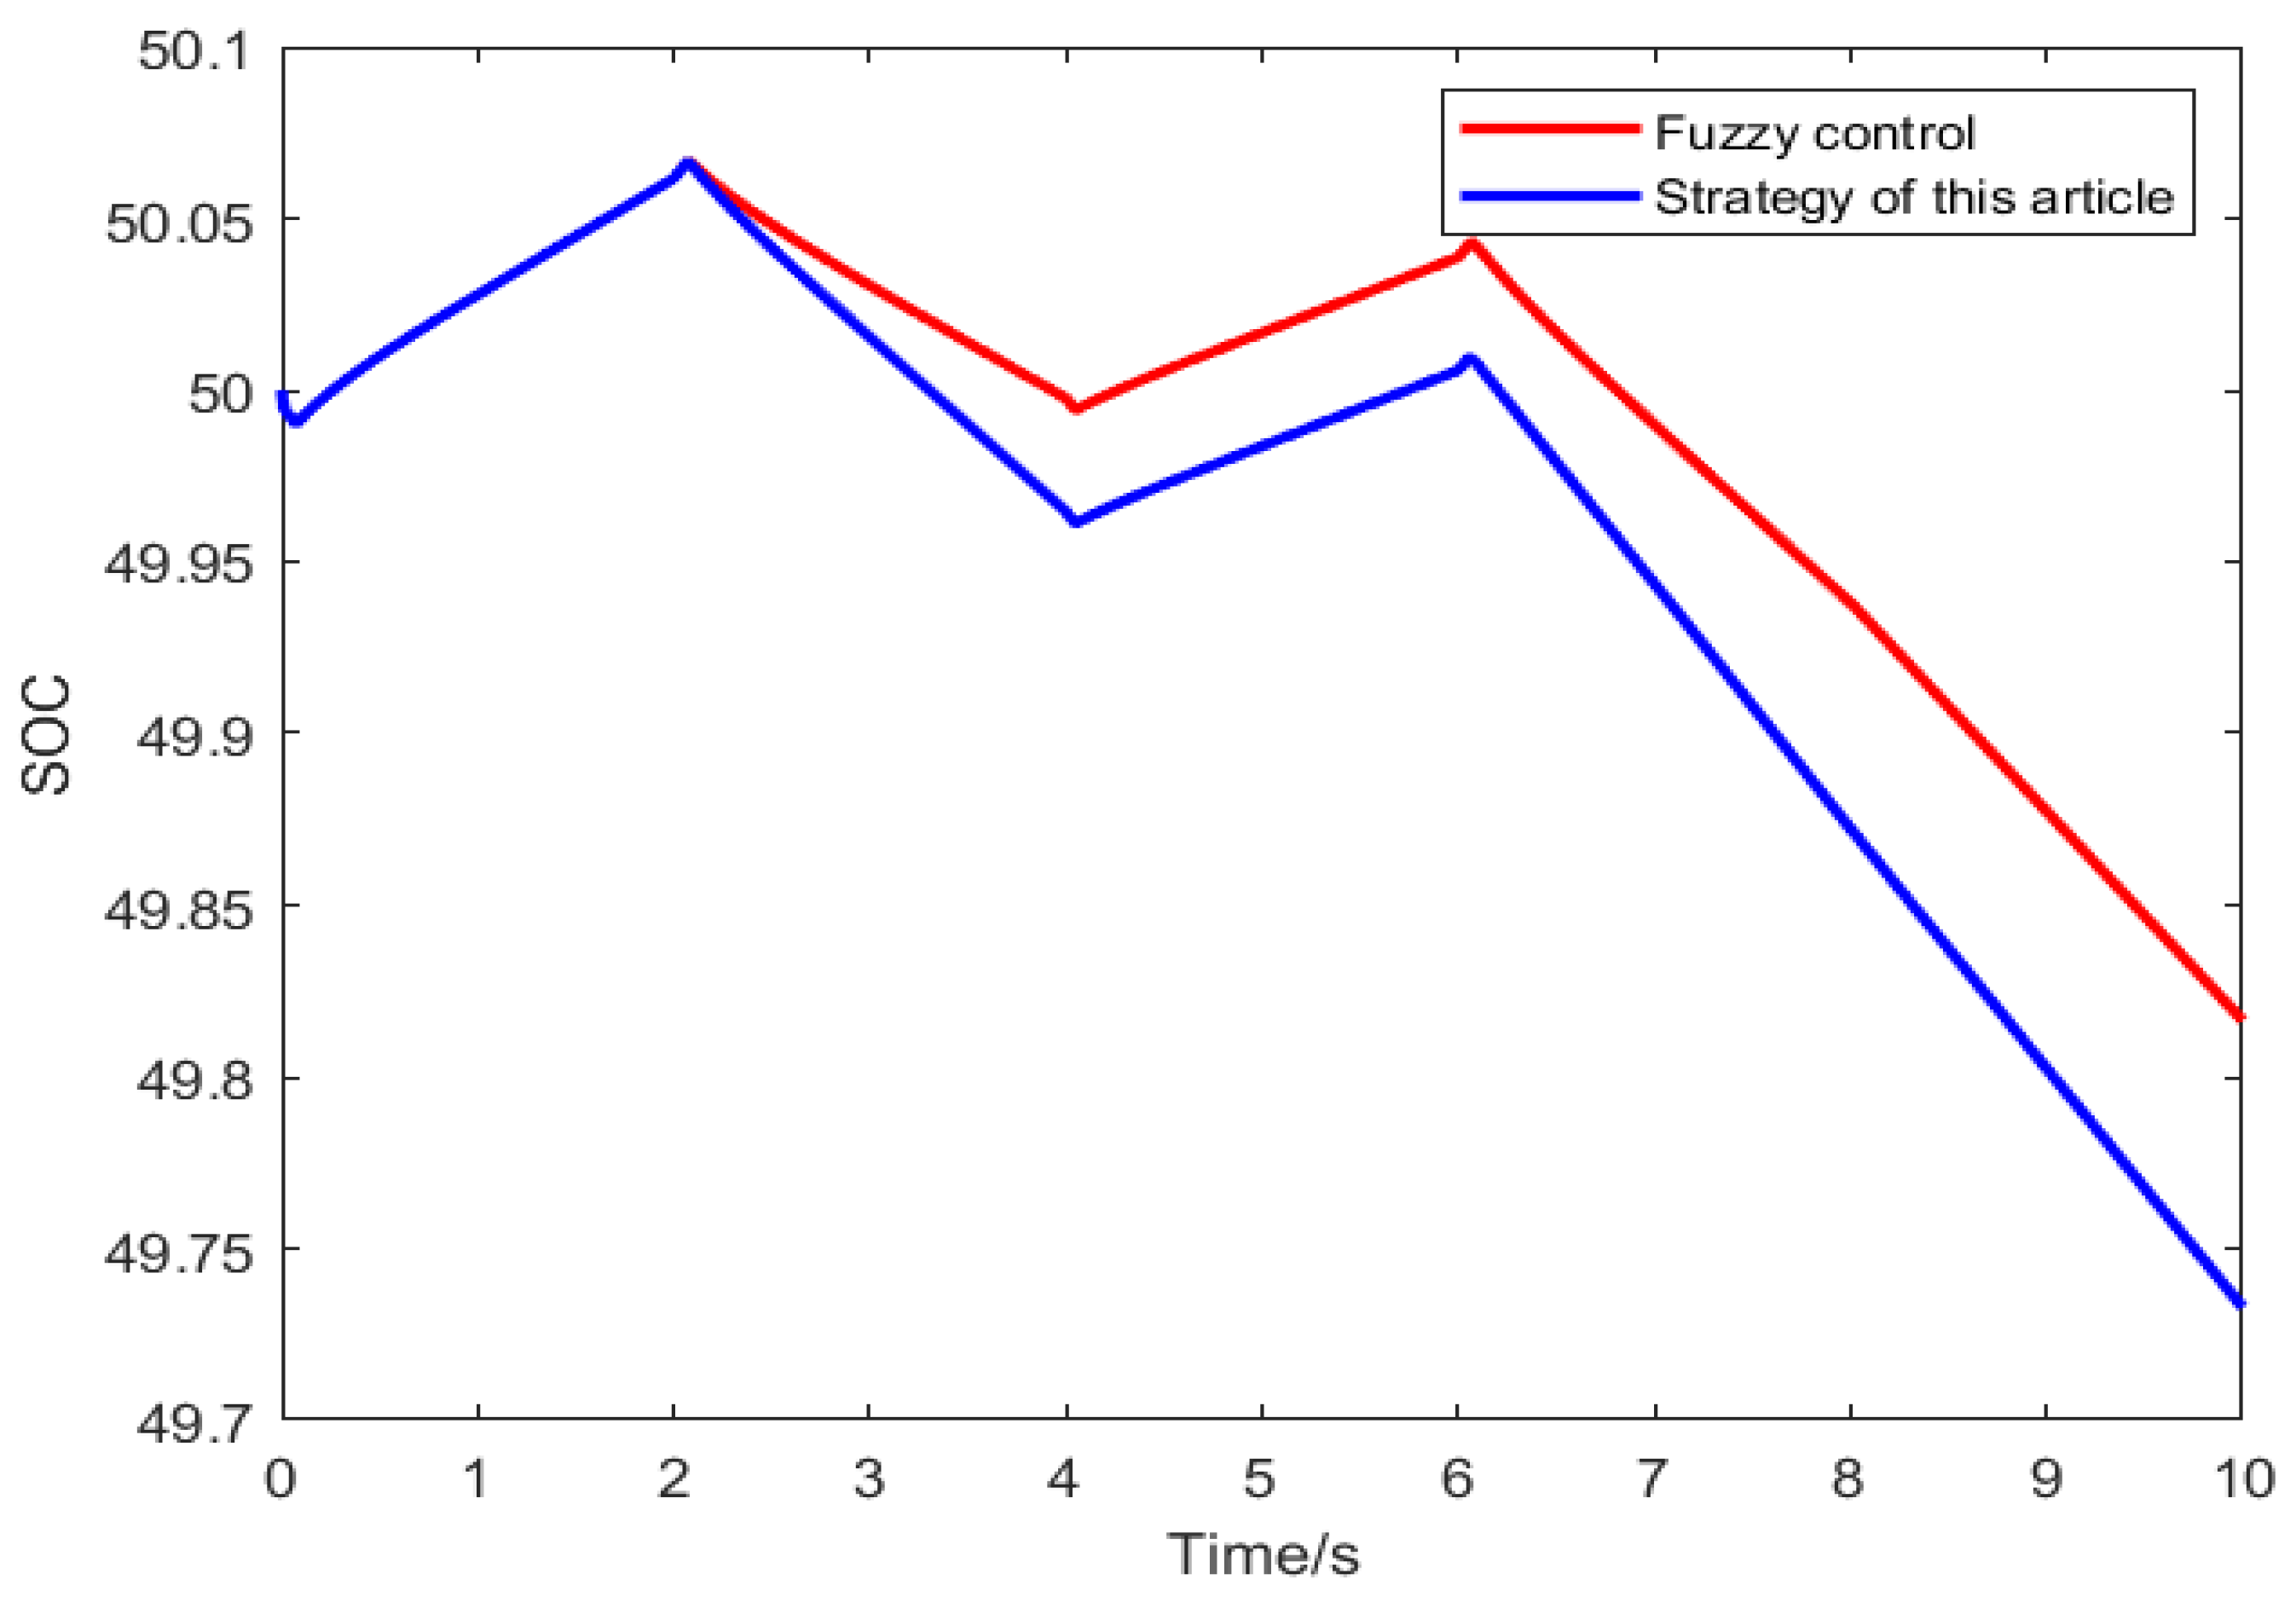
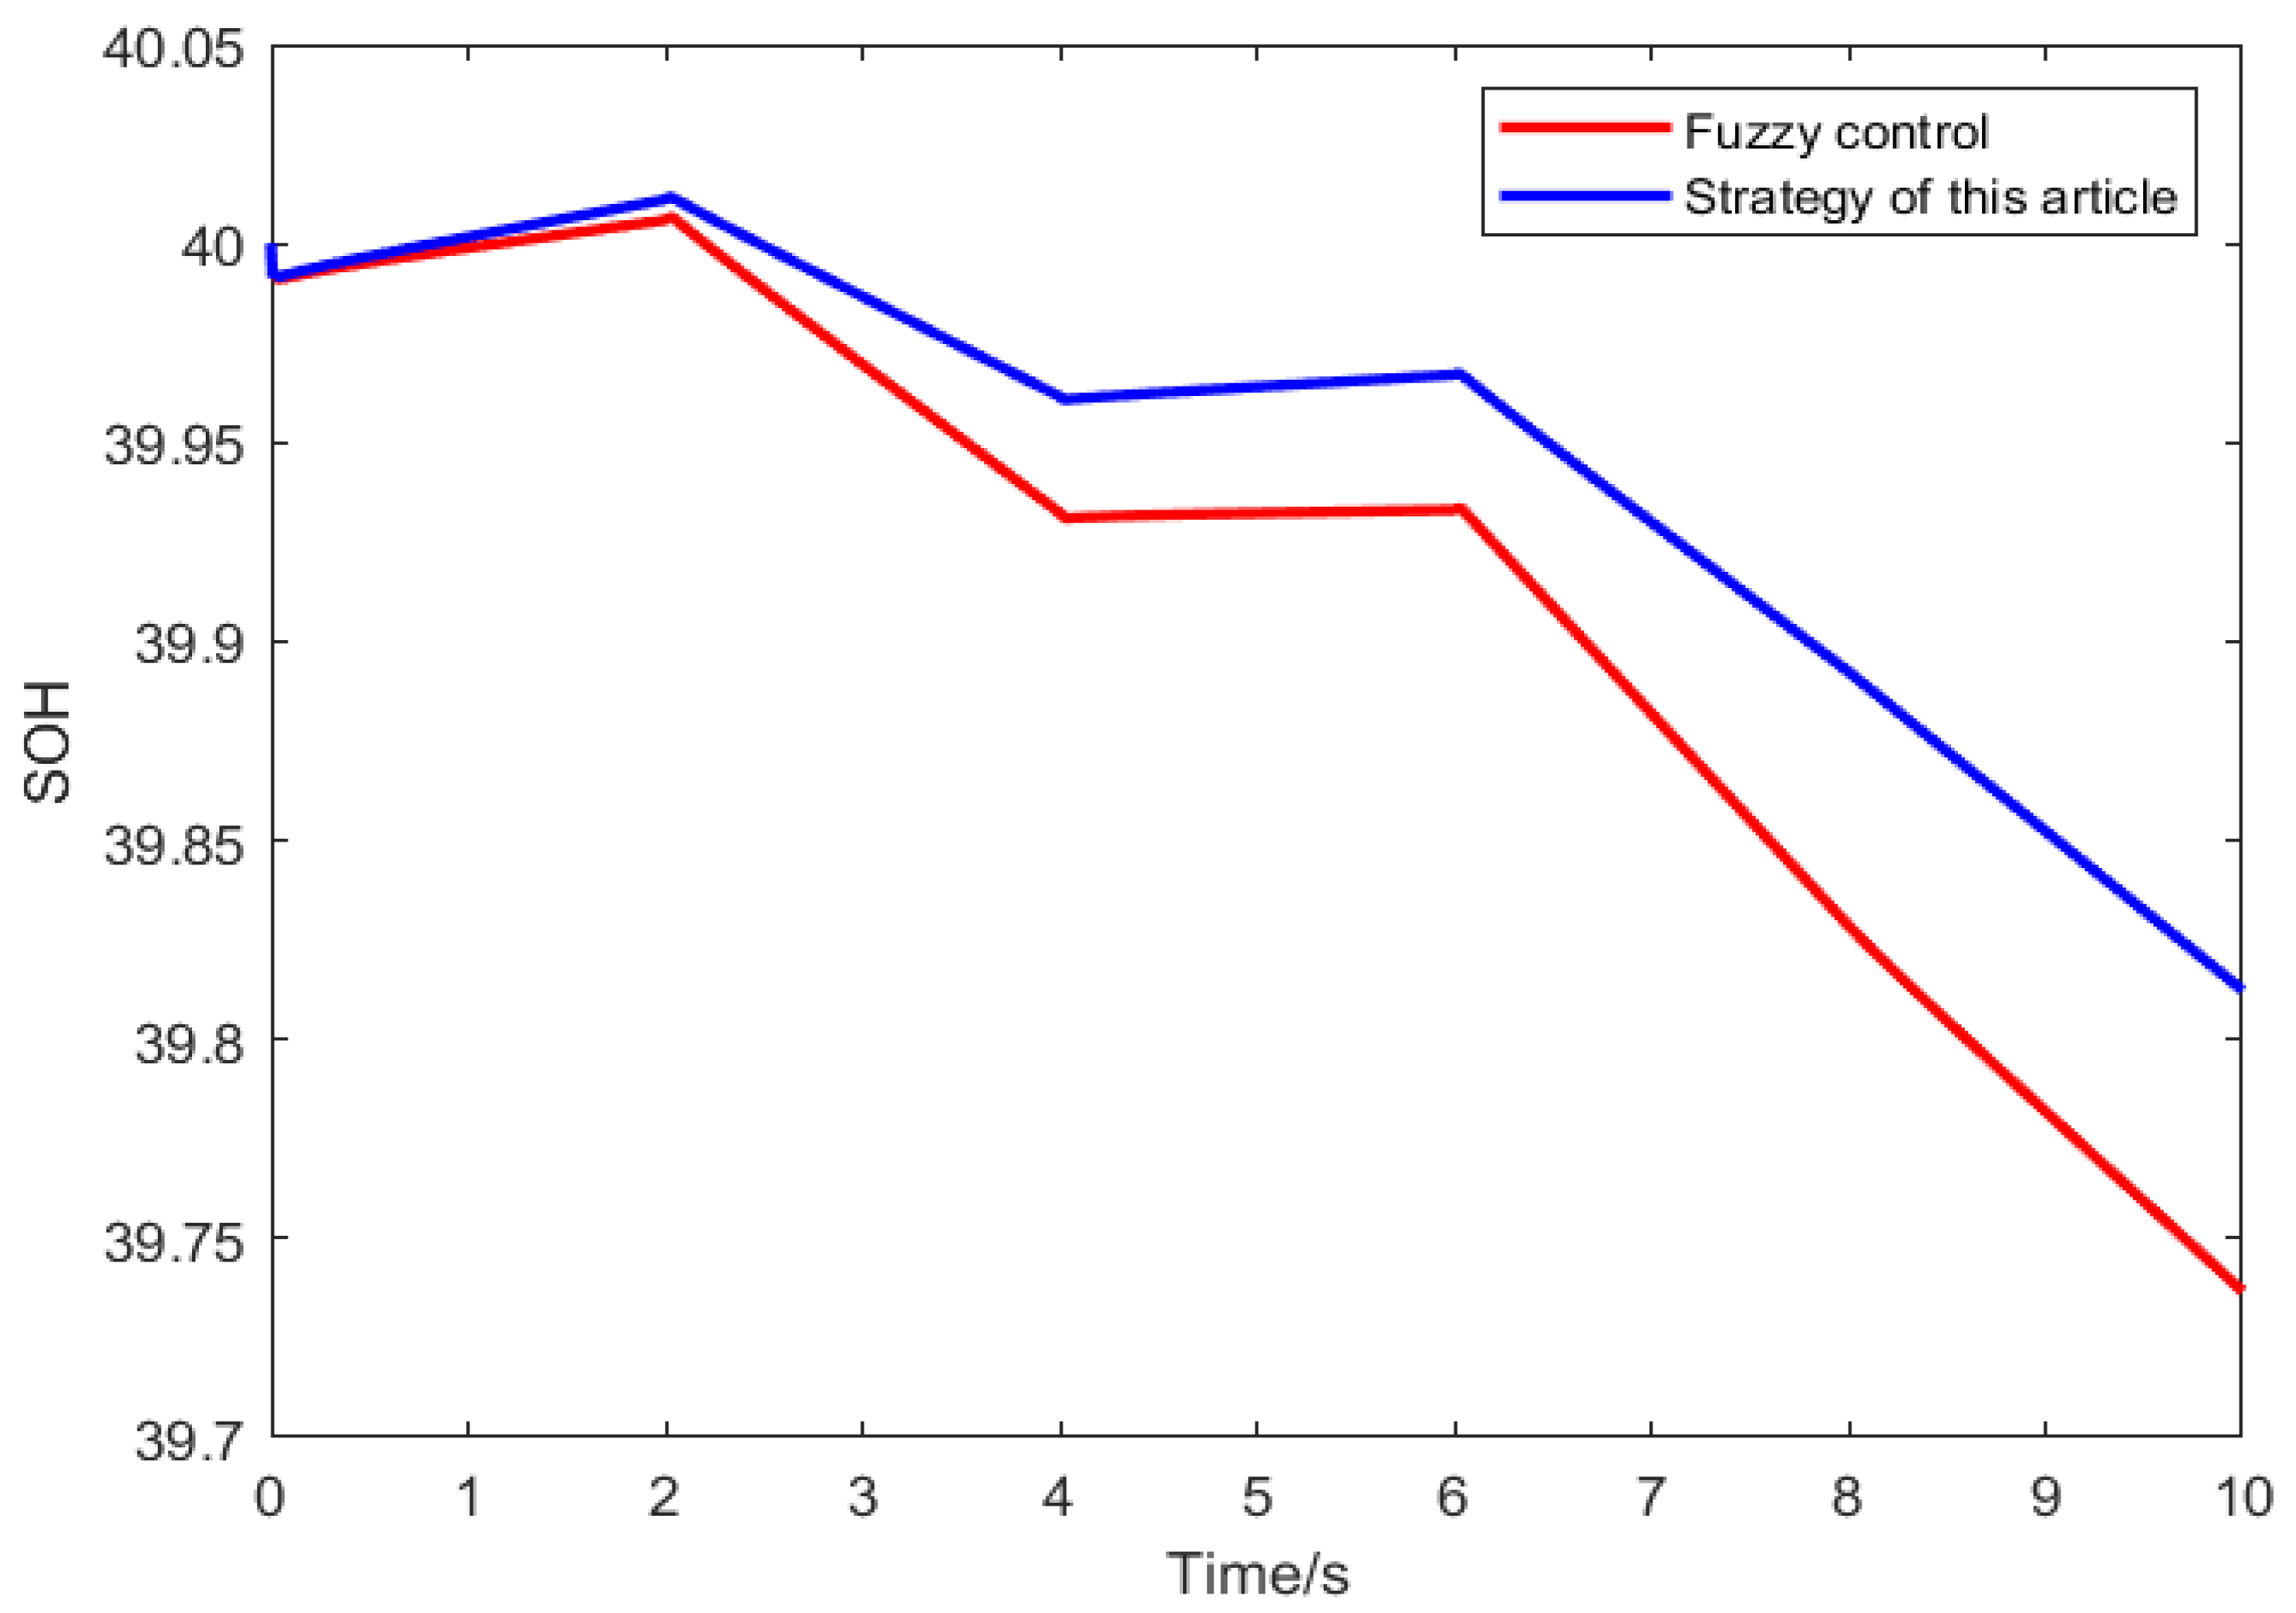
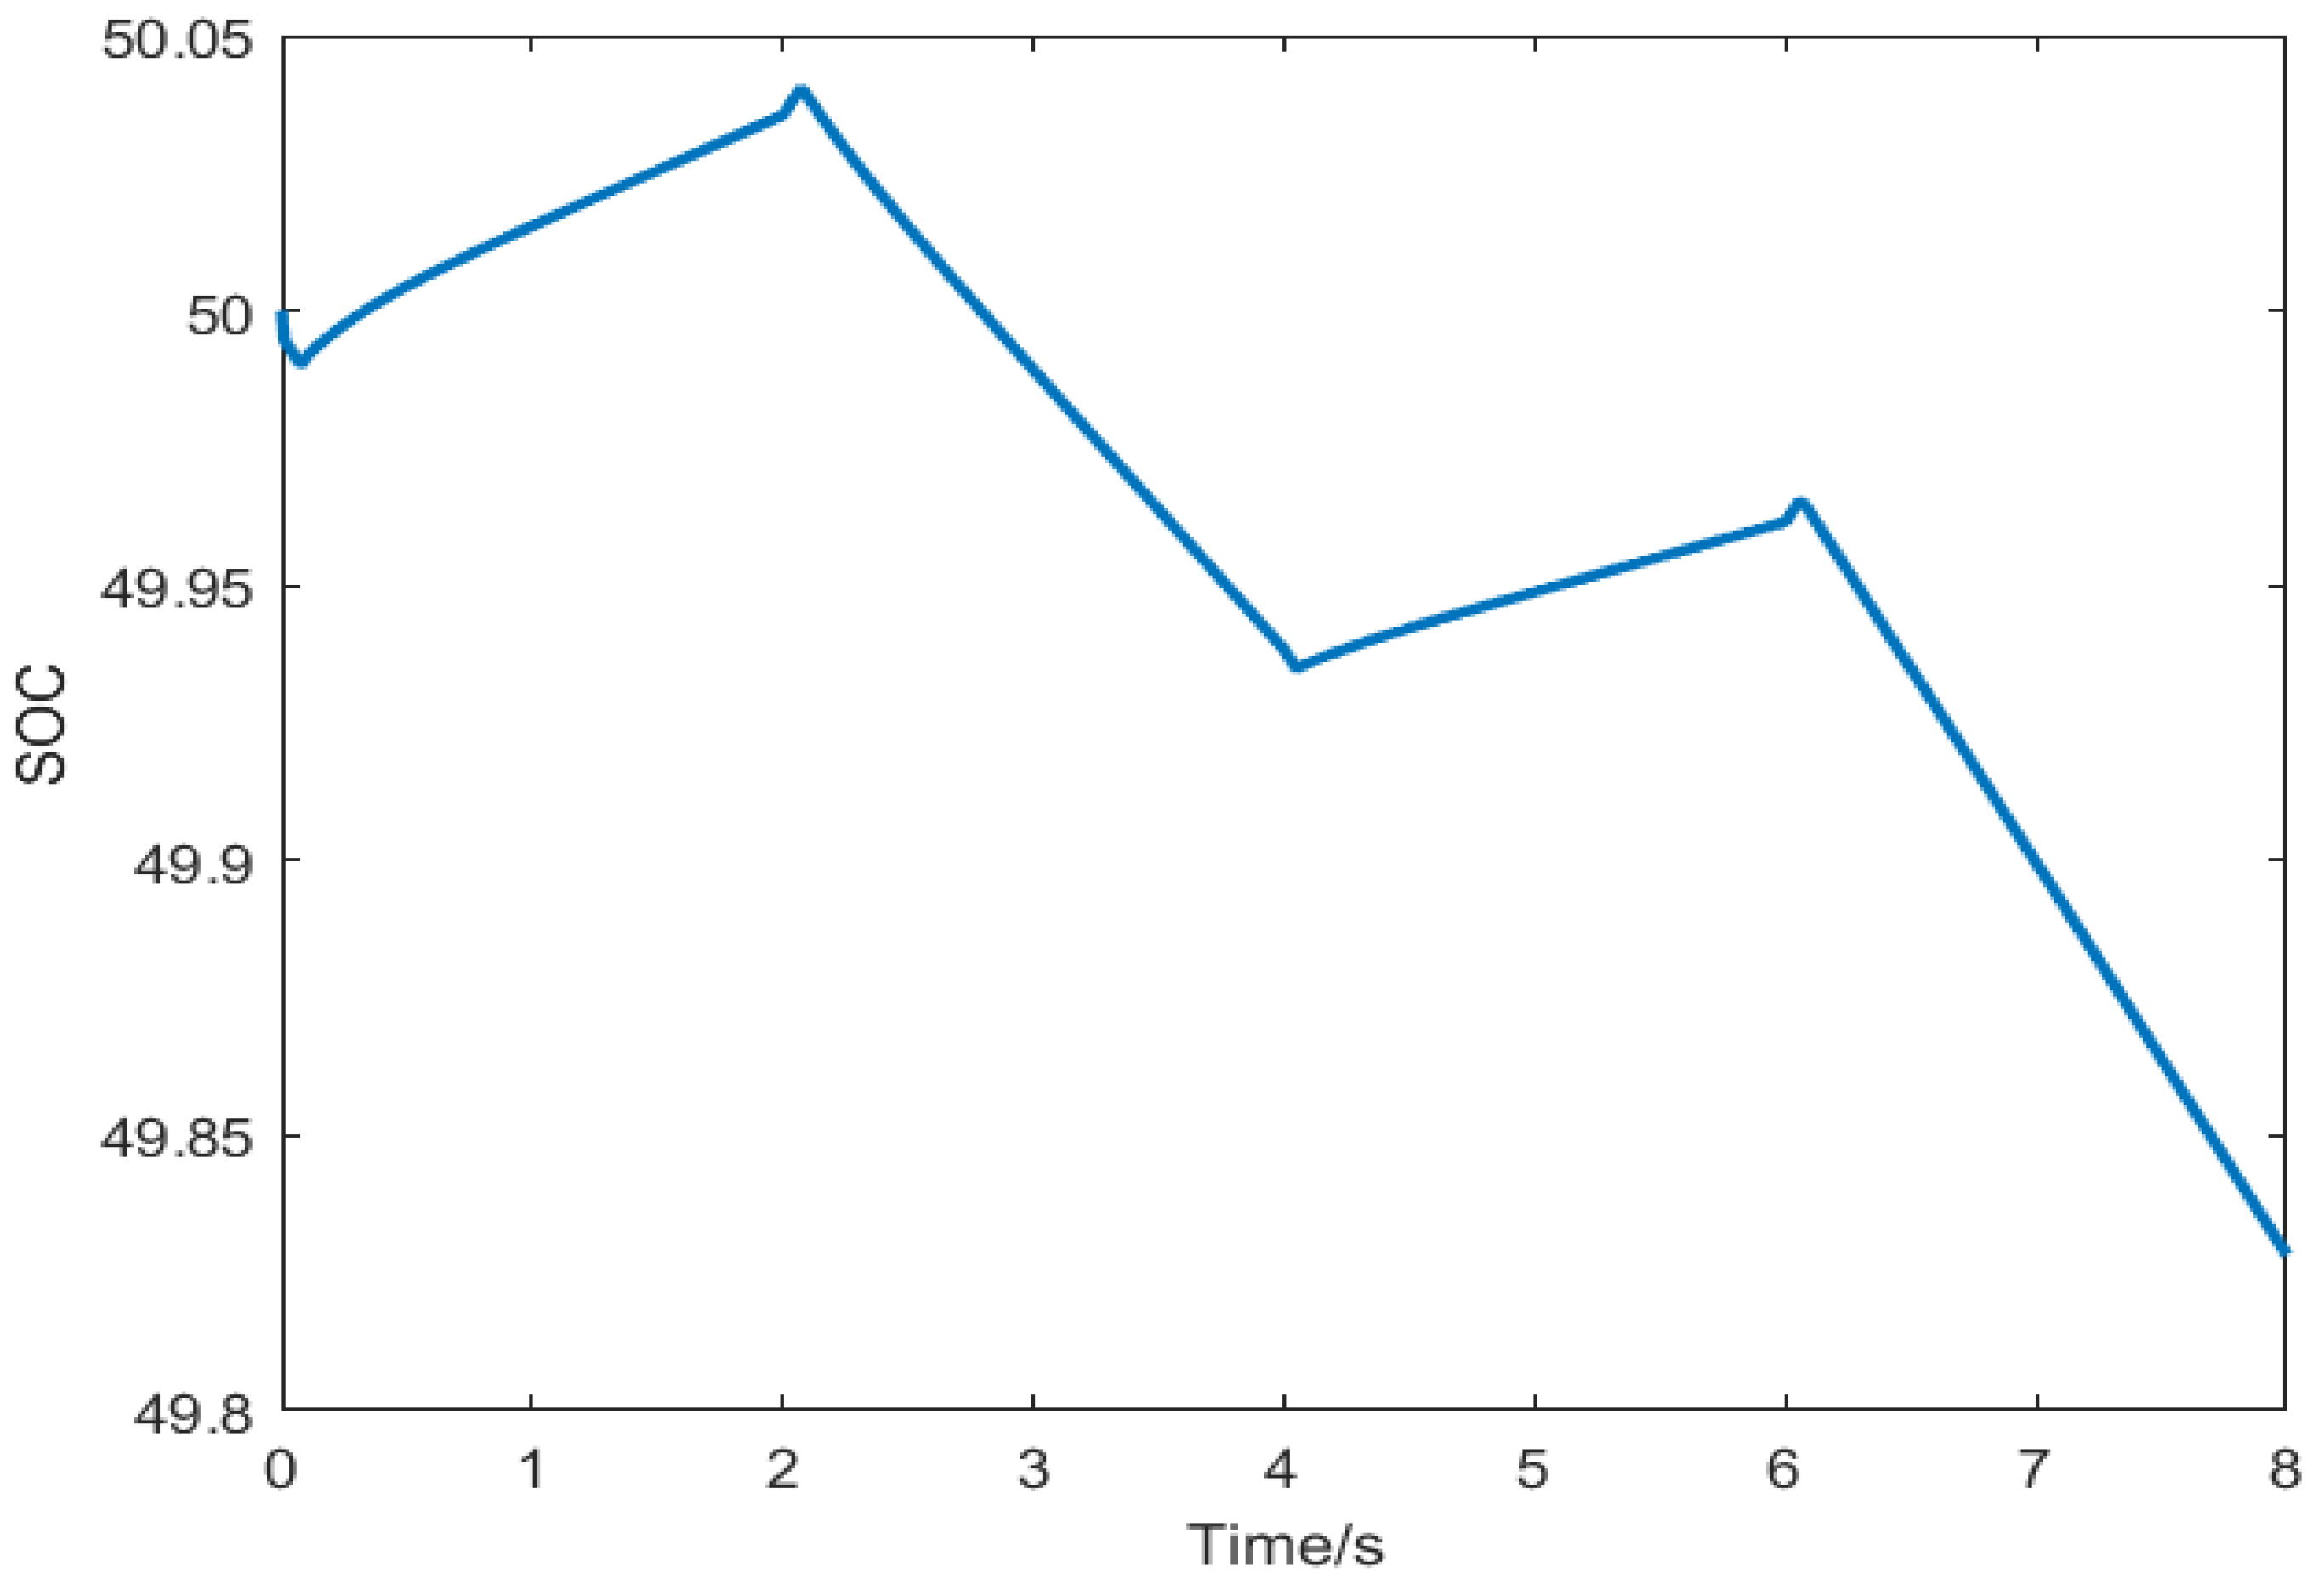
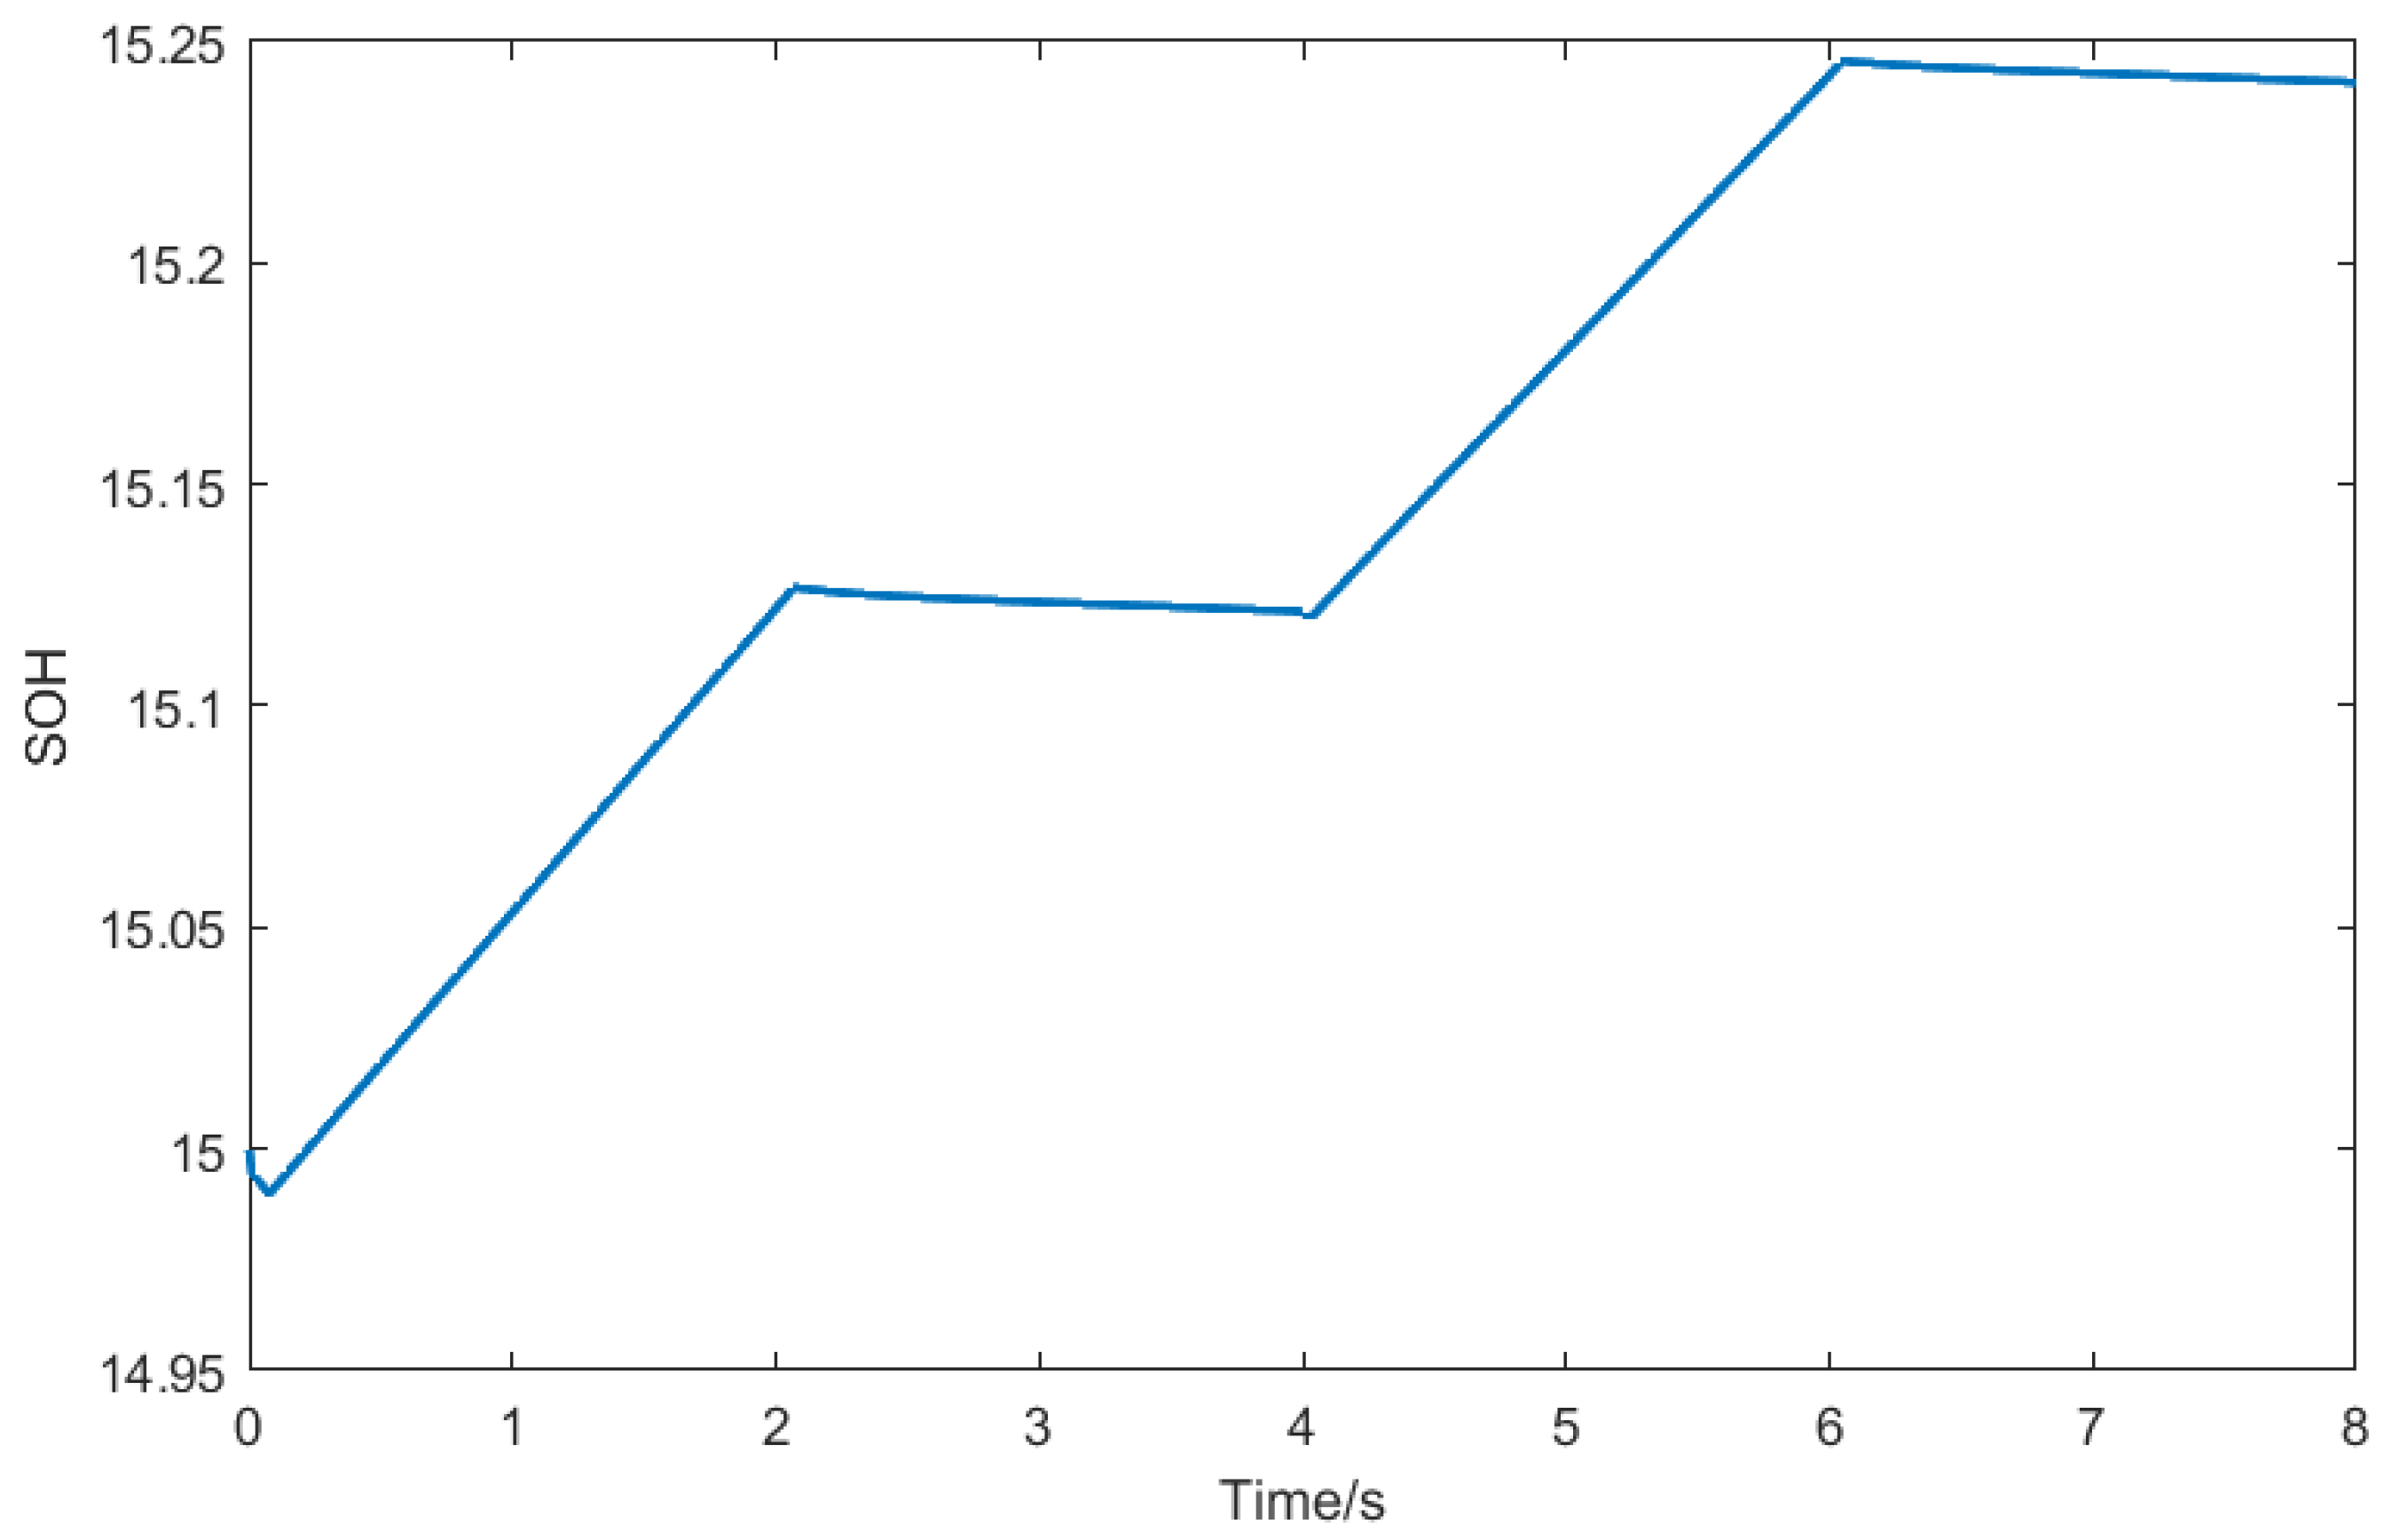
From the analysis of
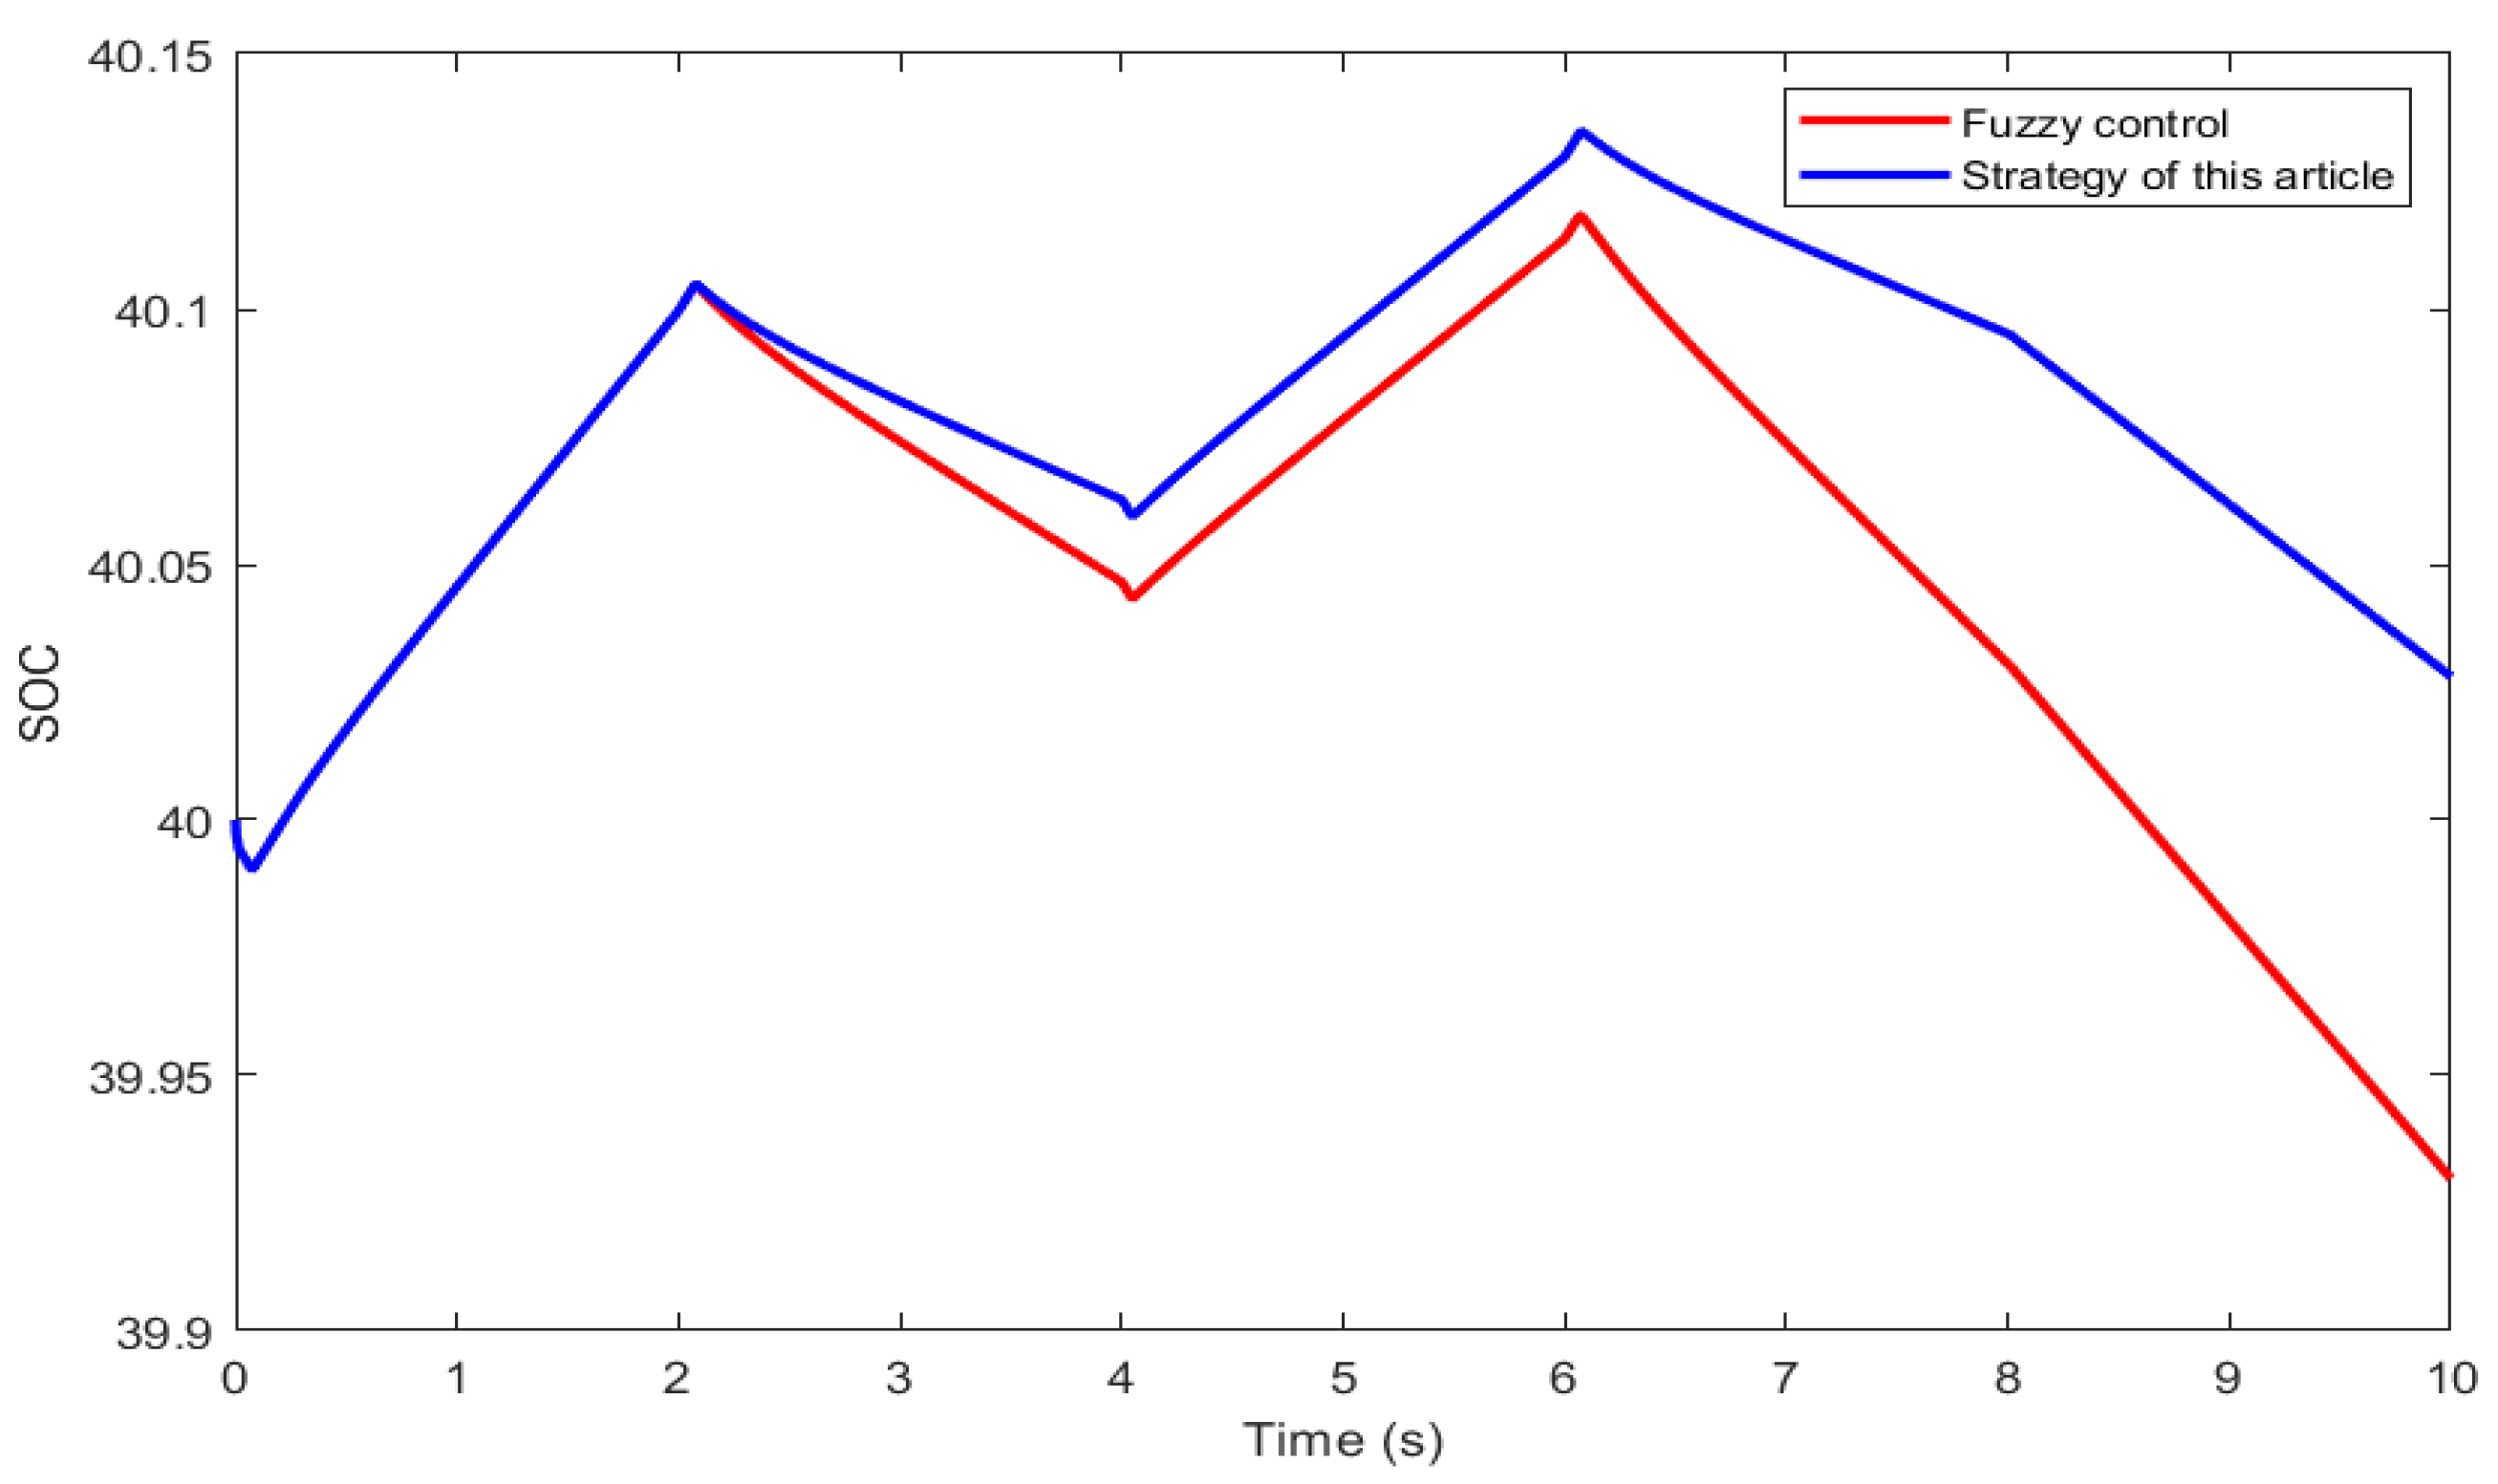
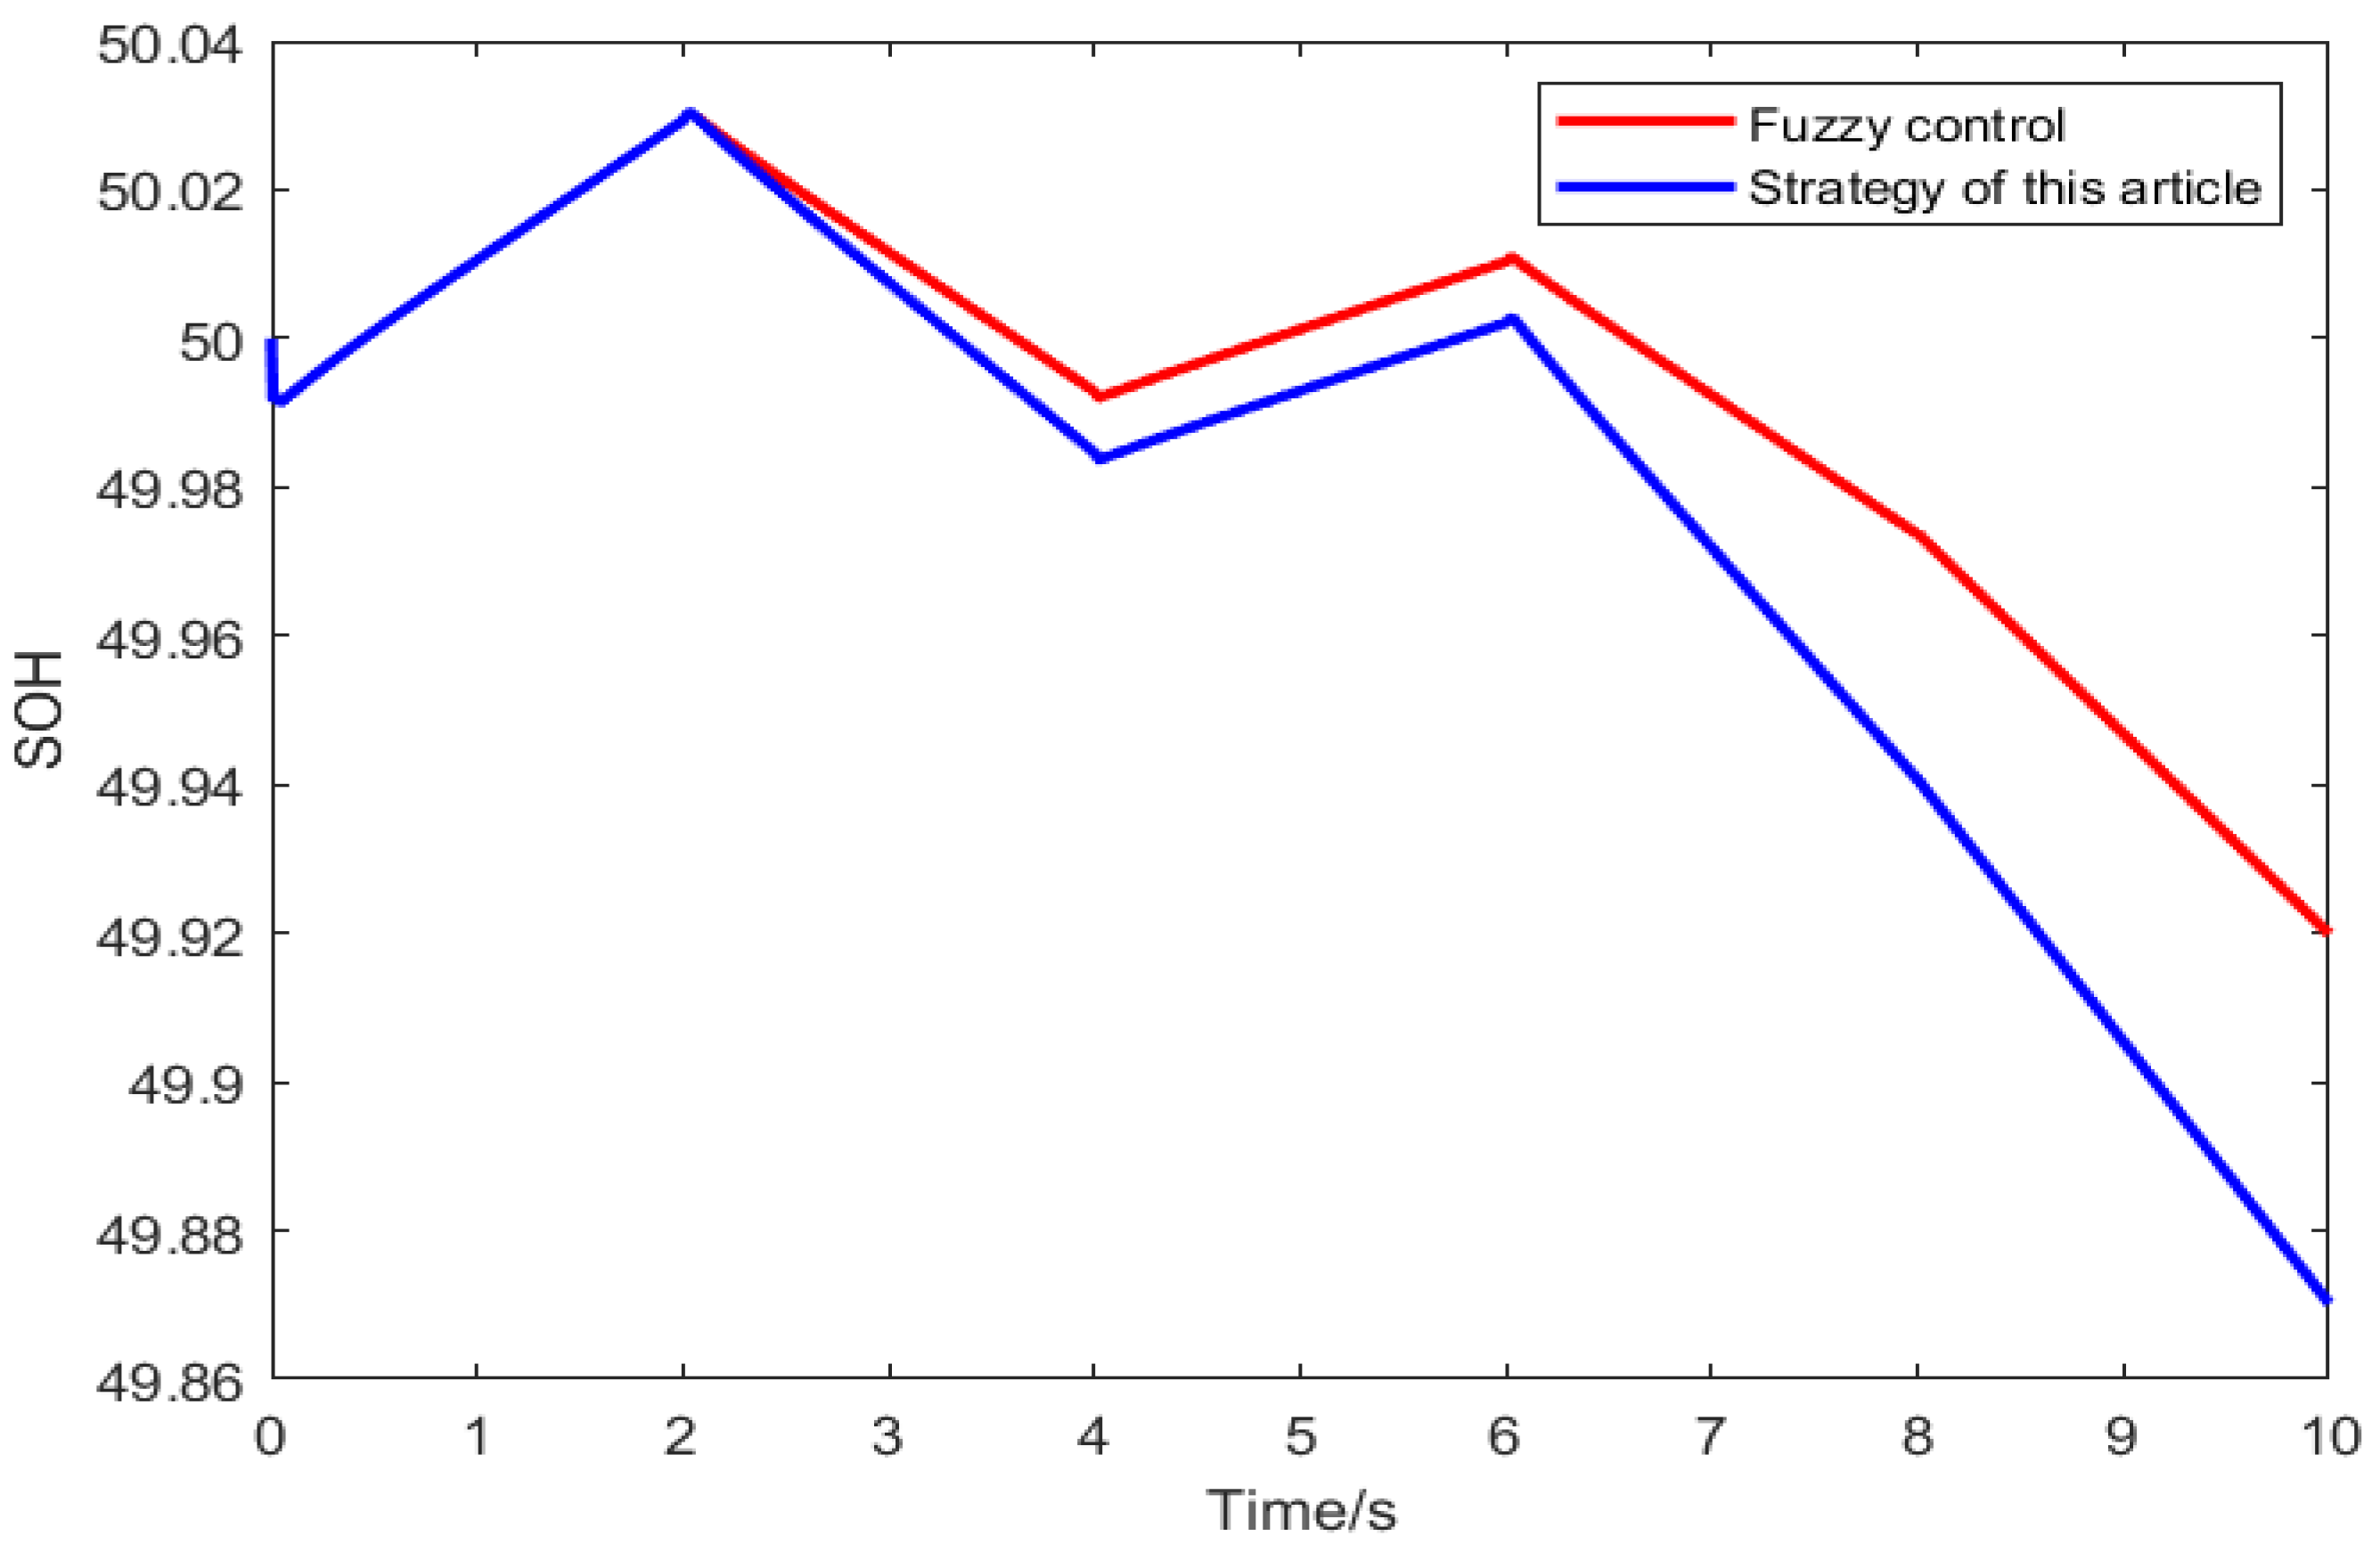
Figure 10 and
Figure 11, it can be observed that when there is a power deficit in the system and the SOC < the SOH, the SOH value decelerates more quickly, while the SOC value grows at a slower rate. This better improves the hydrogen state of the hydrogen storage tank and the charge state of the lithium battery.
In addition, set SOC = 0.5; SOH = 0.4; and the other parameters are as shown in
Table 4.
According to
Figure 12 and
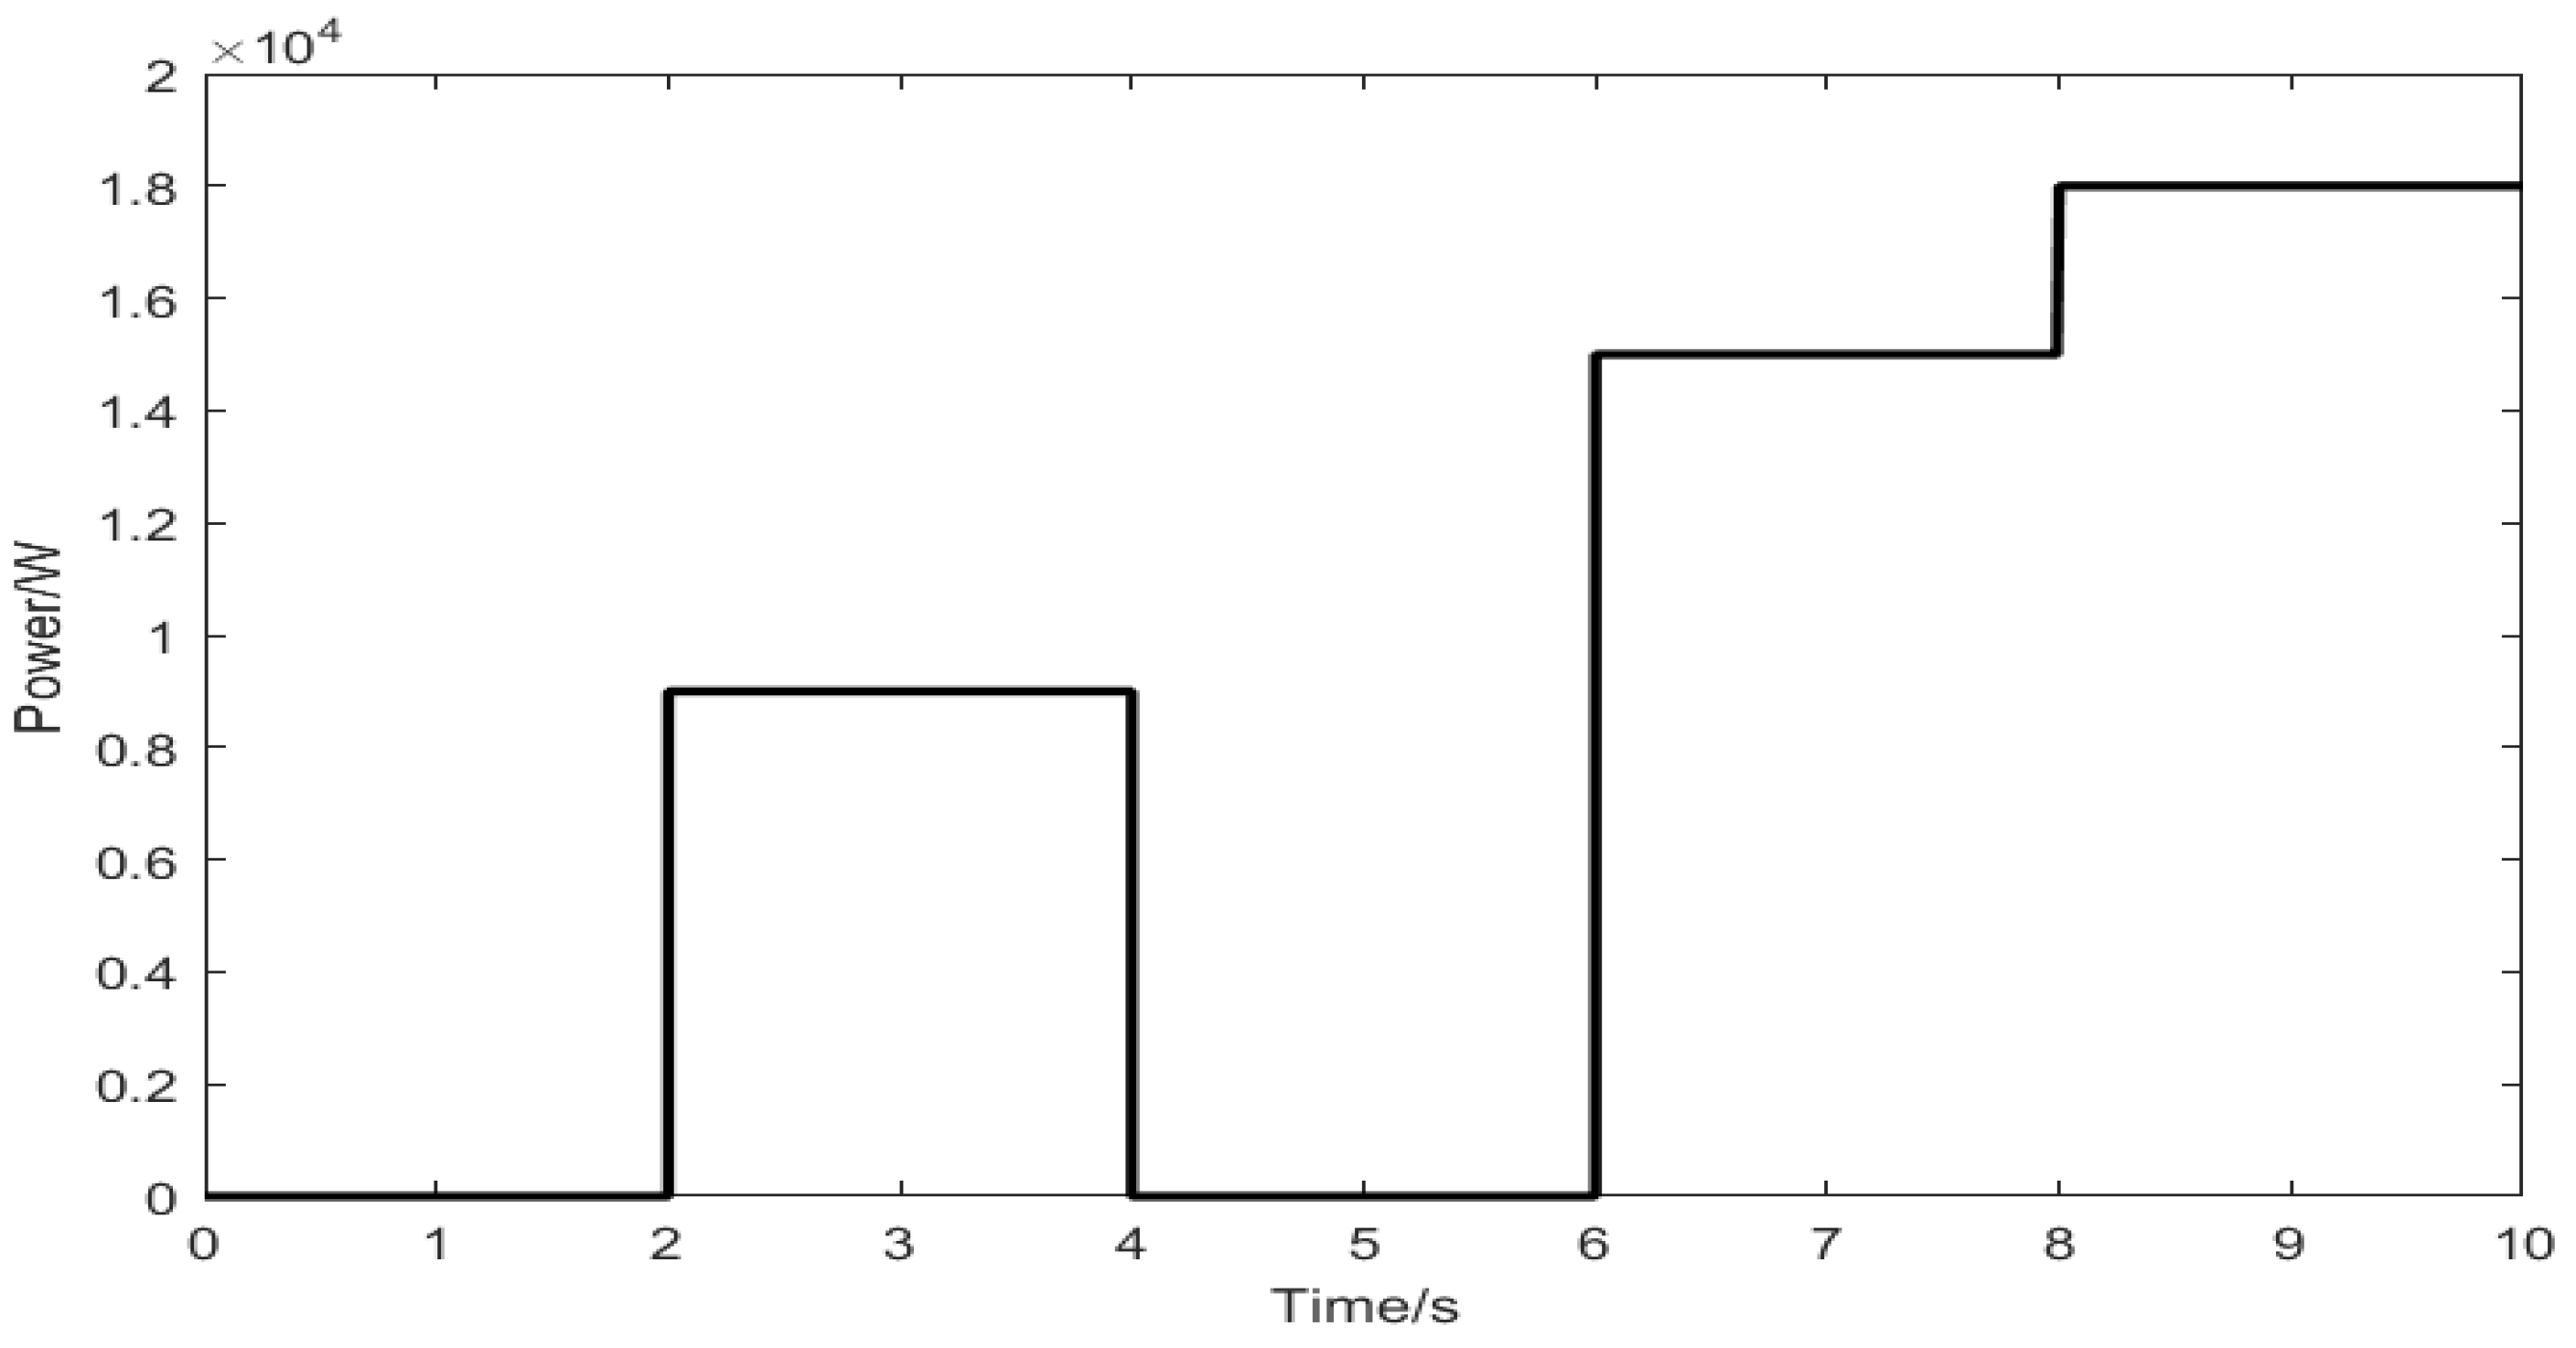
Figure 13, from 0 to 2 s, the system operates in State 1. Since the SOC > the SOH, the power allocated to the electrolyzer through fuzzy control is higher than that allocated to the lithium battery. From 2 to 4 s, the system operates in State 3 with a power deficit. Both the fuel cell and lithium battery provide power, with the fuzzy control allocating 6 kW to the fuel cell. At this time, N fuel cell stacks are activated, meaning no fuel cell stacks are in operation. From 4 to 6 s, the system returns to State 1, where the power allocated to the electrolyzer is higher than that allocated to the lithium battery. From 6 to 8 s, the system switches back to State 3, with 8.5 kW allocated, resulting in N fuel cell stacks being activated, meaning no fuel cell stacks are in operation. From 8 to 10 s, the fuzzy control allocates 12 kW of power to the fuel cell, thereby activating one fuel cell stack.
From the analysis of
Figure 14 and
Figure 15, it can be observed that when there is a power deficit in the system and the SOC > the SOH, the system only activates N groups of fuel cells. This slows down the rate of decrease in the SOH value while increasing the growth rate of the SOC value.
5.2. Simulation in the Low SOH Range
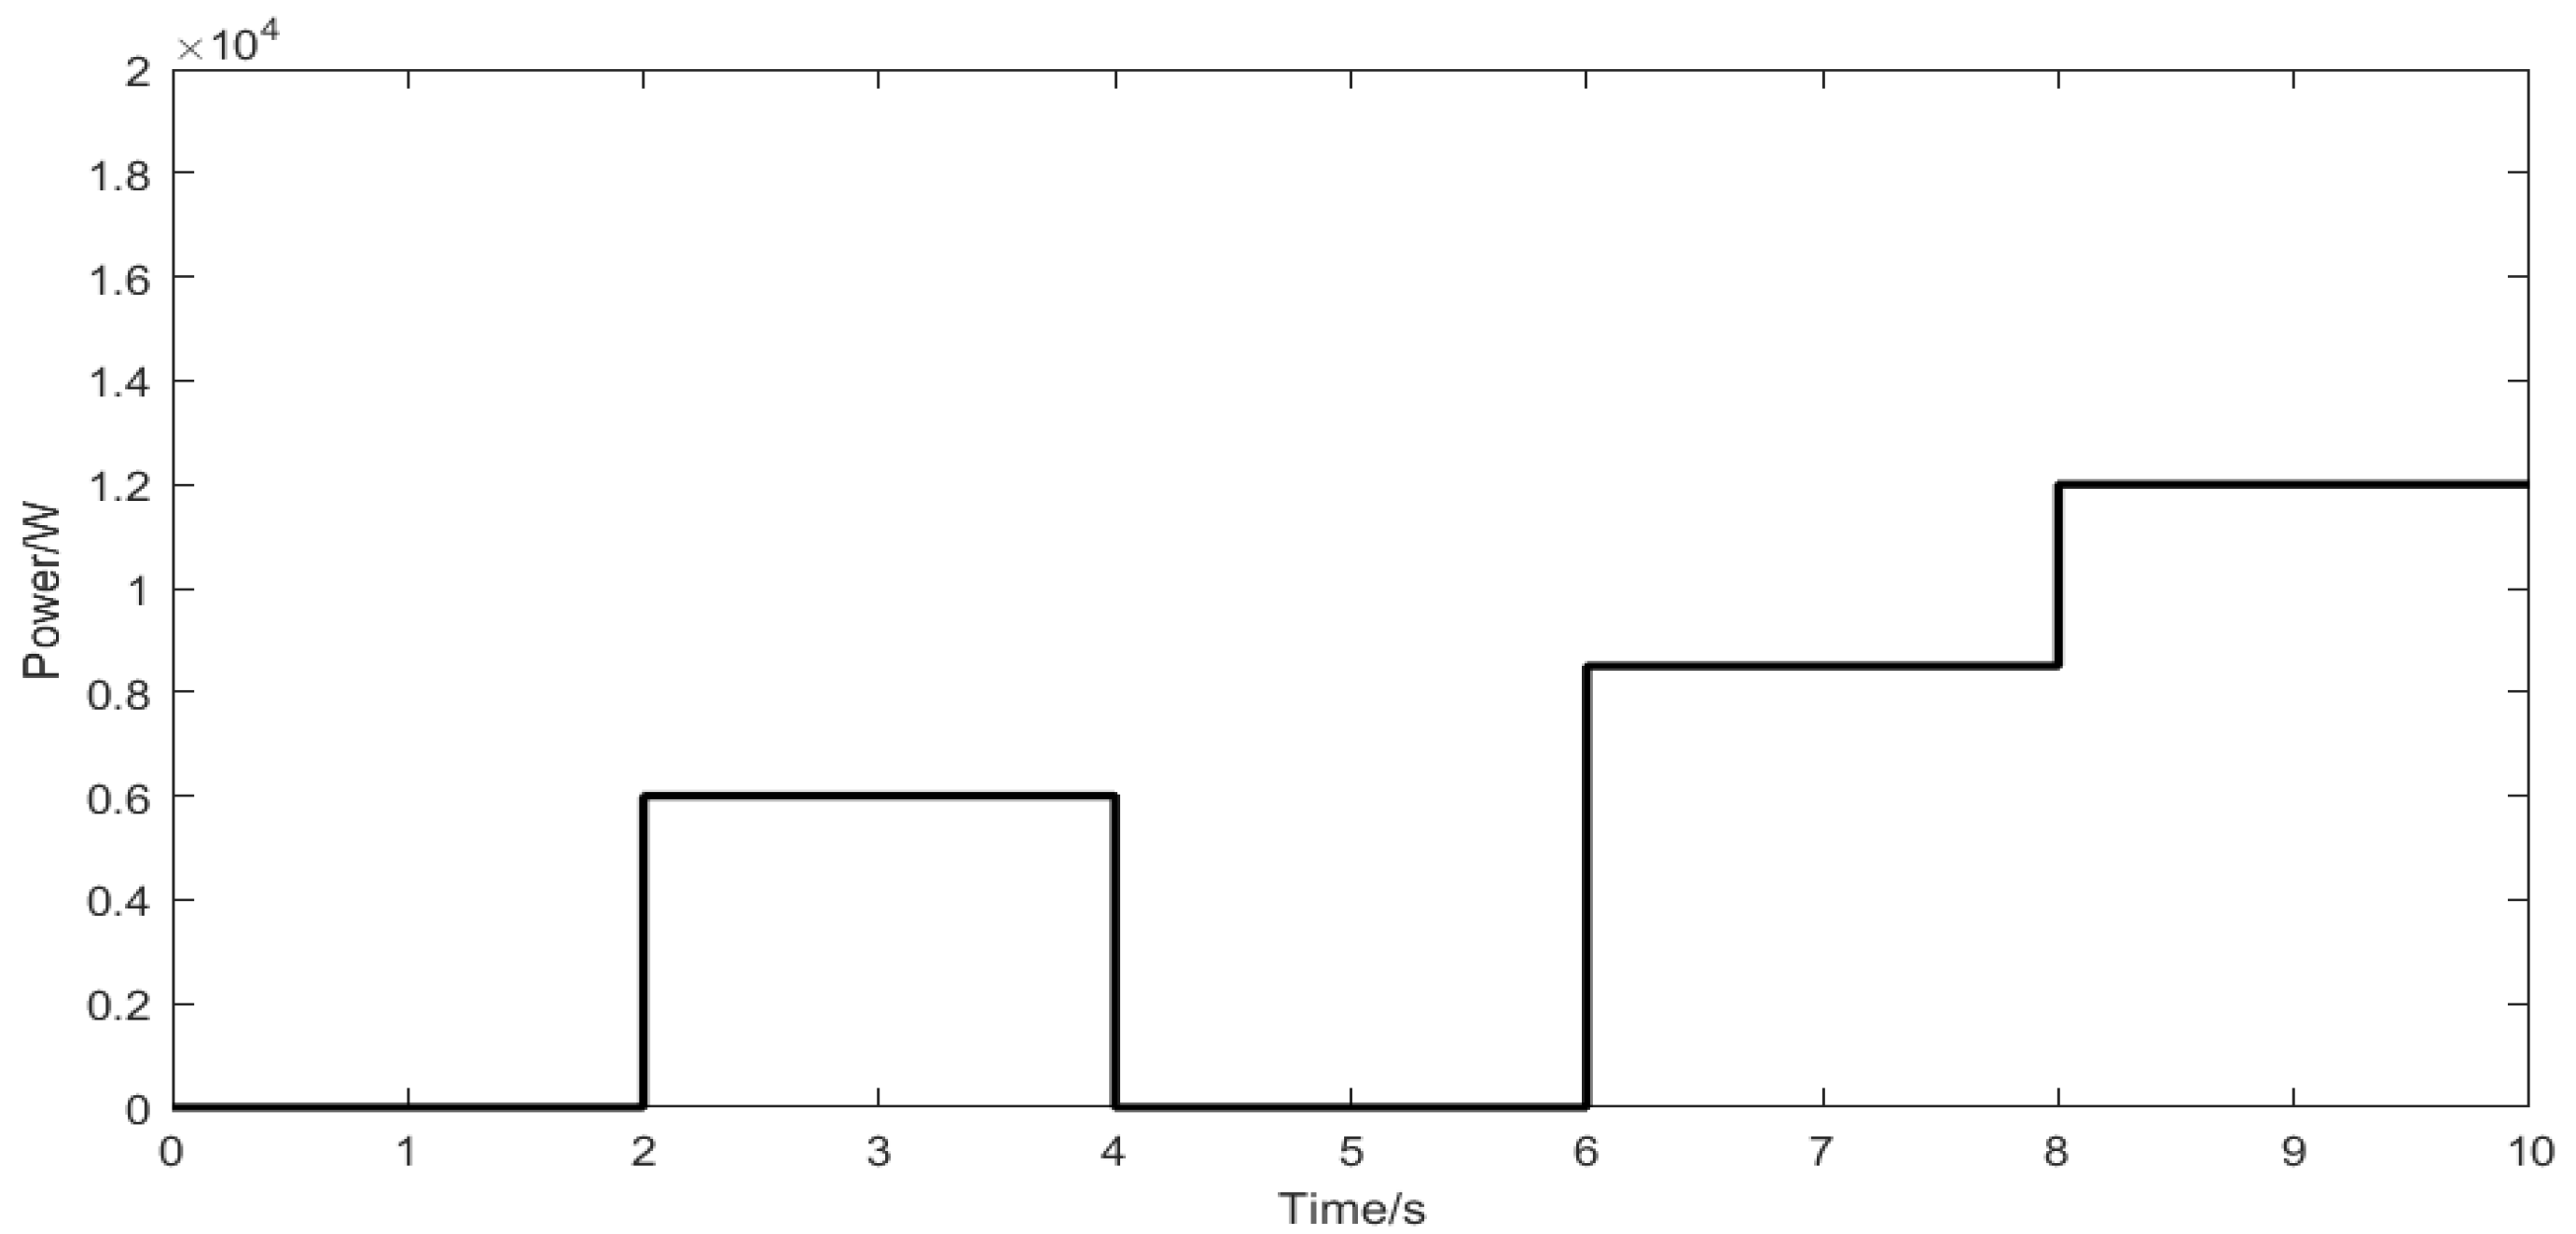
To verify the proposed control strategy in a low SOH state, set SOC = 0.5, SOH = 0.15, and the other parameters as shown in
Table 5.
According to
Figure 16, from 0 to 2 s, the system operates in State 1. Since the SOC > the SOH, the power allocated to the electrolyzer through fuzzy control is higher than that allocated to the lithium battery. From 2 to 4 s, the system operates in State 5, with a power shortage and a very low SOH value. Therefore, the fuel cell stack shuts down, and the lithium battery compensates for the deficit power. From 4 to 6 s, the system returns to State 1, where the power allocated to the electrolyzer is higher than that allocated to the lithium battery. From 6 to 8 s, the system switches again to State 5. The variation curves of SOC and SOH are shown in
Figure 17 and
Figure 18.
6. Discussion
Hydrogen energy storage, as an emerging storage technology, has demonstrated significant application potential across various fields. In the renewable energy sector, hydrogen storage enables efficient energy storage and distribution by converting excess electricity into hydrogen, addressing the intermittency issues of wind and solar energy. In the transportation sector, hydrogen fuel cell vehicles, ships, and aircraft have become key development areas, offering efficient, zero-emission clean energy solutions. Additionally, in industrial production, hydrogen is widely used as a chemical feedstock, a high-temperature process fuel, and a green alternative to reduce carbon emissions. Moreover, hydrogen storage can act as a regulatory tool for the power grid, supporting grid stability and exhibiting significant advantages in meeting seasonal or long-duration energy storage demands.
The startup and shutdown processes of hydrogen equipment stacks need to be smooth to avoid excessive mechanical stress and temperature fluctuations. Frequent start-stop cycles may lead to stack failures, resulting in system instability. The control strategy proposed in this paper aims to enhance system stability by managing the power distribution between hydrogen storage and lithium batteries, preventing frequent startup and shutdown of hydrogen equipment, and enabling more efficient utilization of renewable energy. However, due to the limitations of hydrogen fuel cells, the conversion efficiency in the electricity–hydrogen–electricity cycle remains relatively low. Additionally, simulation software does not account for the specific impact of temperature and pressure changes during hydrogen production or utilization in the system. Hydrogen storage also faces challenges such as high costs, incomplete infrastructure, and the need for technological breakthroughs. With advancements in technology and policy support, hydrogen storage is expected to play a more significant role in future energy transition as hydrogen resources become more widely adopted.
7. Conclusions
In the face of the widespread application of hydrogen energy in the future, hydrogen energy storage can be widely used as a long-term energy storage solution. To ensure the coordinated operation of various components in a hydrogen storage energy microgrid system and to achieve reasonable dynamic regulation of the battery’s state of charge (SOC) and the hydrogen storage tank’s hydrogen state, this paper proposes a control strategy for the coordinated operation and power distribution of the hydrogen storage microgrid system. The following conclusions are drawn:
The proposed strategy comprehensively considers the system’s power deficit, the battery’s state of charge (SOC), and the hydrogen storage tank’s hydrogen state. It uses a fuzzy control algorithm to allocate power between lithium battery energy storage and hydrogen storage.
Since operating fuel cells at high or low power for extended periods can reduce their lifespan and lead to low system efficiency, this paper proposes using a high-efficiency multi-stack fuel cell system instead of a single fuel cell. By combining this with fuzzy control for power distribution, the system’s power allocation is further optimized, allowing the battery’s state of charge (SOC) and the hydrogen storage tank’s hydrogen state to operate within a more reasonable range.
The proposed coordinated control strategy divides the system’s operating conditions into five categories, enabling rapid suppression of power fluctuations within the system under varying load conditions, thereby ensuring the stable operation of the system.
To further advance the utilization of hydrogen energy and establish a truly pollution-free, clean energy system, the following efforts should be strengthened: First, the production cost of hydrogen remains relatively high, which limits its widespread application. Therefore, large-scale hydrogen production technologies still need to be improved. Second, the storage and transportation of hydrogen require specialized infrastructure, which is not yet widespread globally and is costly to build. The lack of such infrastructure restricts the large-scale circulation and application of hydrogen. Third, the efficiency of hydrogen storage in the energy conversion process is relatively low. There are energy losses in the process of converting electricity to hydrogen and then back to electricity. This results in an overall low efficiency of hydrogen energy storage. Continuous development of hydrogen fuel cells in the future is expected to improve their conversion efficiency, enabling hydrogen energy to be more widely applied.
Author Contributions
Methodology, H.S.; software, J.L.; formal analysis, G.Q. and Q.Z.; writing—original draft preparation, J.L.; writing—review and editing, H.S.; visualization, P.X.; supervision, Y.G.; data curation, Y.G.; funding acquisition, Q.Z. and H.S. All authors have read and agreed to the published version of the manuscript.
Funding
This work is funded by the S&T Program of Hebei (23284502Z, 242Q4502Z) and the Overseas Expertise Introduction Project of Hebei (2023YX044A).
Data Availability Statement
The original contributions presented in the study are included in the article, further inquiries can be directed to the corresponding author.
Conflicts of Interest
Authors Gang Qin and Qingqing Zhang were employed by the company Suntien Green Energy Co., Ltd. The remaining authors declare that the research was conducted in the absence of any commercial or financial relationships that could be construed as a potential conflict of interest.
References
- Wang, S.; Kong, L.; Cai, G.; Yan, H.; Han, Z.; Liu, C.; Wan, Y.; Yang, S.; Wang, X. Current Status, Challenges, and Prospects of Key Application Technologies of Hydrogen Energy Storage in Power Systems. Proc. CSEE 2023, 43, 6660–6681. [Google Scholar]
- Xu, C.; Liu, J. Application Value, Challenges, and Prospects of Hydrogen Energy Storage in China’s New Power System. Eng. Sci. China 2022, 24, 89–99. [Google Scholar] [CrossRef]
- He, Y.; Guo, S.; Zhou, J.; Wu, F.; Huang, J.; Pei, H. The quantitative techno-economic comparisons and multi-objective capacity optimization of wind-photovoltaic hybrid power system considering different energy storage technologies. Energy Convers. Manag. 2021, 229, 113779. [Google Scholar] [CrossRef]
- Zhang, J.; Li, J. Revolution in Renewables: Integration of Green Hydrogen for a Sustainable Future. Energies 2024, 17, 4148. [Google Scholar] [CrossRef]
- Wang, Y.; Jiang, L.; Fan, X. Research on Power Distribution Strategy of DC Microgrid System Based on Hydrogen Energy Storage. Therm. Power Gener. 2023, 52, 105–114. [Google Scholar]
- Chen, M.; Ren, J.; Li, F. Coordinated and Stable Operation of Wind-Solar Hybrid and Electrolytic Water Hydrogen Production Systems. Acta Energiae Solaris Sin. 2023, 44, 344–350. [Google Scholar]
- Jing, T.; Chen, G.; Wang, Z.; Xu, P.; Li, G.; Jia, M.; Wang, Y.; Shi, J.; Li, M. Review of Research on Hydrogen Energy Storage Systems Coupled with Wind-Solar Hybrid Power Generation. Electr. Power 2022, 55, 75–83. [Google Scholar]
- Li, J.; Shi, Z.; Liang, Z.; Liang, C. Cooperative Power Control Method for DC Microgrid with Electro-Hydrogen Coupled Energy Storage Systems. J. Shanghai Jiao Tong Univ. 2024, 1–24. [Google Scholar] [CrossRef]
- Chirosca, M.; Rusu, E.; Minzu, V. Green Hydrogen—Production and Storage Methods: Current Status and Future Directions. Energies 2024, 17, 5820. [Google Scholar] [CrossRef]
- Gugulothu, R.; Nagu, B.; Pullaguram, D. Energy management strategy for standalone DC microgrid system with photovoltaic/fuel cell/battery storage. J. Energy Storage 2023, 57, 106274. [Google Scholar] [CrossRef]
- Ahmad, A.; Iamarino, M.; D’Angola, A. A battery-to-electrolyzer pathway for energy management in a hybrid battery/hydrogen microgrid. J. Phys. Conf. Ser. 2023, 2648, 012094. [Google Scholar] [CrossRef]
- Zhang, X.; Pei, W.; Mei, C.; Tan, J.; Zhang, Q.; Deng, W. Fuzzy Power Distribution Strategy and Coordinated Control Method for Island DC Microgrid with Electro/Hydrogen Hybrid Energy Storage System. High Volt. Eng. 2022, 48, 958–968. [Google Scholar]
- Li, H. Research on Control Strategies for Photovoltaic Water Electrolysis Hydrogen Production-Fuel Cell Hybrid Systems. Electr. Eng. 2023, 18, 49–53. [Google Scholar]
- Li, J.; Di, W.; Li, Y.; Liu, H.; Yang, H. Long-Duration Energy Storage Technologies and Case Studies. Therm. Power Gener. 2023, 52, 85–94. [Google Scholar]
- Bhavani, N.; Vani, R. Design and implementation of hybrid energy sources with fuzzy neuro control for DC micro grid system used for electric vehicle. Int. J. Heavy Veh. Syst. 2022, 29, 107–120. [Google Scholar] [CrossRef]
- Yang, J.; Wang, T.; Du, C.; Min, F.; Lü, T.; Zhang, Y.; Yan, L.; Xie, J.; Yin, G. Review of Lithium-Ion Battery Model Research. Energy Storage Sci. Technol. 2019, 8, 58–64. [Google Scholar]
- Ángel, H.; Victor, R.; Damien, G. Investigation of PEM electrolyzer modeling: Electrical domain, efficiency, and specific energy consumption. Int. J. Hydrog. Energy 2020, 45, 14625–14639. [Google Scholar]
- Jiao, D.; Ma, J.; Hou, Y.; Zhang, Y.; Hao, D. Lifetime Optimization Method for Multi-Stack Fuel Cell Systems under Operating Condition Constraints. Control. Theory Appl. 2024, 1–8. [Google Scholar]
- Li, J.; Shi, Z.; Chen, L. Hierarchical Control Strategy for Electro-Hydrogen Coupled Systems Considering Multi-Stack Fuel Cell Power Distribution. Electr. Power Constr. 2024, 45, 79–88. [Google Scholar]
- Wang, X.; Tu, C.; Guo, Q.; Hou, Y.; Xiao, F. Coordinated Optimization Control Method for Hydrogen Storage Hybrid Systems Considering Multi-Stack Fuel Cell Efficiency Characteristics. Electr. Power Autom. Equip. 2023, 43, 19–26. [Google Scholar]
- Liu, M.; Li, Q.; Wang, T.; Chen, W. Adaptive Power Distribution Method for Multi-Stack Fuel Cell Power Generation Systems Considering Stack Operating Performance. Proc. CSEE 2019, 39, 6666–6677. [Google Scholar]
- Zhu, Y.; Li, Q.; Huang, W.; Shang, W.; Chen, W.; Ding, Y. Efficiency Coordinated Optimization Control for Multi-Stack Fuel Cell Systems Based on Adaptive Power Distribution. Proc. CSEE 2019, 39, 1714–1722+1868. [Google Scholar]
- Liu, J.; Luo, W.; Yang, X.; Wu, L. Robust Model-Based Fault Diagnosis for PEM Fuel Cell Air-Feed System. IEEE Trans. Ind. Electron. 2016, 63, 3261–3270. [Google Scholar] [CrossRef]
- Wang, Z.; Su, Y.; Zhang, J.; Hua, L.; Li, J. Photovoltaic Power Generation System Based on Hydrogen Energy Storage. Power Supply Technol. 2021, 45, 1333–1336. [Google Scholar]
- Falcão, D.S.; Pinto, A.M.F.R. A review on PEM electrolyzer modelling: Guidelines for beginners. J. Clean. Prod. 2020, 261, 121184. [Google Scholar] [CrossRef]
Figure 1.
System structure diagram of microgrid with hydrogen energy storage.
Figure 1.
System structure diagram of microgrid with hydrogen energy storage.
Figure 2.
Input membership functions for SOC and SOH.
Figure 2.
Input membership functions for SOC and SOH.
Figure 3.
Power allocation coefficient K.
Figure 3.
Power allocation coefficient K.
Figure 4.
Multiple fuel cell stack structure diagram.
Figure 4.
Multiple fuel cell stack structure diagram.
Figure 5.
Multiple fuel cell stack efficiency diagram.
Figure 5.
Multiple fuel cell stack efficiency diagram.
Figure 6.
System control flowchart.
Figure 6.
System control flowchart.
Figure 7.
DC bus voltage diagram.
Figure 7.
DC bus voltage diagram.
Figure 8.
System power distribution diagram.
Figure 8.
System power distribution diagram.
Figure 9.
Fuzzy control allocated fuel cell power.
Figure 9.
Fuzzy control allocated fuel cell power.
Figure 10.
SOC comparison diagram.
Figure 10.
SOC comparison diagram.
Figure 11.
SOH comparison diagram.
Figure 11.
SOH comparison diagram.
Figure 12.
System power distribution diagram.
Figure 12.
System power distribution diagram.
Figure 13.
Fuzzy control allocated fuel cell power.
Figure 13.
Fuzzy control allocated fuel cell power.
Figure 14.
SOC comparison diagram.
Figure 14.
SOC comparison diagram.
Figure 15.
SOH comparison diagram.
Figure 15.
SOH comparison diagram.
Figure 16.
System power distribution diagram.
Figure 16.
System power distribution diagram.
Figure 17.
SOC comparison diagram.
Figure 17.
SOC comparison diagram.
Figure 18.
SOH comparison diagram.
Figure 18.
SOH comparison diagram.
Table 1.
Fuzzy control rules for the PE module.
Table 1.
Fuzzy control rules for the PE module.
| | SOH | PS | M | PB |
|---|
| SOC | |
|---|
| PS | M | PB | PB |
| M | PS | M | PB |
| PB | PS | PS | M |
Table 2.
Fuzzy control rules for the FC module.
Table 2.
Fuzzy control rules for the FC module.
| | SOH | PS | M | PB |
|---|
| SOC | |
|---|
| PS | M | PS | PS |
| M | PB | M | PS |
| PB | PB | PB | M |
Table 3.
Parameters of each part of the system.
Table 3.
Parameters of each part of the system.
| Time/s | Pw/kW | Ps/kW | Pload/kW | Pd/kW | Pc/kW | Pfc/kW | Fuel Cells |
|---|
| [0–2] | 40 | 30 | 40 | 30 | 12 | 0 | 0 |
| [2–4] | 30 | 25 | 35 | −15 | 0 | 9 | 1 |
| [4–6] | 25 | 15 | 50 | 20 | 8 | 0 | 0 |
| [6–8] | 25 | 15 | 60 | −25 | 0 | 15 | 2 |
| [8–10] | 25 | 15 | 70 | −30 | 0 | 18 | 2 |
Table 4.
Parameters of each part of the system.
Table 4.
Parameters of each part of the system.
| Time/s | Pw/kW | Ps/kW | Pload/kW | Pd/kW | Pc/kW | Pfc/kW | Fuel Cells |
|---|
| [0–2] | 40 | 30 | 40 | 30 | 18 | 0 | 0 |
| [2–4] | 30 | 25 | 35 | −15 | 0 | 6 | 0 |
| [4–6] | 25 | 15 | 50 | 20 | 14 | 0 | 0 |
| [6–8] | 25 | 15 | 60 | −25 | 0 | 8.5 | 0 |
| [8–10] | 25 | 15 | 70 | −30 | 0 | 12 | 1 |
Table 5.
Parameters of Each Part of the System.
Table 5.
Parameters of Each Part of the System.
| Time/s | Pw/kW | Ps/kW | Pload/kW | Pd/kW |
|---|
| [0–2] | 40 | 30 | 40 | 30 |
| [2–4] | 30 | 25 | 35 | −15 |
| [4–6] | 25 | 15 | 50 | 20 |
| [6–8] | 25 | 15 | 60 | −25 |
| Disclaimer/Publisher’s Note: The statements, opinions and data contained in all publications are solely those of the individual author(s) and contributor(s) and not of MDPI and/or the editor(s). MDPI and/or the editor(s) disclaim responsibility for any injury to people or property resulting from any ideas, methods, instructions or products referred to in the content. |
© 2025 by the authors. Licensee MDPI, Basel, Switzerland. This article is an open access article distributed under the terms and conditions of the Creative Commons Attribution (CC BY) license (https://creativecommons.org/licenses/by/4.0/).


