1. Introduction
Currently, photovoltaic technologies have gained global prominence because of increasing awareness of environmental issues and the demand for sustainable energy solutions. These technologies demonstrate significant competitiveness compared to other renewable energy sources, particularly due to their unique ability to directly convert solar energy into electricity through photovoltaic effects. These characteristics position solar photovoltaic energy as one of the primary alternatives for diversifying the global energy matrix and substantially contribute to sustainable energy transition [
1,
2].
However, the implementation of PV systems in urban environments presents significant challenges, primarily due to the limited availability of space for installing solar panels. In densely built areas, rooftops and coverings are often the only available locations, thus limiting the potential for energy generation. To overcome these restrictions, it is essential to explore and maximize the use of other surfaces, such as building facades, by integrating photovoltaic systems into architectural design [
3].
The integration of photovoltaic modules into facades (building-integrated photovoltaic—BIPV) is an innovative approach that transforms architectural elements into solar energy generators, utilizing vertical surfaces that are traditionally not used for this purpose. These modules can be applied in transparent or semi-transparent forms on glass, such as windows, or integrated into cladding materials, such as tiles and metal panels. In addition to adding a modern esthetic to buildings, local energy generation from these vertical surfaces can significantly reduce long-term energy costs, thereby promoting sustainability and energy self-sufficiency in buildings [
4].
The field of photovoltaic integration in buildings is constantly evolving because of advances in photovoltaic materials, energy storage systems, and integration technologies. These developments can make BIPV systems more accessible, efficient, and applicable to a wide range of architectural projects, from small constructions to large urban developments [
5].
The performance of PV systems on windows and facades is affected by factors such as geographic location and climatic conditions. Parameters such as solar irradiance, ambient temperature, and dirt accumulation on the surface of the modules play crucial roles in the efficiency and longevity of photovoltaic conversion. Therefore, a detailed analysis of these factors is essential for the planning and optimization of integrated photovoltaic systems in buildings, especially in urban contexts where environmental variables can vary significantly [
6,
7,
8,
9].
Although the analysis of these systems can be performed manually, the use of simulation software allows for more detailed and precise evaluation. PVsyst, for example, is a widely used tool for analyzing multiple performance parameters of photovoltaic systems. The proposed software provides detailed estimates of electricity generation considering local characteristics and climate patterns throughout the year [
10].
Recent studies have demonstrated the effectiveness of the PVsyst software in the detailed analysis of building-integrated photovoltaic systems (BIPV). Essah et al. [
11] conducted PVsyst simulations to assess the performance, yield, and aging characteristics of a polycrystalline silicon cell PV system integrated into the facade of the Engineering Building at the University of Reading. Shakouri et al. [
12] investigated the effects of a double-skin photovoltaic facade on energy generation, cooling, and thermal load reduction. They used PVsyst to evaluate energy generation and DesignBuilder to calculate the demand, focusing on incorporating PV modules as a retrofit strategy.
Jeong et al. [
13] compared the output power of a colored BIPV system simulated by PVsyst using meteorological data from the Korea Meteorological Administration (KMA) and measured irradiance data. Hamzah and Go [
14] analyzed the performance of colored BIPV systems in a building located in a tropical region of Malaysia, combining 3D modeling in Building Information Modeling (BIM) software with detailed solar analysis in PVsyst to obtain precise results. Yang et al. [
15] modeled complex BIPV systems installed on roofs, facades, and coverings of buildings in Zhuhai, China, using different simulation tools, including PVsyst, to investigate the capabilities and limitations of these technologies.
Demir and Aktacir [
16] investigated strategies to maximize the efficiency of building-integrated photovoltaic (BIPV) systems under specific meteorological conditions in Şanlıurfa, Turkey. The study focused on comparing the performance of monofacial and bifacial panels installed on different building surfaces using experimental methods and simulations with the PVsyst software. Yu et al. [
17] optimized the operation of BIPV systems and evaluated their environmental and economic benefits. The study used PVsyst to simulate the energy performance of building-integrated photovoltaic systems and PV-BILD to assess the environmental and economic impacts throughout the lifecycle of BIPV systems.
Zhang et al. [
18] optimized building-integrated photovoltaic (BIPV) systems in a high-rise building in Shenzhen, China, to improve its energy efficiency. The PVsyst software was used to simulate the energy performance of the PV system in different scenarios, considering the location, solar irradiance, and shading. The analysis involved optimizing the panel layout and assessing its technical and economic feasibility.
In this context, this paper aims to analyze the electrical performance of a BIPV system consisting of a monocrystalline silicon photovoltaic window installed on a facade in the city of João Pessoa, Paraíba, Brazil, using PVsyst software. Additionally, the analysis involves the design and construction of an experimental setup, focusing on evaluating efficiency under specific climatic conditions, considering factors such as solar irradiance, ambient temperature, and other critical parameters for optimizing energy performance.
This type of BIPV system is often referred to as a PV window. The adoption of semi-transparent photovoltaic (PV) windows in buildings has emerged as a relevant trend in sustainable design because they simultaneously combine thermal insulation, daylighting, and energy generation. However, this application requires careful analysis to determine the optimal window orientation.
Jamala et al. [
19] performed computational modeling and simulation using Rhinoceros and Grasshopper for a prototype building with a single semi-transparent monocrystalline PV window, considering the climate of Gowa, Indonesia (5.2° S). They investigated the uncertainty of weighting factors in optimizing the PV window orientation by considering several annual daylight and energy performance metrics. The results indicated that the south orientation was the most advantageous in 73% of the cases, followed by the east (24%) and north (3%). When each group of metrics was given a single weight, the south orientation remained the best in 62% of the cases.
Guo et al. [
20] conducted experimental tests using naturally ventilated double-pane PV windows and validated the model in EnergyPlus. Using the validated model, the energy performance of the windows was analyzed in five typical climates in China. The south-facing windows showed the lowest electricity consumption in the Harbin, Beijing, Shanghai, and Lhasa climates. However, east-facing windows exhibited the lowest electricity consumption in the Shenzhen climate.
This work’s main contribution is the identification of the optimal orientation of the monocrystalline PV window that provides the best annual electrical performance for a BIPV system. This study, the first of its kind in this city, offers important insights and establishes a reliable criterion for optimizing the design of PV windows in the southern hemisphere.
2. Location Characterization
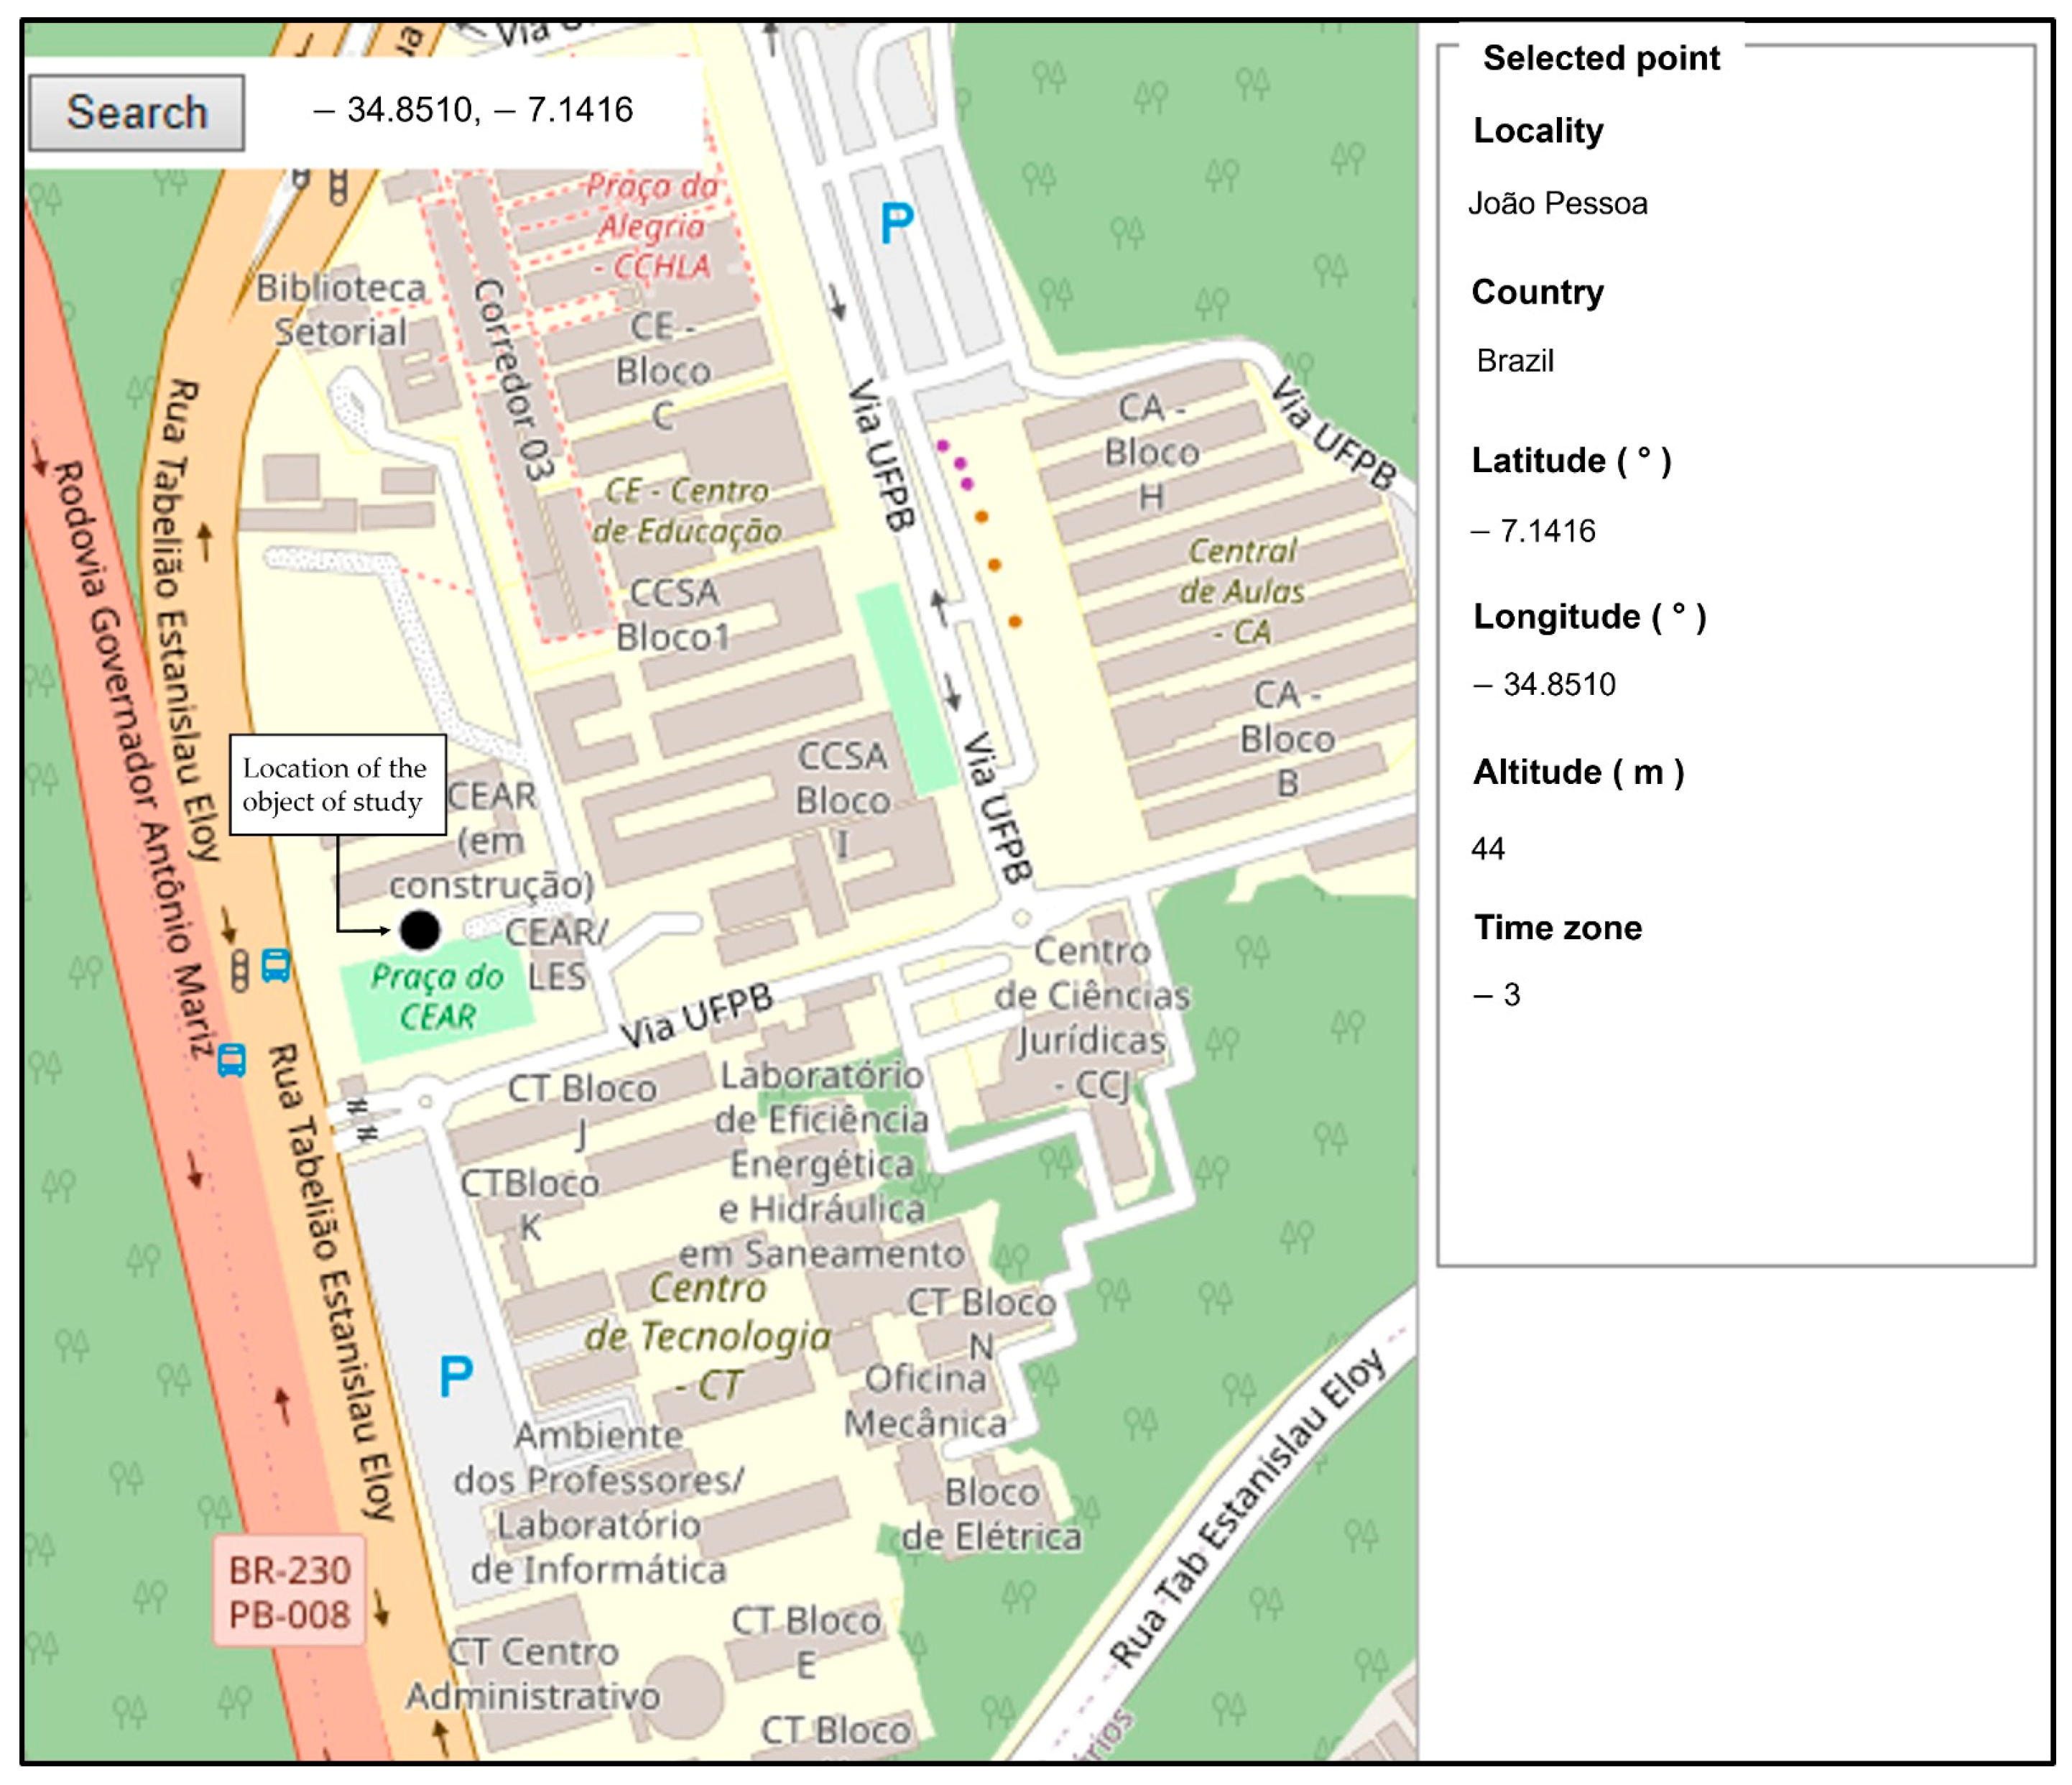
The present study was conducted at the Center for Alternative and Renewable Energies (CEAR) at the Federal University of Paraíba (UFPB), located at the João Pessoa campus, in the capital of the State of Paraíba, Brazil, at approximate coordinates of 7.12° south and 34.86° west, near the Equator. This geographic location ensures high solar radiation incidence throughout the year, thereby favoring the efficiency of photovoltaic systems. The choice of João Pessoa for the installation of the building-integrated photovoltaic system was made not only because of the favorable climatic conditions but also because of the scarcity of regional studies on photovoltaic systems applied to vertical facades (90° orientation), contributing to filling gaps in the scientific literature and promoting the development of this technology under the typical climatic conditions of Northeast Brazil.
The Paraíba state is located in the Northeast Region of Brazil and borders Rio Grande do Norte to the north, Pernambuco to the south, Ceará to the west, and the Atlantic Ocean to the east. It comprises 223 municipalities, according to the Brazilian Institute of Geography and Statistics (IBGE) [
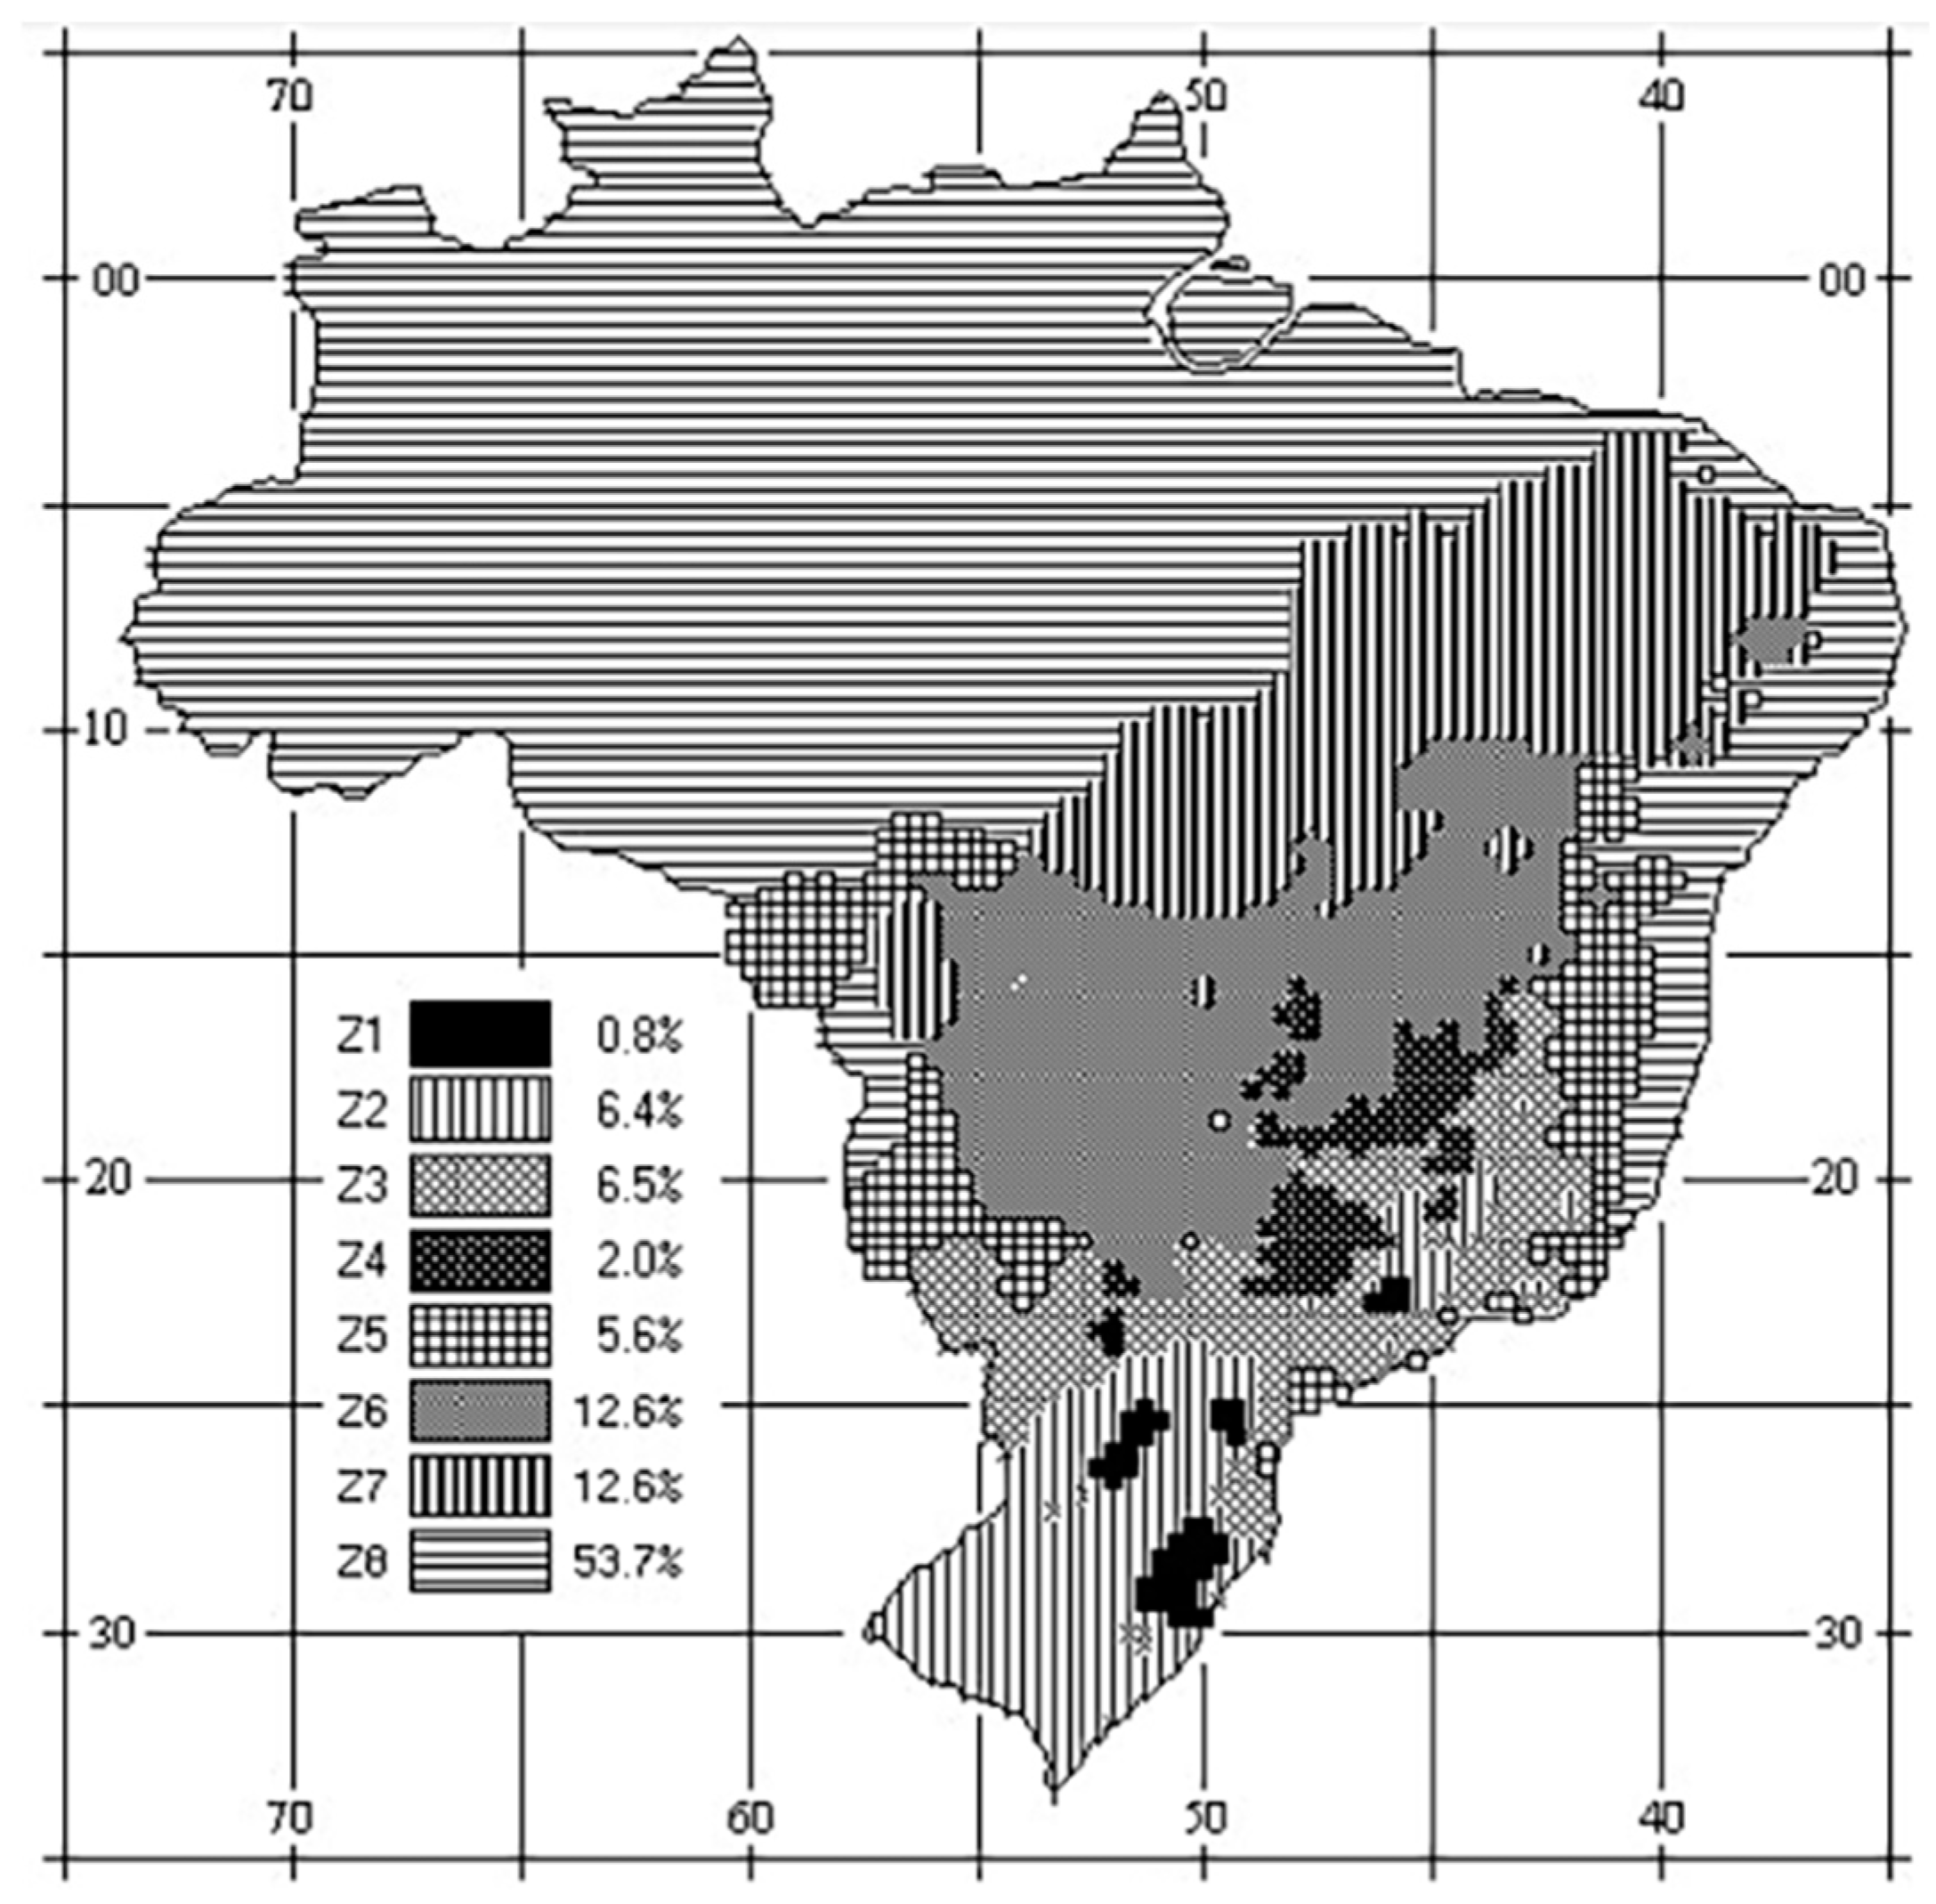
21] and exhibits semi-arid and tropical humid climates. It is situated in bioclimatic zone 8 according to the NBR 15220-3 standard [
22]. This classification defines climatic regions in Brazil based on average monthly maximum and minimum temperatures and relative humidity.
Bioclimatic zone 8 covers 53.7% of Brazil’s territory, as shown in
Figure 1, and is concentrated in the northernmost areas, including humid equatorial climate zones such as the Amazon. The main characteristics of this region include high year-round temperatures, high relative humidity, and minimal daily temperature variation. These regions are located between the Tropic of Capricorn and the Equator [
23].
The rainfall regime in Paraíba exhibits two distinct rainy seasons that are influenced by regional atmospheric systems. In the Sertão and Alto Sertão regions, which cover the west and north of the Borborema Plateau, rainfall occurs between February and May. The rainy season occurs from April to July on the coast and in adjacent areas to the east. This seasonal variation is modulated by the trade wind circulation, the Intertropical Convergence Zone (ZCIT), and other regional atmospheric systems and is influenced by the geographic diversity across the Paraíba state [
24].
Paraíba has high solar radiation levels, indicating its significant potential for renewable energy use. In João Pessoa, the annual average solar radiation is 5.53 kWh/(m
2day), according to data from the Reference Center for Solar and Wind Energy Sérgio de S. Brito (CRESESB) [
25], which positioned the city as a strategic location for the application of photovoltaic technologies. This scenario stimulates scientific research and promotes the integration of PV systems, contributing to the diversification of the energy matrix and strengthening sustainability in urban areas.
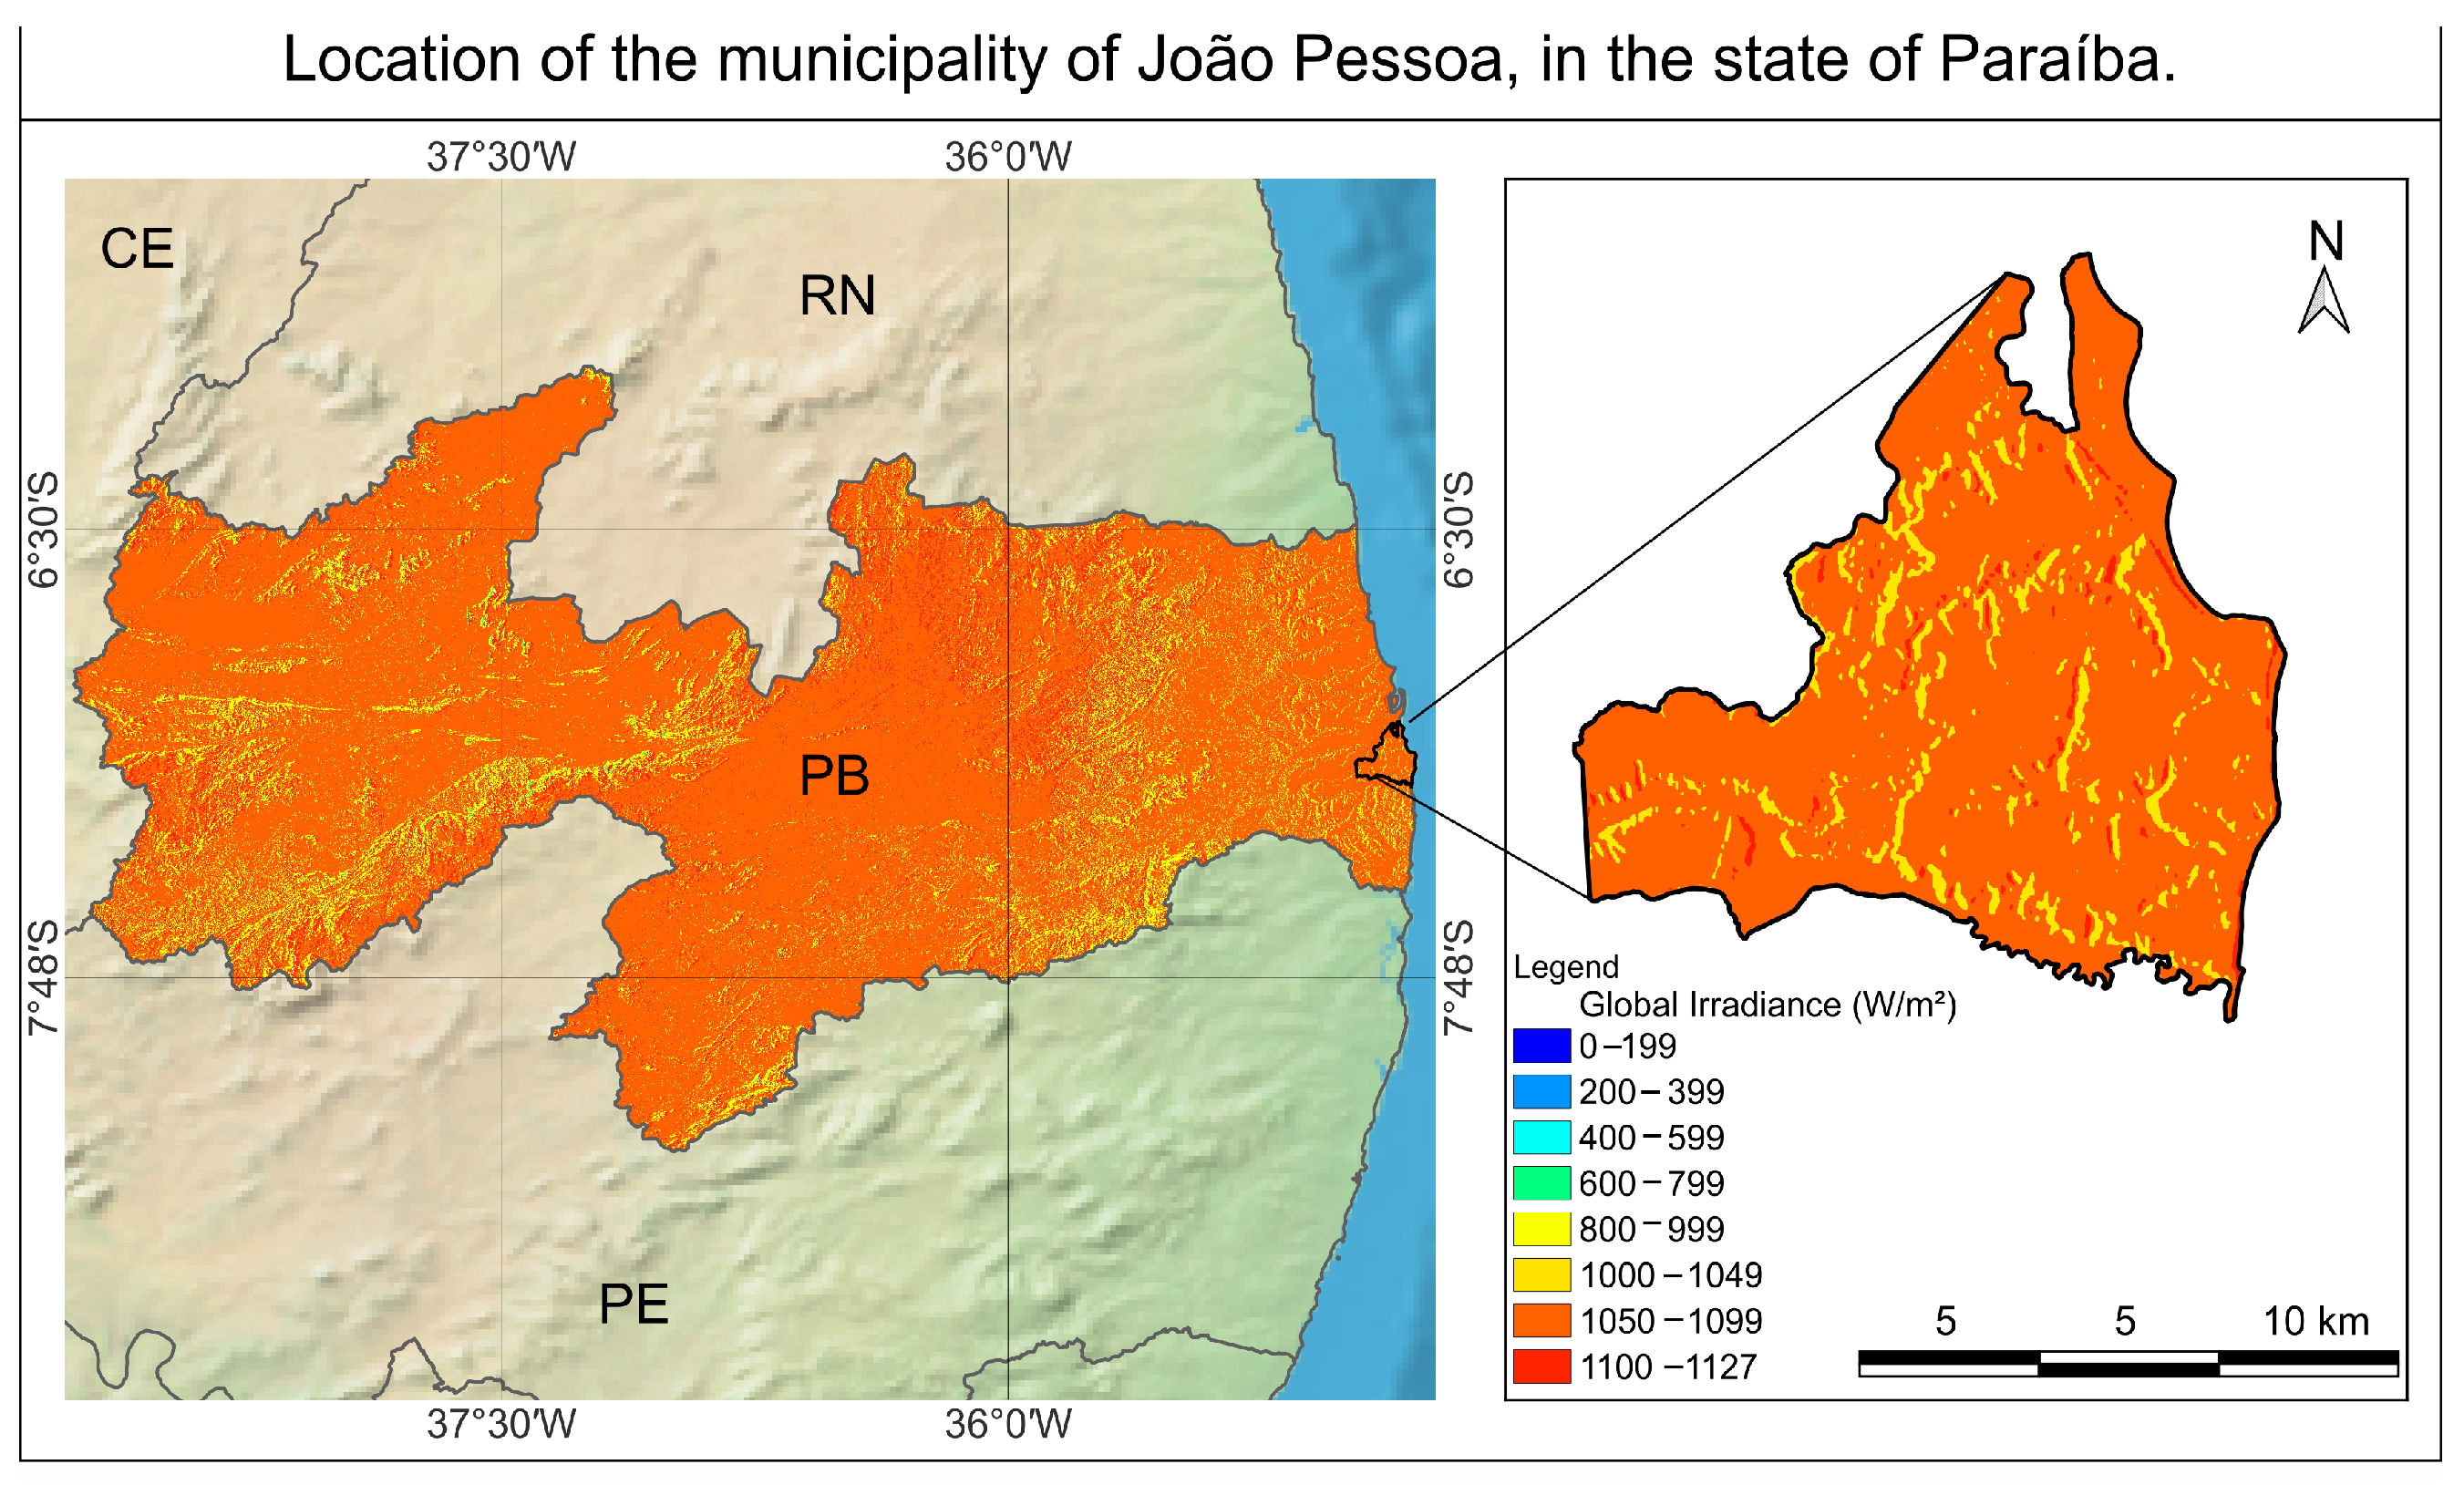
The levels of Horizontal Global Irradiance (GHI) in the territory of Paraíba, with a focus on João Pessoa, are presented in
Figure 2, which illustrates the spatial distribution of solar radiation across the state. The graph was created using QGIS 3.34.12 software [
26], a Geographic Information System (GIS) tool widely used for processing and visualizing georeferenced data. QGIS allows for the integration and analysis of multiple information layers to create thematic maps and precise geospatial models.
For the creation of
Figure 2, data from the National Institute for Space Research (INPE) [
27] and the Brazilian Institute of Geography and Statistics (IBGE) [
28] were used, including information on altitude, slope, relief, and global radiation indexes across the state. This integrated approach enabled the identification of areas with higher solar energy potential, with an emphasis on the urban regions of João Pessoa.
3. Materials and Methods
3.1. BIPV System Characterization
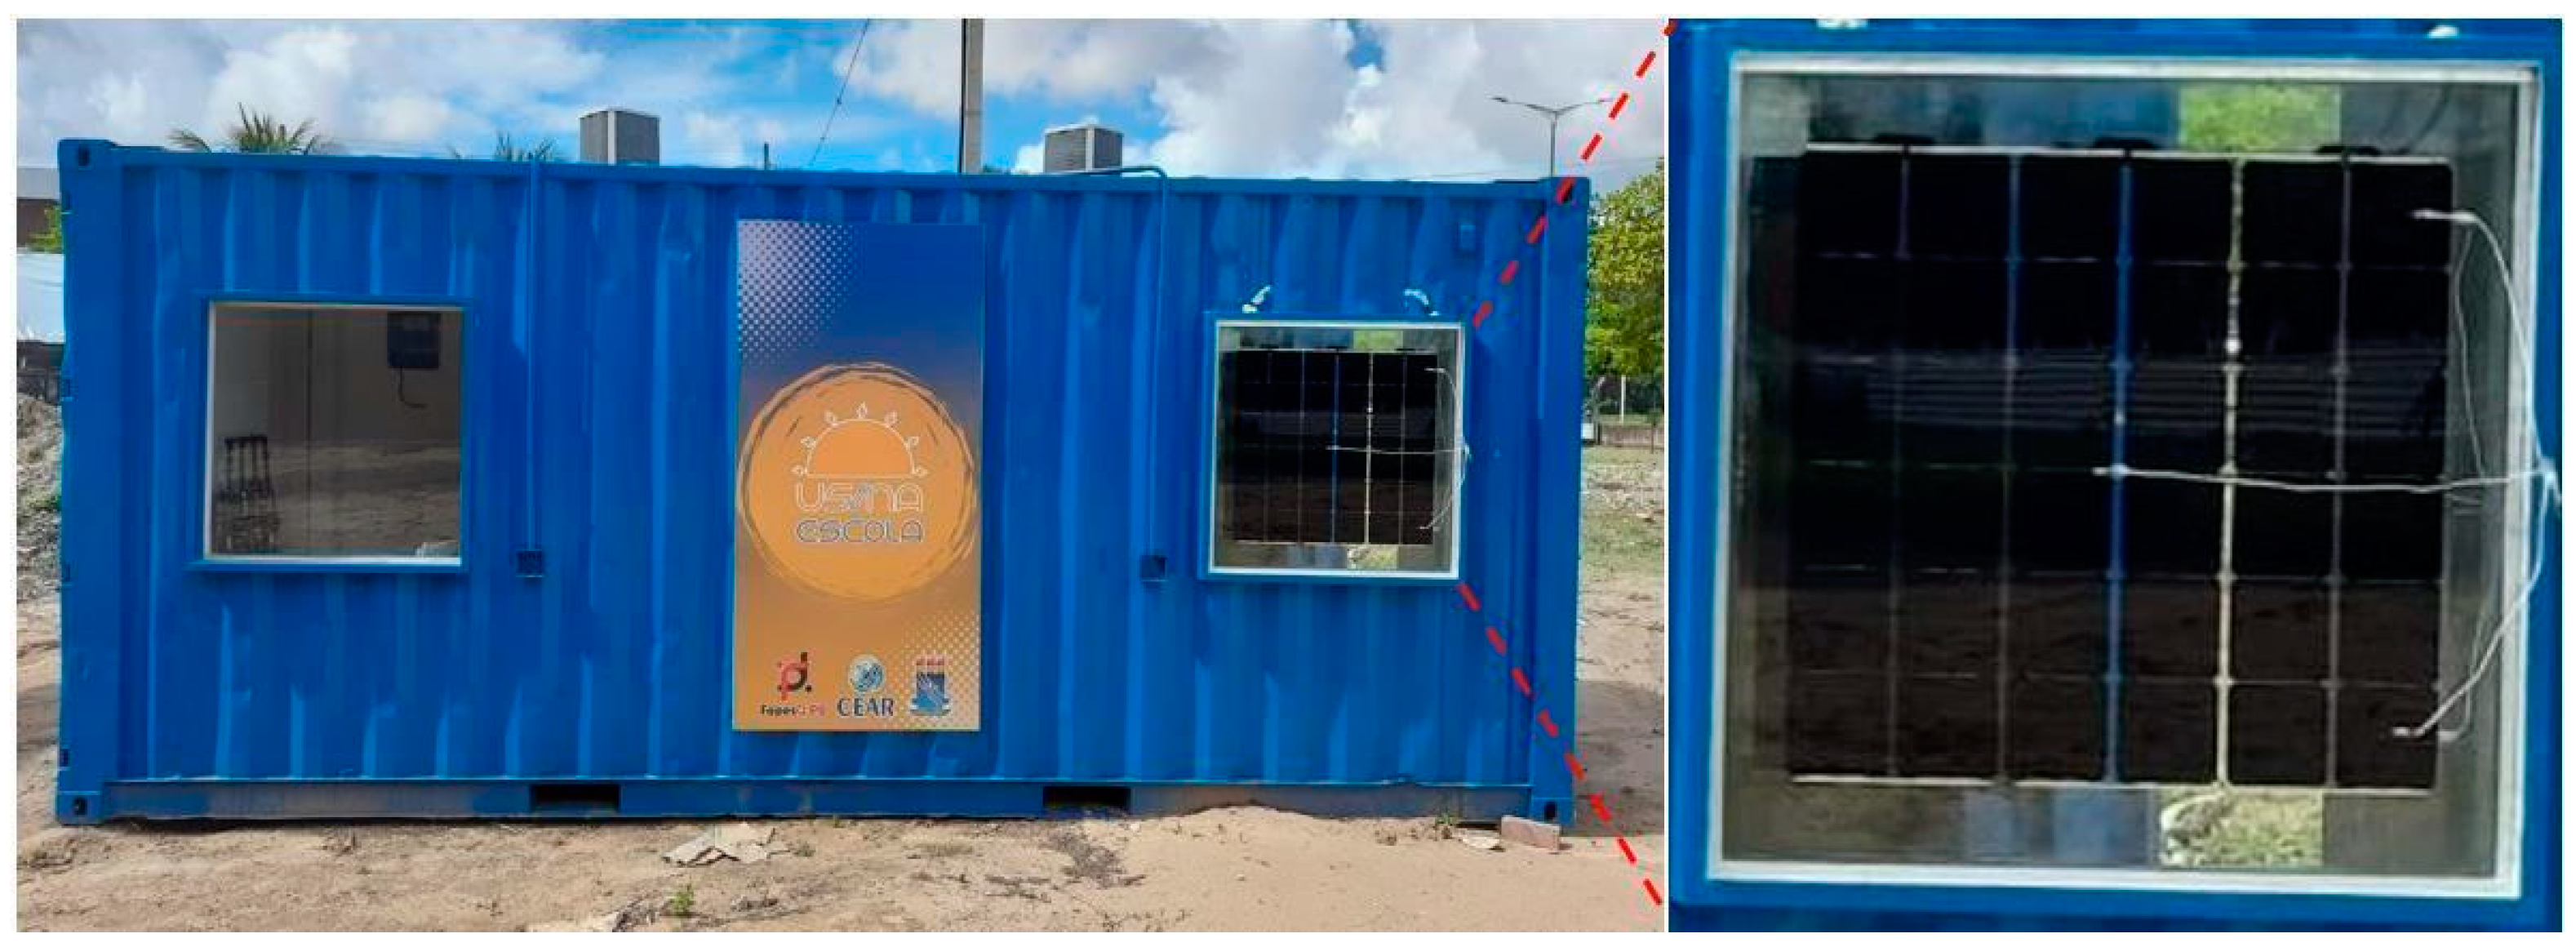
The present study focuses on the electrical performance analysis of a BIPV system composed of a 132 Wp photovoltaic module with monocrystalline silicon (Si-mono) cells and 25% efficiency under standard test conditions (STC). The module, encapsulated between two 5 mm layers of translucent glass, was installed vertically at a 90° angle on the facade of a container, functioning as a double-glazed window.
The installation was designed with a 50 mm gap between the module and the inner glass, creating a stagnant air gap. The system, shown in
Figure 3, is connected to the Paraíba electrical grid via a 130 Wp microinverter with maximum power point tracking (MPPT) and is currently oriented toward the north. Information about the key system components is presented in
Table 1.
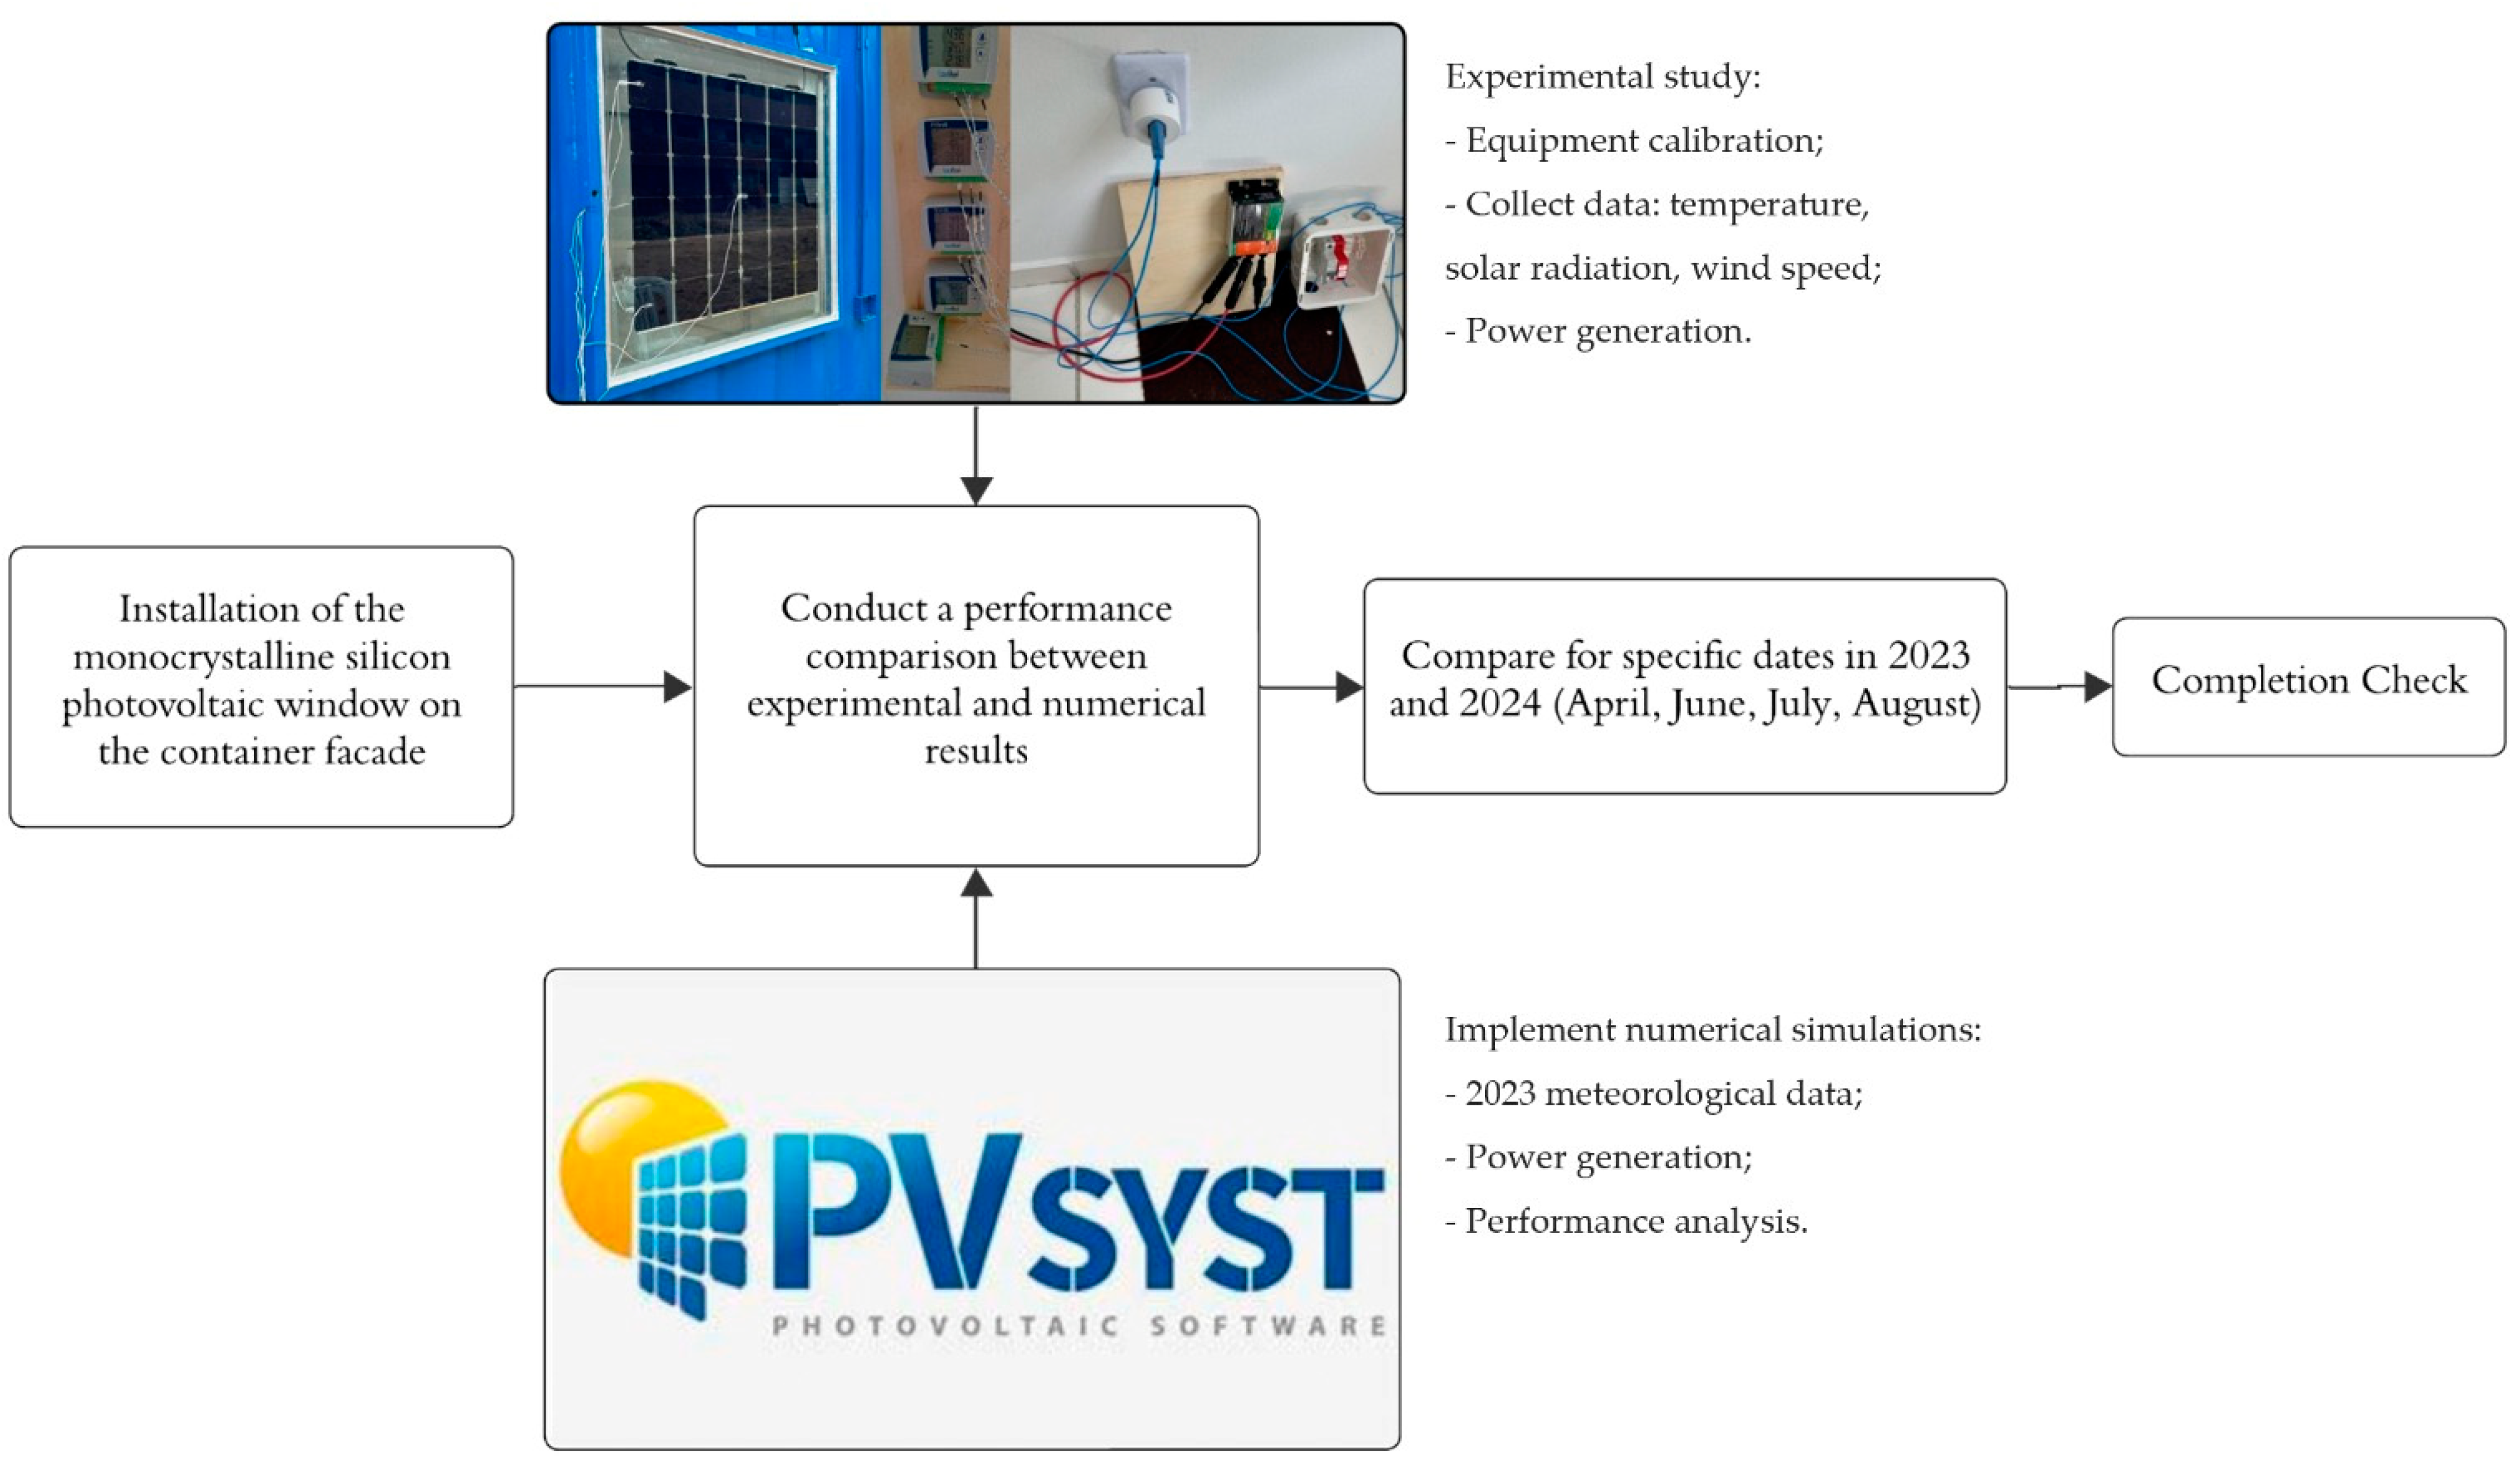
This configuration was chosen to evaluate the performance of the system integrated into buildings considering local environmental variables such as solar irradiance and ambient temperature through two complementary methods: simulation and experimental. In the simulation method, simulations were performed to estimate energy production throughout 2023, considering the orientations north, south, east, and west, aiming to identify the most efficient orientation for 90° photovoltaic modules on vertical facades in João Pessoa, as well as to assess the influence of climatic variations on electrical performance.
The experimental method involved collecting energy production data on specific days in 2024 to improve the understanding of the real operational conditions of the system. This combined approach will allow for a detailed analysis of the electrical performance of the BIPV system, considering both simulations based on annual climatic models and field-observed results.
The methodological flow of this study is schematically represented in the flowchart shown in
Figure 4.
3.2. Experimental Method
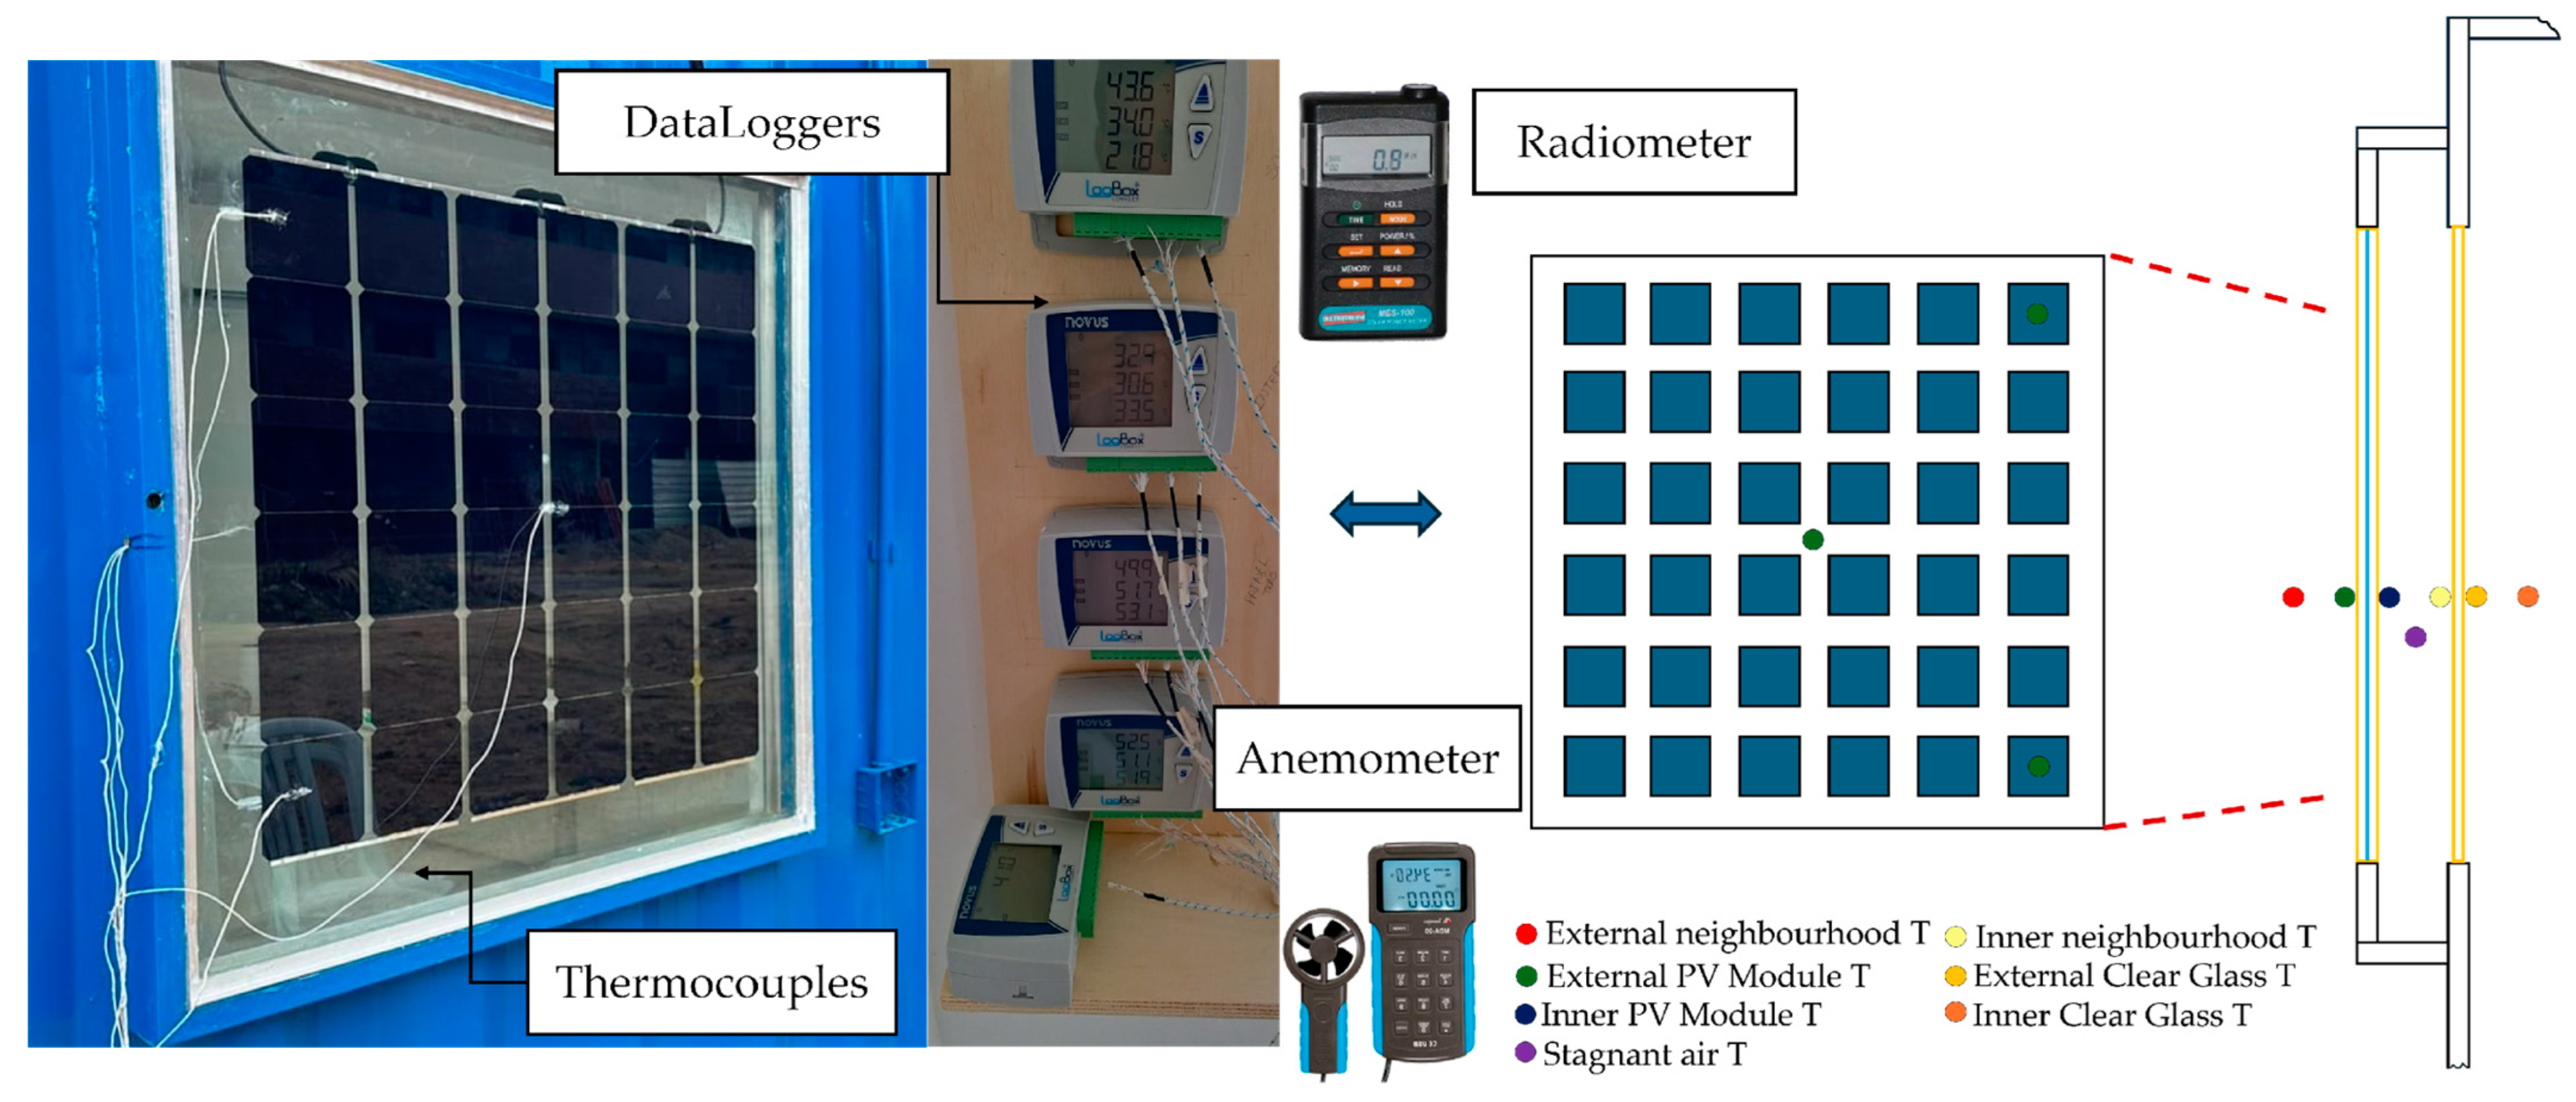
In the experimental method, data on temperature, wind speed, and solar radiation on the surface of the photovoltaic module were collected to ensure greater accuracy in the results. Temperatures were measured using 13 type K thermocouples strategically positioned and connected to Novus dataloggers. Three thermocouples were installed on the external surface of the module, three on the internal surface, four on the internal and external surfaces of the window glass, and three others to monitor the air temperatures inside and outside the container, as well as in the cavity air gap.
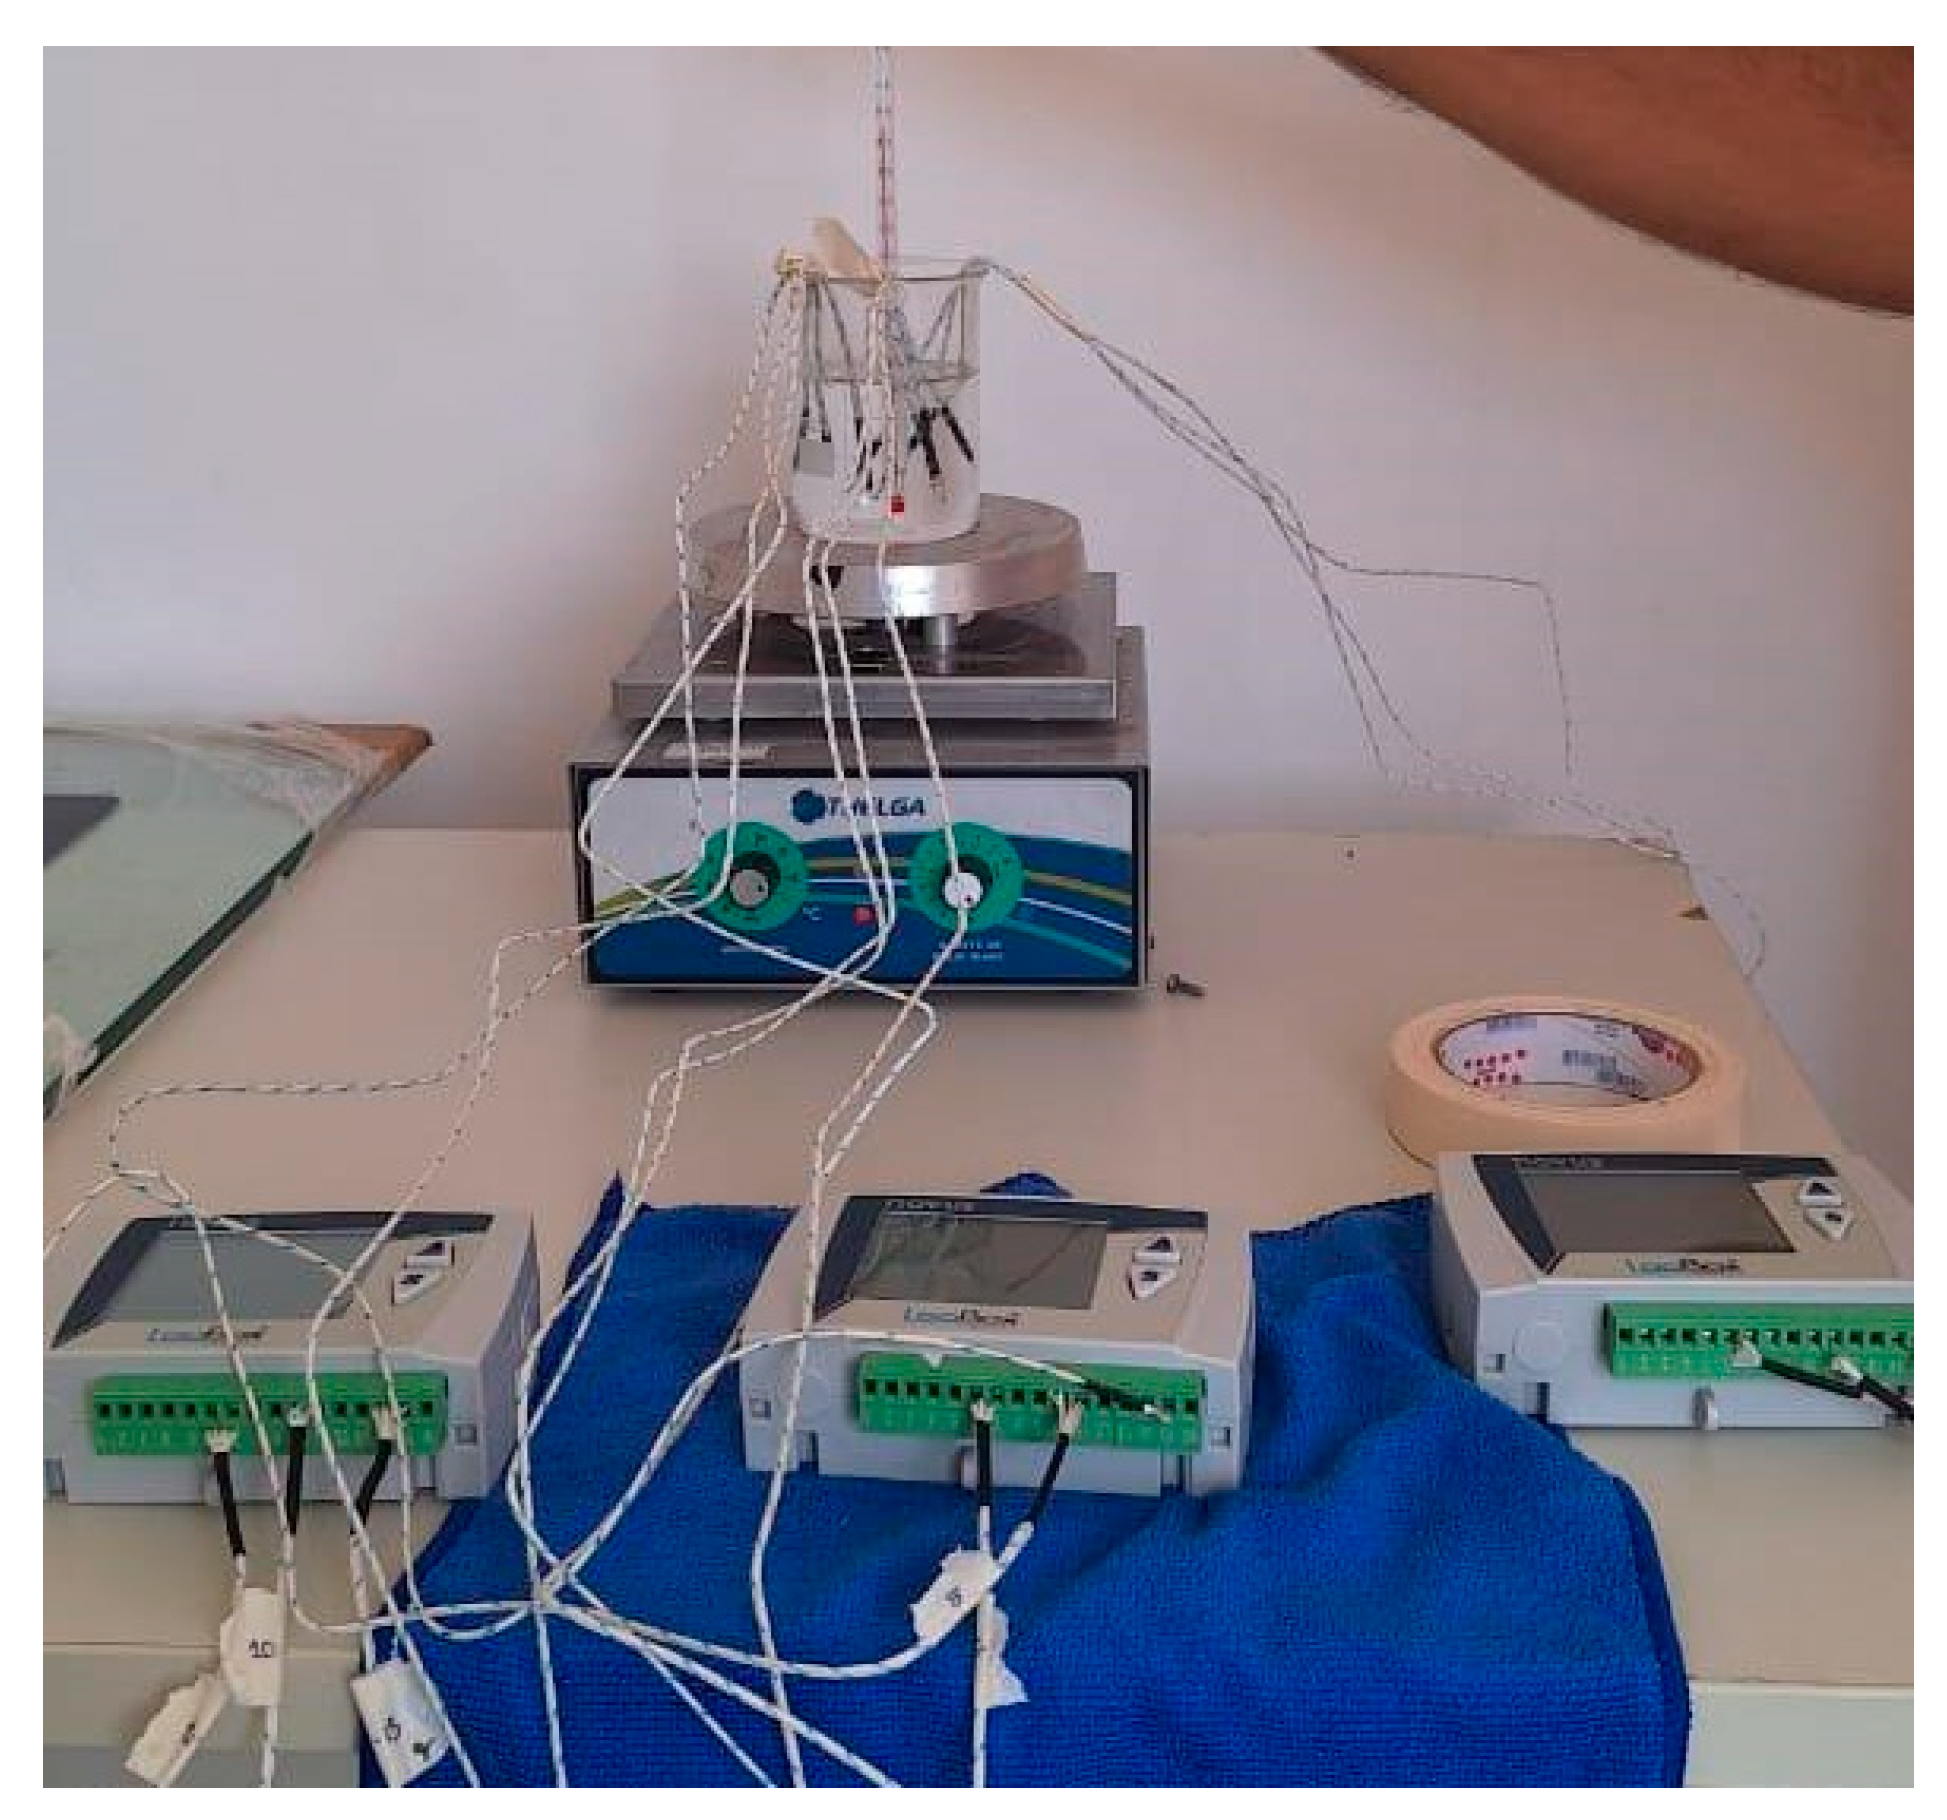
The thermocouples were calibrated using a high-resolution thermometer with an accuracy of 0.1 °C. The thermometer was stabilized at ambient temperature, and the thermocouples were immersed in water until they reached thermal equilibrium with the thermometer. The water temperature was gradually increased using a magnetic stirrer with a heating function (
Figure 5) until reaching values close to 100 °C.
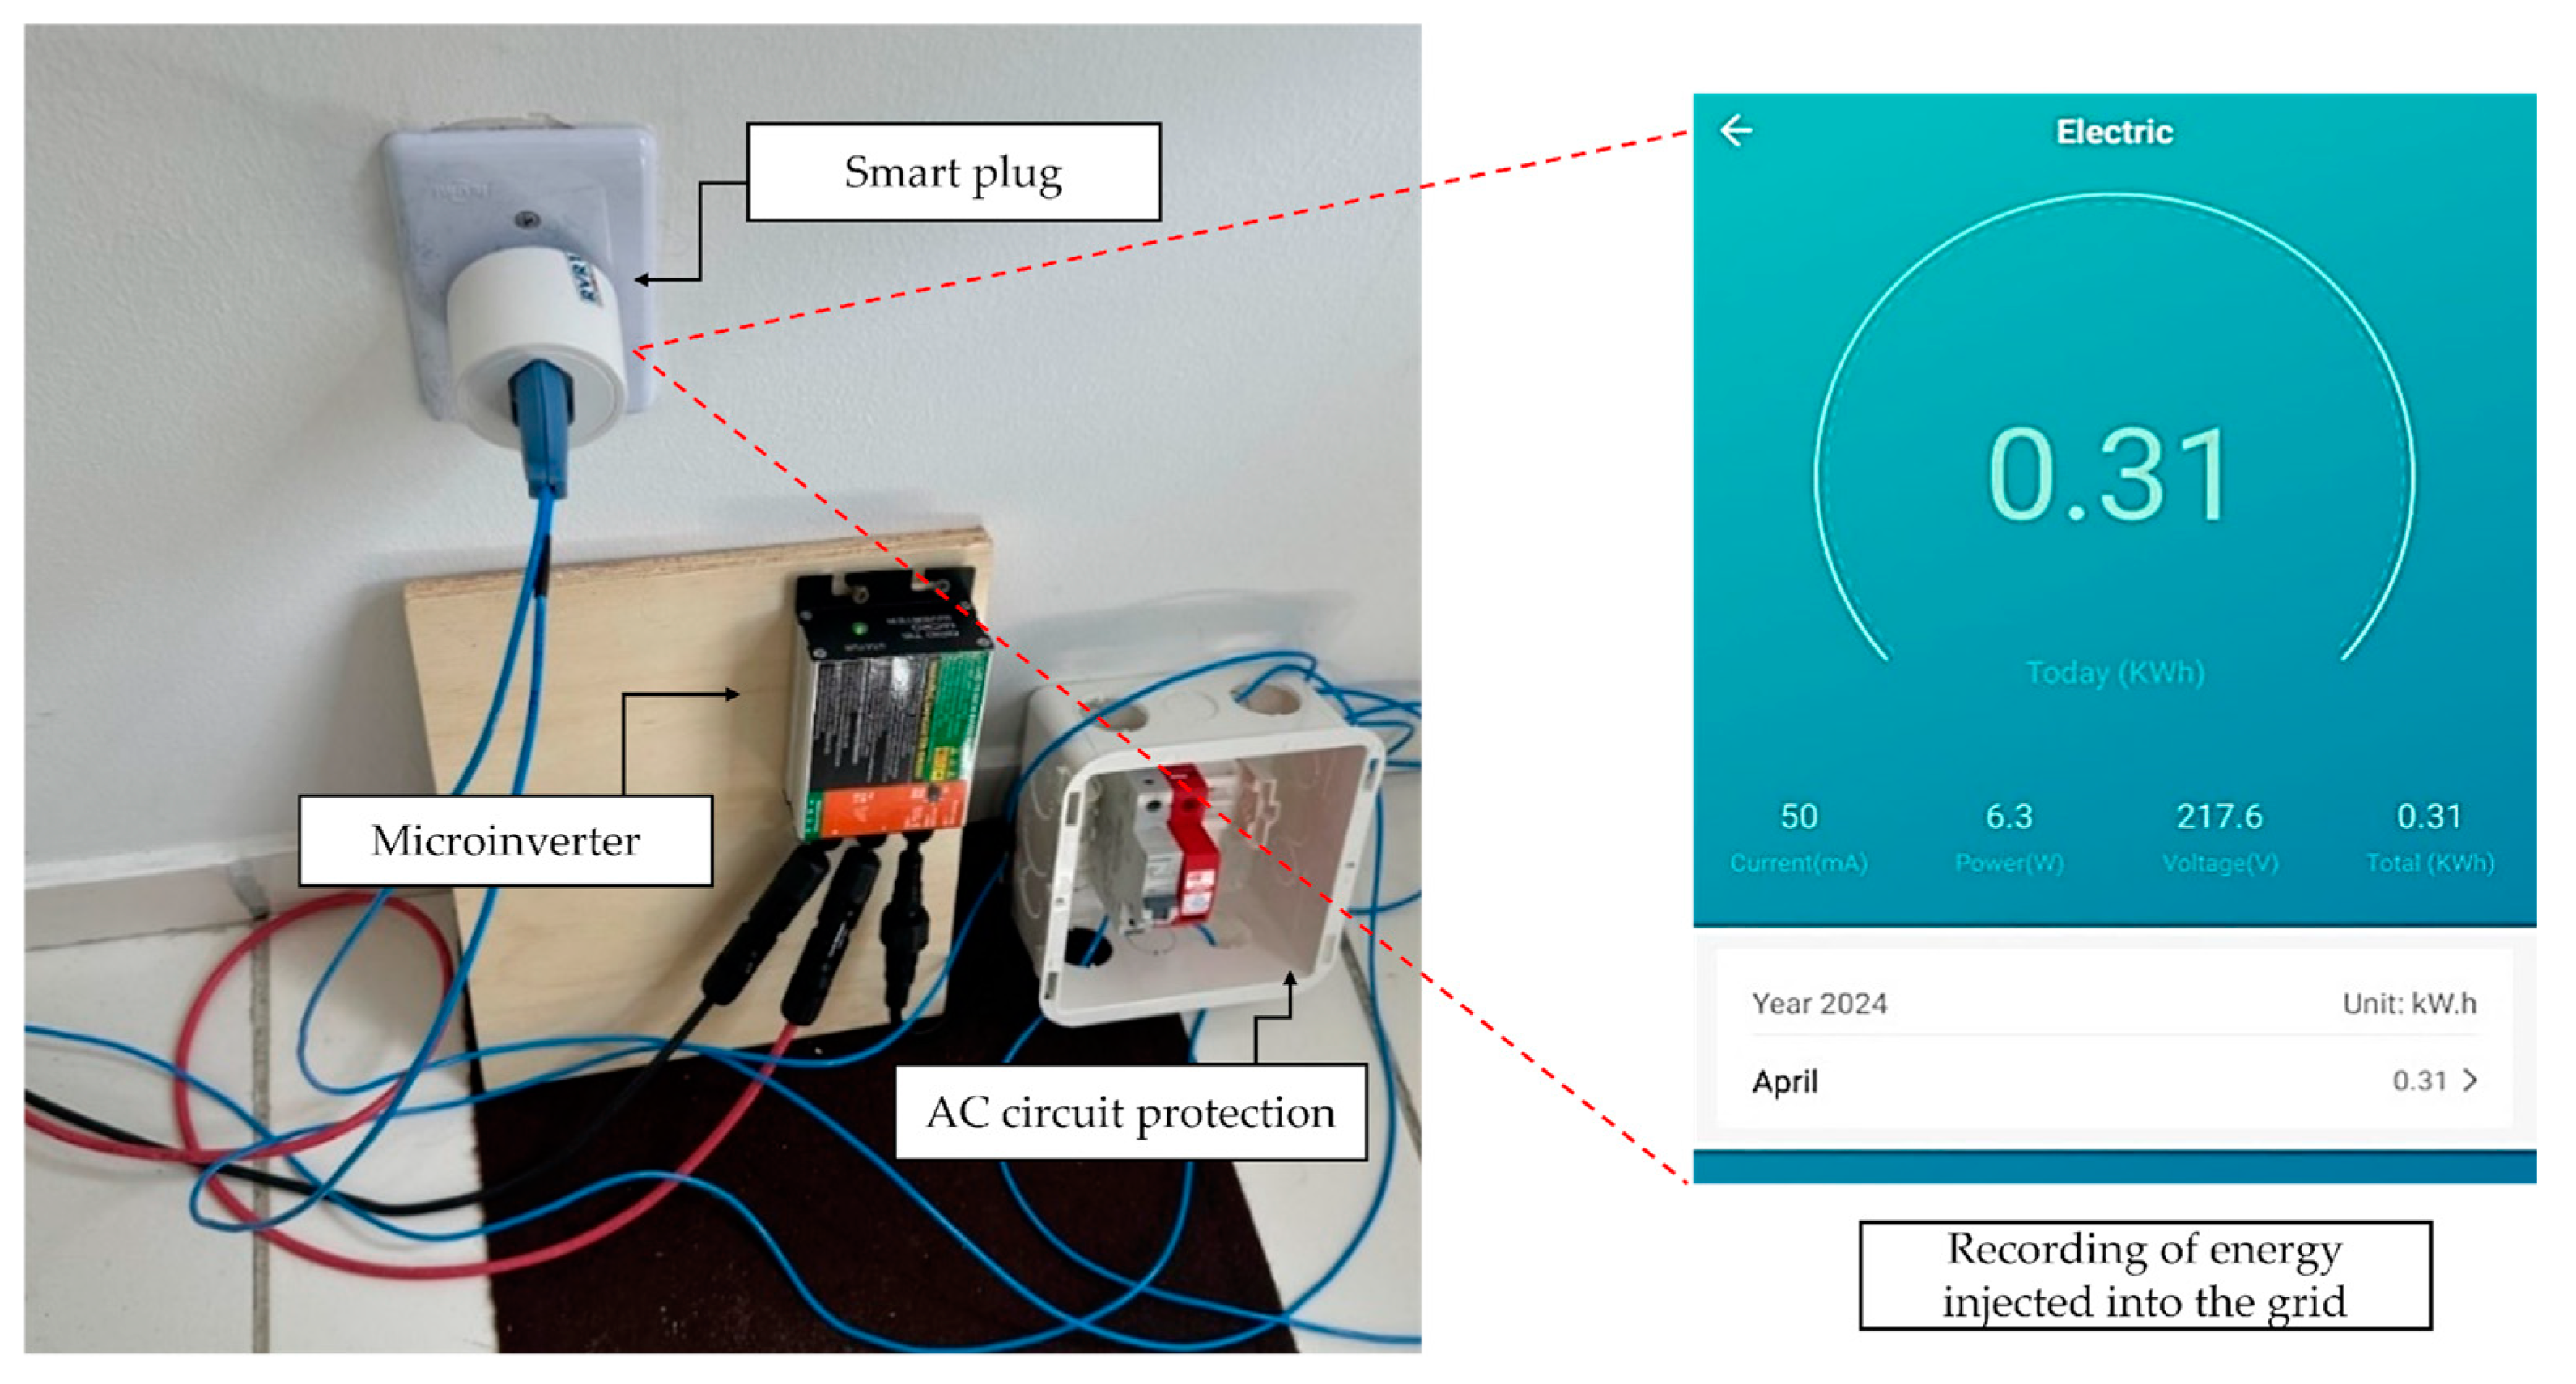
Wind speeds were measured at 1.5 m above the ground using a digital anemometer (MDA-20), while global direct (Hor.Global) and diffuse (Hor.Diffuse) horizontal solar radiation was recorded by a digital radiometer positioned in front of the module, ensuring measurement accuracy. Finally, the amount of energy injected into the power distribution grid was recorded using a smart plug, which collected data on the produced power, current, and voltage.
Figure 6 shows the arrangement of the thermocouples and the instruments.
Figure 7 shows a smart plug for recording energy injected into the grid.
Table 2 shows the instrument’s precision in detail.
Data collection took place in 2024 on 23–25 April; 21, 26, and 28 June; 17–19 July; and 23, 26, and 27 August, between 8:00 AM and 4:00 PM, with measurements taken every 20 min, which can be consulted in
Table 3.
3.3. Simulation Method
For the simulation method, an electrical simulation was performed using PVsyst software to analyze the performance of a PV system under different orientations (north, south, east, and west), considering the amount of energy produced and injected into the grid under these conditions. Pvsyst was selected because of its wide recognition in the solar energy industry and its established application in academic studies, as discussed in the first section of this article. Although it is commercial software, it was used during the 30-day free trial period, enabling analysis without additional costs.
Pvsyst allows for the consideration of essential variables such as geographic location, module tilt, the technical specifications of the system components, and local climatic variations, making the simulation highly representative of real operating conditions.
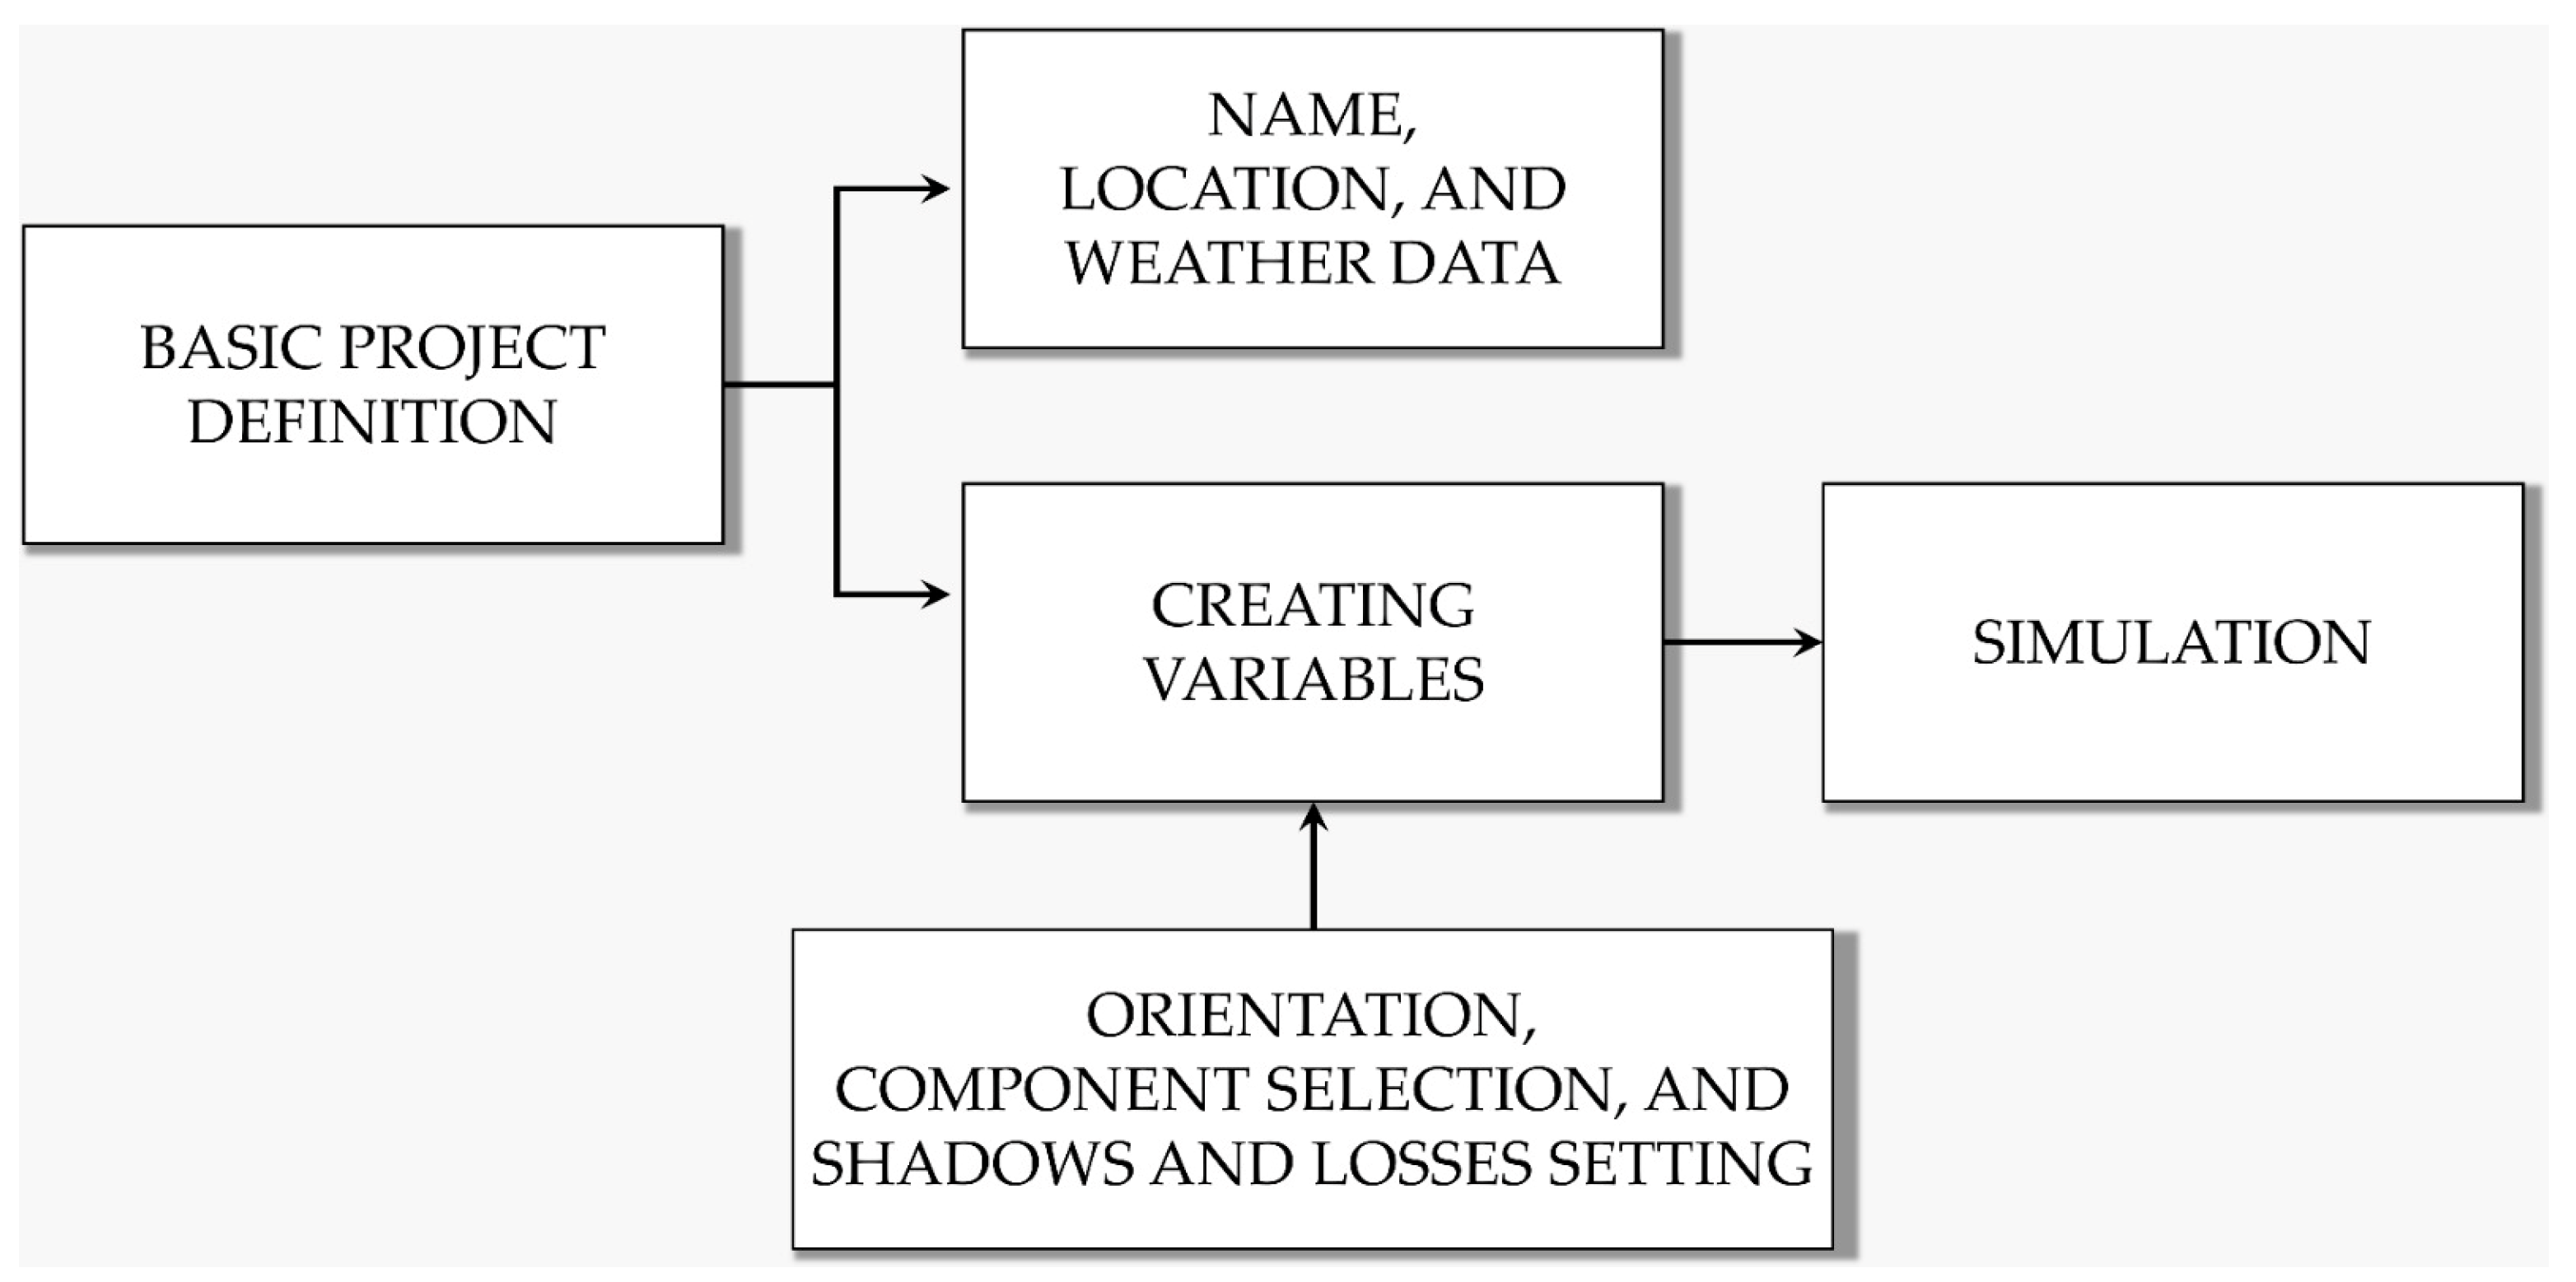
Figure 8 shows a diagram of the simulation steps performed.
The location was defined using the software’s interactive map, and its interface is presented in
Figure 9. Based on the selected location, Pvsyst automatically imports the meteorological data required for the simulation into its monthly meteorological database. These data were sourced from reliable internal databases, including NASA, Meteonorm, and SAM, as well as external databases such as those provided by INPE and field measurements.
For this analysis, meteorological data collected in 2023 from the Solarimetric Station of the Federal University of Paraíba were used. These data include measurements of direct (Hor.Global) and diffuse horizontal irradiation (Hor.Diffuse) (kWh/m
2), ambient temperature (°C), and wind speed (m/s), which are essential for the software simulation. Data were collected at 10 min intervals throughout the year, ensuring adequate temporal resolution for analyzing climatic variations and their impact on the photovoltaic system’s performance, and are presented in
Table 4.
After inputting the meteorological data, Pvsyst enables the configuration of module orientations, specification of system components (such as inverters and photovoltaic modules), and calculation of system losses during operation. These losses are determined based on factors such as shading, inverter efficiency, thermal losses, and electrical losses, thereby allowing for a precise estimation of energy production and system performance under various operating conditions.
The performance evaluation of a photovoltaic system considers several factors, such as pollution, ohmic losses, variations in the angle of incidence, and temperature, which affect the energy conversion efficiency. These factors contribute to the system’s annual losses and are essential for accurately estimating solar yield.
The calculation begins with the global irradiance on the horizontal plane, which is obtained by summing the monthly local irradiance values throughout the year. When directed toward the photovoltaic module plane, losses such as shading and soiling are considered, which reduce the conversion efficiency. In this study, the soiling loss over a year was set at 3%, as determined using the Pvsyst software.
Pvsyst also considers a 3D model of the system, accounting for the system’s geometry, the sun’s varying position throughout the year, and the potential shading caused by surrounding obstacles, which allows for precise tracking of the solar movement and its impact on the photovoltaic system’s performance.
Losses related to the angle of incidence reflect how the inclination of the photovoltaic module affects its absorption capacity, with this relationship being inversely proportional. In other words, when sunlight strikes the module at a steep angle, the absorption efficiency decreases. According to Abella et al. [
29], the Pvsyst software calculates these losses using the ASHRAE (American Society of Heating, Refrigerating, and Air-Conditioning Engineers) [
30] parameterization, as shown in Equation (1).
where
b0 = 0.05 for crystalline modules, and
I corresponds to the angle of incidence.
Furthermore, the photovoltaic process involves losses due to fluctuations in solar irradiance and increased temperature, which reduce the open-circuit voltage and decrease the energy conversion efficiency. Additional losses occur in the wiring due to the electrical resistance of the conductors and connectors, causing heat dissipation and further reducing the efficiency.
The system efficiency is also influenced by the module temperature, as higher temperatures reduce the open-circuit voltage and energy conversion. The heat transfer coefficient, U, which depends on the wind conditions, was set at 15 W/m
2·K for modules with an insulated rear side, which is common in BIPV systems. Thermal losses were evaluated using Faiman’s [
31] heat transfer model, as shown in Equation (2).
where
is the irradiance of the panel [W/m
2];
U is the heat transfer coefficient [W/(m
2K)];
is the absorptivity of the photovoltaic panel, adopted as 0.90;
is the efficiency of the photovoltaic panel; and ant is the ambient temperature [°C].
The ohmic losses were calculated based on the resistances of the direct current (DC) and alternating current (AC) cables. Under standard test conditions (STC), the software estimated an ohmic loss of 1.5%. When the conditions differ from the STC, the resistance is adjusted according to the length and cross-section of the cables, resulting in resistive losses of approximately 60% of the STC value. These losses vary quadratically with the current in the circuit, as shown in Equation (3).
Losses in the microinverters were calculated based on their efficiency in converting direct current (DC) to alternating current (AC) using the efficiency curve of the devices, represented by Equation (4). The nighttime consumption was estimated at 700 mW, which is necessary to keep the system operational overnight. This energy loss is particularly relevant for systems with microinverters, as they continue to consume energy even without solar generation.
where
Pout is the output power [W], and
Pin is the input power [W].
With all the losses identified, the system’s performance index is calculated using the performance ratio (PR), as shown in Equation (5), which measures the efficiency of the photovoltaic system relative to its theoretical capacity. PR reflects the impact of factors such as temperature, shading, module technology, and tilt angle. It is crucial for assessing the system’s quality, as it indicates the total losses during the conversion from direct current (DC) to alternating current (AC). PR allows for evaluating the amount of energy injected into the grid (E_Grid) and making comparisons between photovoltaic systems, regardless of location or installed capacity, and assesses how close the system is to its ideal performance, considering module temperature and the efficiency of incident solar radiation [
32].
where
is the available energy for use [kWp/kWp/day],
is the energy produced in the STC power,
is the incident irradiance [kWp/m
2/day], and
is the STC installed power [kWp].
The equivalent units are explained by the fact that with the STC, 1 kWh/kWp of electricity should be generated for every kWh/m2 of irradiation.
Several challenges were identified during the study. One notable issue was the high variability of solar radiation in tropical regions, such as João Pessoa, which can be attributed to the frequent presence of clouds and rapid climatic changes. This variability significantly affected the consistency of data collection over time because it directly impacted both direct and diffuse solar radiation, consequently influencing the electrical performance of the system. The fixed 90° inclination of the PV module further constrained the system’s energy efficiency, limiting its performance and precluding direct comparisons with other inclination angles commonly studied in BIPV research.
Additionally, shading conditions posed a significant challenge, as shadows cast by architectural elements, vegetation, and nearby structures caused fluctuations in the solar radiation reaching the module. These variations introduced complexities in accurately assessing the system’s electrical performance under real-life conditions. Finally, ensuring instrumentation accuracy, including solar radiation, current, and voltage sensors, was difficult due to their exposure to adverse environmental conditions, further highlighting the need for robust methodologies and more precise sensors in similar studies.
4. Results and Discussion
To assess the electrical performance of the designed system, it is essential to consider the losses calculated by Pvsyst, which are detailed in
Table 5.
Considering the losses described in
Table 5, it is possible to evaluate the performance ratio (PR).
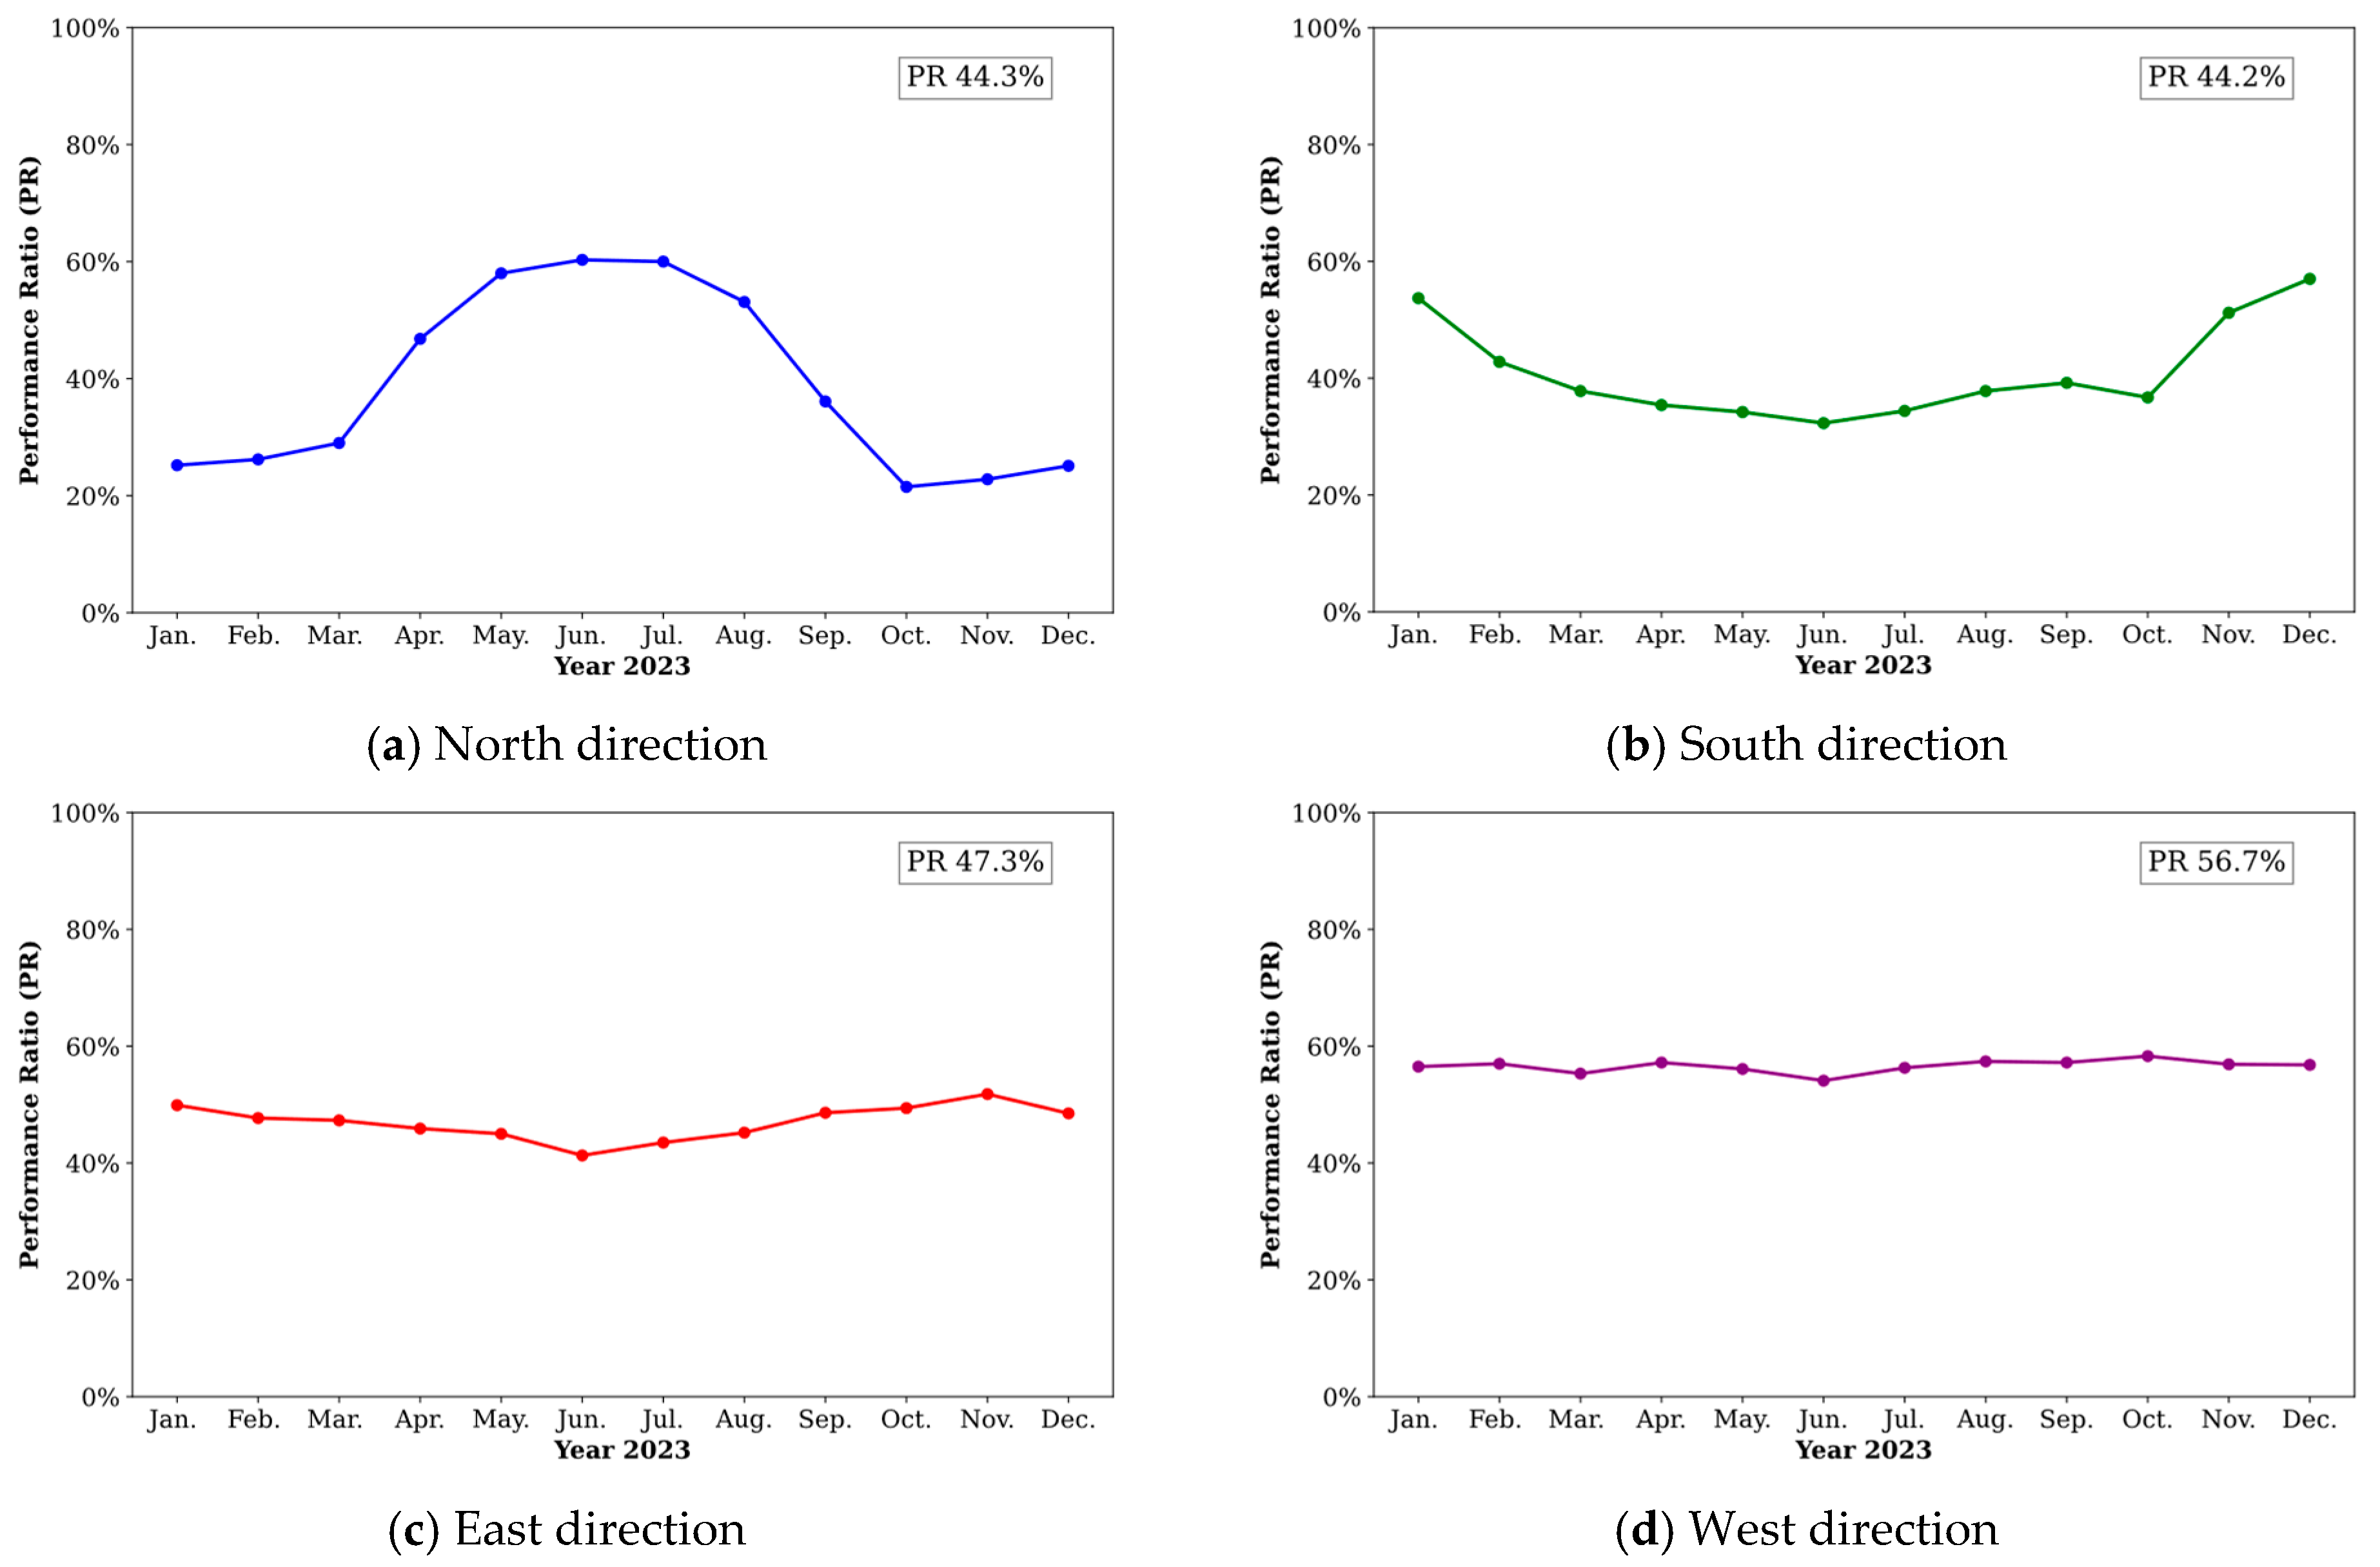
Figure 10 shows some variations in the performance of photovoltaic systems throughout the year. The average yield recorded was 44.3% for the north façade, 44.4% for the south, 47.4% for the east, and 56.8% for the west.
In the study by Lauffer et al. [
33], a simulation of energy generation in vertical residential photovoltaic façades was presented for the cities of Recife and Porto Alegre, also located in Brazil, with different types of photovoltaic modules and climatic conditions, taking into account the city of Recife, as it has climatic aspects much closer to the city of João Pessoa; the research data were used as a comparative effect for the applicability of the model in João Pessoa.
The system installed on the north façade (
Figure 10a) achieved its best performance between April and July, during the winter solstice in the southern hemisphere, when the sun is positioned to the north, directly over the Tropic of Capricorn, benefiting the north façade of João Pessoa. During this period, a low irradiance loss of 3.3% and temperature loss of approximately 6.6% were observed.
For south orientation (
Figure 10b), the best performance occurred between November and February, during the summer solstice, when the sun shines directly over the Tropic of Cancer. However, the lower solar altitude created longer shadows, reducing the incident radiation and the system’s efficiency. The south facade exhibited the highest irradiance loss among the four directions analyzed (4.0%) but the lowest temperature loss (5.3%).
The east and west facades, as shown in
Figure 10c,d, demonstrated more consistent performance throughout the year, receiving solar radiation primarily during specific times, such as mornings and afternoons. In these orientations, the irradiance losses were 2.4% and 2.1%, respectively. However, these façades also experienced higher temperature losses (9.0% on the east and 9.8% on the west) due to greater solar exposure, which led to increased module heating and a reduction in photovoltaic conversion efficiency.
For the city of João Pessoa, it was initially estimated that the north-facing façade would exhibit the highest performance ratio (PR) throughout the year. However, the east and west façades demonstrated superior performances. This behavior, as observed in Lauffer et al. [
33], can be explained by the higher and more consistent solar radiation incidence during the afternoon period, particularly between 2 p.m. and 4 p.m. This result is directly related to the solar trajectory, which, due to steeper angles during this time interval, enhances energy generation in these orientations.
The PR value showed subtle variations, which is expected in tropical regions, where the losses are primarily associated with the BIPV system and local climatic conditions. The performance ratio (PR) is directly related to the amount of energy injected into the grid (E_Grid) [
34], with facades having higher PR values generating more energy, as shown by the values presented in
Table 6.
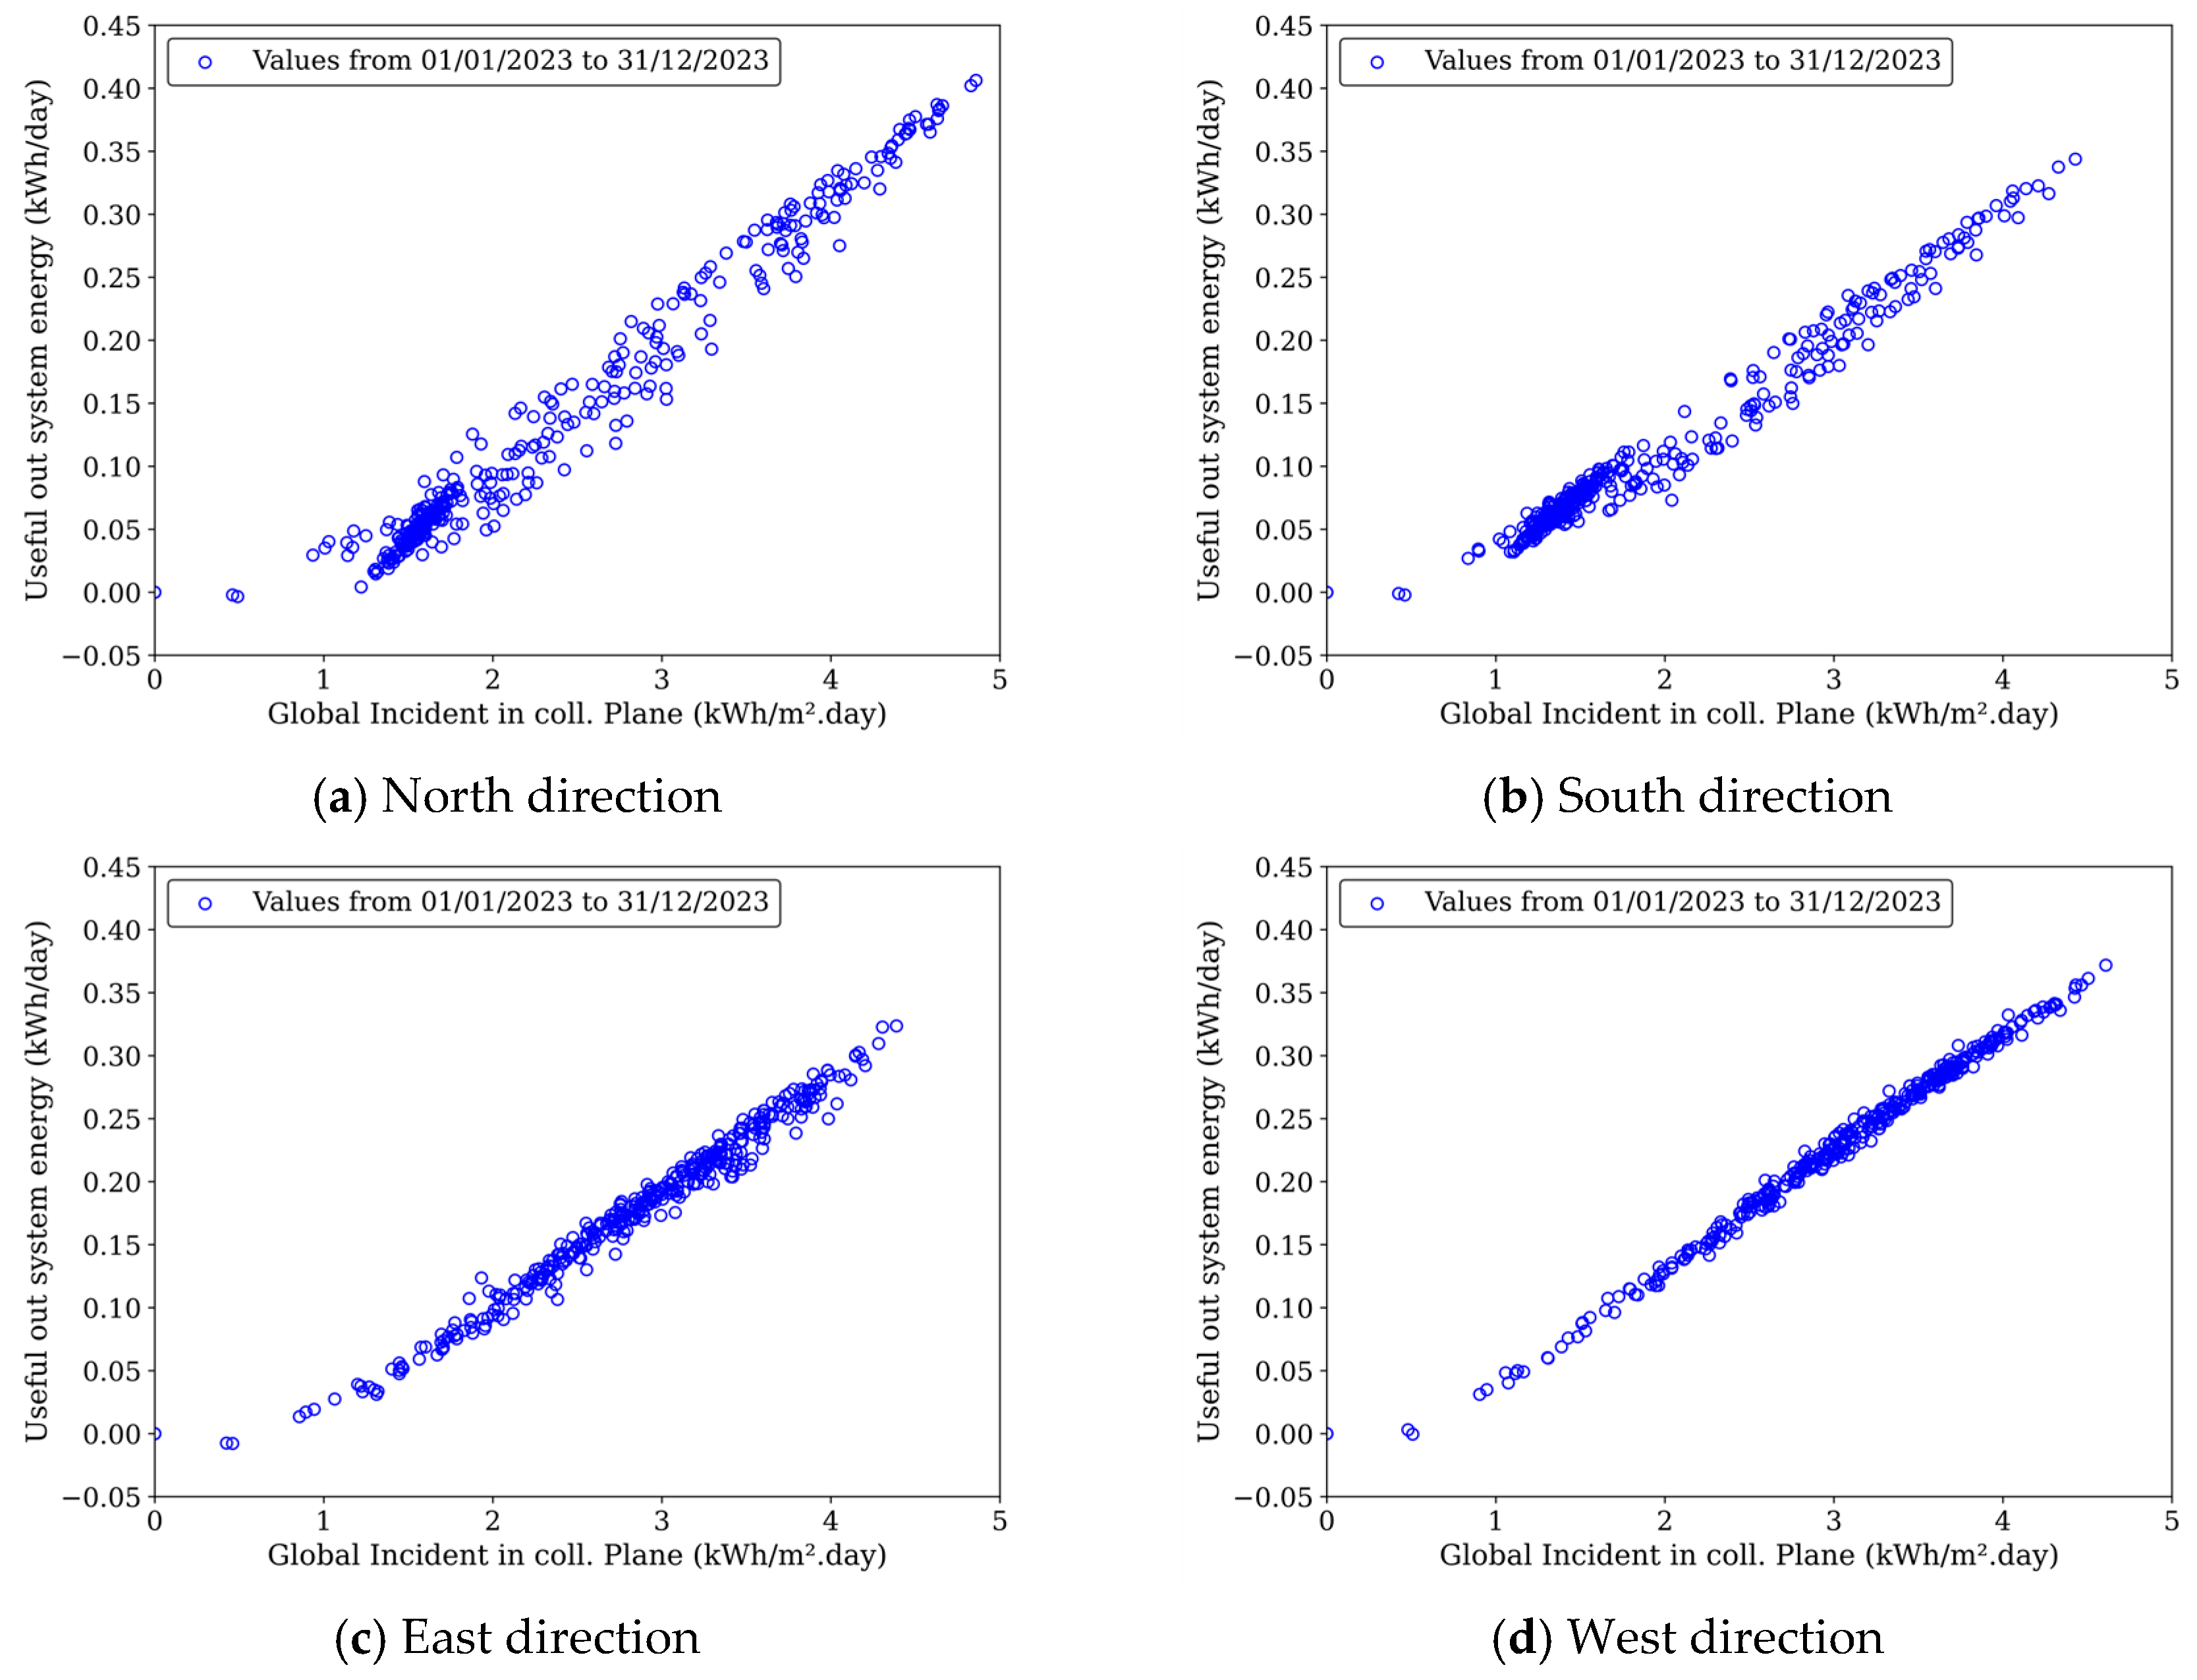
Figure 11 shows the relationship between the energy injected into the grid as a function of the global irradiance on the plane of the system for the north, south, east, and west orientations, respectively.
For orientations with higher performance indexes, the injected energy curves appear more linear and upward-trending, reflecting a proportional increase in the radiation received and greater efficiency in photovoltaic conversion. A detailed analysis of these graphs shows that the west (
Figure 11d) and east (
Figure 11c) orientations produce more energy, as their curves are more linear and with more agglutination of points for greater radiation, reinforcing the importance of the correct orientation and tilt of photovoltaic modules to maximize the system’s energy efficiency.
An experimental study was conducted to provide a solid basis for validating the simulations. In the case of a photovoltaic window, real environmental conditions (such as temperature, solar radiation, and incidence angles) can be complex and vary significantly. The experimentation allows the simulations to be compared with the observed data, ensuring that the model is accurate and applicable to local reality.
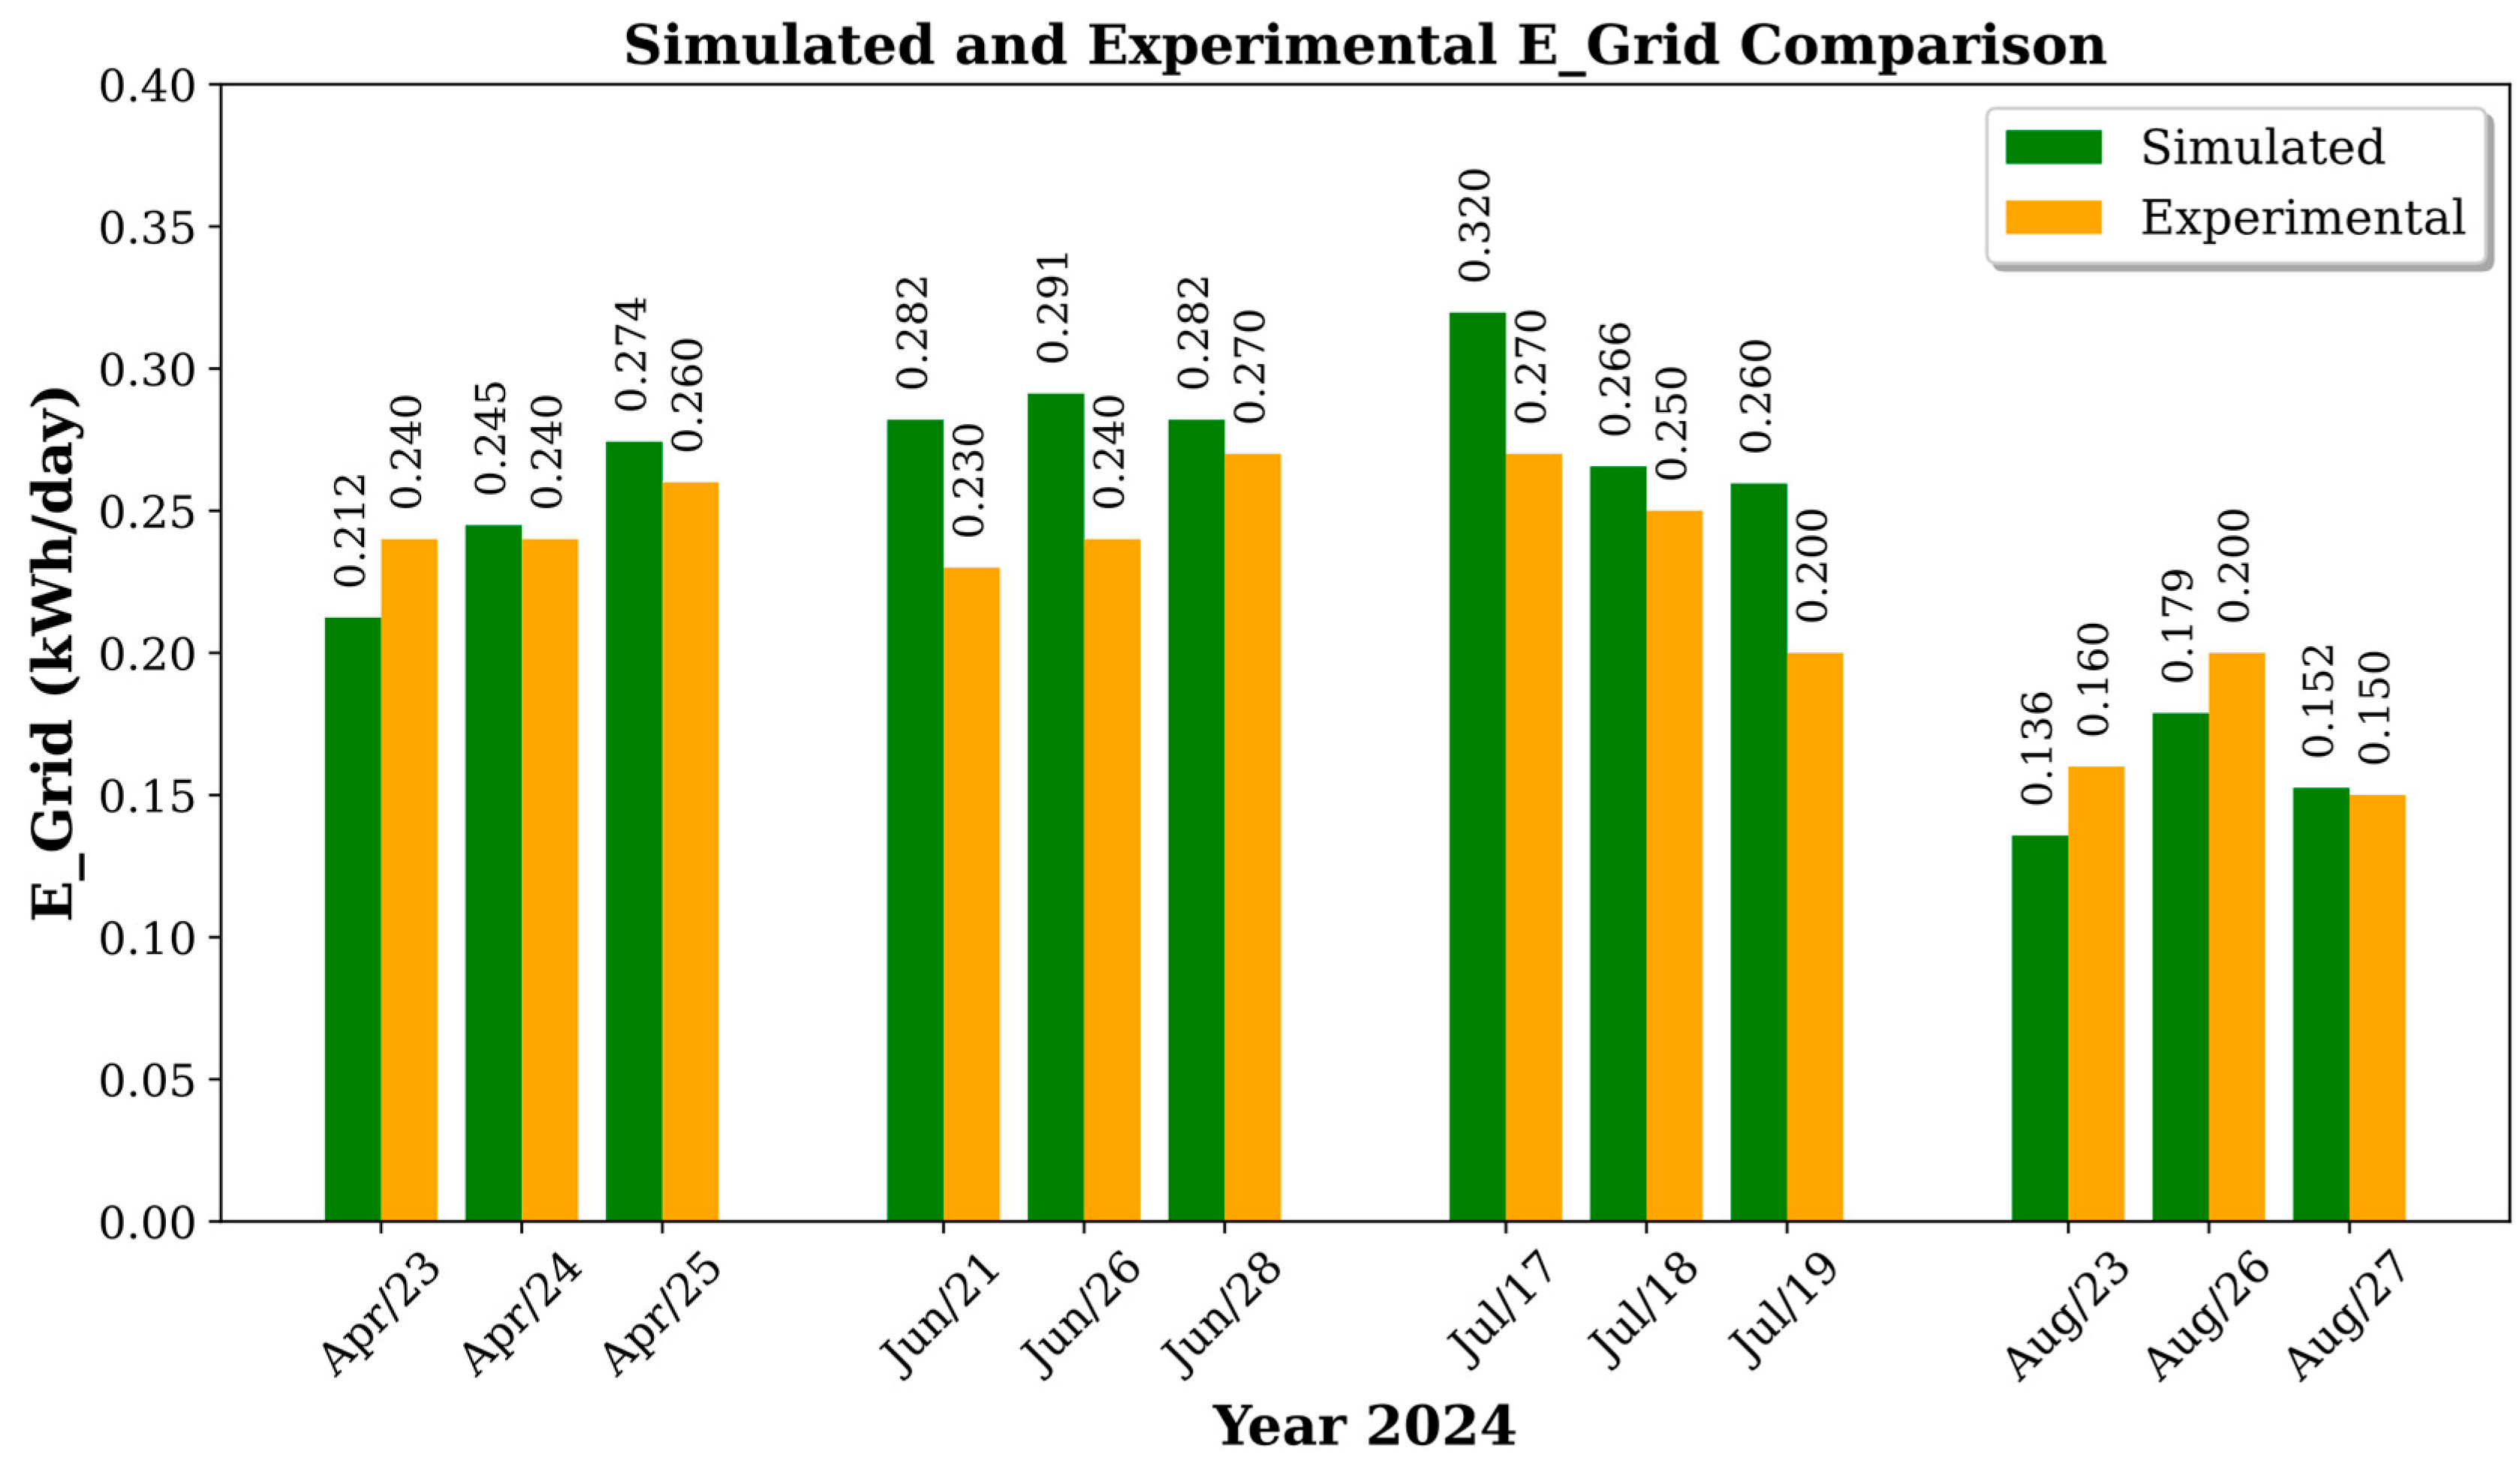
When comparing the grid-injected energy values obtained through the simulation method with the experimental method for the days 23–25 April; 21, 26, and 28 June; 17, 18, and 19 July; and 23, 26, and 27 August, a substantial correlation between the results is observed, as shown in
Figure 12. It is important to note that the comparisons are made for the north orientation, which is the actual orientation of the study object.
For the analyzed days in April, there was practically no discrepancy between the simulated and experimental values. The experimental values were 0.2400, 0.2400, and 0.2600 kWh/day, resulting in an average of 0.2530 kWh/day. The simulated values obtained through the simulation method were 0.2912, 0.2820, and 0.2851 kWh/day, with an average of 0.2445 kWh/day. This slight difference can be attributed to the typical climatic conditions of April in João Pessoa, which, despite the beginning of winter, offer good availability of direct solar radiation and low climatic variability, favoring greater agreement between the calculation methods.
In contrast, during June, a more significant difference was observed between the energy injected into the grid obtained from the simulation and experimental methods. On 21, 26, and 28 June, the simulated values were 0.2820, 0.2912, and 0.2820 kWh/day, resulting in an average of 0.2851 kWh/day, while the experimental values were 0.2300, 0.2400, and 0.2700 kWh/day, with an average of 0.2467 kWh/day.
In the days analyzed in July 2024, the discrepancy between the simulated and experimental results became more pronounced. The experimental energy injected into the grid was 0.2700, 0.2500, and 0.2000 kWh/day, resulting in an average of 0.2400 kWh/day. In contrast, the simulated values obtained through the simulation method were 0.3197, 0.2656, and 0.2596 kWh/day, with an average of 0.2816 kWh/day.
This June–July discrepancy can be explained by the seasonal climatic conditions of João Pessoa during winter, which is characterized by increased cloud cover and reduced direct solar irradiance. These conditions negatively affect the module’s performance, which relies heavily on direct radiation to achieve high efficiency levels. Although robust, the PVsyst simulation model may underestimate these variations because it uses average climatic data as the basis for its estimates.
However, in August, a greater alignment between the simulated and experimental values was observed. On 23, 26, and 27 August, the simulated values were 0.1357, 0.1788, and 0.1525 kWh/day, resulting in an average of 0.1556 kWh/day. In comparison, the experimental values were 0.1600, 0.2000, and 0.1500 kWh/day, with an average of 0.1700 kWh/day. This realignment can be attributed to the stabilization of the climatic conditions typical of late winter, when cloudiness begins to decrease and solar radiation levels become more consistent.
João Pessoa is located in Northeastern Brazil. It has a tropical climate with a high solar incidence. However, during the winter period (April to July), rainfall and cloudiness are common. These factors reduce the efficiency of the photovoltaic system because of the decrease in direct incident radiation and the increase in thermal losses caused by higher module temperatures under low ventilation conditions.
Overall, the results demonstrate the consistency of the simulation model in estimating the energy injected into the grid, especially during periods of greater climatic stability. However, the analysis also highlights the importance of considering regional and seasonal specificity when adjusting the simulations and improving the accuracy of the results.
The robust experimental data collection also serves as a basis for future research. This validated data set can serve as a starting point for other researchers who wish to expand or adapt the study to other regions or contexts.
5. Conclusions
This study fills a gap in the literature by providing detailed experimental model data on the electrical performance of monocrystalline silicon BIPV systems in a tropical climate, such as João Pessoa, Brazil. The location has specific characteristics, such as high solar radiation throughout the year, mainly diffuse, and rapid climate changes. However, by investigating the photovoltaic module on a vertical façade with a fixed angle of 90 degrees, this article contributes to a better assessment of the impact of this system on energy efficiency, as it has challenges related to interference from nearby structures and less direct solar incidence, which are key points for systems integrated into buildings due to the predominance of vertical facades.
The orientation of the photovoltaic module significantly influences the amount of solar radiation and energy generation. In 2023, the south-facing facade recorded the highest irradiance losses, which were attributed to the lower solar altitude during the southern hemisphere’s winter, resulting in reduced solar radiation intensity. Conversely, the east and west facades experienced lower irradiance losses throughout the year, benefiting from a more balanced distribution of solar radiation during the day. However, these facades also faced higher thermal losses due to prolonged direct sunlight exposure, which increased module temperatures and reduced the photovoltaic conversion efficiency.
The performance ratio (PR) of the modules showed slight variations throughout the year, reflecting the interaction between solar radiation and local climatic conditions. The north-facing facade exhibited the best performance between April and August during the winter solstice, with irradiance and thermal losses of 3.3% and thermal losses of 6.6%. On the south-facing facade, optimal performance was observed between November and February during the summer solstice, with irradiance losses of 4.0% and thermal losses of 5.3%. The east and west facades maintained more consistent performance, with lower irradiance losses (2.4% and 2.1%, respectively) but higher thermal losses (9.0% and 9.8%) due to increased solar exposure.
An analysis of the energy injected into the grid in 2023 revealed that the east and west facades displayed more stable and consistent performance. Although the north-facing facade generated higher amounts of energy in certain months, its values were more variable, reducing the predictability of energy generation in BIPV systems with modules installed at a 90° tilt.
A comparison of the simulated values with the experimental data from 2024 revealed minor discrepancies due to differences in the data collection methods. The experimental data were collected directly from the photovoltaic module, while the meteorological data were obtained from a solarimetric station located at different heights and distances from the study object. Despite these limitations, the results confirmed the accuracy of the PVsyst model under stable climatic conditions but also highlighted the challenges of simulating scenarios with seasonal variability and adverse atmospheric conditions.
These findings underscore the impact of seasonal climatic conditions on the performance of photovoltaic systems and emphasize the need to improve simulation models to better account for extreme atmospheric variations. Furthermore, they highlight the importance of appropriate module orientation and tilt to optimize energy production throughout the year.
It was concluded that in the tropical climate of João Pessoa, east- and west-facing facades are more advantageous for installing monocrystalline silicon photovoltaic modules with a 90° tilt, as these orientations provide a more balanced capture of solar radiation throughout the day.
This approach provides real data collected under practical conditions, increasing its applicability. The article’s contribution goes beyond a one-off analysis, as it includes important information for urban planners, architects, and engineers interested in applying sustainable technologies in tropical regions.
Although the data presented are significant, several questions remain unanswered, highlighting the need for further research into the impact of orientation on the electrical performance of building-integrated photovoltaic (BIPV) façades in predominantly tropical climates, such as that of João Pessoa, Brazil. Such research should include investigations into varying the inclination angle of photovoltaic windows beyond the traditional 90° configuration.
Additionally, future studies could delve deeper into seasonal variations in solar radiation, considering both direct and diffuse components, as well as the shading effects caused by architectural elements. The exploration of advanced photovoltaic technologies, such as hybrid modules that integrate energy generation with thermal insulation properties, offers promising potential for enhancing the efficiency of such systems. In this context, combining sophisticated computational models with empirical experiments in diverse urban scenarios can significantly improve our understanding of the performance of BIPV systems across different configurations. This approach strengthens their applicability in regions with varied climatic conditions, paving the way for optimized and context-specific solutions.


 ,
, 


