
The Impact of Trade Openness on Carbon Emissions: Empirical Evidence from Emerging Countries

Abstract
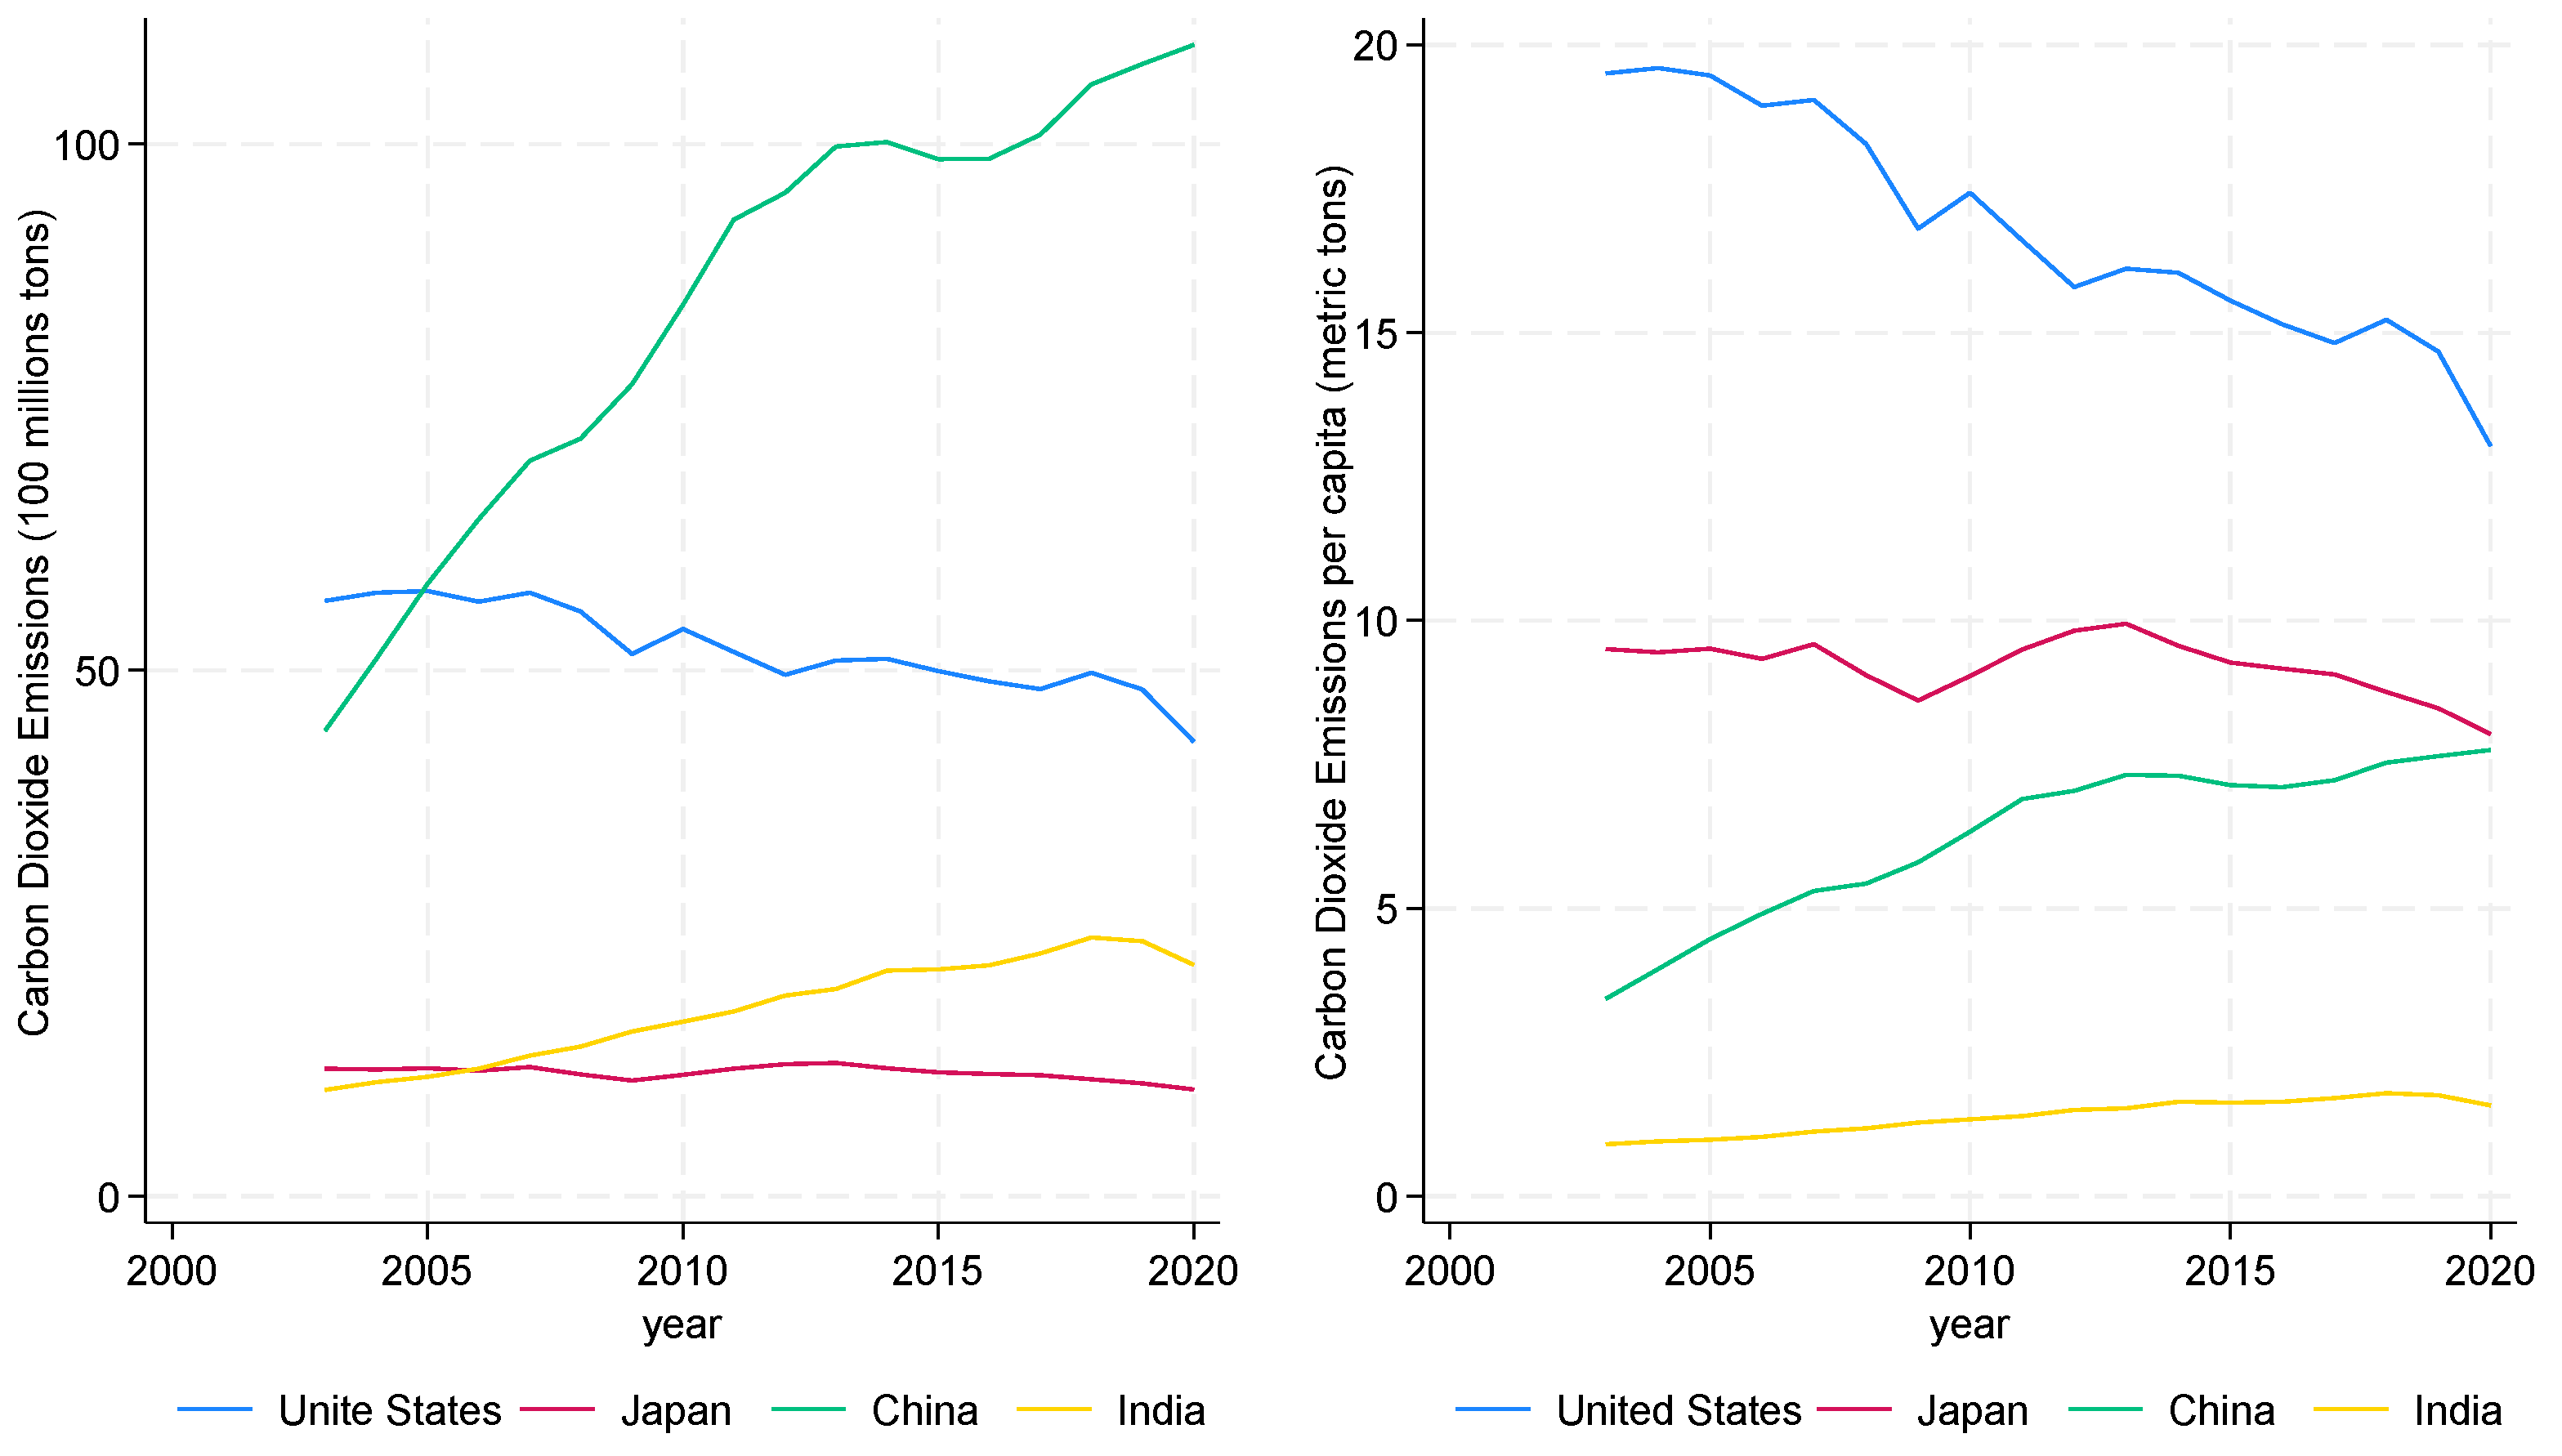
1. Introduction
2. Literature Review
2.1. Studies Based on Time Series Data
2.2. Studies Based on Panel Data

| Authors | Country/Regions | Period | Methodology | Results |
|---|---|---|---|---|
| Study based on time-series data | ||||
| Jayanthakumaran et al. [13] | India and China | 1971–2007 | ARDL bounds test | None |
| Kohler [14] | South Africa | 1960–2009 | ARDL bounds test, VECM Granger Causality | Two-way |
| Tiwari et al. [12] | India | 1966–2011 | ARDL bounds test, VECM Granger Causality | Positive |
| Ertugrul et al. [28] | Top ten emitters among developing countries | 1971–2011 | ARDL bounds test, VECM Granger Causality | Positive |
| Mutascu [6] | France | 1960–2013 | Wavelet tool | Positive |
| Hdom and Fuinhas [10] | 1975–2016 | Brazil | FMOLS, DOLS | Positive |
| Ansari et al. [15] | top CO2 emitters | 1971–2013 | ARDL, VECM Granger causality | Uncertain |
| Suhrab et al. [29] | Pakistan | 1985–2018 | Cointegration analysis, Granger Causality | Positive |
| Udeagha and Ngepah [11] | South African | 1960–2020 | Novel dynamic ARDL simulation | Uncertain |
| Study based on panel data | ||||
| Al-Mulali and Ozturk [18] | 14 MENA countries | 1996–2012 | FMOLS, VECM Granger causality | Two-way |
| Jebli et al. [19] | 25 OECD countries | 1980–2010 | DOLS, FMOLS, VECM Granger causality | Two-way |
| Ahmed et al. [16] | BRICS | 1970–2013 | FMOLS, VECM Granger causality | Positive |
| Destek et al. [20] | Ten CEEC countries | 1991–2011 | DOLS, FMOLS, VECM Granger causality | Two-way |
| Zhang et al. [17] | Ten newly industrialized countries | 1971–2013 | OLS, FMOLS, DOLS, Panel VECM Granger causality | Positive |
| Afridi et al. [30] | SAARC | 1980–2016 | OLS, GLS, panel Causality tests | Negative |
| Lv and Xu [25] | 55 middle-income countries | 1992–2012 | PMG | Uncertain |
| Sun et al. [23] | 49 high-emission countries in BRI | 1991–2014 | FMOLS, panel VECM Granger causality | Uncertain |
| Iqbal et al. [24] | Heterogeneous income groups | 1971–2020 | FMOLS, DOLS, system GMM | Uncertain |
| Chen et al. [21] | 64 BRI countries | 2001–2019 | Panel quantile regression | Positive |
| Salam and Xu [31] | BRI countries | 2001–2018 | Two-step GMM | Uncertain |
| Chhabra et al. [32] | 23 middle-income countries | 1994–2018 | GMM, Dumitrescu-Hurlin causality test | Positive |
| Azam et al. [33] | Six countries from the OPEC | 1975–2018 | OLS | Positive |
| Zheng et al. [22] | 10 Asian countries | 1995–2018 | CS-ARDL, AMG, CCEMG | Positive |
| Wang and Zhang [25] | 182 countries | 1990–2015 | FMOLS | Uncertain |
| Ashraf et al. [34] | 75 BRI countries | 1990–2019 | Spatial panel data models | Positive |
| Pata et al. [35] | 6 ASEAN countries | 1995–2018 | Panel ARDL, Dumitrescu-Hurlin causality test | Negative |
| Suleman et al. [27] | 85 countries | 1995–2020 | Stepwise regression, FMOLS et al. | Uncertain |
| Pham and Nguyen [36] | 64 developing countries | 2003–2017 | BMA | None |
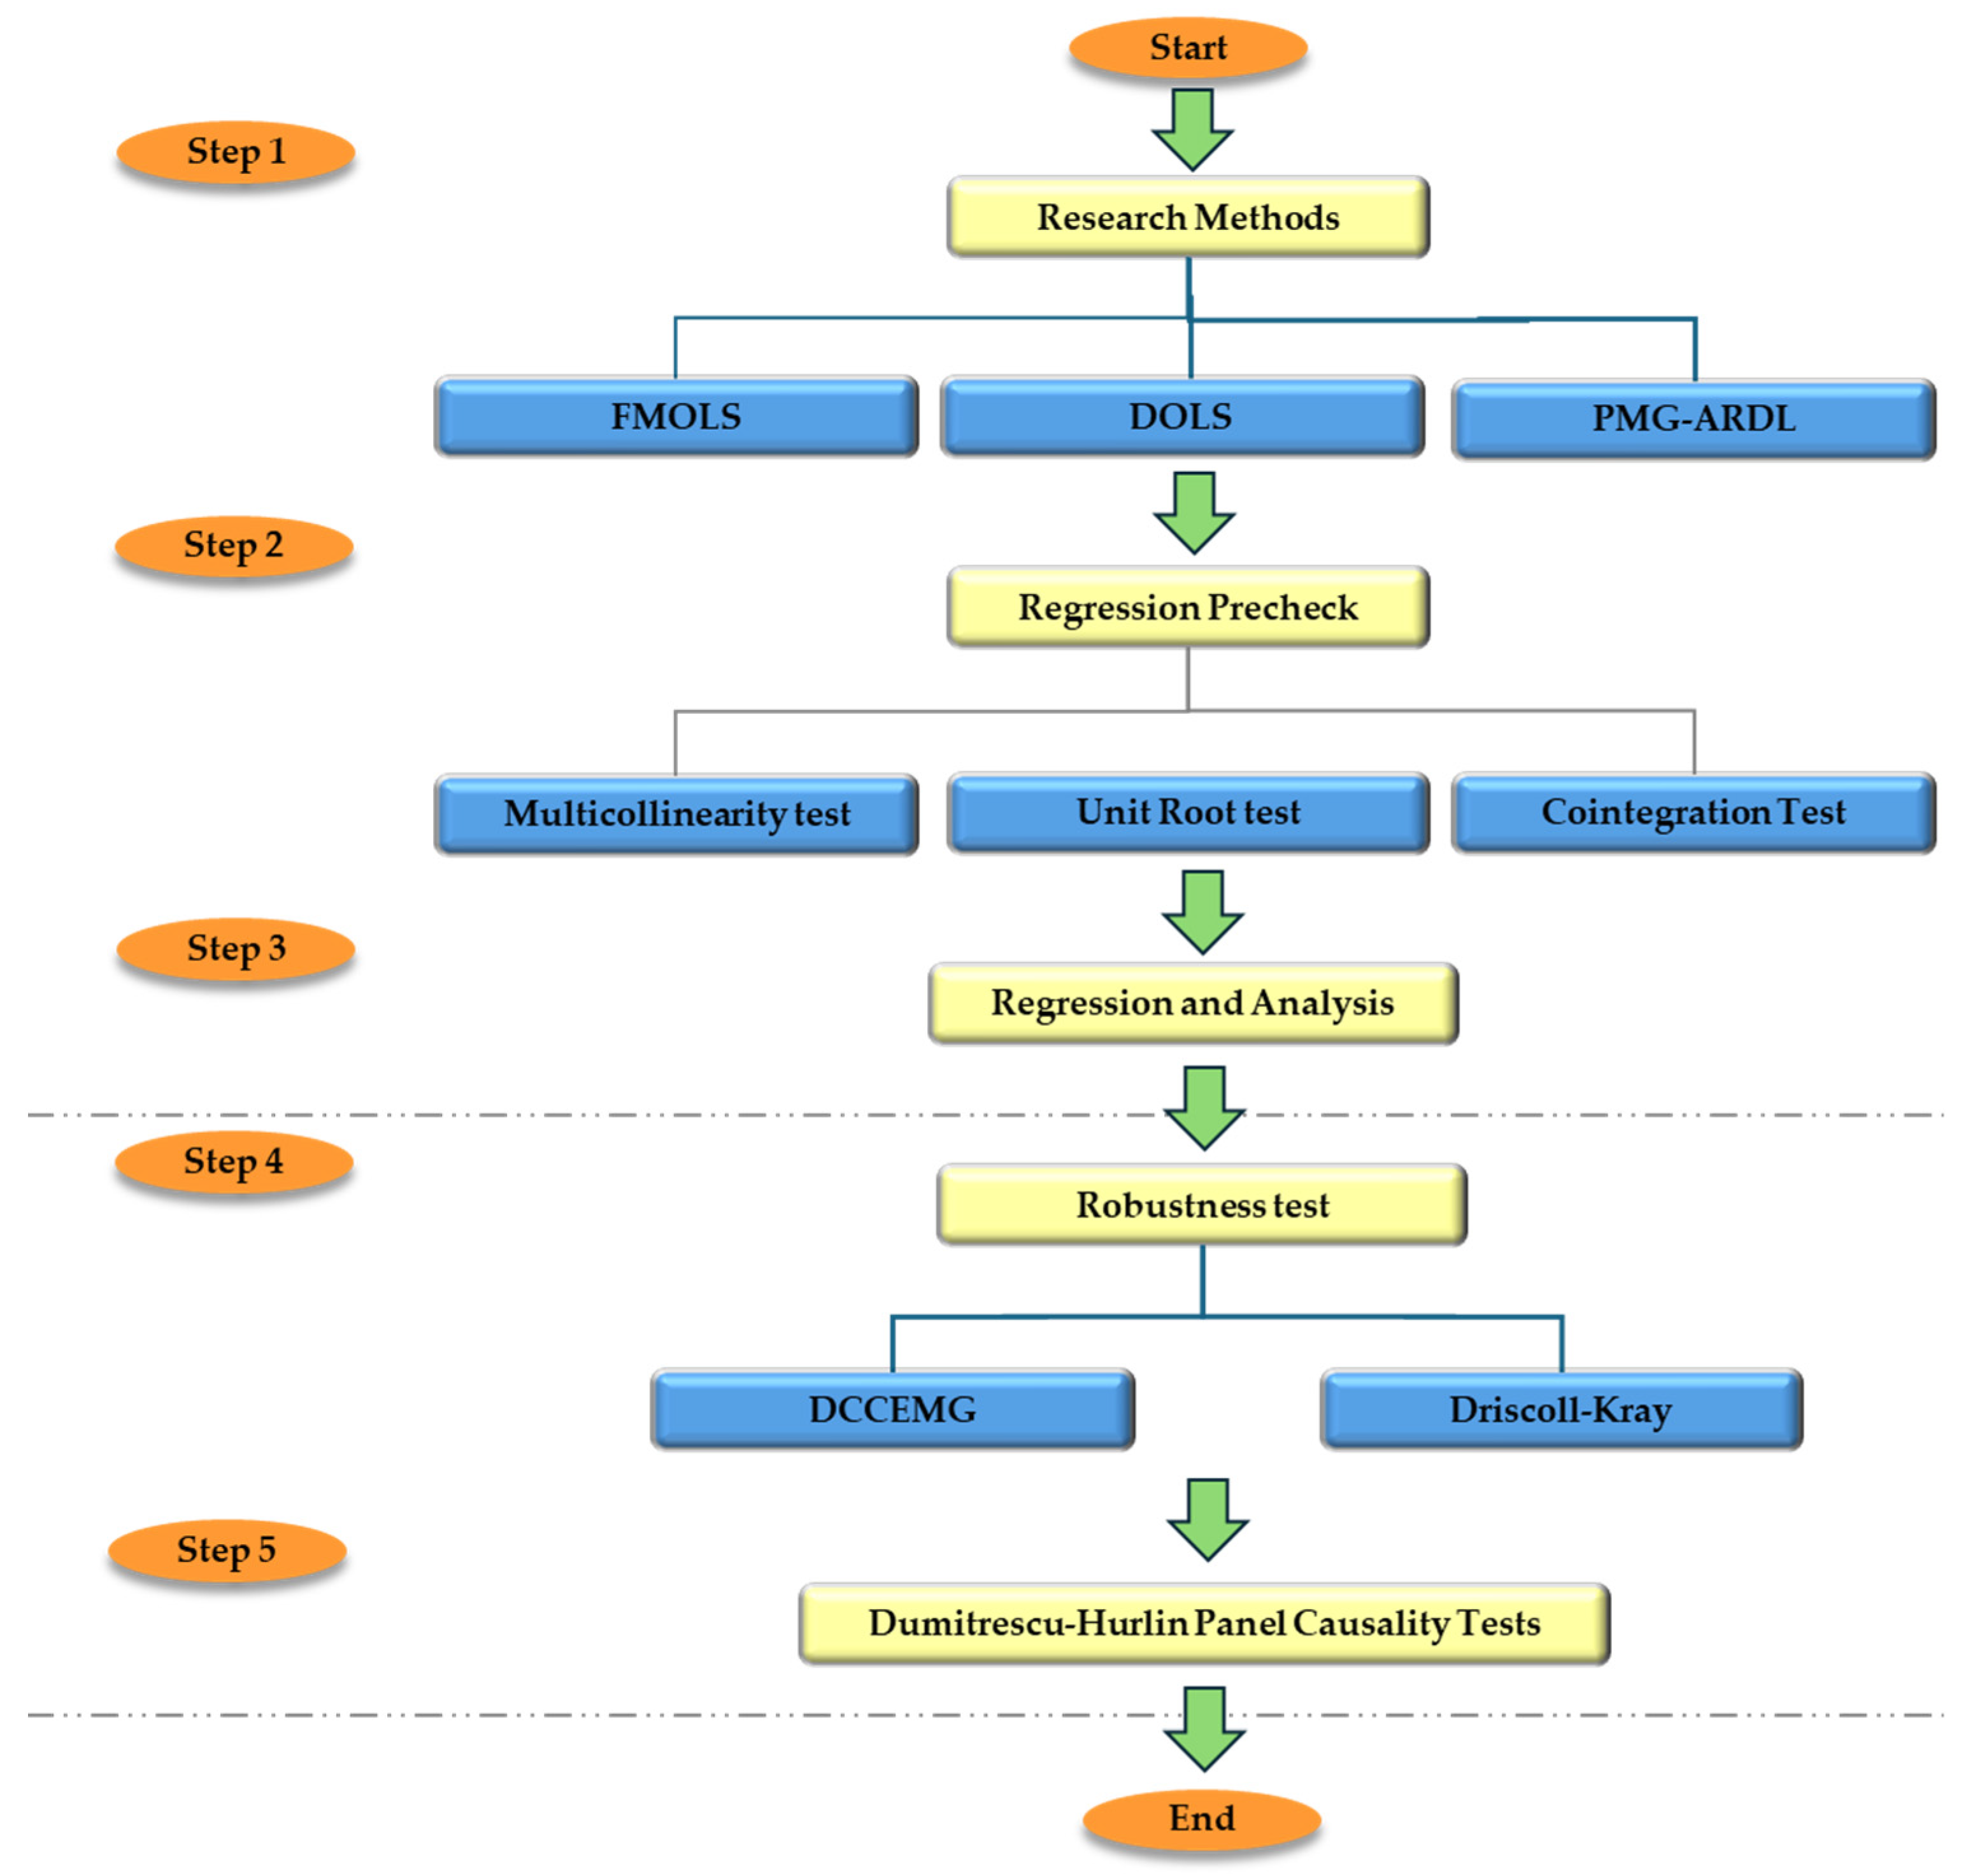
3. Research Methods and Data
3.1. Research Method
3.1.1. Basic Model Setting
3.1.2. FMOLS, DOLS, and PMG-ARDL Methods
- (1)
- FMOLS method
- (2)
- Panel DOLS method
- (3)
- Panel PMG-ARDL method
3.2. Data and Basic Statistics
3.2.1. Data Description
3.2.2. Basic Statistics
4. Unit Root Test and Cointegration Test
4.1. Slope Heterogeneity Test
4.2. Cross-Section Dependence Test
4.3. Panel Unit Root Test
4.4. Results of Cointegration Test
5. Results of Estimation
5.1. Panel FMOLS and DOLS Estimates
5.2. PMG-ARDL Estimate
5.3. Further Estimation: Enhancing Robustness
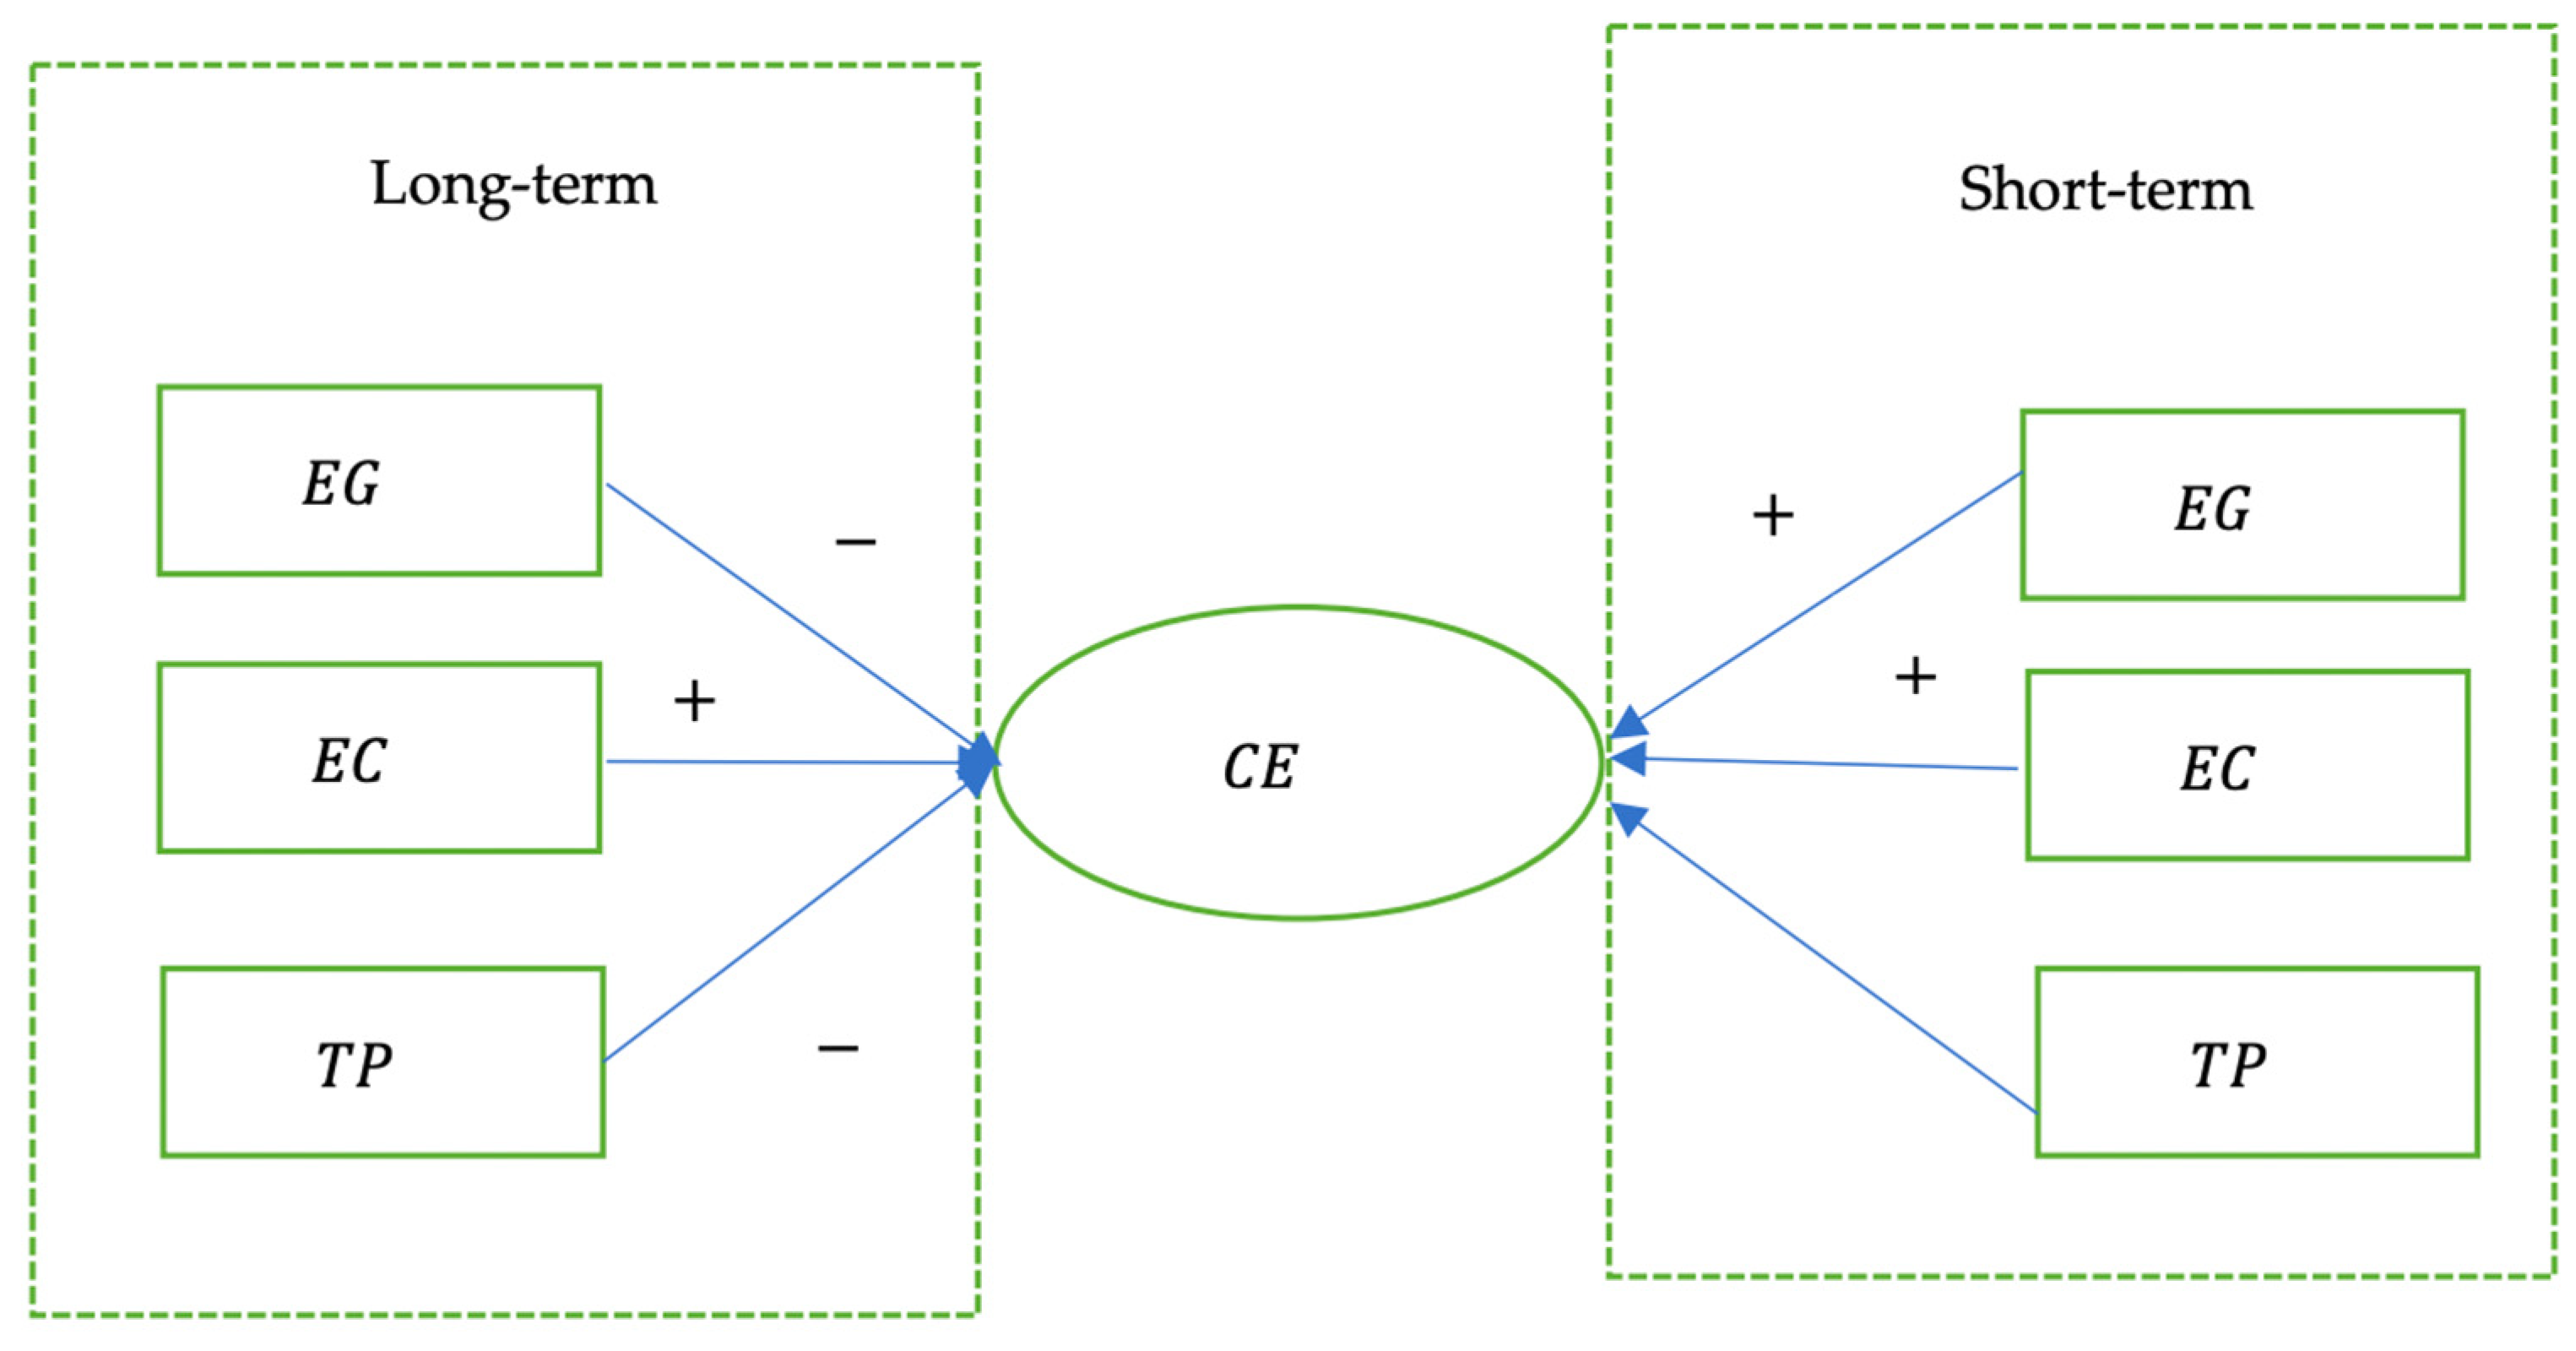
5.4. Analysis and Discussion of Estimation Results
6. Causality Test
7. Conclusions, Policy Implications, and Limitations
7.1. Conclusions and Policy Implications
7.2. Limitations
Author Contributions
Funding
Data Availability Statement
Conflicts of Interest
References
- Berlie, A.B. Global warming: A review of the debates on the causes, consequences and politics of global response. Ghana J. Geogr. 2018, 10, 144–164. [Google Scholar]
- Ahmed, S.; Yoon, W.; Jo, H.; Irshad, M.; Khan, M.K.; Kim, J. Structure-activity relationship and deactivation behavior of iron oxide during CO2 hydrogenation. Chem. Eng. J. 2024, 499, 156104. [Google Scholar] [CrossRef]
- Alam, M.M.; Murad, M.W.; Noman, A.H.M.; Ozturk, I. Relationships among carbon emissions, economic growth, energy consumption and population growth: Testing Environmental Kuznets Curve hypothesis for Brazil, China, India and Indonesia. Ecol. Indic. 2016, 70, 466–479. [Google Scholar] [CrossRef]
- Riti, J.S.; Song, D.; Shu, Y.; Kamah, M. Decoupling CO2 emission and economic growth in China: Is there consistency in estimation results in analyzing environmental Kuznets curve? J. Clean. Prod. 2017, 166, 1448–1461. [Google Scholar] [CrossRef]
- Shahbaz, M.; Nasreen, S.; Ahmed, K.; Hammoudeh, S. Trade openness–carbon emissions nexus: The importance of turning points of trade openness for country panels. Energy Econ. 2016, 61, 221–232. [Google Scholar] [CrossRef]
- Mutascu, M. A time-frequency analysis of trade openness and CO2 emissions in France. Energy Policy 2018, 115, 443–455. [Google Scholar] [CrossRef]
- He, B.; Yu, X.; Ho, S.; Zhang, X.; Xu, D. Does China’s Two-Way FDI Coordination Improve Its Green Total Factor Productivity? Pol. J. Environ. Stud. 2024, 33, 173–183. [Google Scholar] [CrossRef]
- Antweiler, W.; Copeland, B.R.; Taylor, M.S. Is free trade good for the environment? Am. Econ. Rev. 2001, 91, 877–908. [Google Scholar] [CrossRef]
- Farhani, S.; Chaibi, A.; Rault, C. CO2 emissions, output, energy consumption, and trade in Tunisia. Econ. Model. 2014, 38, 426–434. [Google Scholar] [CrossRef]
- Hdom, H.A.; Fuinhas, J.A. Energy production and trade openness: Assessing economic growth, CO2 emissions and the applicability of the cointegration analysis. Energy Strateg. Rev. 2020, 30, 100488. [Google Scholar] [CrossRef]
- Udeagha, M.C.; Ngepah, N. Does trade openness mitigate the environmental degradation in South Africa? Environ. Sci. Pollut. Res. 2022, 29, 19352–19377. [Google Scholar] [CrossRef] [PubMed]
- Tiwari, A.K.; Shahbaz, M.; Hye QM, A. The environmental Kuznets curve and the role of coal consumption in India: Cointegration and causality analysis in an open economy. Renew. Sustain. Energ. Rev. 2013, 18, 519–527. [Google Scholar] [CrossRef]
- Jayanthakumaran, K.; Verma, R.; Liu, Y. CO2 emissions, energy consumption, trade and income: A comparative analysis of China and India. Energy Policy 2012, 42, 450–460. [Google Scholar] [CrossRef]
- Kohler, M. CO2 emissions, energy consumption, income and foreign trade: A South African perspective. Energy Policy 2013, 63, 1042–1050. [Google Scholar] [CrossRef]
- Ansari, M.A.; Haider, S.; Khan, N.A. Does trade openness affects global carbon dioxide emissions: Evidence from the top CO2 emitters. Manag. Environ. Qual. 2020, 31, 32–53. [Google Scholar] [CrossRef]
- Ahmed, K.; Shahbaz, M.; Kyophilavong, P. Revisiting the emissions-energy-trade nexus: Evidence from the newly industrializing countries. Environ. Sci. Pollut. Res. 2016, 23, 7676–7691. [Google Scholar] [CrossRef] [PubMed]
- Zhang, S.; Liu, X.; Bae, J. Does trade openness affect CO2 emissions: Evidence from ten newly industrialized countries? Environ. Sci. Pollut. Res. 2017, 24, 17616–17625. [Google Scholar] [CrossRef] [PubMed]
- Al-Mulali, U.; Ozturk, I. The effect of energy consumption, urbanization, trade openness, industrial output, and the political stability on the environmental degradation in the MENA (Middle East and North African) region. Energy 2015, 84, 382–389. [Google Scholar] [CrossRef]
- Jebli, M.B.; Youssef, S.B.; Ozturk, I. Testing environmental Kuznets curve hypothesis: The role of renewable and non-renewable energy consumption and trade in OECD countries. Ecol. Indic. 2016, 60, 824–831. [Google Scholar] [CrossRef]
- Destek, M.A.; Balli, E.; Manga, M. The relationship between CO2 emission, energy consumption, urbanization and trade openness for selected CEECs. Res. World Econ. 2016, 7, 52–58. [Google Scholar] [CrossRef]
- Chen, F.; Jiang, G.; Kitila, G.M. Trade openness and CO2 emissions: The heterogeneous and mediating effects for the belt and road countries. Sustainability 2021, 13, 1958. [Google Scholar] [CrossRef]
- Zheng, W.L.; Tien, N.H.; Sibghatullah, A.; Asih, D.; Soelton, M.; Ramli, Y. Impact of energy efficiency, technology innovation, institutional quality, and trade openness on greenhouse gas emissions in ten Asian economies. Environ. Sci. Pollut. Res. 2023, 30, 43024–43039. [Google Scholar] [CrossRef]
- Sun, H.; Attuquaye Clottey, S.; Geng, Y.; Fang, K.; Clifford Kofi Amissah, J. Trade openness and carbon emissions: Evidence from belt and road countries. Sustainability 2019, 11, 2682. [Google Scholar] [CrossRef]
- Iqbal, M.A.; Majeed, M.T.; Luni, T. Human capital, trade openness and CO2 emissions: Evidence from Heterogeneous income groups. Pak. J. Comm. Soc. Sci. 2021, 15, 559–585. [Google Scholar]
- Wang, Q.; Zhang, F. The effects of trade openness on decoupling carbon emissions from economic growth—Evidence from 182 countries. J. Clean. Prod. 2021, 279, 123838. [Google Scholar] [CrossRef] [PubMed]
- Lv, Z.; Xu, T. Trade openness, urbanization and CO2 emissions: Dynamic panel data analysis of middle-income countries. J. Int. Trade Econ. Dev. 2019, 28, 317–330. [Google Scholar] [CrossRef]
- Suleman, S.; Thas Thaker, H.M.; Cheong Wing Hoh, C. Is trade relevant to the macro drivers of carbon dioxide emissions? A study of high- and low-trade open-ness economies. Nat. Resour. Forum. 2024, 1–30. [Google Scholar]
- Ertugrul, H.M.; Cetin, M.; Seker, F.; Dogan, E. The impact of trade openness on global carbon dioxide emissions: Evidence from the top ten emitters among developing countries. Ecol. Indic. 2016, 67, 543–555. [Google Scholar] [CrossRef]
- Afridi, M.A.; Kehelwalatenna, S.; Naseem, I.; Tahir, M. Per capita income, trade openness, urbanization, energy consumption, and CO2 emissions: An empirical study on the SAARC Region. Environ. Sci. Pollut. Res. 2019, 26, 29978–29990. [Google Scholar] [CrossRef] [PubMed]
- Suhrab, M.; Soomro, J.A.; Ullah, S.; Chavara, J. The effect of gross domestic product, urbanization, trade openness, financial development, and renewable energy on CO2 emission. Environ. Sci. Pollut. Res. 2023, 30, 22985–22991. [Google Scholar] [CrossRef]
- Salam, M.; Xu, Y. Trade openness and environment: A panel data analysis for 88 selected BRI countries. Environ. Sci. Pollut. Res. 2022, 29, 23249–23263. [Google Scholar] [CrossRef]
- Chhabra, M.; Giri, A.K.; Kumar, A. Do technological innovations and trade openness reduce CO2 emissions? Evidence from selected middle-income countries. Environ. Sci. Pollut. Res. 2022, 29, 65723–65738. [Google Scholar] [CrossRef]
- Azam, M.; Rehman, Z.U.; Ibrahim, Y. Causal nexus in industrialization, urbanization, trade openness, and carbon emissions: Empirical evidence from OPEC economies. Environ. Dev. Sustain. 2022, 24, 13990–14010. [Google Scholar] [CrossRef]
- Ashraf, J.; Ashraf, Z.; Javed, A. The spatial spillover effects of energy transition and trade openness on CO2 emis-sions. Energy Build. 2023, 292, 113167. [Google Scholar] [CrossRef]
- Pata, U.K.; Dam, M.M.; Kaya, F. How effective are renewable energy, tourism, trade openness, and foreign direct investment on CO2 emissions? An EKC analysis for ASEAN countries. Environ. Sci. Pollut. Res. 2023, 30, 14821–14837. [Google Scholar] [CrossRef]
- Pham DT, T.; Nguyen, H.T. Effects of trade openness on environmental quality: Evidence from developing countries. J. Appl. Econ. 2024, 27, 2339610. [Google Scholar] [CrossRef]
- Dumitrescu, E.I.; Hurlin, C. Testing for Granger non-causality in heterogeneous panels. Econ. Model. 2012, 29, 1450–1460. [Google Scholar] [CrossRef]
- Phillips, P.C.B.; Hansen, B.E. Statistical Inference in Instrumental Variables Regression with I (1) Processes. Rev. Econ. Stud. 1990, 57, 99–125. [Google Scholar] [CrossRef]
- Sarkodie, S.A.; Strezov, V. Empirical study of the Environmental Kuznets curve and Environmental Sustainability curve hypothesis for Australia, China, Ghana and USA. J. Clean. Prod. 2018, 201, 98–110. [Google Scholar] [CrossRef]
- Pesaran, M.H.; Yamagata, T. Testing slope homogeneity in large panels. J. Econom. 2008, 142, 50–93. [Google Scholar] [CrossRef]
- Westerlund, J.; Edgerton, D.L. A panel bootstrap cointegration test. Econ. Lett. 2007, 97, 185–190. [Google Scholar] [CrossRef]
- De Hoyos, R.E.; Sarafidis, V. Testing for cross-sectional dependence in panel-data models. STATA J. 2006, 6, 482–496. [Google Scholar] [CrossRef]
- Pesaran, M.H.; Ullah, A.; Yamagata, T. A bias-adjusted LM test of error cross-section independence. Econom. J. 2008, 11, 105–127. [Google Scholar] [CrossRef]
- Palm, F.C.; Smeekes, S.; Urbain, J.P. Cross-sectional dependence robust block bootstrap panel unit root tests. J. Econom. 2011, 163, 85–104. [Google Scholar] [CrossRef]
- Gengenbach, C.; Palm, F.C.; Urbain, J.P. Panel unit root tests in the presence of cross-sectional dependencies: Comparison and implications for modelling. Econom. Rev. 2009, 29, 111–145. [Google Scholar] [CrossRef]
- Phillips, P.C.B.; Sul, D. Dynamic panel estimation and homogeneity testing under cross section dependence. Econom. J. 2003, 6, 217–259. [Google Scholar] [CrossRef]
- Moon, H.R.; Perron, B. Testing for a unit root in panels with dynamic factors. J. Econom. 2004, 122, 81–126. [Google Scholar] [CrossRef]
- Pesaran, M.H. A simple panel unit root test in the presence of cross-section dependence. J. Appl. Econom. 2007, 22, 265–312. [Google Scholar] [CrossRef]
- Pedroni, P. Panel cointegration: Asymptotic and finite sample properties of pooled time series tests with an application to the PPP hypothesis. Econom. Theor. 2004, 20, 597–625. [Google Scholar] [CrossRef]
- Kao, C. Spurious regression and residual-based tests for cointegration in panel data. J. Econom. 1999, 90, 1–44. [Google Scholar] [CrossRef]
- Westerlund, J. New simple tests for panel cointegration. Econom. Rev. 2005, 24, 297–316. [Google Scholar] [CrossRef]
- Wu, F.; He, J.; Cai, L.; Du, M.; Huang, M. Accurate multi-objective prediction of CO2emission performance indexes and industrial structure optimization using multihead attention-based convolutional neural network. J. Environ. Manag. 2023, 337, 117759. [Google Scholar] [CrossRef] [PubMed]
- Holtz-Eakin, D.; Newey, W.; Rosen, H.S. Estimating vector autoregressions with panel data. Econometrica 1988, 56, 1371–1395. [Google Scholar] [CrossRef]
- Zhang, J.; Yang, Z.; He, B. Empowerment of digital Technology for the Resilience of the logistics industry: Mechanisms and paths. Systems 2024, 12, 278. [Google Scholar] [CrossRef]
- Zhang, J.; Yang, Z.; Zhang, X.; Sun, J.; He, B. Institutional Configuration Study of Urban Green Economic Efficiency–Analysis Based on fsQCA and NCA. Pol. J. Environ. 2025, 34, 1457–1467. [Google Scholar] [CrossRef]
- Baltagi, B.H.; Feng, Q.; Kao, C. Estimation of heterogeneous panels with structural breaks. J. Econometrics 2016, 191, 176–195. [Google Scholar] [CrossRef]
- Okui, R.; Wang, W. Heterogeneous structural breaks in panel data models. J. Econometrics 2021, 220, 447–473. [Google Scholar] [CrossRef]
- Clarke, D.; Tapia-Schythe, K. Implementing the panel event study. Stata J. 2021, 21, 853–884. [Google Scholar] [CrossRef]

| America (6) | Europe (10) | Africa (1) | Asia (12) |
|---|---|---|---|
| Argentina Brazil Chile Colombia Mexico Peru | Bulgaria Czech Republic Greece Hungary Poland Romania Russian Federation Slovenia Turkey Ukraine | Egypt | Bangladesh China India Indonesia Israel Iran South Korea Malaysia Pakistan Philippines Thailand Vietnam |
| Variables | Explanations | Unit | Sources |
|---|---|---|---|
| Logarithm of CO2 emission per capita | Metric tons | WDI | |
| Logarithm of GDP per capita | Constant 2015 US dollar | WIT | |
| Logarithm of energy consumption per capita | MBTU | EIA | |
| Logarithm of trade openness | Percent | WDI |
| CE | EG | EC | TP | |
|---|---|---|---|---|
| Mean | 4.834 | 9350.804 | 82.840 | 75.296 |
| Median | 4.190 | 7627.160 | 77.018 | 60.778 |
| Min | 0.210 | 698.732 | 4.742 | 22.106 |
| Max | 12.217 | 39591.40 | 240.364 | 210.374 |
| Sd | 3.213 | 7915.109 | 55.811 | 40.995 |
| Skewness | 0.531 | 1.518 | 0.744 | 0.933 |
| Kurtosis | 2.331 | 5.224 | 3.134 | 2.904 |
| Jarque-Bera | 34.303 *** | 308.134 *** | 48.511 *** | 75.939 *** |
| Prob | 0.000 | 0.000 | 0.000 | 0.000 |
| Observations | 522 | 522 | 522 | 522 |
| 1 — — | ||||
| 0.791 *** (0.000) | 1 — — | |||
| 0.977 *** (0.000) | 0.825 *** (0.000) | 1 — — | ||
| 0.460 *** (0.000) | 0.294 *** (0.000) | 0.415 *** (0.000) | 1 — — |
| lnEG | lnEC | lnTP | |
|---|---|---|---|
| VIF | 3.16 | 3.49 | 1.22 |
| 1/VIF | 0.316 | 0.287 | 0.821 |
| Homogenous/Heterogenous Slope Coefficient Testing | ||
|---|---|---|
| Test | Statistic | p-Value |
| 12.507 *** | 0.000 | |
| 14.716 *** | 0.000 | |
| Variable | CD Test | p-Value | Corr | Abs (Corr) |
|---|---|---|---|---|
| 10.40 *** | 0.000 | 0.122 | 0.625 | |
| 63.00 *** | 0.000 | 0.737 | 0.827 | |
| 18.03 *** | 0.000 | 0.211 | 0.622 | |
| 7.65 *** | 0.000 | 0.089 | 0.467 |
| Variables | Level Form | 1st Difference | ||||
|---|---|---|---|---|---|---|
| T-Bar | Z [t-Bar] | p-Value | T-Bar | Z [t-Bar] | p-Value | |
| −1.982 | −1.279 | 0.100 | −2.269 *** | −2.792 | 0.003 | |
| −1.421 | 1.686 | 0.954 | −2.234 *** | −2.608 | 0.005 | |
| −1.892 | −0.801 | 0.212 | −2.270 *** | −2.798 | 0.003 | |
| −1.169 | 3.013 | 0.999 | −2.374 *** | −3.347 | 0.000 | |
| Variables | Level Form | 1st Difference | ||
|---|---|---|---|---|
| Statistic | Critical Value (1%) | Statistic | Critical Value (1%) | |
| −1.737 | −2.32 | −3.276 | −2.32 | |
| −0.956 | −1.76 | −2.336 | −1.76 | |
| −1.868 | −2.32 | −3.465 | −2.32 | |
| −1.249 | −2.32 | −3.243 | −2.32 | |
| Within-Dimension | ||||
| Statistic | p-Value | W. Statistic | p-Value | |
| Panel v-Statistic | 1.968 ** | 0.025 | 2.021 ** | 0.022 |
| Panel rho-Statistic | −0.718 | 0.237 | −0.983 | 0.163 |
| Panel PP-Statistic | −3.351 *** | 0.000 | −3.659 *** | 0.000 |
| Panel ADF-Statistic | −2.247 ** | 0.012 | −2.003 ** | 0.023 |
| Between-Dimension | ||||
| Statistic | p-Value | |||
| Group rho-Statistic | 0.883 | 0.811 | ||
| Group PP-Statistic | −4.380 *** | 0.000 | ||
| Group ADF-Statistic | −2.614 *** | 0.005 | ||
| t-Statistic | p-Value | |
|---|---|---|
| ADF | −4.111 *** | 0.000 |
| Statistic | p-Value | |
|---|---|---|
| Variance ratio | −1.843 *** | 0.033 |
| Variables | FMOLS | DOLS | ||
|---|---|---|---|---|
| Coefficient | p-Value | Coefficient | p-Value | |
| −0.153 *** | 0.000 | −0.197 ** | 0.010 | |
| 1.232 *** | 0.000 | 1.251 *** | 0.000 | |
| −0.060 ** | 0.037 | −0.112 ** | 0.036 | |
| Adjusted R-squared | 0.996 | 0.997 | ||
| (1) MG | (2) PMG | (3) DFE | |
|---|---|---|---|
| Long-term | |||
| 0.632 (0.223) | −0.060 ** (0.022) | −0.168 (0.107) | |
| 0.699 * (0.083) | 1.026 *** (0.000) | 1.250 *** (0.000) | |
| 0.182 (0.164) | −0.149 *** (0.000) | −0.056 (0.534) | |
| Short-term | |||
| ECT | −0.583 *** (0.000) | −0.295 *** (0.000) | −0.192 *** (0.000) |
| 0.284 ** (0.019) | 0.405 *** (0.001) | 0.311 *** (0.000) | |
| 0.165 (0.136) | 0.432 *** (0.000) | 0.482 *** (0.000) | |
| −0.014 (0.704) | 0.036 (0.194) | −0.002 (0.943) | |
| Constant | −0.193 (0.643) | 0.038* (0.055) | −0.129 (0.173) |
| Chi-Squared Statistic | p-Value | |
|---|---|---|
| MG | 3.12 | 0.373 |
| PMG | ||
| MG | 0.00 | 1.000 |
| DFE |
| DCCEMG | Driscoll–Kray | |
|---|---|---|
| −0.190 ** (0.042) | −0.129 ** (0.01) | |
| 0.861 *** (0.000) | 1.177 *** (0.000) | |
| −0.052 ** (0.022) | −0.058 *** (0.003) | |
| −0.714 *** (0.000) | _______ | |
| Constant | _______ | −0.485 *** (0.000) |
| Null Hypothesis | W-Stat. | Zbar-Stat | p-Value |
|---|---|---|---|
| 4.035 *** | 2.795 | 0.005 | |
| 4.124 *** | 2.952 | 0.003 | |
| 3.679 ** | 2.170 | 0.030 | |
| 4.553 *** | 3.706 | 0.000 | |
| 5.508 *** | 5.384 | 0.000 | |
| 4.461 *** | 3.544 | 0.000 | |
| 2.615 | 0.299 | 0.765 | |
| 3.123 | 1.192 | 0.233 | |
| 2.813 | 0.648 | 0.517 | |
| 7.768 *** | 9.355 | 0.000 | |
| 4.796 *** | 4.133 | 0.000 | |
| 7.752 *** | 9.327 | 0.000 |
Disclaimer/Publisher’s Note: The statements, opinions and data contained in all publications are solely those of the individual author(s) and contributor(s) and not of MDPI and/or the editor(s). MDPI and/or the editor(s) disclaim responsibility for any injury to people or property resulting from any ideas, methods, instructions or products referred to in the content. |
© 2025 by the authors. Licensee MDPI, Basel, Switzerland. This article is an open access article distributed under the terms and conditions of the Creative Commons Attribution (CC BY) license (https://creativecommons.org/licenses/by/4.0/).
Share and Cite
Zhou, R.; Guan, S.; He, B. The Impact of Trade Openness on Carbon Emissions: Empirical Evidence from Emerging Countries. Energies 2025, 18, 697. https://doi.org/10.3390/en18030697
Zhou R, Guan S, He B. The Impact of Trade Openness on Carbon Emissions: Empirical Evidence from Emerging Countries. Energies. 2025; 18(3):697. https://doi.org/10.3390/en18030697
Chicago/Turabian StyleZhou, Rui, Shu Guan, and Bing He. 2025. "The Impact of Trade Openness on Carbon Emissions: Empirical Evidence from Emerging Countries" Energies 18, no. 3: 697. https://doi.org/10.3390/en18030697
APA StyleZhou, R., Guan, S., & He, B. (2025). The Impact of Trade Openness on Carbon Emissions: Empirical Evidence from Emerging Countries. Energies, 18(3), 697. https://doi.org/10.3390/en18030697