
Structural and Modal Analysis of a Small Wind Turbine Blade Considering Composite Material and the IEC 61400-2 Standard


Abstract
1. Introduction
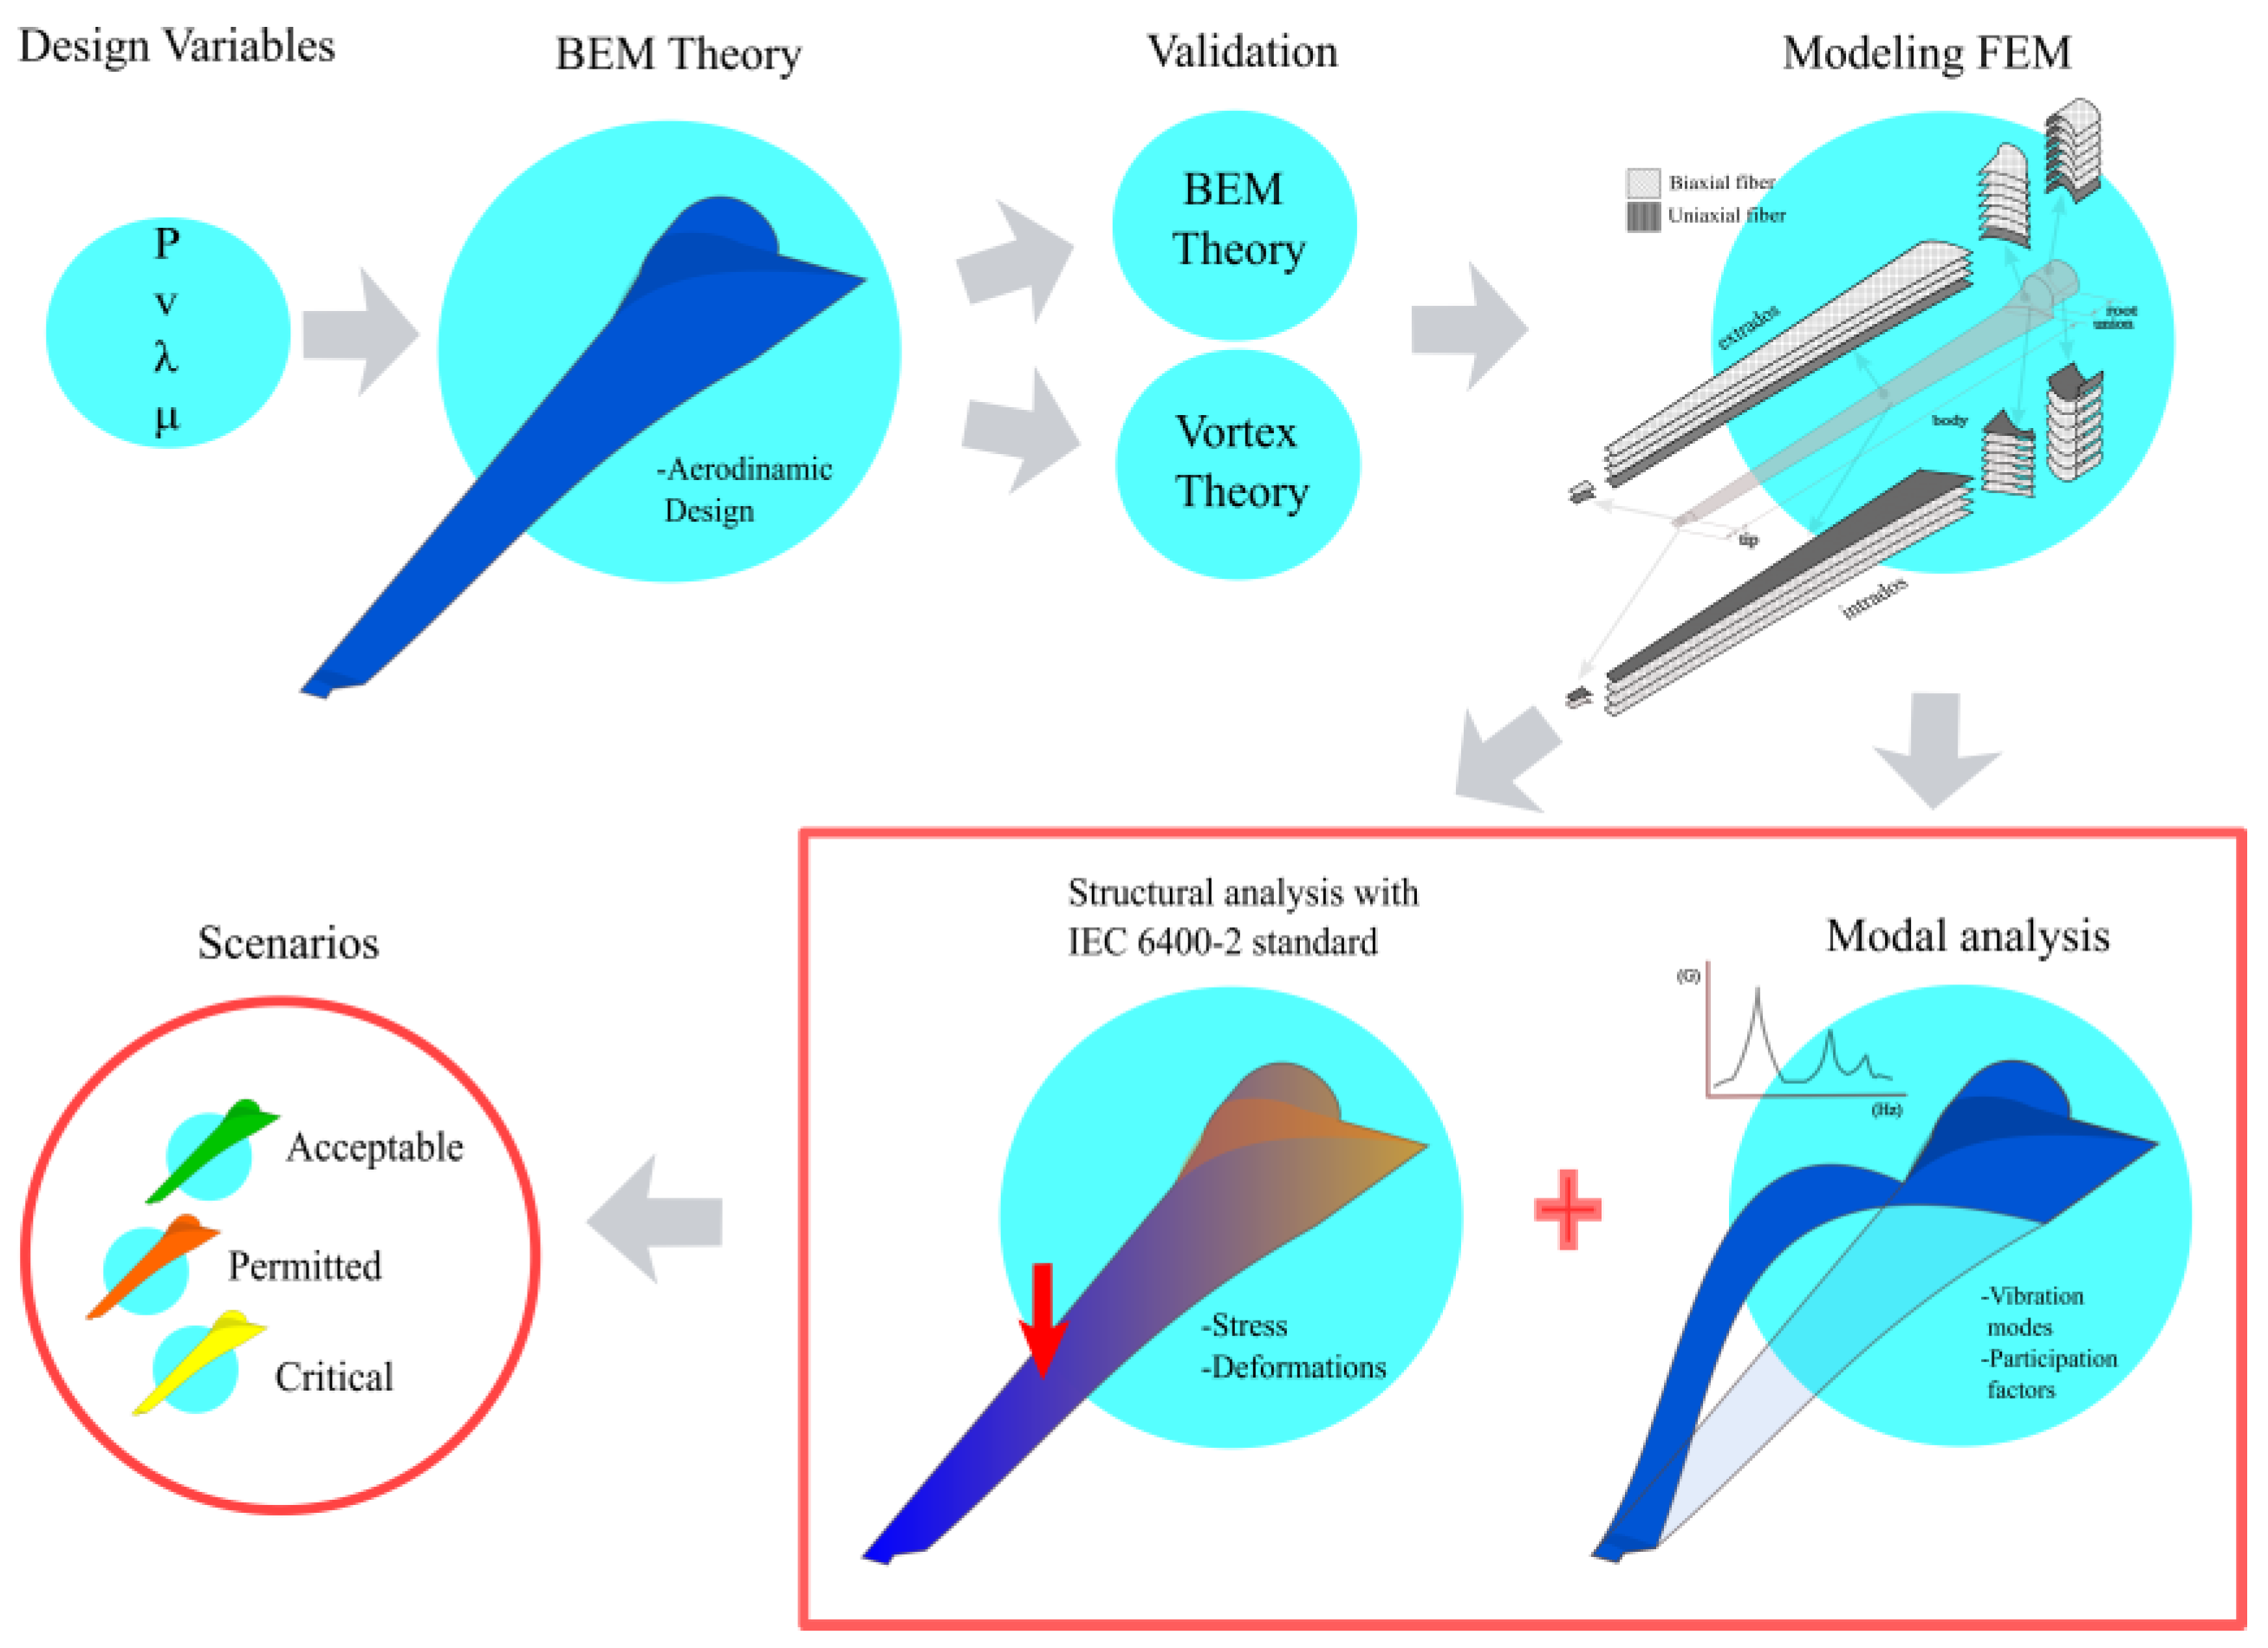
2. Materials and Methods
- rated power, ,
- wind speed, ,
- tip speed ratio, , and
- dynamic viscosity,
2.1. Material Selection
2.2. Simple Model in FEM
2.3. FEM Simulation Software for Composite Materials
2.4. Setting up Fiberglass Layers in the Software
2.5. Modal Analysis
2.6. IEC 61400-2 International Standard
3. Results
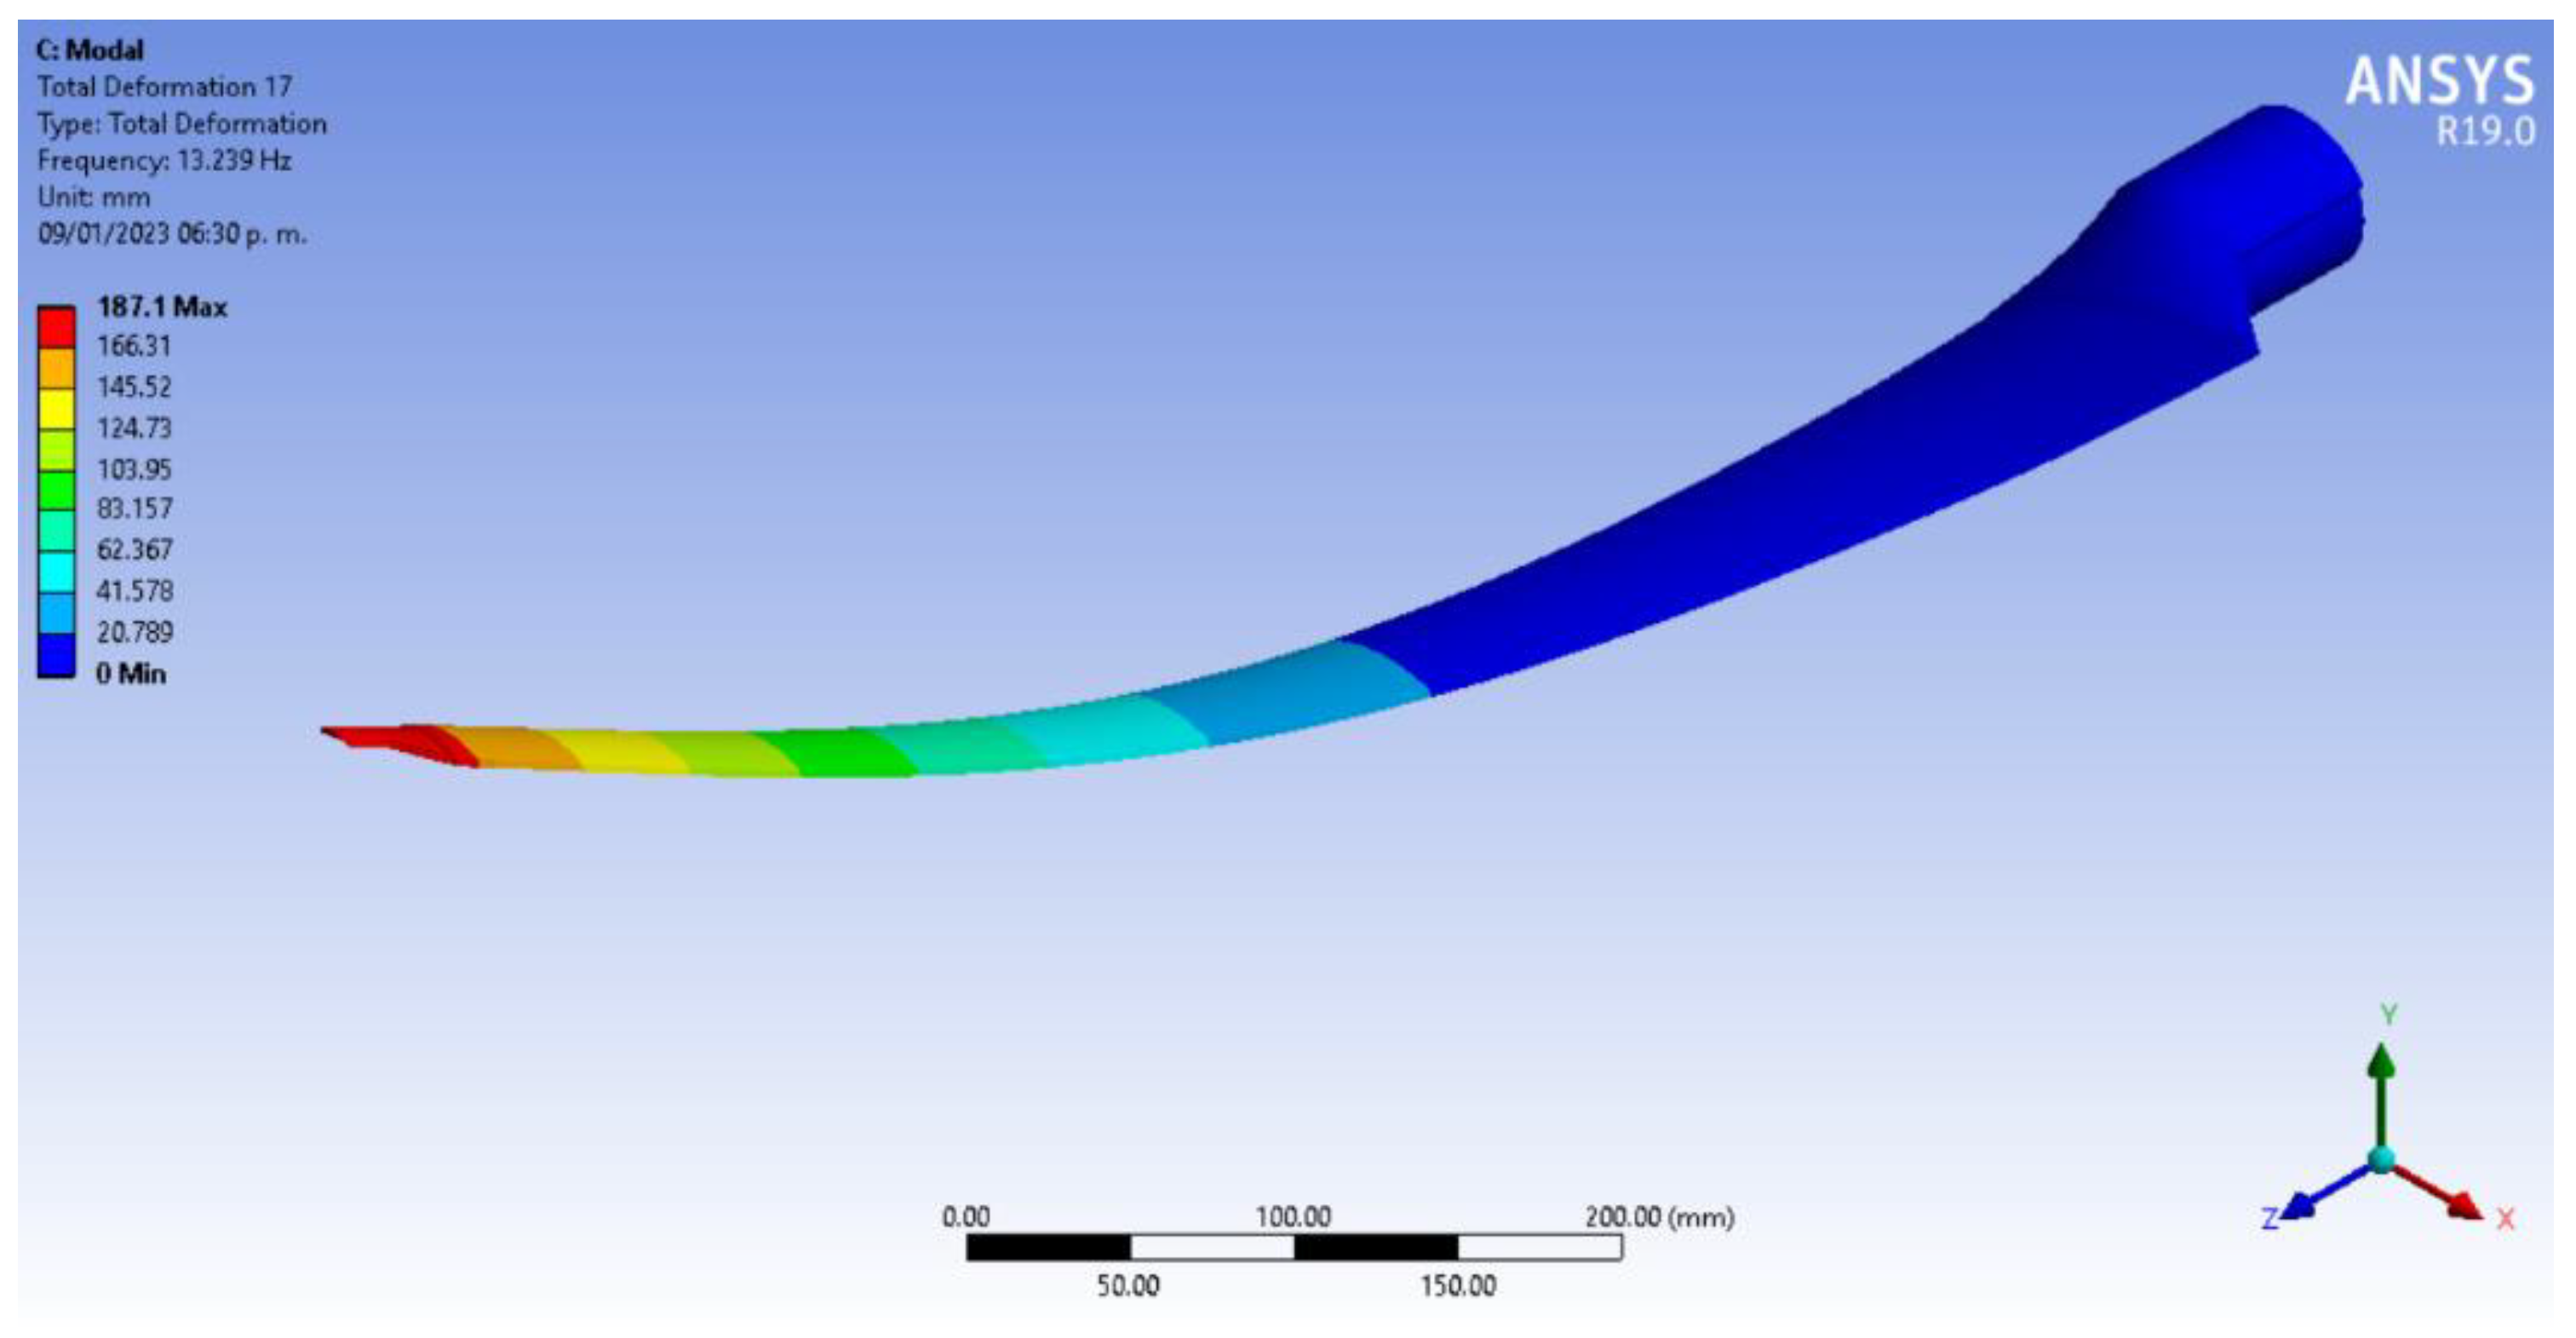
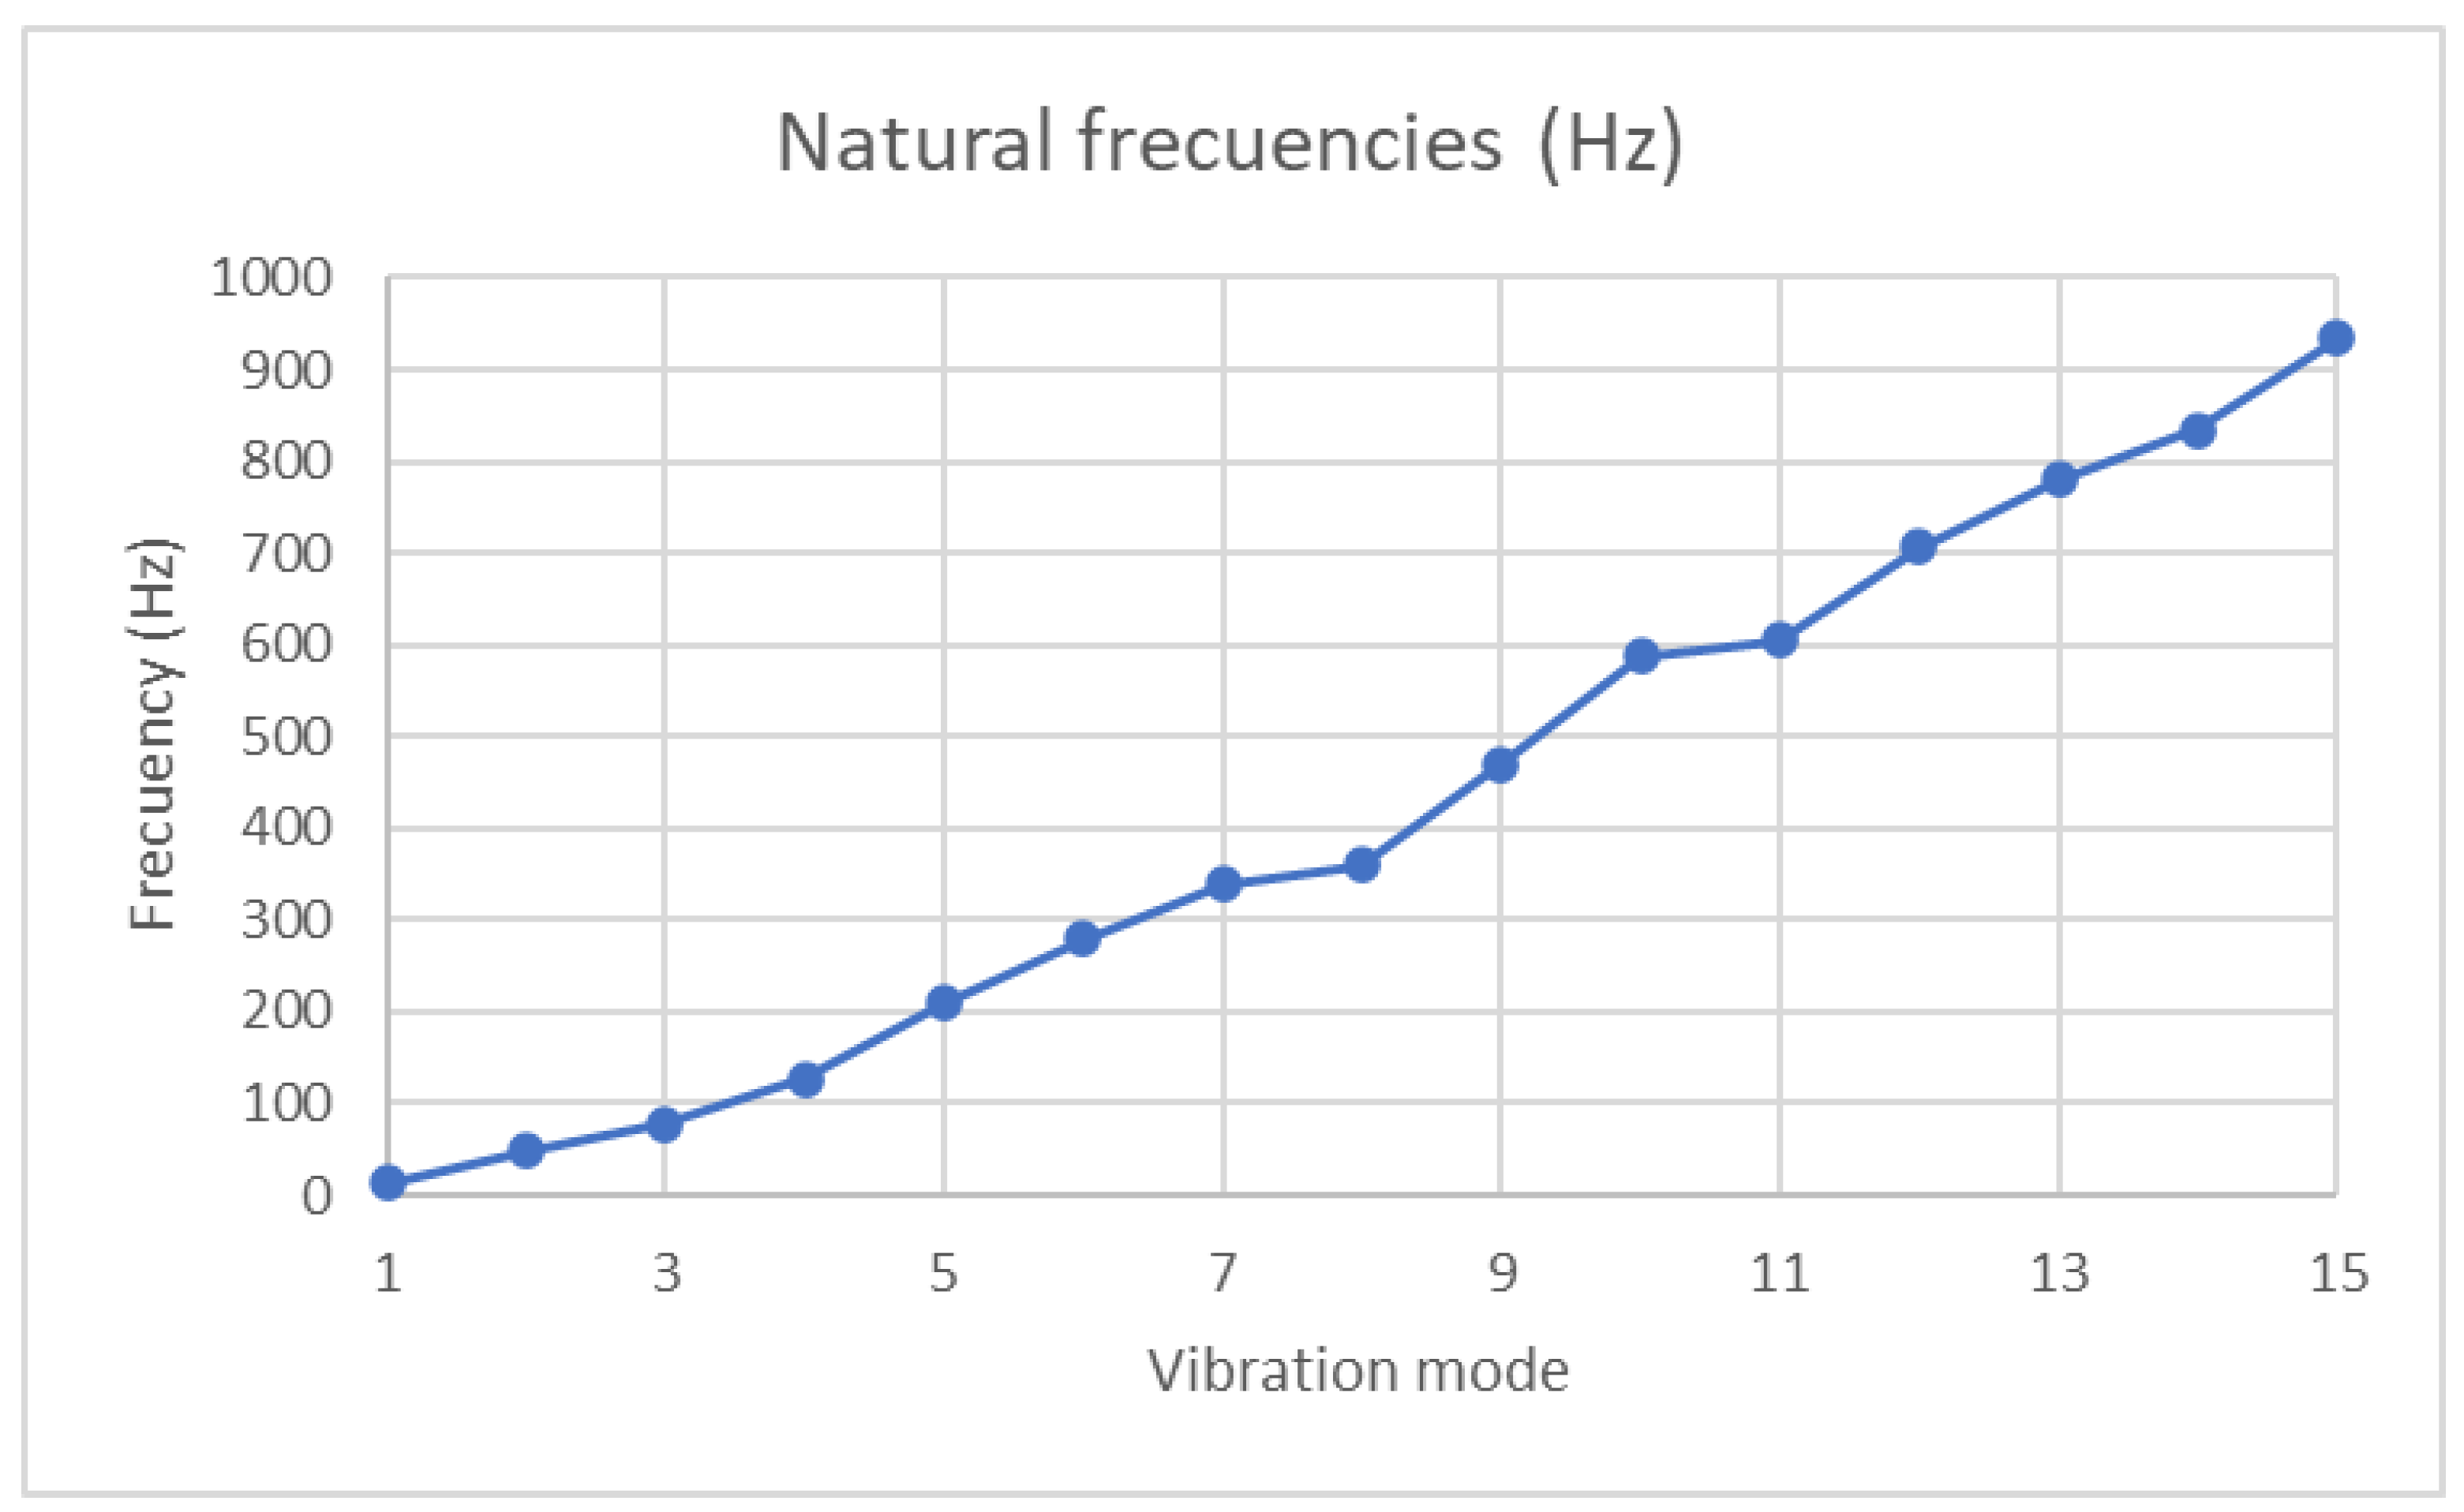
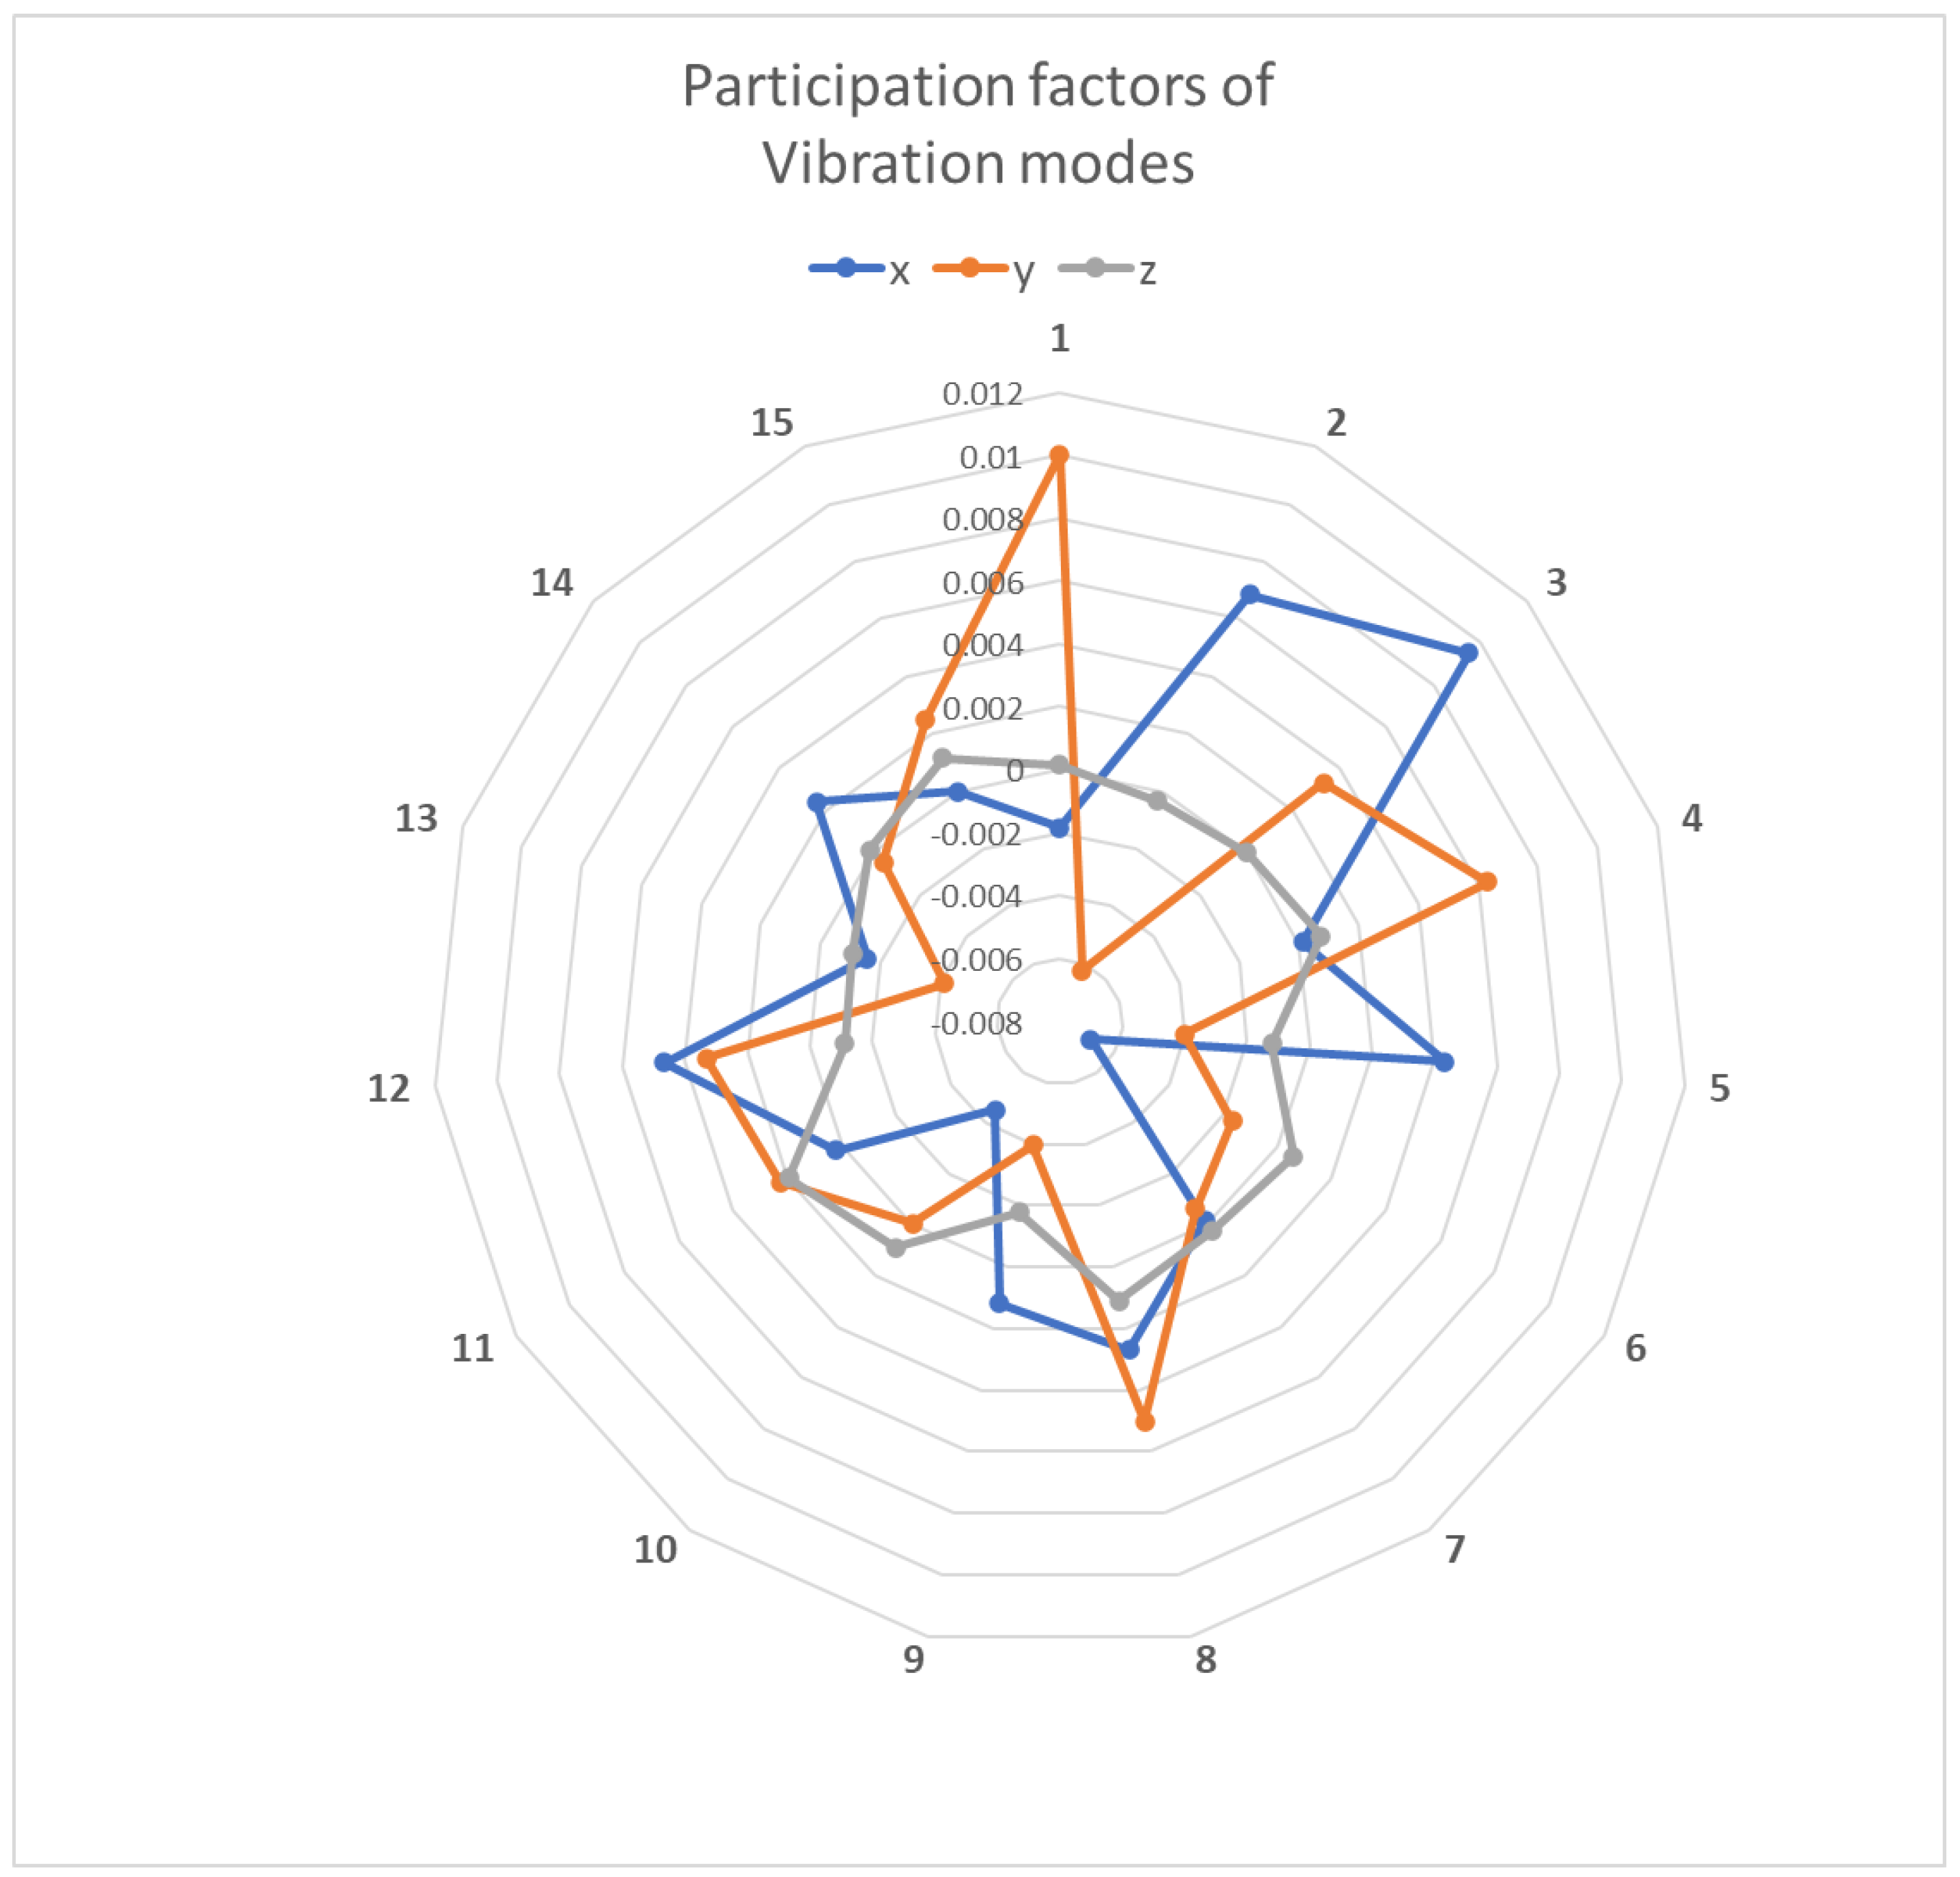
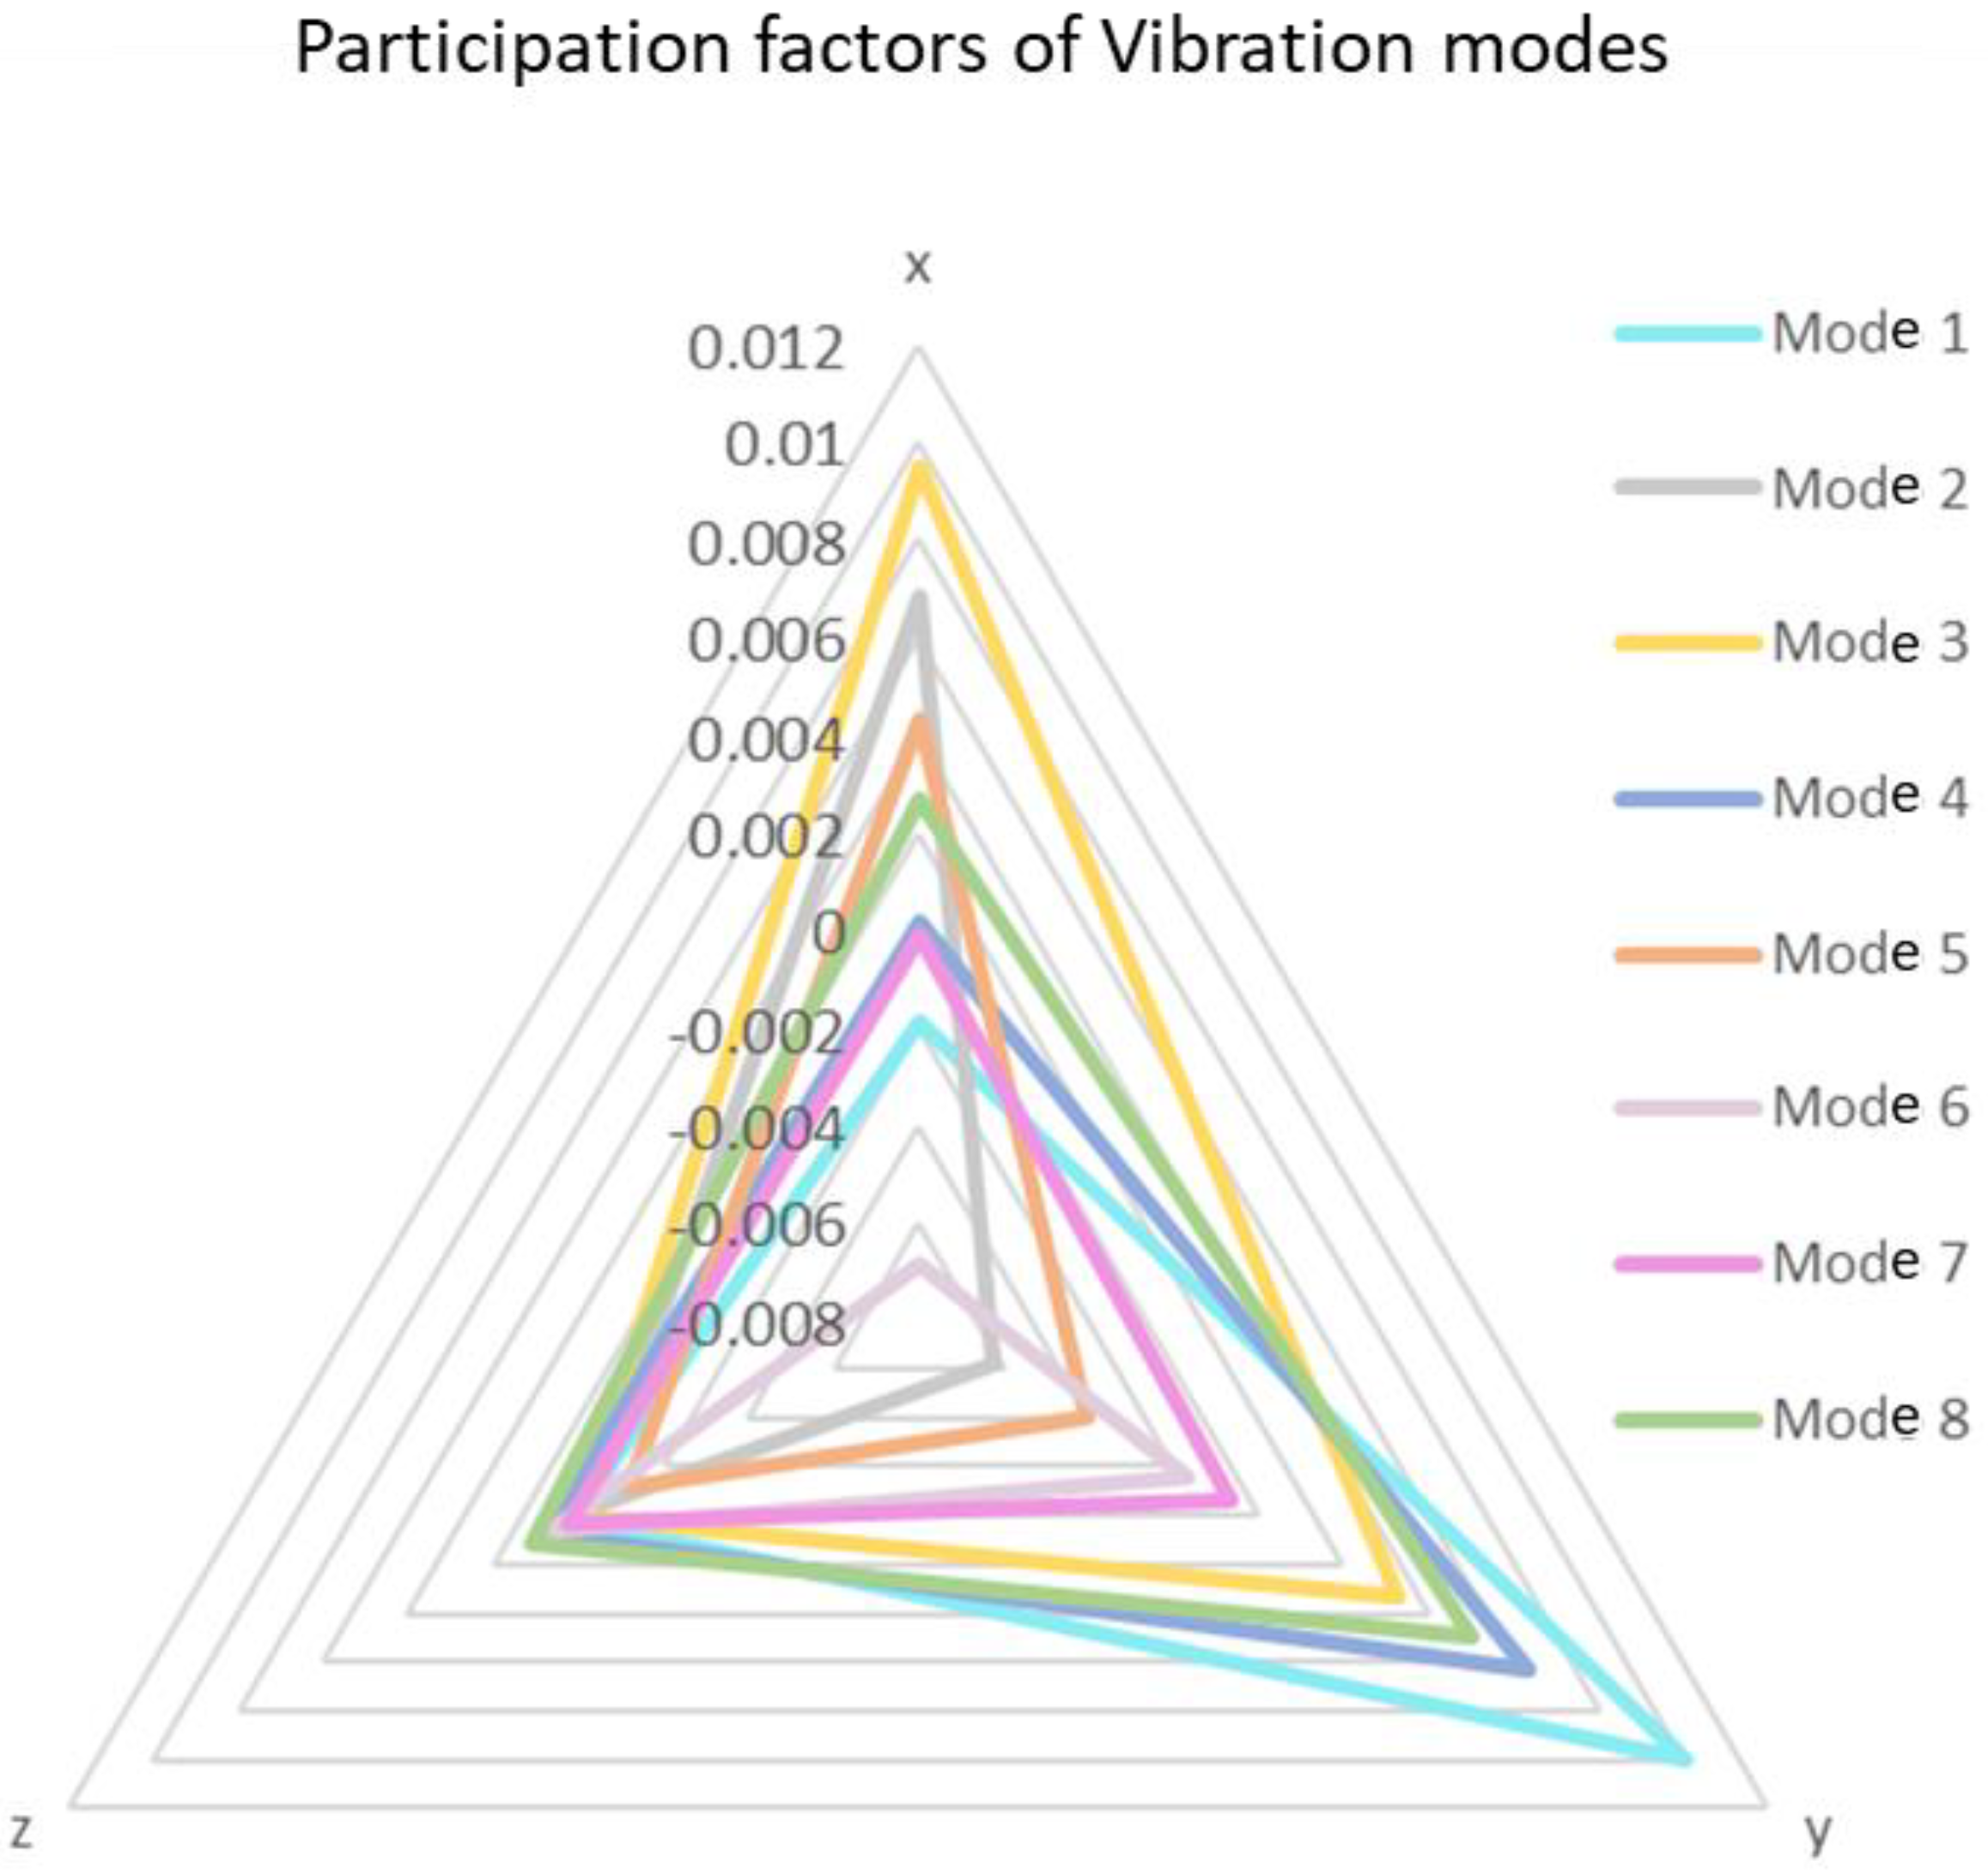
3.1. Modal Simulation and Analysis in FEM
3.2. Structural Analysis According to IEC 61400-2 by Using FEM Software


4. Discussion
5. Conclusions
Author Contributions
Funding
Data Availability Statement
Acknowledgments
Conflicts of Interest
References
- AMDEE Asociación Mexicana de Energía Eólica. Available online: https://amdee.org/es_es/ (accessed on 25 June 2024).
- Arramach, J.; Boutammachte, N.; Bouatem, A.; Al Mers, A. Prediction of the Wind Turbine Performance by Using a Modified BEM Theory with an Advanced Brake State Model. Energy Procedia 2017, 118, 149–157. [Google Scholar] [CrossRef]
- de Freitas Pinto, R.L.U.; Gonçalves, B.P.F. A revised theoretical analysis of aerodynamic optimization of horizontal-axis wind turbines based on BEM theory. Renew. Energy 2017, 105, 625–636. [Google Scholar] [CrossRef]
- Sang, S.; Wen, H.; Cao, A.X.; Du, X.R.; Zhu, X.; Shi, Q.; Qiu, C.H. Dynamic modification method for BEM of wind turbine considering the joint action of installation angle and structural pendulum motion. Ocean Eng. 2020, 215, 107528. [Google Scholar] [CrossRef]
- Mangestiyono, W.; Setyoko, B.; Tadeus, D.Y. Mechanical Strength of 10 kW Wind Turbine Blade Utilize Glass Fiber Reinforced Plastic. Mater. Today Proc. 2019, 13 Pt 1, 71–75. [Google Scholar] [CrossRef]
- Torregrosa, A.J.; Gil, A.; Quintero, P.; Cremades, A. On the effects of orthotropic materials in flutter protection of wind turbine flexible blades. J. Wind Eng. Ind. Aerodyn. 2022, 227, 105055. [Google Scholar] [CrossRef]
- Zaradnik, R.; Raichman, S.; Mirasso, A. Vibraciones libres de palas de turbinas eólicas de materiales compuestos considerando cinemática no lineal mediante modelos de elementos finitos. Mecánica Comput. 2017, XXVI, 419–438. [Google Scholar]
- Wang, L.; Cheng, T.H.; Tang, X.D.; Qian, J.G. Vibration and damping analysis of carbon fiber wind turbine blade with viscoelastic damping treatment. Adv. Mater. Res. 2014, 1008, 192–196. [Google Scholar] [CrossRef]
- Ganeriwala, S.N.; Kanakasabai, V.; Richardson, M. Modes indicate cracks in wind turbine blades. In Conference Proceedings of the Society for Experimental Mechanics Series; Springer New York LLC: New York, NY, USA, 2011; pp. 509–513. [Google Scholar] [CrossRef]
- Xu, J.; Zhang, L.; Li, S.; Xu, J. The influence of rotation on natural frequencies of wind turbine blades with pre-bend. J. Renew. Sustain. Energy 2020, 12, 023303. [Google Scholar] [CrossRef]
- Bachhania, K. Vibration analysis of Vertical axis wind turbine (VAWT) using Ansys. Int. J. Mech. Eng. 2022, 7, 2484–2492. [Google Scholar]
- Soyoz, S.; Hanbay, S.; Bagirgan, B.; Ergun, O. Long-term vibration-based monitoring and seismic performance assessment of a wind turbine. J. Civ. Struct. Health Monit. 2021, 11, 117–128. [Google Scholar] [CrossRef]
- Thomas, T.T.; Narkhede, M.M.; Patil, B.S.; Mogra, A. Analysis of Wind Turbine Blade Having i Shaped Spar Using Both Epoxy Fiber and Carbon Fiber Using FEM. Mater. Today Proc. 2017, 4, 2573–2579. [Google Scholar] [CrossRef]
- Eldeeb, A.E.; Eldeeb, A.E.; El-Arabi, M.E.; Hussein, B.A. Effect of cracks in wind turbine blades on natural frequencies during operation. J. Eng. Appl. Sci. 2020, 67, 1995–2012. [Google Scholar]
- Hand, B.; Kelly, G.; Cashman, A. Structural analysis of an offshore vertical axis wind turbine composite blade experiencing an extreme wind load. Mar. Struct. 2021, 75, 102858. [Google Scholar] [CrossRef]
- AEN/CTN 206 and Producción de Energía Eléctrica UNESA. Norma Española IEC 61400-2. 2014. Available online: www.aenor.es (accessed on 15 May 2024).
- Molinero, D.; López, V.; Cervantes, A. Revista de Simulación Computacional Aerodynamic design proposal for turbulence reduction in the rotational steed in low-capacity HAWT wind turbines. Diciembre 2020, 4, 20–29. [Google Scholar] [CrossRef]
- Mahmuddin, F. Rotor Blade Performance Analysis with Blade Element Momentum Theory. Energy Procedia 2017, 105, 1123–1129. [Google Scholar] [CrossRef]
- Zhang, C.; Chen, H.P.; Huang, T.L. Fatigue damage assessment of wind turbine composite blades using corrected blade element momentum theory. Measurement 2018, 129, 102–111. [Google Scholar] [CrossRef]
- Wood, D. Small Wind Turbines: Analysis, Design, and Application; Springer: Berlin/Heidelberg, Germany, 2011. [Google Scholar] [CrossRef]
- Manwell, J.F.; McGowan, J.G.; Rogers, A.L. Wind Energy Explained: Theory, Design and Application, 2nd ed.; Wiley: Hoboken, NJ, USA, 2010; ISBN 978-0-470-01500-1. [Google Scholar]
- Giguere, P.; Selig, M.S. New Airfoils for Small Horizontal Axis Wind Turbines. ASME J. Sol. Energy Eng. 1998, 120, 108–114. [Google Scholar] [CrossRef]
- Marten, D.; Saverin, J.; de Luna, R.B.; Perez-Becker, S. QBlade. 2024. Available online: https://docs.qblade.org/ (accessed on 12 August 2024).
- White, M.F. Mecánica de Fluidos, 5th ed.; Mc Graw Hill: Rhode Island, RI, USA, 2004; ISBN 0-07-240217-2. [Google Scholar]
- Burton, T.; Sharpe, D.; Jenkins, N.; Bossanyi, E. Wind Energy Handbook; John Wiley & Sons, Ltd.: Hoboken, NJ, USA, 2001; ISBN 0-471-48997-2. [Google Scholar]
- Smith, W.F.; Javad, H.; Nagore Cázares, G.; González Caver, P.; Leonarda, C.A.; Bellido Velasco, J.A. Fundamentos de la Ciencia e Ingeniería de Materiales, 4th ed.; McGraw-Hill Interamericana: New York, NY, USA, 2006; ISBN 9701056388. [Google Scholar]
- Askeland, D.R.; Fulay, P.P.; Wright, W.J. Ciencia e Ingeniería de Materiales, 6th ed.; CENGAGE Learning: Boston, MA, USA, 2012; ISBN 9786074816204. [Google Scholar]
- Cortés, T.A.; Tovar, A. Comparación entre los procesos industriales para el conformado de piezas con materiales compuestos. In Temas de Ciencia y Tecnología; Universidad Tecnológica de la Mixteca: Oaxaca, Mexico, 2020; Volume 24, pp. 33–40. ISSN 2007-0977. Available online: https://www.imrtest.com/tests/ (accessed on 15 May 2024).
- Barnes, R.H.; Morozov, E.V.; Shankar, K. Improved methodology for design of low wind speed specific wind turbine blades. Compos. Struct. 2014, 119, 677–684. [Google Scholar] [CrossRef]
- Zamudio, J.G.; Gónzalez, A. Diseño del Sistema de Infusión de Resina Para la Fabricación de Aspas Utilizadas en un Aerogenerador de 30 kW. Master’s Thesis, CIATEQ, Querétaro, Mexico, 2020. [Google Scholar]
- ANSYS Inc. Engineering Analysis with ANSYS Software; ANSYS Student [Software]; ANSYS Inc.: Canonsburg, PA, USA, 2024. [Google Scholar]
- Hu, G.; Sun, W.; Wu, A.; Xu, Y. Modal analysis of three rotating blades of large wind turbine. Appl. Mech. Mater. 2012, 157, 697–701. [Google Scholar] [CrossRef]
- Thomson, W.T. Theory of Vibration with Applications. In Theory of Vibration with Applications, 4th ed.; Springer: Santa Barbara, CA, USA; New York NY, USA, 1993; ISBN 978-0-412-78390-6. [Google Scholar] [CrossRef]
- ANSYS Inc. ANSYS Contact Technology Guide. 20 June 2024. Available online: http://www.ansys.com (accessed on 15 May 2024).
- Tsai, S.W.; Afb, W.-P.; Wu, E.M.; Louis, S. A General Theory of Strength for Anisotropic Materials. J. Compos. Mater. 1971, 5, 58–80. [Google Scholar] [CrossRef]


| Property | ±45° Angle Ply Glass/Epoxy | Unidirectional Glass/Epoxy | |
|---|---|---|---|
| Longitudinal modulus, GPa | 25 | 39 | |
| Transverse modulus, GPa | 25 | 8.3 | |
| Transverse modulus, GPa | 18 | 8.3 | |
| Shear modulus, GPa | 6.3 | 4.1 | |
| Poisson’s ratio | 0.38 | 0.26 | |
| Tensile strength, MPa | 511 | 1062 | |
| Compressive strength, MPa | 628 | 610 | |
| Tensile strength, MPa | 511 | 31 | |
| Compressive strength, MPa | 628 | 118 | |
| Tensile strength, MPa | 28 | 31 | |
| Compressive strength, MPa | 138 | 118 | |
| In plane shear strength, MPa | 790 | 72 | |
| Density, kg/m3 | 1900 | 1900 | |
| Load Hypothesis | Stress (MPa) | ||
|---|---|---|---|
| Maximum Principal | Von Mises | ||
| FAz | Force in z | 37.67 | 33.75 |
| MAx | Moment in x | 1.59 | 1.03 |
| MAy | Moment in y | 2.69 | 1.96 |
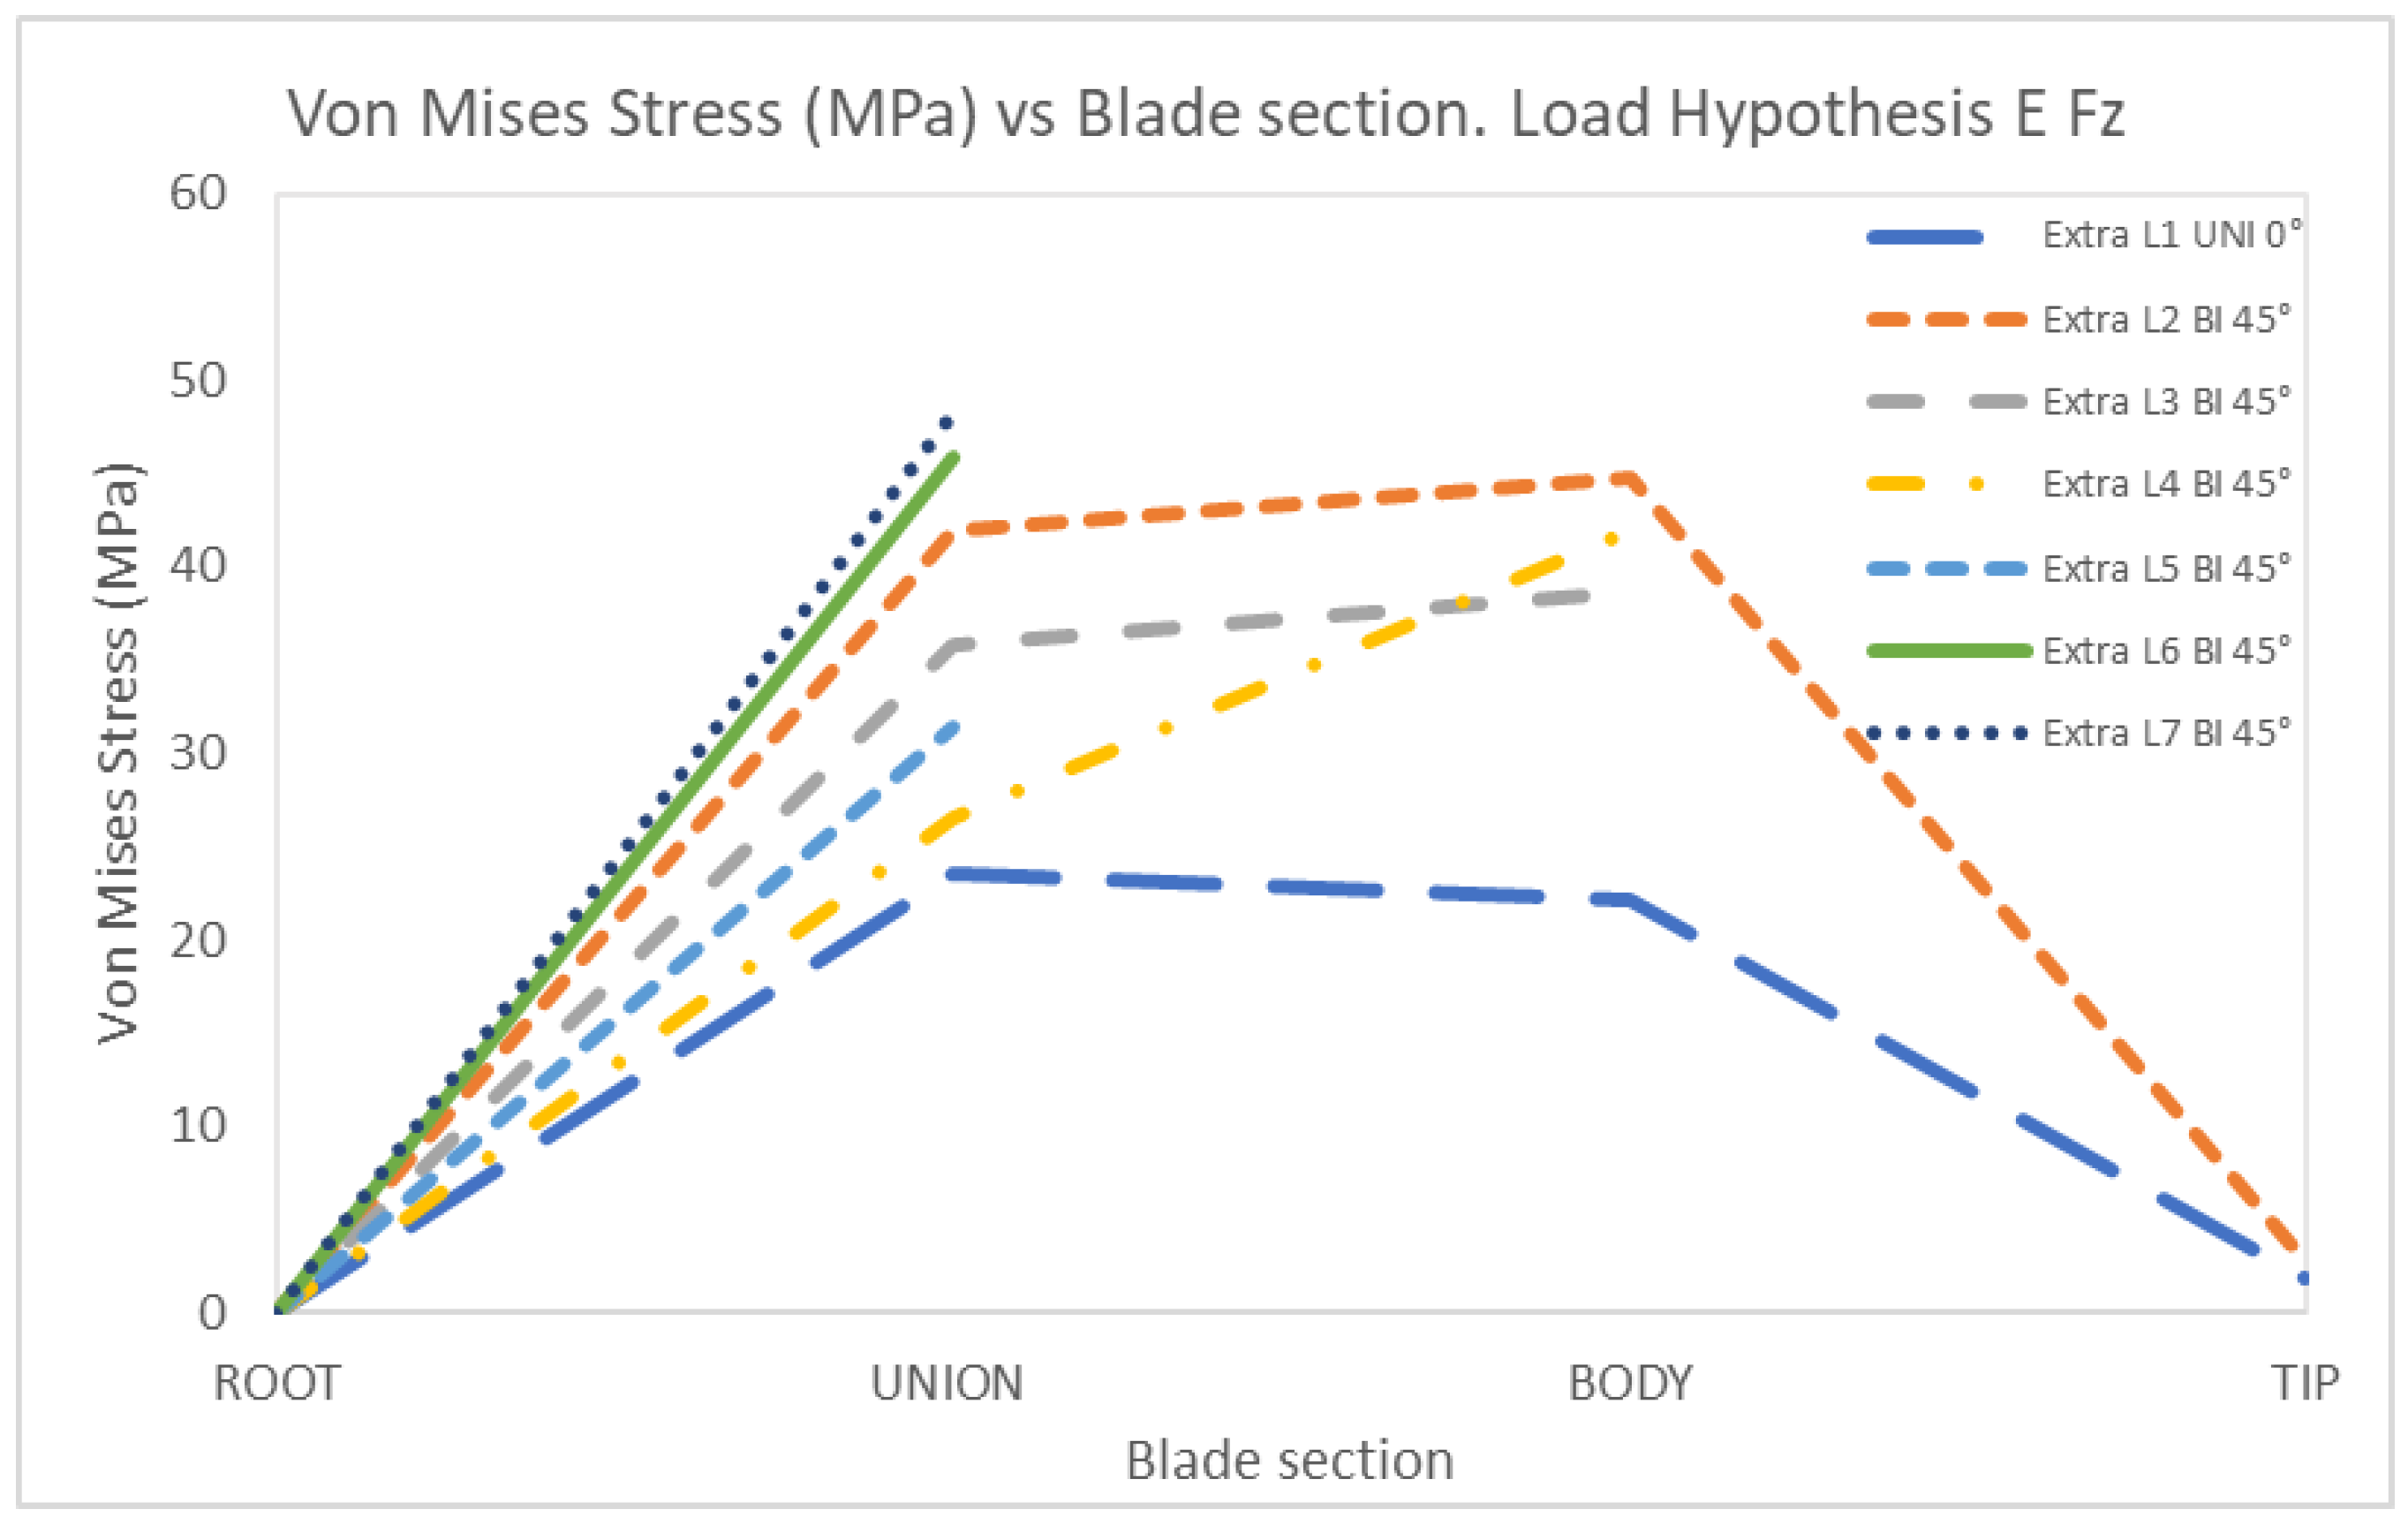
| FEz | Force in z | 30.86 | 27.65 |
| MBy | Moment in y | 0.85 | 0.98 |
| MCy | Moment in y | 415.27 | 300.72 |
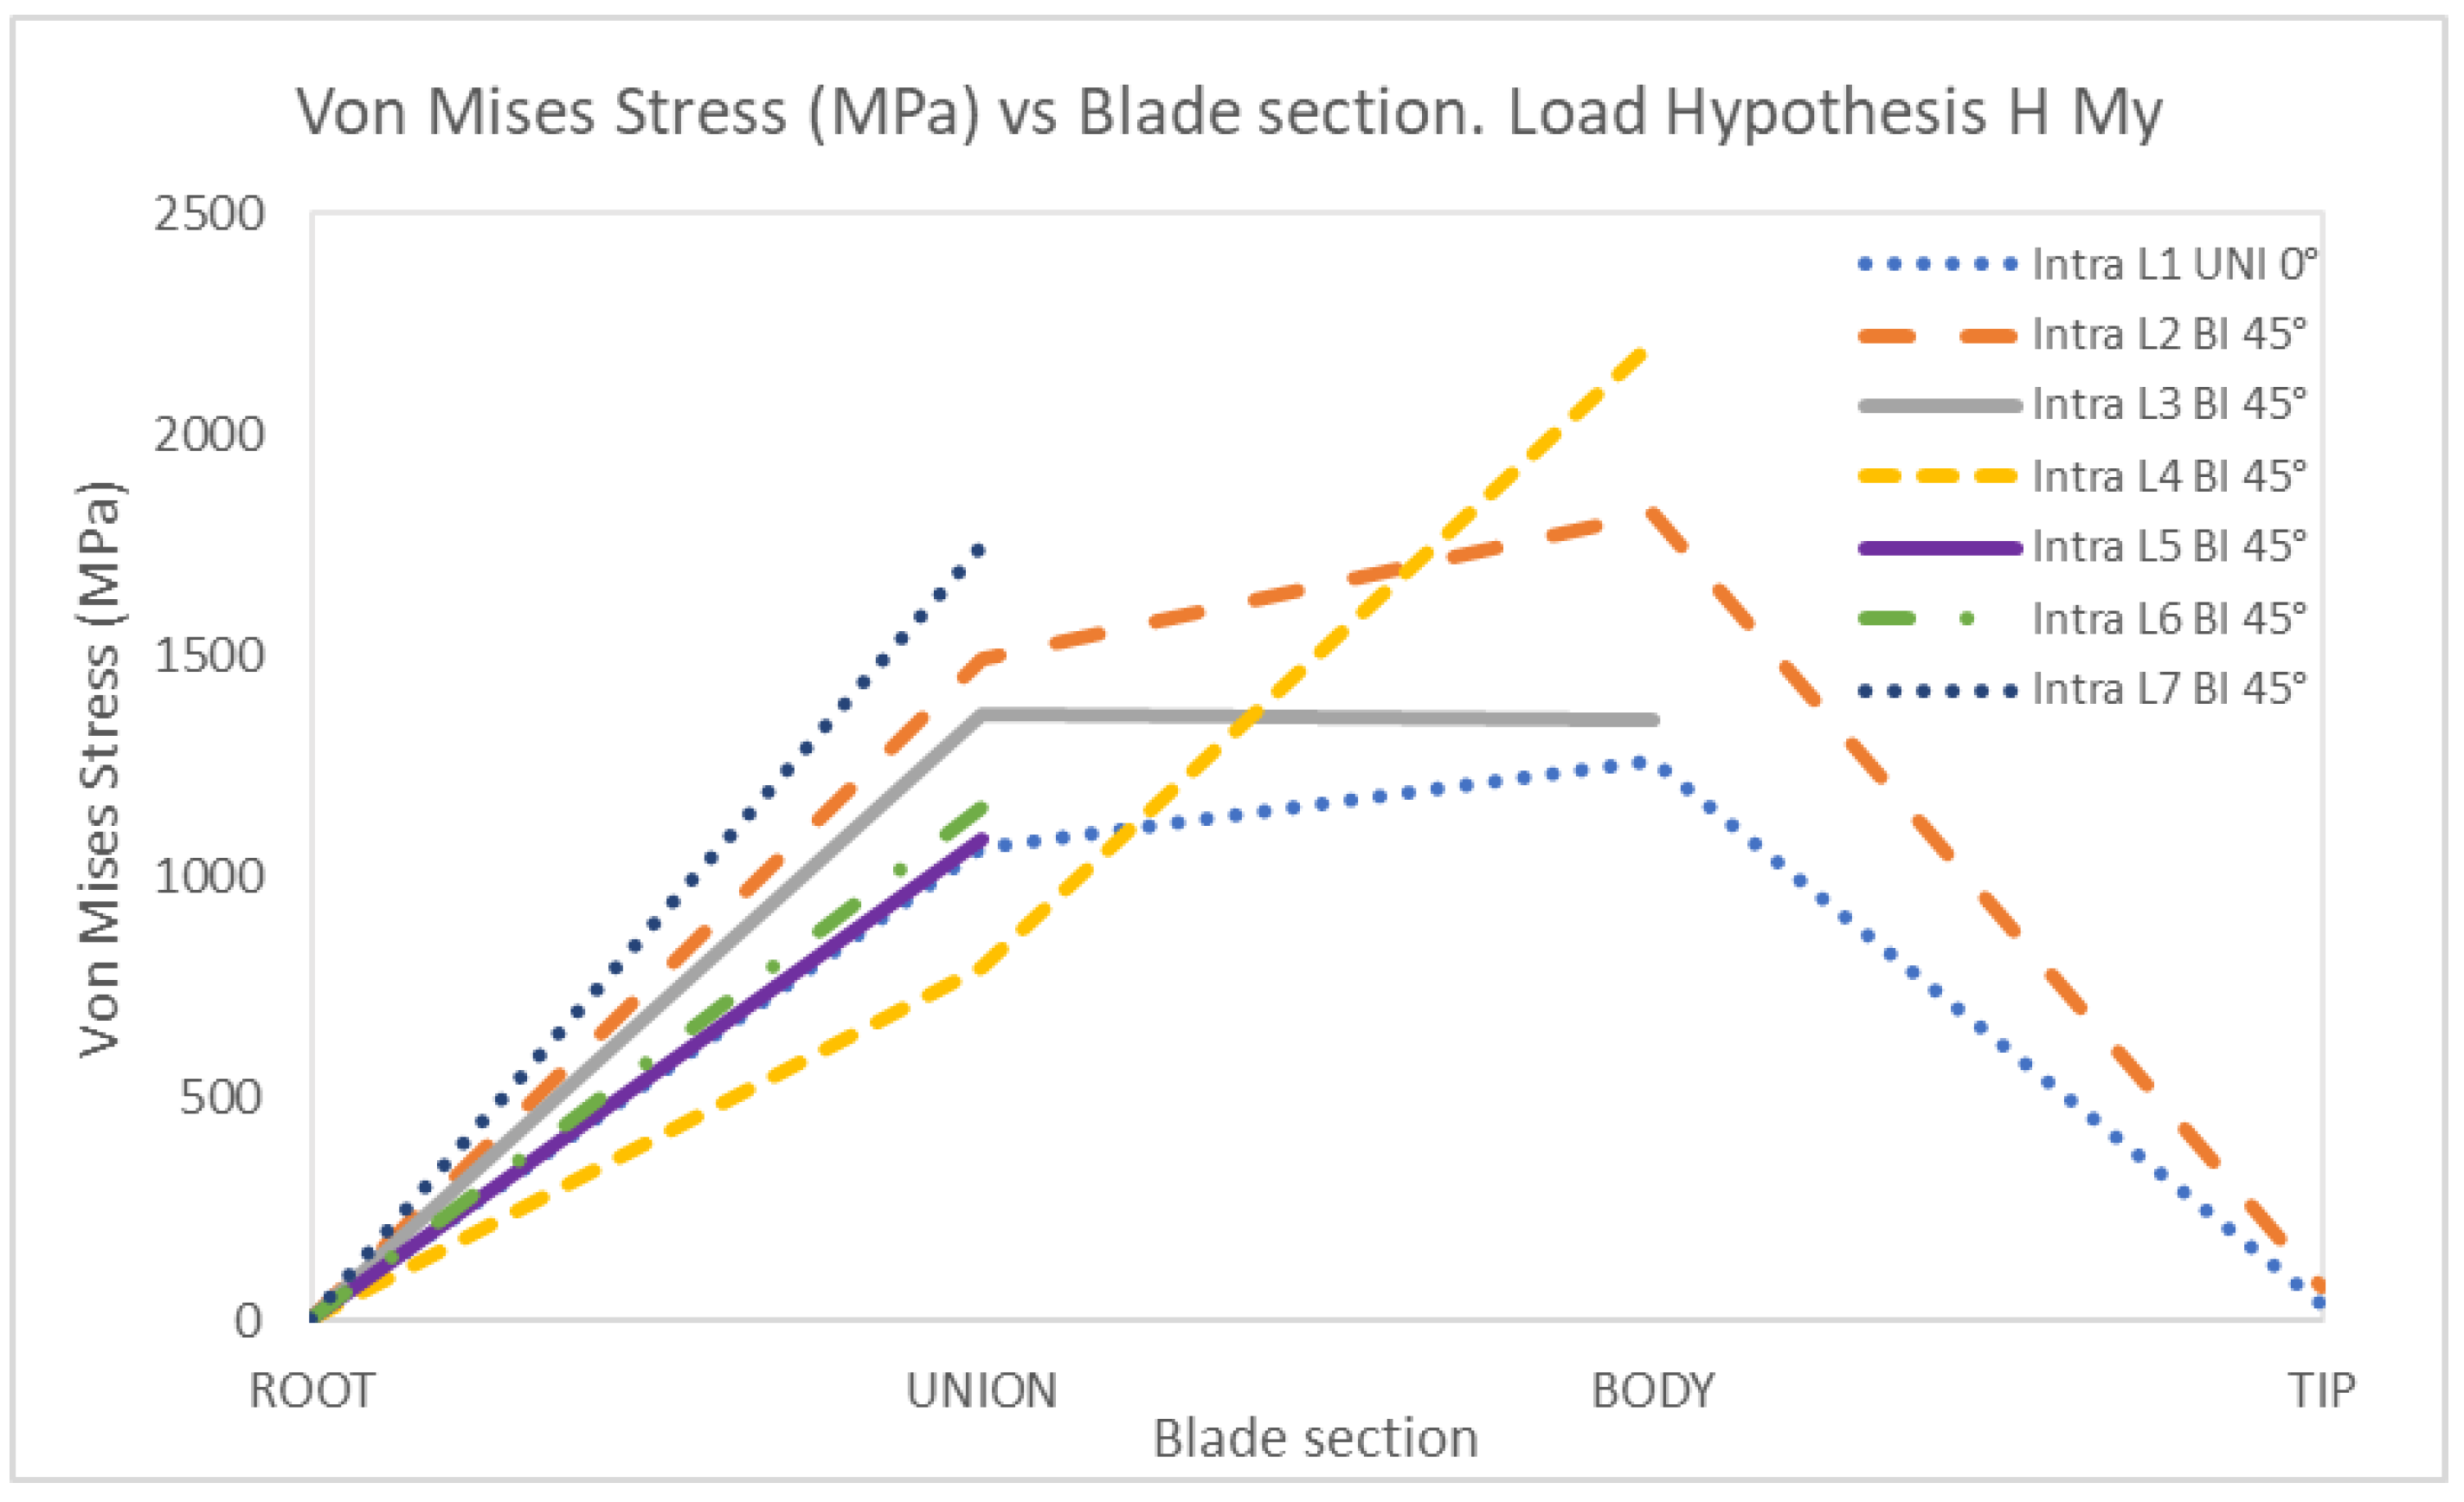
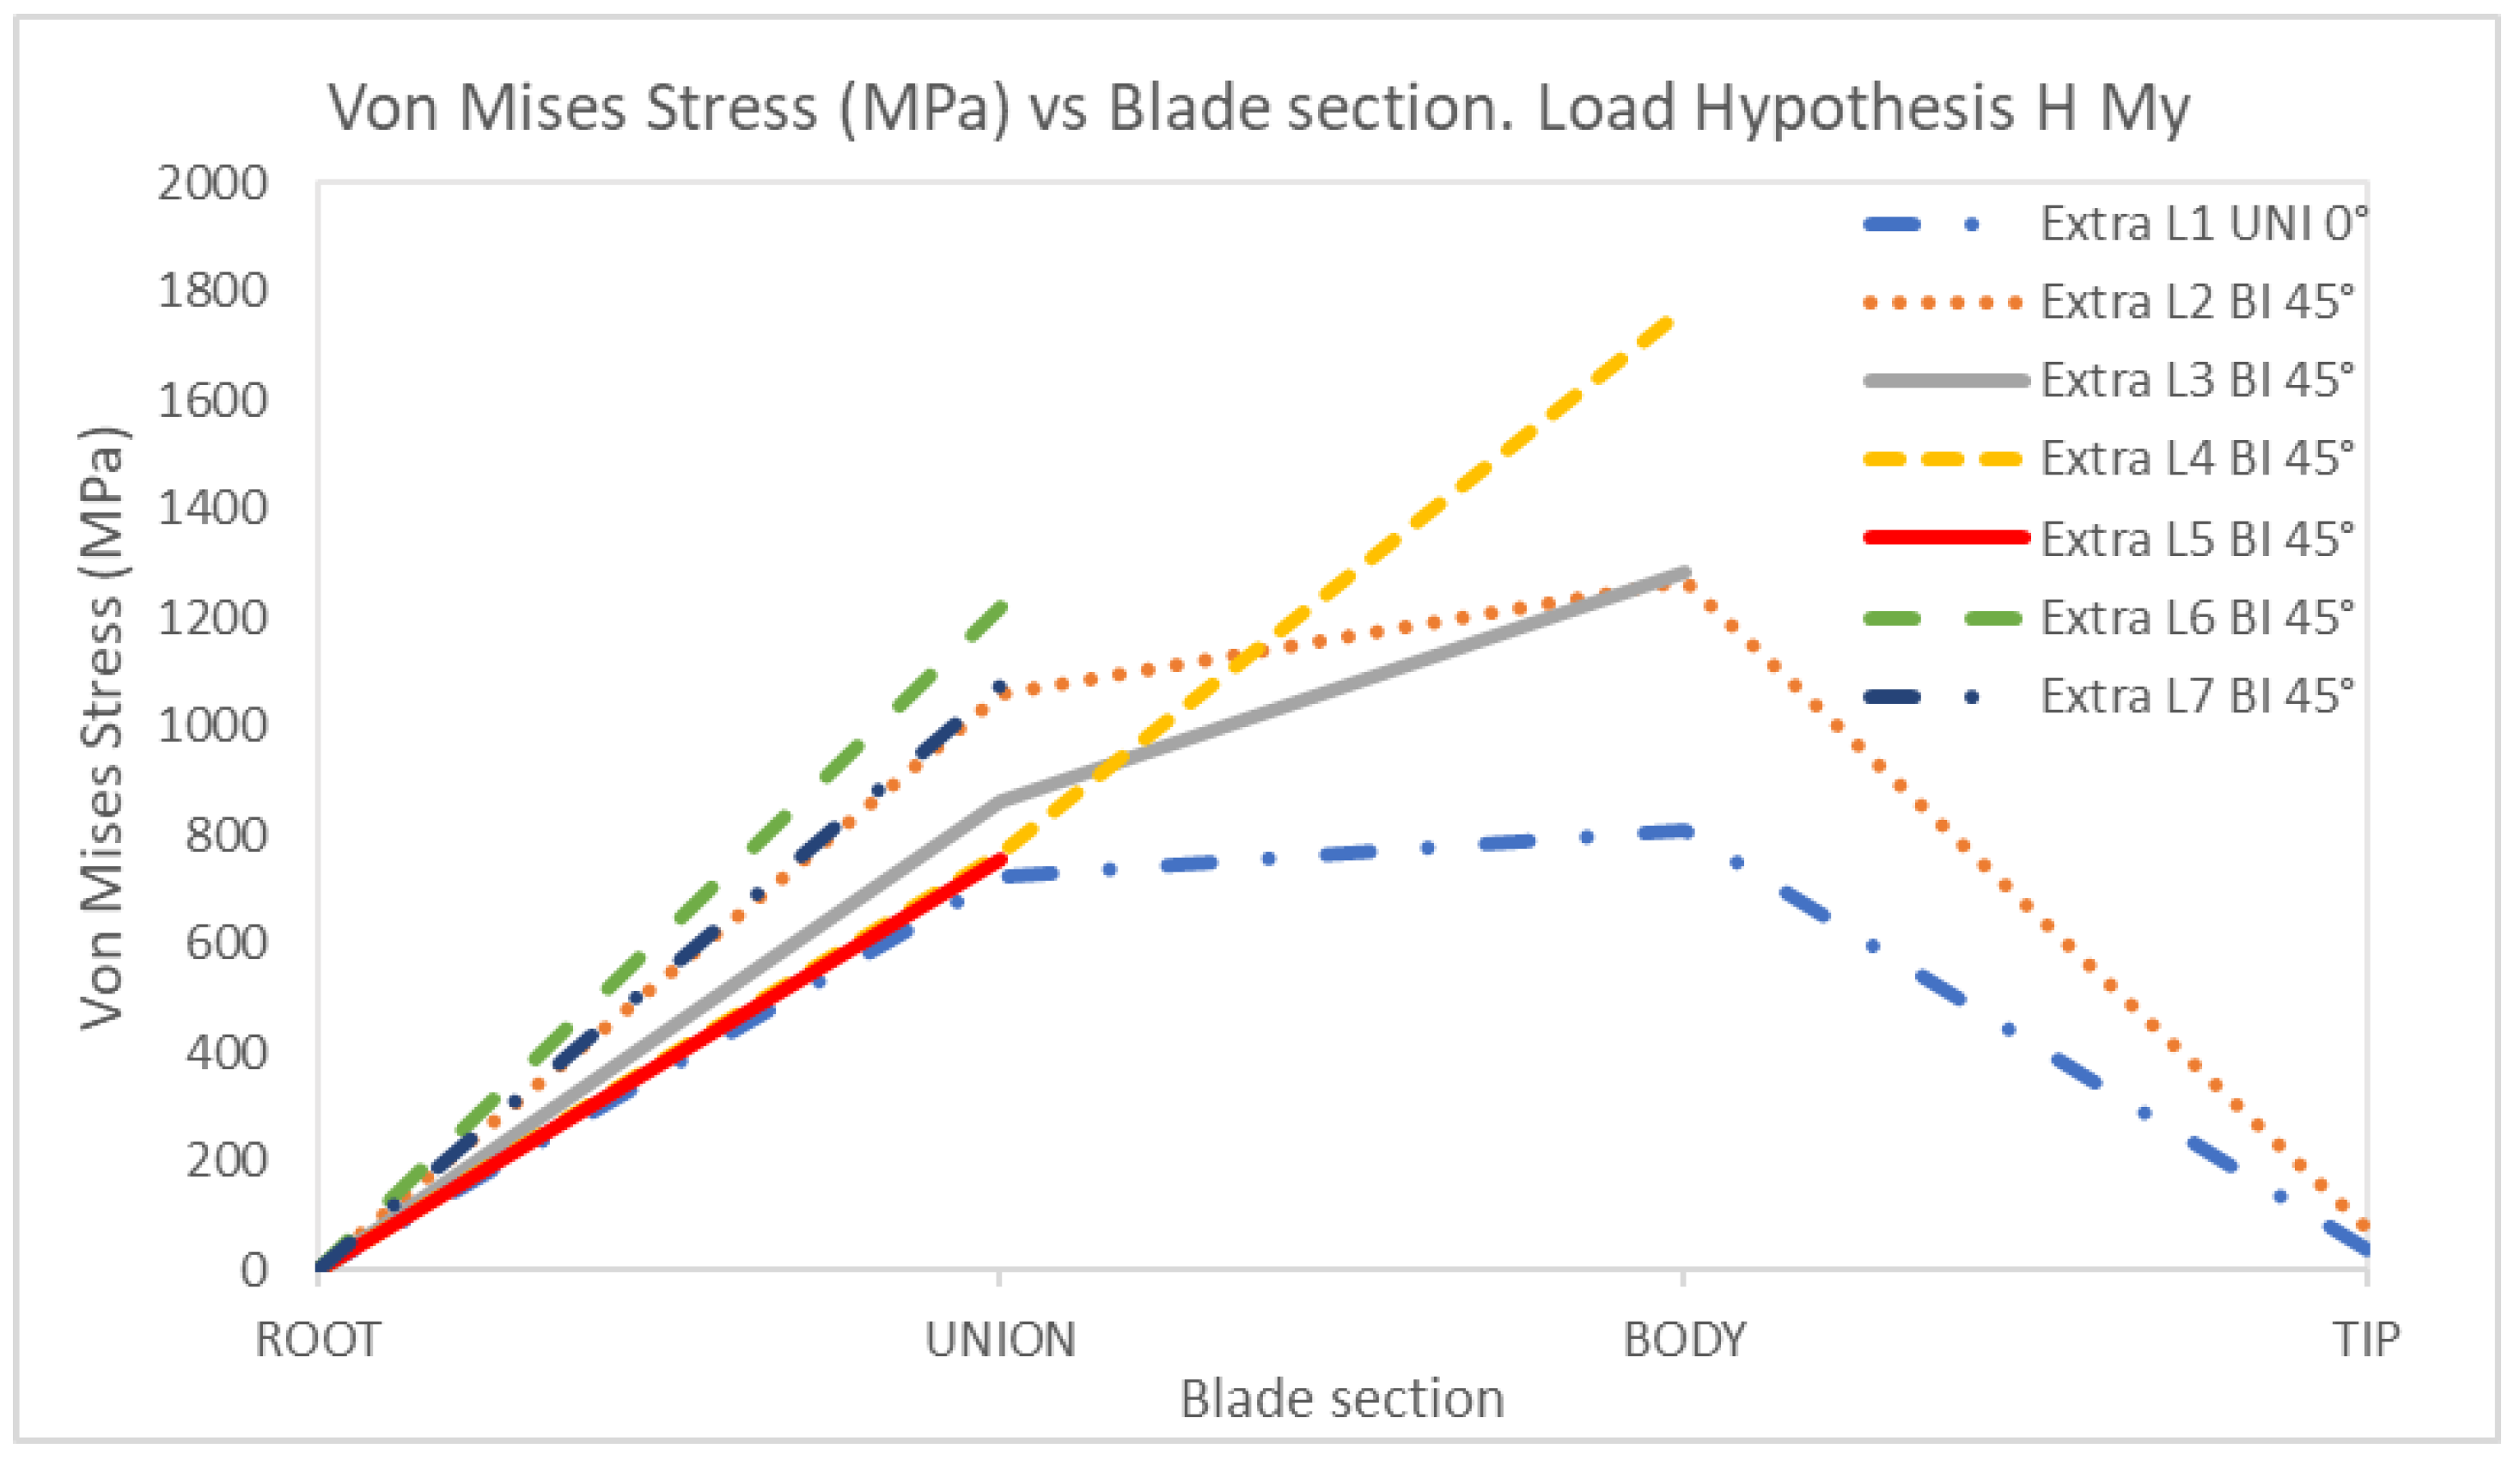
| MHy | Moment in y | 158.64 | 140.32 |
| Element Sets | Stack-Up (Layer Configuration) | Fabric Type (Fiberglass) |
|---|---|---|
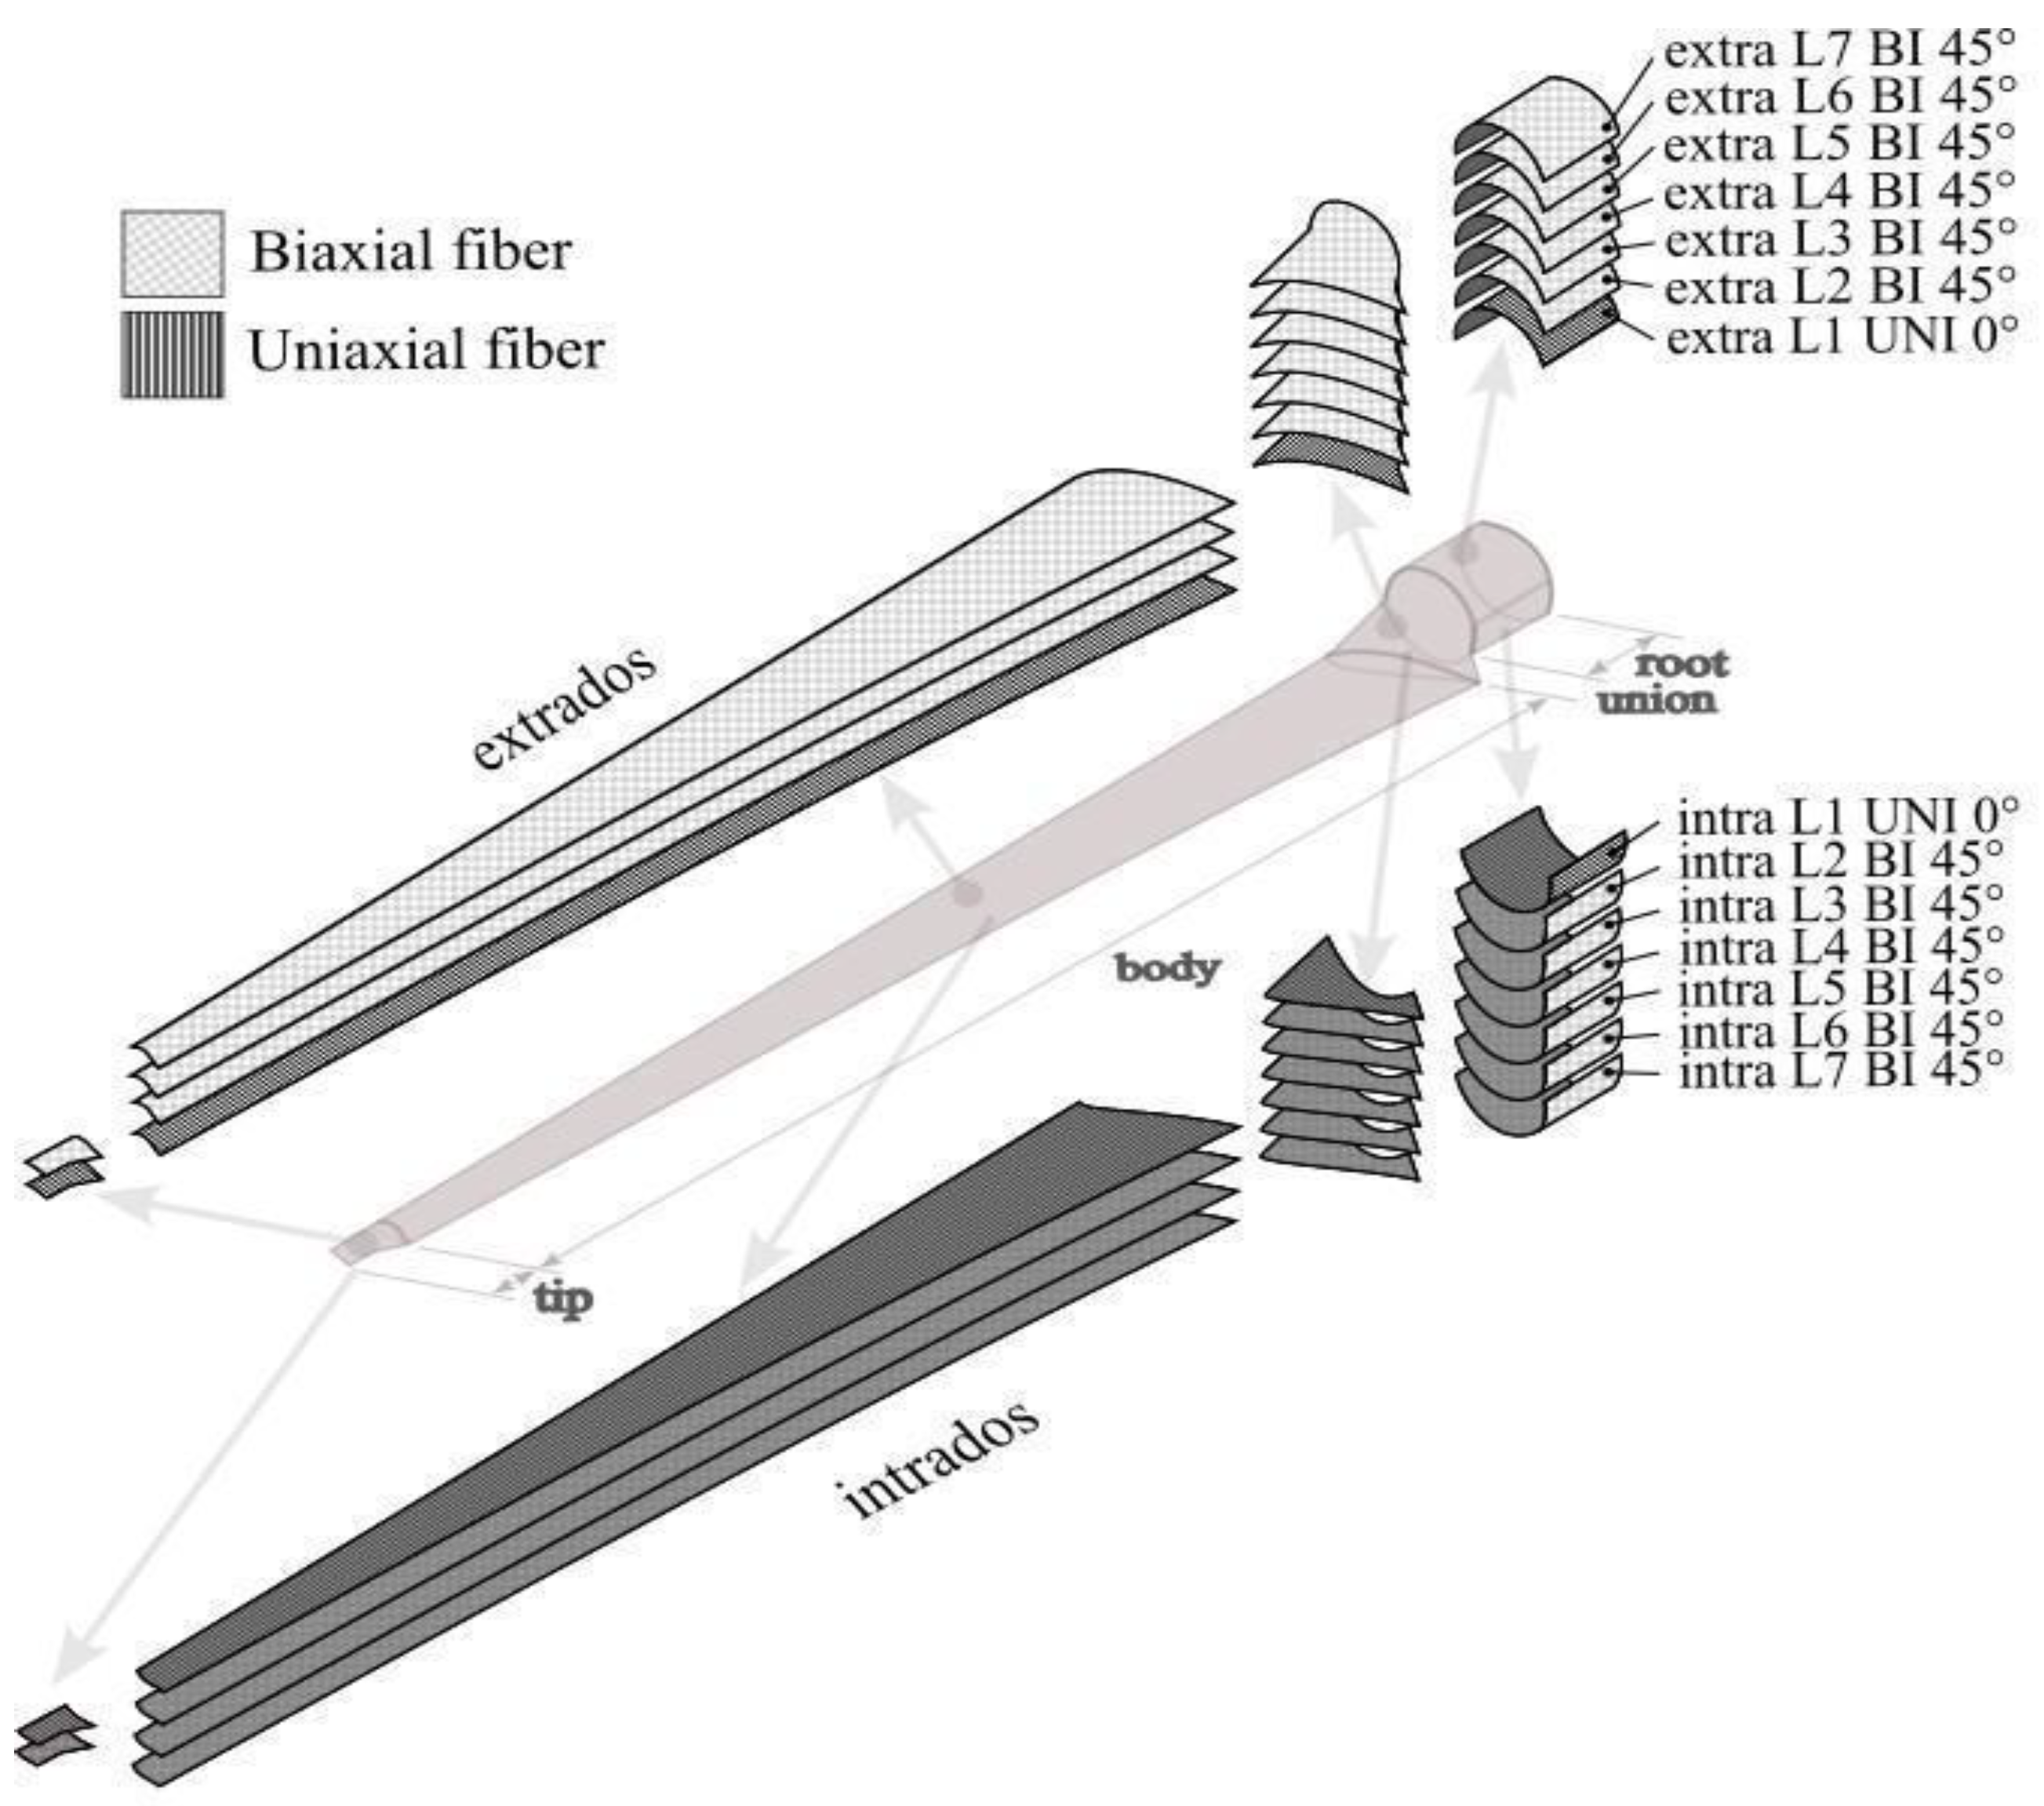
| Root | Seven layers | One Uniaxial/six Biaxial |
| Joint | Seven layers | One Uniaxial/six Biaxial |
| Body | Four layers | One Uniaxial/three Biaxial |
| Tip | Two layers | One Uniaxial/one Biaxial |
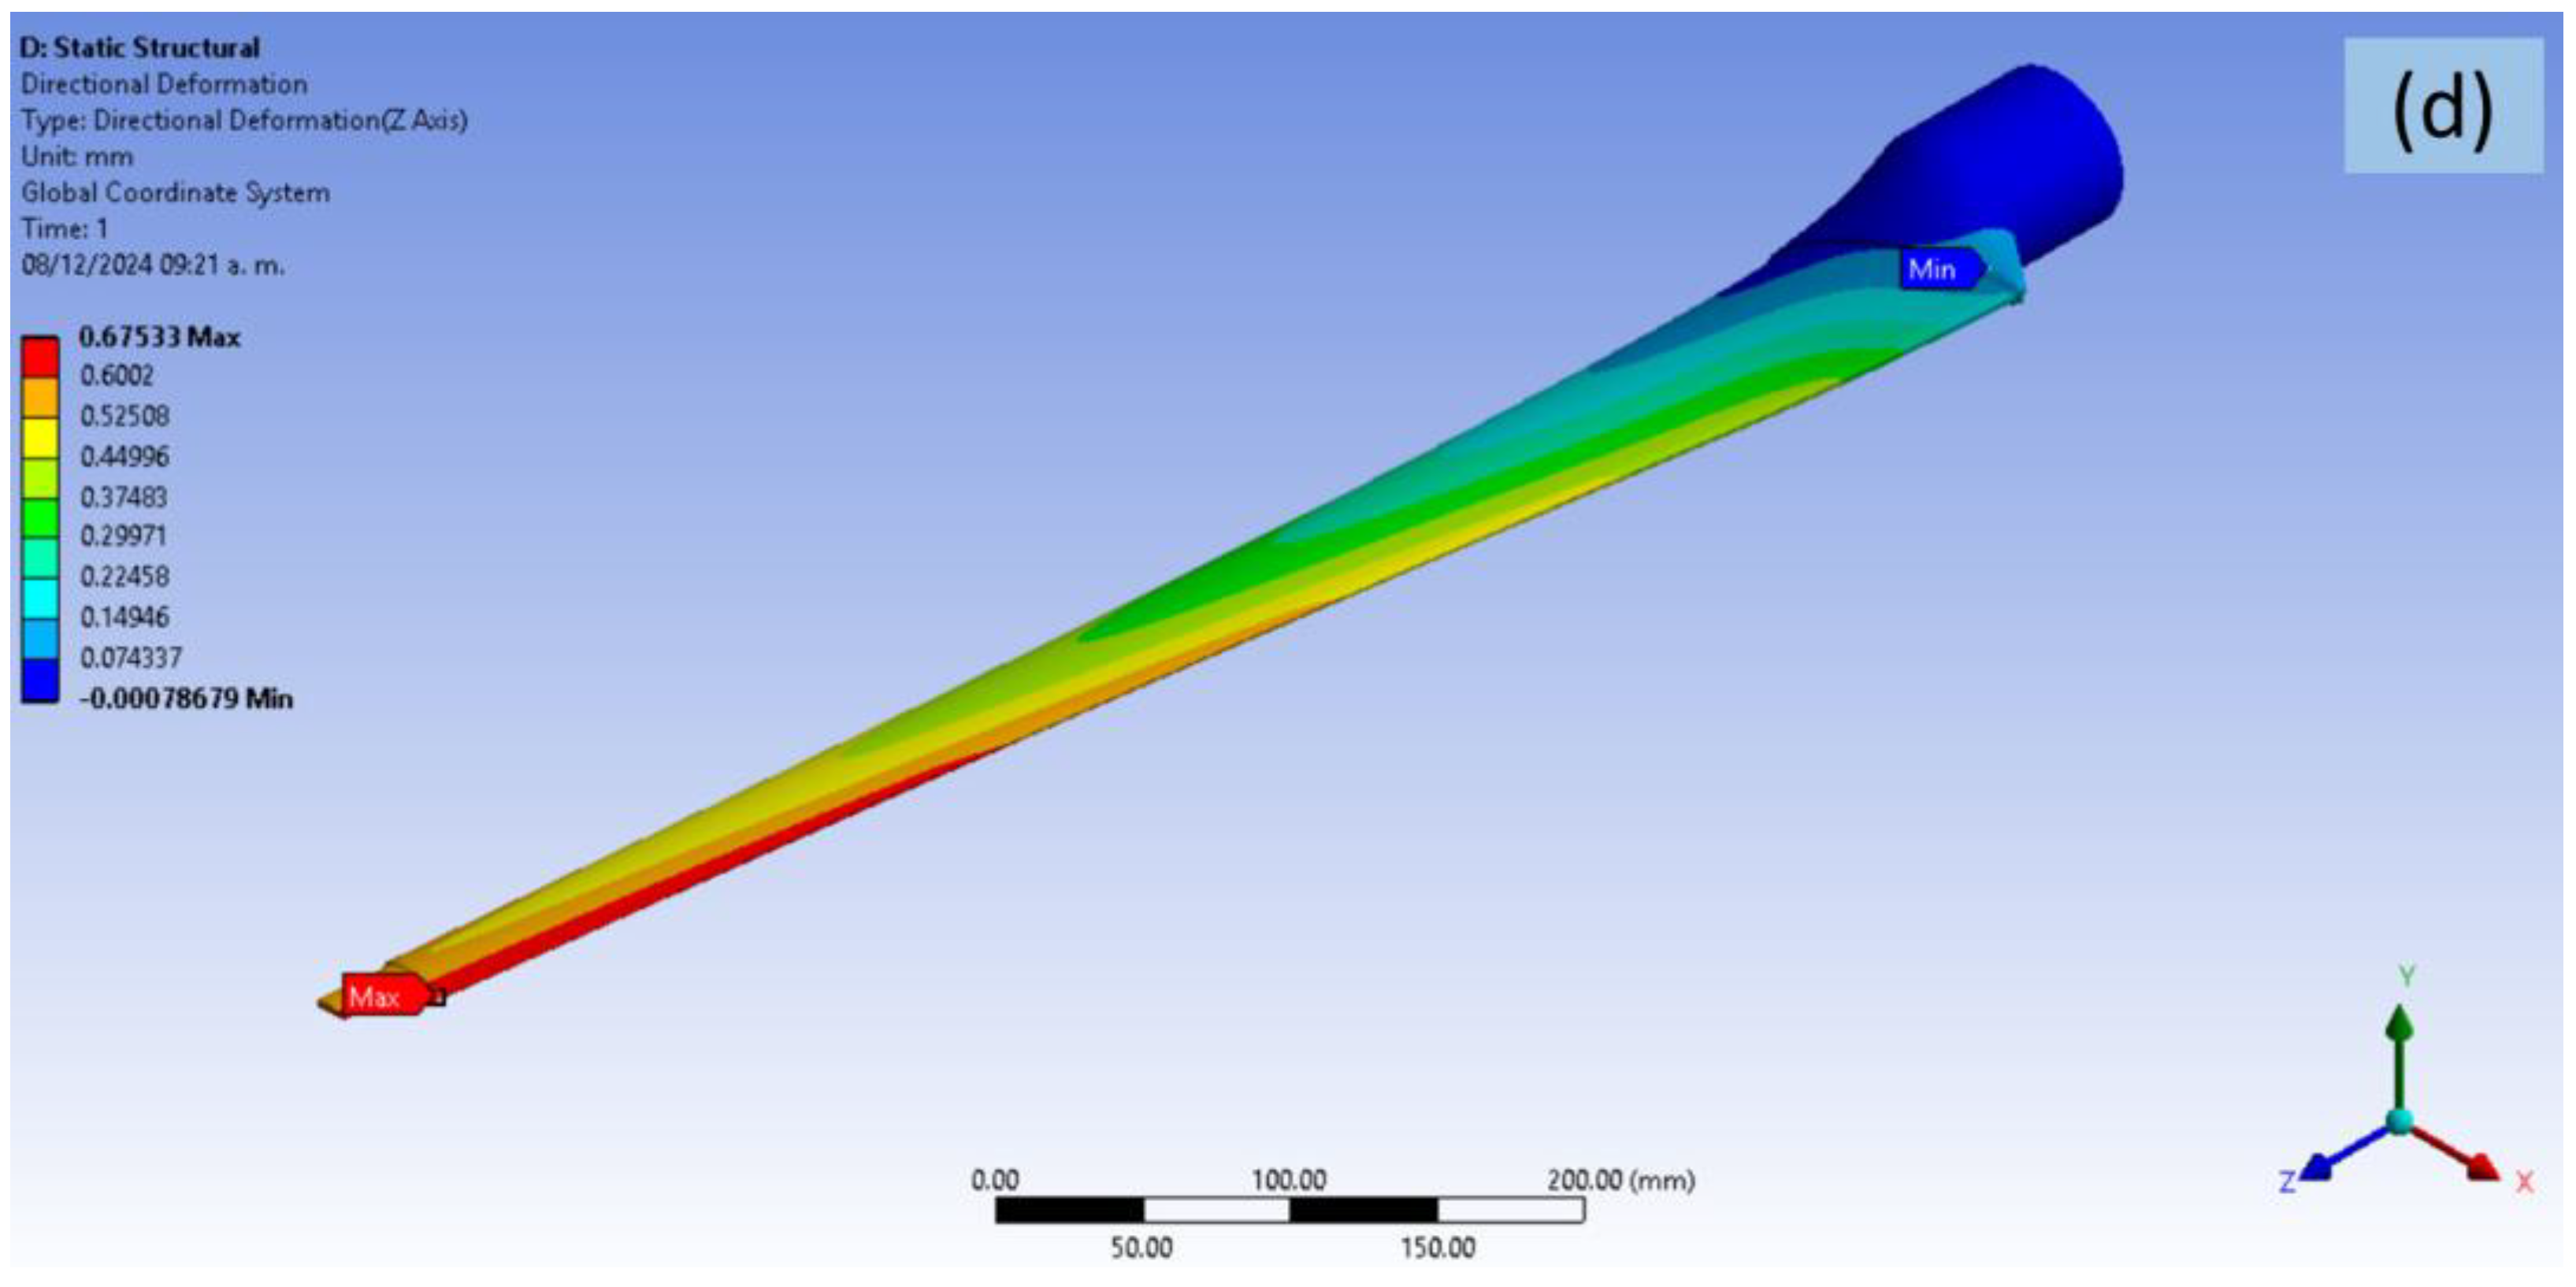
| Load Hypothesis 1 | Directional Deformation (m) | ||||
|---|---|---|---|---|---|
| Total | |||||
| 1 | AFz | 0.02042 | 0.00010 | 0.00068 | 0.02078 |
| 2 | AMx | 0.01799 | 0.00001 | 0.00022 | 0.01814 |
| 3 | AMy | 0.00008 | 0.00786 | 0.00027 | 0.01329 |
| 4 | BMy | 0.00016 | 0.01522 | 0.00052 | 0.00027 |
| 5 | CMy | 0.00150 | 0.08585 | 0.00178 | 0.15634 |
| 6 | EFz | 0.01673 | 0.00008 | 0.00055 | 0.01703 |
| 7 | HMy | 0.00187 | 0.10658 | 0.00221 | 0.19410 |
 | Von Mises Stress (MPa) | |||||||||
|---|---|---|---|---|---|---|---|---|---|---|
| Layer | Intrados | Extrados | ||||||||
| Hypothesis | No | Type | Root | Union | Body | Tip | Root | Union | Body | Tip |
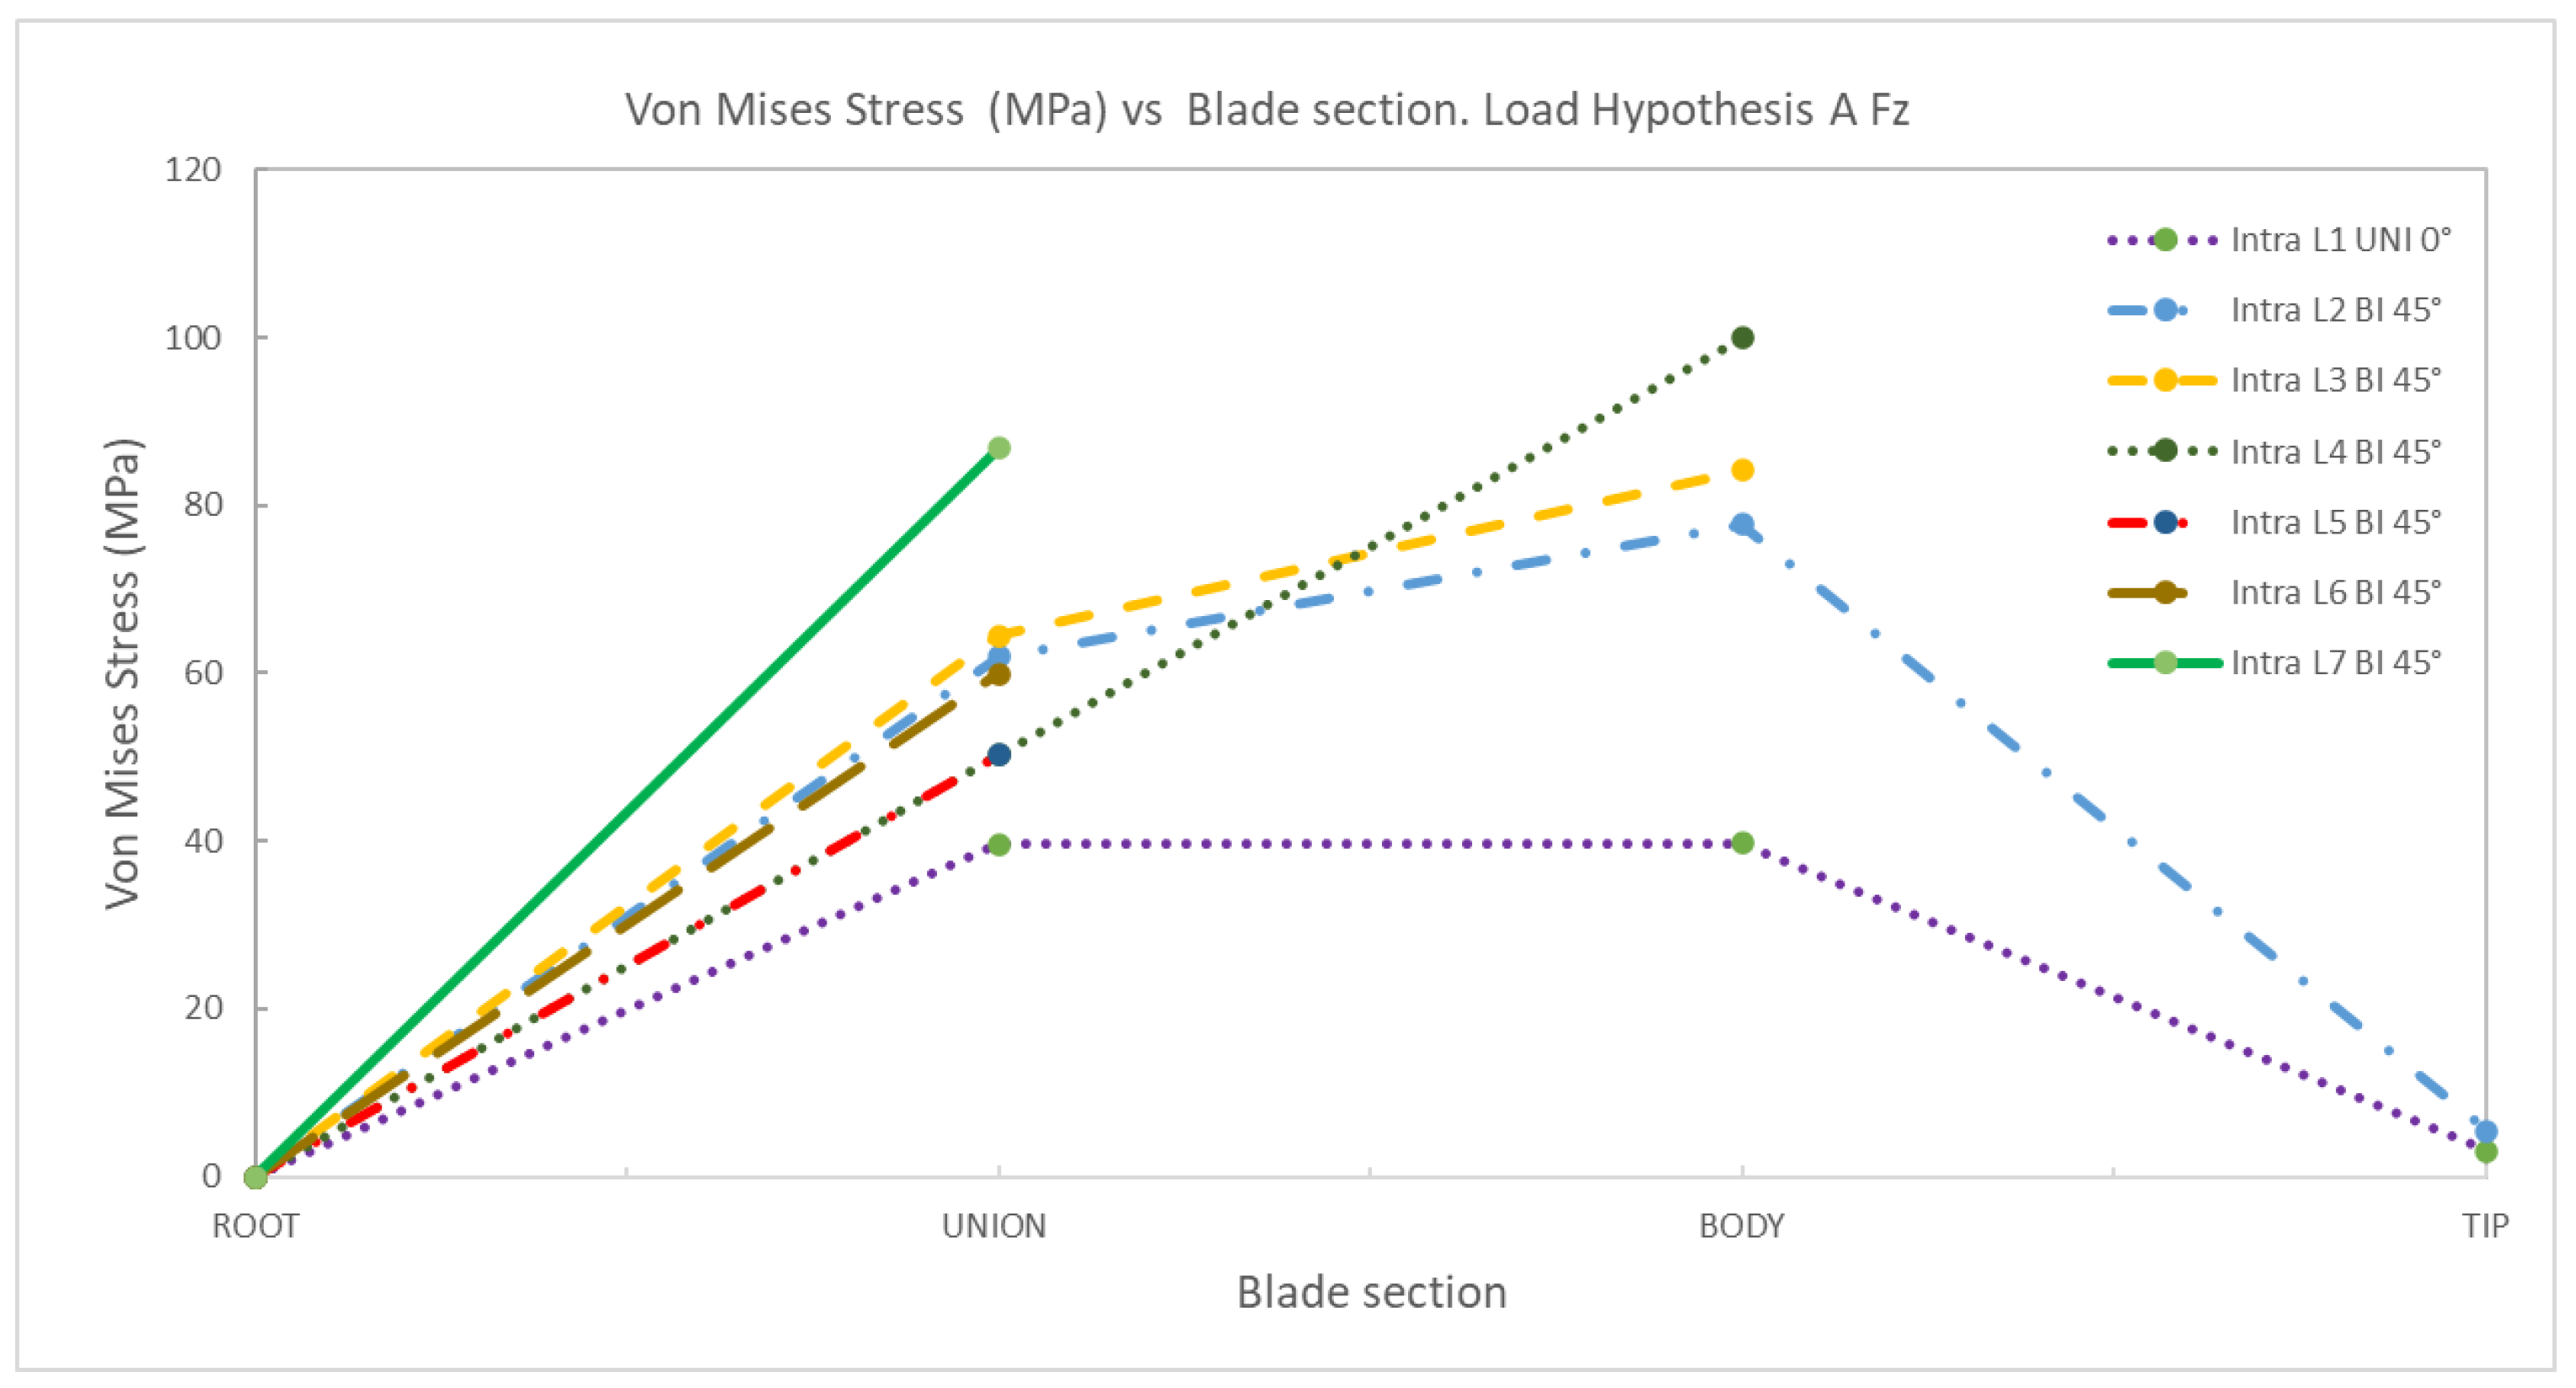
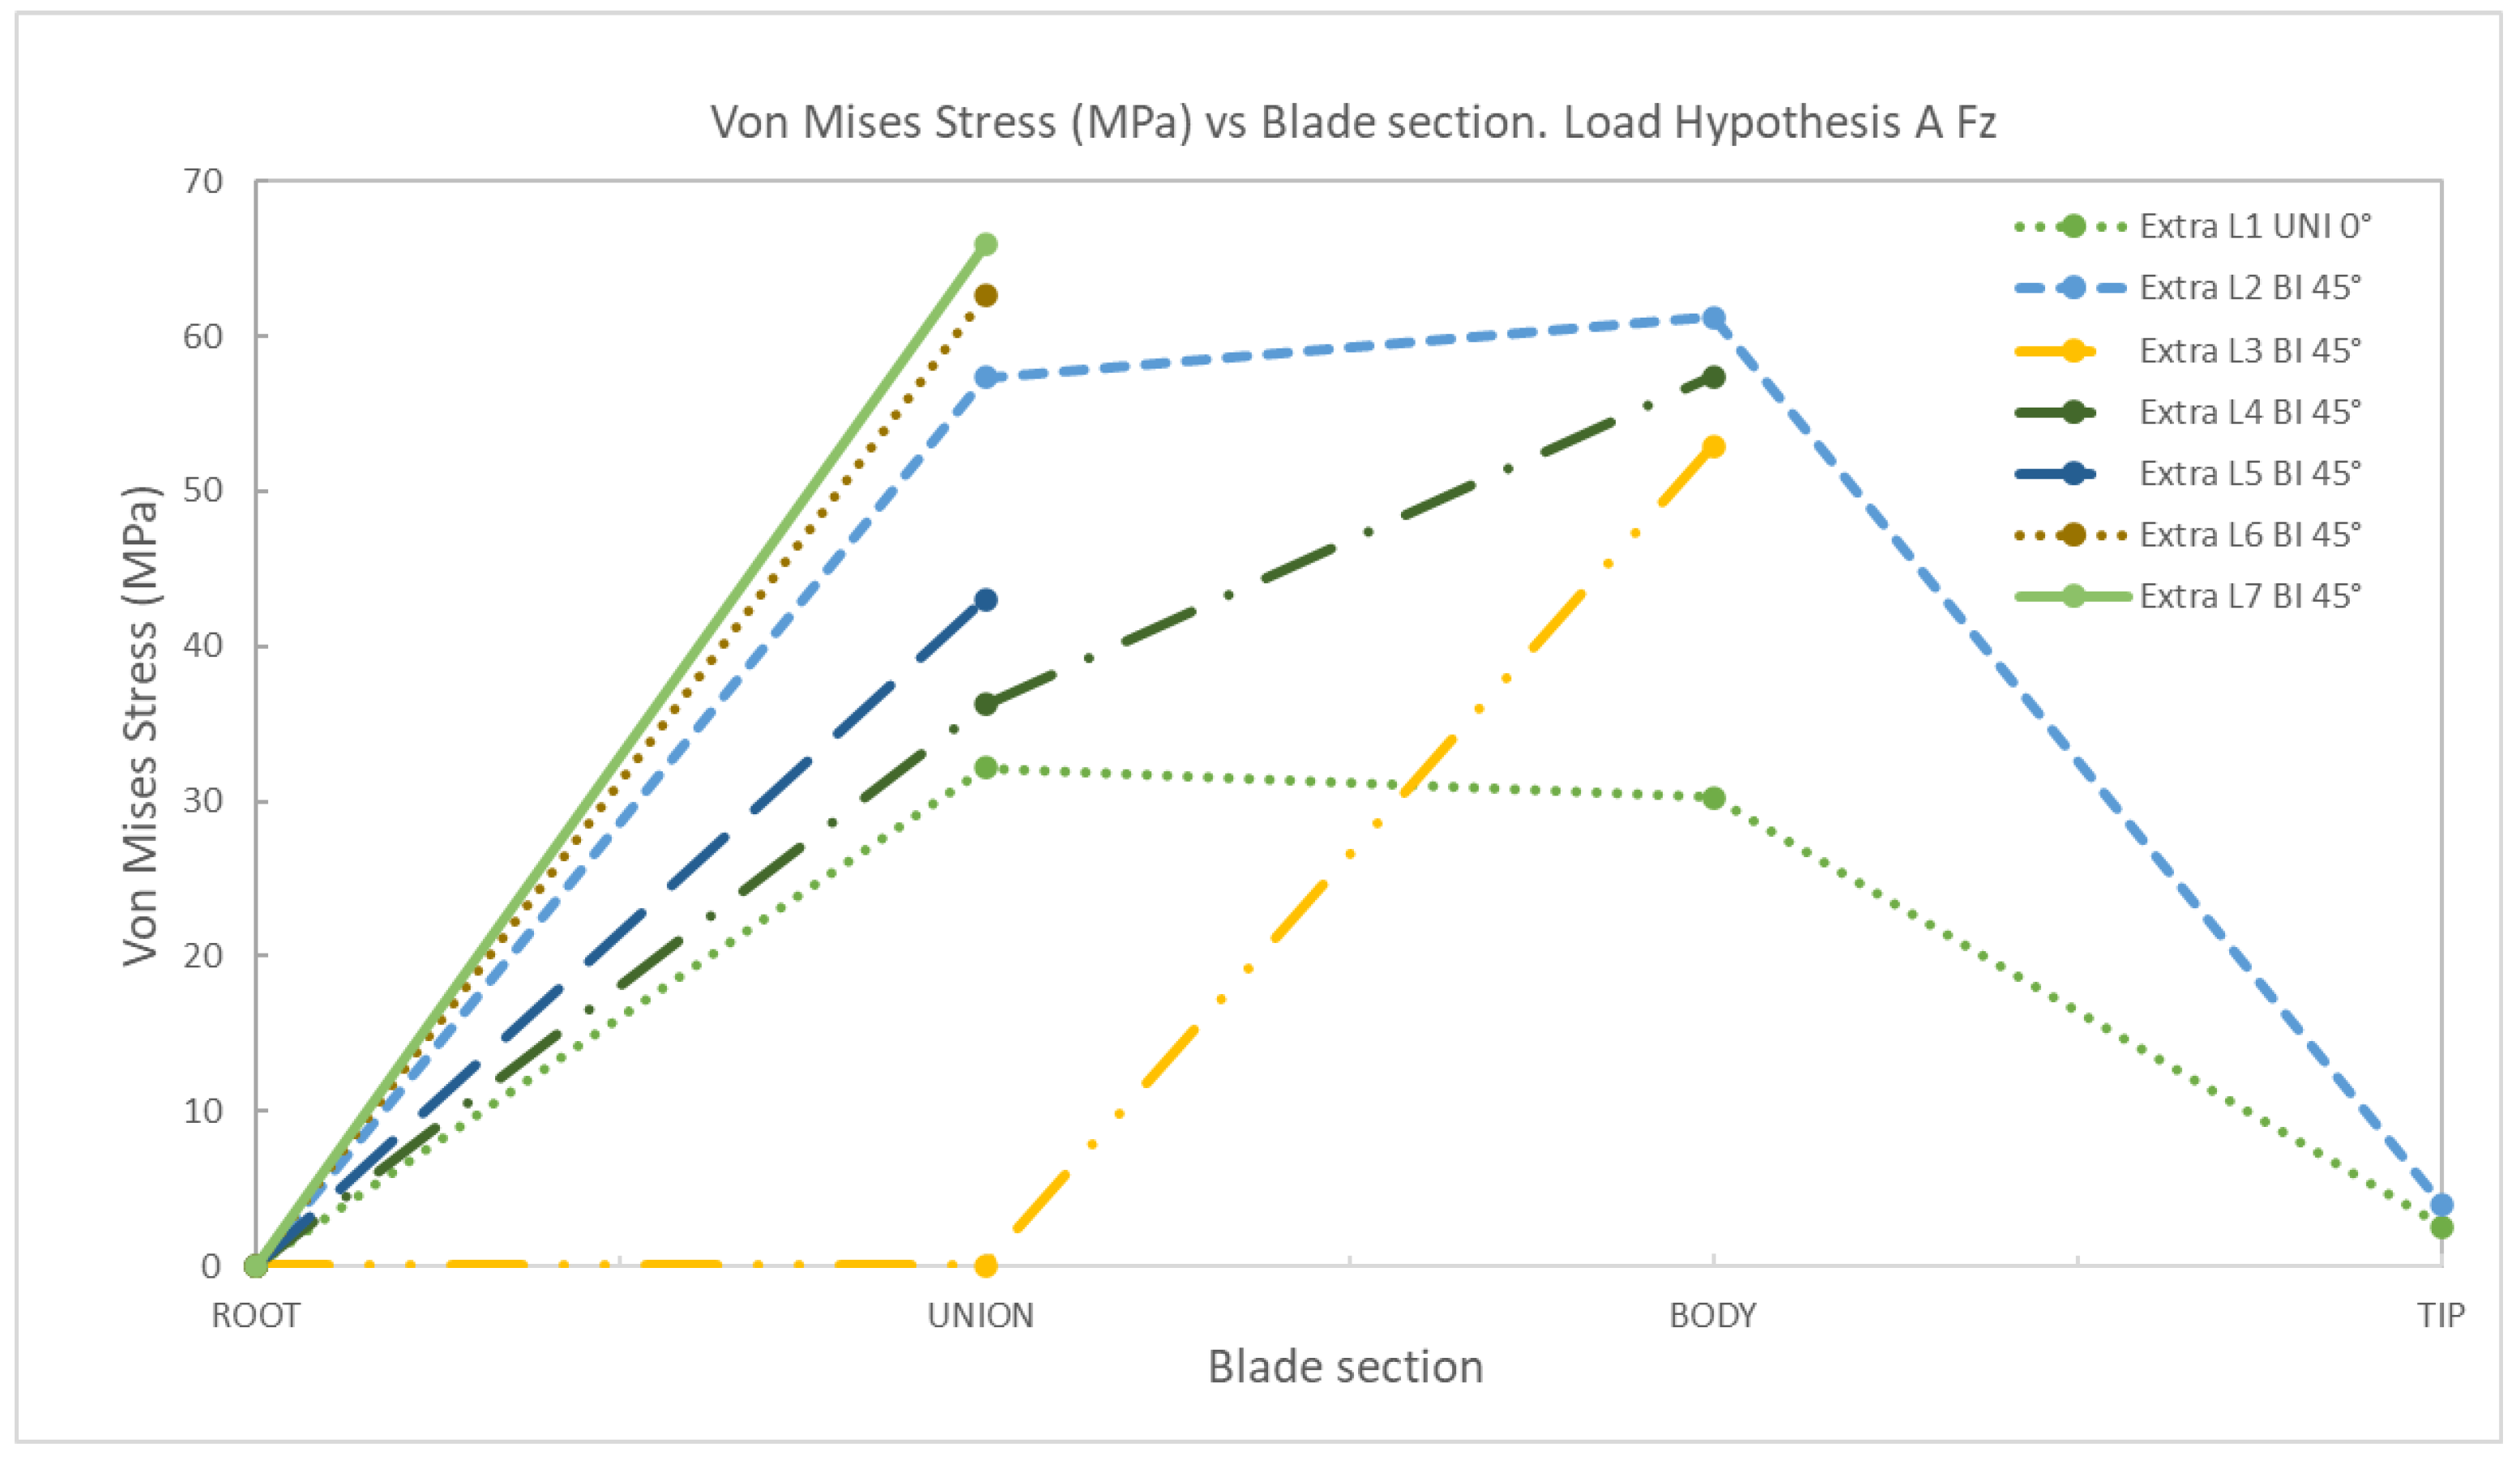
AFz | 1 | Uniaxial | 0 | 39.67 | 39.72 | 3.03 | 0 | 32.15 | 30.22 | 2.52 |
| 2 | Biaxial | 0 | 61.98 | 77.72 | 5.50 | 0 | 57.35 | 61.27 | 3.92 | |
| 3 | Biaxial | 0 | 64.49 | 84.15 | 0 | 48.98 | 52.94 | |||
| 4 | Biaxial | 0 | 50.23 | 99.88 | 0 | 36.25 | 57.41 | |||
| 5 | Biaxial | 0 | 50.21 | 0 | 43.01 | |||||
| 6 | Biaxial | 0 | 59.99 | 0 | 62.62 | |||||
| 7 | Biaxial | 0 | 86.86 | 0 | 65.91 | |||||
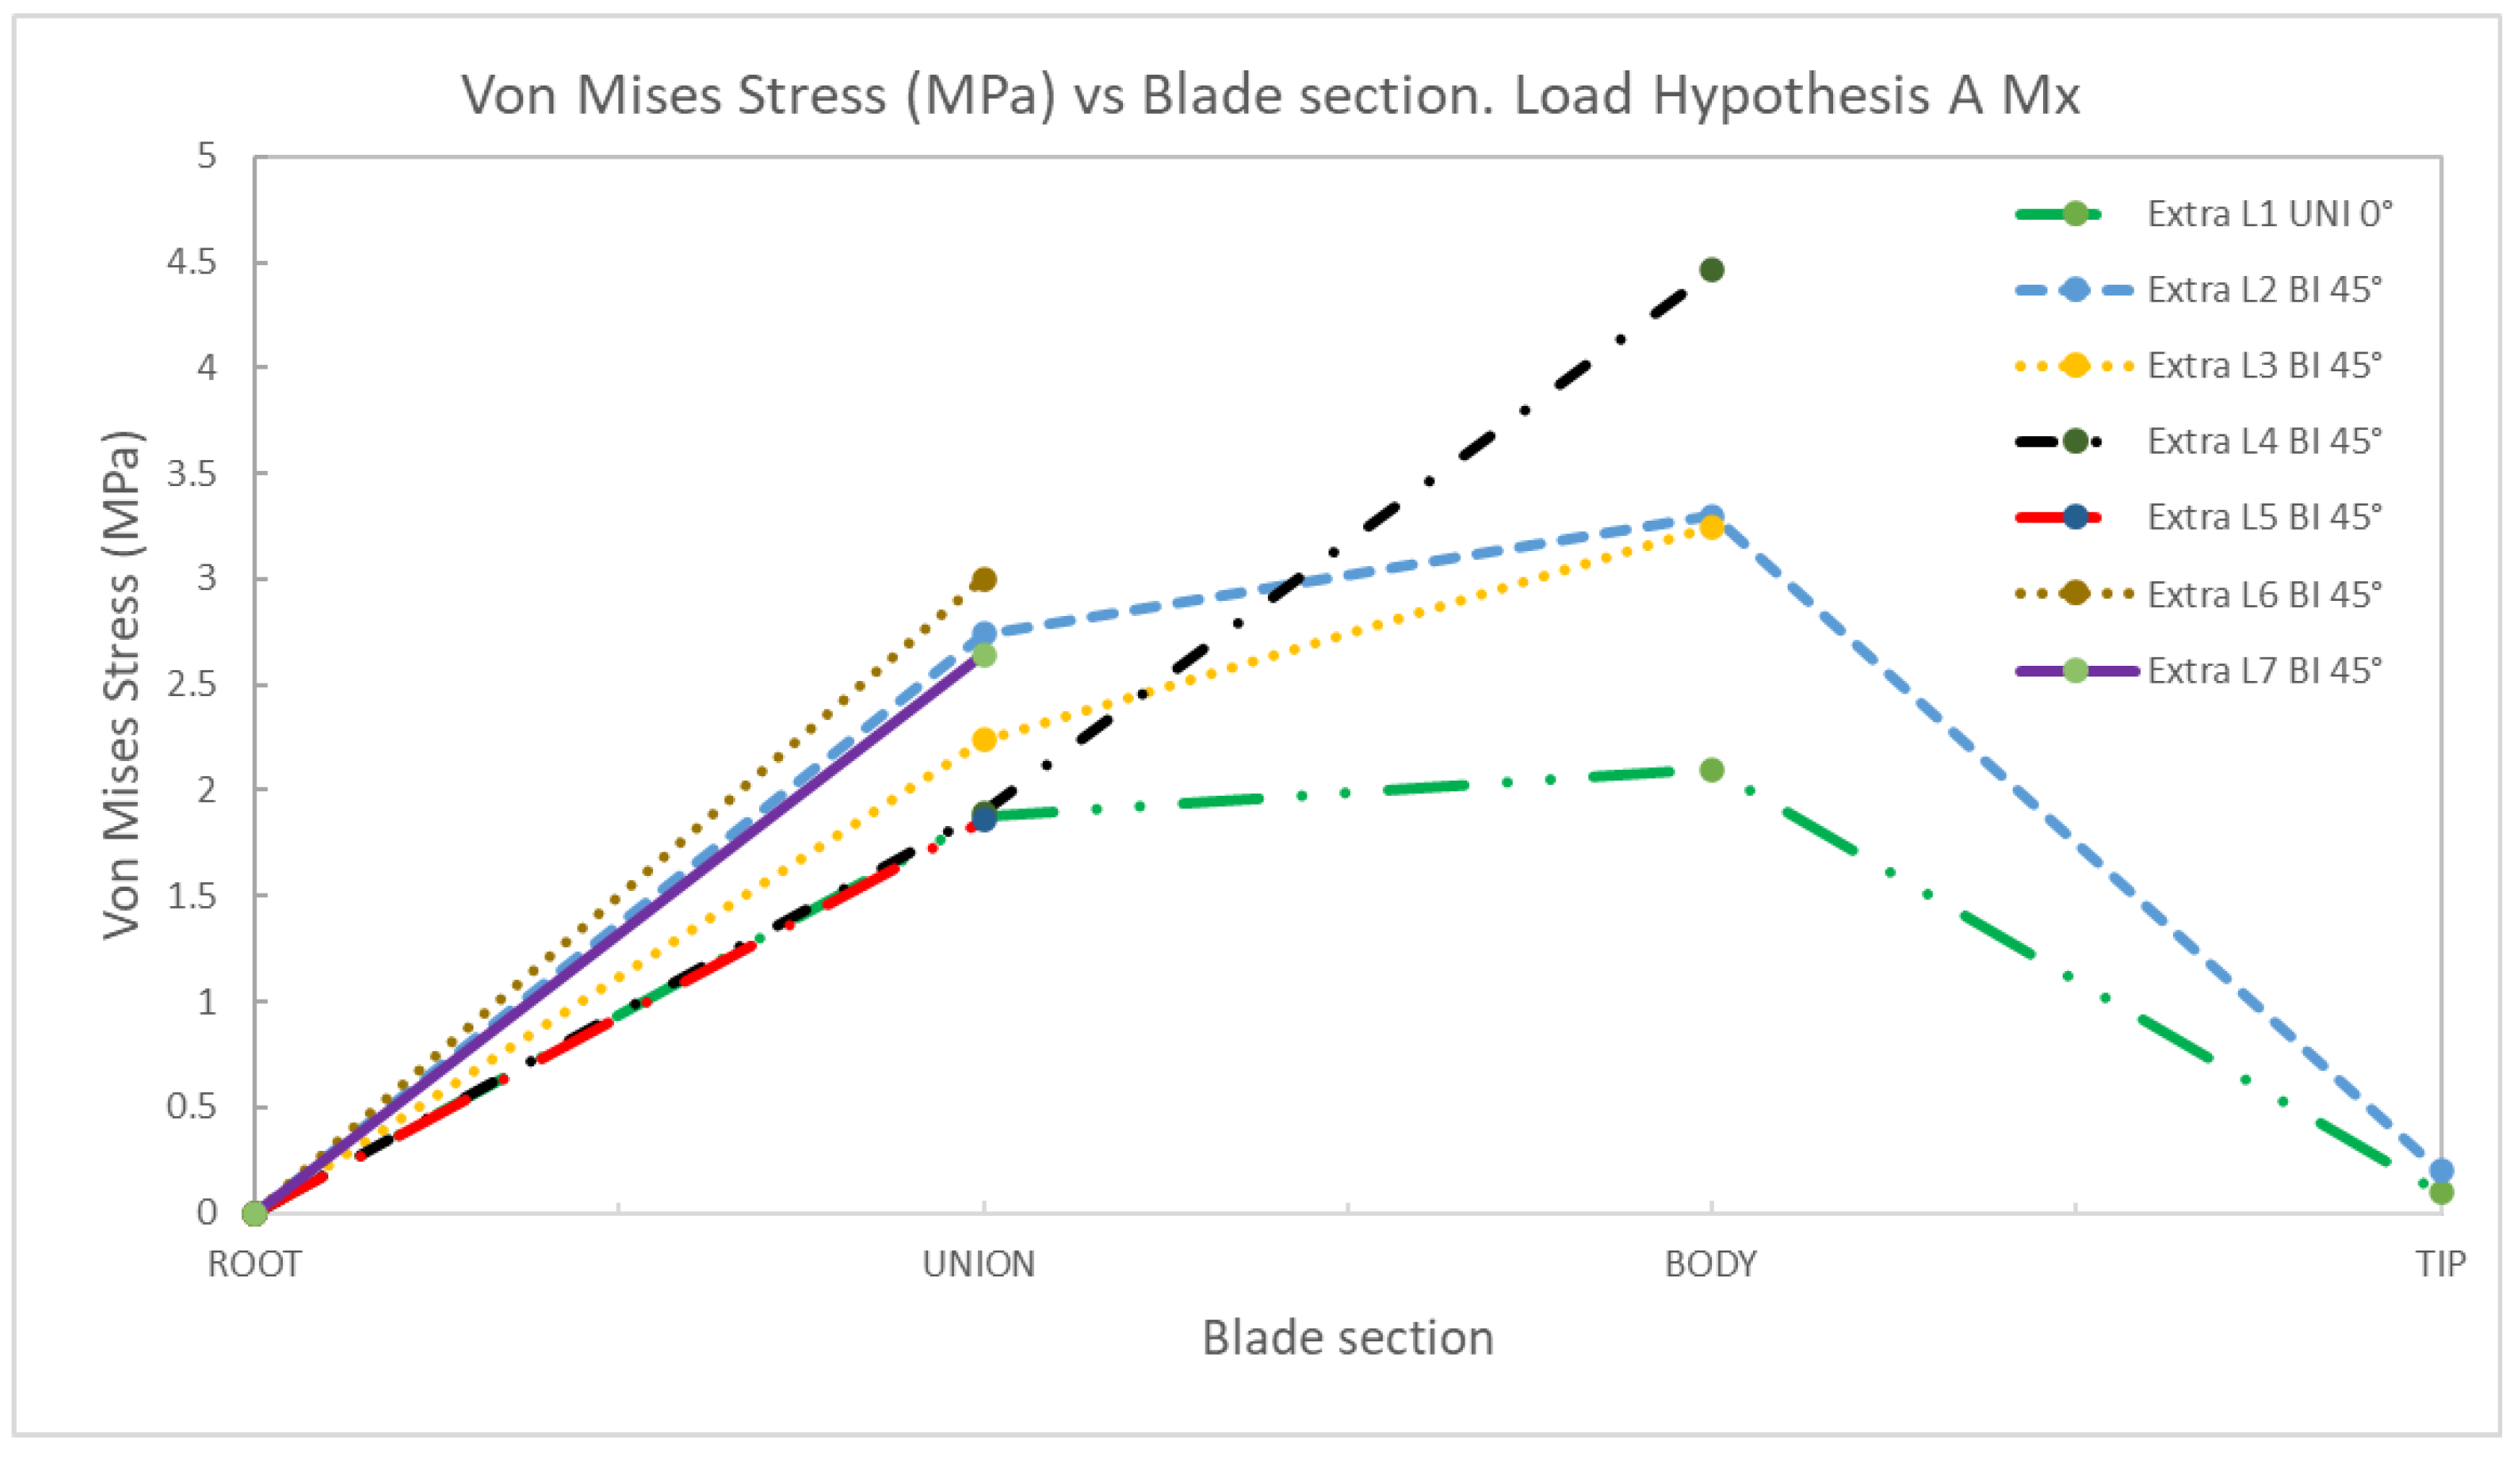
AMx | 1 | Uniaxial | 0 | 2.84 | 3.39 | 0.10 | 0 | 1.88 | 2.10 | 0.10 |
| 2 | Biaxial | 0 | 3.99 | 4.83 | 0.19 | 0 | 2.74 | 3.30 | 0.20 | |
| 3 | Biaxial | 0 | 3.62 | 3.71 | 0 | 2.24 | 3.25 | |||
| 4 | Biaxial | 0 | 2.10 | 5.58 | 0 | 1.90 | 4.46 | |||
| 5 | Biaxial | 0 | 2.69 | 0 | 1.86 | |||||
| 6 | Biaxial | 0 | 2.93 | 0 | 3.00 | |||||
| 7 | Biaxial | 0 | 4.32 | 0 | 2.64 | |||||
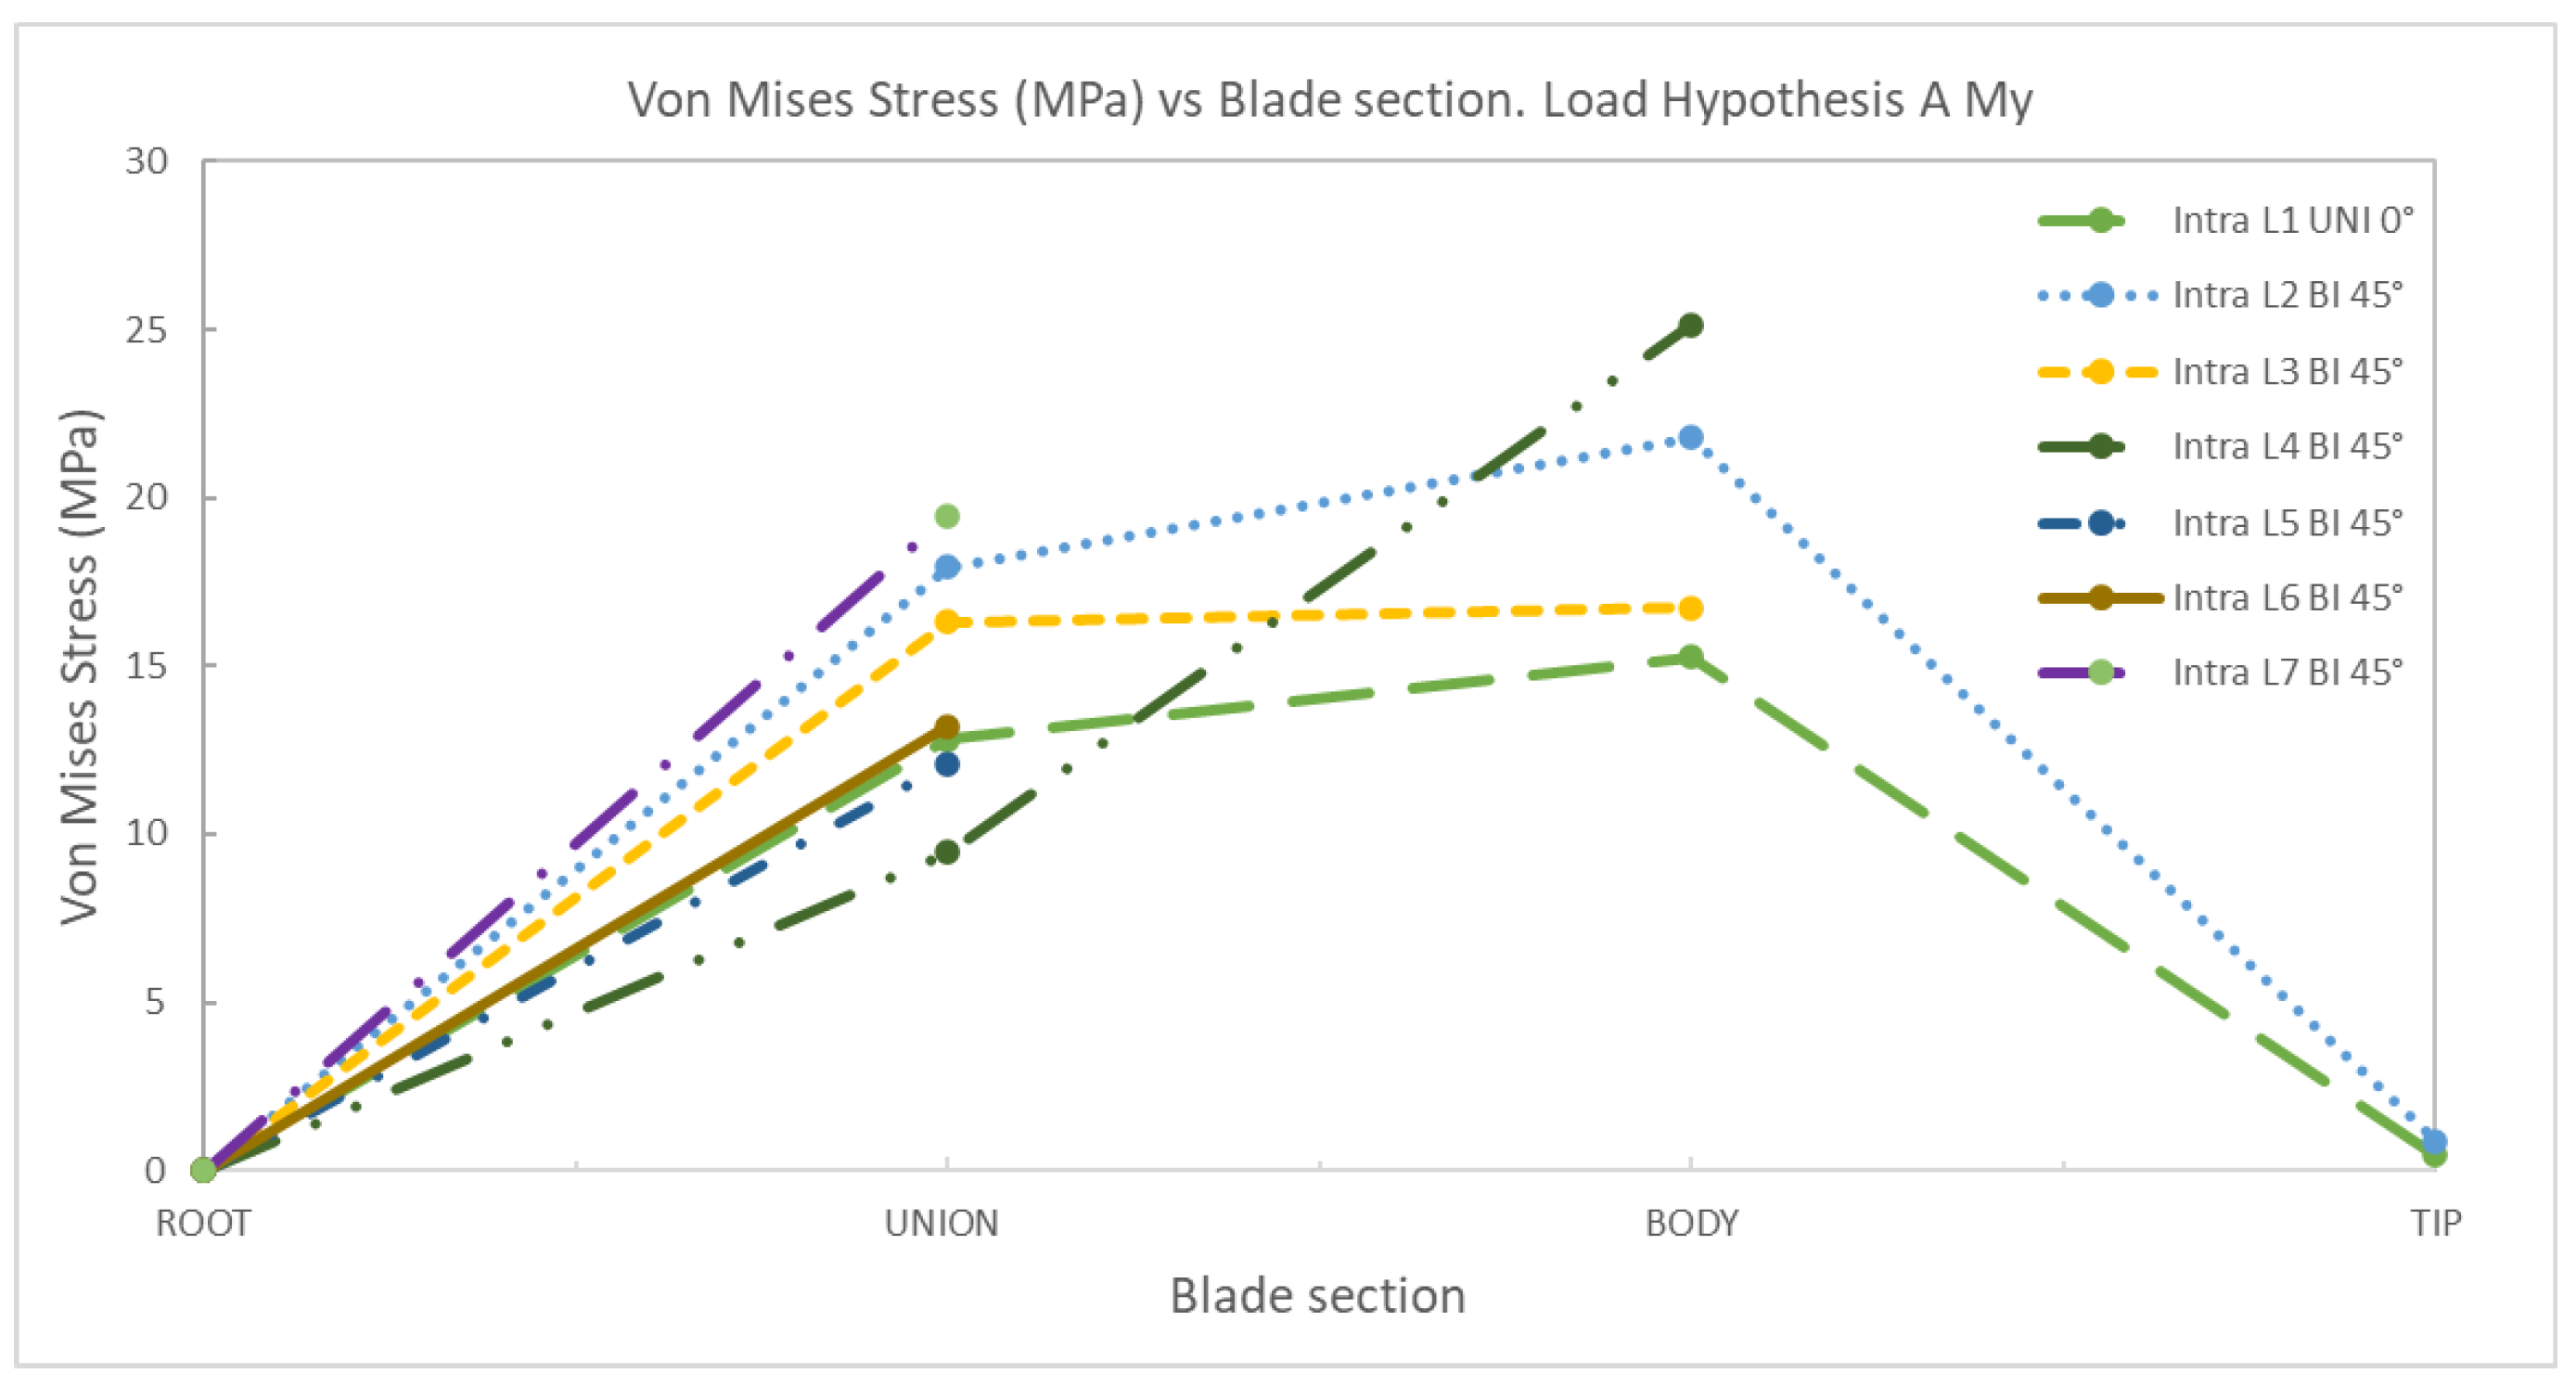
AMy | 1 | Uniaxial | 0 | 12.81 | 0.15 | 0.46 | 0 | 8.47 | 9.45 | 0.43 |
| 2 | Biaxial | 0 | 17.95 | 21.78 | 0.86 | 0 | 12.34 | 14.86 | 0.88 | |
| 3 | Biaxial | 0 | 16.30 | 16.73 | 0 | 10.09 | 14.63 | |||
| 4 | Biaxial | 0 | 9.45 | 25.15 | 0 | 8.54 | 20.11 | |||
| 5 | Biaxial | 0 | 12.11 | 0 | 8.37 | |||||
| 6 | Biaxial | 0 | 13.20 | 0 | 13.52 | |||||
| 7 | Biaxial | 0 | 19.47 | 0 | 11.90 | |||||
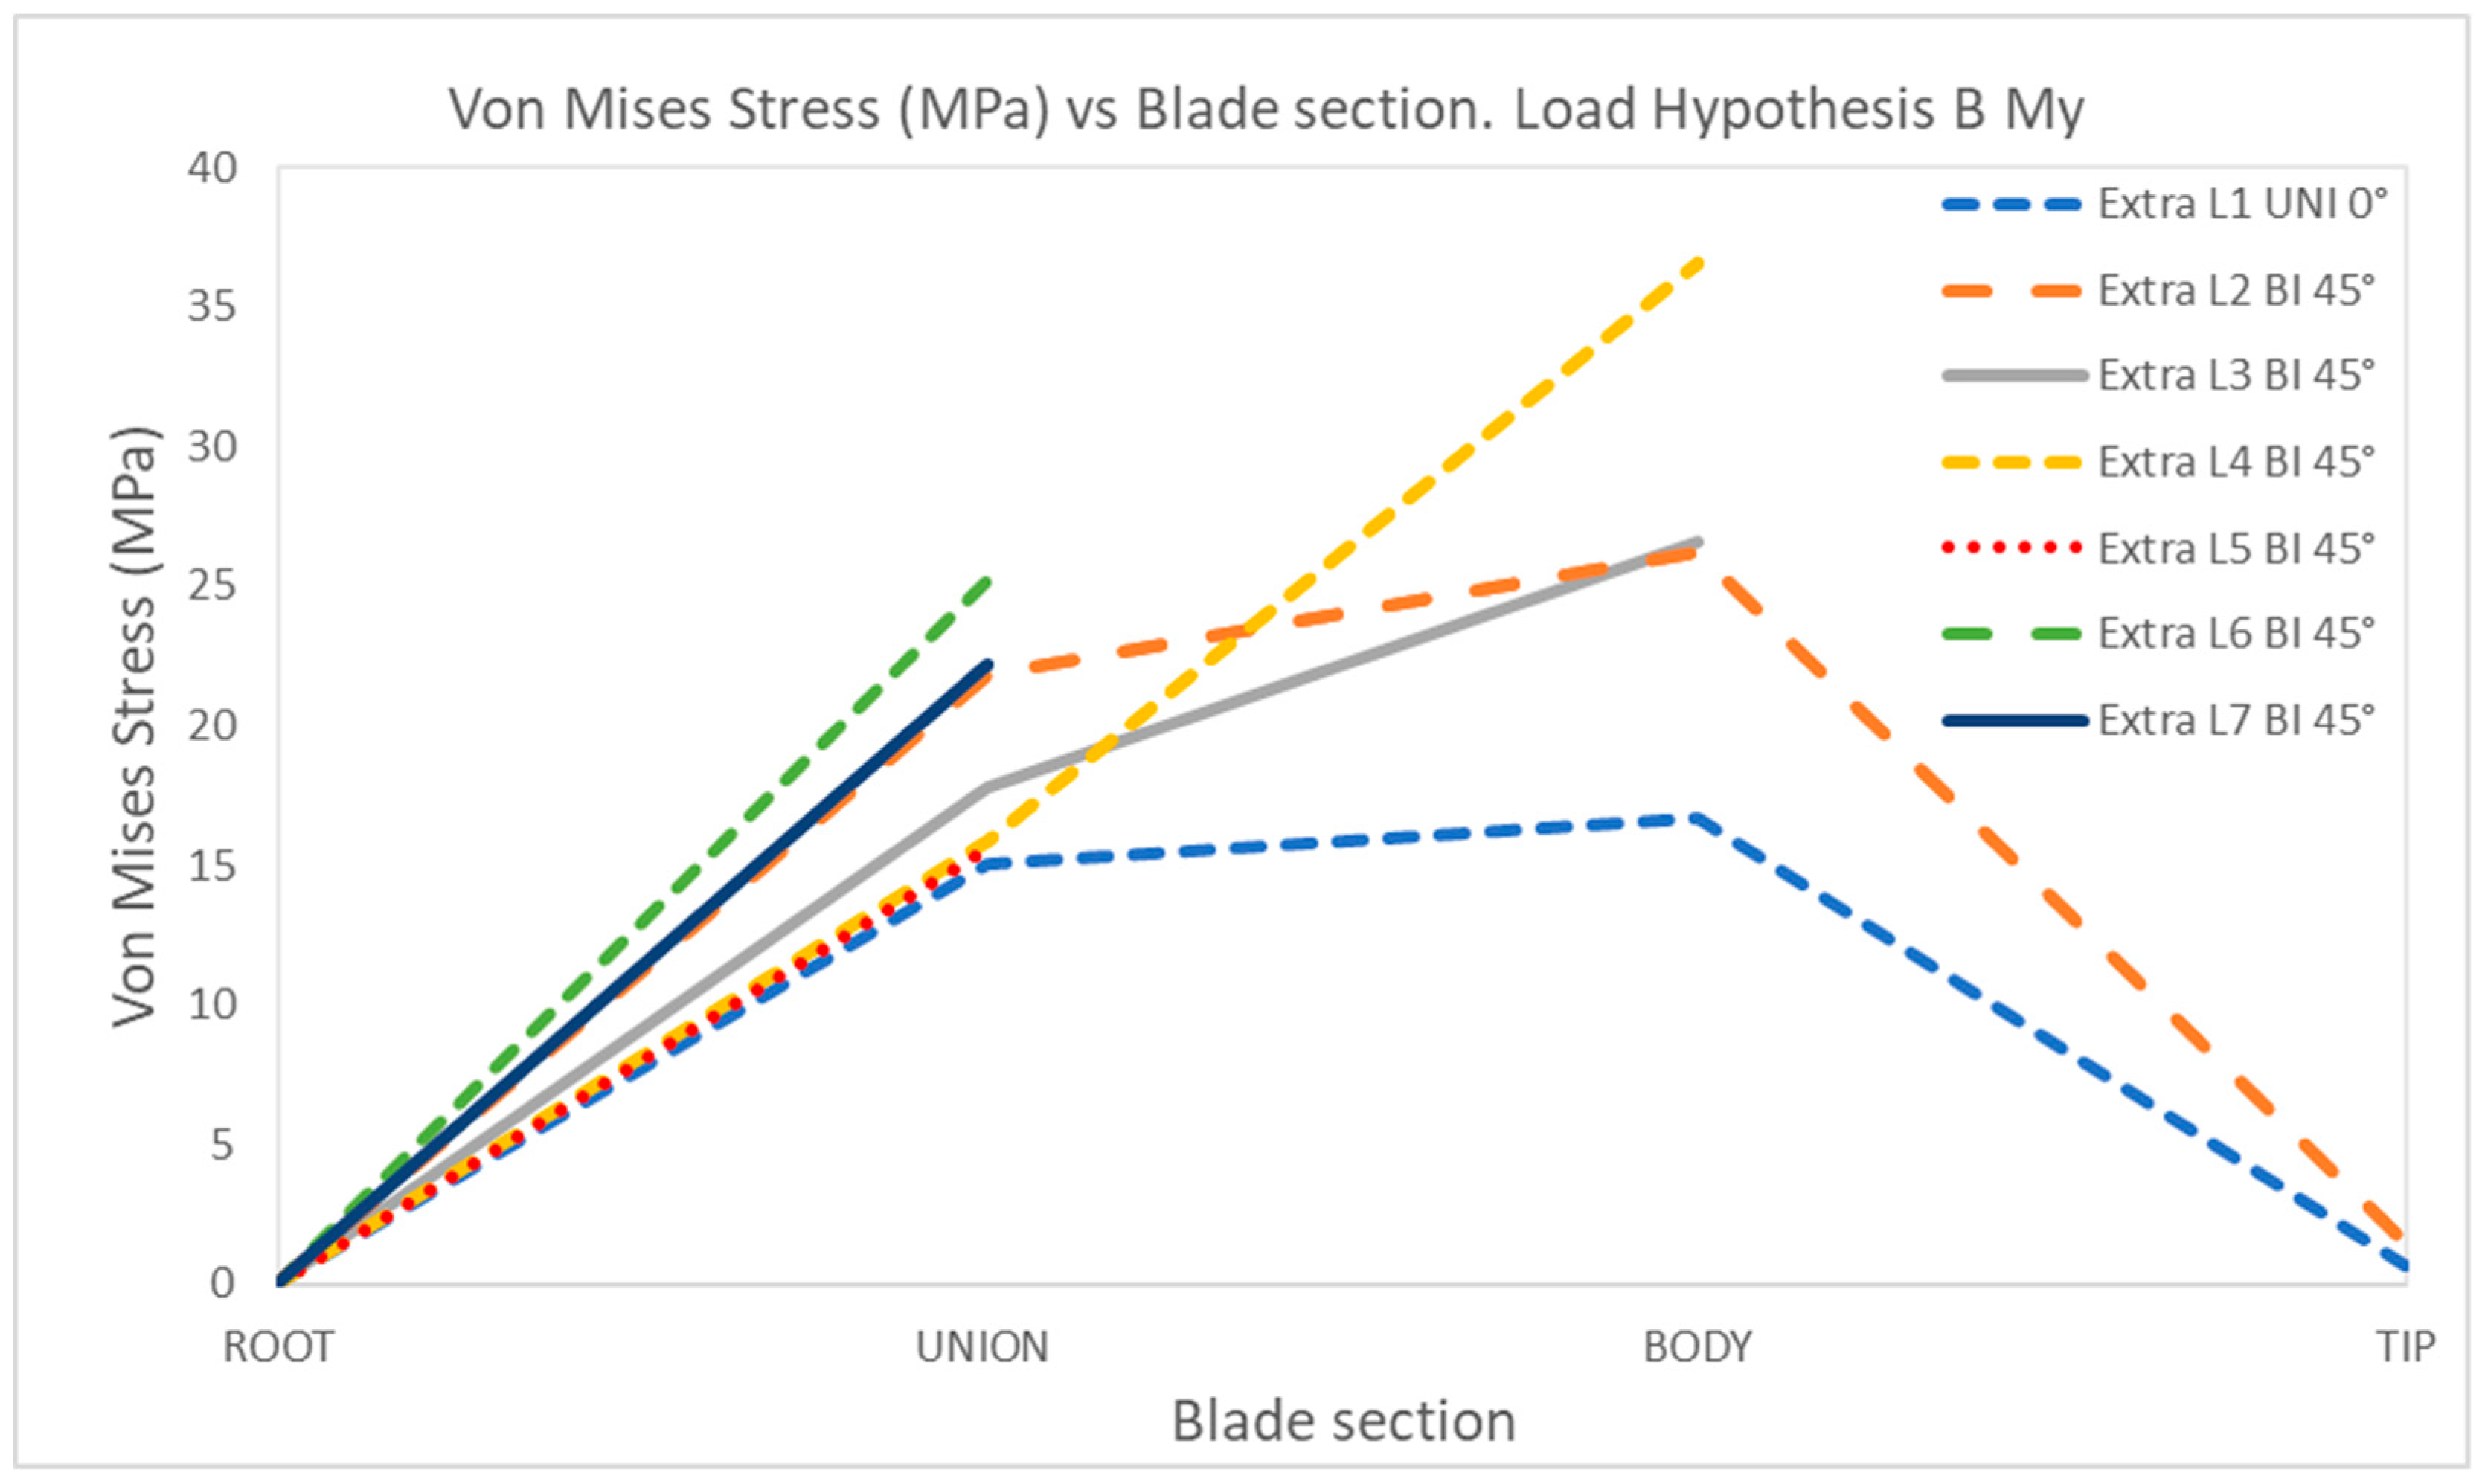
BMy | 1 | Uniaxial | 0 | 22.10 | 26.09 | 0.77 | 0 | 15.01 | 16.70 | 0.72 |
| 2 | Biaxial | 0 | 30.85 | 37.66 | 1.52 | 0 | 21.87 | 26.22 | 1.46 | |
| 3 | Biaxial | 0 | 28.37 | 20.03 | 0 | 17.79 | 26.60 | |||
| 4 | Biaxial | 0 | 16.47 | 45.75 | 0 | 15.86 | 36.59 | |||
| 5 | Biaxial | 0 | 22.44 | 0 | 15.61 | |||||
| 6 | Biaxial | 0 | 23.97 | 0 | 25.20 | |||||
| 7 | Biaxial | 0 | 36.24 | 0 | 22.24 | |||||
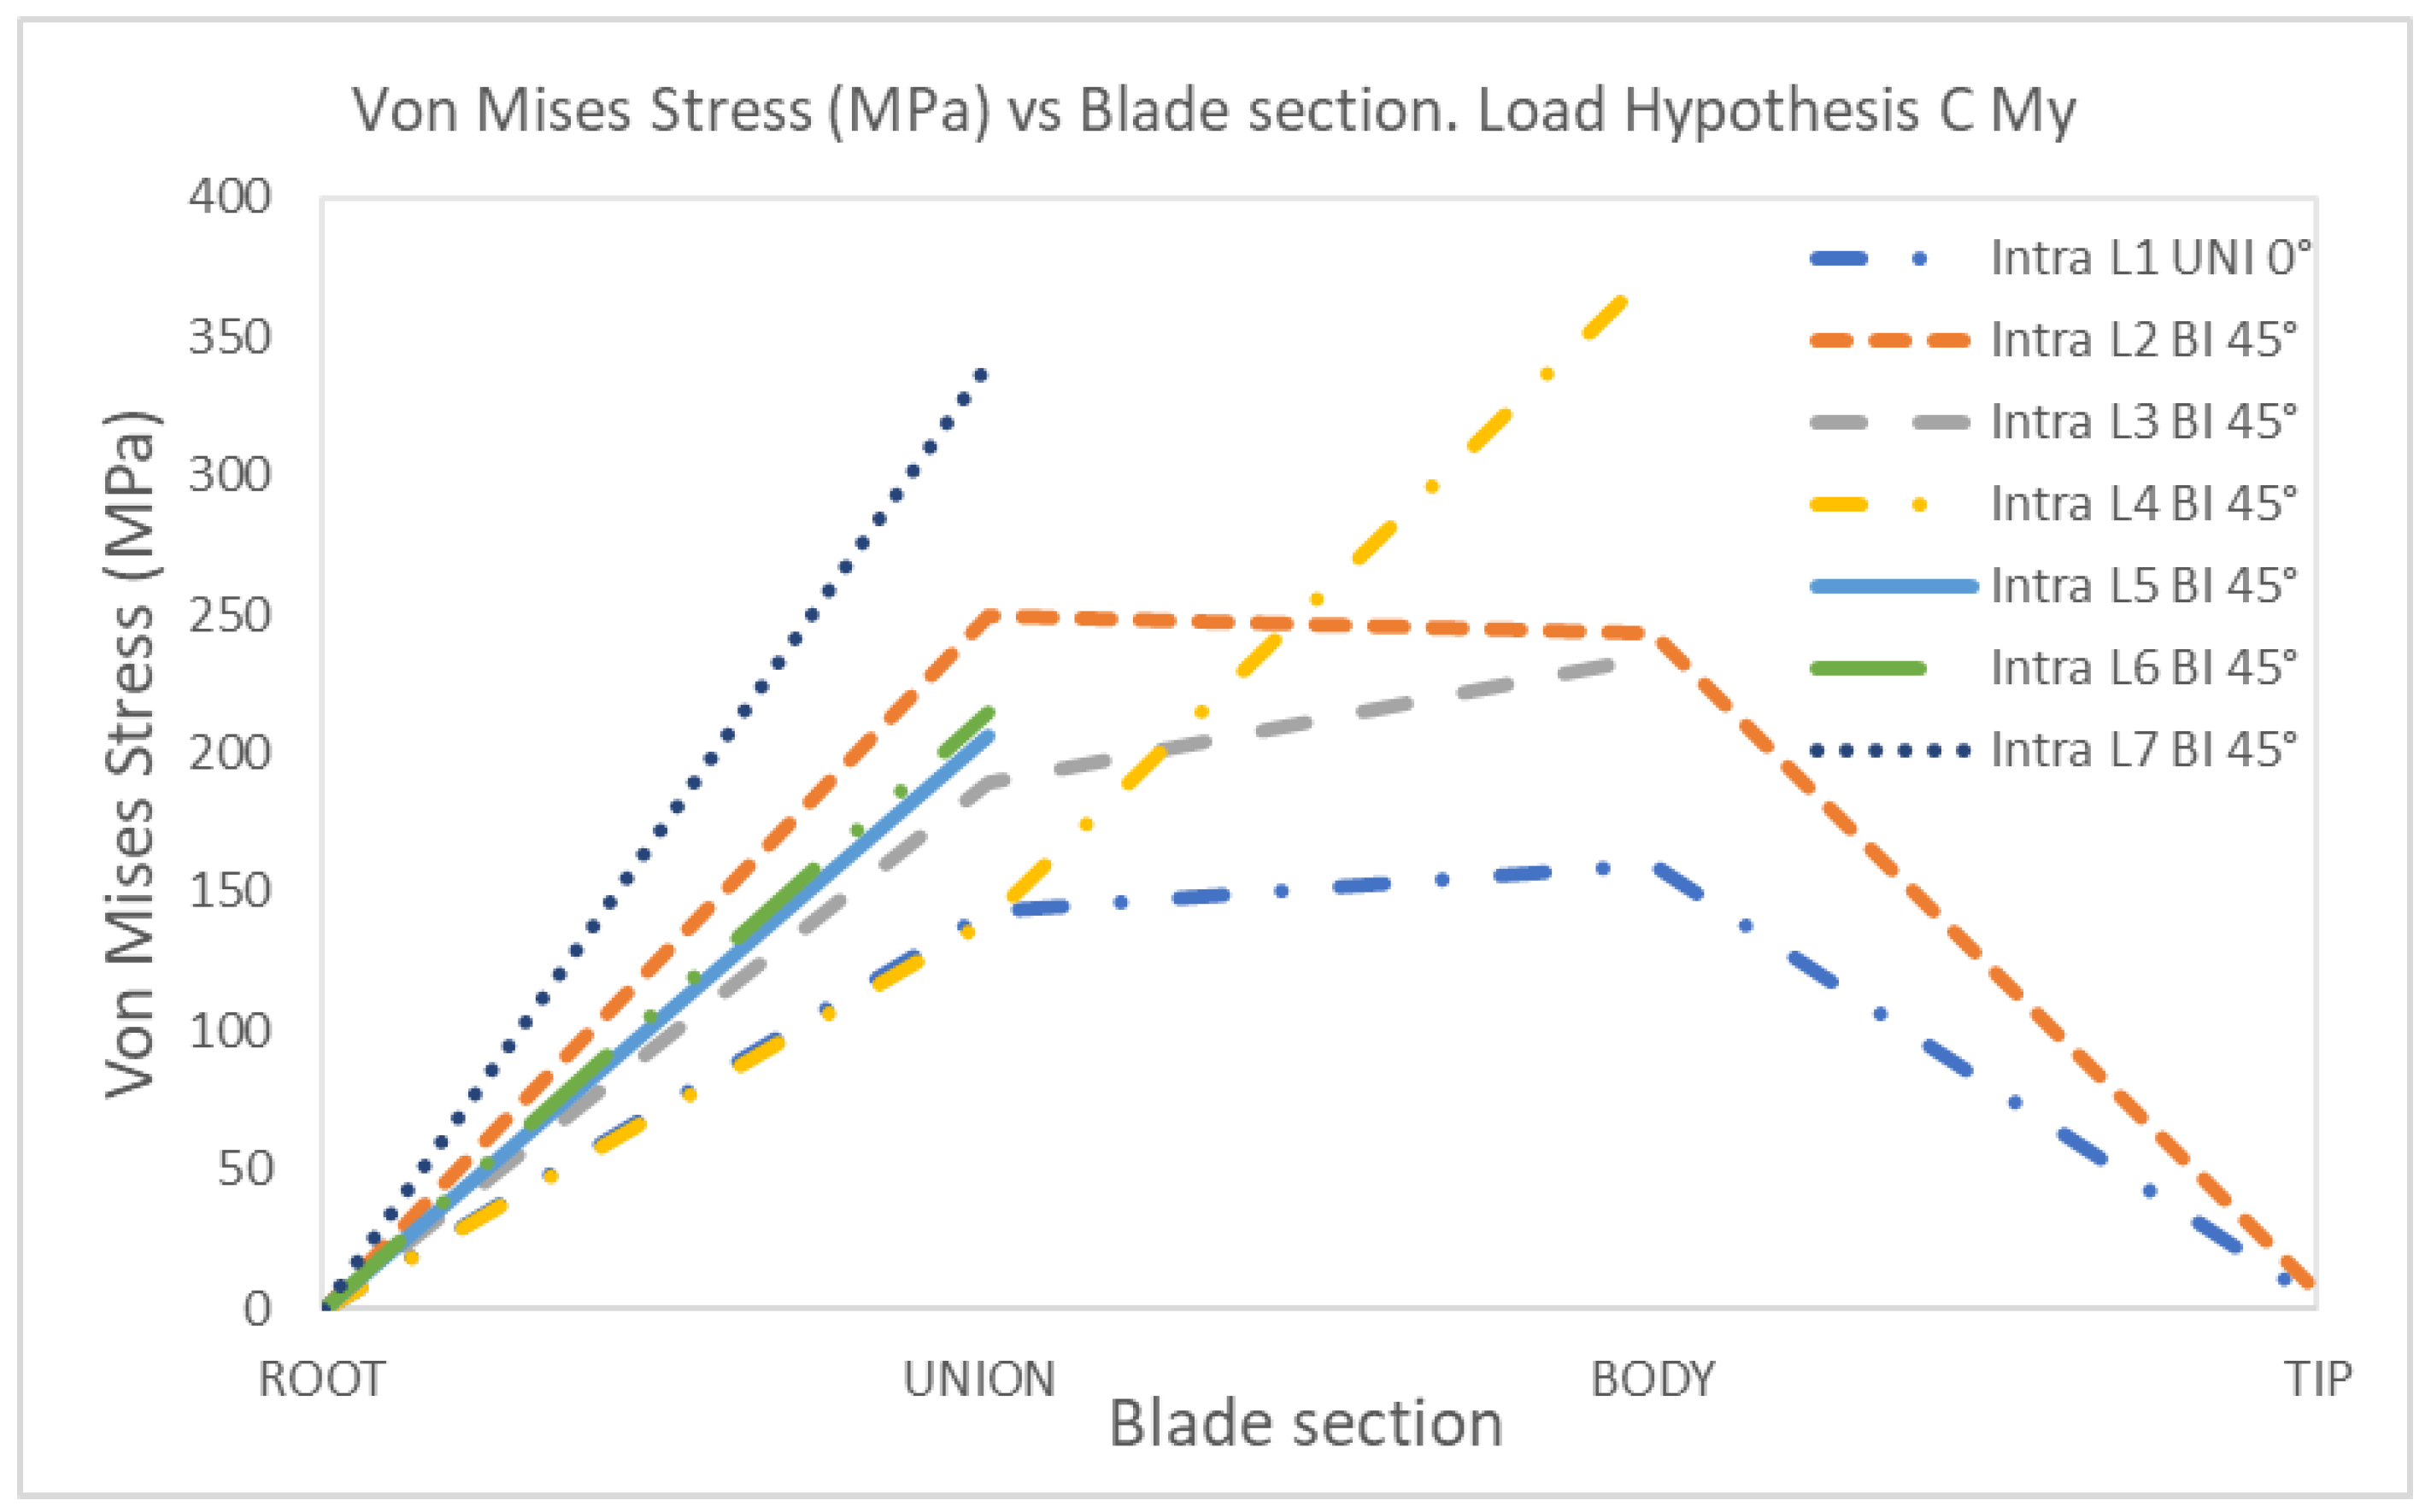
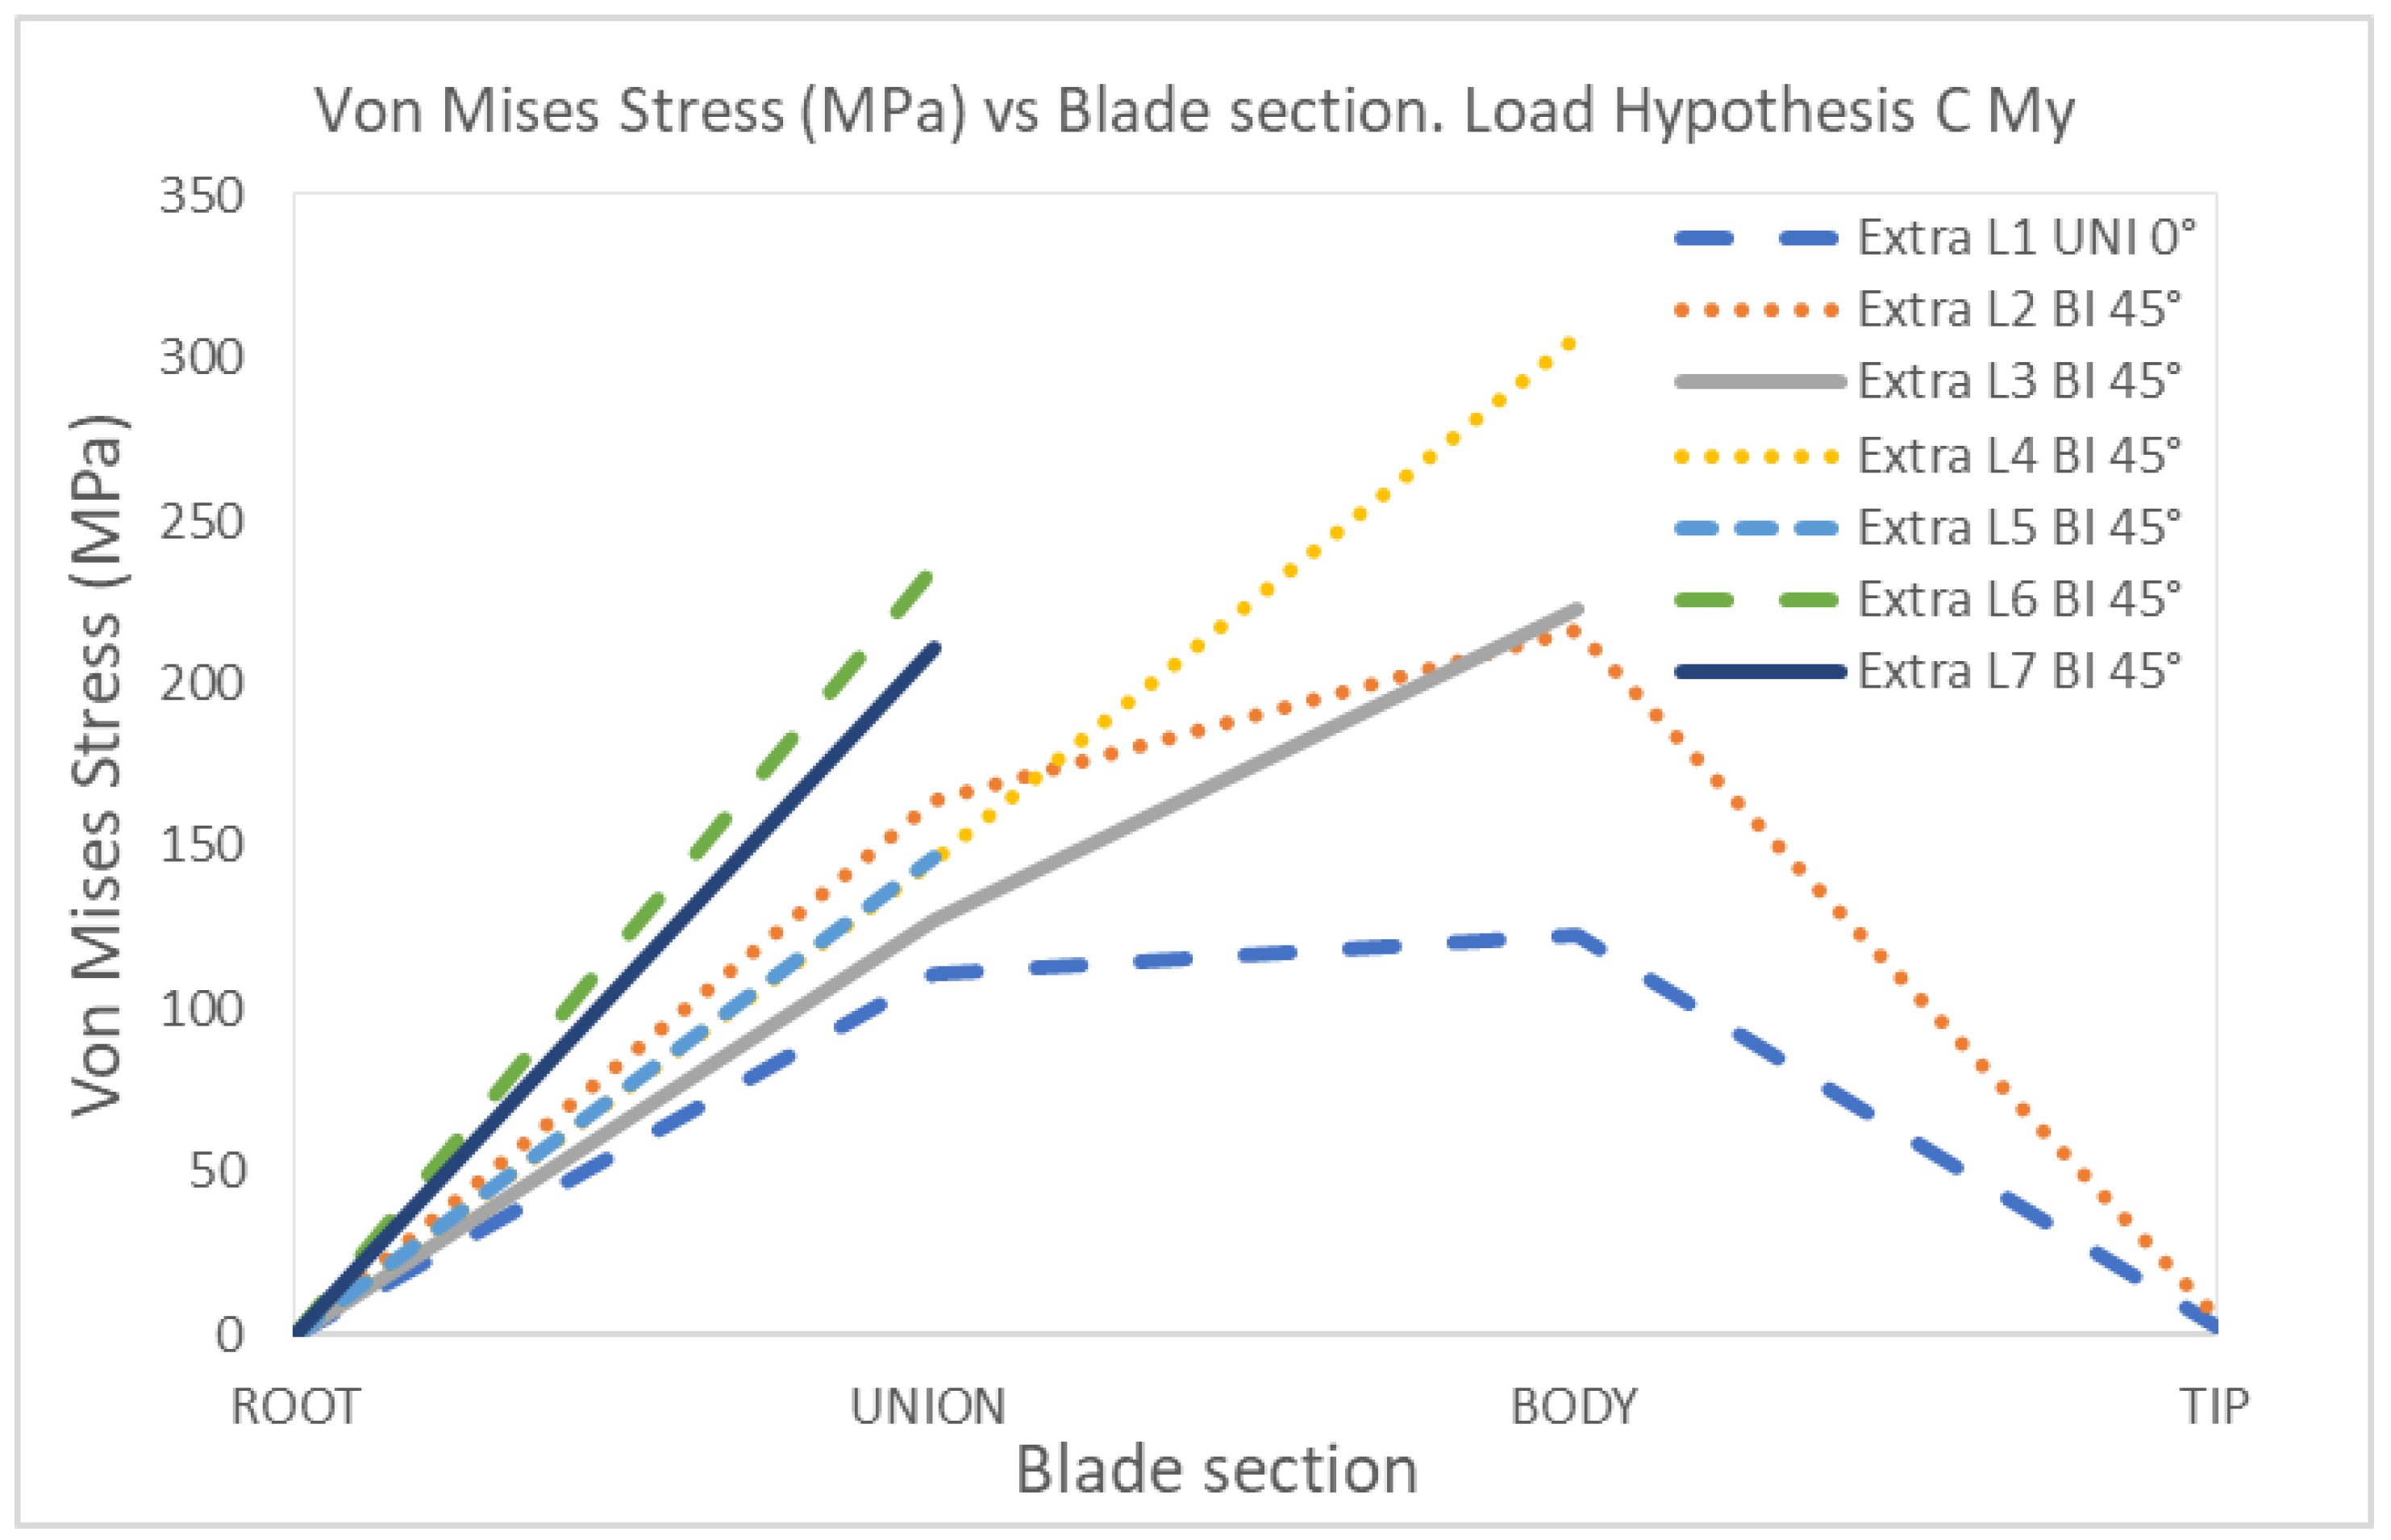
CMy | 1 | Uniaxial | 0 | 142.88 | 160.25 | 2.88 | 0 | 110.75 | 122.86 | 2.63 |
| 2 | Biaxial | 0 | 249.18 | 242.91 | 6.05 | 0 | 163.80 | 216.50 | 5.33 | |
| 3 | Biaxial | 0 | 189.01 | 234.59 | 0 | 127.63 | 223.09 | |||
| 4 | Biaxial | 0 | 139.75 | 373.47 | 0 | 145.93 | 306.16 | |||
| 5 | Biaxial | 0 | 206.72 | 0 | 146.34 | |||||
| 6 | Biaxial | 0 | 215.19 | 0 | 236.03 | |||||
| 7 | Biaxial | 0 | 339.89 | 0 | 211.18 | |||||
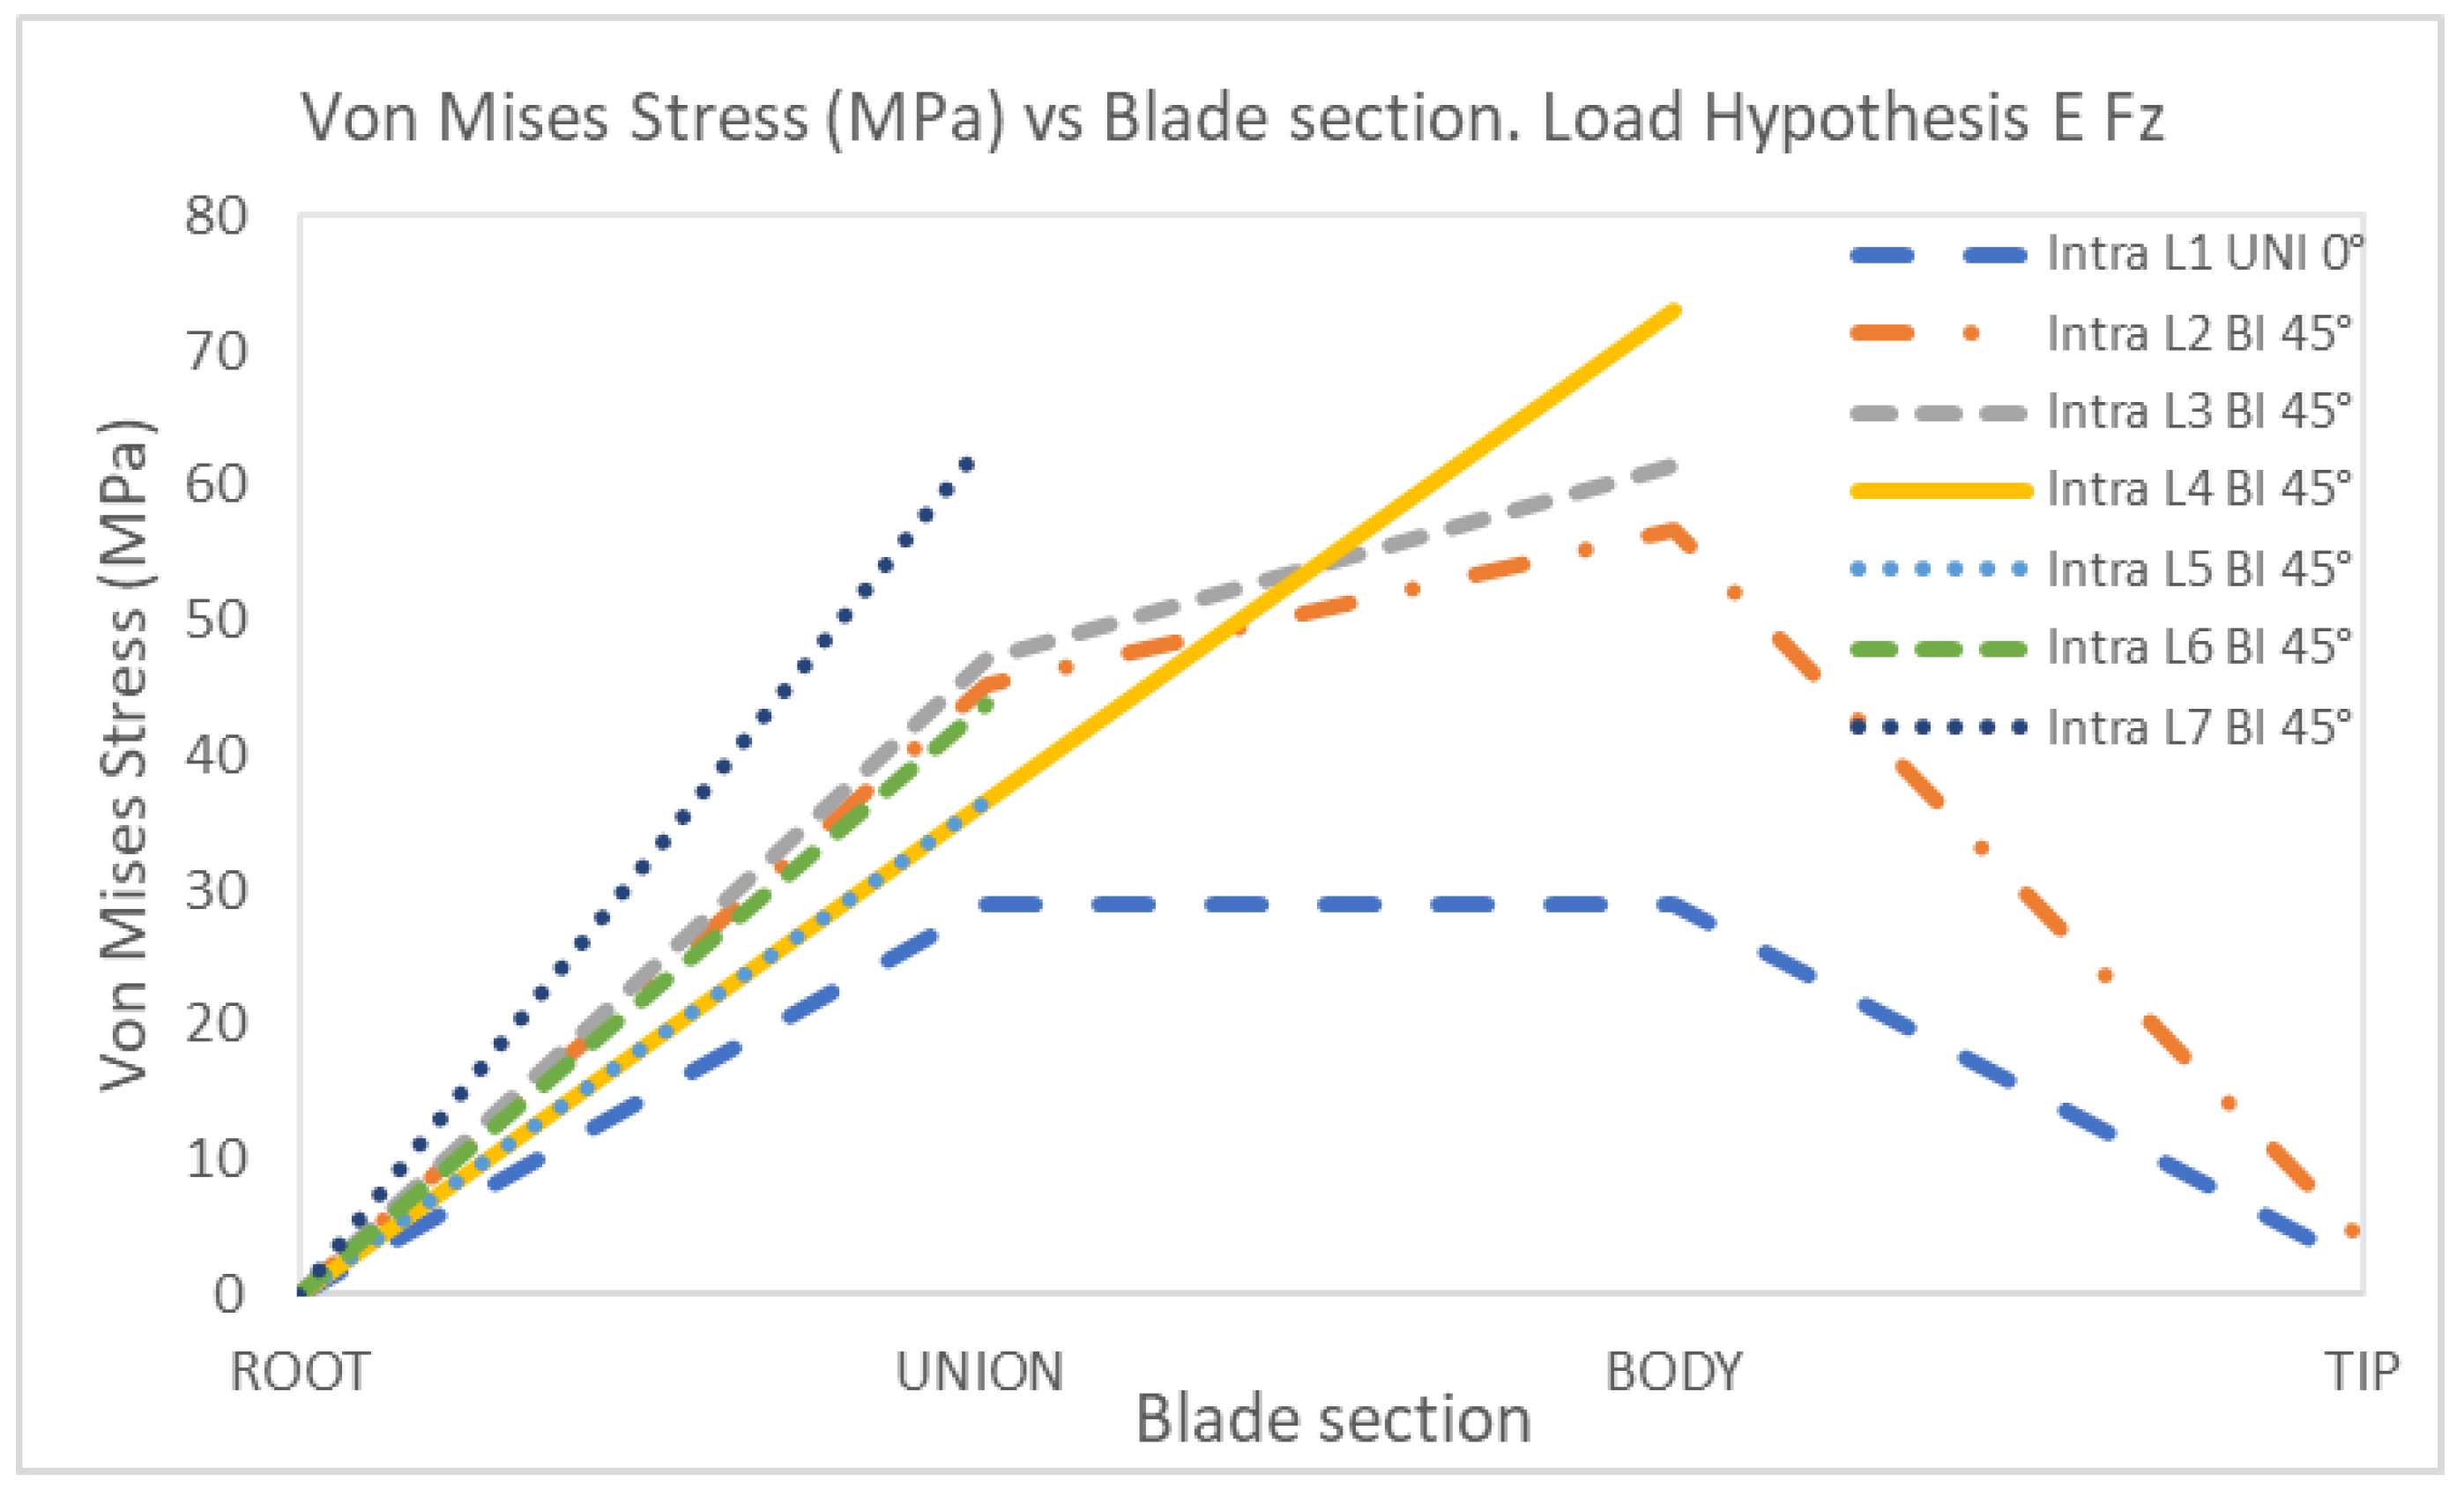
EFz | 1 | Uniaxial | 0 | 29.01 | 29.05 | 2.21 | 0 | 23.53 | 22.11 | 1.84 |
| 2 | Biaxial | 0 | 45.30 | 56.81 | 4.01 | 0 | 41.96 | 44.79 | 2.86 | |
| 3 | Biaxial | 0 | 47.14 | 61.52 | 0 | 35.78 | 38.67 | |||
| 4 | Biaxial | 0 | 36.72 | 73.03 | 0 | 26.48 | 41.97 | |||
| 5 | Biaxial | 0 | 36.72 | 0 | 31.43 | |||||
| 6 | Biaxial | 0 | 43.86 | 0 | 45.80 | |||||
| 7 | Biaxial | 0 | 63.55 | 0 | 48.22 | |||||
HMy | 1 | Uniaxial | 0 | 1068.50 | 1261.60 | 37.33 | 0 | 725.72 | 807.32 | 34.65 |
| 2 | Biaxial | 0 | 1491.90 | 1821.00 | 73.40 | 0 | 1057.60 | 1267.70 | 70.79 | |
| 3 | Biaxial | 0 | 1371.60 | 1355.50 | 0 | 860.03 | 1286.10 | |||
| 4 | Biaxial | 0 | 796.47 | 2212.10 | 0 | 766.77 | 1769.31 | |||
| 5 | Biaxial | 0 | 1084.80 | 0 | 754.52 | |||||
| 6 | Biaxial | 0 | 1159.10 | 0 | 1218.30 | |||||
| 7 | Biaxial | 0 | 1752.10 | 0 | 1075.30 | |||||
| 2212.10 | 191.41 | 0.10 | ||||||||
| Max | Mid | Min | ||||||||
 —Permissible scenario;
  —Acceptable scenario;
  —Critical scenario.
—Permissible scenario; —Acceptable scenario; —Critical scenario.
—Critical scenario.
—Permissible scenario; —Acceptable scenario; —Critical scenario.| Load Hypotheses | Vibration Mode | 1 | 2 | 3 | 4 | 5 | 6 | 7 | 8 | 9 | 10 | 11 | 12 | 13 | 14 | 15 |
|---|---|---|---|---|---|---|---|---|---|---|---|---|---|---|---|---|
| Natural Frequencies (Hz) | 13.4 | 48.3 | 78.3 | 127.3 | 209.9 | 280.0 | 339.3 | 360.2 | 470.2 | 587.3 | 604.6 | 706.6 | 780.3 | 834.1 | 933.3 | |
| A Fz | ||||||||||||||||
| A Mx | ||||||||||||||||
| A My | ||||||||||||||||
| B My | ||||||||||||||||
| C My | ||||||||||||||||
| E Fz | ||||||||||||||||
| H My |
Disclaimer/Publisher’s Note: The statements, opinions and data contained in all publications are solely those of the individual author(s) and contributor(s) and not of MDPI and/or the editor(s). MDPI and/or the editor(s) disclaim responsibility for any injury to people or property resulting from any ideas, methods, instructions or products referred to in the content. |
© 2025 by the authors. Licensee MDPI, Basel, Switzerland. This article is an open access article distributed under the terms and conditions of the Creative Commons Attribution (CC BY) license (https://creativecommons.org/licenses/by/4.0/).
Share and Cite
Vázquez, M.; López, V.; Campos, R.; Cadenas, E.; Marin, P. Structural and Modal Analysis of a Small Wind Turbine Blade Considering Composite Material and the IEC 61400-2 Standard. Energies 2025, 18, 566. https://doi.org/10.3390/en18030566
Vázquez M, López V, Campos R, Cadenas E, Marin P. Structural and Modal Analysis of a Small Wind Turbine Blade Considering Composite Material and the IEC 61400-2 Standard. Energies. 2025; 18(3):566. https://doi.org/10.3390/en18030566
Chicago/Turabian StyleVázquez, Miriam, Victor López, Rafael Campos, Erasmo Cadenas, and Paulina Marin. 2025. "Structural and Modal Analysis of a Small Wind Turbine Blade Considering Composite Material and the IEC 61400-2 Standard" Energies 18, no. 3: 566. https://doi.org/10.3390/en18030566
APA StyleVázquez, M., López, V., Campos, R., Cadenas, E., & Marin, P. (2025). Structural and Modal Analysis of a Small Wind Turbine Blade Considering Composite Material and the IEC 61400-2 Standard. Energies, 18(3), 566. https://doi.org/10.3390/en18030566