Article

Lessons Learned from Four Real-Life Case Studies: Energy Balance Calculations for Implementing Positive Energy Districts

1
Sonnenplatz Großschönau GmbH, 3922 Großschönau, Austria
2
University of Applied Sciences Technikum Wien, Renewable Energy Systems, 1200 Wien, Austria
3
Delft University of Technology, PMVD, 2628 CD Delft, The Netherlands
4
PV Works, 2628 CD Delft, The Netherlands
5
LINKS Foundation, 10138 Torino, Italy
6
Denkstatt Romania SRL, 300425 Timişoara, Romania
*
Author to whom correspondence should be addressed.
Energies 2025, 18(3), 560; https://doi.org/10.3390/en18030560
Submission received: 10 December 2024 / Revised: 10 January 2025 / Accepted: 16 January 2025 / Published: 24 January 2025

Abstract

:
Positive Energy Districts (PEDs) are integral to achieving sustainable urban development by enhancing energy self-sufficiency and reducing carbon emissions. This paper explores energy balance calculations in four diverse case study districts within different climatic conditions—Fiat Village in Settimo Torinese (Italy), Großschönau (Austria), Beursplain in Amsterdam (Netherlands), and Lunca Pomostului in Reşiţa (Romania)—as part of the SIMPLY Positive project. Each district faces unique challenges, such as outdated infrastructure or heritage protection, which we address through tailored strategies including building renovations and the integration of renewable energy systems. Additionally, we employ advanced simulation methodologies to assess energy performance. Simulation results highlight the significance of innovative technologies like photovoltaic-thermal (PVT) systems, application of demand-side actions, and flexible grid usage. Furthermore, mobility assessments and resident-driven initiatives demonstrate the critical role of community engagement in reducing carbon footprints. This study underscores the adaptability of PED frameworks across varied urban contexts and provides actionable insights for scaling similar strategies globally, supporting net-zero energy targets.

1. Introduction

The global transition toward sustainable urban development has become a critical priority, motivated by the urgent need to combat climate change and achieve climate neutrality in line with international frameworks such as the Paris Agreement. Positive Energy Districts (PEDs) embody a transformative concept within this transition, focusing on empowering urban areas to generate more renewable energy than they consume. A PED is seen as a district with annual net-zero energy import and net-zero CO2 emissions, working towards an annual local surplus production of renewable energy [1]. They are seen as a tool for achieving climate-neutral cities, embedded in integrated urban strategies providing liveable, sustainable, and inclusive urban neighbourhoods. By leveraging energy-efficient buildings, smart grids, and innovative renewable energy technologies, PEDs significantly contribute to net-zero carbon goals while enhancing urban resilience. A PED Programme has been aligned with the Driving Urban Transition (DUT) Partnership and has become one of the three DUT Pathways. The programme will continue to expand its activities, with the aim of initiating 100 PEDs in Europe by 2025. [2]
However, implementing PEDs, particularly in established urban locales, presents numerous challenges. These challenges include the lack of universally accepted methodologies for assessing energy balances, the complexities of integrating renewable energy systems into dense and often outdated urban infrastructures, and the pressing need for multi-stakeholder collaboration to secure local acceptance and ensure equitable development processes [3,4].
This paper highlights findings from the research project “Supporting Innovative and Ambitious Cities and Municipalities on Their Pathway to Positive Energy Districts through Easy, Clear, and Understandable Guidelines, Targets, and Strategies” (SIMPLY Positive) [5]. Its main goal is to provide a practical overview and outline possible strategies for energy balance calculation within the focus district, which is a key aspect of implementing PEDs.

2. Materials and Methods

2.1. Focus Districts Description

The project considers four focus districts: Fiat Village in Settimo Torinese (Italy), Großschönau (Austria), Beursplain in the centre of Amsterdam (Netherlands), and Lunca Pomostului in Reşiţa (Romania).
The main parameters of focus districts are presented in Table 1.
In Settimo Torinese, the district Fiat Village is primarily residential, with most buildings over 50 years old, requiring extensive renovations to enhance energy performance. Goals include establishing a Renewable Energy Community to facilitate local energy production and consumption and implementing energy management systems to optimize energy use across both public and private sectors.
Großschönau, a small rural municipality in Austria, is committed to sustainability and known for its long-standing environmental initiatives. Plans are in place to attain the Positive Energy Municipality status by 2030, focusing on energy self-sufficiency and innovative projects, including small-scale wind turbines and a centralized biomass heating network.
The selected area Beursplain in Amsterdam is characterized by old buildings under heritage protection. Some buildings already feature photovoltaic (PV) systems, with the primary goal being to achieve a positive energy balance.
In Reşiţa, the focus Lunca Pomostului district combines residential, commercial, and institutional spaces, although much of its infrastructure is outdated. Efforts in this district aim to reduce emissions by 20% compared to 1990 levels. Current initiatives focus on urban redevelopment, including the modernization of public spaces, the addition of green infrastructure, and improved mobility options such as cycling lanes and pedestrian pathways.
These four districts represent diverse climatic conditions and energy challenges. For instance, Reşiţa experiences a temperate climate with Mediterranean influences, while Settimo Torinese and Amsterdam share moderate climates with varying precipitation patterns. Großschönau has a relatively dry climate with cold winters. Despite these differences, all districts prioritize the integration of renewable energy systems, with Amsterdam and Settimo Torinese emphasizing centralized heating solutions, and Großschönau showcasing leadership in decentralized renewable energy projects.

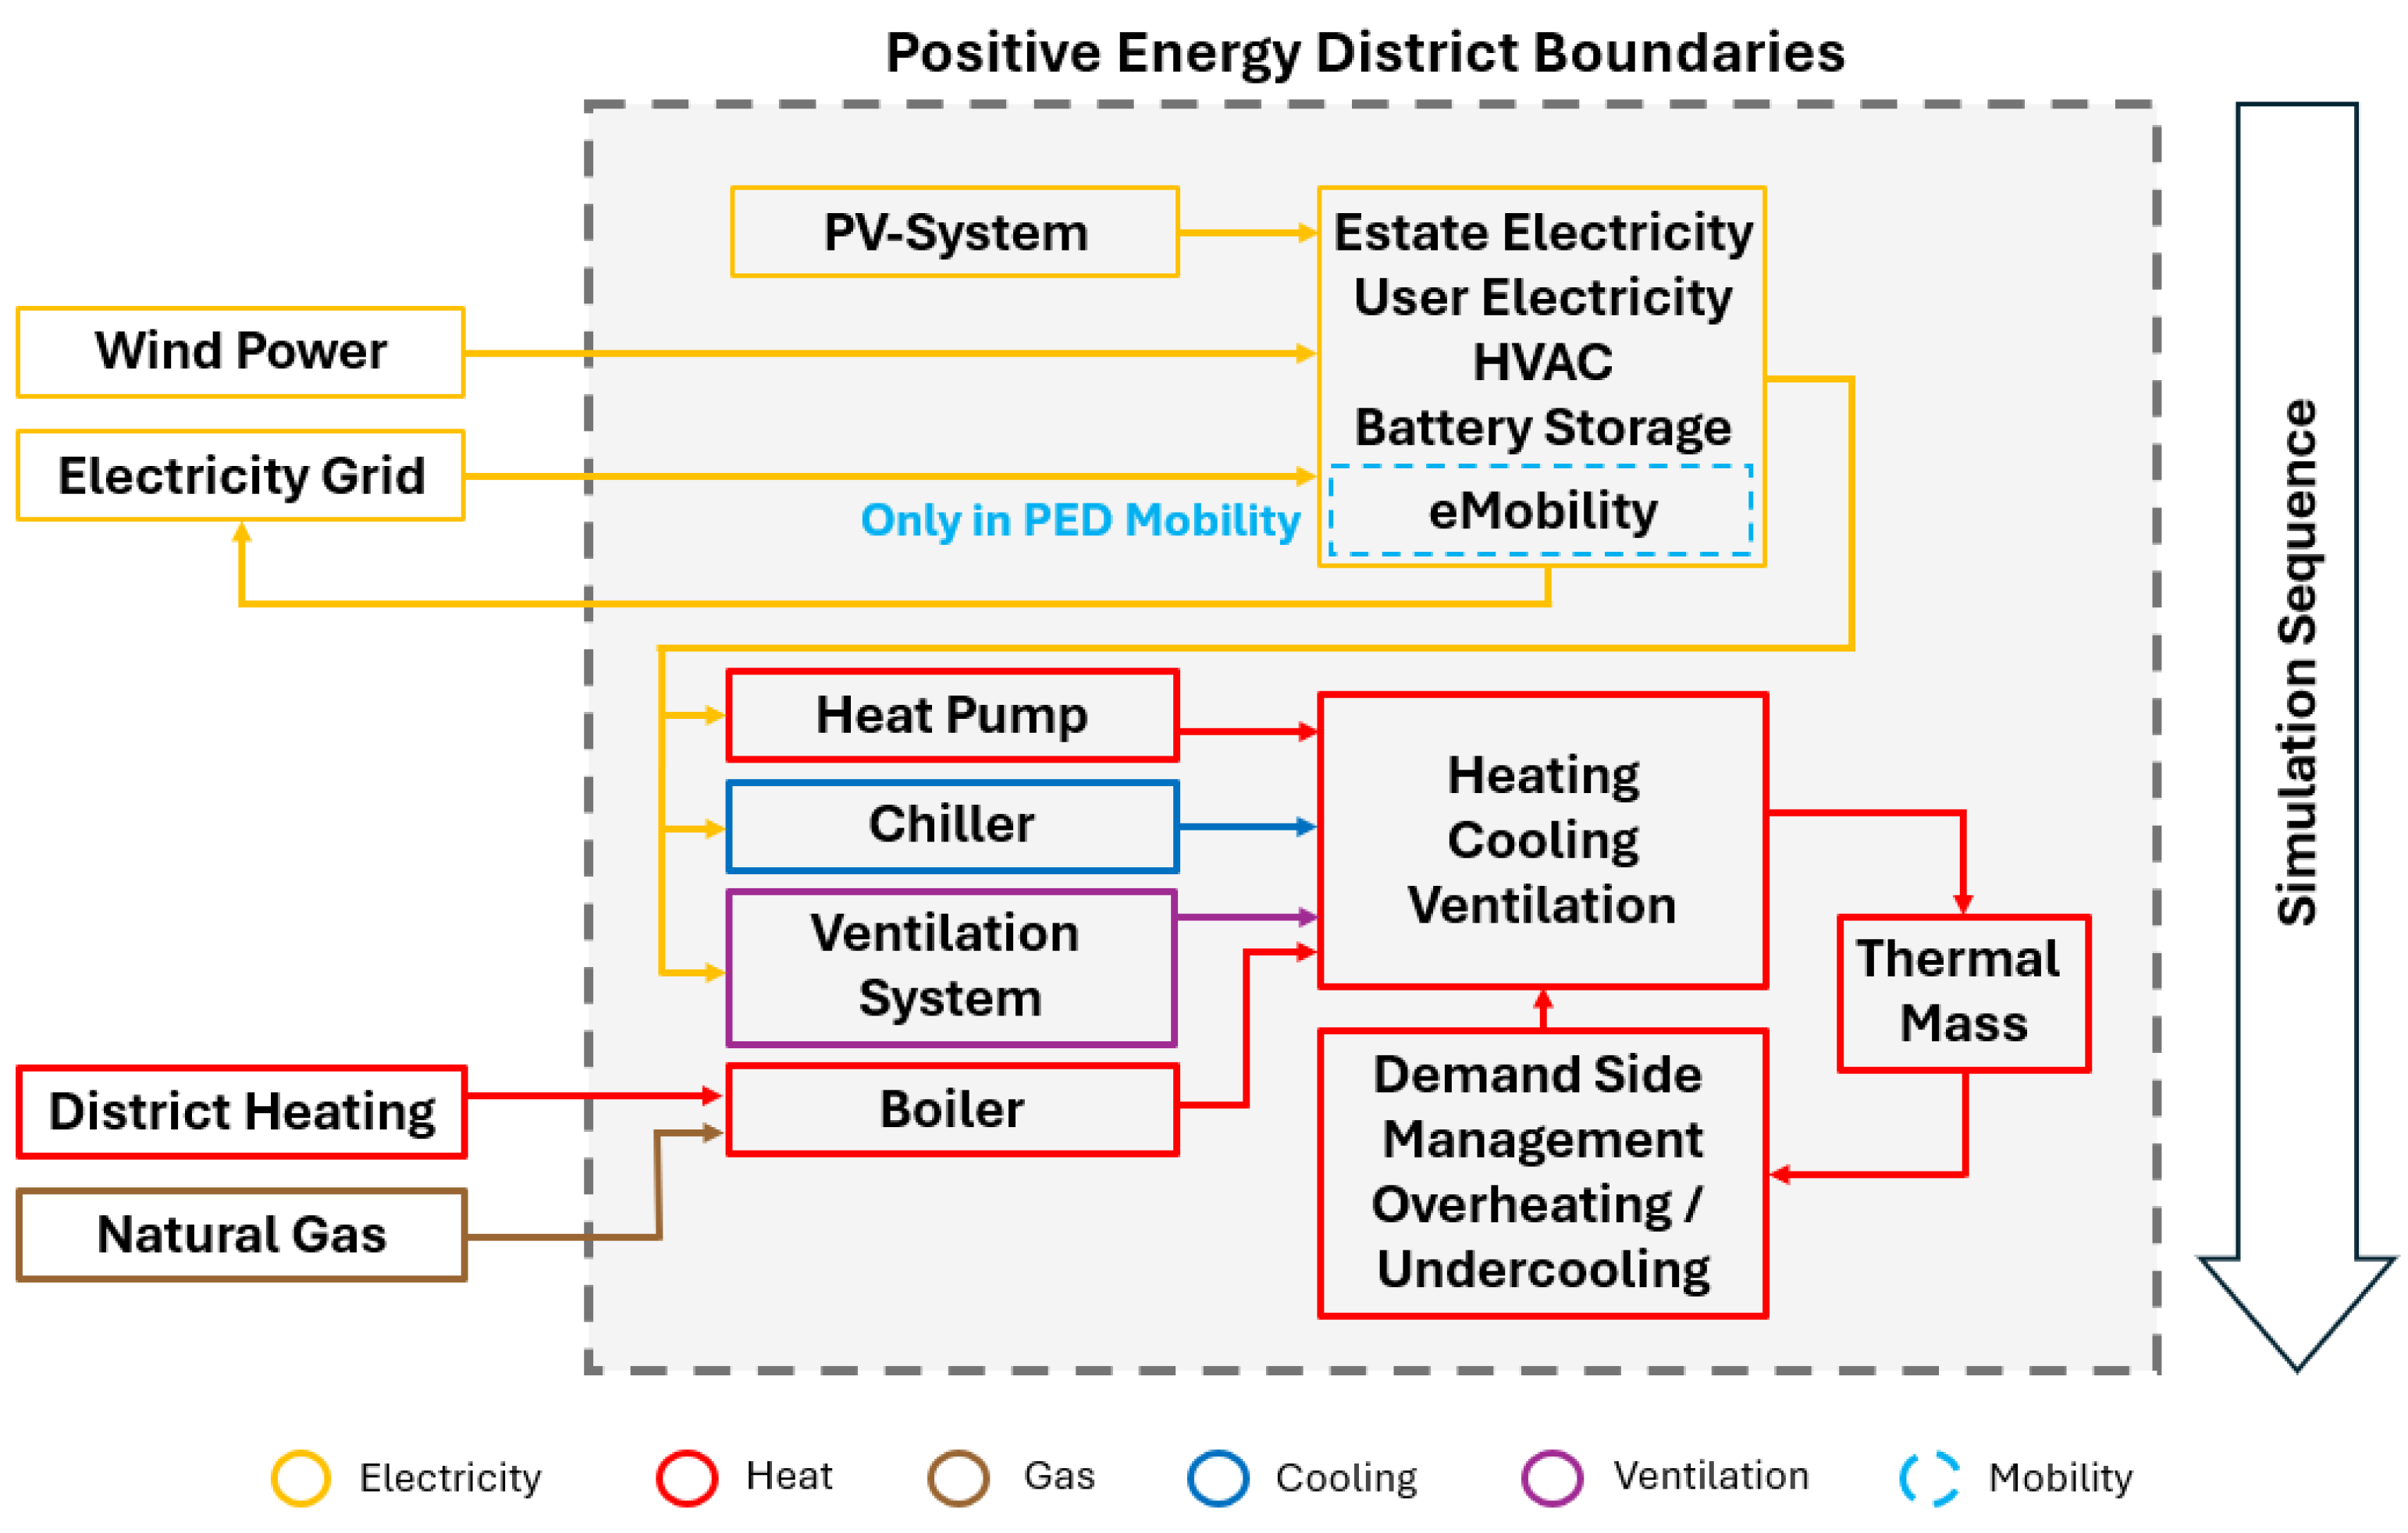
2.2. Methodology Description

The core of the definition of Positive Energy Districts (PEDs) lies in establishing a clear rationale behind their design, which articulates the objectives they aim to achieve. This design approach [12] begins by defining specific goals and subsequently deriving criteria for their operationalization based on these objectives.
System boundaries are established from spatial, temporal, and functional perspectives, in line with the principles outlined in the fundamentals of PED energy modelling [13]:
  • Spatial boundaries: these refer to the geographical limits enclosing included energy services and supplies;
  • Temporal boundaries: these represent the balancing period, typically defined as one operational year;
  • Functional boundaries: these identify specific energy functions, uses, or demands that are included or excluded based on their purpose rather than proximity.
The functional boundaries and included energy services can be categorized into three main areas:
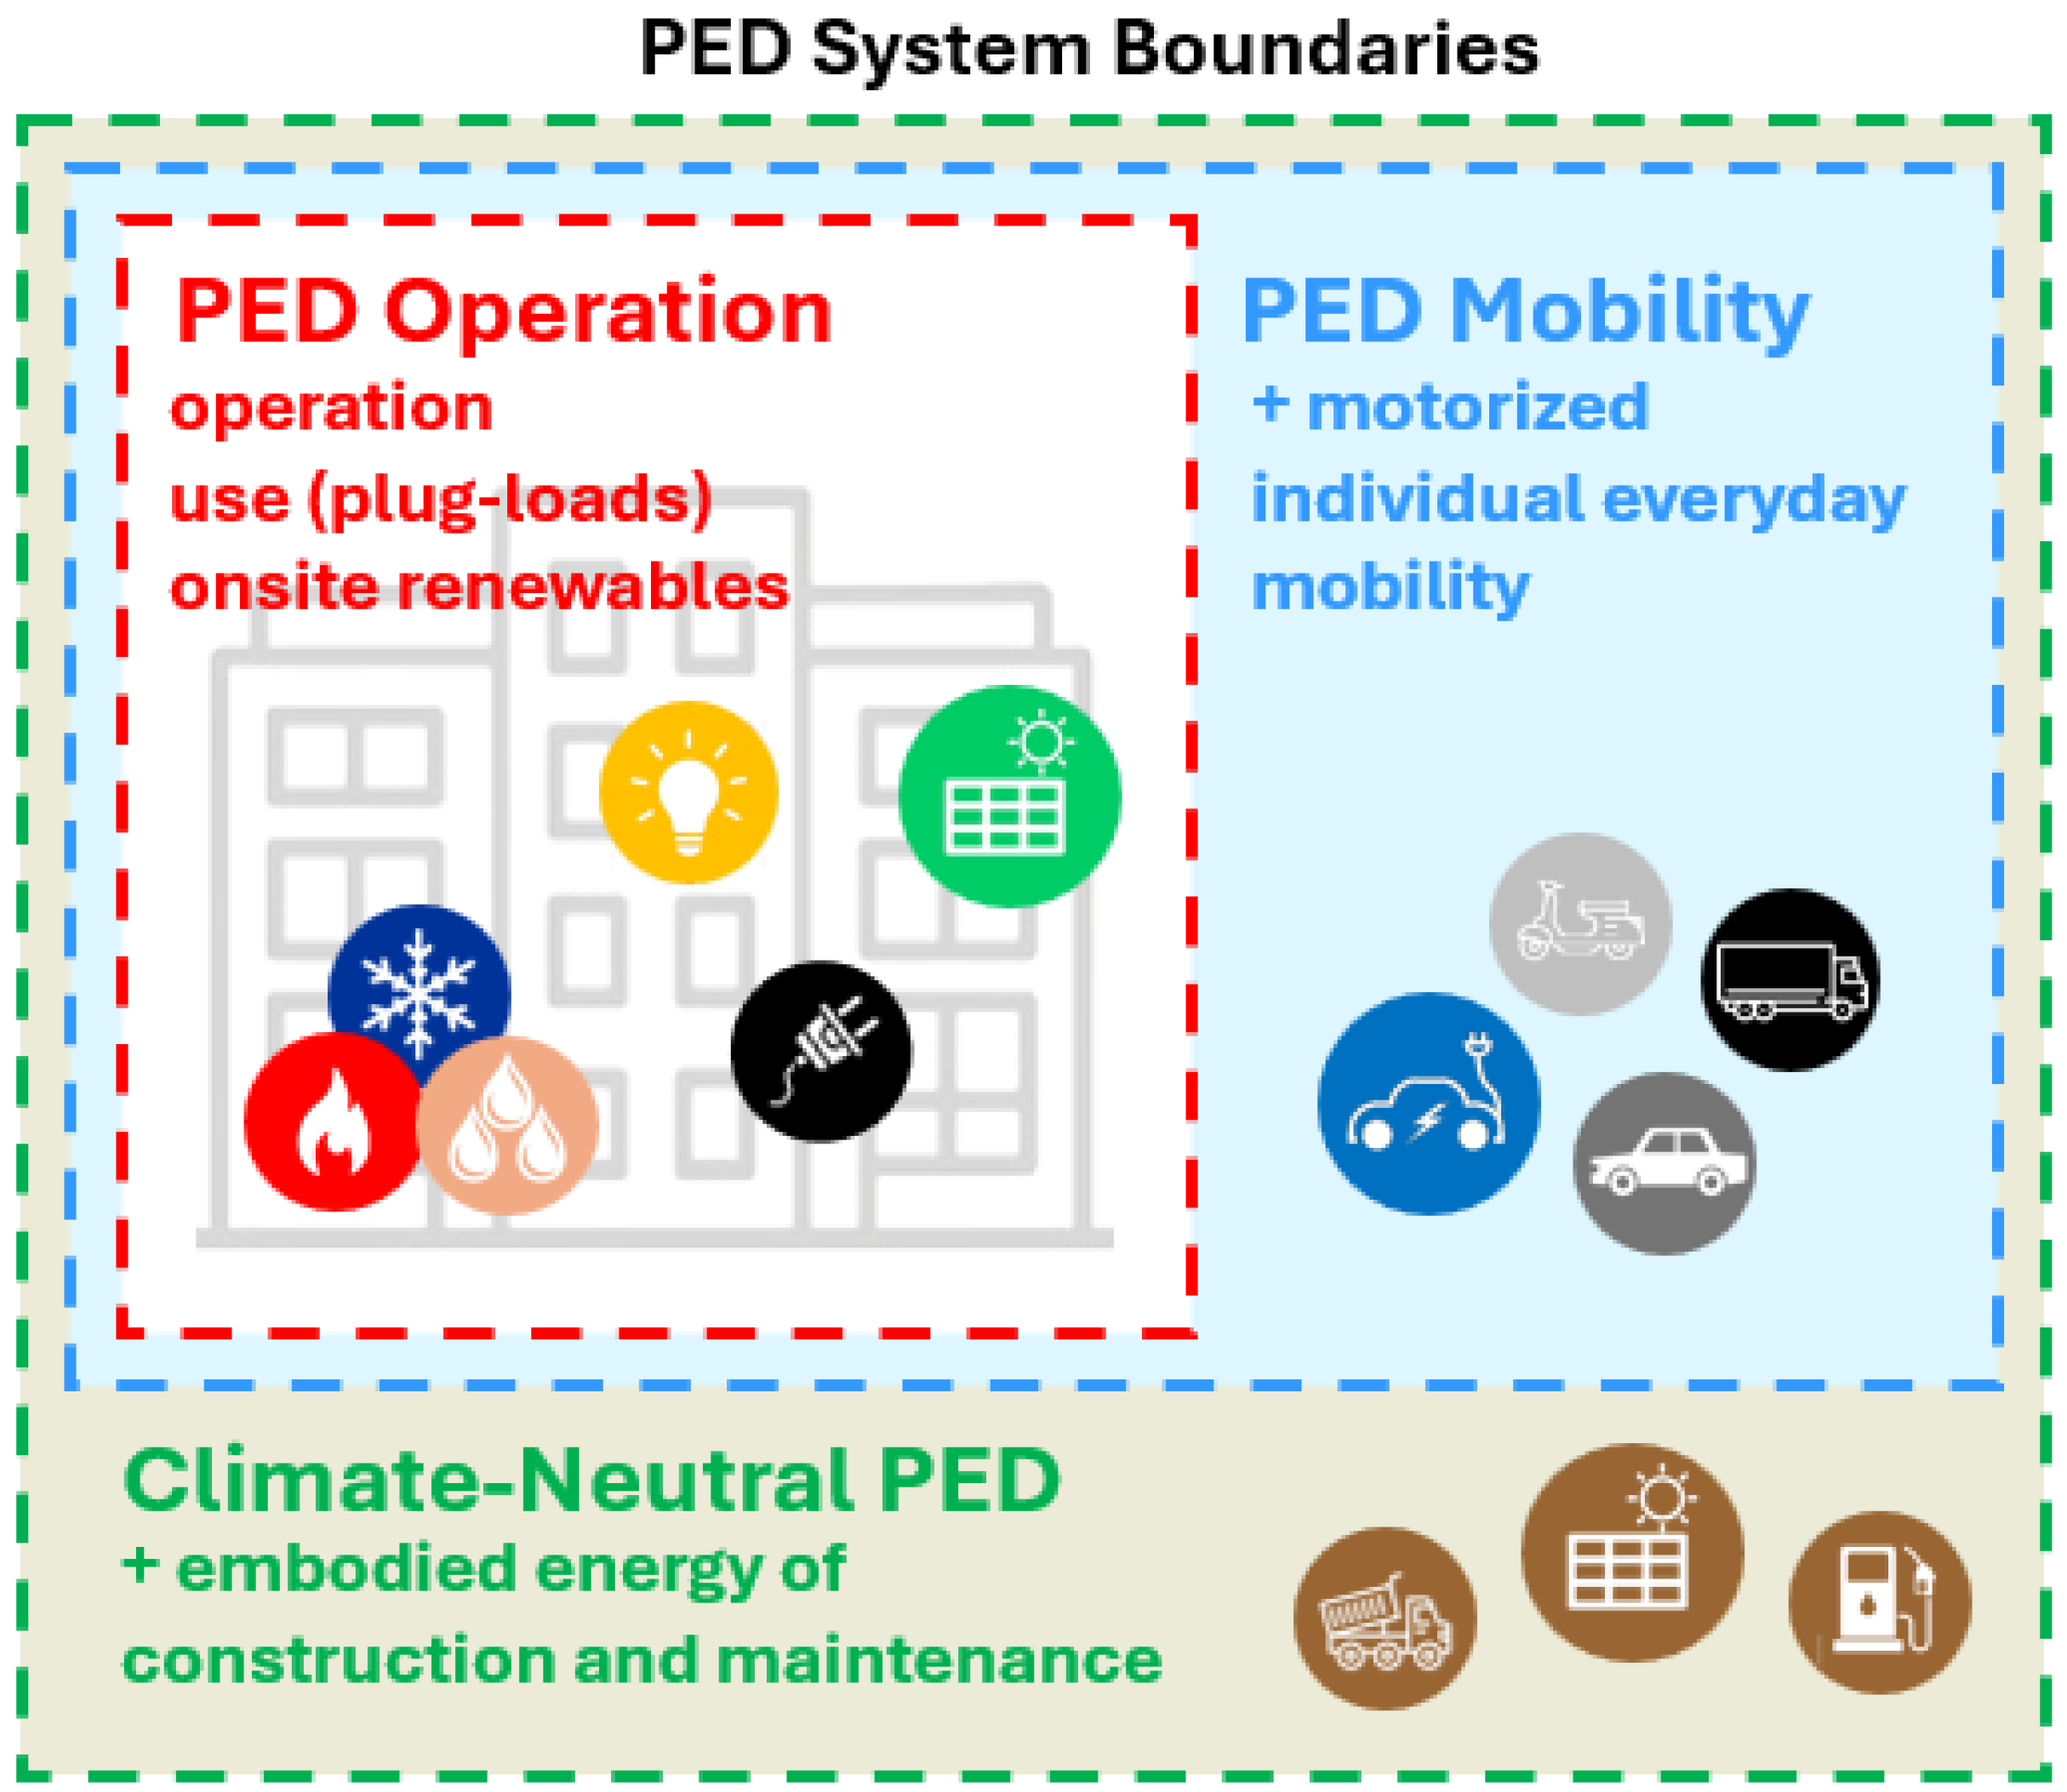
  • Operational energy and user electricity;
  • Mobility aspects;
  • Embodied energy and emissions.
This approach defines three variants or layers of PEDs:
  • PED operation (innermost level): focuses solely on operational energy;
  • PED mobility: expands to include private daily mobility;
  • Climate-neutral PED (outermost layer): incorporates embodied energy related to district construction, maintenance, repair, and mobility.
Each layer adds complexity and introduces uncertainty compared to the previous one. Access to adequate data is critical for simulation and verification, and these system boundaries are visually represented in Figure 1.
Under the SIMPLY Positive project, the first step in defining PEDs involved determining the type of each focus district along with its respective system boundaries. The spatial boundaries for each focus district align with the geographical borders of the selected regions. The sizes of these districts vary from the large city of Amsterdam to the small village of Großschönau. Despite these differences, nearly all self-set district goals include energy-related key performance indicators (KPIs).
The Romanian focus district set itself the goal of reducing CO2 emissions. This can be reframed as increasing the share of renewable energy, which contributes directly to lowering CO2 emissions and aligns it with the objectives of other districts. In the Italian focus district, two of the three self-set goals are socially oriented, making them more challenging to quantify; these can be classified as supportive objectives.
Temporal boundaries for all focus districts are set at one operational year, as there are no additional local or project-specific requirements. The functional boundary type of each focus district categorizes them primarily as residential areas with a minor proportion of social buildings (e.g., schools and offices).
The energy simulation was carried out to obtain the annual primary energy balance KPI and utilizes a simplified model of a single-zone thermal building and is calculated as follows:
P E B = C F + i j f i j E i j
with E i j the energy flow j   at hour i over the system boundary (outwards positive) weighed with f i j the time-dependant primary energy conversion factor of that energy flow and C F representing “Context Factors”, which are virtual balance components derived from top-down model parametrization described in [12]. The context factors depend on district density, expressed as the Floor Area Ratio (FAR) between the district’s gross floor area (GFA) and the underlying buildable plot area (PA):
F A R = G F A P A
The context factors used for analysis were operationalized according to the following [13]:
  C F D = M i n 2 61.94 F A R + 0.15 53.79 , 125   k W h P E m G F A 2 C F R = 15   k W h P E m G F A 2   C F R + D = C F D + C F R
The functional system boundary of the energy balance includes building use of operation and plug-loads (BUB). A second boundary only includes building operation (BOB) and is calculated by subtraction of user electricity and plug-loads (UE) from the use balance:
B O B = B U B U E
Electrical power needs are primarily met by a photovoltaic (PV) system. Any surplus energy generated can either be redirected to domestic hot water systems as part of demand-side management (DSM) strategies or fed back into the grid to offset overall energy consumption, with the inverted conversion factor for grid electricity at that time. Unmet energy demands are supplemented by grid-supporting sources, such as wind peak shaving from nearby wind farms, which are modelled by the use of external wind availability data (>40% of installed capacity) at which point the primary energy conversion is set to zero, effectively discounting grid use during these hours. The effect of these measures is separately shown as “Flexibility Measures”.
Thermal energy demand is defined by the target temperature settings for heating, cooling, and domestic hot water (DHW) systems. This demand can be satisfied through electrical solutions, such as heat pumps, or other methods like district heating and natural gas boilers. Each energy system is evaluated using specific primary energy conversion factors, which may be obtained from national or regional standards, measurement data, or projections for future energy systems.
Any excess energy generated through demand-side management can be stored in the building’s thermal mass, which helps to reduce peak load demands, particularly during winter nights. The simulation method is illustrated schematically in Figure 2 and described in more detail in [14].

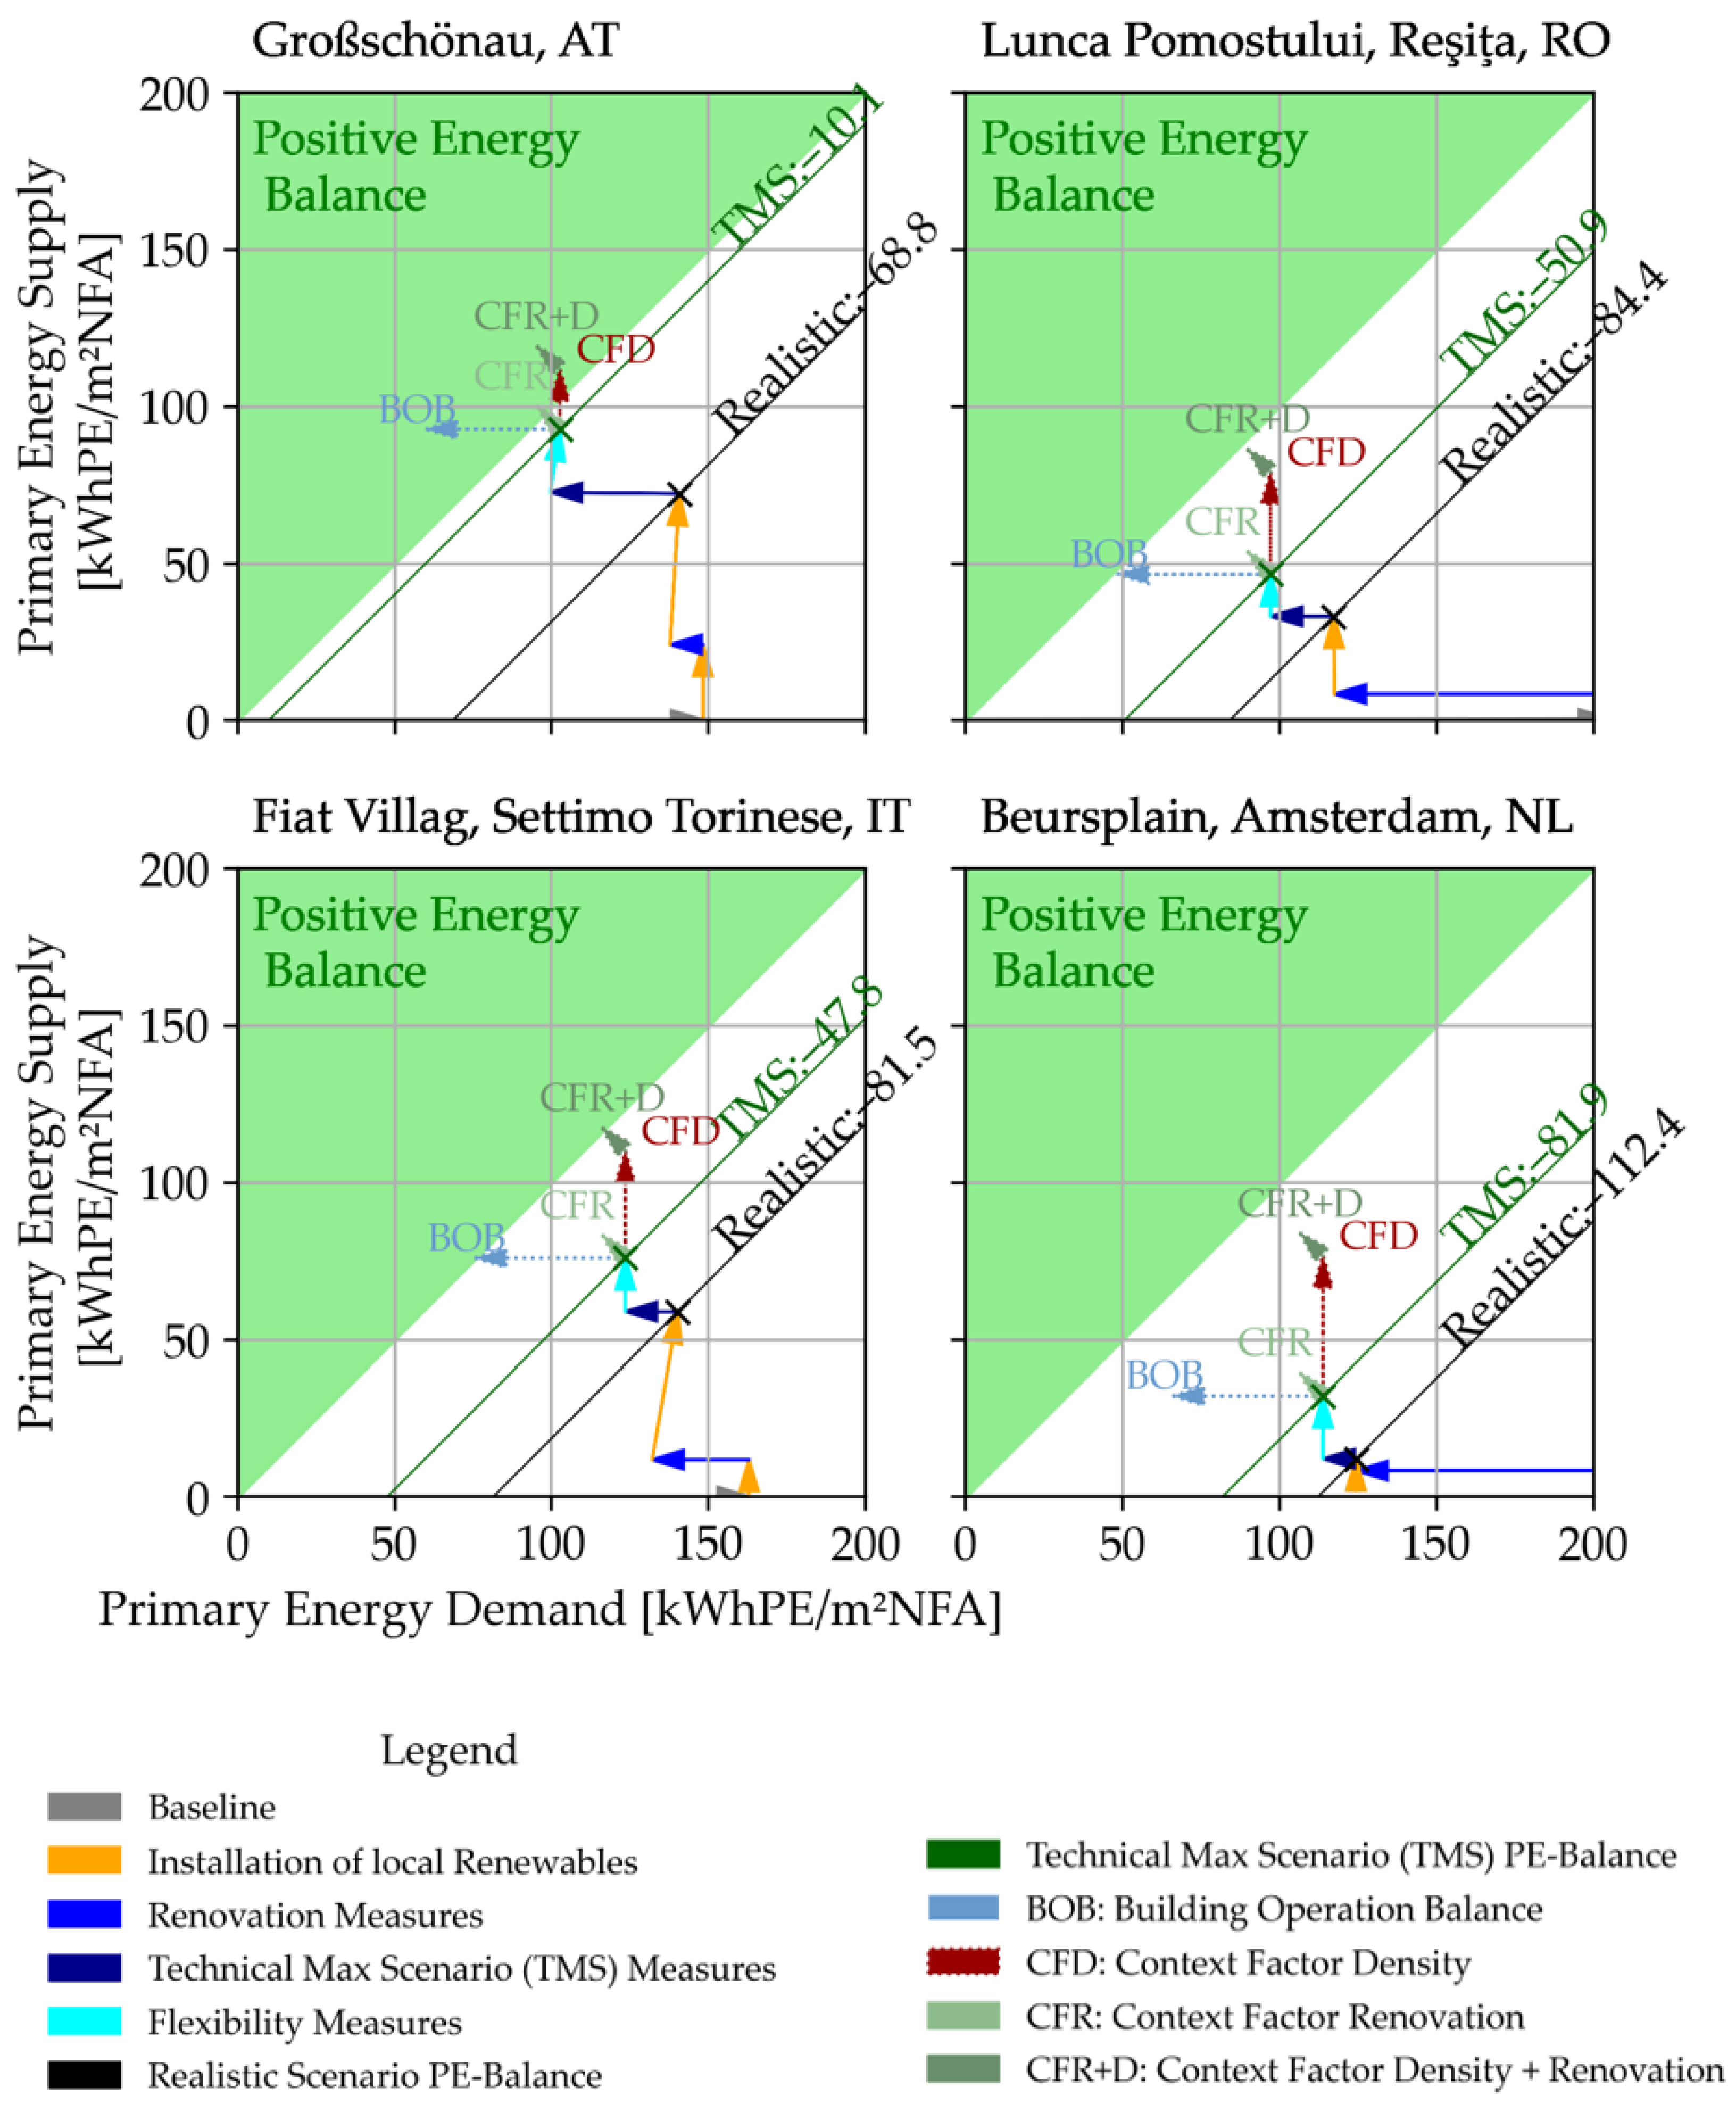
3. Energy Balance Calculation Results

For all the focus districts (FDs) considered, the development scenarios aimed at achieving Positive Energy Districts (PEDs) emphasize two primary strategies: building renovations (including insulating walls, roofs, and basements, as well as replacing windows) and the installation of photovoltaic (PV) panels. In regions with relatively cold climates, such renovations are crucial for minimizing heat loss during winter months. Conversely, in southern regions with high solar irradiation, PV installations are particularly effective, although these areas typically face increased energy demands for cooling during hotter months.
The most effective development scenarios combine a variety of available strategies, such as flexible grid usage and the integration of renewable energy technologies. Since primary energy is a critical factor in assessing PEDs, the effectiveness of these scenarios can be illustrated through a comparison of primary energy demand and supply, as shown in Figure 3.
The dashed grey line in Figure 3 indicates the balance point, where energy demand equals supply—this represents the baseline requirement in the conventional definition of PEDs.
However, achieving a comprehensive understanding of PEDs also necessitates considering contextual factors [12].
In Figure 3, the blue line depicts PED pathways that do not account for these contextual factors, while the orange line illustrates pathways that include such considerations. The scenarios progress from the current state (represented by the rightmost points) through various stages, including the following
  • Building renovation: initial energy efficiency improvements;
  • Renovation with PV installation: increasing the integration of PV systems within districts;
  • Implementation of flexible grid systems: enhancing management and distribution of energy.
  • Adoption of all measures: combining renovations, PV installations, flexible grid systems, and more efficient energy equipment in the focus districts (represented by the leftmost points).
By considering these development scenarios, we can better understand the pathways toward achieving PEDs in diverse urban contexts.

4. Discussion on Further Improvement Areas of FDs Towards PEDs

In this research, focus districts were considered at the PED level of building operation and used to minimize complexity and uncertainty related to initial data. Several potential improvements could enhance the study’s outcomes, including the following:
  • Integrating a photovoltaic-thermal (PVT) simulation model to better align district goals with PED standards;
  • Elevating the focus of the study to PED Mobility levels;
  • Evaluating demand-side actions by residents to reduce energy consumption and carbon footprints within the districts.

4.1. Improvement of Simulation Results by Integrating PV/PVT Model in PED

One way to enhance the energy balance calculation within the focus districts is to utilize a more detailed model that accounts for various scenarios incorporating photovoltaic (PV) systems. In this work, we specifically compare photovoltaic-thermal (PVT) systems with conventional photovoltaic (PV) and solar thermal (ST) systems. While a PV module generates electricity, an ST module produces heat. In contrast, a PVT system integrates both PV and ST functionalities into a single unit, allowing for the simultaneous production of electricity and heat.
The modelling of these systems is grounded in energy conservation principles and considers heat exchanges—conductive, convective, and radiative—across each collector component. Several assumptions are made, including neglecting pressure losses, edge losses, dust, and partial shading. Additionally, we assume uniform temperature across components, with the thermo-physical properties of materials treated as temperature independent. Each collector area is approximately 2 m2. To simplify annual simulations across the district, we apply a rapid and efficient reduced temperature Tred approach [15], obtaining unique coefficients by solving ordinary differential equations (ODEs), and these highly detailed models are integrated into the PVMD Toolbox [16]:
T r e d = T i n T a m G ,
This approach characterizes the thermal and electrical performance of the system as functions of operational conditions, which include fluid inlet temperature (Tin), ambient temperature (Tam), and solar radiation (G). The reduced temperature also influences the efficiency of photovoltaic (PV) systems, as cell temperature is dependent on operating conditions; however, this impact on overall PV performance is minimal. The thermal efficiency of the solar thermal (ST) collector, considering unique coefficients, can be expressed as follows:
η t h = 0.75     3.67   T r e d
Similarly, the electrical and thermal efficiencies of the photovoltaic-thermal (PVT) collector are based on the PVMD Toolbox [16] calculated as follows:
η e l = 0.195 0.33 T r e d ,
η t h = 0.47 10 T r e d
These equations define the efficiencies of the solar collectors, considering several operational parameters, including baseline efficiency and temperature-dependent loss coefficients. Both electrical and thermal efficiencies are calculated on an hourly basis, which allows us to estimate the electrical and thermal yield of each collector type effectively.
To evaluate the potential for large-scale implementation of PVT systems, we applied this modelling approach to the Dutch focus district, the city centre of Amsterdam. We utilized openly available height data [17], processed as a rasterized digital elevation model (DEM) with a resolution of 0.5 metres. The footprint data from the cadastre [18] were used to clip the data points corresponding to each building within their respective polygon shapes.
Subsequently, we employed the Random Sample Consensus (RANSAC) algorithm [19] to detect suitable planar surfaces of at least 10 m². The layout of modules on these surfaces was optimized using a heuristic algorithm designed to fit them in rectangular formations on sloped rooftops [20], utilizing both portrait and landscape orientations. For flat rooftops, a maximum fit strategy was used, along with a simple economic model that determined whether an east–west or south-facing layout was more beneficial. If a building hosted at least four modules, our skyline-based approach [21] was implemented to estimate solar irradiance as an hourly profile spanning an average year. The required climate data were procured from the Royal Netherlands Meteorological Institute (KNMI) [22] over the past ten years.

4.1.1. Key Results

  • Buildings and footprint: There are a total of 16,452 buildings in the focus district, encompassing a combined footprint area of 2.76 km2. This area is further divided into the following:
    o
    1.09 km2 detected as flat surfaces;
    o
    1.17 km2 categorized as sloped rooftops.
  • Module installation potential: on these surfaces, it is feasible to install 333,145 modules across 11,300 separate systems.
Furthermore, Table 2 presents the results of the geospatial mapping of PV, PVT, and ST modules throughout the focus district.

4.1.2. Energy Yield Comparison

  • Photovoltaic modules: yield only electricity, with no thermal yield;
  • Solar thermal modules: yield only heat, with no electrical yield;
  • PVT systems: achieve a combined total yield of 359.4 GWh/year, translating to 130 kWh/year/m2 when divided by the building footprint area.
While the thermal yield of PVT systems is lower than that of ST systems, which generate a specific yield of 164 kWh/year/m2, PVT systems are often the most efficient approach for roofs in terms of energy generation.

4.2. Assessing Mobility in PED

To assess the electricity demand for private e-mobility within the Positive Energy District (PED), we developed a simulation model based on the parking-based approach described in the Horizon Europe INCIT-EV Project [23]. This model estimates both the overall annual energy demand and the temporal distribution of energy requests throughout the year [24].
The parking-based approach focuses on understanding drivers’ habits and behaviours, particularly the timing and duration of parking. Notably, this method does not require knowledge of the origin-destination trip matrix; instead, it emphasizes modelling parking and charging patterns to determine energy demand.

4.2.1. Model Inputs

The model utilizes three main categories of inputs:
  • Car fleet characteristics:
    o
    Average number of electric vehicles (EVs) travelling within the PED (internal), originating from the PED (outgoing), and heading into the PED (incoming) each day;
    o
    Typical daily travel distances.
  • Driver behaviour:
    o
    Preferred times and locations for charging;
    o
    State of charge (SOC) thresholds that trigger a charging event (initial SOC) and stop the charging operation (final SOC);
    o
    These behaviours are represented in the model using probability distributions.
  • Charging infrastructure:
    o
    Number and power of charging points available within the district;
    o
    Temperature data can also be incorporated to account for variations in energy consumption due to seasonal temperature changes, which affect battery efficiency.
Once the inputs are defined, the model runs an hourly simulation for one entire year, processing each vehicle sequentially. Daily average values are used for all days of the year. It evaluates charging decisions based on the vehicle’s current SOC, its travel or parked status, and the availability of charging stations. When all charging requirements are met, the vehicle’s status changes to “charging,” and its energy demand is added to the current timestep and cumulative annual demand.

4.2.2. Model Outputs

The outputs of the model include the following:
  • Maximum power demand: the peak power demand on the local electricity grid and the specific time it occurs;
  • Total annual energy demand: this provides essential insights regarding the additional energy supply requirements needed to meet district-wide demand;
  • The model also tracks disservice events where charging requests cannot be fulfilled due to all stations being occupied.
As an example, we present the results of the simulation conducted for the focus district in Settimo Torinese (Italy), illustrated in Figure 4. The results are shown monthly to highlight potential annual patterns in energy demand.

4.2.3. Findings

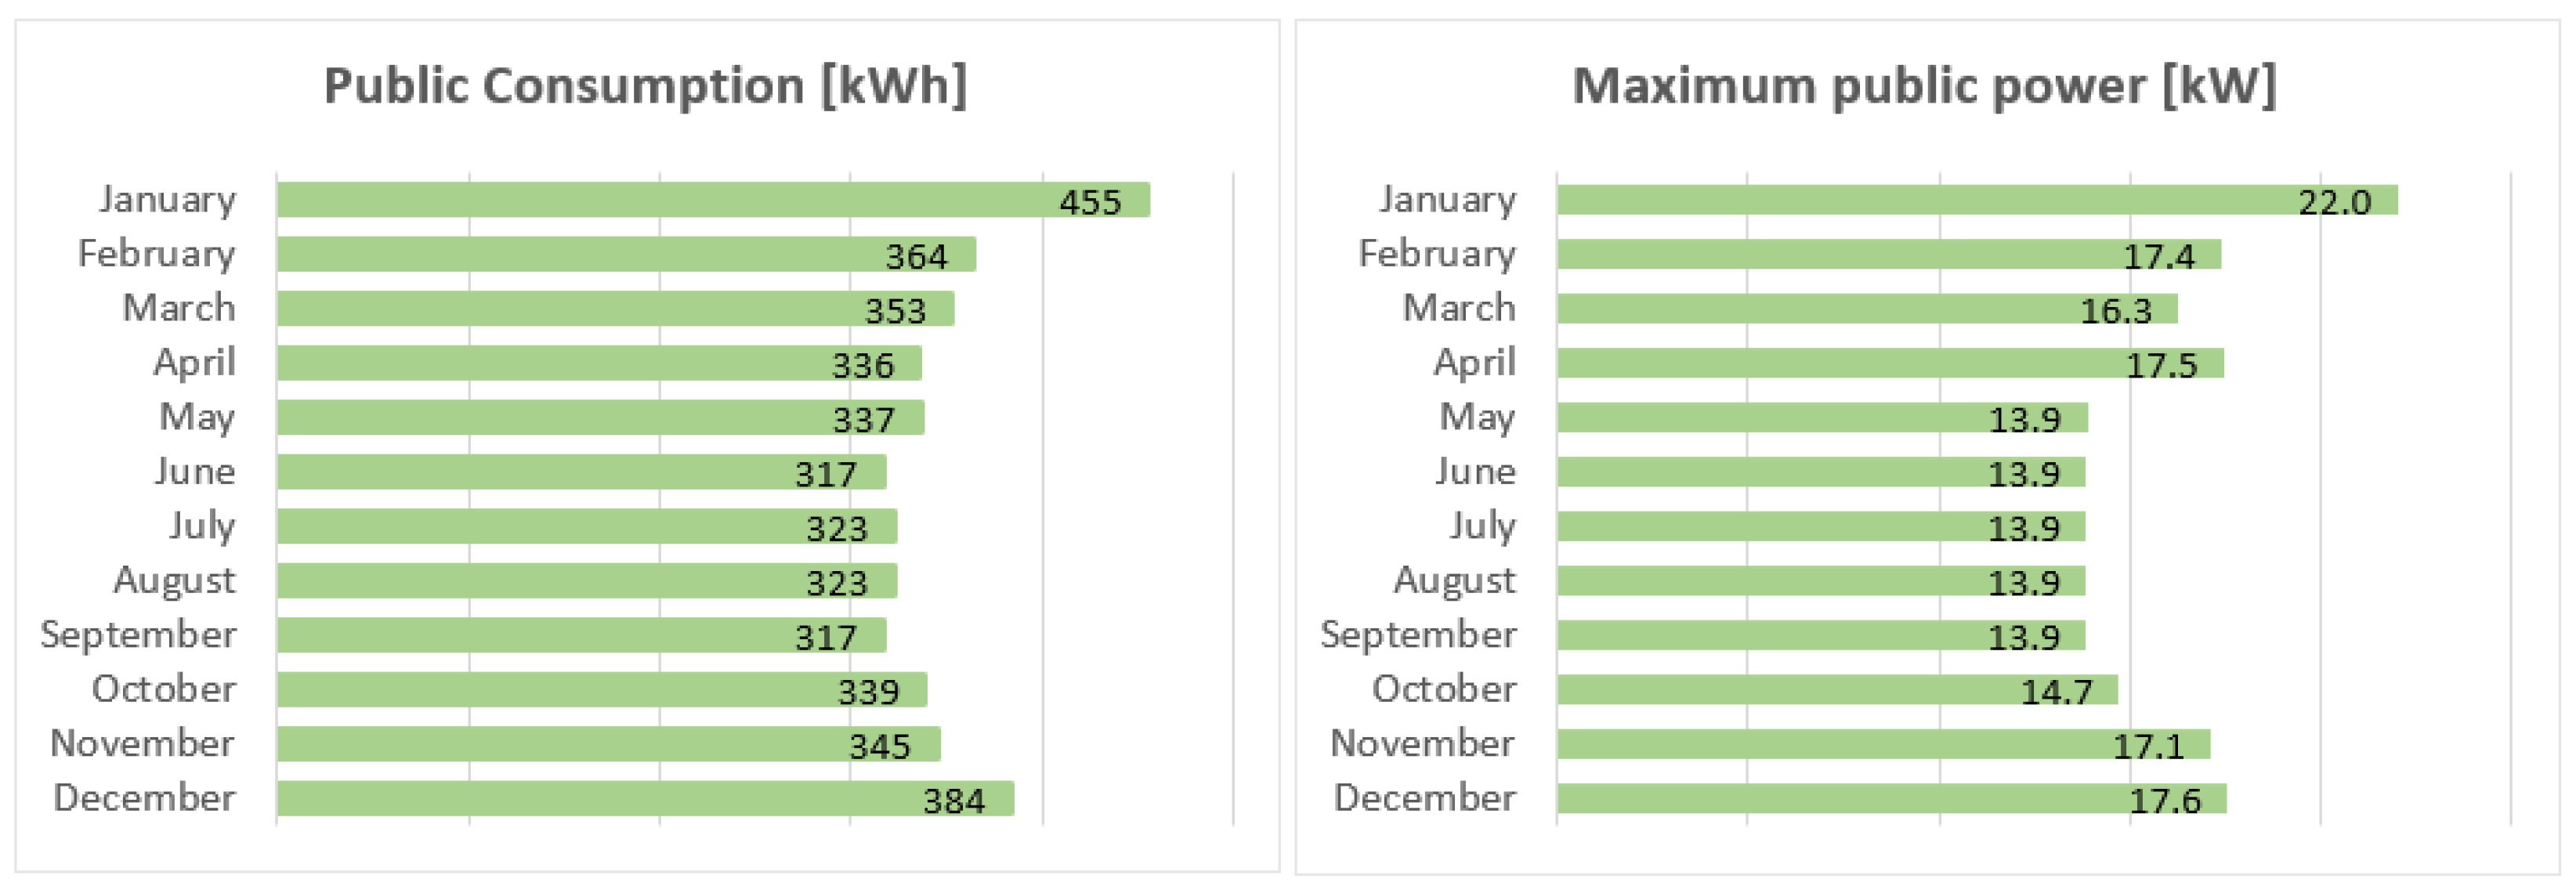
  • Seasonal trends: Winter months exhibit higher consumption due to reduced battery efficiency in cold temperatures. On average, the energy required monthly is approximately 400 kWh, comparable to the consumption of two average Italian-sized families [25].
  • Maximum power: The maximum power requested from the grid is 22 kW, which the current infrastructure can easily accommodate. No disservice events were recorded, indicating that the existing charging infrastructure meets demand effectively.
These results were instrumental in completing the energy balance for the focus district of Settimo Torinese, providing a more comprehensive overview of total energy consumption.

4.3. Demand-Side Actions of Residents

Demand-side actions by residents—such as behavioural changes and the adoption of sustainable technologies—are essential components in the transition towards a PED. A study conducted in the SIMPLY Positive project evaluates the potential for energy and greenhouse gas (GHG) reductions through resident-driven actions within the Focus District of Großschönau, Austria [26].
Utilizing both qualitative and quantitative methods, the study identified and ranked scalable actions that contribute to district-wide energy reduction and provide insights for urban energy planning. Data on energy usage patterns were collected through household interviews, examining factors such as heating methods, appliance usage, and mobility practices. Subsequently, energy consumption data and GHG emission metrics were analyzed, and buildings were sorted based on Austrian typology [27], to quantify the saving potential.
The following Table 3 ranks best-practice examples by replication potential, which were identified as the most effective ones, considering the district-wide energy-saving potential.

4.3.1. Key Findings

The analysis reveals that significant district-wide energy reductions can be achieved through several key measures, including the following:
  • Thermal renovation: Upgrading building insulation and installing energy-efficient windows and doors can dramatically reduce heating and cooling needs. For instance, a thermal renovation case in Großschönau has been shown to decrease energy consumption by over 50%, reducing the energy index from 119 kWh/m2a to 56 kWh/m2a. With approximately 111 buildings identified as suitable candidates for renovation, district-wide implementation could result in annual savings of up to 3400 MWh [28];
  • Transition to electric vehicles: Replacing combustion-engine vehicles with electric cars is one of the most effective strategies for reducing GHG emissions in the transportation sector. The study found that a typical household could save about 7 MWh and 3 tons of CO2 equivalents per year by switching to an electric vehicle powered by renewable energy. Scaling this across all inhabitants in Großschönau could yield annual savings of about 420 MWh and 174 tons of CO2 equivalents;
  • E-bike and carpooling initiatives: Encouraging residents to shift from personal vehicles to e-bikes or carpooling can significantly reduce energy consumption and emissions. For example, regular carpooling can save around 6 MWh annually, while covering a daily commute of 16 km on an e-bike instead of using a combustion vehicle could save approximately 350 MWh and 110 tons of CO2 equivalents per year [29,30]. These actions not only support environmental goals but also provide health benefits and reduced transportation costs for residents.

4.3.2. Best-Practice Examples

The following measures were identified as having the highest potential for replication and impact on district-wide energy savings (see Table 3 for details):
  • Thermal renovations;
  • Conversion from combustible cars to electric cars;
  • Conversion to e-bikes and carpooling.
A final ranking provides a roadmap for scalable and impactful strategies that balance environmental gains with ease of implementation. Some actions, which require minimal technical intervention, can be readily adopted by most residents and still significantly impact the district’s energy balance. By increasing awareness of energy usage and identifying inefficient appliances or consumption patterns, residents can make sustainable choices without substantial financial burden [30].
These findings provide a replicable framework for other districts aiming to achieve PED status, serving as a decision-support tool for public incentives and awareness-raising measures.

4.4. Integrating the SECAP Methodology to Trigger PEDs Within a City

Given the complexity surrounding the development of Positive Energy Districts (PEDs), we developed a guideline offering a framework for potential developers, including municipalities and private sector entities, focused on leveraging the Sustainable Energy and Climate Action Plan (SECAP) methodology [31]. The guideline emphasizes synergies and interoperability between the two processes, concentrating on shared principles, compatible frameworks, common data management, and specific integration points.
The guideline was developed by identifying SECAP steps that facilitate the operationalization of PEDs during the creation of the SECAP within the focus district in Reşiţa, Romania. Key elements common to both SECAP and PED processes were determined for effective planning and monitoring of PEDs, aligned with the PED framework and key performance indicators.
A fundamental premise of these guidelines is that an SECAP should be initiated prior to PED development, as PEDs typically represent neighbourhoods within cities where the spatial boundaries of SECAPs may extend beyond those of individual PEDs.
As PED development does not lend itself to a rigid standardized approach, these guidelines provide users with a structured framework that can serve as a foundation for personalized PED development and operationalization. The framework is presented in four main phases:
  • Initiation phase
    • Political commitment: securing the backing of political leaders to foster support for PED initiatives;
    • Mobilizing relevant stakeholders: engaging all key players, including residents, businesses, and civic organizations, to ensure comprehensive participation;
    • Building support: gaining momentum and endorsement from stakeholders to facilitate the project.
  • Planning phase
    • Framework setting: establishing the context and guidelines for PED operationalization;
    • Documenting policy synergies: identifying and aligning existing policies that complement PED objectives;
    • Elaboration of a PED action plan: developing a detailed strategy to implement and achieve PED goals.
  • Implementation phase
This phase integrates all planning efforts into actionable steps, ensuring that strategies are executed effectively.
4.
Monitoring phase
Implementing monitoring processes to track progress toward objectives and assess the effectiveness of implemented actions.
Although some SECAP elements may not apply directly to the development and establishment of PEDs, the maturity of the SECAP methodology has effectively supported municipal decarbonization planning throughout Europe for over a decade. Furthermore, these guidelines reference the SIMPLY Positive deliverables, which offer practical approaches for defining PEDs, operational scenarios, energy balances, key performance indicators, and project monitoring.
By synthesizing the SECAP methodology, as applied in the focus district in Reşiţa, and the insights from the SIMPLY Positive project, the “Guidelines on How to Use the SECAP Methodology to Trigger Flagship Positive Energy Districts Within a City” are expected to significantly aid developers in their PED operationalization processes.

5. Conclusions

This study underscores the critical role of Positive Energy Districts (PEDs) in fostering sustainable urban environments. Through an analysis of energy balance calculations across four diverse case studies—Settimo Torinese, Großschönau, Amsterdam, and Reşiţa—this research highlights the adaptability and efficacy of tailored strategies across various urban and climatic contexts. Key findings include the following:
  • Significant potential for positive energy balances: despite variations in infrastructure age, climate, and urban density, all focus districts demonstrated substantial potential to achieve positive energy balances through targeted interventions, including the integration of renewable energy sources;
  • Scalable methodologies: The structured framework—with three expanding functional system boundaries—provides a scalable approach to addressing increasing complexities, from operational energy management to embodied emissions. This framework ensures that solutions remain feasible and impactful over the long term.
  • Innovative technologies: innovative solutions such as photovoltaic-thermal (PVT) systems have shown effectiveness in optimizing rooftop utilization by producing both electrical and thermal energy, thus meeting diverse energy needs.
  • Community engagement: active community involvement and enhancements in e-mobility contribute significantly to energy efficiency and emissions reduction, highlighting the essential role of resident engagement and behavioural change in the success of PEDs.
The findings also emphasize the replicability of the proposed methodologies, presenting a robust framework for other cities aspiring to establish their own PEDs. Comprehensive energy simulations, collaborative planning, and adaptive measures are crucial to the successful implementation of these districts.
This research can serve as a valuable resource for policymakers, urban planners, and stakeholders focused on developing sustainable, resilient, and energy-positive communities. Future work should prioritize the integration of emerging technologies and advanced simulation techniques to refine the design and functionality of PEDs.

6. Future Work

Future research should focus on the integration of emerging technologies and advanced simulation techniques to enhance the design and functionality of Positive Energy Districts (PEDs). This includes exploring the potential of smart grid technology to optimize energy distribution and consumption, as well as incorporating energy storage solutions to manage supply and demand fluctuations effectively. Additionally, investigating the role of advanced data analytics and machine learning can provide deeper insights into resident behaviours and energy usage patterns, leading to more personalized and effective demand-side management strategies. Expanding the scope of case studies to include a wider range of urban contexts and geographical settings will also allow for a comprehensive understanding of how different factors—such as socio-economic conditions and local policies—impact the implementation and success of PEDs. By focusing on these areas, future work can build a more resilient framework for urban energy planning and foster broader adoption of sustainable practices in cities worldwide.

Author Contributions

Conceptualization, H.B. and S.A.; methodology of energy balance calculation, S.S.; methodology of PV/PVT calculation, Z.U.A., R.S., M.V., M.Z. and O.I.; methodology mobility calculation M.P. and C.B.; methodology of demand-side evaluation, H.B. and M.B.; methodology SECAP applying, A.S.; investigation of PED energy balance, S.A. and S.S.; investigation of PV/PVT, Z.U.A., R.S., M.V., M.Z. and O.I.; investigation of mobility, M.P. and C.B.; investigation of demand-side actions, H.B. and M.B.; writing—original draft preparation, S.A.; writing—review and editing, H.B., S.S., M.B., Z.U.A., R.S., M.V., M.Z., O.I., A.S., M.P. and C.B; project administration, H.B. All authors have read and agreed to the published version of the manuscript.

Funding

This project has been developed in the framework of the PED Program, which is implemented by the Joint Programming Initiative Urban Europe and SET Plan Action 3.2. The Austrian part is supported by the Austrian Ministry of Climate Action, Environment, Energy, Mobility, Innovation, and Technology (BMK); the Romanian part is supported by a grant of the Ministry of Research, Innovation and Digitization CNCS/CCCDI—UEFISCDI, project number PED-JPI-SIMPLY POSITIVE, contracts number 325/2022 and 326/2022, within PNCDI III; the Dutch part is supported by the RVO (the Netherlands Enterprise Agency), reference number ERANETPED-02767306; and the Italian part is supported by a grant of the Ministry of Education and Merit—Department for Higher Education and Research, project number PED_00042, from the Fund for Investment in Scientific and Technological Research (FIRST/FAR) and/or Special Accounting Account no. 5944.

Data Availability Statement

The original contributions presented in this study are included in the article. Further inquiries can be directed to the corresponding author.

Conflicts of Interest

Author Mr.Helmut Bruckner was employed by the company Sonnenplatz Großschönau GmbH, 3922 Großschönau, Austria. The remaining authors declare that the research was conducted in the absence of any commercial or financial relationships that could be construed as a potential conflict of interest.

References

  1. SETIS. p. I: SET-Plan ACTION n°3.2 Implementation Plan. Europe to Become a Global Role Model in Integrated, Innovative Solutions for the Planning, Deployment, and Replication of Positive Energy Districts. June 2018. Available online: https://setis.ec.europa.eu/system/files/2021-04/setplan_smartcities_implementationplan.pdf (accessed on 22 November 2024).
  2. SET Plan. p 71ff: SET Plan Progress Report 2024, Scaling up Research, Innovation and Competitiveness in Clean Energy Technologies, Implementing Positive Energy Districts. 2024. Available online: https://setis.ec.europa.eu/set-plan-progress-report-2024_en (accessed on 10 January 2025).
  3. Khalid, M. Smart grids and renewable energy systems: Perspectives and grid integration challenges. Energy Strat. Rev. 2024, 51, 101299. [Google Scholar] [CrossRef]
  4. Kataray, T.; Nitesh, B.; Yarram, B.; Sinha, S.; Cuce, E.; Shaik, S.; Vigneshwaran, P.; Roy, A. Integration of smart grid with renewable energy sources: Opportunities and challenges—A comprehensive review. Sustain. Energy Technol. Assess. 2023, 58, 103363. [Google Scholar] [CrossRef]
  5. SIMPLY Positive, 2023–2024, International Research Project, Developed in the Framework of the PED Program, Which Is Implemented by the Joint Programming Initiative Urban Europe and SET Plan Action 3.2. Available online: http://simplypositive.eu/ (accessed on 12 December 2024).
  6. Ayaz, M. No Gas All Local: Developing a Renewable-Based and Decentralised Energy System for the Historic Centre of Amsterdam, Wageningen University & Research—Library. 2022. Available online: https://edepot.wur.nl/633721 (accessed on 10 January 2025).
  7. SET Plan. Increase the Resilience and Security of the Energy System—Implementation Plan; European Commission: Brussels, Belgium, 2018. [Google Scholar]
  8. Sareen, S.; Albert-Seifried, V.; Aelenei, L.; Reda, F.; Etminan, G.; Andreucci, M.-B.; Kuzmic, M.; Maas, N.; Seco, O.; Civiero, P.; et al. Ten questions concerning positive energy districts. Build. Environ. 2022, 216, 109017. [Google Scholar] [CrossRef]
  9. Vandevyvere, H.; Ahlers, D.; Wyckmans, A. The Sense and Non-Sense of PEDs—Feeding Back Practical Experiences of Positive Energy District Demonstrators into the European PED Framework Definition Development Process. Energies 2022, 15, 4491. [Google Scholar] [CrossRef]
  10. Zhang, X.; Penaka, S.R.; Giriraj, S.; Sánchez, M.N.; Civiero, P.; Vandevyvere, H. Characterizing Positive Energy District (PED) through a Preliminary Review of 60 Existing Projects in Europe. Buildings 2021, 11, 318. [Google Scholar] [CrossRef]
  11. Lindholm, O.; Rehman, H.U.; Reda, F. Positioning Positive Energy Districts in European Cities. Buildings 2021, 11, 19. [Google Scholar] [CrossRef]
  12. Schneider, S.; Zelger, T.; Sengl, D.; Baptista, J. A Quantitative Positive Energy District Definition with Contextual Targets. Buildings 2023, 13, 1210. [Google Scholar] [CrossRef]
  13. Albert-Seifried, V.; Murauskaite, L.; Massa, G.; Aelenei, L.; Baer, D.; Krangsås, S.G.; Alpagut, B.; Mutule, A.; Pokorny, N.; Vandevyvere, H. Definitions of Positive Energy Districts: A Review of the Status Quo and Challenges. In Proceedings of the Sustainability in Energy and Buildings 2021, Split, Croatia, 14–16 September 2022; Springer Nature: Singapore, 2022; pp. 493–506. [Google Scholar]
  14. Schneider, S.; Drexel, R.; Zelger, T.; Baptista, J. PEExcel: A fast one-stop-shop Assessment and Simulation framework for Positive Energy Districts. In Proceedings of the BauSim Conference 2024, Vienna, Austria, 23–26 September 2024; IBPSA-Germany and Austria; Volume 10, pp. 80–88. [Google Scholar] [CrossRef]
  15. Ul-Abdin, Z.; Zeman, M.; Isabella, O.; Santbergen, R. Investigating the annual performance of air-based collectors and novel bi-fluid based PV-thermal system. Sol. Energy 2024, 276, 112687. [Google Scholar] [CrossRef]
  16. Vogt, M.; Tobon, C.R.; Alcañiz, A.; Procel, P.; Blom, Y.; El Din, A.N.; Stark, T.; Wang, Z.; Goma, E.G.; Etxebarria, J.; et al. Introducing a comprehensive physics-based modelling framework for tandem and other PV systems. Sol. Energy Mater. Sol. Cells 2022, 247, 111944. [Google Scholar] [CrossRef]
  17. Height Data Retrieved from Algemeen Hoogtebestand Nederland. Available online: https://www.ahn.nl/open-data (accessed on 16 October 2024).
  18. Bag Cadaster Data from Bag Viewer. Available online: https://bagviewer.kadaster.nl/lvbag/bag-viewer/ (accessed on 24 October 2024).
  19. Torr, P.H.S.; Zisserman, A. MLESAC: A New Robust Estimator with Application to Estimating Image Geometry. Comput. Vis. Image Underst. 2000, 78, 138–156. [Google Scholar] [CrossRef]
  20. De Vries, T.N.; Bronkhorst, J.; Vermeer, M.; Donker, J.C.; Briels, S.A.; Ziar, H.; Zeman, M.; Isabella, O. A quick-scan method to assess photovoltaic rooftop potential based on aerial imagery and LiDAR. Sol. Energy 2020, 209, 96–107. [Google Scholar] [CrossRef]
  21. Calcabrini, A.; Ziar, H.; Isabella, O.; Zeman, M. A simplified skyline-based method for estimating the annual solar energy potential in urban environments. Nat. Energy 2019, 4, 206–215. [Google Scholar] [CrossRef]
  22. Climate Data Procured from the Koninklijk Nederlands Meteorologisch Instituut, Ministerie van Infrastructuur en Waterstaat. Available online: https://daggegevens.knmi.nl/klimatologie/uurgegevens (accessed on 15 October 2024).
  23. INCIT-EV Website|Electric Charging Solutions for Electric Vehicles. Available online: https://www.incit-ev.eu/ (accessed on 22 November 2024).
  24. Macaluso, P.; Carboni, A.; Botta, C.; Lazzeroni, P.; Deflorio, F.; Arnone, M. Estimating charging demand by modelling EV drivers’ parking patterns and habits. Eur. Transp.\Trasp. Eur. 2023, 90, 1–14. [Google Scholar] [CrossRef]
  25. Italian Regulatory Authority for Energy. Networks and Environment (ARERA). 2023. Available online: https://www.arera.it/en/comunicati-stampa/dettaglio/elettricita-bolletta-in-tutela-186-nel-quarto-trimestre-contributo-straordinario-per-i-titolari-di-bonus (accessed on 4 November 2024).
  26. Binder, M.; Bruckner, H. D4.4 Demand Side Actions of Residents to Reduce Districts. Available online: http://simplypositive.eu/wp-content/uploads/2024/12/D4.4-Demand-side-actions-of-residents-to-reduce-energy-consumption-and-carbon-footprint-in-focus-districts_final.pdf (accessed on 28 October 2024).
  27. TABULA WebTool. Available online: https://webtool.building-typology.eu/#bm (accessed on 11 July 2024).
  28. Brennwert. Available online: https://www.geothermie.de/bibliothek/lexikon-der-geothermie/b/brennwert (accessed on 1 August 2024).
  29. Berechnung von Treibhausgas (THG)-Emissionen Verschiedener Energieträger. Available online: https://secure.umweltbundesamt.at/co2mon/co2mon.html (accessed on 15 July 2024).
  30. Verordnung des Vorstands der E-Control Über die Voraussetzungen an die Fachliche Qualifizierung und Requalifizierung von Energiedienstleisterinnen und Energiedienstleistern (Energieeffizienz-Qualifikationsbewertungs-Verordnung—EEff-QBV)—BGBI.II Nr. 264/2023. Available online: https://www.ris.bka.gv.at/eli/bgbl/II/2023/264/20230908 (accessed on 19 July 2024).
  31. European Commission: Joint Research Centre; Rivas, S.; Bertoldi, P.; Melica, G.; Dallemand, J.; Palermo, V. Guidebook ’How to Develop a Sustainable Energy and Climate Action Plan (SECAP)’. Part 1, The SECAP Process, Step-by-Step Towards Low Carbon and Climate Resilient Cities by 2030; Bertoldi, P., Ed.; Publications Office: Luxembourg, 2018; Available online: https://data.europa.eu/doi/10.2760/223399 (accessed on 23 January 2025).
Figure 1. Three expanding functional system boundaries of PED: from operation and use (red) to including everyday individual motorized mobility (blue) to also include energy and emissions from construction and maintenance (green).
Energies 18 00560 g001
Figure 2. Applied simulation components of the PED establishment.
Energies 18 00560 g002
Figure 3. Primary energy in focus districts: demand vs. supply with and without accounting for contexts. BOB (blue): building operation balance; CFR (light green): context factor renovation; CFD (red): context factor density; CFR+D (green): combination of CFD and CFR. District scenarios with a final primary energy balance in the green shaded area are considered PEDs in Operation.
Energies 18 00560 g003
Figure 4. Annual public consumption and maximum public power in Fiat Village, Settimo Torinese.
Energies 18 00560 g004
Table 1. Focus district parameters.
ParameterUnitIT, Fiat Village,
Settimo Torinese
AT, GroßschönauNL, Beursplain, AmsterdamRO, Lunca Pomostului Reşiţa
District Areaha19.0705.03.047.0
Population-3200450300 [6]9900
Gross Floor Aream2 GFA213,937401,06098,941130,700
District Buildable Plot Aream2 PA146,000391,00030,035420,859
Floor Area Ratio (FAR)-1.470.153.290.31
Site Coverage Ratio (SCR)%2677818
Net to Gross Floor Area Ratio%80708080
Building Storeys (avg)-5.61.54.24.9
Residential Usage%98.482.219.176.5
Commercial Usage%0.211.729.03.9
Primary School Usage%0.05.00.00.0
Secondary School Usage%0.00.00.09.8
Others (Retail) Usage%1.41.151.99.8
Heating Setpoint°C22222222
Heating COP Heat Pump (Flex)-3.5 (4.5)3.5 (4.5)3.5 (4.5)3.5 (4.5)
Heating Degree Days°C·d4786.03483.13917.93877.8
Cooling Setpoint°C26262626
Cooling COP Heat Pump (Flex)-2.5 (5.0)2.5 (5.0)2.5 (5.0)2.5 (5.0)
Cooling Degree Days°C·d0.46.91.116.4
Primary Energy Conversion FactorsSource[7][8][9][10,11]
Table 2. Results of the geospatial mapping of PV, PVT and ST modules on the focus district.
Module CountNominal Power (MW)Electric
Energy (GWh/yr)
Thermal Energy
(GWh/yr)
Total
Energy (GWh/yr)
PV333,145123.3117.30117.3
ST333,145123.30452.6452.6
PVT333,145123.3121.9237.5359.4
Table 3. Most effective identified demand-side actions by replication potential.
Demand-Side ActionsEnergy Saving Potential for the Whole Focus District [kWh]GHG Saving Potential
Depending on Energy Mix
[kg CO2-Equivalents]
(A) Simple to replicate for everyone and associated with low costs
Energy consultations in residential buildings 135,660n/a
Regular ventilation of radiators129,430n/a
Adapting the room temperature to the usage
and daytime
74,0533566
Reduction in the room temperature by 1 °C68,3042139
Conversion to LED technology55,200683–15,710
(B) Possible under certain circumstances and/or low investment required
Switch to e-bikes for going to work346,090112,020
Carpooling with at least 2 persons341,360110,940
Conversion of street lighting to LED268,755n/a
Correct ventilation of windows and shadowing instead of an air conditioner196,8901970–45,280
Conversion from combustion cars
to public transport
78,00024,540
(C) Costly and/or complex technical adaptation required
Renovate private buildings to passive
house standard
4,060,720n/a
Thermal renovation as performed in reality3,401,460n/a
Renovate public buildings to passive
house standard
529,13295,240
Conversion from combustion cars to electric cars421,231143,900–173,900
Conversion from oil heater to heat pumps247,82311,357–17,232
Disclaimer/Publisher’s Note: The statements, opinions and data contained in all publications are solely those of the individual author(s) and contributor(s) and not of MDPI and/or the editor(s). MDPI and/or the editor(s) disclaim responsibility for any injury to people or property resulting from any ideas, methods, instructions or products referred to in the content.

