Article

Study on the Effect of Mixed-Phase Icing on the Aerodynamic Characteristics of Wind Turbine Airfoil

1
School of Energy and Power Engineering, Nanjing Institute of Technology, Nanjing 211167, China
2
Liaoning Provincial Key Laboratory of Aircraft Ice Protection, AVIC Aerodynamics Research Institute, Shenyang 110034, China
*
Authors to whom correspondence should be addressed.
Energies 2025, 18(3), 559; https://doi.org/10.3390/en18030559
Submission received: 9 December 2024 / Revised: 4 January 2025 / Accepted: 23 January 2025 / Published: 24 January 2025
(This article belongs to the Section A3: Wind, Wave and Tidal Energy)

Abstract

:
Wind turbines operating in high-altitude and cold regions are susceptible to icing phenomenon, which is a serious threat to the power generation efficiency and operational safety. On the basis of the current research on supercooled droplet icing, mixed-phase icing is investigated. Based on icing numerical simulations under mixed-phase conditions, the aerodynamic characteristics of wind turbine airfoils before and after icing are analyzed. The results indicate that as the icing thickness increases, the aerodynamic characteristics of the airfoil gradually deteriorate, with the lift decreasing by 40.2% and the drag increasing by 135.2%. The aerodynamic characteristics of airfoil after icing are analyzed under both glaze and rime ice conditions and compared to those of the clear airfoil. The results show that icing leads to a decrease in the lift coefficient and an increase in the drag coefficient of the airfoil. This deterioration is primarily due to the fact that icing causes premature separation of the airfoil airflow, and icing can cause obstruction at the leading edge, which leads to the formation of local vortices and a decline in aerodynamic performance. The effects of icing on the aerodynamic characteristics of wind turbine airfoils under glaze and rime ice conditions are compared, and the lift-to-drag ratio decreases by 87.9% under the glaze ice condition and by 62.4% under rime ice conditions. The results show that the effects of mixed-phase icing under glaze ice conditions has a more severe impact than under rime ice conditions.

1. Introduction

Wind energy, as a renewable energy source, has garnered significant attention and application. Wind turbines serve as the primary equipment for converting wind energy and are typically installed in areas with abundant wind resources, which often coincide with harsh climatic conditions. The icing problem of wind turbine blades in low-temperature rainy and snowy weather has become a significant challenge for wind power generation [1]. It is crucial to carry out research on wind turbine icing to ensure the reliable operation of wind turbines in cold environments [2,3]. Wind turbine blade icing is generally caused by the impact of supercooled droplets on frozen surfaces [4,5], and mixed-phase icing due to meteorological conditions containing ice crystals is an emerging problem faced by wind turbines.
Ice crystals are a common meteorological phenomenon found in strongly convective clouds, typically located in the upper part of these clouds. When warm and humid air rises rapidly within such clouds, water vapor cools quickly and condenses into tiny ice crystals. The icing issues faced by wind turbine blades under mixed-phase conditions, which include ice crystal icing, differ significantly from conventional supercooled droplet icing. This distinction is particularly evident in the movement and impact processes of ice crystals [6], as well as in phase transition processes [7]. The main difference between ice crystal icing and conventional droplet icing is that the ice crystal content and diameter are larger than those of supercooled droplets, resulting in a larger impact area and impact amount [8,9]. The physical process of ice crystal impact is related to the surface state. Ice crystals do not freeze on dry surfaces, while the impact of wet surface will produce adhesion, freezing, erosion and other phenomena [10]. At the same time, ice crystals lead to a greater range and amount of icing on the surface, so ice crystal icing is more complex [11]. Consequently, research on wind turbine icing under mixed-phase conditions cannot be conducted using the traditional icing method [12]. Icing can lead to a reduction in lift and an increase in drag of wind turbine airfoil, affecting power generation efficiency. Ice crystal impact and melting will obviously have adverse effects on the performance of anti-icing systems [13]. Quantitative evaluation of the effect of mixed-phase icing on the aerodynamic performance of wind turbines is still rare. Therefore, research related to the icing problem under mixed-phase conditions is particularly complex and important.
Currently, researchers have conducted both theoretical and applied research in the field of mixed-phase icing. Al Khalil et al. [14] performed icing wind tunnel experiments under various mixed-phase conditions and observed both glaze ice and rime ice during the experiments. Currie et al. [15,16,17] melted ice crystal particles during their movement by mixing hot air in an experiment, and the melted ice crystal particles collided with the test piece and froze. Struk et al. [18] carried out icing wind tunnel experiments on NACA 0012 airfoils and analyzed the results to determine the minimum melting rate at which ice crystals freeze. Baumert et al. [19] carried out icing wind tunnel experiments using cylinders and airfoils as experimental subjects and obtained experimental results under different ice crystal contents and supercooled droplet contents. Trontin et al. [20,21] developed a numerical simulation method for ice crystal freezing and established a mathematical model for ice crystal erosion, taking into account the influence of liquid water on the freezing process. Niladdeen et al. [22] considered the physical processes of ice crystal impacts on various surfaces in mixed-phase icing numerical simulations and established corresponding mathematical models. Bucknell et al. [23] proposed a mixed-phase icing model that incorporates multi-layer structures, including water film flow, ice crystals, and supercooled droplets. Malik et al. [24,25] carried out icing experiments after ice crystals impacted a heated surface in an icing wind tunnel and observed the physical processes of surface icing under different heating conditions [26]. Norde [27] proposed a mixed-phase icing model based on the energy term of sensible heat representation, which ignores the latent heat of unmelted ice crystals and simplifies the calculation of convective heat transfer. Zhang et al. [28] calculated the trajectories of ice crystals using the Eulerian method based on the secondary development of Fluent and investigated mixed-phase icing based on the extended Messinger model. Jia et al. [29] simulated the heat and mass transfer processes of ice crystals in the engine intake duct and analyzed the melting phenomenon of ice crystals. The current research primarily focuses on mixed-phase icing, and there is still relatively limited analysis of the aerodynamic characteristics after icing. After icing, the geometry of wind turbine airfoil is changed, which affects the pressure distribution around the wind turbine airfoil and the surrounding flow field, resulting in a decrease in the lift coefficient, an increase in the drag coefficient, and a deterioration in the aerodynamic characteristics of the airfoil. The changes in aerodynamic characteristics of the airfoil can lead to a decrease in the output power and energy generation of wind turbines, which seriously affects the economic efficiency of wind turbines. Therefore, studying the effect of icing on the aerodynamic characteristics of wind turbine airfoil under mixed-phase conditions is essential for understanding the reasons behind the reduction in aerodynamic performance and for assessing the associated icing hazards. Many scholars have conducted research on wind turbine icing and physical phenomena under supercooled droplet conditions. However, numerical simulations of wind turbine icing for mixed-phase conditions are still rare. The variation in aerodynamic characteristics of wind turbine airfoils under mixed-phase conditions is similarly less studied. Currently, there is no quantitative access to the changes in aerodynamic characteristics of wind turbine airfoils under mixed-phase conditions. Therefore, the research content of this paper is relevant and very important in wind turbine design.
Based on the previous research [30] on mixed-phase icing, the effect of icing on the aerodynamic characteristics of wind turbine airfoils under mixed-phase conditions is mainly investigated. Based on the icing numerical simulation under mixed-phase conditions, the shape of wind turbine airfoil after icing is obtained. The effect of icing growth on the aerodynamic characteristics with the increase in icing time is analyzed, and the trend of aerodynamic characteristics with icing growth is obtained. Additionally, the aerodynamic characteristics of iced airfoils are investigated at different angles of attack under typical conditions, and the aerodynamic characteristics of clean and iced airfoils are compared. The effects of glaze ice and rime ice on the wind turbine airfoil are compared, which can reasonably reflect the effects of different mixed-phase icing on aerodynamic characteristics and provide support for wind turbine anti-deicing research.

2. Numerical Simulation Methods

The DU airfoils are the most widely used wind turbine blade airfoils at present, and numerous researchers have carried out extensive experimental and numerical simulation studies on this series of airfoils. In this paper, the DU 97-W-300 airfoil is selected as the research subject for numerical simulation of icing under mixed-phase conditions. The icing numerical simulation process mainly includes grid generation, flow field calculation, particle trajectory calculation and ice accretion calculation.

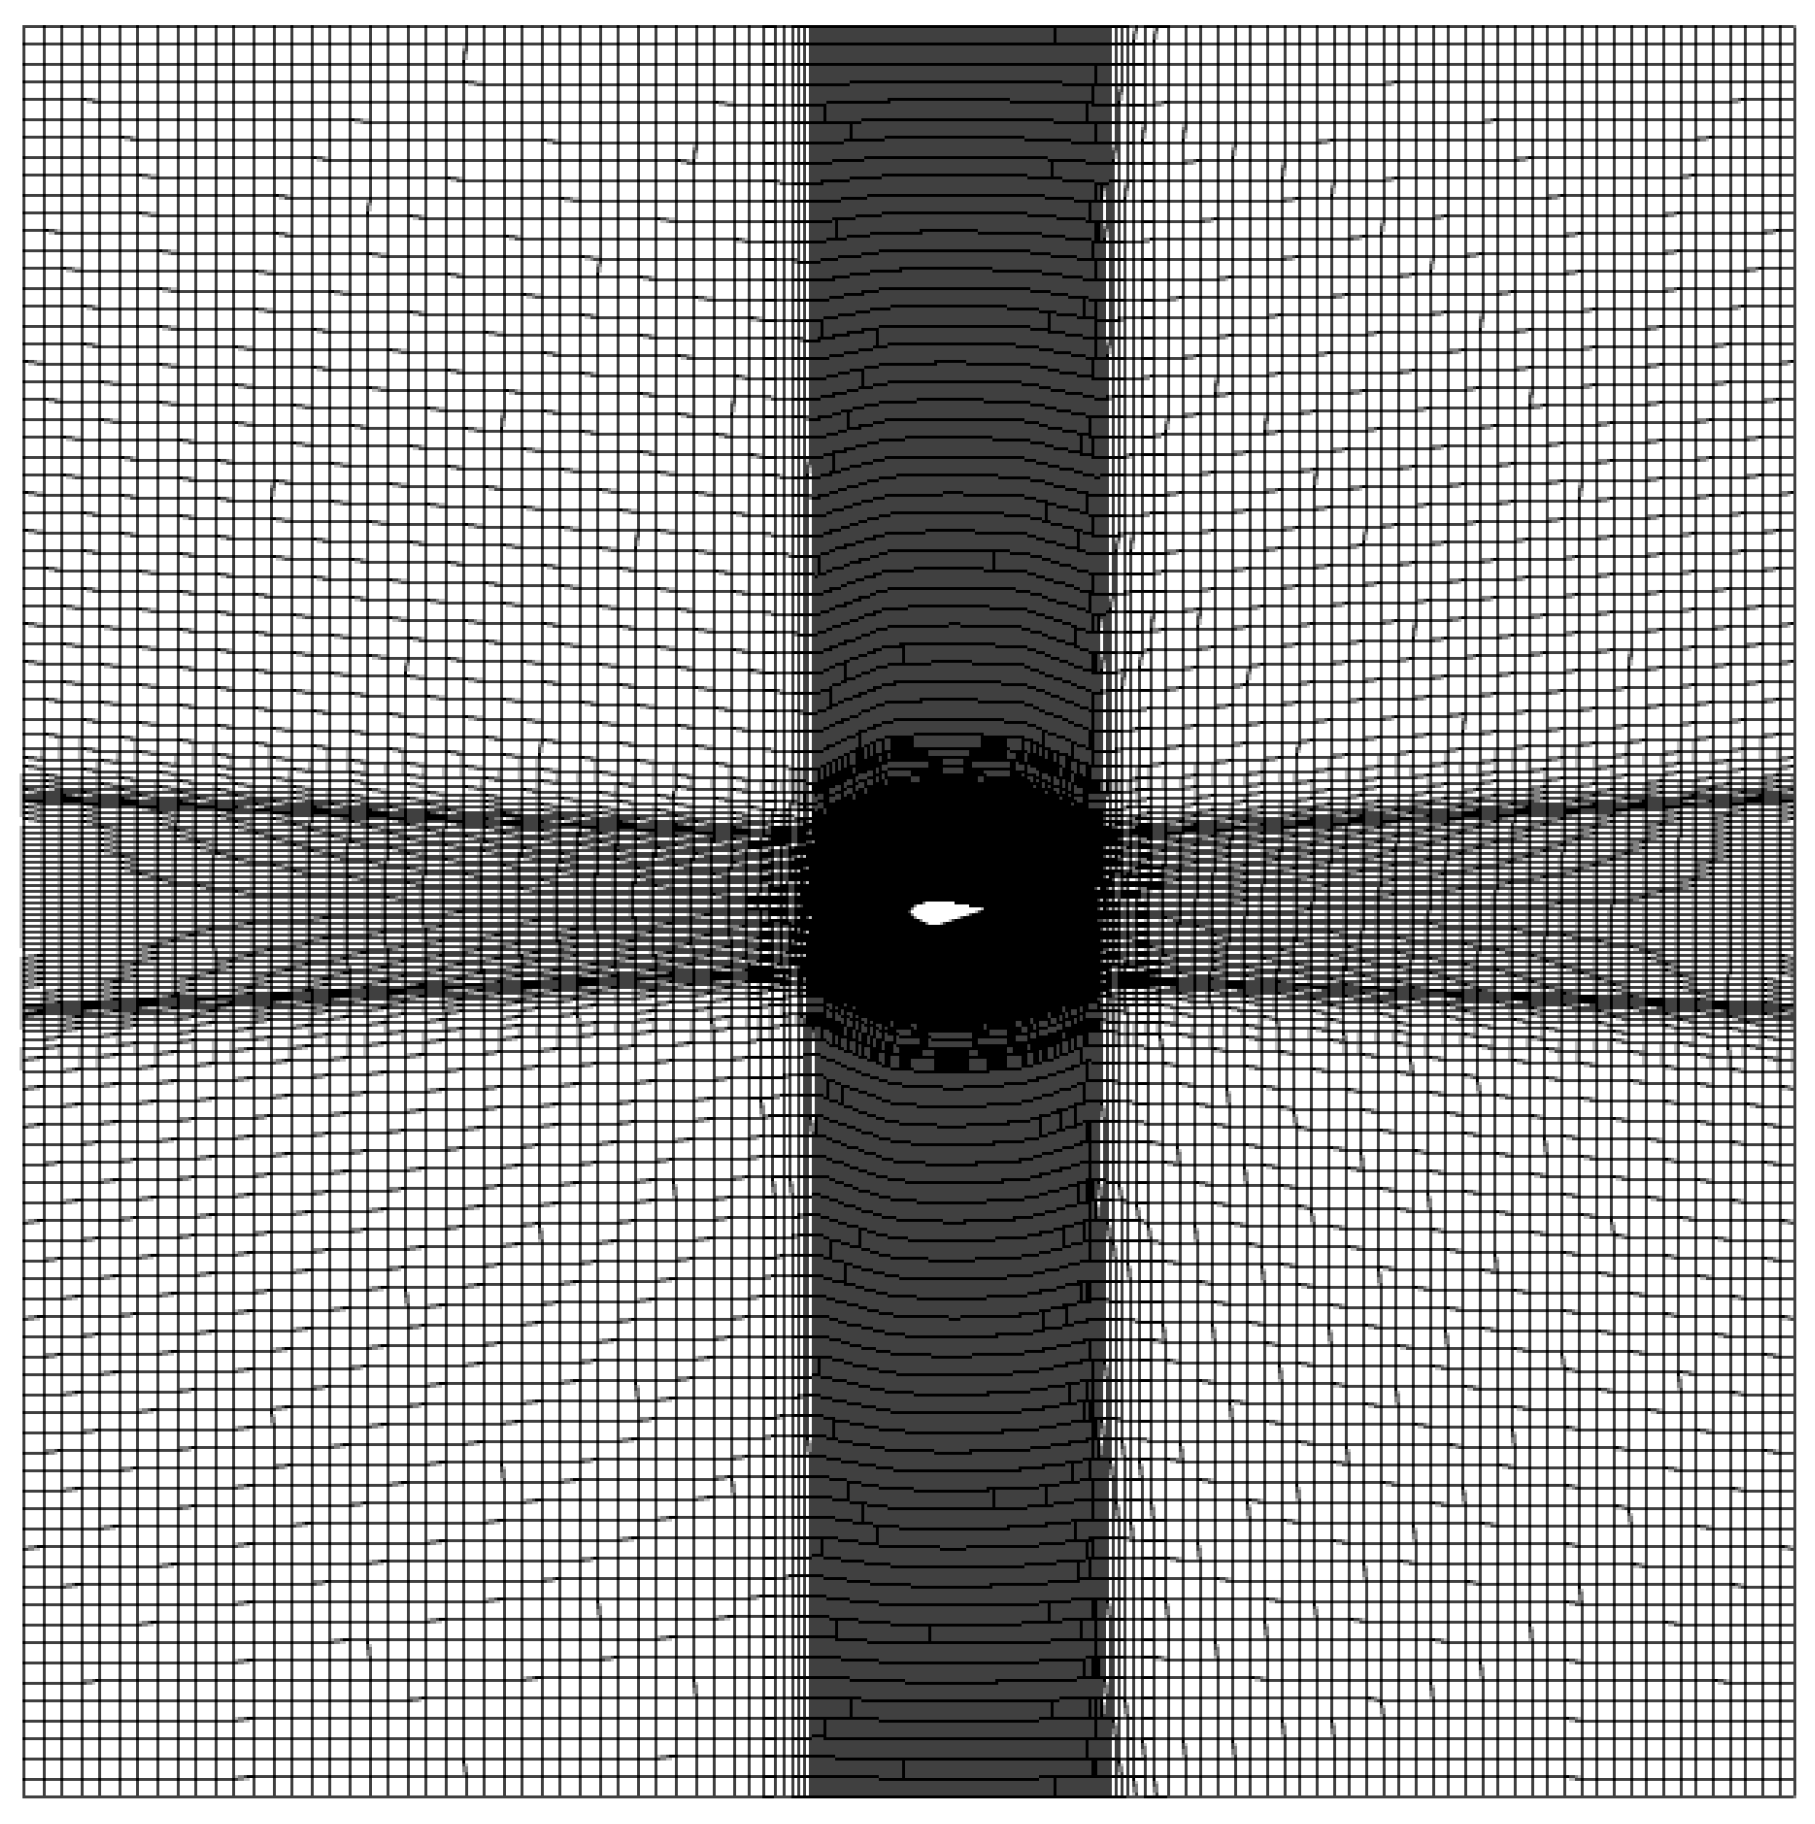
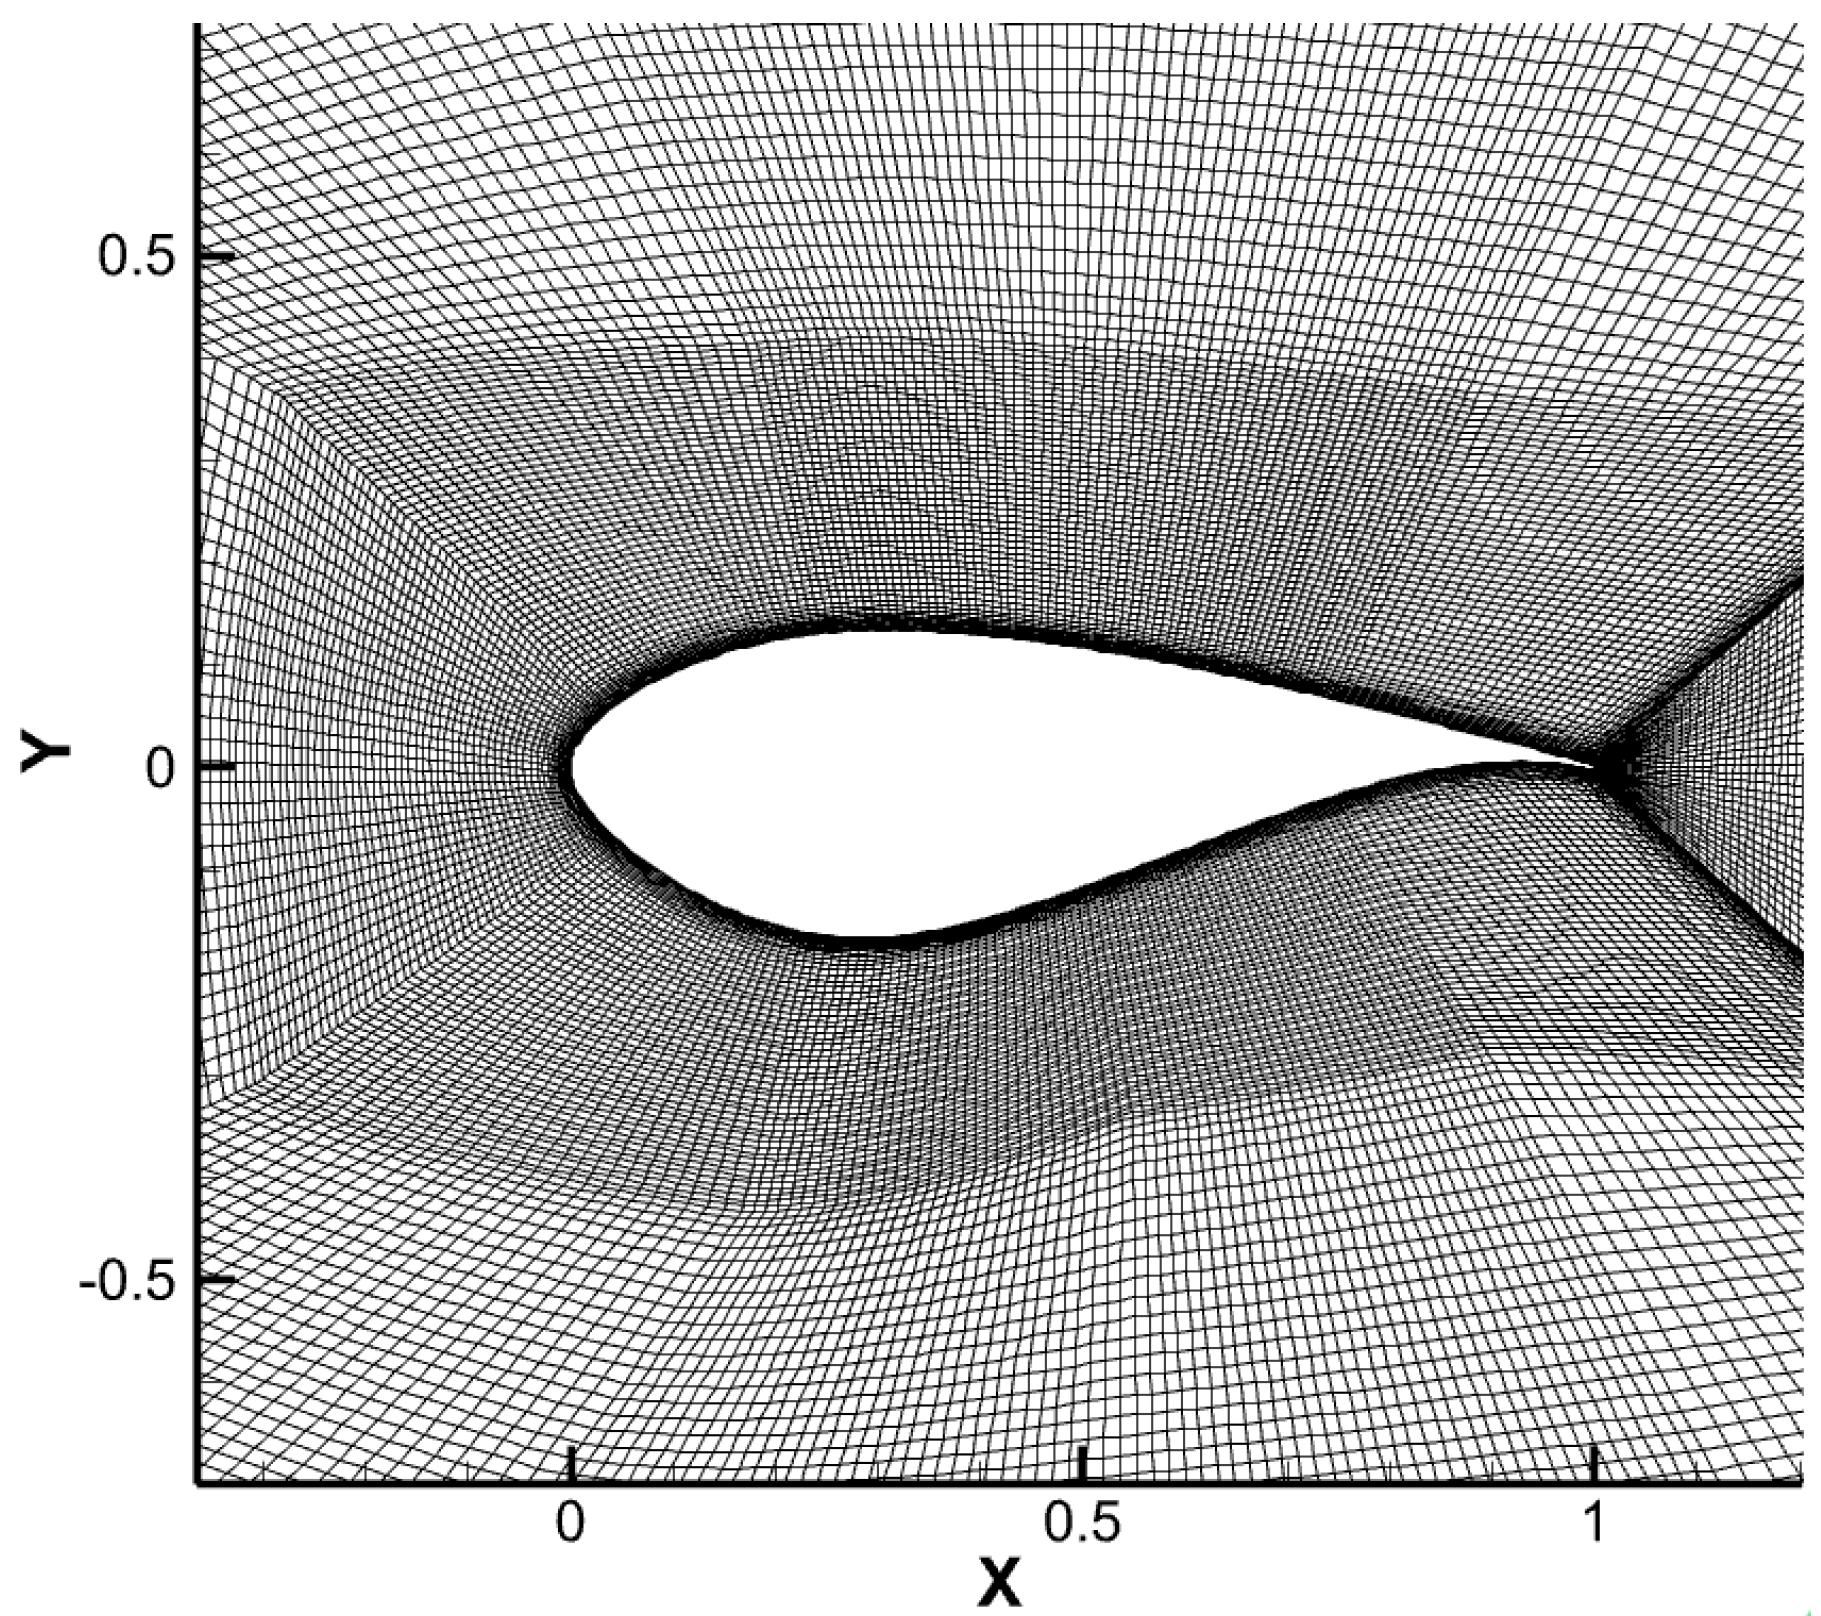
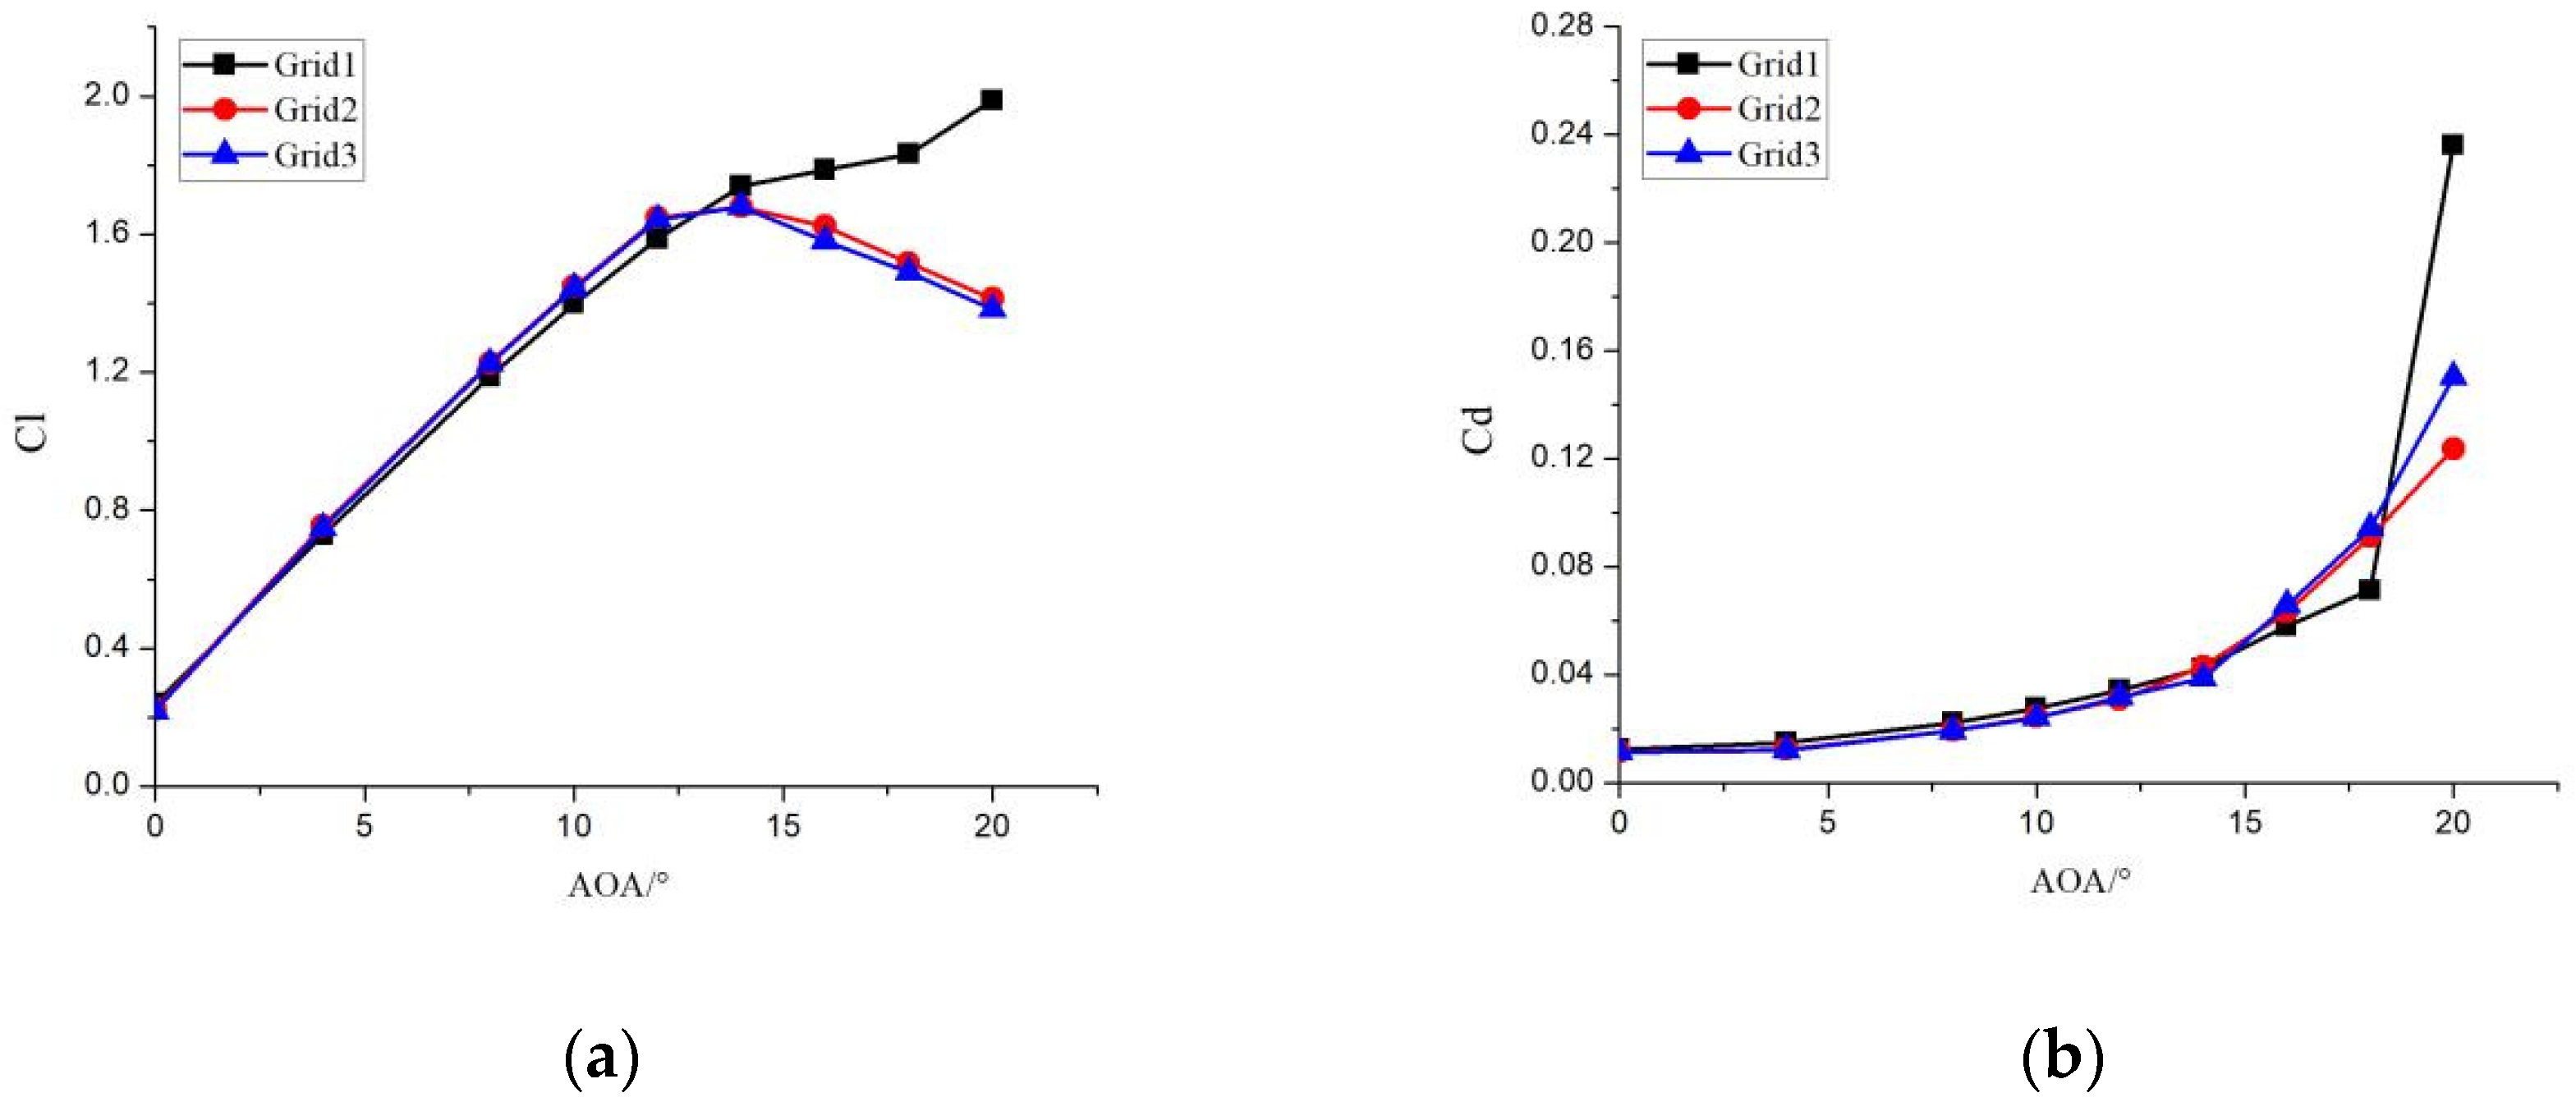
2.1. Grid Generation

The grid generation is mainly performed using Ansys ICEM for meshing the computational domain. The boundary distance of the computational domain is 10 times the chord length of the airfoil to reduce the influence of boundary conditions on the calculation results. The grid adopts an O-shaped topology, and the overall number of grid nodes is 70,000, with 350 points arranged on the surface of the airfoil. Local grid refinement is carried out at the leading edge where icing occurs. Due to the complexity of the flow on the airfoil surface, boundary layer separation flow often occurs in the near-wall region; in order to accurately capture the boundary layer, the grid close to the surface of the airfoil is encrypted. The height of the first layer grid from the airfoil is less than 10−6 m, making y + < 1. The orthogonality of the generated structural grid is greater than 0.84, and the grid quality is good, which meets the requirements for numerical simulation. The overall grid used in this paper is shown in Figure 1, and the local grid is shown in Figure 2.
In order to test the effect of different grids on the computational results, three different numbers of grids are used for grid independence verification, consisting of 49,000, 70,000, and 88,000 grid nodes, respectively, named Grid1, Grid2, and Grid3. These grids are designed to vary the number of grids by changing the distribution of grid nodes in both the circumferential and radial directions of the airfoil. The first layer height of each grid is kept constant to accurately capture the flow within the boundary layer.
The aerodynamic characteristics of airfoils with different angles of attack are calculated under the condition that the Reynolds number of the incoming wind velocity is 3 × 10⁶. The results of different grids are compared and the comparison results are shown in Figure 3. It can be seen that although the change trend of the lift coefficient and drag coefficient calculated under different grids is similar, when using Grid1, the difference between the calculation results and those of other grids is large, which indicates that the calculation results can not meet the requirements when the number of grids is 49,000. When using Grid2 and Grid3, both results hardly change anymore. This indicates that when the grid reaches 70,000, further increasing the number of grids will not enhance the accuracy of the calculation results. Therefore, taking into account both the accuracy and efficiency of the calculation results, Grid2 with the grid number of 70,000 was chosen for subsequent numerical calculations.

2.2. Flow Field Calculation

The flow field calculations were carried out using Ansys Fluent 19.2. The boundary conditions for the airflow were chosen as velocity inlet and pressure outlet. The left and lower boundaries of the rectangular computational domain were the velocity inlet, while the right and upper boundaries were the pressure outlet, since different positive angles of attack needed to be taken into account in the calculation process. The SIMPLEC algorithm was used for the solver, and all other settings were maintained at default values. The calculations were considered to have converged when the main calculation parameters no longer showed significant variations.
Since different turbulence models had certain effects on the calculation results, it was necessary to study which turbulence model was more suitable for numerical simulation in this paper. The turbulence models were set as the S-A (Spalart–Allmaras) model, k ε model, SST (Shear Stress Transport) k ω model and Transition SST model with transition, using the grid and condition in the previous section. The aerodynamic characteristics of the airfoil were calculated and compared with experimental results to investigate the influence of the turbulence model on the calculation results.
The comparison of calculation results under different turbulence models is shown in Figure 4. From the experimental results, it can be seen that when the angle of attack is small, the lift coefficient increases continuously with the increase in angle of attack, while the change in drag coefficient is relatively small. But when the angle of attack reaches the maximum lift coefficient, the lift coefficient suddenly decreases and the drag coefficient increases. This is due to airflow separation, causing the airfoil to stall and resulting in a decrease in lift. Before the airfoil stall, the differences in calculation results between different models are small, but the aerodynamic characteristics can be better predicted using the Transition SST model, and the calculated values of the lift and drag coefficients are closer to the experimental results. However, when the angle of attack reaches the stall, there are significant differences between all calculation results and experiments. The S-A model and SST k ω model are closer to the experimental values, while the calculation results of the Transition SST model have a certain difference compared to the experimental results. This is because both the S-A model and the SST k ω model are fully turbulent models, and when the airfoil stalls, the entire airfoil transitions to turbulence. The Transition SST model maintains laminar flow at the leading edge of the airfoil, resulting in a higher lift coefficient and lower drag coefficient calculation after the airfoil is stalled. Combining the above analyses with the fact that wind turbine icing mainly occurs before the airfoil stalls, it is more important to accurately simulate the air flow under the small angle of attack condition. Therefore, the Transition SST turbulence model was chosen to carry out the subsequent icing and aerodynamic analysis research.

2.3. Particle Trajectory Calculation

The particle trajectory calculation mainly uses the Lagrangian method to calculate the motion trajectory of supercooled droplets/ice crystals. It is assumed that the particle physical parameters do not change and the ice crystal temperature is the same as the ambient temperature. During the process of particle motion, it is affected by the airflow, while the airflow is not disturbed by particle motion. The motion trajectory equation can be expressed in the same form [31]:
m p d 2 r p d t 2 = D + G ,
where m p is the particle mass, d 2 r p / d t 2 is the motion acceleration, D is the viscous drag force on air, and Drag can be calculated using a spherical drag calculation method. G is the gravity.
The particle trajectory equation is a first-order ordinary differential equation about particle velocity, which can be solved using the fourth-order Runge–Kutta method. The initial conditions of the equation are particle velocity and particle position. The initial position of the particle is chosen at the left boundary of the computational domain, and the initial velocity of the particle is considered equal to the far-field velocity. By solving Equation (1) continuously, different positions and velocities of the particles in space can be obtained. For airfoil boundary conditions, part of the particles may not impact the airfoil and these particles do not participate in the icing calculation, while the trajectory of the other part will intersect with the airfoil. This intersection point is the impact position of the particles on the airfoil, which is the final result of the particle trajectory calculation and the input parameter of the icing calculation [31].

2.4. Ice Accretion Calculation

The thermodynamic model of mixed-phase icing is extended based on the Messinger theory. The surface is divided into a number of control units, which are in contact with the air and the surface, ignoring the heat transfer processes within the units. The control unit method is used to analyze the mass conservation and energy conservation equations for the wall control unit, as follows [32]:
M ˙ c l t , i c , w + M ˙ c l t , i c , i + M ˙ c l t , d + M ˙ i n = M ˙ e v p + M ˙ o u t + M ˙ i c e ,
Q ˙ c l t , i c , w + Q ˙ c l t , i c , i + Q ˙ c l t , d + Q ˙ in + Q ˙ cond = Q ˙ evp + Q ˙ out + Q ˙ i c e + Q ˙ h t c ,
In the mass equation, M ˙ c l t , i c , w is the amount of the melted portion of the ice crystals impacting on the surface, M ˙ c l t , i c , i is the amount of the unmelted portion of the ice crystals, and M ˙ c l t , d is the amount of water from the supercooled droplets impacting on the airfoil surface. The amount of particle impact can be obtained based on the particle impact characteristics. M ˙ in is the amount of liquid water flowing into the current control unit from the upstream control unit, M ˙ o u t is the amount of liquid water flowing out of the control unit to the downstream control unit. The inflow and outflow of surface liquid water are related, and the M ˙ o u t of upstream units is equal to the M ˙ in of downstream units. M ˙ evp is the amount of water evaporated in the control unit; it can be calculated based on the evaporation formula of water. M ˙ i c e is the amount of liquid water that freezes into ice, and this is the final result that needs to be obtained for the calculation.
In the energy equation, Q ˙ c l t , i c , w is the energy of the melted portion of the ice crystals impacting on the surface, Q ˙ c l t , i c , i is the energy of the unmelted portion of the ice crystals impacting on the surface, Q ˙ c l t , d is the energy of the supercooled droplets impacting on the surface, Q ˙ in is the energy of water flowing into the upstream control unit, and Q ˙ out is the energy of water flowing out of the control unit. These energy terms can be obtained by multiplying the mass flux by the enthalpy value. Q ˙ cond is the energy conducted by the skin, and it can be considered adiabatic. Q ˙ evp is the energy taken away by evaporation, and Q ˙ h t c is the energy taken away by convective heat transfer; these can be obtained using basic heat transfer formulas. Q ˙ i c e is the energy absorbed by the frozen liquid water and this can be obtained based on the amount of ice formation.
In the process of solving equations, it is necessary to start from the stationary point. It can be assumed that there is no water inflow at the stationary point. Based on the mass of the impacting particles, the mass of the outflowing liquid water and the icing are solved for. Subsequently, along the airflow direction on the surface of the airfoil, the equations are solved sequentially to obtain the icing mass in each unit. Finally, the icing height is converted from the mass to obtain the shape of the airfoil after icing [32].

3. Effect of Icing Growth on Aerodynamic Characteristics

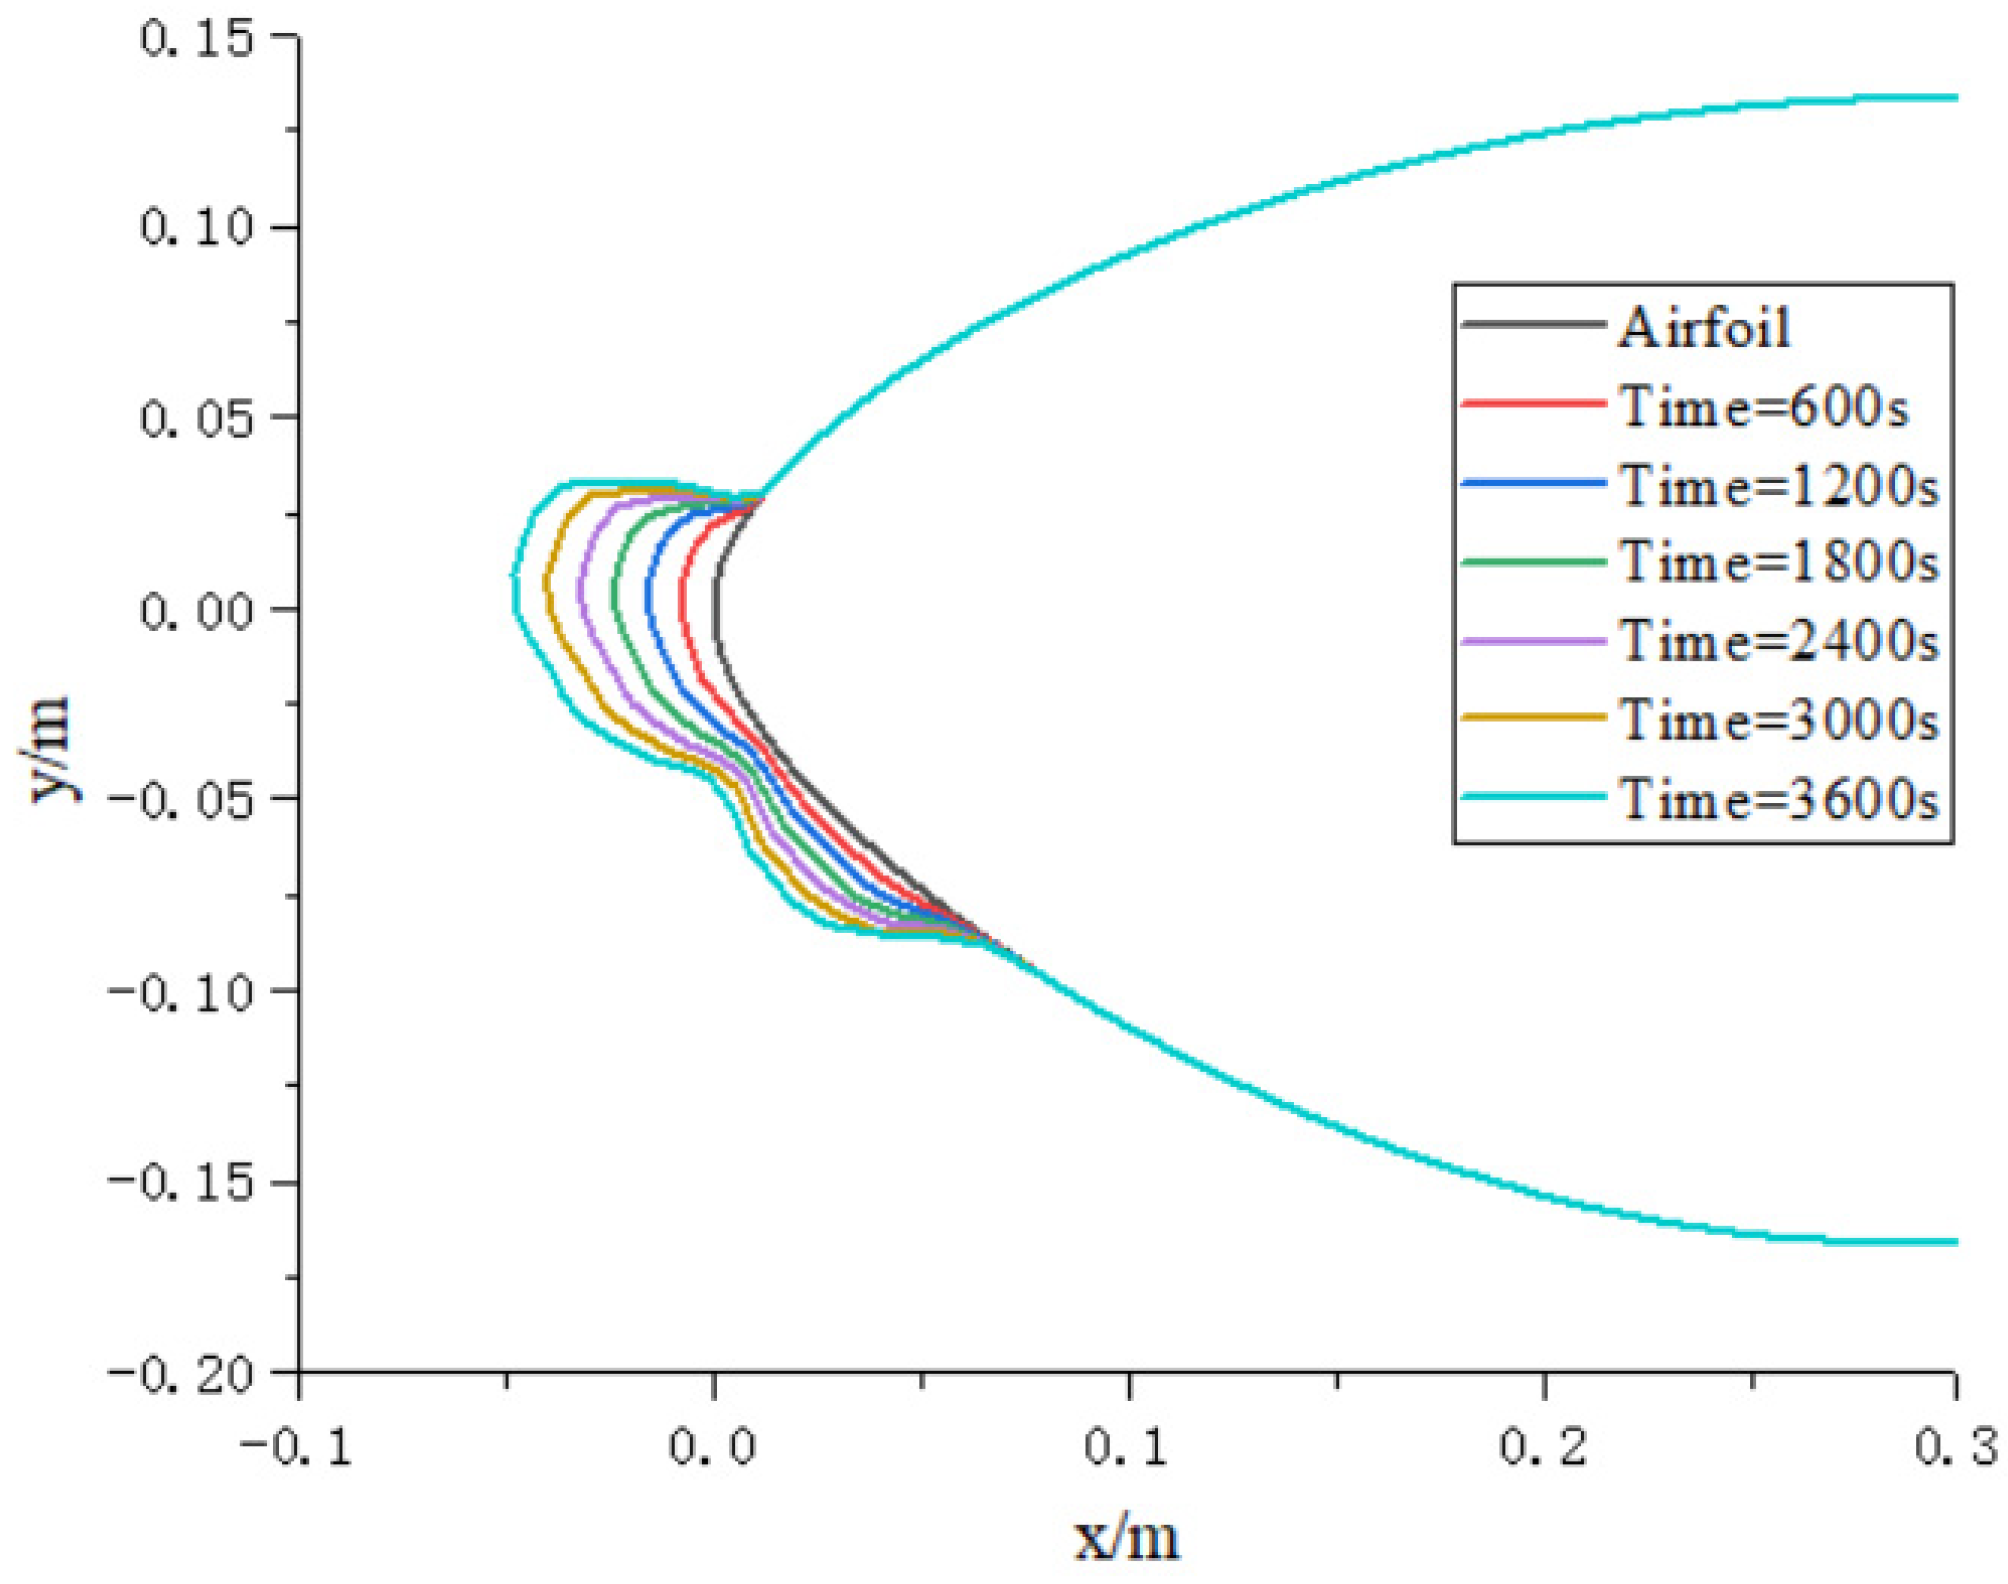
3.1. Ice Shapes Calculation

The icing simulation method under mixed-phase conditions is used to carry out the calculation of the icing characteristics of wind turbine airfoil. The DU 97-W-300 wind turbine airfoil with a chord length of 1.0m is chosen as the calculation model. Typical wind turbine airfoil icing meteorological conditions are selected for the calculation conditions, with the incoming velocity of 50 m/s. The incoming velocity of the airfoil is considered as the combined velocity of the blade rotation velocity and the wind velocity, and the magnitude of the two velocities is reflected by the angle of attack. The angle of attack is 4°, the droplet diameter is 30 μm, the LWC (Liquid Water Content) is 0.5 g/m3, the ice crystal diameter is 200 μm, the ICC (Ice Crystal Content) is 0.5 g/m3 and the icing temperature is 266 K. The ice shape of the wind turbine airfoil is calculated as shown in Figure 5, with a total icing time of 3600 s. By dividing it 6 times, the ice shape can be obtained at intervals of 600 s.
From the results, it can be seen that icing mainly occurs at the leading edge of the wind turbine airfoil, and with the increase in time, the ice shape gradually thickens. The ice shape generally shows a trend of being thicker in the top and bottom and thinner in the middle, similar to a sheep horn. In this case, a typical clear ice shape is generated. This is because the supercooled droplets and ice crystals impacting the surface do not freeze immediately at this icing temperature. Some freeze immediately upon impact, while the remaining supercooled droplets and ice crystals form liquid water on the surface. The liquid water begins to flow towards both sides under the action of airflow and gradually freezes, eventually forming the ice shape shown in Figure 5. The least amount of icing is located approximately near the leading edge stationing point, and the thickness of icing gradually increases towards both sides, with more icing on the upper surface than on the lower surface.

3.2. Aerodynamic Characteristics Calculation

During the icing process, the aerodynamic characteristics of wind turbine airfoils change continuously as the ice shape grows. Therefore, a study on the effect of icing growth on aerodynamic characteristics was carried out to analyze the degree of change in aerodynamic characteristics with the continuous increase in ice shape. The calculation conditions for aerodynamic characteristics are directly related to icing meteorological conditions; therefore, the calculation conditions for aerodynamic characteristics are a flow velocity of 50 m/s and an angle of attack of 4°. The settings are kept constant for grid generation and flow field calculations for different ice shapes.
The pressure distribution and streamline around the airfoil are given in Figure 6. The pressure distribution around the airfoil is roughly the same. The pressure is higher near the leading edge and lower above the airfoil, generating upward lift to push the wind turbine to do work. As the icing increases, the local pressure distribution changes, mainly with the pressure gradually increasing above the airfoil. This results in a decrease in overall lift and an increase in drag for the airfoil. It can be seen from the streamline that there is no obstruction of airflow through the airfoil when it is not iced. The icing increases, especially as the icing time reaches 2400 s, where vortex structures appear behind the ice shape. The local enlargement of the vortex structures behind the ice shape at 3600 s is shown in Figure 6h. The local vortex structure destroys the original airflow of the clear airfoil, resulting in airflow separation and local pressure reduction, which affects the lift of the airfoil.
The trends of the lift coefficient and drag coefficient of the airfoil with icing growth are shown in Figure 7a,b. The lift coefficient and drag coefficient generally converge to a fixed value, which is the calculation result. When there is airflow separation on the airfoil, the lift coefficient and drag coefficient will vary periodically with the shedding of vortices at the tail of the airfoil. At this time, the average values represent the lift coefficient and drag coefficient. It can be seen that the lift coefficient continues to decrease, from 0.755 when it was unfrozen to 0.451 after 3600 s of icing time, with a decrease of 40.2%. The drag coefficient increased from 0.0125 at the beginning to 0.0294, with an increase of 135.2%. Figure 7c shows the trend of the lift-to-drag ratio, which is the most important parameter affecting the efficiency of wind power generation. The lift-to-drag ratio decreased from 60.4 before icing to 15.3 after icing of 3600 s, with a decrease of 74.6%, which seriously affected the efficiency of wind turbine power generation. It can also be seen that the drop in the lift-to-drag ratio is larger when icing first occurs and slows down as the icing increases. This is mainly due to the icing damaging the aerodynamic shape of the original wind turbine airfoil, resulting in a decrease in the lift coefficient, an increase in the drag coefficient, and a serious decrease in the lift-to-drag ratio. The decrease in the lift-to-drag ratio affects the power generation efficiency of the wind turbine. If the icing condition is particularly severe, it can also cause the wind turbine to shut down. Therefore, the icing phenomenon is a serious climatic factor that affects the efficiency of wind power generation.

4. Aerodynamic Characteristics of Wind Turbine Airfoil After Icing

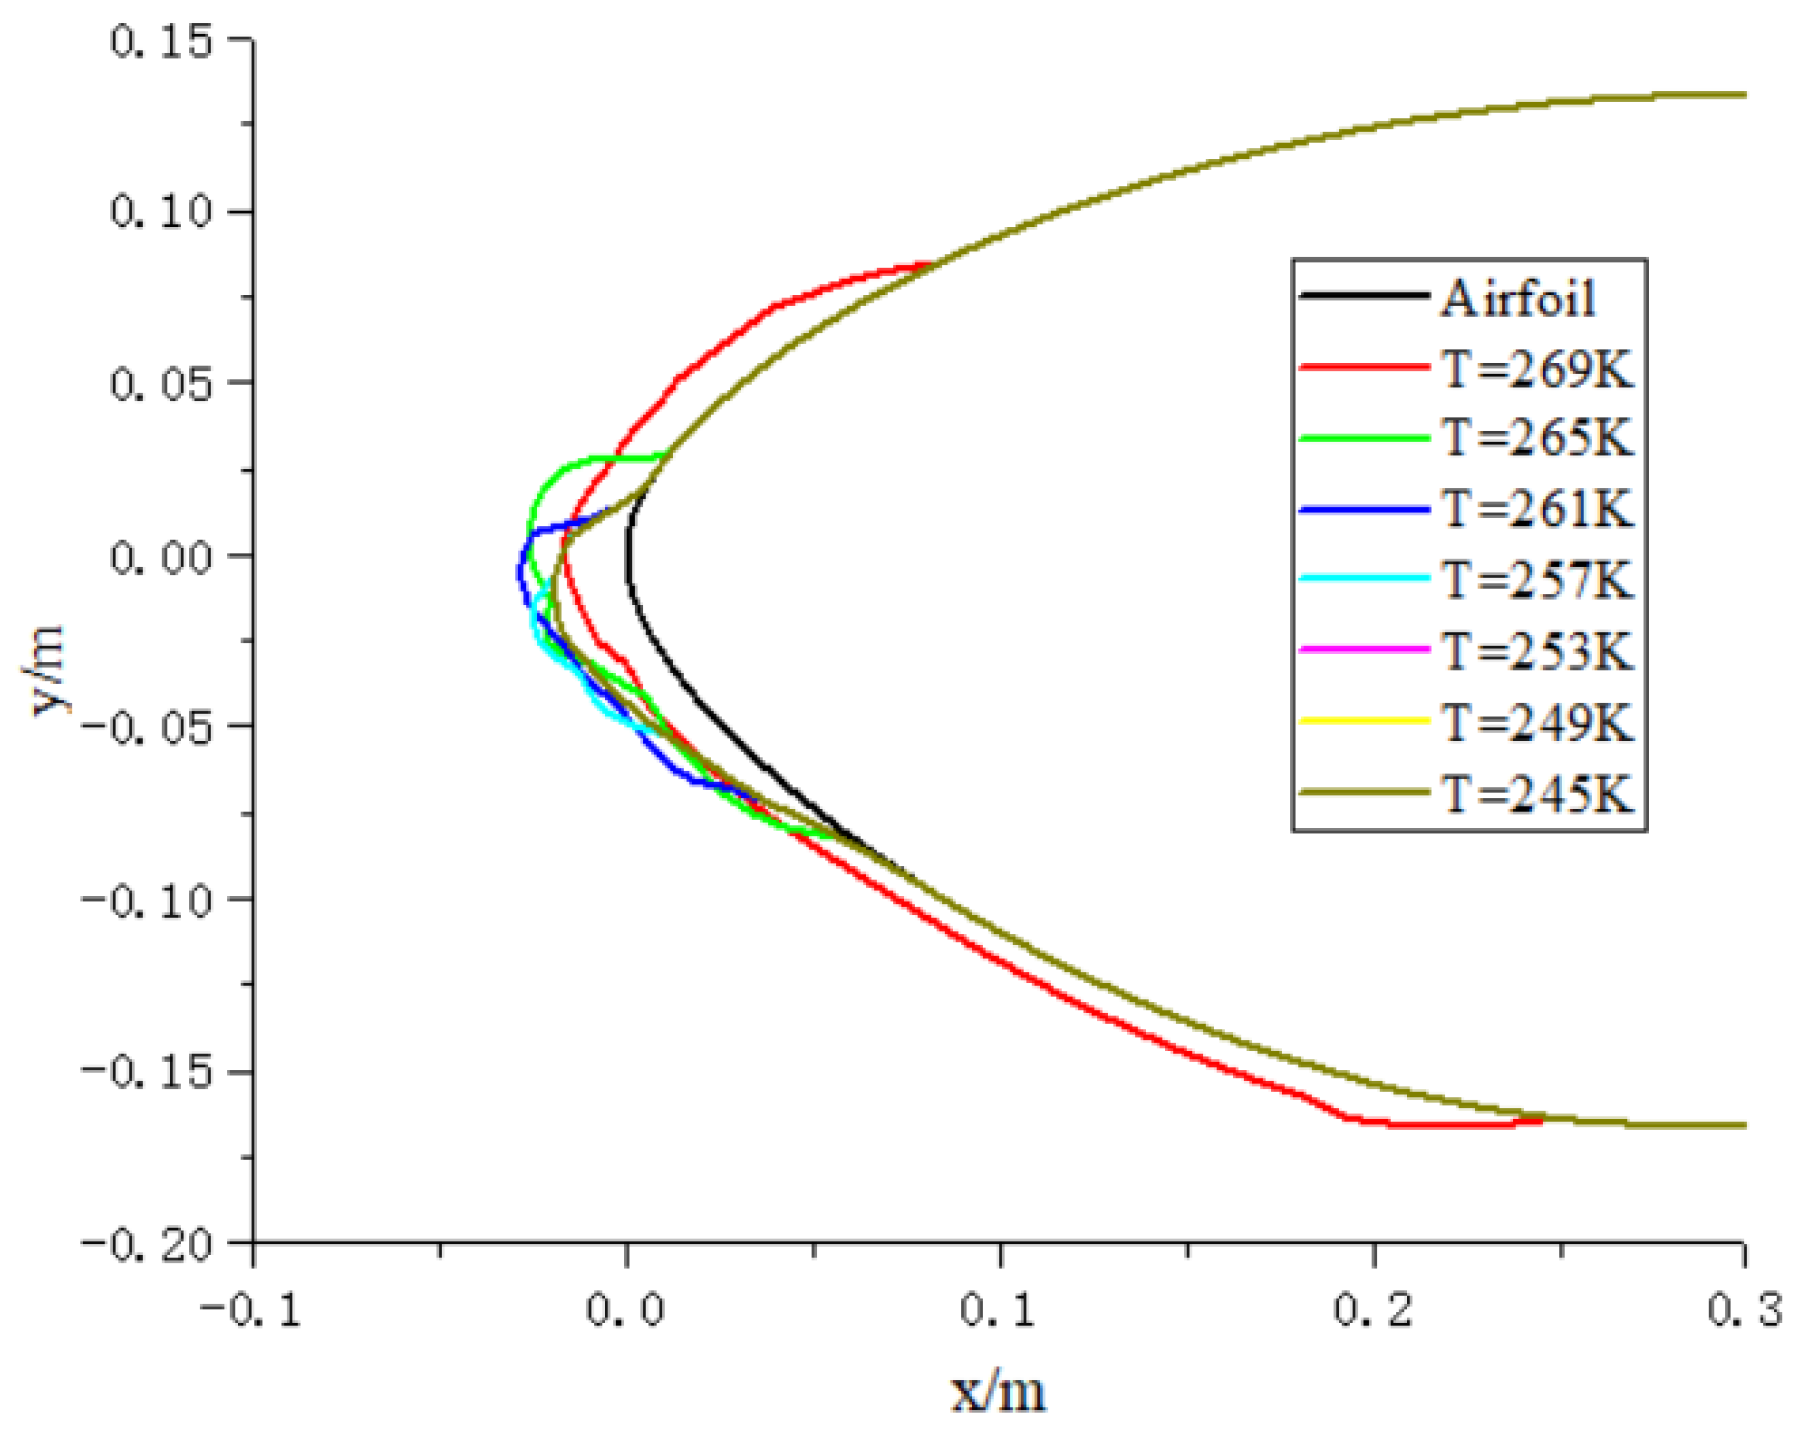
4.1. Icing Characteristics at Different Temperatures

When wind turbine icing occurs, the shape of the wind turbine changes. When icing does not increase, it is also meaningful to study the aerodynamic characteristics of the wind turbine airfoil after icing. This can be used to evaluate the power generation efficiency of the wind turbine after icing, and thus to make a judgment on the necessity for a de-icing system. There are two typical types of ice accretion: one is glaze ice at higher icing temperatures and the other is rime ice at relatively lower icing temperatures. So mixed-phase icing under different icing temperatures needs to be studied first. The icing temperatures were selected as 269 K, 265 K, 261 K, 257 K, 253 K, 249 K, and 245 K, respectively, and the freezing time was 1800s. The rest of the calculation conditions were the same as in the Section 3.
As can be seen from the results in Figure 8, the icing range gradually decreases and the icing thickness gradually increases as the temperature decreases. When the icing temperature approaches the phase transition temperature, both the amount and range of icing expand rapidly. This is because when the icing temperature is low, rime ice is produced on the airfoil surface, and the liquid water impinging on the surface freezes immediately, so the icing range is smaller and the ice shape does not change much. When the icing temperature is high, glaze ice is produced, and supercooled droplets and ice crystals impacting the airfoil surface form liquid water. The liquid water flows towards the upper and lower sides under the action of airflow, and the distribution range of liquid water expands. When there is no liquid water in the ice crystal impact area, ice accretion does not occur. The flow of liquid water makes ice crystals impact the surface liquid water, and more ice crystals are involved in the mixed-phase icing phase transition. The impact of ice crystals also replenishes the mass of liquid water, increasing its mass and flow range and further forming ice. Therefore, when the temperature is high, the amount and range of icing under mixed-phase conditions can be much greater than those under supercooled droplet icing conditions, and special attention needs to be paid to the design of wind turbine de-icing systems.
As can be seen in the figure, glaze ice is produced on the surface of the wind turbine airfoil at 266 K, while rime ice is formed on the surface at 253 K. Two typical icing temperatures of 266 K and 253 K were used to calculate of aerodynamic characteristics after icing. The lift coefficient and drag coefficient were calculated for the clean airfoil and the two types of iced airfoils at an incoming velocity of 50 m/s, in order to accurately determine the aerodynamic characteristics of wind turbine airfoil after icing.

4.2. Aerodynamic Characteristics of Clean Airfoil

The flow field of the DU 97-W-300 clean airfoil was analyzed by the numerical simulation method, and the results of pressure distribution and airflow streamline calculation under different angles of attack are shown in Figure 9. It can be seen that when the angle of attack ranges from 0° to 12°, the airflow has not yet separated and flows smoothly through the airfoil. The negative pressure area on the upper surface of the airfoil gradually moves towards the leading edge as the angle of attack increases, while the positive pressure area on the leading edge gradually moves towards the lower surface. When the angle of attack is greater than 14°, airflow separation phenomenon occurs at the airfoil tail, and a separation vortex can be observed from the streamlines. The appearance of a separated vortex destroys the airflow of the airfoil, leading to a reduction in the lift coefficient of the airfoil and the deterioration of its aerodynamic characteristics. As the angle of attack continues to increase, the airflow separation area at the airfoil tail gradually expands, and its impact on aerodynamic characteristics becomes more severe. When the angle of attack reaches 20°, the airfoil is already in a complete stall; at this time, the lift decreases, the drag rises, and the lift-to-drag ratio seriously deteriorates.

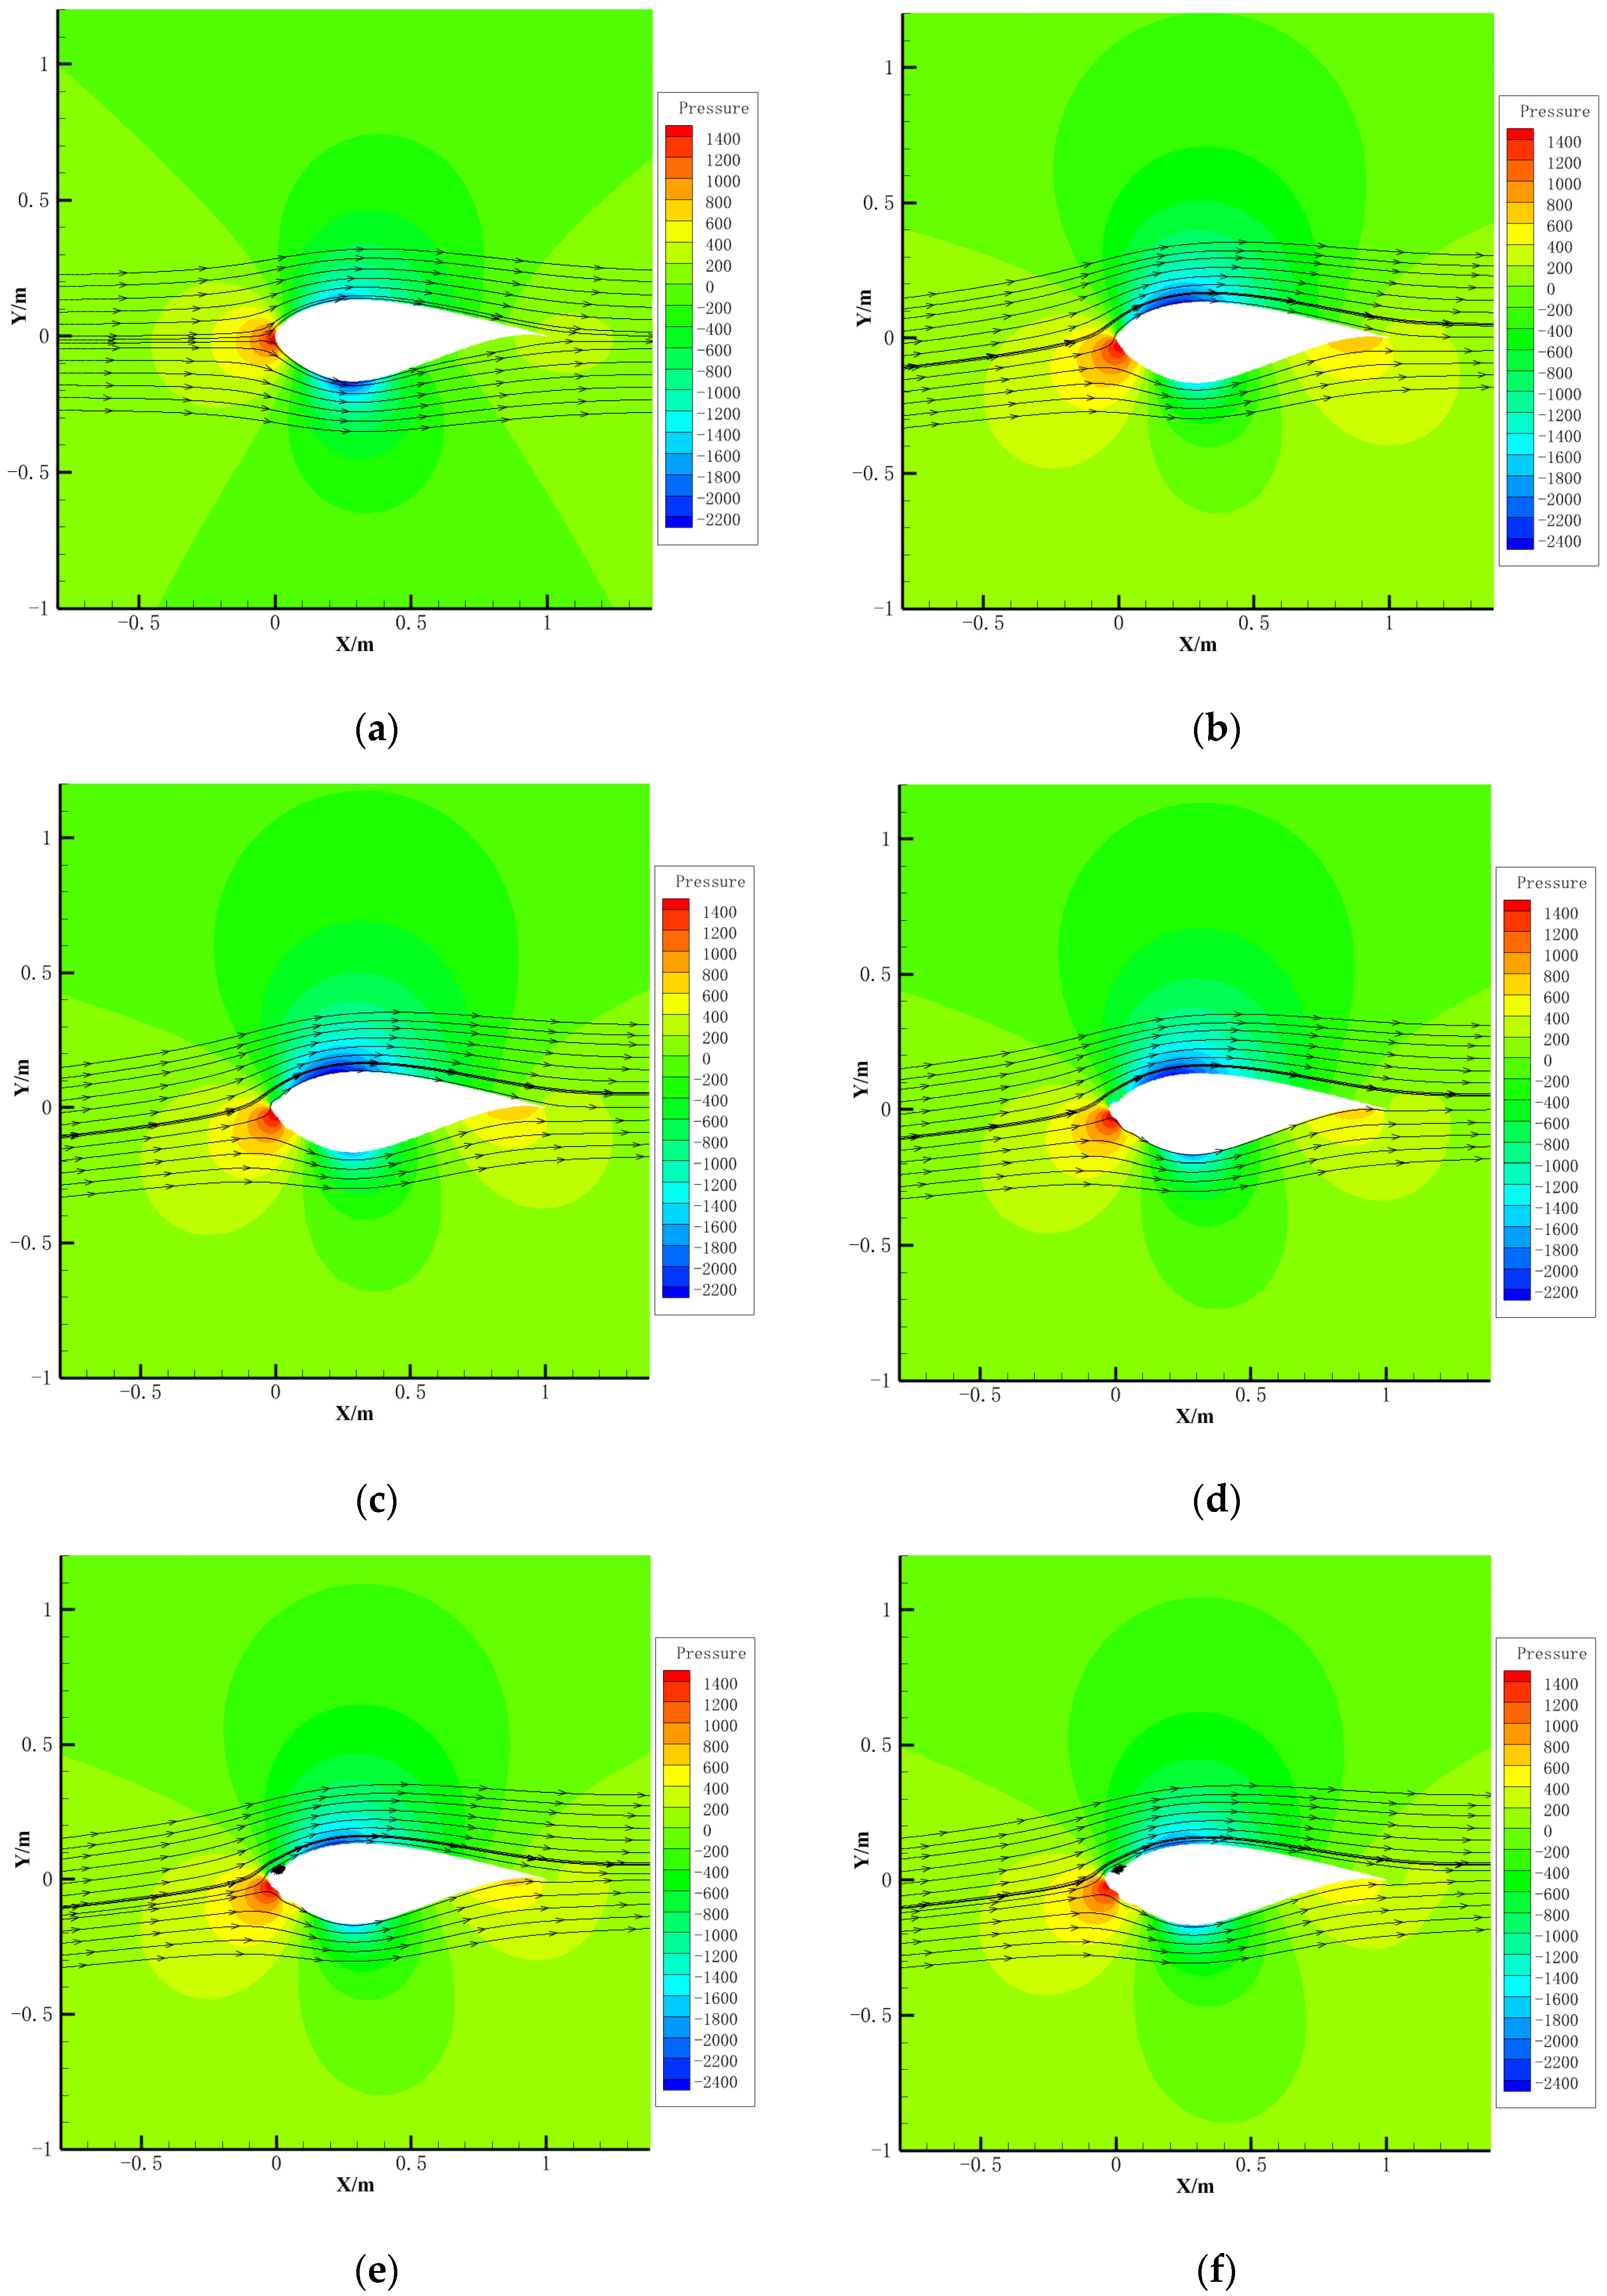
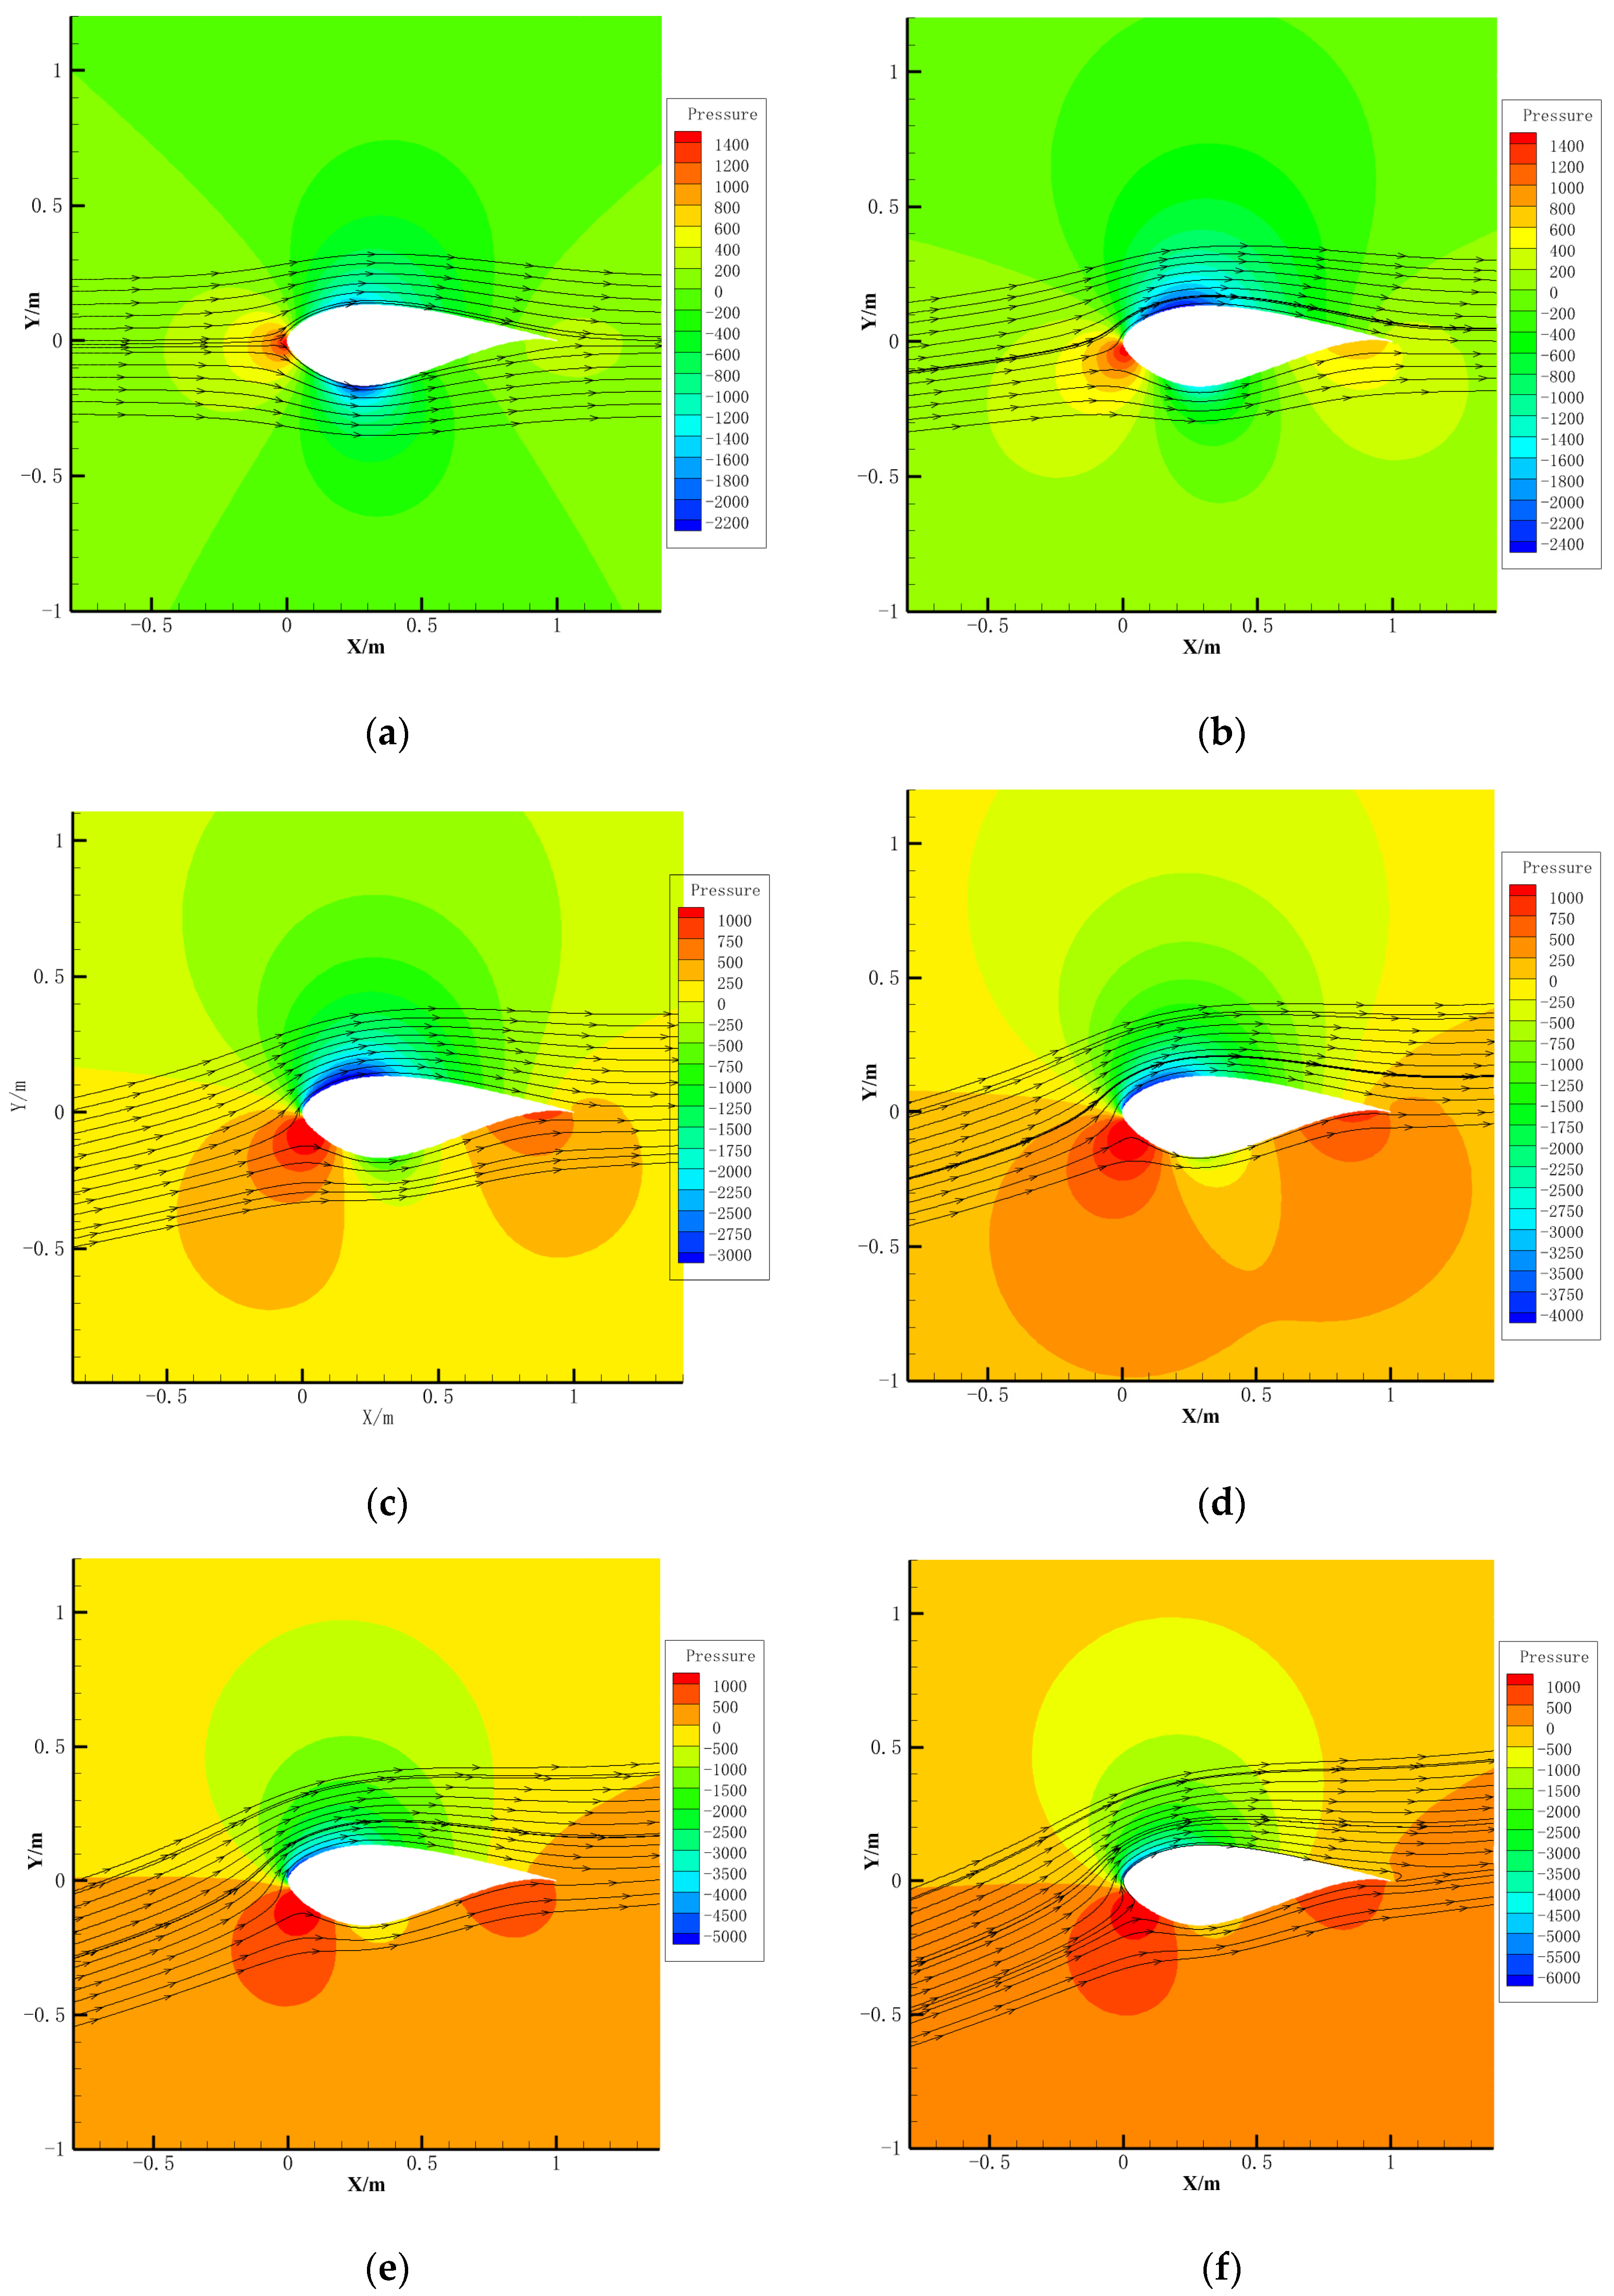
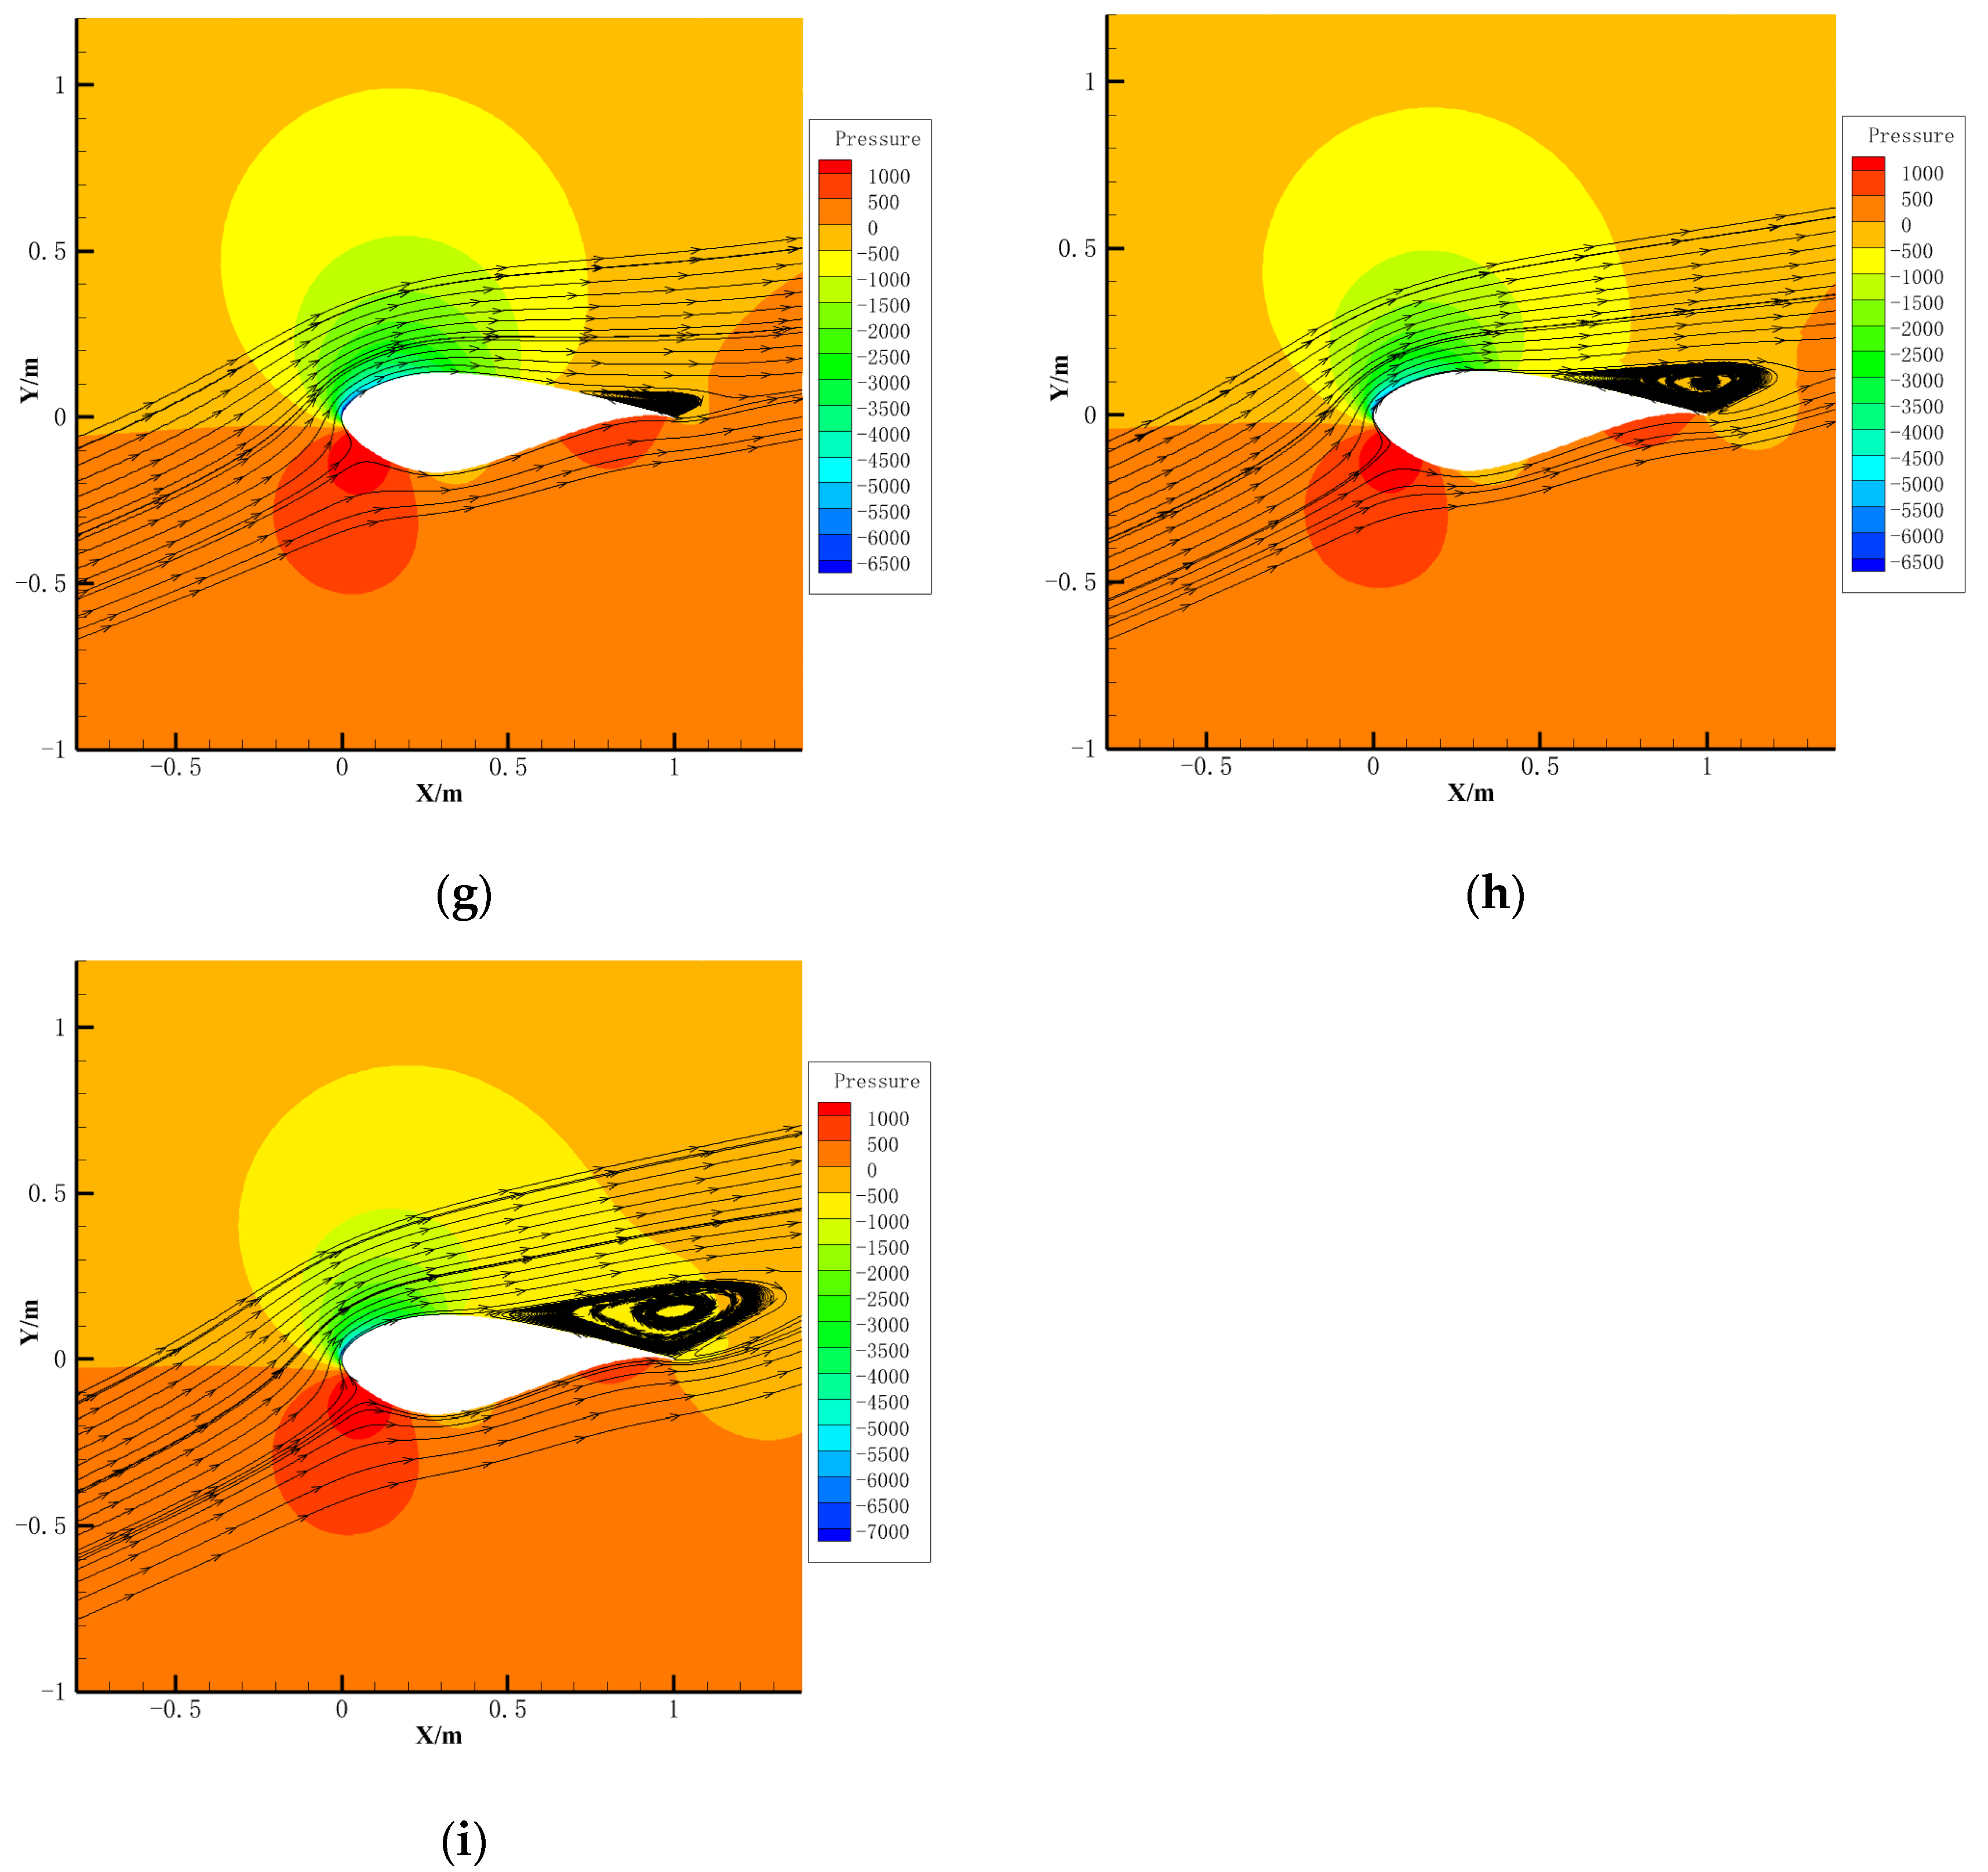
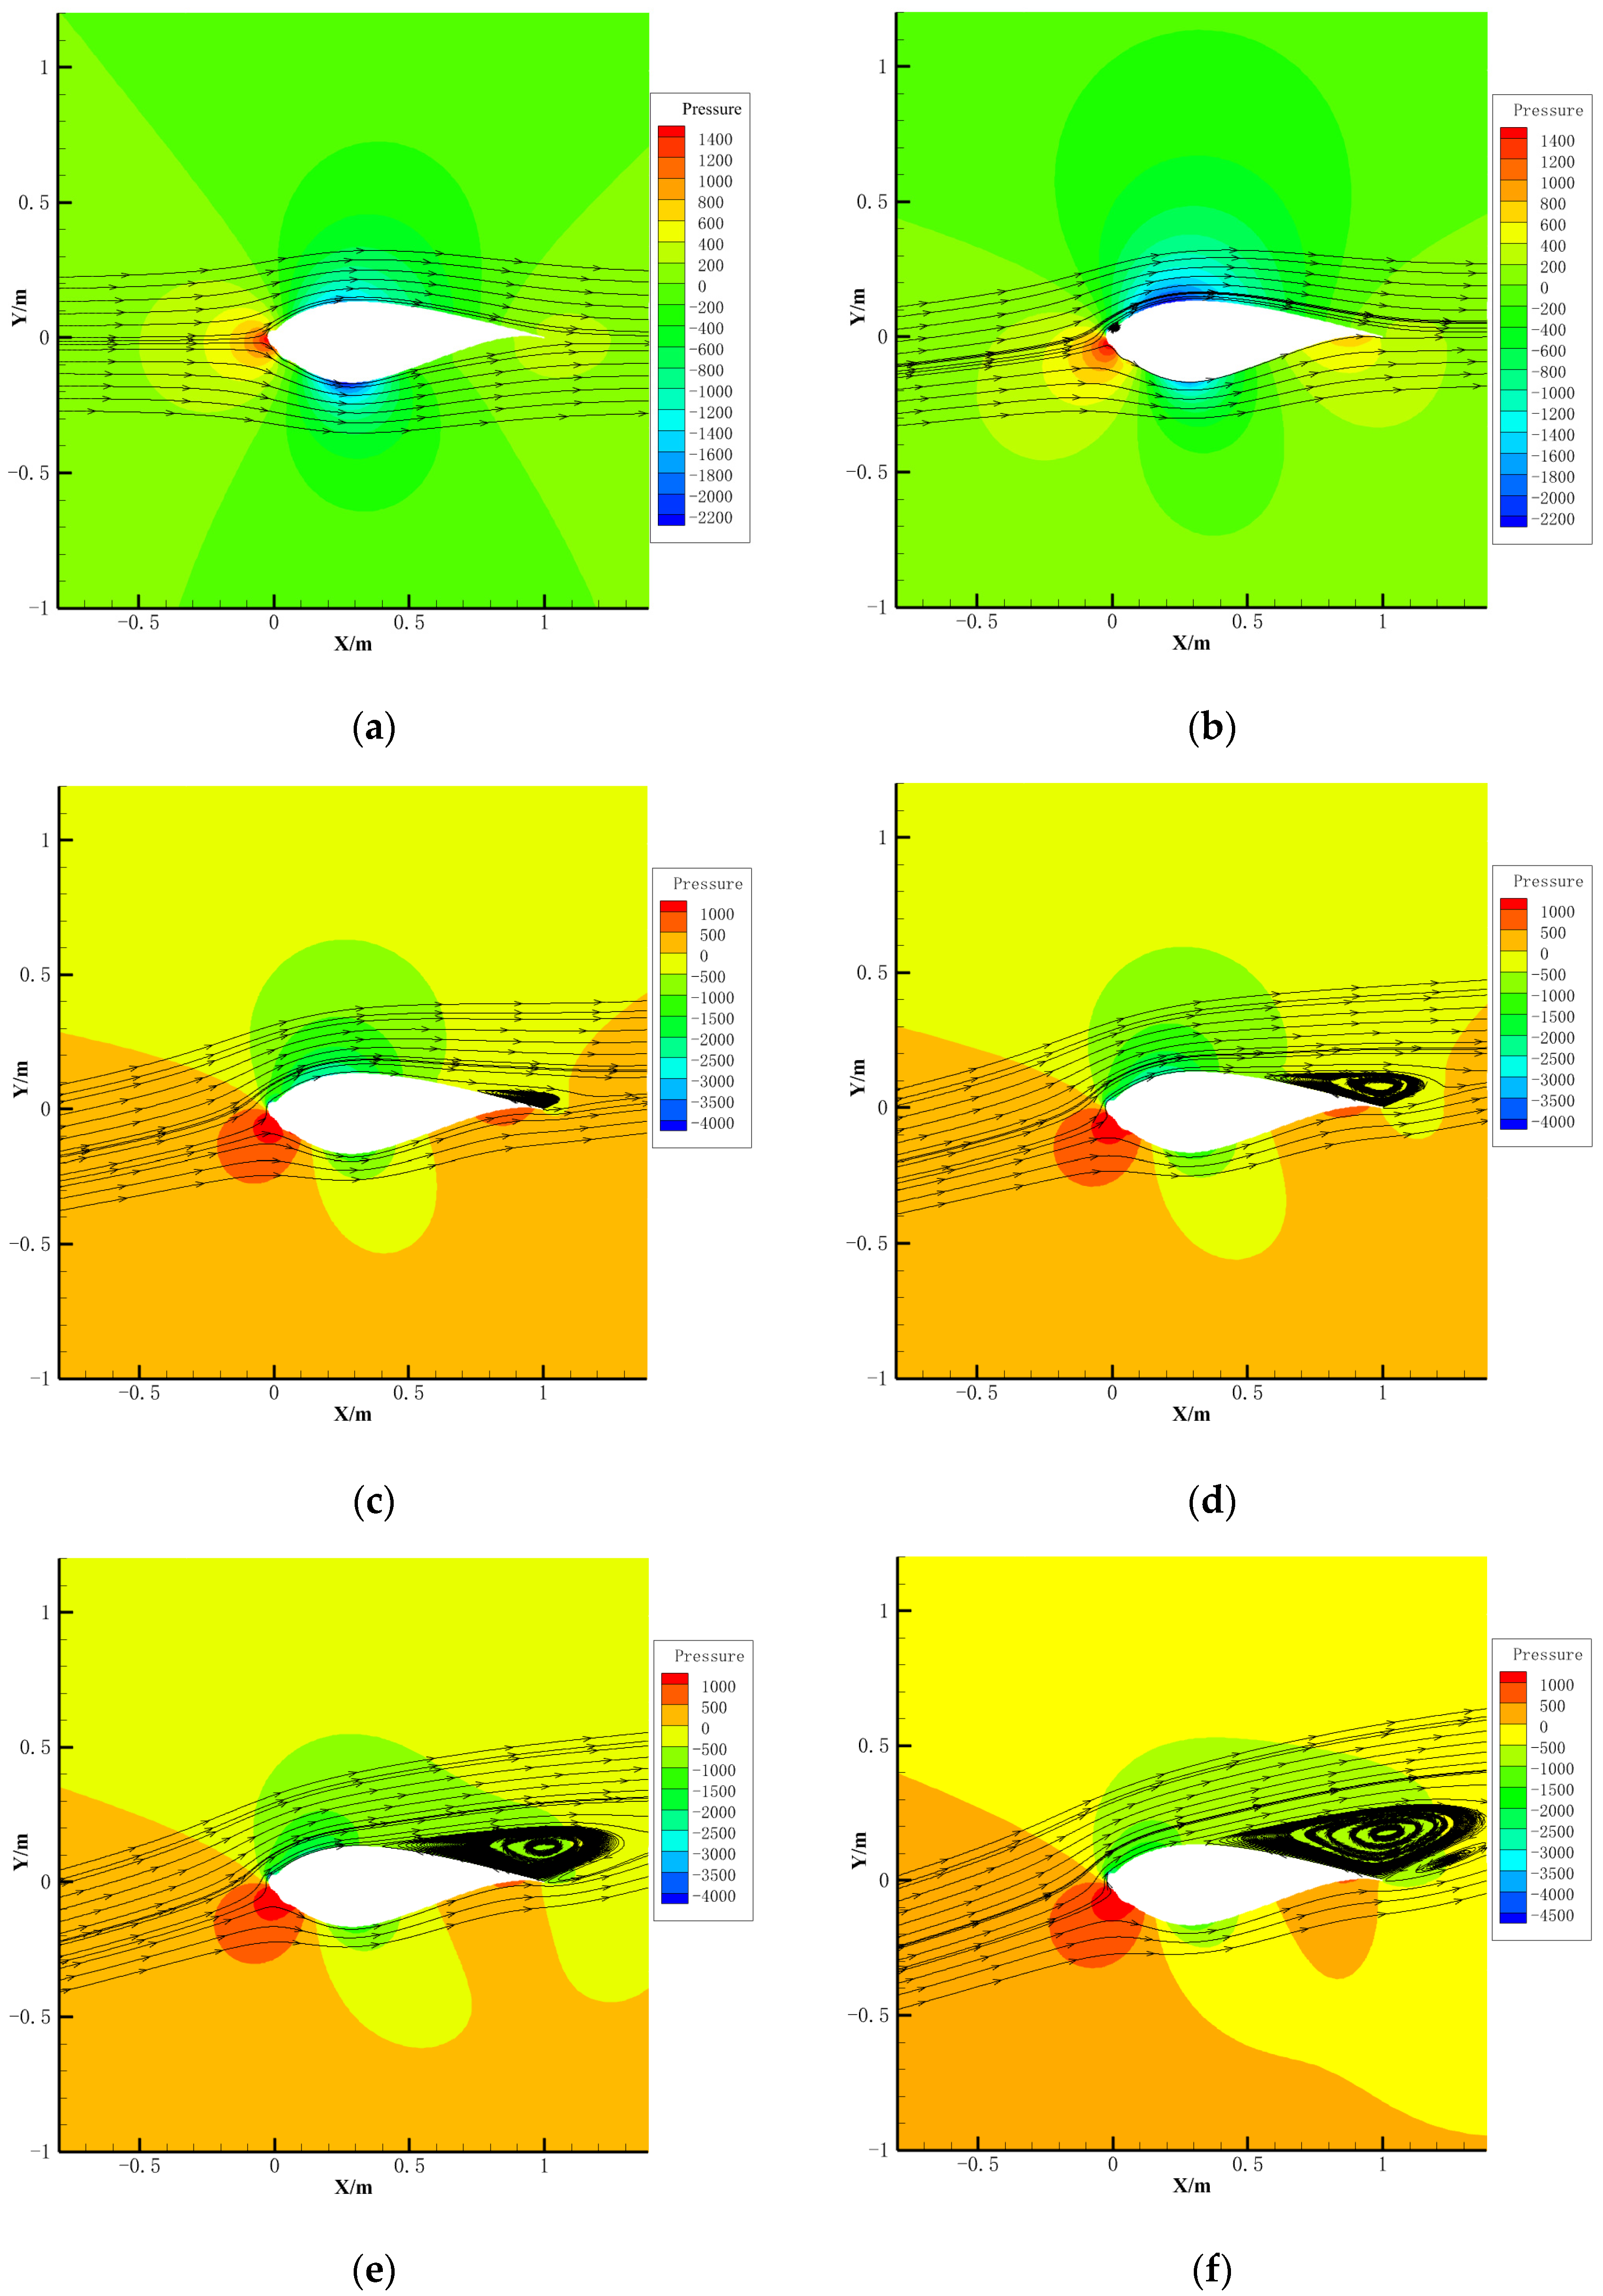
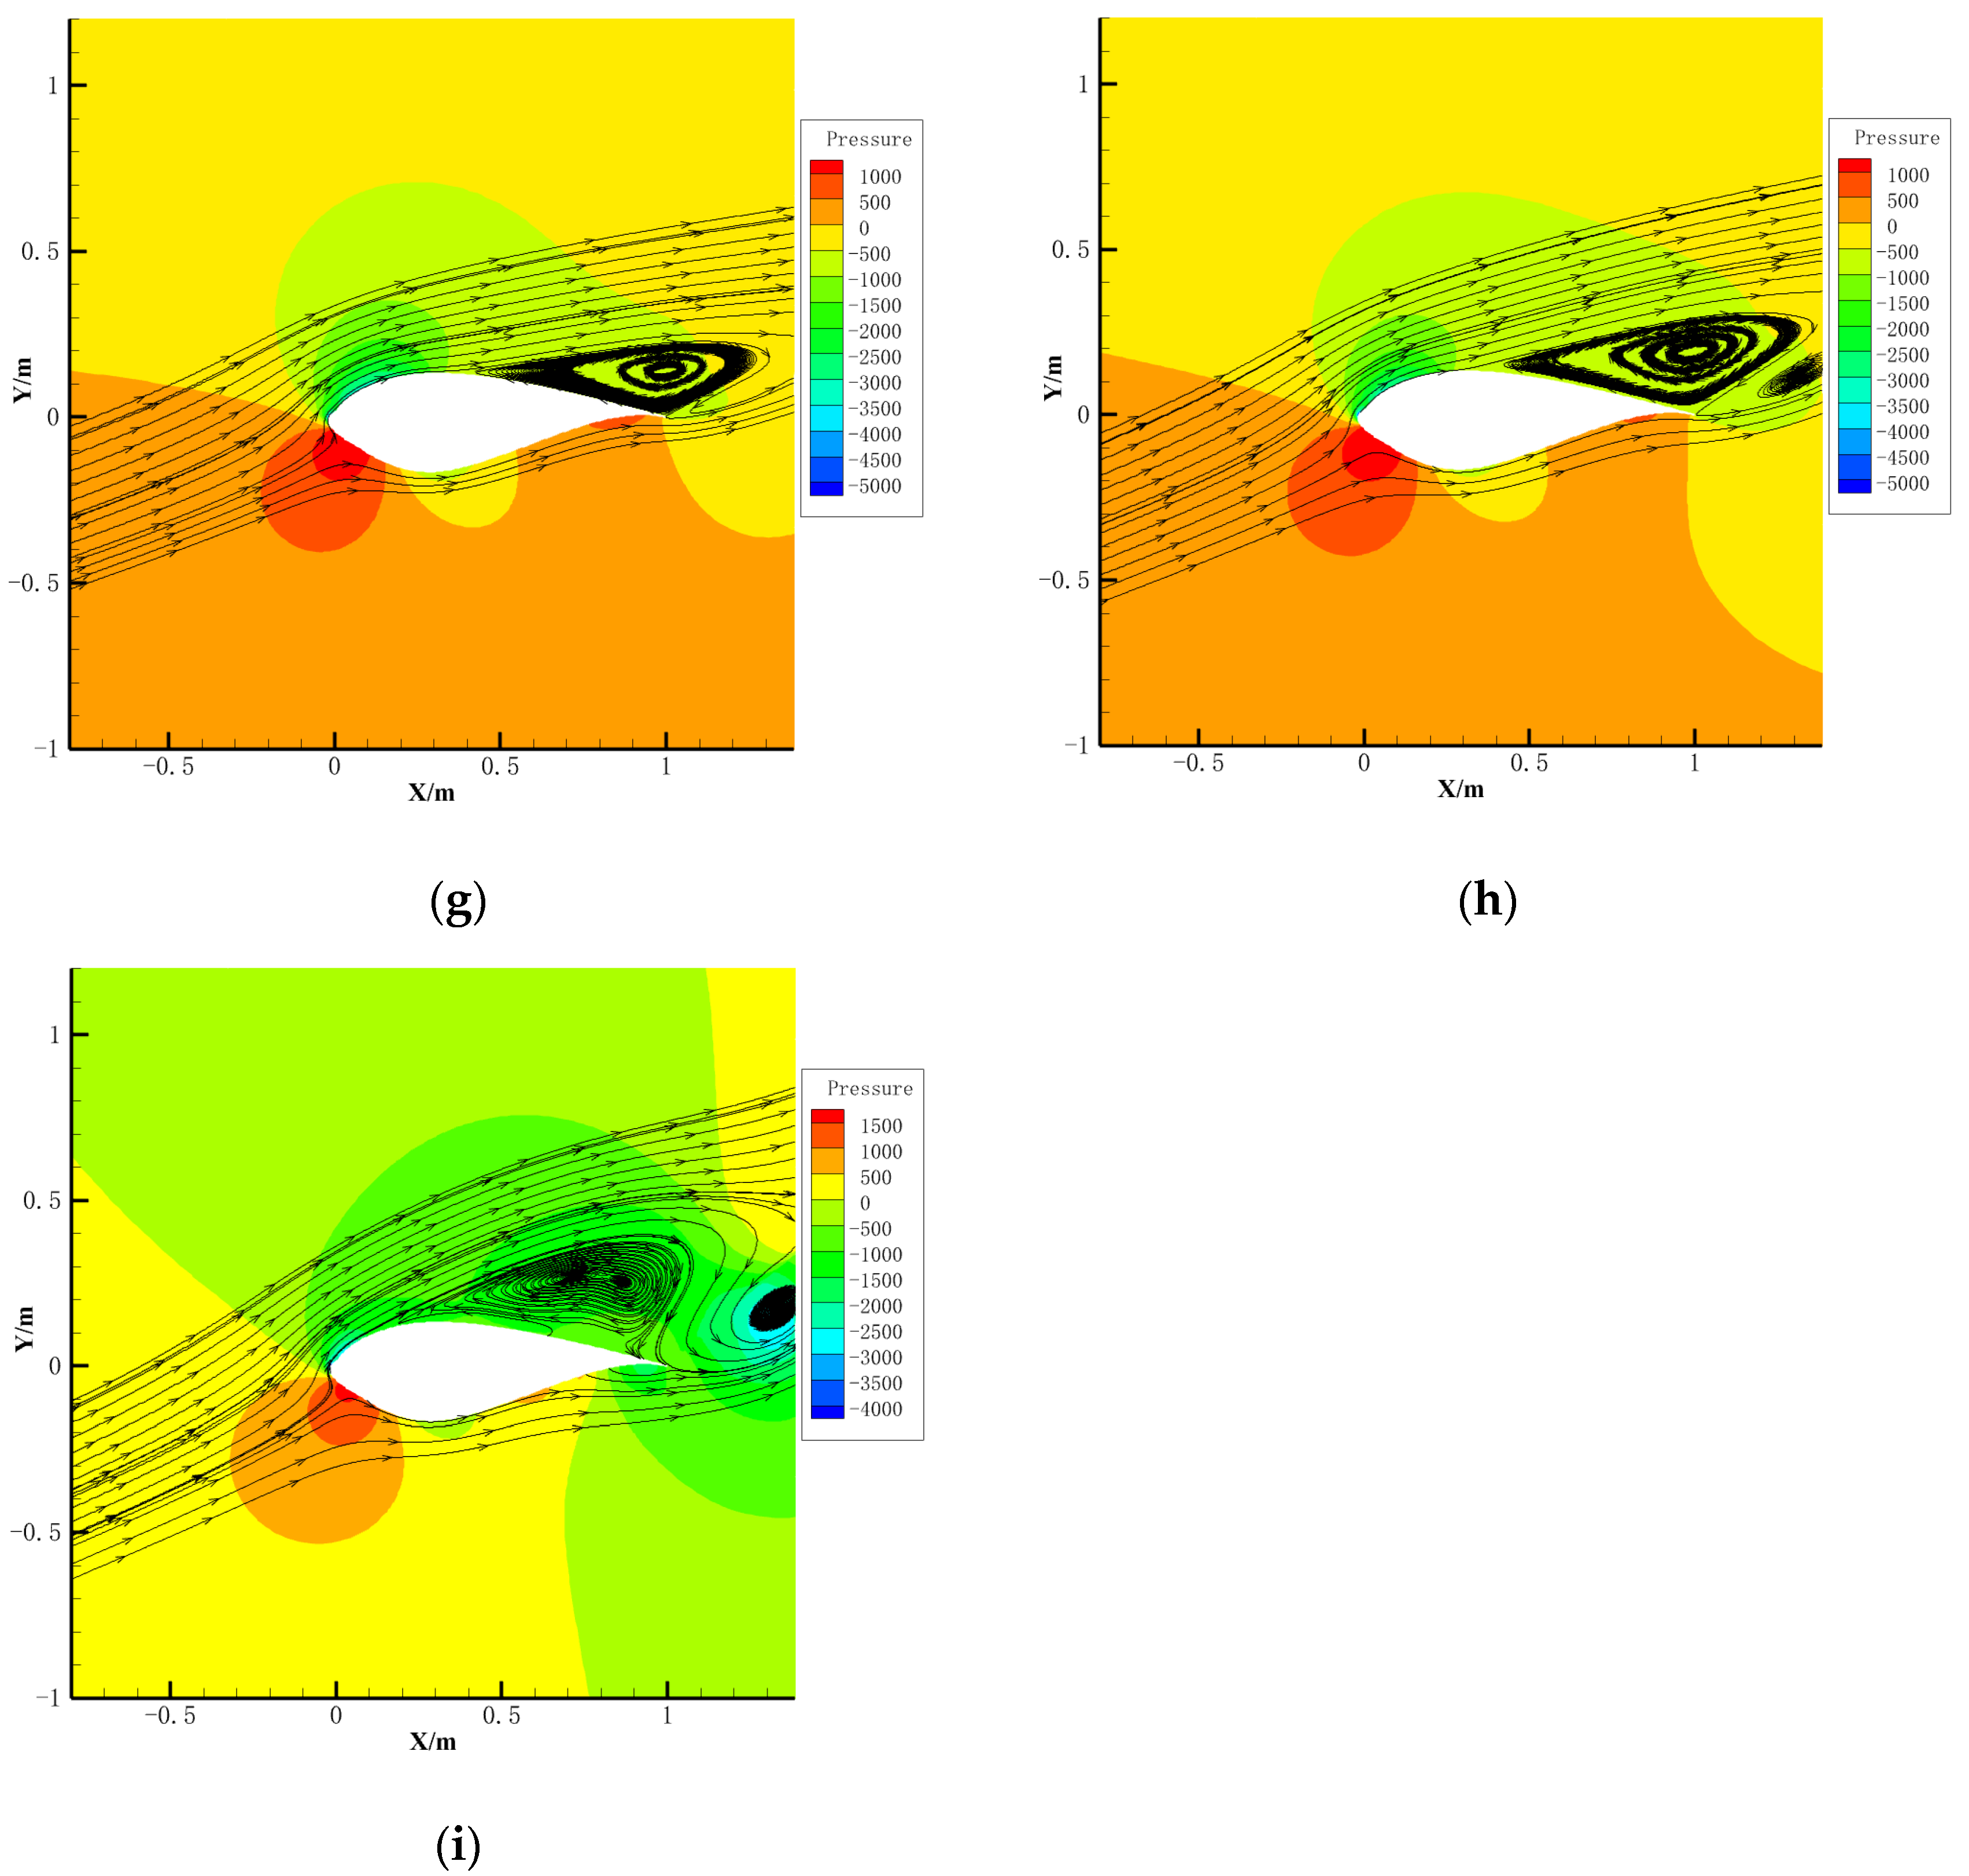
4.3. Aerodynamic Characteristics Under Glaze Ice Condition

The variations in pressure distribution and streamline of the airfoil with angle of attack under the glaze ice condition are given in Figure 10. The comparison shows that the pressure distribution and streamlines significantly change after icing. The icing causes smaller vortex structures to appear behind the ice shape, which destroys the original airflow streamlines, leading to a decrease in the lift coefficient and premature separation of the airflow. From the calculation results under different angles of attack, it can be seen that when the angle of attack reaches 8°, a small separation vortex appears near the trailing edge of the iced wind turbine airfoil. As the angle of attack continues to increase, the range of the separated vortex gradually expands. In contrast, the un-iced wind turbine airfoil shows a separation vortex on the trailing edge at 14°, indicating that the ice shape under glaze ice conditions will cause the vortex structure at the trailing edge to appear earlier. The appearance of a separated vortex will increase the upper surface pressure, resulting in a decrease in lift and an increase in drag of the airfoil. The separation vortex near the trailing edge of the airfoil gradually expands, and the airfoil is basically in a complete stall state. It can be seen that there are differences between the separation morphology caused by ice formation at the leading edge of the airfoil and the high angle of attack of the clean airfoil. The separation of clean airfoil is directly related to the reverse pressure gradient in the flow direction. The separation of icing airfoils is usually caused by abrupt changes in local geometric features, leading to direct instability and detachment of the shear layer.
Figure 11a,b show the variation trends of lift and drag coefficients of the airfoil after icing under both the un-iced and glaze ice condition. From the lift coefficients, it can be seen that the maximum lift coefficient point of the wind turbine airfoil after icing is significantly advanced from 14° to 8° compared to that of the un-iced airfoil. This indicates that the airfoil is more prone to stall, leading to the deterioration of aerodynamic characteristics. The lift coefficient also shows a significant decrease at all angles of attack. At the angle of attack of 10°, the lift coefficient decreases from 1.448 to 0.762, with a decrease of 47.3%. At the angle of attack of 14°, the lift coefficient decreases from 1.679 to 0.657, with a decrease of 60.8%. From the perspective of drag coefficient, the drag coefficient of the wind turbine airfoil also increases significantly after icing. At the angle of attack of 10°, the drag coefficient increases from 0.0246 to 0.0707, with an increase of 187.3%. At the angle of attack of 12°, the drag coefficient increases from 0.0308 to 0.1053, with an increase of 241.8%. The trend of the lift-to-drag ratio is shown in Figure 11c. The lift-to-drag ratio of the wind turbine airfoil after icing is smaller than that of the un-iced airfoil. At an angle of attack of 8°, the lift-to-drag ratio decreases from 62.9 to 18.8, a decrease of 70.1%. At an angle of attack of 14°, the lift-to-drag ratio decreases from 38.9 to 4.69, a decrease of 87.9%. It can be seen that the aerodynamic characteristics of the wind turbine airfoil seriously deteriorate after icing under the glaze ice condition. At this time, the wind turbine can no longer generate power normally, and it needs to use a de-icing system to operate normally.

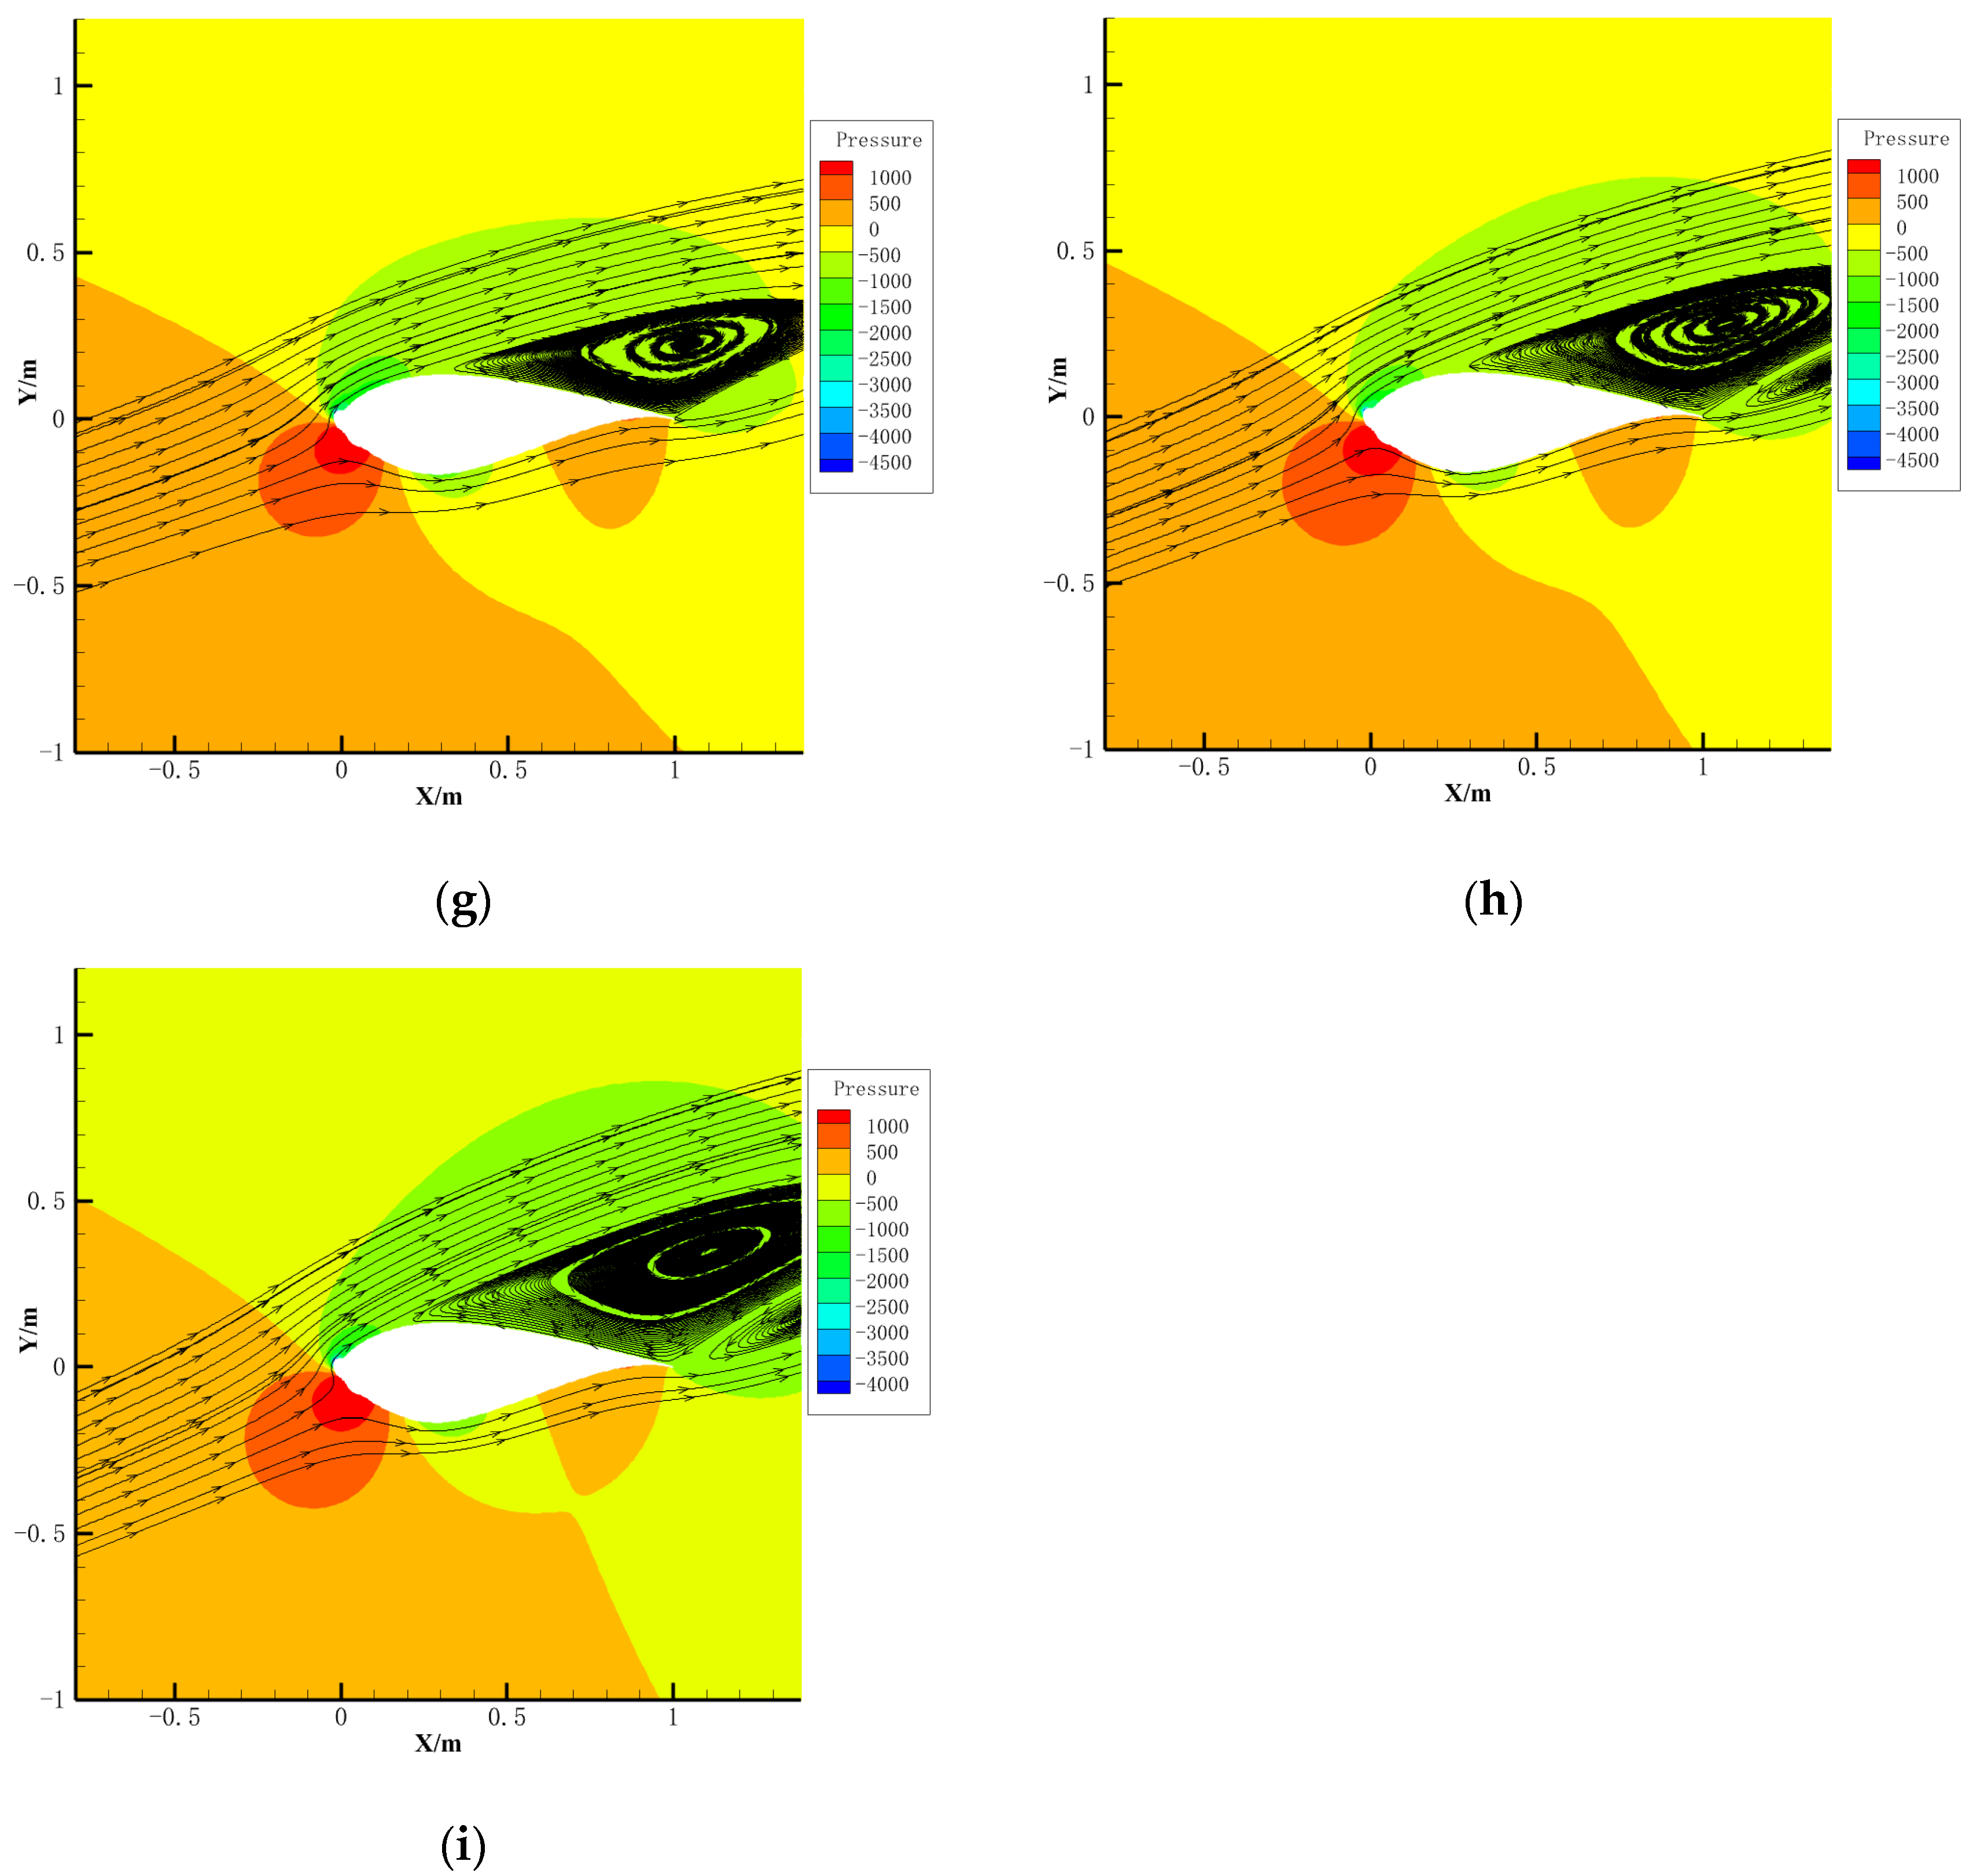
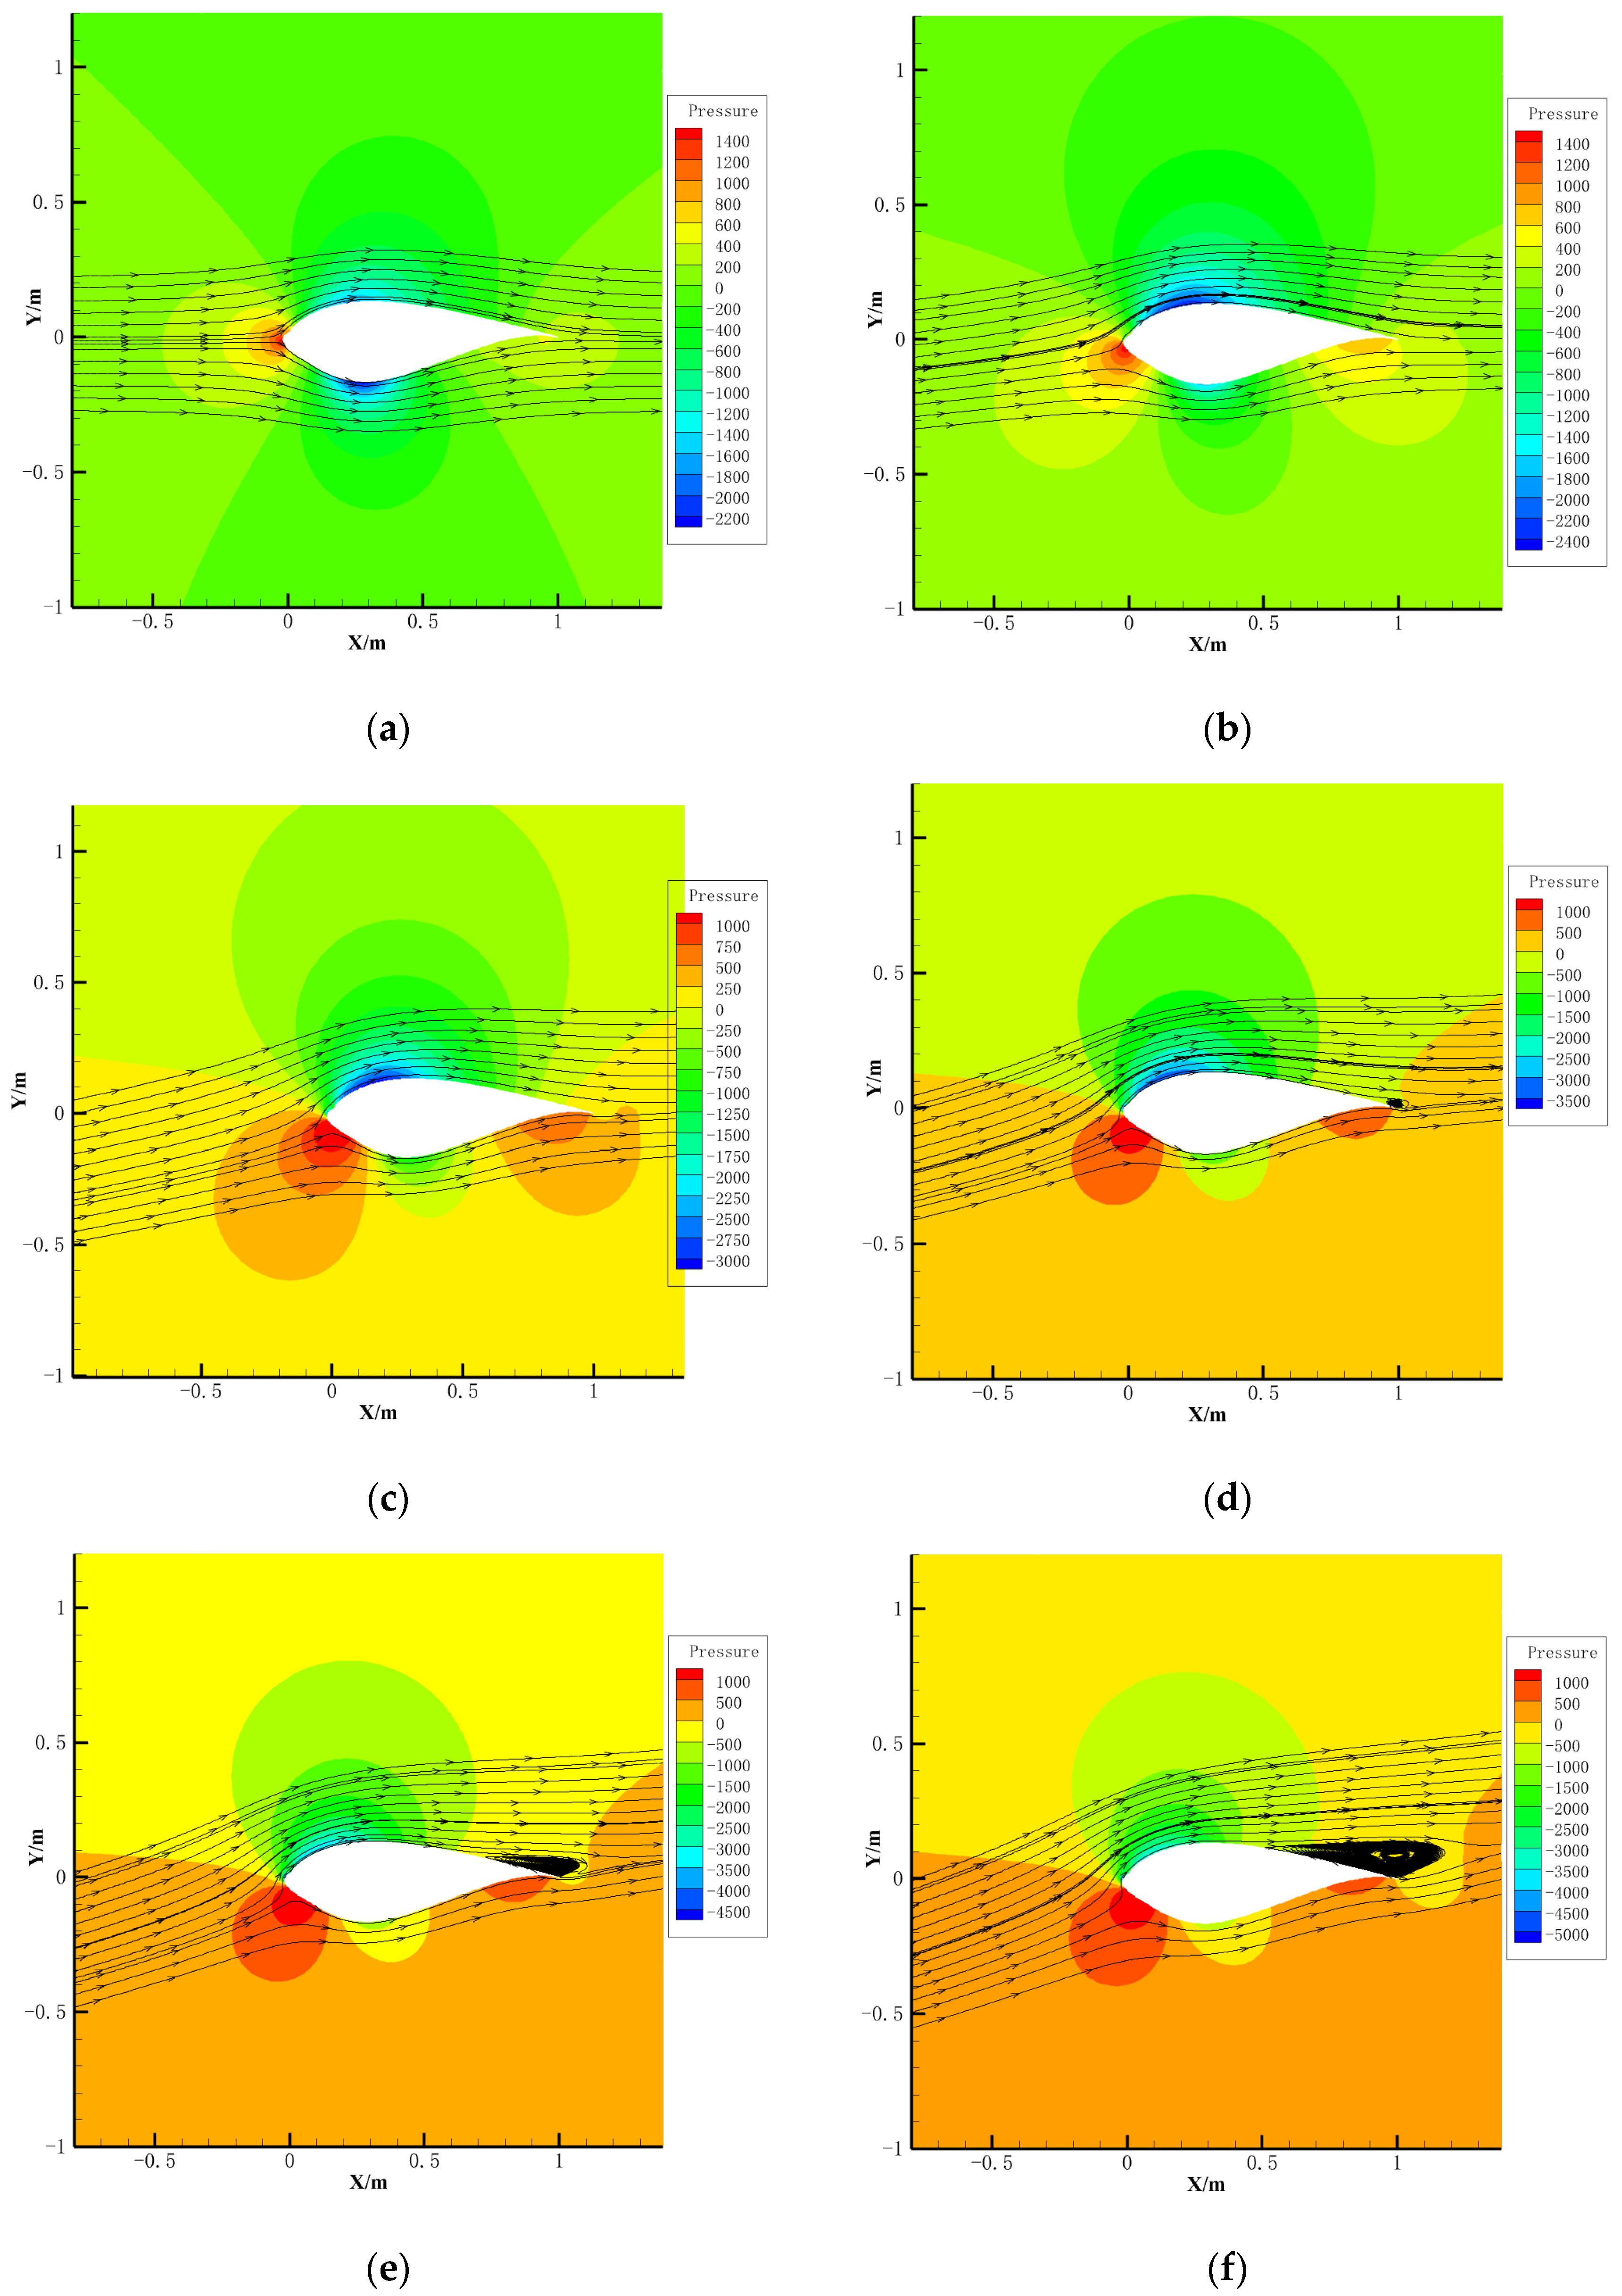
4.4. Aerodynamic Characteristics Under Rime Ice Condition

Figure 12 shows the variation in pressure distribution and streamline with angle of attack of the wind turbine airfoil under the rime ice condition. It can be seen that when the angle of attack reaches 12°, a significant separation vortex appears near the trailing edge of the wind turbine airfoil after icing, and as the angle of attack increases, the range of the separation vortex gradually expands. Compared with the un-iced condition, the angle of attack of the separated vortex appears relatively earlier. The appearance of the separation vortex deteriorates the aerodynamic characteristics of the airfoil after icing, resulting in a decrease in lift coefficient and an increase in drag coefficient. However, comparing the airfoil airflow under the rime ice condition with that under the glaze ice condition, it can be found that the angle of attack at which the separating vortex appears in the glaze ice condition is larger than that in the rime ice condition. This indicates that the aerodynamic characteristics of the wind turbine airfoil after icing in the rime ice condition are better than in the glaze ice condition, which means that the effect of glaze ice on wind turbines is more severe than that of rime ice. This is due to the ice shape at the leading edge in the glaze ice condition showing an irregular ram’s horn shape, which causes significant disruption to the airflow streamlines. In the case of rime ice, supercooled droplets and ice crystals freeze immediately after impacting on the surface. The appearance of rime ice is relatively less deformed than glaze ice, and the damage to the leading edge airflow streamline is relatively small. Rime ice causes less abrupt geometrical changes, and the airflow is relatively less affected. Therefore, the separation effect at the trailing edge of the airfoil is also relatively small. The aerodynamic effect on the wind turbine airfoil is significant in the glaze ice, and it is more important to pay attention to the icing problem of the wind turbine at higher temperatures.
The trends of the lift and drag coefficients of the wind turbine airfoil after icing for the un-iced and rime ice conditions are given in Figure 13a,b. From the lift coefficients, it can be seen that the maximum lift coefficient point of the wind turbine airfoil after icing slightly increases from 14° to 12° compared to that of the un-iced airfoil. The lift coefficient slightly decreases at various angles of attack. At the angle of attack of 10°, the lift coefficient decreases from 1.448 to 1.204, a decrease of 16.8%. At the angle of attack of 14°, the lift coefficient decreases from 1.679 to 1.158, a decrease of 31.0%. In terms of drag coefficients, the drag coefficients of wind turbine airfoils increase slightly after icing. At the angle of attack of 10°, the drag coefficient increases from 0.0246 to 0.0357, with an increase of 45.1%. At the angle of attack of 14°, the drag coefficient increases from 0.0431 to 0.079, with an increase of 83.2%. Although the lift coefficient of the wind turbine airfoil still decreases and the drag coefficient still increases under the rime ice condition, the magnitude of the decrease in lift coefficient and the increase in drag coefficient is significantly reduced compared to the glaze ice conditions. The aerodynamic characteristics of the airfoil under the rime ice condition are better than those under the glaze ice condition. Figure 13c shows the variation trend of the lift-to-drag ratio. It can be seen that the lift-to-drag ratio of the wind turbine airfoil after icing is smaller than that of the clean airfoil. At the angle of attack of 8°, the lift-to-drag ratio decreases from 62.9 to 40.1, with a decrease of 36.2%. At the angle of attack of 14°, the lift-to-drag ratio decreases from 38.9 to 14.6, with a decrease of 62.4%. The aerodynamic characteristics of the wind turbine airfoil also deteriorate after icing under rime ice conditions, but the magnitude of deterioration is significantly reduced compared to the glaze ice, indicating that the effect of the glaze ice condition on wind turbines is greater than that of the rime ice condition.

5. Conclusions

In this paper, the aerodynamic characteristics of wind turbine airfoils after icing were numerically calculated under mixed-phase conditions. Firstly, the mixed-phase icing numerical simulation method was introduced, and the calculation method of aerodynamic characteristics and the mixed-phase icing characteristics of wind turbine airfoils were investigated. The changes in the ice shapes of the airfoil with increasing time were analyzed and the mixed-phase icing characteristics of wind turbine under different temperature conditions were investigated. Then, the effect of icing growth process on the aerodynamic characteristics of wind turbine airfoils was analyzed. The aerodynamic characteristics of the airfoils for both glaze ice and rime ice conditions were studied, and the effect of the different icing types on the aerodynamic characteristics of the airfoil was compared. The following conclusions were obtained through numerical calculations:
(1)
As icing gradually accumulates, the icing thickness gradually increases. The higher the icing temperature, the wider the range of icing on the wind turbine airfoil and the higher the total amount of icing.
(2)
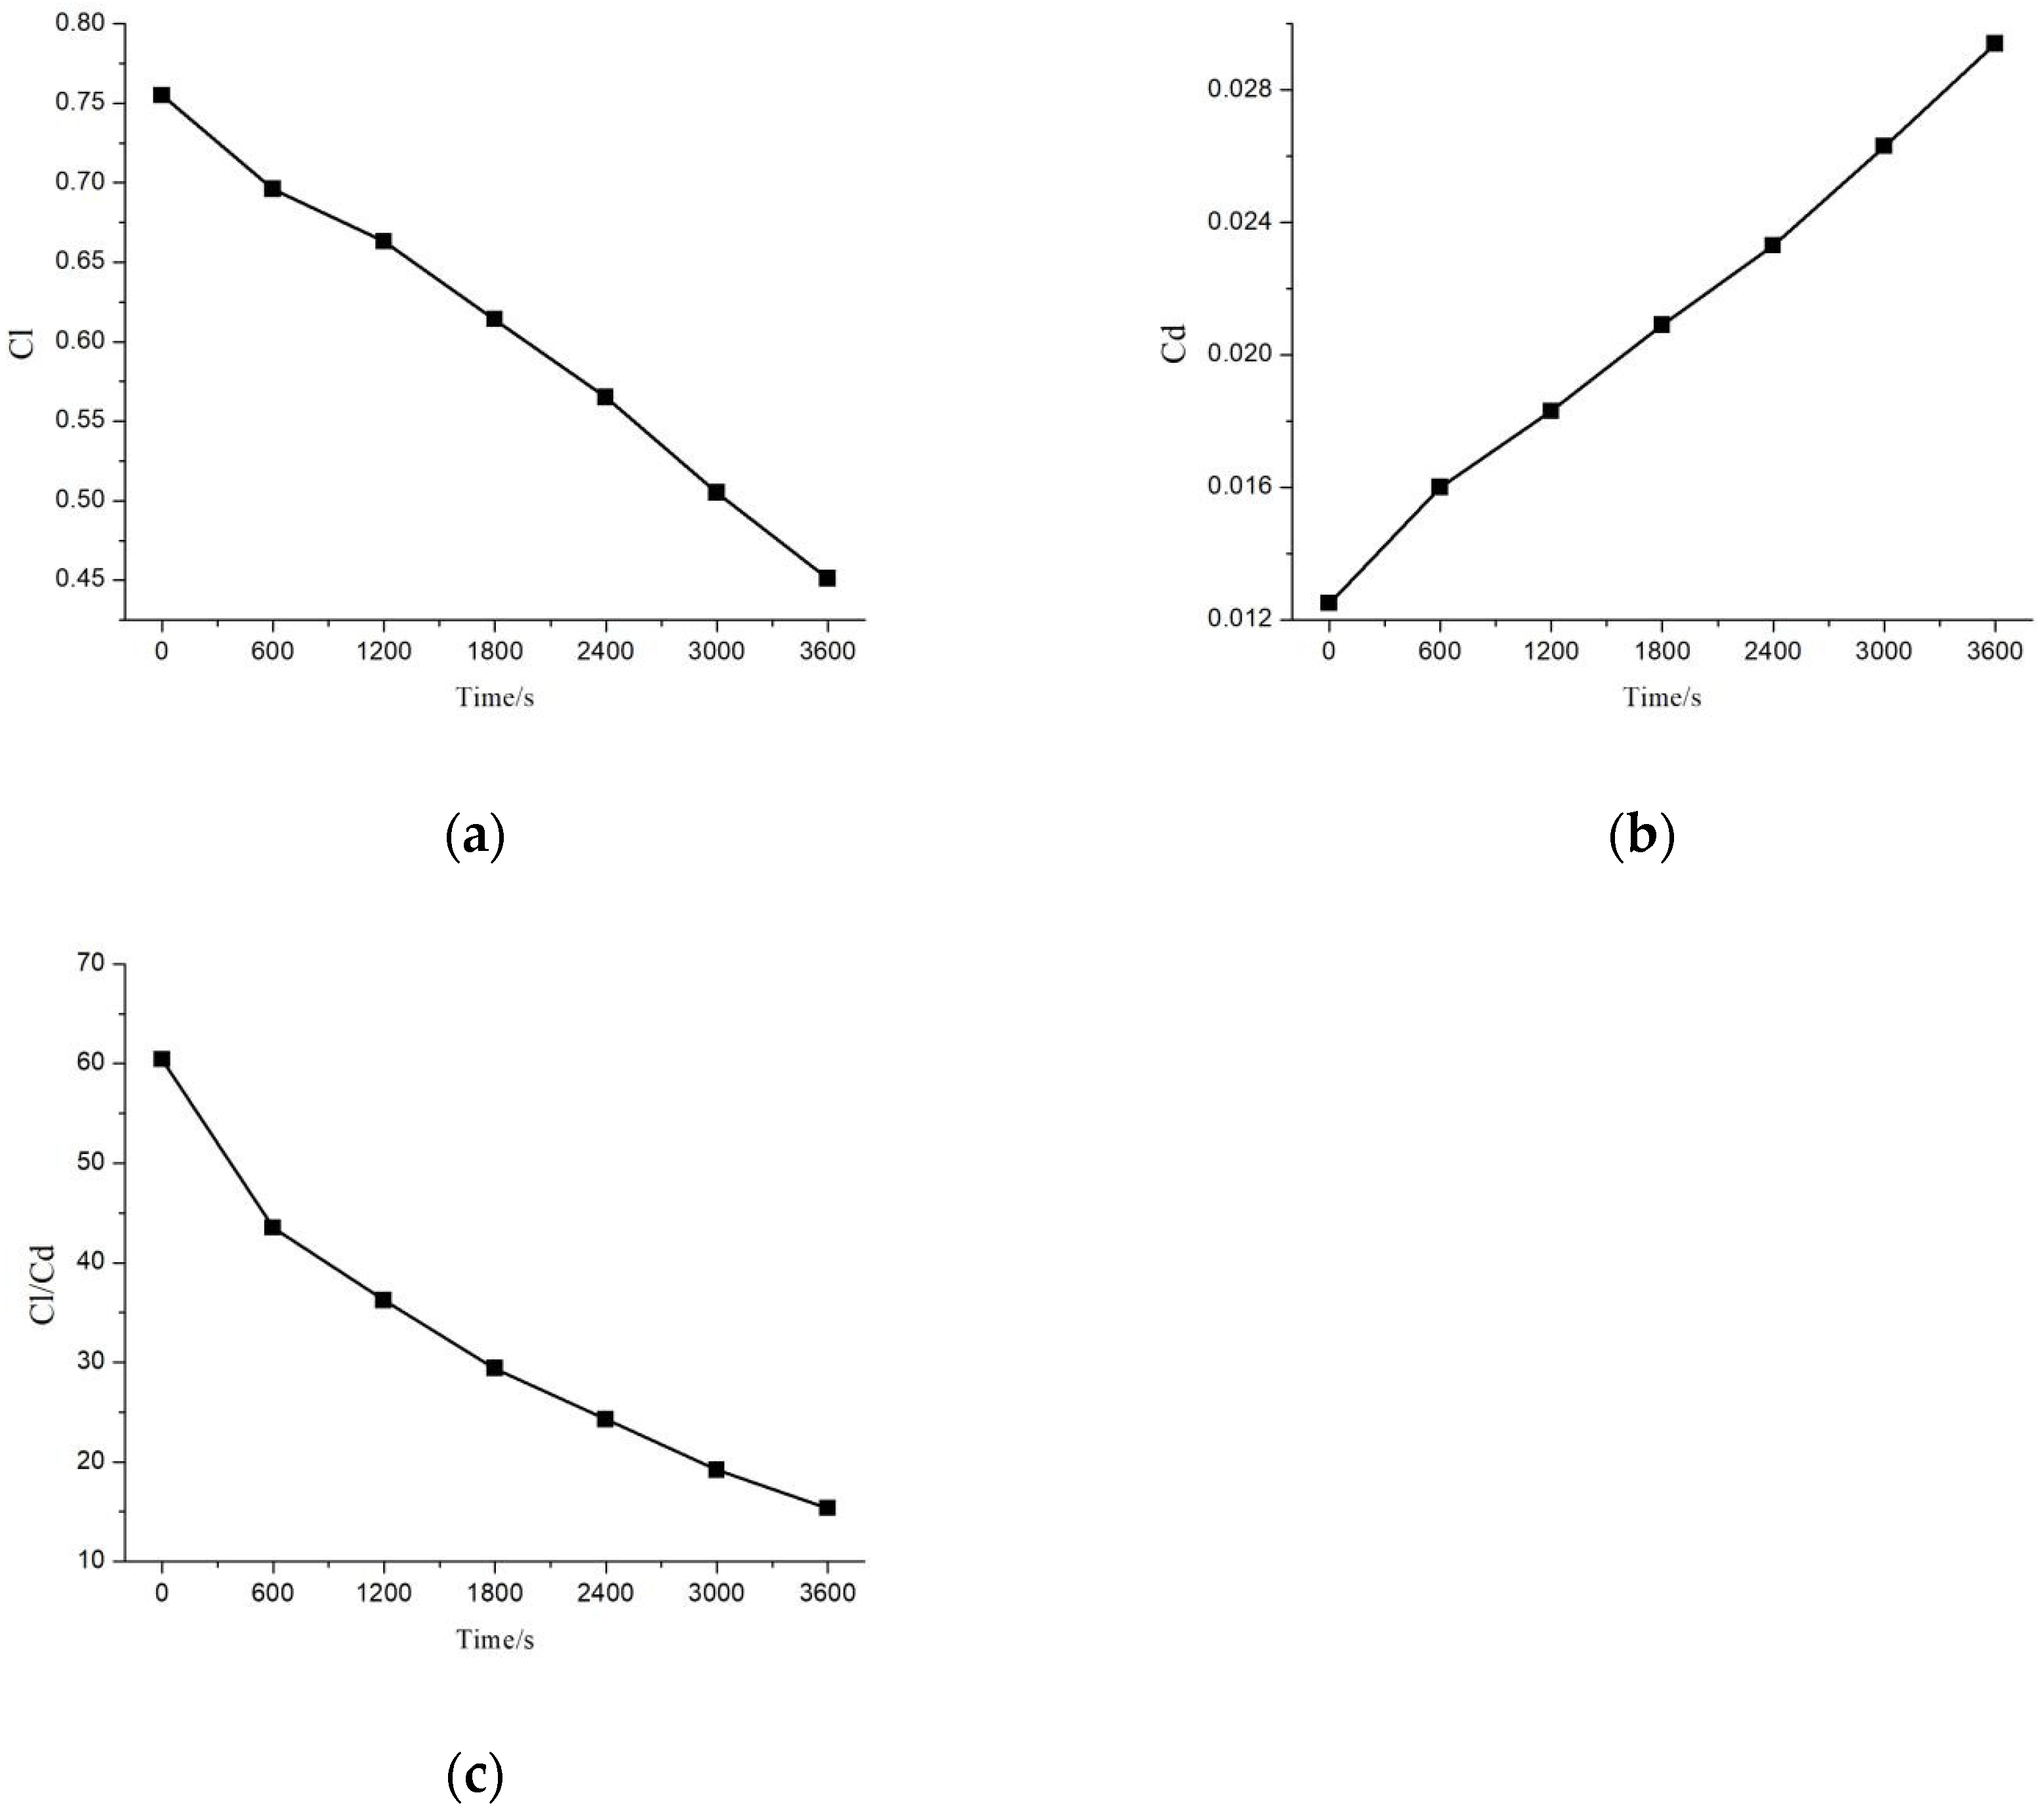
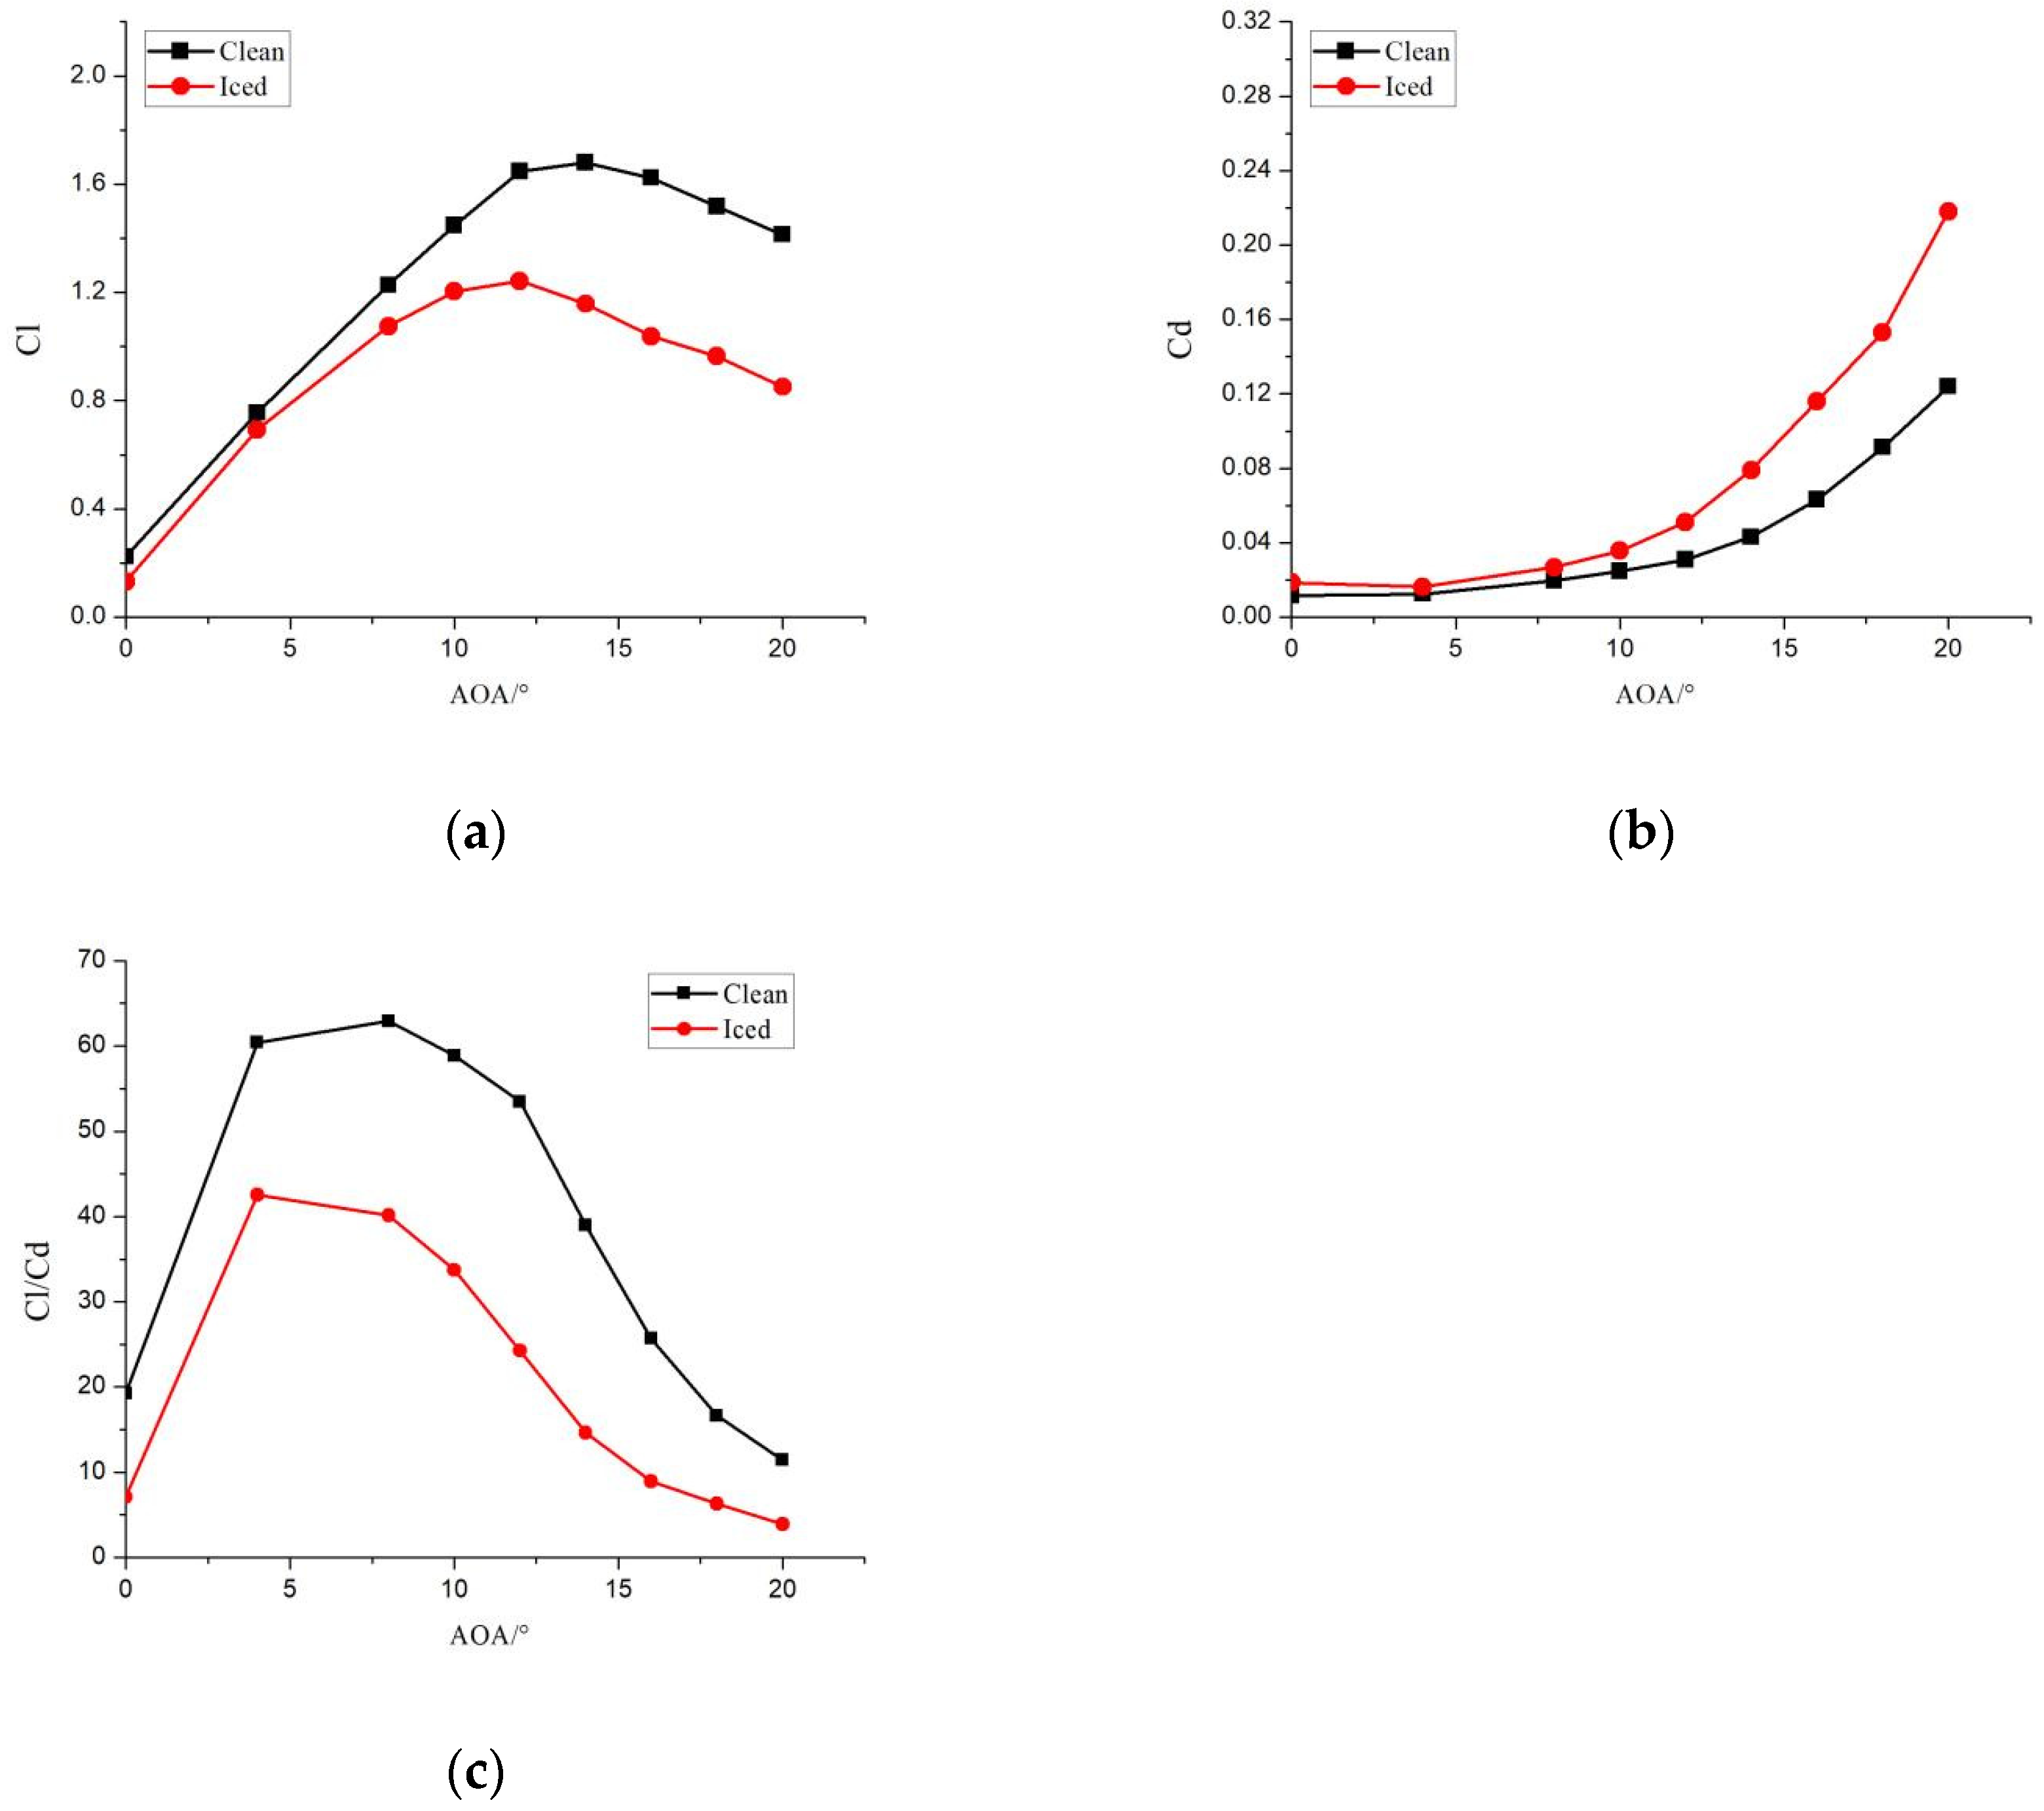
The aerodynamic characteristics of the wind turbine airfoil decrease with the icing growth. After 3600 s of icing, the lift coefficient decreases by 40.2%, the drag coefficient increases by 135.2%, and the lift-to-drag ratio decreases by 74.6%.
(3)
Under the glaze ice condition, the lift coefficient of the wind turbine airfoil decreases by up to 60.8%, the drag coefficient increases by up to 241.8%, the lift-to-drag ratio decreases by up to 87.9%, and the stall angle of attack advances from 14° to 8°. Under the rime ice condition, lift coefficient decreases by up to 31.0%, drag coefficient increases by up to 83.2%, lift-to-drag ratio decreases by up to 62.4%, and the stall angle of attack is advanced from 14° to 12°.
(4)
The harm of icing on the aerodynamic characteristics of the wind turbine airfoil under the glaze ice condition is significantly greater than that in the rime ice condition.

Author Contributions

Conceptualization, X.W. and Y.R.; methodology, X.W.; software, Z.W.; validation, X.W., H.Z. and Z.W.; investigation, X.W., H.Z. and Z.W.; writing—original draft preparation, X.W. and Y.R.; writing—review and editing, X.W., Y.R. and Z.W.; supervision, H.Z.; project administration, H.Z.; funding acquisition, X.W. and H.Z. All authors have read and agreed to the published version of the manuscript.

Funding

This work was supported by the Aeronautical Science Foundation of China (Grant No. 2023M066027001, 2022Z006026005), the Postgraduate Research & Practice Innovation Program of Jiangsu Province (Grants No. SJCX24_1307), the Industry-University-Research Cooperation Project of Jiangsu Province (Grants No. BY20230704) and Scientific Research Foundation of Nanjing Institute of Technology (Grants No. 3612403222440).

Institutional Review Board Statement

Not applicable.

Informed Consent Statement

Not applicable.

Data Availability Statement

Data is contained within the article.

Conflicts of Interest

Author Huanyu Zhao was employed by the AVIC Aerodynamics Research Institute. The remaining authors declare that the research was conducted in the absence of any commercial or financial relationships that could be construed as a potential conflict of interest.

References

  1. Zhang, Z.; Zhang, H.; Zhang, X.; Hu, Q.; Jiang, X. A Review of Wind Turbine Icing and Anti/De-Icing Technologies. Energies 2024, 17, 2805. [Google Scholar] [CrossRef]
  2. Frohboese, P.; Anders, A. Effects of icing on wind turbine fatigue loads. J. Phys. Conf. Ser. 2007, 75, 01206. [Google Scholar] [CrossRef]
  3. Gantasala, S.; Luneno, J.C.; Aidanpää, J.O. Influence of Icing on the Modal Behavior of Wind Turbine Blades. Energies 2016, 9, 862. [Google Scholar] [CrossRef]
  4. Fortin, G.; Perron, J. Wind Turbine Icing and De-icing. In Proceedings of the 47th AIAA Aerospace Sciences Meeting, Orlando, FL, USA, 5–8 January 2009. [Google Scholar]
  5. Wang, Z.; Zhu, C. Numerical simulation for in-cloud icing of three-dimensional wind turbine blades. Simulation 2018, 94, 31–41. [Google Scholar] [CrossRef]
  6. Bian, P.; Wang, F.; Wang, L.; Kong, W.; Liu, H. The microscopic contact morphology of ice crystal on substrate and its effect on heterogeneous nucleation/icing. Int. J. Heat Mass Transf. 2023, 209, 124125. [Google Scholar] [CrossRef]
  7. Tetteh, E.; Loth, E.; Neuteboom, M.O.; Fisher, J. In-flight gas turbine engine icing. AIAA J. 2022, 60, 5610–5632. [Google Scholar] [CrossRef]
  8. Haggerty, J.; Defer, E.; De Laat, A.; Bedka, K.; Moisselin, J.; Potts, R.; Divito, S. Detecting Clouds Associated with Jet Engine Ice Crystal Icing. Bull. Am. Meteorol. Soc. 2019, 100, 31–40. [Google Scholar] [CrossRef] [PubMed]
  9. Mason, J.; Strapp, W.; Chow, P. The ice particle threat to engines in flight. In Proceedings of the 44th AIAA Aerospace Sciences Meeting and Exhibit, Reno, NV, USA, 9–12 January 2006. [Google Scholar]
  10. Addy, H.E.; Veres, J.P. An overview of NASA engine ice-crystal icing research. In Proceedings of the International Conference on Aircraft and Engine Icing and Ground Deicing, Chicago, IL, USA, 13–17 June 2011. [Google Scholar]
  11. Dezitter, F.; Grandin, A.; Brenguier, J.L.; Hervy, F.; Schlager, H.; Villedieu, P.; Zalamansky, G. HAIC-High Altitude Ice Crystals. In Proceedings of the 5th AIAA Atmospheric and Space Environments Conference, San Diego, CA, USA, 24–27 June 2013. [Google Scholar]
  12. Bucknell, A.; McGilvray, M.; Gillespie, D.R.; Jones, G.; Reed, A.; Buttsworth, D.R. Heat transfer in the core compressor under ice crystal icing conditions. J. Eng. Gas Turbines Power 2018, 140, 071501. [Google Scholar] [CrossRef]
  13. Abdelghany, E.S.; Sarhan, H.H.; El Saleh, A.; Farghaly, M.B. High bypass turbofan engine and anti-icing system performance: Mass flow rate of anti-icing bleed air system effect. Case Stud. Therm. Eng. 2023, 45, 102927. [Google Scholar] [CrossRef]
  14. Al-Khalil, K.; Irani, E.; Miller, D. Mixed phase icing simulation and testing at the cox icing wind tunnel. In Proceedings of the 41st Aerospace Sciences Meeting and Exhibit, Reno, NV, USA, 6–9 January 2003. [Google Scholar]
  15. Currie, T.; Struk, P.; Tsao, J.C.; Fuleki, D.; Knezevici, D. Fundamental study of mixed-phase icing with application to ice crystal accretion in aircraft jet engines. In Proceedings of the 4th AIAA Atmospheric and Space Environments Conference, New Orleans, LA, USA, 25–28 June 2012. [Google Scholar]
  16. Currie, T.; Fuleki, D.; Mahallati, A. Experimental Studies of Mixed-Phase Sticking Efficiency for Ice Crystal Accretion in Jet Engines. In Proceedings of the 6th AIAA Atmospheric and Space Environments Conference, Atlanta, GA, USA, 16–20 June 2014. [Google Scholar]
  17. Currie, T.; Fuleki, D. Experimental Results for Ice Crystal Icing on Hemispherical and Double Wedge Geometries at Varying Mach Numbers and Wet Bulb Temperatures. In Proceedings of the 8th AIAA Atmospheric and Space Environments Conference, Washington, DC, USA, 13–17 June 2016. [Google Scholar]
  18. Struk, P.M.; King, M.C.; Bartkus, T.P.; Tsao, J.C.; Fuleki, D.; Neuteboom, M.; Chalmers, J. Ice crystal icing physics study using a NACA 0012 airfoil at the national research council of Canada’s research altitude test facility. In Proceedings of the 2018 Atmospheric and Space Environments Conference, Atlanta, GA, USA, 25–29 June 2018. [Google Scholar]
  19. Baumert, A.; Bansmer, S.; Trontin, P.; Villedieu, P. Experimental and numerical investigations on aircraft icing at mixed phase conditions. Int. J. Heat Mass Transf. 2018, 123, 957–978. [Google Scholar] [CrossRef]
  20. Trontin, P.; Blanchard, G.; Villedieu, P. A comprehensive numerical model for mixed-phase and glaciated icing conditions. In Proceedings of the 8th AIAA Atmospheric and Space Environments Conference, Washington, DC, USA, 13–17 June 2016. [Google Scholar]
  21. Trontin, P.; Villedieu, P. A comprehensive accretion model for glaciated icing conditions. Int. J. Multiph. Flow 2018, 108, 105–123. [Google Scholar] [CrossRef]
  22. Nilamdeen, S.; Habashi, W.G. Multiphase approach toward simulating ice crystal ingestion in jet engines. J. Propuls. Power 2011, 27, 959–969. [Google Scholar] [CrossRef]
  23. Bucknell, A.; McGilvray, M.; Gillespie, D.R.; Jones, G.; Collier, B. A thermodynamic model for ice crystal accretion in aircraft engines: EMM-C. Int. J. Heat Mass Transf. 2021, 174, 121270. [Google Scholar] [CrossRef]
  24. Malik, Y.A.; Köbschal, K.; Bansmer, S.; Tropea, C.; Hussong, J.; Villedieu, P. Ice accretion compositions in ice crystal icing. Int. J. Heat Mass Transf. 2024, 220, 124910. [Google Scholar] [CrossRef]
  25. Malik, Y.A.; Bennani, L.; Bansmer, S.; Trontin, P.; Villedieu, P. Experimental and numerical investigation of accretion inception and heat transfer physics in ice crystal icing. Int. J. Heat Mass Transf. 2023, 214, 124364. [Google Scholar] [CrossRef]
  26. Malik, Y.A.; Karpen, N.; Bonaccurso, E.; Roisma, I.; Hussong, J.; Villedieu, P. Experimental investigation of the accretion and shedding process on a heatable NACA0012 airfoil in ice crystal icing conditions. Cold Reg. Sci. Technol. 2024, 217, 104030. [Google Scholar] [CrossRef]
  27. Norde, E. Eulerian Method for Ice Crystal Icing in Turbo Fan Engines. Ph.D. Thesis, University of Twente, Enschede, The Netherlands, 2017. [Google Scholar]
  28. Zhang, L.; Liu, Z.; Zhang, M. Numerical simulation of ice accretion under mixed-phase conditions. Proc. Inst. Mech. Eng.—Part G J. Aerosp. Eng. 2016, 230, 2473–2483. [Google Scholar] [CrossRef]
  29. Jia, W.; Yang, B.; Zheng, M.; Kong, Q. Numerical investigation of ice crystal melting characteristic and icing risk in an axial compressor. Int. J. Turbo Jet-Engines 2024, 41, 139–149. [Google Scholar] [CrossRef]
  30. Wang, X.; Ru, Y.; Zhao, H.; Wang, Z. Numerical Investigation of Wind Turbine Airfoil Icing and Its Influencing Factors under Mixed-Phase Conditions. Energies 2024, 17, 4993. [Google Scholar] [CrossRef]
  31. Wang, Z.; Liu, C.; Zhong, W.; Zhao, H. Numerical simulation of ice crystal trajectory and its influencing factors based on Lagrangian method. Appl. Sci. 2023, 13, 4110. [Google Scholar] [CrossRef]
  32. Wang, Z.; Zhong, W.; Liu, C.; Zhao, H.; Liu, S. Numerical Simulation of Ice Crystal Supercooled Droplet Mixed Phase Icing Based on the Improved Messinger Model. Int. J. Aerosp. Eng. 2023, 1, 6696084. [Google Scholar] [CrossRef]
Figure 1. Overall grid of the airfoil.
Energies 18 00559 g001
Figure 2. Local grid of airfoil leading edge.
Energies 18 00559 g002
Figure 3. Comparison of calculation results with different grids: (a) lift coefficient; (b) drag coefficient.
Energies 18 00559 g003
Figure 4. Comparison of calculation results under different turbulence models: (a) lift coefficient; (b) drag coefficient.
Energies 18 00559 g004
Figure 5. Time-dependent ice shapes under mixed-phase conditions.
Energies 18 00559 g005
Figure 6. Effect of icing growth on airfoil flow field at a temperature of 266 K and angle of attack of 4°: (a) t = 0 s; (b) t = 600 s; (c) t = 1200 s; (d) t = 1800 s; (e) t = 2400 s; (f) t = 3000 s; (g) t = 3600 s; (h) t = 3600 s leading edge.
Energies 18 00559 g006aEnergies 18 00559 g006b
Figure 7. Aerodynamic characteristics of airfoil after icing over time at a temperature of 266 K and angle of attack of 4°: (a) lift coefficient; (b) drag coefficient; (c) lift-to-drag.
Energies 18 00559 g007
Figure 8. Comparison of icing at different icing temperatures.
Energies 18 00559 g008
Figure 9. Flow field of clean airfoil at normal temperature: (a) AOA = 0°; (b) AOA = 4°; (c) AOA = 8°; (d) AOA = 10°; (e) AOA = 12°; (f) AOA = 14°; (g) AOA = 16°; (h) AOA = 18°; (i) AOA = 20°.
Energies 18 00559 g009aEnergies 18 00559 g009b
Figure 10. Flow field of airfoil after icing under glaze ice condition at a temperature of 266 K: (a) AOA = 0°; (b) AOA = 4°; (c) AOA = 8°; (d) AOA = 10°; (e) AOA = 12°; (f) AOA = 14°; (g) AOA = 16°; (h) AOA = 18°; (i) AOA = 20°.
Energies 18 00559 g010aEnergies 18 00559 g010b
Figure 11. Aerodynamic characteristics of airfoil after icing under the glaze ice condition at a temperature of 266 K: (a) lift coefficient; (b) drag coefficient; (c) lift-to-drag.
Energies 18 00559 g011
Figure 12. Flow field of airfoil after icing under rime ice condition at a temperature of 253 K: (a) AOA = 0°; (b) AOA = 4°; (c) AOA = 8°; (d) AOA = 10°; (e) AOA = 12°; (f) AOA = 14°; (g) AOA = 16°; (h) AOA = 18°; (i) AOA = 20°.
Energies 18 00559 g012aEnergies 18 00559 g012b
Figure 13. Aerodynamic characteristics of airfoil after icing under rime ice condition at a temperature of 253 K: (a) lift coefficient; (b) drag coefficient; (c) lift-to-drag.
Energies 18 00559 g013
Disclaimer/Publisher’s Note: The statements, opinions and data contained in all publications are solely those of the individual author(s) and contributor(s) and not of MDPI and/or the editor(s). MDPI and/or the editor(s) disclaim responsibility for any injury to people or property resulting from any ideas, methods, instructions or products referred to in the content.

