Article

Catalytic Methane Decomposition for the Simultaneous Production of Hydrogen and Low-Reactivity Biocarbon for the Metallurgic Industry

by
Roger A. Khalil
1,*,
Sethulakshmy Jayakumari
2,
Halvor Dalaker
2,
Liang Wang
1,
Pål Tetlie
2 and
Øyvind Skreiberg
1
1
SINTEF Energy Research, P.O. Box 4761 Torgarden, NO-7465 Trondheim, Norway
2
SINTEF Industry, P.O. Box 4760 Torgarden, NO-7465 Trondheim, Norway
*
Author to whom correspondence should be addressed.
Energies 2025, 18(3), 558; https://doi.org/10.3390/en18030558
Submission received: 9 December 2024 / Revised: 15 January 2025 / Accepted: 20 January 2025 / Published: 24 January 2025
(This article belongs to the Section B: Energy and Environment)

Abstract

To reach agreed-on climate goals, it is necessary to develop new energy carriers and industrial materials that are carbon-neutral. To combat global warming and keep Earth’s temperature from increasing by 1.5 °C, some of these solutions need to be carbon-negative. This study fulfills this criterion by producing clean hydrogen and biocarbon suitable for the metallurgic industry through the thermal decomposition of methane using biocarbon as a catalyst. Five different biomass samples were used to prepare biocarbons at a pyrolysis temperature of 1000 °C with a holding time of 90 min. When methane was cracked at 1100 °C with a holding time of 90 min, the highest hydrogen production was 105 mol/kg biocarbon, achieved using birch bark. The lowest hydrogen yield, of 68 mol/kg biocarbon, was achieved with steam-explosion pellets. All the biocarbons showed substantial carbon deposition from cracked methane on their surfaces, with the highest deposition on birch bark and spruce wood biocarbons of 42% relative to the biocarbon start weight. The carbon deposition increased with the decomposition temperature, the methane share in the purge gas and the holding time. The steam-explosion pellets, after deactivation, had a CO2 reactivity that was comparable to coke, a reducing agent that is commonly used in manganese-producing industries. About 90% of the potassium and sodium were removed from the biocarbon during catalytic decomposition of methane performed at 1100 °C. The alkali removal was calculated relative to the biocarbon produced under the same conditions, but with 100% N2 purge instead of CH4. After catalytic decomposition, the surface area of the biocarbon was reduced by 11–34%, depending on the biocarbon type.

Graphical Abstract

1. Introduction

To reach our agreed climate goals, it is necessary to develop new energy carriers and industrial feedstocks free of fossil CO2 emissions, and most net-zero scenarios also include significant levels of CO2 capture and sequestration (CCS). The metallurgical industry is a large emitter of CO2, a significant portion of which is directly related to key chemical reactions producing metals from ores:
MeOx + (x/2) C → (x/2) CO2 + Me
This fact means that transitioning electricity production to 100% CO2-free energy will not be sufficient to decarbonize metal production. There are ongoing efforts to remove the carbon from the process, for example, by using hydrogen as a reducing agent [1,2,3,4,5] or using electrolytic processes [6,7,8]. These technologies are not mature and have the drawback that they will require a completely new process design and, most likely, completely new metallurgical plants. Due to the significant capital investments of metallurgical plants, the rollout of any such novel technology would most likely only proceed at the pace at which existing plants reach their end-of-life cycle. From this point of view, it is more attractive to replace fossil carbon raw materials with biogenic carbon or to capture and sequester CO2 from metallurgical plants. This would allow the core process to remain largely unchanged, while existing plants could continue to operate without CO2 emissions. The combination of both technologies, i.e., use of biogenic carbon with CCS, would allow for a carbon-negative process.
Biocarbon from biomass is prepared by thermal treatment under inert conditions to obtain a carbon-rich solid suitable for a wide variety of applications. Unsurprisingly, there have been significant efforts to use ever-larger fractions of biocarbon in metallurgical plants. The success of these efforts varies between industries. There are open-hearth silicon plants in Brazil that are operating today on 100% biocarbon [9]. Producing other metals and alloys has been more challenging. In the case of ferromanganese and silicomanganese, for example, biocarbon levels in furnaces remain low. This is because the properties of biocarbon differ from those of the traditional carbon sources like coal and coke, particularly in terms of chemical reactivity and physical strength. Unless these issues are resolved, fractions of biocarbon used will remain limited. The high porosity (and corresponding low density) of biocarbon limits its compressive and mechanical strengths. It also increases its chemical reactivity due to increased surface area. This is at odds with its use in manganese alloy production, where the carbon material, as it descends into the reaction zone, meets rising CO2 with which it may react, causing carbon loss and additional energy demand through the Boudouard reaction:
CO2 + C ⇄ 2CO,
A denser biocarbon material has the potential to have more appropriate strength and reactivity. One way of increasing the density that has been recently proposed but little studied is to deposit carbon from methane through pyrolysis [10]. At a high temperature, methane will decompose into elemental carbon and hydrogen:
CH4 → C(s) + 2H2,
Methane pyrolysis has also been studied as a potential route for hydrogen production. Hydrogen is foreseen to be the energy carrier of the future, as it does not contain any carbon and therefore does not produce any CO2 during its conversion. Currently, the most-used method for producing hydrogen, and that with the highest energy efficiency and the lowest cost compared to other conventional methods, is steam methane reforming (SMR) [11]. In SMR, methane is first converted to syngas via reaction with steam, and the CO is then converted to CO2 and H2 via the water–gas shift reaction in a subsequent reactor:
CH4 + H2O ⇄ 3H2 + CO,
CO + H2O ⇄ CO2 + H2,
The purification of hydrogen requires a further process step, typically pressure-swing adsorption. A carbon-neutral process would require a biogenic feedstock or the separation and stable deposition of CO2 [12]. However, as current practice is to use fossil methane and no carbon capture, SMR causes emissions of around 9 kg CO2eq/kg H2.
Catalytic decomposition of methane (CDM) is a process by which methane is thermally cracked, using a catalyst, to produce elemental carbon and H2 free of CO and CO2, with no need for carbon capture and storage. There are other advantages in comparison to SMR: lower process complexity, lower theoretical energy input per produced H2 (37.8 kJ/mol H2 for CDM compared to 63.3 kJ/mol H2 for SMR) and no need for steam production. However, the hydrogen needs to be separated, while the other gases, methane and other hydrocarbons can be recycled back to the CDM reactor. The thermal cracking of methane without a catalyst requires high temperatures (above 1200 °C) to achieve reasonable H2 yields. However, with the use of a catalyst, methane can be dissociated at temperatures as low as 550 °C [13]. Despite all these advantages, hydrogen production through CDM is still not commercially viable due to the challenges described. Several catalysts have been investigated for the catalytic dissociation of methane, e.g., metal-based catalysts, such as Ni, Co, Mo, Fe, Al, etc., and carbon-based ones, such as activated carbon, carbon black and different coals.
Studies performed with metallic catalysts have shown high dissociation activity; however, the carbon deposition on the catalysts in all cases resulted in the deactivation of the catalyst [14,15,16,17]. These catalysts can be regenerated; however, this will increase the complexity of the process due to the requirement of an additional dedicated reactor operating at different pressure conditions from those of the CDM reactor. Regeneration will also result in the formation of CO2 through the combustion of the deposited carbon, which takes away the most important advantage of CDM over SMR, namely, CO2-free hydrogen production.
Activated coal (AC) is a carbonaceous solid usually produced from coal thermally treated using an activation medium such as steam or phosphoric acid [18]. These catalysts have shown a high activity for methane dissociation but a rapid deactivation due to carbon deposition [19,20,21]. AC can be regenerated by using CO2 gasification at high temperatures (900–1000 °C), though this is likely to result in additional costs and higher environmental impact [22,23].
Carbon black (CB) is composed of fine particles consisting mainly of carbon produced by incomplete combustion of heavy petroleum products. These products have been used as catalysts in CDM studies as well. CB proved to have lower catalytic activity compared to AC, but also showed better catalytic stability despite carbon deposition [24,25,26]. Nevertheless, CB may not be regarded as an effective candidate because (1) it is fossil-based, (2) it has low catalytic activity and (3), despite short-term stability, it will eventually be deactivated due to carbon deposition. Coal chars may as well be discarded based on the same reasoning, although studies on various coal chars reported acceptable catalytic activities for methane decomposition but also fast deactivation [27,28].
This study aimed to use charcoal (derived from forest biomass) as a catalyst for methane decomposition to densify the biocarbon while simultaneously producing hydrogen. The pretreatment method suggested in this study aims to produce a sustainable biocarbon with characteristics that are suitable for its use as a reductant in metal production. It is expected that the biomass-based biocarbon will behave in a similar manner to the above-mentioned carbon-based catalysts. Throughout the process, the carbon deposition deactivates the biocarbon. As shown in the literature, the biocarbon matrix will adsorb the dissociated carbon from the methane, which will result in the closure of the particle pores, reducing the internal surface area, thus lowering the biocarbon reactivity. The temperature treatment will also improve the carbon binding order in the biocarbon matrix, giving additional strength and contributing further to lower reactivity [29].
The proposed solution provides a biocarbon with (1) a reduced inner surface area, (2) an increased fixed carbon content, (3) increased strength, (4) an increased volumetric mass density, (5) lower reactivity and (6) improved biocarbon uniformity (homogeneity). This study gives detailed information on methane decomposition using five different biocarbons produced from birch woodchips (BWs), spruce woodchips (SWs), birch bark chips (BB), wood pellets (WPs) and steam-explosion pellets (SEPs), all produced at a pyrolysis temperature of 1000 °C [30]. An electrically heated reactor packed with biocarbon material was used for this study. Both the potential to produce hydrogen and the treated biocarbon were investigated as a function of biocarbon type, CDM temperature, holding time and methane concentration in the purge stream. This work is part of a larger project, the main aim of which is to attain negative CO2 emissions by replacing fossil coal with biocarbon and, at the same time, apply CCS technology in metal production processes. It is therefore imperative to collect as many data as possible across the entire value chain, which includes biocarbon production and the detailed mapping of the CDM for the simultaneous production of hydrogen and low-reactivity biocarbon. The data presented in this work, together with our previous work [30], will be used in the development of a techno-economic model which will include biocarbon production, biocarbon deactivation, and H2 production and integration of CCS in a manganese production plant.

2. Materials and Methods

Two types of biomass feedstocks were used to produce the biocarbons. The first type included spruce wood, birch wood and birch bark chips. The wood and bark chips had sizes in the range of 2–4 cm and 1–2 cm, respectively. The wood pellets were produced from spruce wood, with a diameter of 8 mm and a length of 15–17 mm. The steam-explosion pellets had the same diameter but a length of 18–22 mm. The steam-explosion pellets were produced from spruce woodchips that were subjected to steam explosion at a mild temperature and moderate pressure (<200 °C and <20 bars). The material was then fed into a pellet mill and extruded under pressure into pellets. The produced biocarbons had smaller sizes due to particle shrinkage in comparison to their parent materials. The wood- and bark-chip biocarbons were reduced in size to 1–3 cm and 1–2 cm, respectively. The wood-pellet biocarbon exhibited a substantial decrease in size, down to a diameter of around 5.5–6 mm and a length of 13–15 mm. The diameter and length of the steam-explosion pellets decreased to around 6 mm and 16–18 mm, respectively. Figure S1 in the Supplementary Materials shows pictures of the different biocarbons used in this study.

2.1. Biocarbon Production

The biocarbons for the methane cracking experiments were produced in an electrically heated furnace. The material was put inside the cylindrical furnace, which was then purged with nitrogen to ensure an oxygen-free atmosphere prior to pyrolysis. Afterwards, the furnace was heated at 10 °C/min to 1000 °C, at which point the temperature was kept stable for 90 min before the reactor was cooled down. Details about the experimental apparatus, the volatiles released and the characterization of the biocarbons have been published elsewhere [30]. In total, five different biocarbons were produced, where the raw feedstocks originated from spruce woodchips, birch woodchips, commercially available wood pellets, steam-explosion pellets and birch bark.

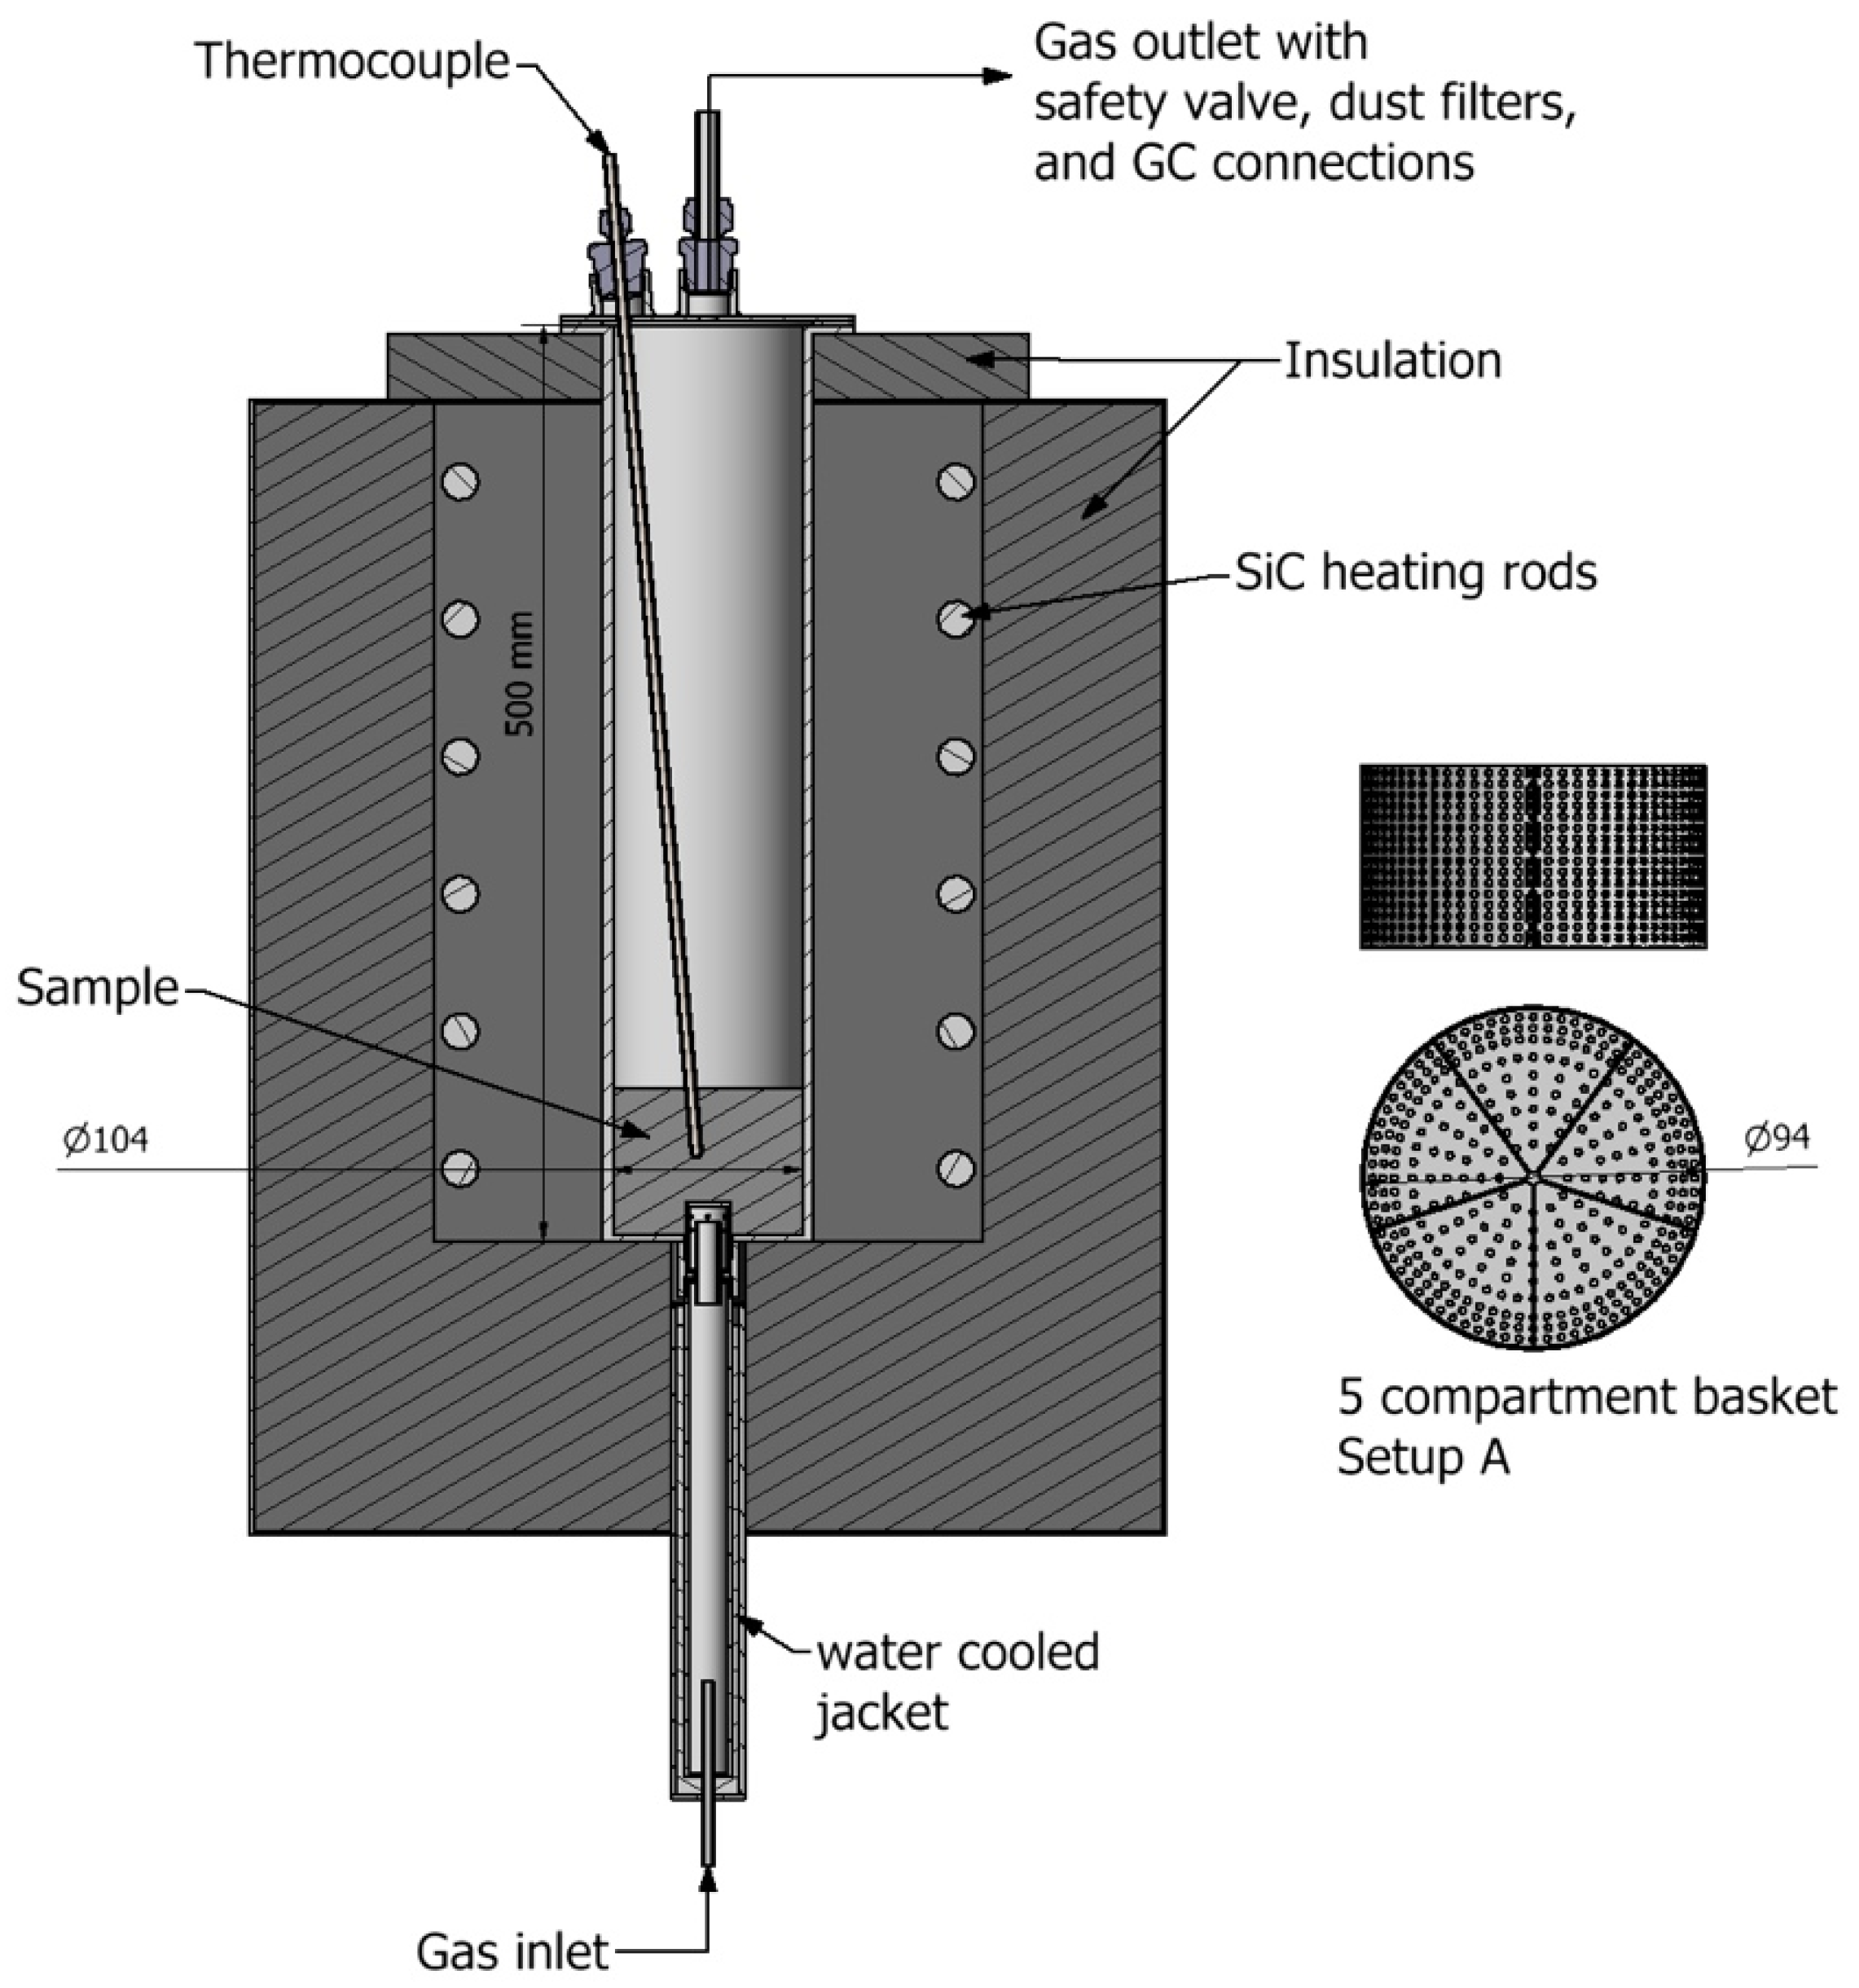
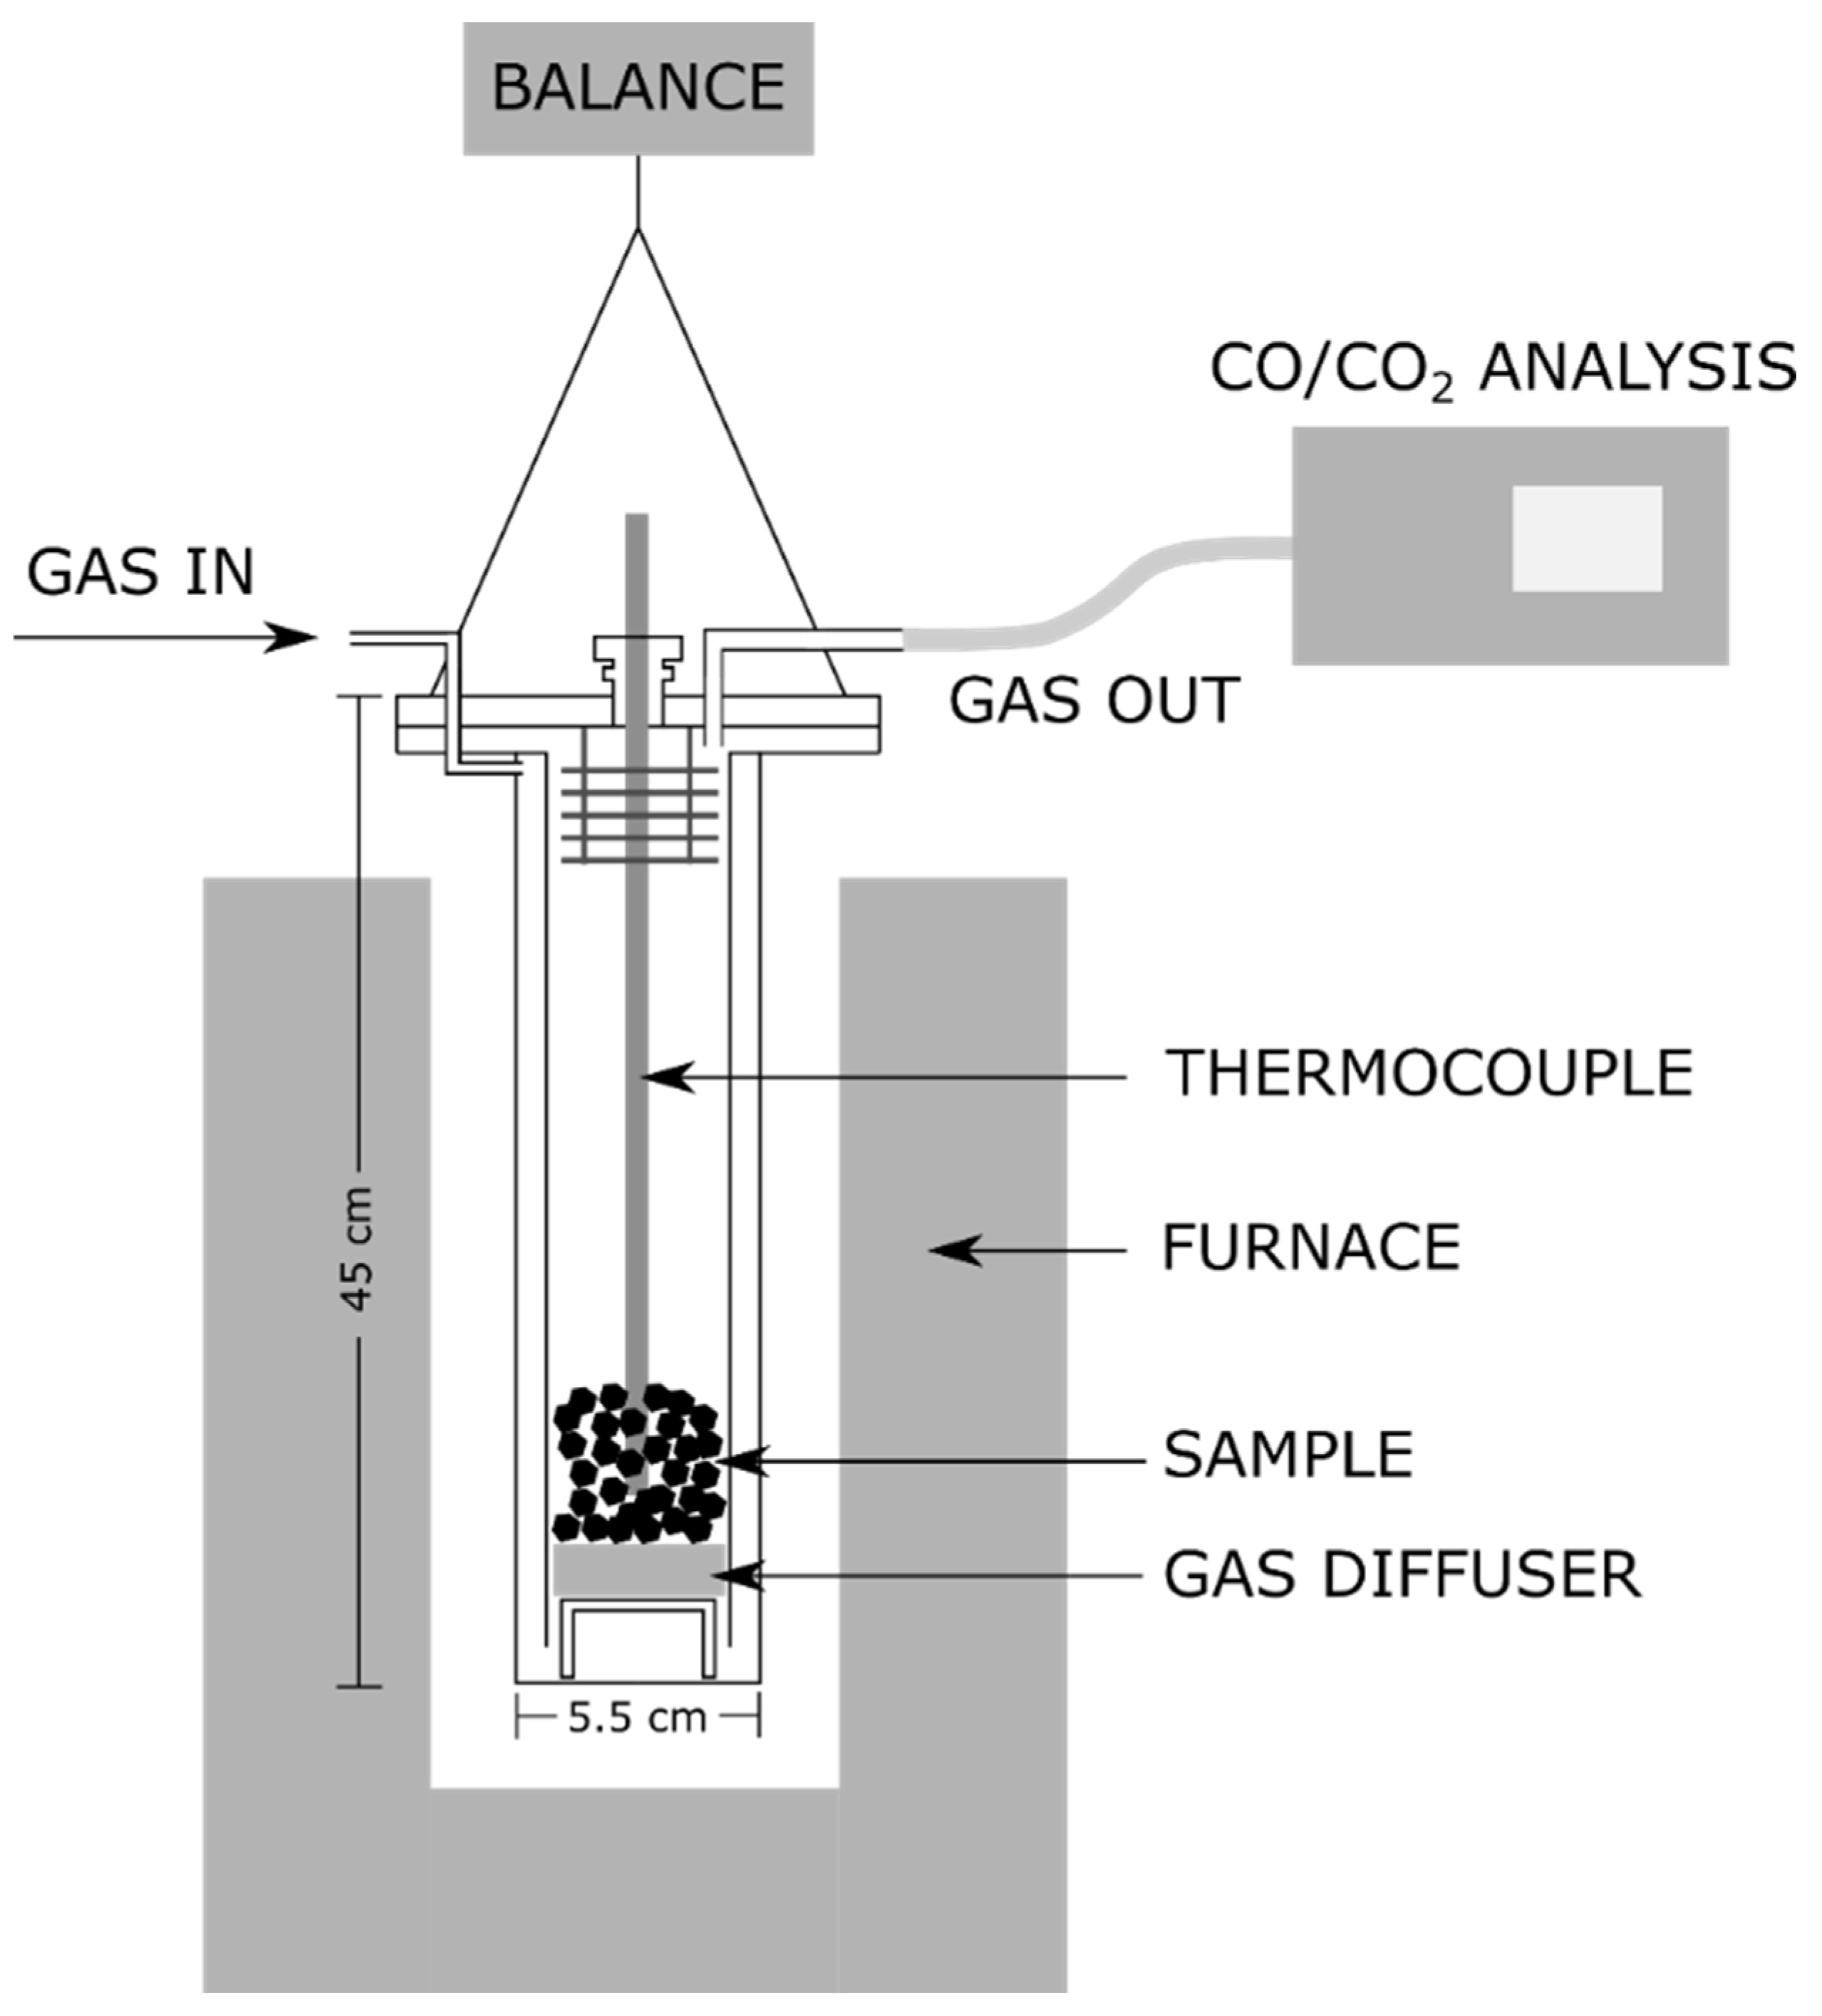
2.2. Methane Cracking Setups

Biocarbon samples were exposed to methane in two different setups. For both setups, a resistance-heated furnace controlled by an S-type thermocouple placed near SiC heating elements was used. Mass flow controllers were used to mix the process gases, which were then purged through the bottom of the furnace and through an inlet-gas-dispersing plug at the bottom of the crucible. The gas inlet was water-cooled to prevent methane cracking before methane entered the hot crucible. The experiments started with purging an inert gas at 3 NL/min to remove all traces of oxygen. When the reactor reached the set temperature, the inert gas was replaced with a mixture of methane and either nitrogen or argon at different ratios. However, the total gas flow was always constant at 3 NL/min. The crucible used was made from a high-temperature-resistant FeCrAl alloy. The first setup, setup A, used a special sample holder insert with five compartments that allowed samples of all different biocarbons to be exposed to the same experimental conditions at the same time. All materials were placed at the same level and did not affect each other. The sample holder was placed on top of the gas nozzle.
The second setup, setup B, was the same as the first setup, but without the sample insert, meaning one type of material was tested each time. In this setup, the amount of material was larger. The charge temperature was logged by a K-type thermocouple placed within an alumina sheet and positioned near the center of the charge. Off-gas exits were located in top of the crucible, and a part stream is pumped into a micro-chromatograph (GC) for off-gas analysis. The crucible and off-gas system had an overpressure from 150 to 350 mbar. The sample gas was filtrated using sintered metal filters. The sample gas temperature was monitored with the help of a K-type thermocouple. A digital pressure gauge at the upstream side of the membrane pump was used to monitor the filter resistance. The micro-GC was calibrated to analyze CH4, C2H4, C2H6, CO, CO2, H2, N2 and O2. Figure 1 shows a schematic view of the setup.
Table 1 shows an overview of all the performed experiments. Experiments 1–6 were performed in setup A, with each experiment generating 5 treated biocarbon samples, produced under the conditions depicted in Table 1. Experiments 7–11 were performed in setup B, on an individual material with a sample size of ca. 80 g, and the main goal was to study the hydrogen production potential for these five different materials.

2.3. Biocarbon Characterization

2.3.1. Proximate Analysis

The proximate analysis of the biocarbon was conducted in accordance with procedures described in standard D1762-84 [31]. For each sample, triplicate analyses were conducted, and the average values are presented in Table 3. The ash content was measured by keeping one gram of dried biocarbon sample at a temperature of 750 °C for 6 h in a crucible with no lid.

2.3.2. Ultimate Analysis

The ultimate compositions of the biocarbon samples were analyzed with an ultimate analyzer (Eurovector EA 3000 CHNS-O), where the oxygen content was calculated by determining the difference. The average values of the triplicate analyses are presented in this study.

2.3.3. Ash-Forming Element Analysis

Ash-forming concentration was measured using an inductively coupled plasma–atomic emission spectrometer (ICP-AES). Samples were dissolved in a mixture of acids (HNO3, HF and H3BO3) and were sent to a pressurized multi-step digester. The digested solution was then analyzed by ICP-AES. The results presented in this study are the averages of the triplicate analyses.

2.3.4. Surface Area, Porosity and Density Analyses

The surface area of the biocarbon samples was characterized with N2 adsorption using an Autosorb-1-MP analyzer (Quantachrome Instruments, Anton Paar, Boynton Beach, FL, USA). Before the adsorption measurement, the biocarbon samples were ground and degassed in a vacuum at 150 °C for 12 h. The N2 adsorption isotherms were measured at a relative pressure (p/p0) of ~5 × 10⁻⁶ to ~1 at 77 K. From the obtained N2 adsorption isotherms, the specific surface of one sample was determined by applying the BET method. The range of application for the BET method was selected following the recommendations provided by Maziarka et al. [32]. The true density of the biocarbon samples was analyzed using a helium pycnometer (Anton-Paar Ultrapyc 5000). Prior to analysis, the ground biocarbon was dried at 105 °C for 8 h. More details on both the surface area and the density analysis can be found in our previous work [33].

2.3.5. Raman Analysis

Raman spectroscopy was performed on the biocarbon samples to analyze the molecular structures of the biocarbons. Raman spectra were collected using a WITec Alpha300r instrument from Oxford Instruments. The laser power was set at 6 mW, and spectra were collected from five different regions, with an exposure time of 120 s. The spectrum region 800–2200 cm−1 was used in all analyses. Cosmic-ray spikes were removed using the method developed by Schulze and Tuner. All spectra were smoothed using the Savitzky and Golay filter [34], with subtraction of the baseline to eliminate the fluorescence signal, according to Cao et al. [35]. In this work, the 5-band method was used to deconvolute the Raman spectra, improve the fitting precision of the deconvolution results and obtain more details about the structure of the carbon materials. Five bands were assigned to the relevant Raman bands, including the D band at 1350 cm−1, the G band at 1590 cm−1, the V band at a valley around 1450 cm−1, the D3 band at 1540 cm−1 and the D4 band at 1185 cm−1. The D3 and D4 bands were included to identify possible amorphous carbon structures related to the formation and deposition of the products from methane cracking on the surface of the biocarbon. The 5-band method has been used and reported in other studies [36,37,38,39].

2.3.6. SEM-EDS Analysis

The microstructure and morphology of biocarbon samples were examined using a scanning electron microscope (Zeiss Ultra 55 Limited Edition, Carl Zeiss AG, Jena, Germany). The biocarbon samples collected from the reactor before and after grinding were examined.

2.3.7. Mechanical Property Analysis

In an industrial furnace, carbon materials are added together with other raw materials to the top of the charge and need to be transported down through the furnace to the reaction zone. Too-small carbon particles will be blown out of the furnace by the outflowing gases before they can take part in metal-producing chemical reactions. The most important mechanical property of carbon materials in metallurgical applications is therefore the strength of the particles, i.e., their ability to resist breakage during mechanical stress. This can be subdivided into “cold strength”, which indicates the particle breakage and fines generation during transportation, as well as the ability to withstand the weight above it without undergoing crushing, and “warm strength” which indicates the particle breakdown and fines generation during interaction with gases and sudden temperature changes inside the furnace [40].
In the present study, the cold strength of the sample was estimated by tumbling the sample in a Hannover drum, where the amount of fines generated was a proxy for the mechanical strength that can be compared to a reference case (e.g., coke). For the cold strength test, the biocarbons were crushed and sieved by hand; a 5–10 mm size fraction of around 20–25 g was selected and placed in a steel drum measuring 30 cm in diameter that contained 4 risers spaced 90 degrees apart. The sample was tumbled for a total of 30 min in 2 steps. For step 1, the sample was tumbled for 10 min at 40 rpm, after which the sample was removed and sieved to 6.3, 4.75, 3.35 and 1.25 mm size fractions and the size distribution was measured. The entire sample was placed back in the drum and tumbled for 20 more minutes at 40 rpm before being removed and re-sieved. The fraction of fines formed was reported from this test. In this case, fines are defined as any material with a size fraction below 3.35 mm.

2.3.8. CO2 Reactivity Procedure

The CO2-reactivity test was conducted with 20 g of sample material, which was placed in a double-walled steel crucible. The crucible, suspended from a balance, continuously recorded the sample’s weight. Gas was introduced into the crucible through the double wall, flowing from the bottom up through the sample. In this manner, the gas was preheated to match the sample’s temperature. The crucible and furnace setup are depicted in Figure 2. During the test, the sample was heated to 1100 °C in an argon atmosphere. Once the desired temperature was achieved, the atmosphere was switched to a 50:50 mixture of carbon monoxide and carbon dioxide, with a total flow of 4 NL/min. The sample was then kept at 1100 °C until 20% of the fixed carbon had reacted. Following this reaction, the sample was cooled to room temperature in an argon atmosphere. The mass loss curve was utilized to calculate the reactivity in terms of the percentage of fixed carbon reacted per minute (% Fixed C reacted/minute).

3. Results and Discussion

3.1. Hydrogen Potential from Catalytic Methane Cracking

A summary of the individual experiments performed at a reactor temperature of 1100 °C and with a purge gas input of 90/10 of CH4/N2 is shown in Table 2. The holding time with the CH4 purge was 90 min, except for experiment 7 with spruce wood, which stopped at the 75 min mark due to unexpected complications. The start weight for the biocarbon catalyst was about 80 g, except that of the SEP biocarbon, which was about 100 g. During the experiments, the biocarbon catalyst was heated to the target temperature in an inert atmosphere. The gases that were released during that period were measured with a GC and were mainly composed of H2, CO and CO2. These volatiles could have been released because of CO2 adsorption from ambient air or because of volatiles that were still left in the biocarbon due to the difference in the temperature at which these biocarbons were produced (1000 °C). These volatiles are depicted in row 2 in Table 2, in total grams, and in weight percent relative to the initial weight, depicted in row 1. This amount was then subtracted from the initial biocarbon weight and is presented in row 3. The weight loss prior to treatment varied by around 1% relative to the initial weight, except for the experiment with spruce wood, where this initial weight loss was minimal. When the holding time reached 90 min, the methane was stopped and replaced with nitrogen. The electrical heating was stopped, and the treated biocarbons were left to cool before they were taken out of the basket, sieved with a mesh size of 2 mm and weighed. The weights gained, in grams, and relative to the start biocarbon mass are shown in row 4. It is important to mention that the experiments with birch wood encountered some challenges with air leakage, which resulted in a CO concentration of 1.2 mol% at the outlet of the reactor, which was stable during the entire methane purge period. The oxygen leakage resulted in both a partial oxidation of the methane and of the deposited carbon, which could explain the lower deposition rate in comparison to the experiment with spruce wood. Although there were some compositional and physical differences between the two wood species, these differences alone cannot explain the large difference in the amount of carbon deposition, which must mainly have been a result of the air leakage. The results for birch wood were for this reason not included in Table 2 or in the carbon balance (Figure 3). The weight gain was about 42% for spruce wood and birch bark, 33% for wood pellets, and 13–14% for birch wood and steam-explosion pellets.
The total gas amounts that left the reactor during the methane purge are also shown in Table 2. The gases were mainly composed of “uncracked” methane, hydrogen, and minor amounts of ethylene and ethane. The hydrogen concentration was also calculated relative to the methane input in mol/mol and relative to the biocarbon weight in mol/kg. The hydrogen production relative to the methane input lay around 0.8 mol H2/mol CH4 for all the tested biocarbons, a ratio of 2 being the theoretical upper limit if all the methane cracked to elemental carbon and hydrogen. This ratio, however, was largely influenced by the entire reactor, which was quite large relative to the biocarbon sample size and could also act as a platform for methane cracking. In all the experiments and for the duration of the entire methane purge, the hydrogen and methane concentrations were stable. Hydrogen production is also shown in the same table relative to the start biocarbon weight and shows that the highest production was achieved with birch bark. This biocarbon is relatively more porous, which could explain its better effectiveness as a catalyst for the thermal decomposition of methane. The lowest hydrogen production relative to biocarbon weight used was exhibited by SEPs. SEPs are a compact material with a high density, which is a good explanation of their lower catalytic performance. For spruce wood, the hydrogen production potential was lower in comparison to the weight gained. As explained earlier, this experiment was stopped after 75 min of holding time, which was 15 min shy of the 90 min target and could explain this deviation.
Figure 3 shows the carbon balance for the same experiments as the weight percent relative to the carbon input to the reactor during the methane purge. Approximately 40% of the input carbon went out of the reactor as unreacted methane. In a real application, it is expected that the catalyst bed would be much larger and that there would be less unreacted methane. The total carbon that left the reactor as different gaseous species after the methane purge was stopped, accounting for 2–11% of the carbon input. This fraction was mainly composed of CH4 and H2. This was probably caused by a time delay that occurred when the methane was replaced with nitrogen after the end of the holding time and by the delay of the GC in quantifying the gas composition. The part of the total solid carbon that was not found in the biocarbon matrix was elemental carbon, which accumulated on the reactor walls or left the reactor as particles along with the gases. This fraction was not measured but calculated by the difference relative to the carbon input. As can be seen from the figure, this share was lowest for the spruce wood sample, which had a lower holding time relative to the other experiments.

3.2. Characterization of the Treated Biocarbon

3.2.1. Proximate and Element Analyses

The proximate analysis was only performed on the original biocarbon and the individual experiments that were performed with gas analysis (experiments 7–11). The other experiments were performed with smaller sample sizes (20 g of each material), as there was not enough material to perform a proximate analysis. The results in Table 3 show that the volatile matter decreased after the biocarbon had been used for methane cracking. The volatile loss could have been due to the temperature increase in the cracking reactor, which was performed at a 100 °C higher temperature than at which the biocarbon was produced. The ash content decreased, which was due to the relative mass increase of the treated biocarbon and the release of ash-forming elements during the CDM.
Table 3. Proximate analysis in terms of wt.% dry basis of the raw biocarbon and the biocarbons treated with CDM at 1100 °C for 90 min.
Proximate AnalysisSpruce WoodBirch WoodWood PelletsSEPsBirch Bark
Biocarbon from pyrolysis
Volatile matter content5.235.845.455.356.57
Ash content0.821.290.801.083.98
Fixed carbon content93.9592.8793.7593.5789.45
Treated biocarbon, at 1100 °C, 90 min, and 90/10 (CH4/N2)
Volatile matter content4.744.724.403.495.09
Ash content0.791.090.771.032.08
Fixed carbon content94.4794.1994.8395.4892.83
The ultimate analyses for all the treated biocarbons and the original biocarbons are depicted in Table 4. The original biocarbon materials, prepared at 1000 °C, had the lowest carbon contents. The original materials also had higher hydrogen and oxygen contents, with average H/C and O/C ratios of 0.1 and 0.08, respectively. After the materials were used for methane cracking, these ratios decreased substantially. For experiments with 30 min holding times, performed both at 1000 °C and 1100 °C, the hydrogen and oxygen contents were still somewhat higher in comparison to the experiments performed with longer holding times.
Figure 4 shows the weight % values of carbon on dry and ash-free bases for all biocarbons, including the untreated samples. As previously mentioned, the raw biocarbon was prepared at 1000 °C with a holding time of 90 min in an inert atmosphere. The legend in Figure 4 shows the temperature at which the experiments were performed, followed by the holding time and the methane/inert ratio at which the reactor was purged. As can be seen from the figure, the spruce wood seemed to have the highest carbon content, followed by the birch bark. The birch wood and wood pellets had similar carbon contents, while the steam-explosion pellets had the lowest carbon content. The third series from the left shows the carbon increase for the experiments performed in an inert atmosphere at 1100 °C. The higher carbon content for these experiments was due to the volatile release caused by the 100 °C increase in pyrolysis temperature. For the experiments performed at 1000 °C, the increase in holding time from 30 to 90 min seemed to significantly increase the carbon concentration in the sample. The effect of holding time was less significant for the experiments performed at 1100 °C. Also, decreasing the methane purge concentration to 45% at 1100 °C seemed to have a minor effect on the carbon concentration in the biocarbon.

3.2.2. Ash-Forming Element Analysis

The ash analyses of some of the experiments are shown in Table 5. For the individual experiments 7–11 (Table 1), a metal balance could be calculated relative to the untreated biocarbon. The calculations took into account the dilution effect due to the mass increase, which was reported in Table 2. For the alkali metals, potassium and sodium, an average 90% decrease in the alkali content in the biocarbon after treatment with CDM at 1100 °C and for 90 min was noticed. The alkali metal content was also lower for the pyrolysis experiments performed at 1100 °C (no CDM); however, it decreased at a much lower rate in comparison to the CDM experiment at the same temperature. As Table 5 shows, the pyrolysis experiments performed at 1100 °C still retained a substantial share of the alkali metals. It is not entirely understood why these elements were removed to a larger extent under CDM, but it might be that the presence of hydrogen and H radicals from the decomposition of methane could have caused the volatility of these metals. This is, of course, good news for obtaining less reactive biocarbon, as alkali metals usually have a catalytic effect that would increase the carbon reactivity. The alkali effect on carbon conversion has been shown to improve the carbon conversion efficiency and the syngas yield in the gasification of biomass [41]. The improved reactivity was accredited to the influence of algae addition, due to its high content of alkaline and alkaline earth metal species. Other elements that seemed to be removed in significant amounts in the same experimental conditions were phosphorus and aluminum. Relative to the original biocarbon material, the average removal of these compounds was 30%. Also, it is interesting to notice that for the cellulosic-based biocarbons (excluding birch bark), the H2 production in mol/kg biocarbon used increased almost linearly with both the potassium and sodium concentrations in the original biocarbon. This linearity, although clear but not perfect, shows that such elements with catalytic potential are some of several parameters that affect methane decomposition. The R-squared value for the linear interpolation was 0.68 for potassium and 0.88 for sodium. The linearity was not maintained for BB because the alkali concentration was 2–3 times larger in comparison to the other biocarbons, which likely affected the linearity. The dependency of CDM on the alkali concentration in the original biocarbon material is depicted in Figure S2 in the Supplementary Materials.

3.2.3. Surface and Density Analysis

The results from the surface area and density measurements are depicted in Table 6. The percentage numbers in parentheses describe the decrease in surface area/density relative to the biocarbon prior to treatment. The surface areas of the five samples varied between 88 and 203 m2/g, with SEPs having the lowest and birch bark the highest. The relative decrease in surface area was highest for birch wood at 34% and lowest for wood pellets at 11%. The pellet feedstocks were relatively compact to begin with, and treatment via carbon deposition had little effect on the surface area. It is worth noting that the reported density is the helium-based solid density, also called the skeletal density. The skeletal density is calculated by dividing the sample mass by its skeletal volume. The skeletal volume is obtained by measuring how much helium can be used to occupy the porous structure inside the particle. As shown in Table 6, the density of the untreated biocarbon was in the range of 1.7–2.04 g cm−3. These values were close to those measured for biocarbon produced with slow pyrolysis of pitch pine at a temperature of 1000 °C [42]. The skeletal density of the CDM-treated biocarbon decreased in comparison to the untreated sample. This could have been due to the CDM-treated biocarbons having larger pore structures, caused by increased volatile release, as the temperature was 100 °C higher in comparison to the untreated samples. The surface area of the original biocarbon had a clear effect on the catalytic decomposition of methane. As the surface area increased, the H2 production in mol/kg biocarbon used also increased. As for the alkali metals, H2 production seemed to correlate linearly with the surface area, with an R-squared value of 0.8. However, the density in Table 6 does not correlate well with the CDM potential. This is probably because the density was more or less constant across the tested biocarbons. The hydrogen production (mol/kg biocarbon) is depicted in Table 2. The surface area effect on the total hydrogen produced in the individual experiments is shown in Figure S3 in the Supplementary Materials.

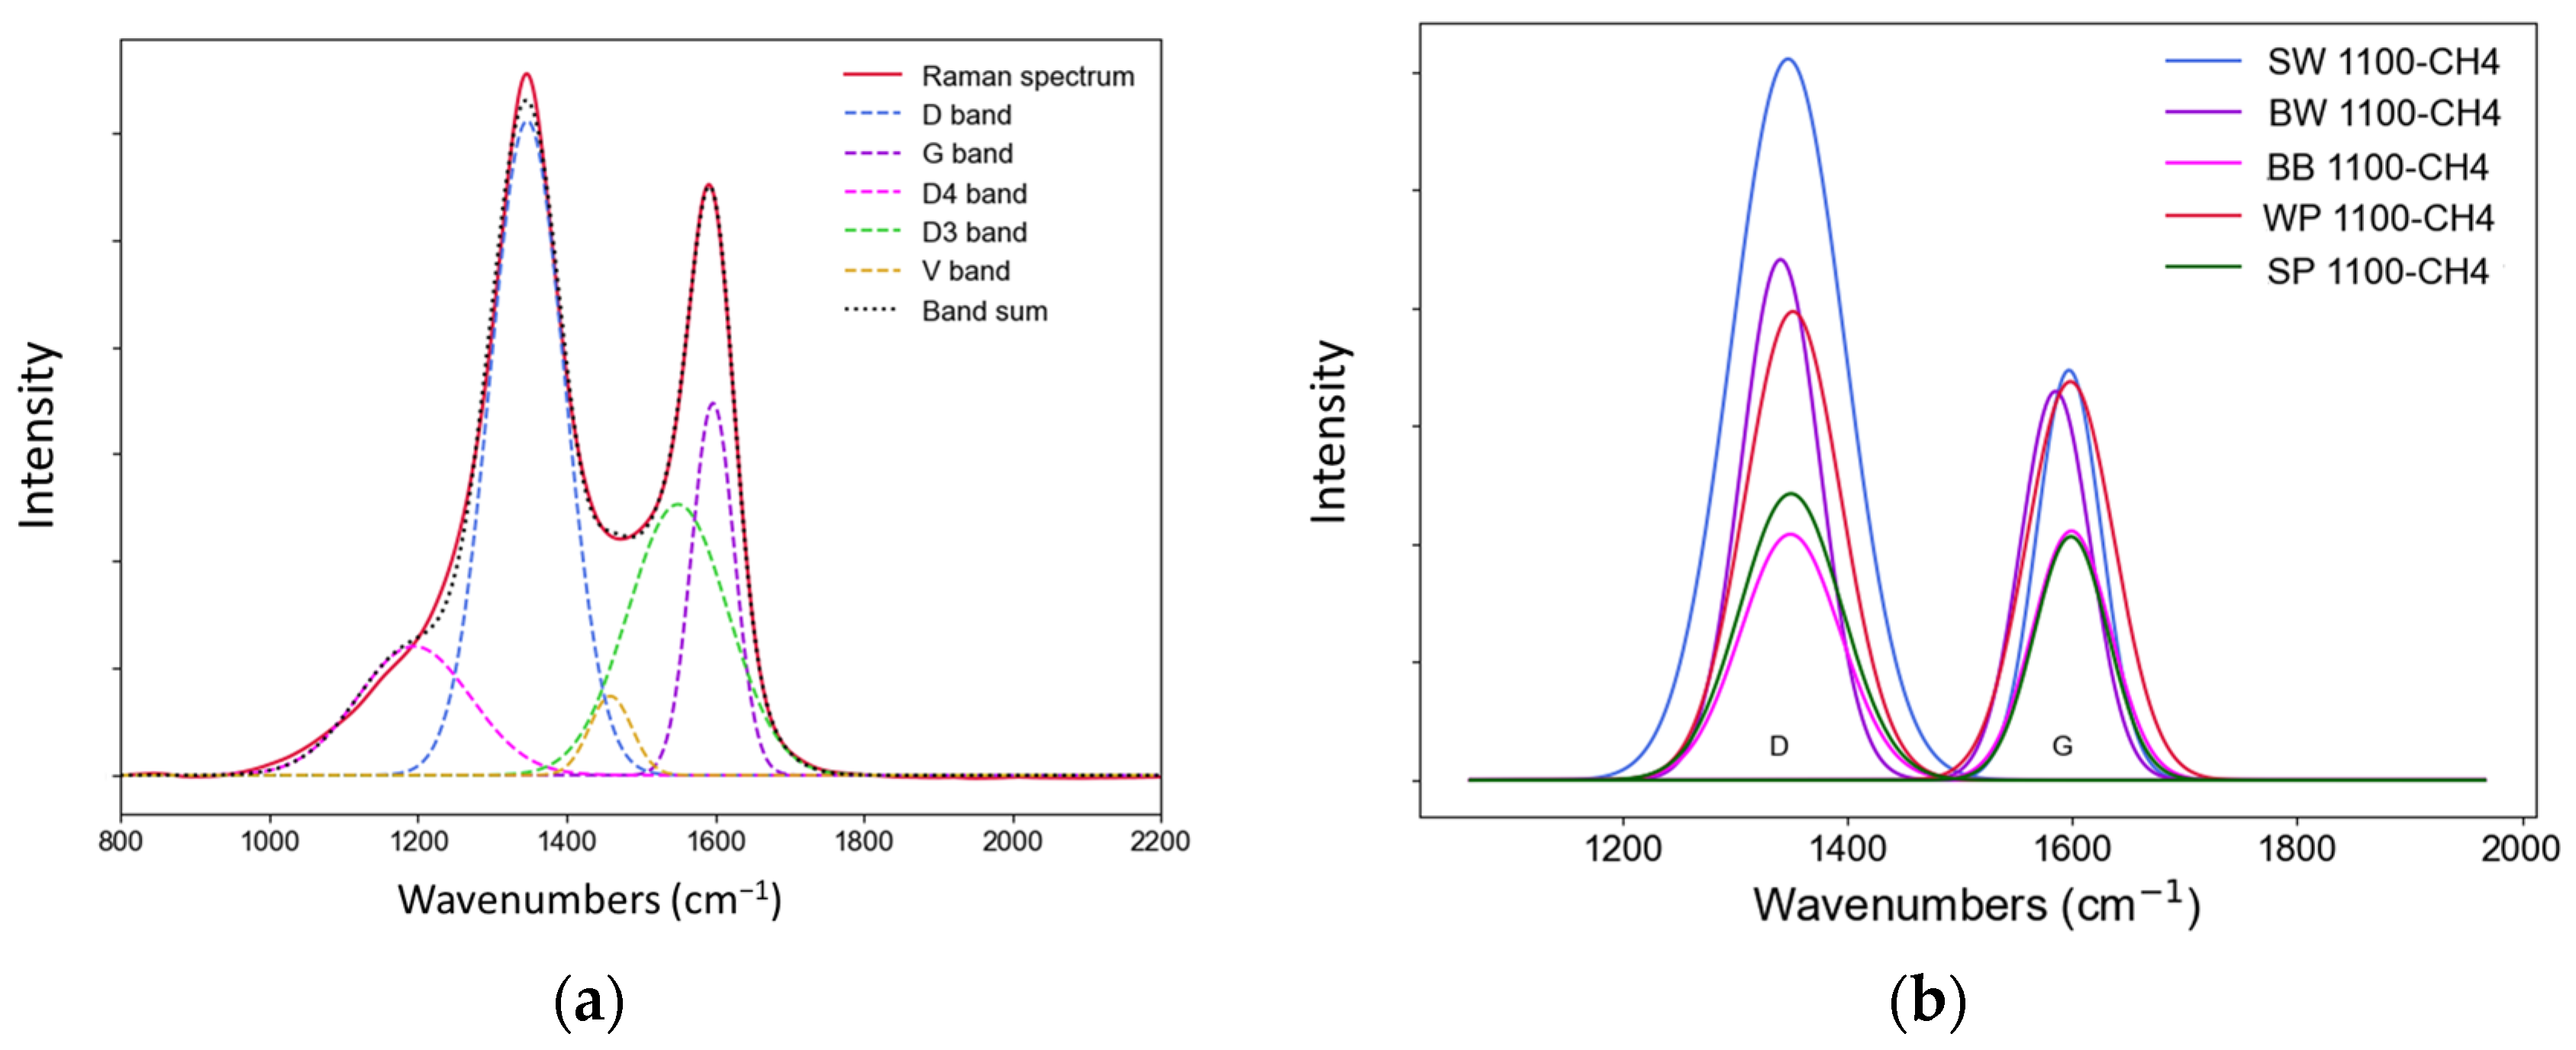
3.2.4. Raman Analysis

Figure 5 shows the Raman spectra of the five biocarbon samples after methane cracking. For the current study, the main purpose of the Raman analysis was to characterize the structural differences in the biocarbon after methane cracking. The D3 and D4 bands were included to identify the formation and presence of amorphous carbon structures related to the formation and deposition of carbonous products from methane cracking on the surface of the biocarbon. The data for the untreated biocarbons have been published elsewhere [30]. These spectra have a common feature, with the detection of two specific bands that are common to carbon materials. The Raman spectra for the studied samples generally overlapped across the wavenumber ranges. All five spectra were further processed with deconvolution to show the hidden peak of each sub-band. Figure 6 shows an exemplary Raman spectrum for the spruce wood biocarbon, treated at 1100 °C with CH4/N2 of 90/10 (SW: 1100-CH4-90), and its deconvolution by curve fitting. The first-order Raman spectrum of this sample was characterized by three main strong peaks: the D (or D1, defect or disorder) band around ~1350 cm−1, the G (graphite) band around ~1590 cm−1 and the D3 (or A) band around ~1540 cm−1. The D band is normally related to the presence of carbon with a disordered structure or is induced by disorders in the graphitic lattice, which can be explained by double-resonant Raman scattering. The G band corresponds to the graphite band, which is normally attributed to an ideal graphitic lattice vibration mode with E2g symmetry [43,44].
The spectral parameters, including the ratio of the integral area, the integral intensity and the full width at half maximum (FWHM) of the deconvoluted D and G bands, are listed in Table 7. The ID/IG ratio is the integral intensity of the D and G bands and indicates the presence of carbon with a different structure. The relative area ratios of the D and G bands (AD/AG) and AD/Atotal, where Atotal is the total Raman area, are additional parameters that are related to the degree of the aromatic rings and the presence of defects and structural imperfections in the carbon matrix. The full width at half maximum (FWHM) values of the D and G peaks were considered as indicators of the order of the basic structural units and relative amounts of defects in the carbon structures. The spectral parameters indicated different microstructures of the studied biocarbon samples. The D and G bands of the SWs were sharper, as shown in Figure 6, with higher parameter values than those of the other biocarbon samples (Table 7). As reported by Kameya et al. [44], the carbon deposited from the cracking of methane can lead to the formation of carbonaceous layers with more ordered and graphitic structures, even after short reaction times. As shown in Table 2, more intensive methane cracking and carbon deposition took place for the spruce wood experiment, which can partially explain the different Raman characteristic parameter values of the spruce wood compared to the other biocarbons. In addition to the carbon deposition, the difference in Raman spectral parameters can also be related to changes in the microstructure of the carbon material itself caused by the high-temperature treatment (i.e., 1100 °C in the current study) [45]. While heating at a high temperature, annealing of the carbon material will take place, which can also lead to the formation of carbon with a more ordered structure [46]. On the other hand, the presence of ash-forming elements can also lead to the formation of carbon with different microstructures [44]. The effects of nickel catalysts on the microstructure of beech wood biocarbon and the nature of deposited carbon from methane decomposition have been studied [43]. Raman analyses showed that biocarbon with Ni loading had considerably lower D and G band intensities and ID/IG values than raw biocarbon. The authors implied that the presence of ash-forming elements can affect deposition mechanisms and thereby the structure of the carbon deposition [43]. In this work, the methane cracking of the biocarbon lasted 90 min at 1100 °C, and there might have been further structural changes to the carbon deposited from the initially cracked methane during the holding time. More detailed studies are needed to investigate the detailed microstructure of biocarbon with more complementary analyses using, for example, XRD.

3.2.5. SEM-EDS Analysis

The results of the SEM-EDS analysis are shown in the Supplementary Materials (Figure S4 and Table S1). Only the SEM-EDS analyses of the treated biocarbons are presented, as the results of the untreated biocarbons have been published elsewhere [30]. After carbon deposition, the five biocarbon samples had different morphologies. There were materials with distinguishable “filamentous” and “spherical” structures, which can be attributed to carbon deposition on the biocarbon surface. Carbon in similar forms deposited on beech surfaces was reported by Guizani et al. [43]. The spruce biocarbon (a) had a smooth surface area, with spherical and cylindrical structures that had grown on top. These structures were mainly composed of carbon (above 91%) and oxygen as the balance element. In comparison, the smooth area had a lower O content. The rough surfaces of points 5 and 6 contained small amounts of Ca and Si. The SEM image of birch biocarbon (b) shows large deposits of branch-shaped structures that had a high carbon concentration (99%, points 1, 2 and 3). The analysis of spot 6 showed signs of carbon deposition forming shell-shaped structures around areas rich in Ca and Si. Guizani et al. observed the formation of a similar carbon layer on a Ni-based catalyst surface [43]. In addition, high contents of Ca, O and Si were detected from the microstructures with brighter colors (spots 4 and 5), together with some minor amounts of other ash elements. This indicated the migration and agglomeration of ash-forming elements on biocarbon surfaces during the high-temperature treatment, which were in turn covered by carbon from the decomposition of methane. In such a case, these elements could act as catalysts, promoting the decomposition of methane. The wood-pellet biocarbon (c) had a rough surface covered with thin paper-like layers. These were mostly carbon deposits (points 1, 2 and 3), while the white areas (4, 5 and 6) had higher O concentrations, in addition to the elements Ca, K and Na. The surface areas of the steam-explosion biocarbon pellets (d) were mainly large, smooth and intact, with far fewer openings (spots 1 and 2). Carbon was the dominant element detected on the smooth SEP surfaces. On the other hand, there were clusters of fine particles in the left corner of the SEM image, which were also caused by the deposition and accumulation of carbon from the cracked methane. In comparison to the spot with the smooth area, higher contents of O and Si and lower contents of C were detected in these clusters of fine particles (spots 3 and 4). This indicates differences in the formation and deposition of carbon.
The birch bark biocarbon, depicted in Figure S4(e), also seemed to have a rather smooth and intact surface with some minor white spots, similar to the other biocarbons. The smooth areas (points 1, 2 and 3) contained roughly 3% of Ca in addition to the carbon, while the white spots, in comparison, contained higher concentrations of O, Si, Na, Mg and Al, indicating aggregation of ash-forming elements on the bark biocarbon surface.

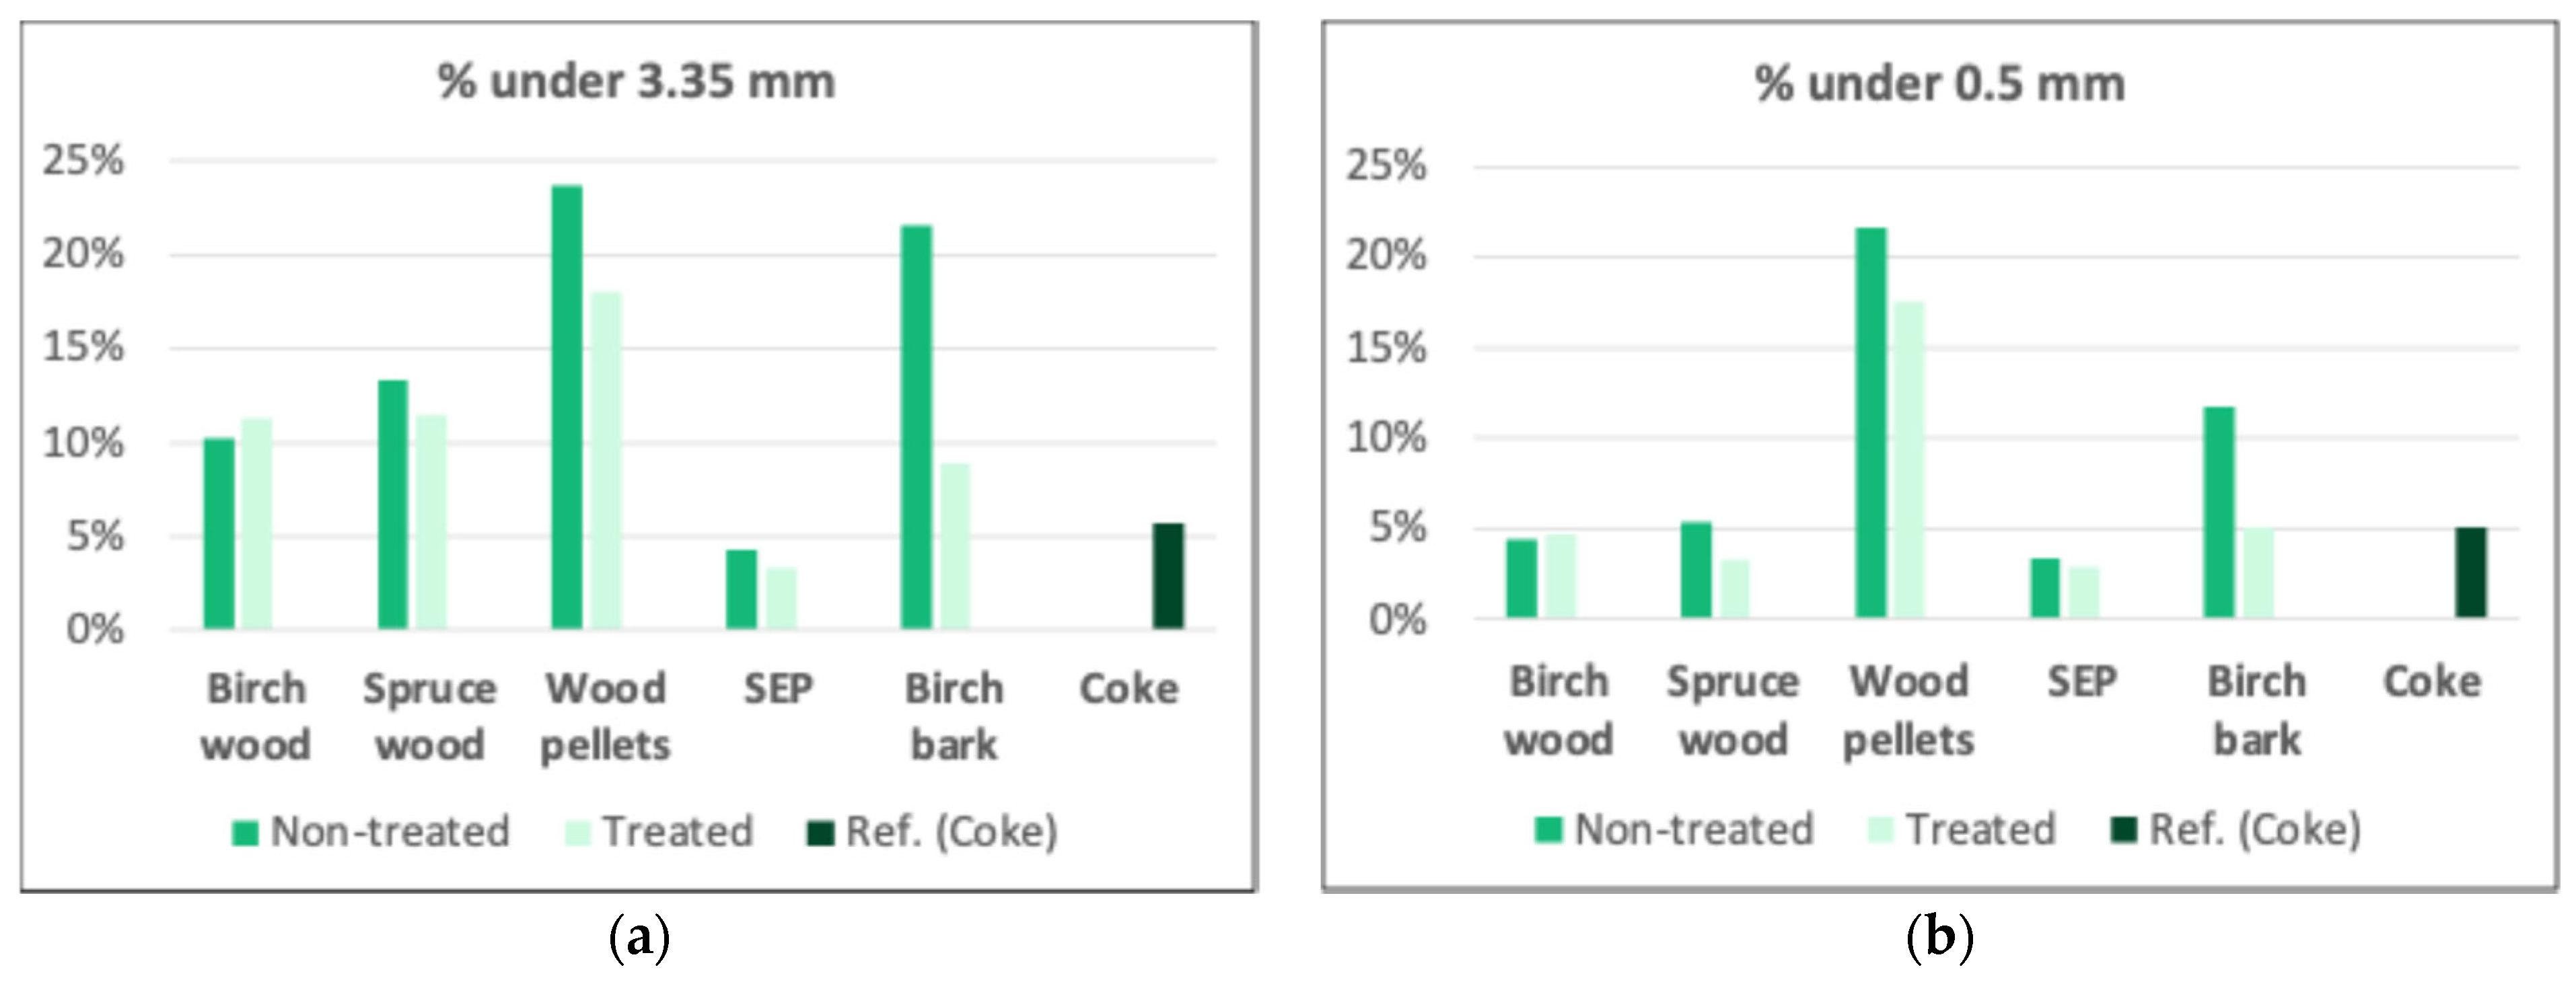
3.2.6. Mechanical Property Analysis

Abrasion strength tests were performed by tumbling the samples for 30 min with a rotation speed of 40 rpm. Figure 7 shows the measured fine fractions that were weighed after sieving both the raw and treated samples. Figure 7a shows the weight fractions for particles below 3.35 mm, and Figure 7b shows those for particles below 0.5 mm. A coke sample, which was used as a reference in the CO2-reactivity tests, was also used here as a reference in the mechanical property analysis. Steam-explosion pellets produced the lowest number of fines for both fractions, which was lower than that for the coke sample. Wood pellets, surprisingly, produced the largest number of fines among all materials. The woodchip species behaved in a similar manner, with fines below 3.35 mm in the range of 10–14% and fines below 0.5 mm close to 5%. Birch bark produced high amounts of fines, with 21% for particles below 3.35 mm (non-treated), which was second to wood pellets. The birch bark was also second to wood pellets for the fraction below 0.5 mm, with 12% for the non-treated sample. However, the birch bark seemed to benefit the most from the methane cracking treatment and showed numbers close to the coke sample in the tumbling tests. In general, the treated samples had smaller fine fractions in comparison to their respective non-treated biocarbons, indicating a positive impact of the CDM on the mechanical properties. Carbon deposition in the treated material seemed to influence the birch bark the most, where the fine fraction dropped from 20 to 10% and from 12 to 5% for the respective fractions of <3.35 and <0.5 mm. Also, wood pellets seemed to show a clear improvement with treatment, while the rest of the samples showed minor improvement.

3.2.7. CO2 Reactivity

CO2 reactivity measures the reaction rate of fixed carbon in a sample in a CO/CO2 atmosphere. Therefore, it is necessary to know the fixed C (Fixed C) content in the biocarbon sample at the starting point. The proximate compositions for the treated and non-treated samples are presented in Table 3. The Fixed C content in both the non-treated and treated samples was above 90%. After treatment, the Fixed C content increased by around 3%. Table 8 displays the CO2-reactivity characteristics of all the samples. To determine the reaction rates for the different materials, the weight loss rate of the fixed carbon was plotted over time. The reaction rates were then obtained through linear interpolation of the various curves. Figure 8 shows the weight loss rates of the fixed carbon for the treated (low-reactivity) samples along with their respective linear interpolations and the deducted reaction rates. Figure 8a depicts the weight loss rates and the reaction rates over the entire period, while Figure 8b shows the values between 2 and 4 min. Although the overall reaction rate was far from linear, it was possible to obtain reaction rates for shorter time intervals where the data fitted a linear model more closely, as shown in Figure 8b. This approach aimed to compare the different materials to determine the effect of CDM on the reactivity of the treated material, as well as in comparison to the reference material, marked as coke in Figure 8. Similar figures were also produced for the non-treated biocarbons and for different time periods, but only the deducted reaction rates are shown in Table 8. A possible explanation for the non-linearity could be that, initially, when gas is introduced into the system, a high reaction rate occurs within the first few seconds due to the immediate exposure of the sample to the gas. The gas then reacts rapidly with the sample, primarily because of its large surface area and high porosity. As the reaction progresses, the rate gradually slows down, which is attributed to the gas–solid reactions occurring in the denser regions of the sample.
It can be observed that the non-treated sample exhibited a higher weight loss, slightly above 10%, compared to the treated samples, which showed around 5% loss, except for the wood pellets, which also exhibited around 11% weight loss for both the treated and non-treated materials. It is important to note that the weight loss reported in Table 8 also includes the volatile loss during the heating of the sample in an inert atmosphere. To compare the results with an industrial coke sample, a reference test was performed using similar sample amounts (20 g). The empty cells in Table 8, indicated with a dash, mean that there were no data available for that period. This occurred only for SWs and BB for the non-treated biocarbons, during the 2–4 min period, as the experiment was stopped when 20% of the fixed carbon in the biocarbon had already reacted.
Although the rate of the reaction varied, the CO2 reactivity was found to be lowest for SEPs, followed by WPs, SWs, BWs and BB, for the non-treated samples. However, the order of the treated samples differed slightly, with SEPs still showing the lowest reactivity, followed by BB, SWs, BWs and WPs. This shift indicated that WPs are the biocarbon feedstock that benefited the least from the CDM treatment relative to BB, SWs and BWs. This could have been due to the compact structure of the WPs, the increased temperature treatment leading to volatile release, making the interior porous but limiting the potential for carbon deposition within. Notably, the BB sample showed the greatest improvement in the CDM treatment, moving from last place before the treatment to second place after it.
Many investigations on carbon sources have been conducted to assess their reactivity in a CO/CO2 atmosphere [47]. However, all the charcoal types showed significantly higher reactivity compared to the other tested carbon types. A study was conducted to investigate the effect of CO2 reactivity on treated industrial biocarbon by depositing 13–15% carbon from methane into a carbon matrix. This process aimed to reduce porosity and increase density to levels similar to those of coke [10,48]. The density of the biocarbon increased by 7–8%, confirming the carbon deposition. However, the CO2 reactivity of the treated biocarbon decreased compared to that of industrial biocarbon. This decrease in CO2 reactivity was likely due to the reduced porosity, which lowers the surface area and decreases the number of accessible active sites, as a result of increased density.
A similar trend in the reaction rates was observed for the treated samples in comparison to the non-treated samples. Overall, CO2 reactivity was very low for the treated SEPs, followed by BWs, SWs, WPs and BB. SEPs exhibited a reactivity (of 2.62% Fixed C reacted/min) matching that of industrial coke at 2.66% Fixed C reacted/min. Another noteworthy observation was that the reactivity of the treated samples was less than half that of the non-treated biocarbon samples.
In general, CO2 reactivity should be dependent on the internal pore structure of the biocarbon (accessible surface area) and on the catalytic activity of the ash elements that are present in the parent biocarbon. CO2 reactivity can also be an indication of how active a material is with respect to other reactions like methane decomposition. Figure S5 in the Supplementary Materials shows the dependency of the overall reaction rate of the non-treated biocarbon (taken from Table 8) on both the surface area of the same biocarbon and on its CDM properties. As can be seen, both properties increased with the overall reaction rate, where the surface area shows a clear linear correlation, with an R-squared value of 0.96. Figure S6 shows, also, that an increase in the content of the alkali metals potassium and sodium resulted in an increase in the CO2 reactivity. Figure S6 does not include the data for BB, as its ash concentration and other physical properties differed substantially from the rest of the materials, which made comparison difficult.

4. Conclusions

Methane cracking experiments were performed on five different biocarbons with the aim of producing low-reactivity biocarbons and hydrogen. The effects of temperature (1000 and 1100 °C), holding time (30 and 90 min) and methane (Ar or N2) ratio in the purge gas (90/10, 45/55 and 0/100) were studied. The hydrogen production potential was assessed in a limited number of experiments by measuring the gas concentration at the outlet of the laboratory-scale reactor. The CDM-treated biocarbons were assessed through a series of analytical characterizations that included proximate and ultimate analyses, ash-forming element analysis, surface area and density analyses, Raman analysis, SEM-EDS analysis, mechanical property analysis, and CO2-reactivity tests. In general, it was shown that all the biocarbons had the potential to act as a catalyst for the decomposition of methane under the studied conditions. In more detail, the following findings and conclusions have been drawn:
  • The hydrogen production rate for all the tested materials was calculated as mol hydrogen produced per kg of biocarbon used. The tests were performed for a period of 90 min at a temperature of 1100 °C. Due to its high porosity, birch bark had the highest hydrogen production rate per catalyst mass at 105 mol/kg biocarbon. The lowest hydrogen production potential belonged to the SEP biocarbon.
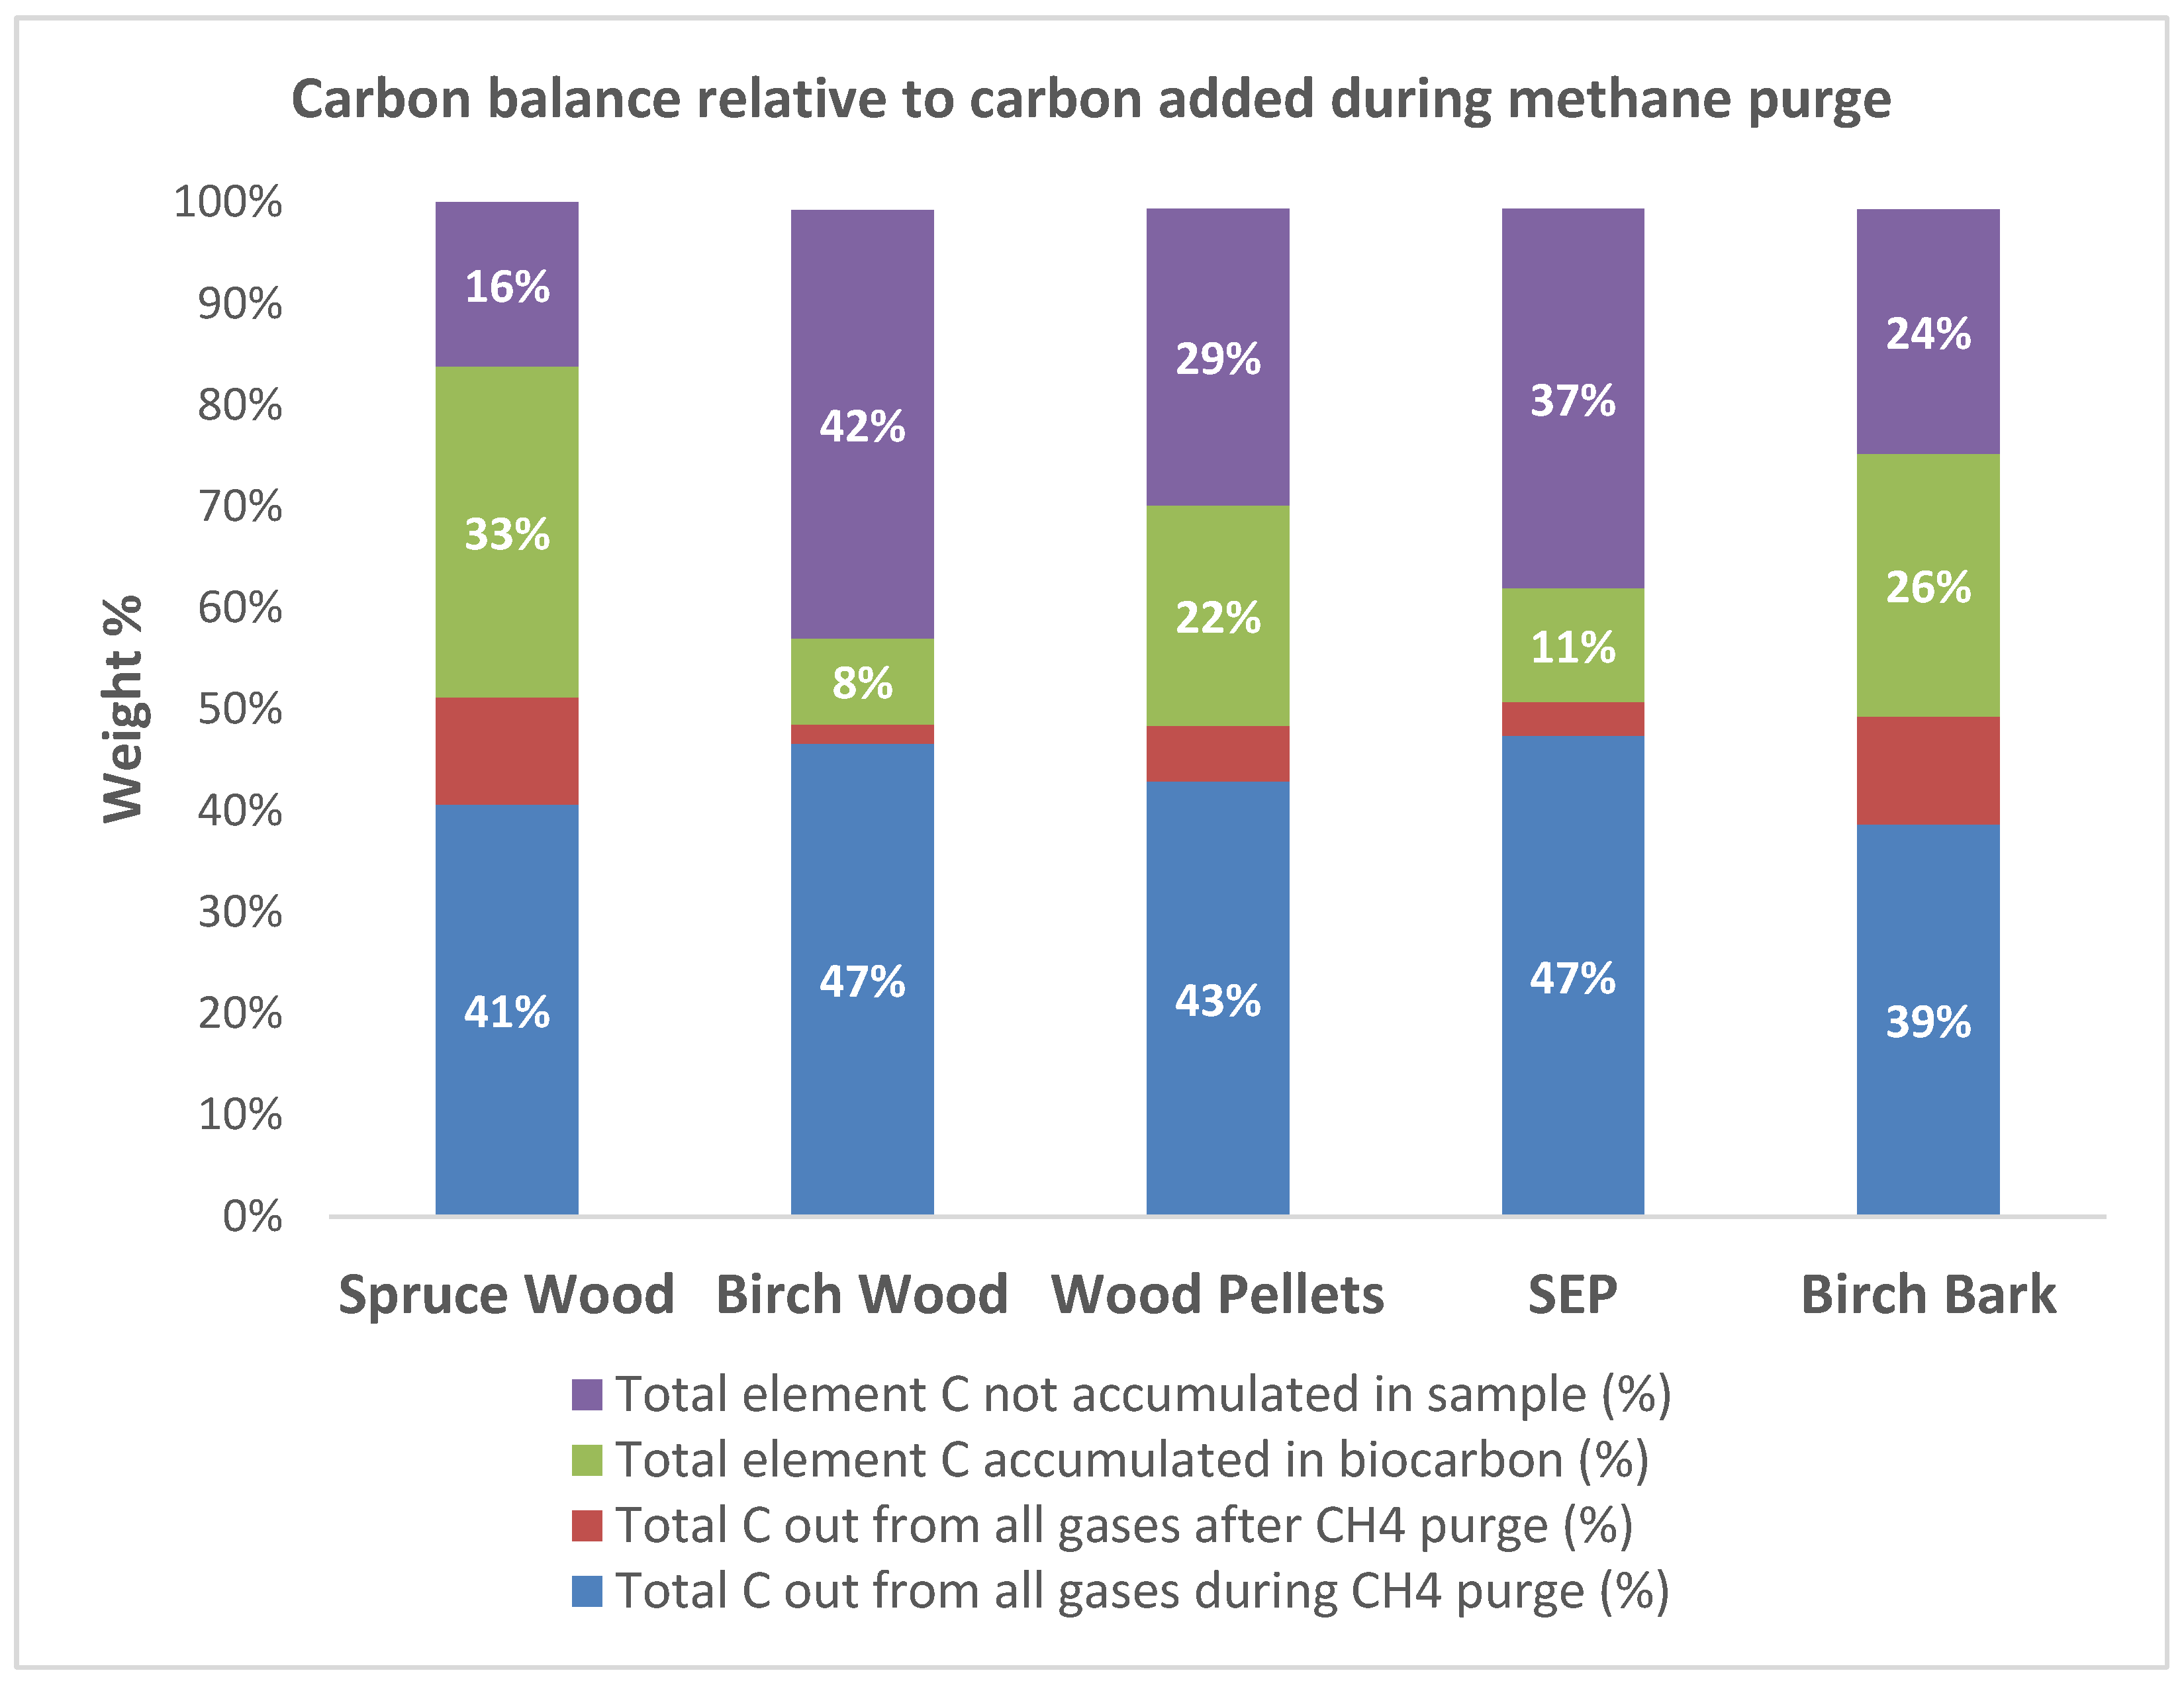
  • The carbon deposition rate was derived by calculating the weight increase relative to the start weight. All the biocarbons showed high carbon deposition that increased with the reactor temperature, the methane ratio in the purge gas and the holding time. The highest deposition rate of 42.8% was achieved with birch bark, and the lowest was 13.9%, achieved with steam-explosion pellets.
  • CDM experiments performed on individual samples showed that alkali metals play an important role in methane decomposition. Ninety percent of the alkali metals potassium and sodium were removed from the biocarbon after treatment at 1100 °C with a CH4/N2 ratio of 90/10 and a 90 min holding time. The alkali removal during methane decomposition also led to lower reactivity in the treated biocarbon. In fact, the potassium and sodium increase in the biocarbon yielded a higher hydrogen production rate and led to an improved CO2 reaction rate. This effect is clearly shown in Figures S2 and S6 in the Supplementary Materials.
  • The surface areas of the different biocarbons also affected the hydrogen production rates. Figure S3 shows that an increase in the surface area resulted in higher hydrogen yields.
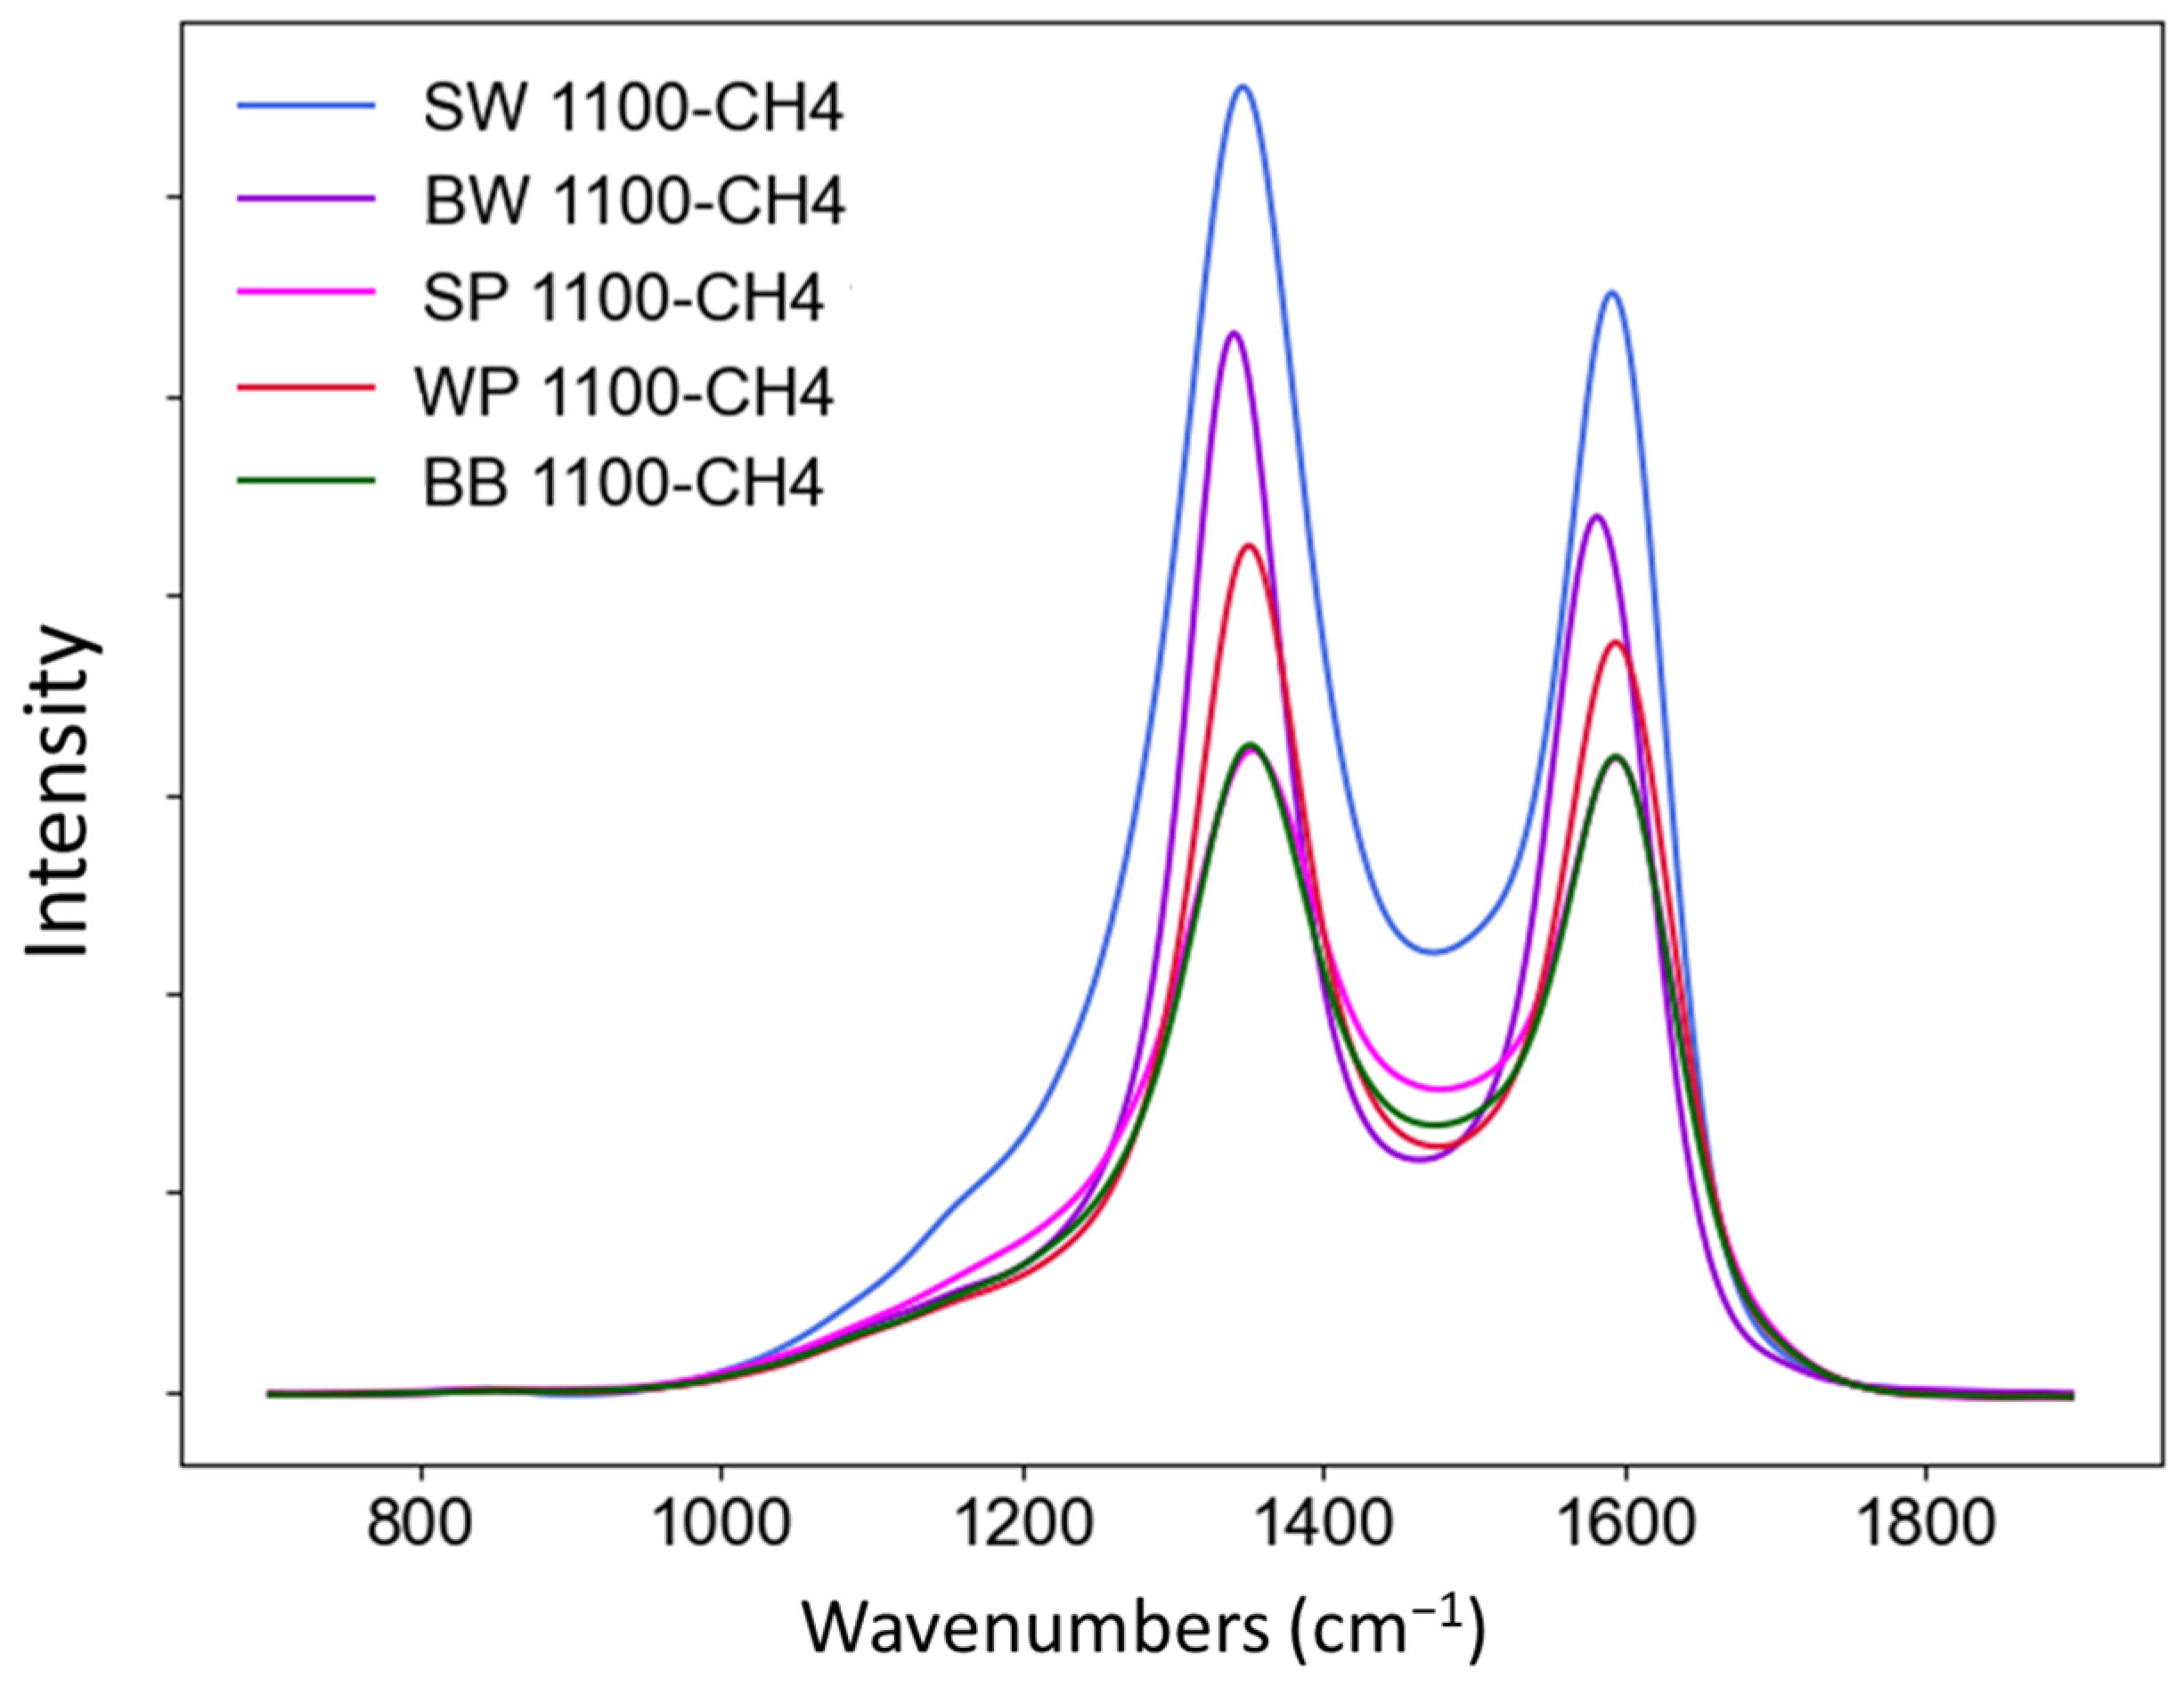
  • Raman and SEM-EDS also showed a more structured carbon matrix and deposition on the particle surfaces, both of which should lead to lower reactivity. The reactivity analysis also confirmed that the CO2 reactivity was indeed lowered after the biocarbon densification. The treated SEP biocarbon had the lowest reactivity rate, which was close to that of the reference coke sample, and it can thus be considered suitable as a reducing agent in manganese production.

Supplementary Materials

The following supporting information can be downloaded at: https://www.mdpi.com/article/10.3390/en18030558/s1, Figure S1: Pictures of the biocarbons produced at 1000 °C with 100 % nitrogen: (a) spruce wood, (b) birch wood, (c) wood pellets, (d) steam explosion pellets, (e) birch bark.; Figure S2: The influence of alkali concentration (Potassium and Sodium) on the total hydrogen produced during CDM experiments.; Figure S3: The influence of the initial biocarbon surface area on the total hydrogen produced during CDM experiments.; Figure S4: SEM images from the biocarbons used for methane cracking at 1100 °C with 90 % me-thane and 10 % Nitrogen. The biocarbons originate from: (a) spruce wood, (b) birch wood, (c) wood pellets, (d) steam explosion pellets, (e) birch bark. Table S1: EDS analysis of the SEM images in Figure S4.; Figure S5: The influence of the overall CO2 reaction rate of initial biocarbon on the total hydrogen produced and the surface area during CDM experiments.; Figure S6: The influence of alkali content on the overall CO2 reaction rate of initial biocarbon during CDM experiments.

Author Contributions

Conceptualization, R.A.K. and Ø.S.; methodology, R.A.K. and H.D.; validation, Ø.S. and H.D.; formal analysis, R.A.K.; investigation, L.W., P.T. and S.J.; data curation, R.A.K., L.W. and S.J.; writing—original draft preparation, R.A.K., H.D., L.W. and S.J.; writing—review and editing, R.A.K., H.D. and Ø.S.; visualization, R.A.K., L.W., P.T. and S.J.; supervision, R.A.K., H.D. and Ø.S.; project administration, R.A.K.; funding acquisition, R.A.K. All authors have read and agreed to the published version of the manuscript.

Funding

This research is part of the project C&H2Ar (502003162), which is funded by the SINTEF Climate Fund, which supports research on solutions and technologies that reduce climate gases in the atmosphere. The research was also supported by the BioSynGas project, which is funded by the Research Council of Norway (Project Number: 319723).

Data Availability Statement

Data can be found in the Supplementary File and include images of the biocarbons, correlations of data that is already in the article, and SEM-EDS data and images.

Conflicts of Interest

The authors declare no conflicts of interest.

References

  1. Heintz, I.; Mousa, E.; Ye, G. Development of Fossil-Free Technologies for the Metallurgical Industry—Swerim Pilot and Industrial Experiences. In Advances in Pyrometallurgy; Fleuriault, C., Steenkamp, J.D., Gregurek, D., White, J.F., Reynolds, Q.G., Mackey, P.J., Hockaday, S.A.C., Eds.; Springer Nature: Cham, Switzerland, 2023; pp. 55–66. [Google Scholar]
  2. Souza Filho, I.R.; Springer, H.; Ma, Y.; Mahajan, A.; da Silva, C.C.; Kulse, M.; Raabe, D. Green Steel at Its Crossroads: Hybrid Hydrogen-Based Reduction of Iron Ores. J. Clean. Prod. 2022, 340, 130805. [Google Scholar] [CrossRef]
  3. Abdul Quader, M.; Ahmed, S.; Dawal, S.Z.; Nukman, Y. Present Needs, Recent Progress and Future Trends of Energy-Efficient Ultra-Low Carbon Dioxide (CO2) Steelmaking (ULCOS) Program. Renew. Sustain. Energy Rev. 2016, 55, 537–549. [Google Scholar] [CrossRef]
  4. Dalaker, H.; Hovig, E.W. Hydrogen Plasma-Based Reduction of Metal Oxides. In Advances in Pyrometallurgy; Fleuriault, C., Steenkamp, J.D., Gregurek, D., White, J.F., Reynolds, Q.G., Mackey, P.J., Hockaday, S.A.C., Eds.; Springer Nature: Cham, Switzerland, 2023; pp. 85–94. [Google Scholar]
  5. Schanche, T.L.; Tangstad, M. Prereduction of Nchwaning Ore in CO/CO2/H2 Gas Mixtures. Minerals 2021, 11, 1097. [Google Scholar] [CrossRef]
  6. Osen, K.S.; Dalaker, H.; Martinez, A.M.; Gudbrandsen, H.; Wang, Z.; Kero, I. CO2 Free FeMn/Mn Production Through Molten Oxide Electrolysis. In Advances in Pyrometallurgy; Fleuriault, C., Steenkamp, J.D., Gregurek, D., White, J.F., Reynolds, Q.G., Mackey, P.J., Hockaday, S.A.C., Eds.; Springer Nature: Cham, Switzerland, 2023; pp. 267–280. [Google Scholar]
  7. Allanore, A. Features and Challenges of Molten Oxide Electrolytes for Metal Extraction. J. Electrochem. Soc. 2014, 162, E13. [Google Scholar] [CrossRef]
  8. Wiencke, J.; Lavelaine, H.; Kane, G.J.; Panteix, P.-J.; Petitjean, C.; Rapin, C. Kinetics of Iron Electrochemical Reduction into Liquid Metal at 1823 K in a Molten Oxide Electrolyte. Mater. Chem. Phys. 2018, 212, 214–223. [Google Scholar] [CrossRef]
  9. Myrhaug, E.H. Non-Fossil Reduction Materials in the Silicon Process-Properties and Behaviour. Ph.D. Thesis, Norges Teknisk-Naturvitenskapelige Universitet, Trondheim, Norway, 2003. Available online: https://www.osti.gov/etdeweb/servlets/purl/20559402 (accessed on 1 February 2024).
  10. Kaffash, H.; Surup, G.R.; Tangstad, M. Densification of Biocarbon and Its Effect on CO2 Reactivity. Processes 2021, 9, 193. [Google Scholar] [CrossRef]
  11. Abbas, H.F.; Wan Daud, W.M.A. Hydrogen Production by Methane Decomposition: A Review. Int. J. Hydrogen Energy 2010, 35, 1160–1190. [Google Scholar] [CrossRef]
  12. Zhang, J.; Li, X.; Chen, H.; Qi, M.; Zhang, G.; Hu, H.; Ma, X. Hydrogen Production by Catalytic Methane Decomposition: Carbon Materials as Catalysts or Catalyst Supports. Int. J. Hydrogen Energy 2017, 42, 19755–19775. [Google Scholar] [CrossRef]
  13. Suelves, I.; Lazaro, M.; Moliner, R.; Corbella, B.; Palacios, J. Hydrogen Production by Thermo Catalytic Decomposition of Methane on Ni-Based Catalysts: Influence of Operating Conditions on Catalyst Deactivation and Carbon Characteristics. Int. J. Hydrogen Energy 2005, 30, 1555–1567. [Google Scholar] [CrossRef]
  14. Amin, A.; Epling, W.; Croiset, E. Reaction and Deactivation Rates of Methane Catalytic Cracking over Nickel. Ind. Eng. Chem. Res. 2011, 50, 12460–12470. [Google Scholar] [CrossRef]
  15. Shah, N.; Panjala, D.; Huffman, G.P. Hydrogen Production by Catalytic Decomposition of Methane. Energy Fuels 2001, 15, 1528–1534. [Google Scholar] [CrossRef]
  16. Shen, W.; Wang, Y.; Shi, X.; Shah, N.; Huggins, F.; Bollineni, S.; Seehra, M.; Huffman, G. Catalytic Nonoxidative Dehydrogenation of Ethane over Fe–Ni and Ni Catalysts Supported on Mg(Al)O to Produce Hydrogen and Easily Purified Carbon Nanotubes. Energy Fuels 2007, 21, 3520–3529. [Google Scholar] [CrossRef]
  17. Wang, H.Y.; Lua, A.C. Development of Metallic Nickel Nanoparticle Catalyst for the Decomposition of Methane into Hydrogen and Carbon Nanofibers. J. Phys. Chem. C 2012, 116, 26765–26775. [Google Scholar] [CrossRef]
  18. Moliner, R.; Suelves, I.; Lazaro, M.; Moreno, O. Thermocatalytic Decomposition of Methane over Activated Carbons: Influence of Textural Properties and Surface Chemistry. Int. J. Hydrogen Energy 2005, 30, 293–300. [Google Scholar] [CrossRef]
  19. Kim, M. Hydrogen Production by Catalytic Decomposition of Methane over Activated Carbons: Kinetic Study. Int. J. Hydrogen Energy 2004, 29, 187–193. [Google Scholar] [CrossRef]
  20. Lee, K.K.; Han, G.Y.; Yoon, K.J.; Lee, B.K. Thermocatalytic Hydrogen Production from the Methane in a Fluidized Bed with Activated Carbon Catalyst. Catal. Today 2004, 93–95, 81–86. [Google Scholar] [CrossRef]
  21. Bai, Z.; Chen, H.; Li, B.; Li, W. Catalytic Decomposition of Methane over Activated Carbon. J. Anal. Appl. Pyrolysis 2005, 73, 335–341. [Google Scholar] [CrossRef]
  22. Abbas, H.F.; Daud, W.M.A.W. Thermocatalytic Decomposition of Methane for Hydrogen Production Using Activated Carbon Catalyst: Regeneration and Characterization Studies. Int. J. Hydrogen Energy 2009, 34, 8034–8045. [Google Scholar] [CrossRef]
  23. Song, Q.; Xiao, R.; Li, Y.; Shen, L. Catalytic Carbon Dioxide Reforming of Methane to Synthesis Gas over Activated Carbon Catalyst. Ind. Eng. Chem. Res. 2008, 47, 4349–4357. [Google Scholar] [CrossRef]
  24. Lee, E.K.; Lee, S.Y.; Han, G.Y.; Lee, B.K.; Lee, T.-J.; Jun, J.H.; Yoon, K.J. Catalytic Decomposition of Methane over Carbon Blacks for CO2-Free Hydrogen Production. Carbon 2004, 42, 2641–2648. [Google Scholar] [CrossRef]
  25. Muradov, N.; Smith, F.; T-Raissi, A. Catalytic Activity of Carbons for Methane Decomposition Reaction. Catal. Today 2005, 102–103, 225–233. [Google Scholar] [CrossRef]
  26. Suelves, I.; Pinilla, J.L.; Lázaro, M.J.; Moliner, R. Carbonaceous Materials as Catalysts for Decomposition of Methane. Chem. Eng. J. 2008, 140, 432–438. [Google Scholar] [CrossRef]
  27. Wei, L.; Tan, Y.; Han, Y.; Zhao, J.; Wu, J.; Zhang, D. Hydrogen Production by Methane Cracking over Different Coal Chars. Fuel 2011, 90, 3473–3479. [Google Scholar] [CrossRef]
  28. Wei, L.; Zhu, M.; Ma, Y.; Zhang, Z.; Zhang, D. Hydrogen Production by Methane Cracking over Xiaolongtan Lignite Chars: The Role of Mineral Matter. Fuel 2016, 183, 345–350. [Google Scholar] [CrossRef]
  29. Hussein, A.; Larachi, F.; Ziegler, D.; Alamdari, H. Effects of Heat Treatment and Acid Washing on Properties and Reactivity of Charcoal. Biomass Bioenergy 2016, 90, 101–113. [Google Scholar] [CrossRef]
  30. Wang, L.; Khalil, R.; Bakken, J.; Skreiberg, Ø. Production and Characterization of Biocarbon from Woody Biomasses Produced at 1000 °C. Fuel 2024, 370, 131667. [Google Scholar] [CrossRef]
  31. D1762-84R13; D07 Committee ASTM International. Test Method for Chemical Analysis of Wood Charcoal. ASTM International: West Conshohocken, PA, USA, 2021. [CrossRef]
  32. Maziarka, P.; Wurzer, C.; Arauzo, P.J.; Dieguez-Alonso, A.; Mašek, O.; Ronsse, F. Do You BET on Routine? The Reliability of N2 Physisorption for the Quantitative Assessment of Biochar’s Surface Area. Chem. Eng. J. 2021, 418, 129234. [Google Scholar] [CrossRef]
  33. Wang, L.; Olsen, M.N.P.; Moni, C.; Dieguez-Alonso, A.; de la Rosa, J.M.; Stenrød, M.; Liu, X.; Mao, L. Comparison of Properties of Biochar Produced from Different Types of Lignocellulosic Biomass by Slow Pyrolysis at 600 °C. Appl. Energy Combust. Sci. 2022, 12, 100090. [Google Scholar] [CrossRef]
  34. Savitzky, A.; Golay, M.J.E. Smoothing and Differentiation of Data by Simplified Least Squares Procedures. Anal. Chem. 1964, 36, 1627–1639. [Google Scholar] [CrossRef]
  35. Cao, A.; Pandya, A.K.; Serhatkulu, G.K.; Weber, R.E.; Dai, H.; Thakur, J.S.; Naik, V.M.; Naik, R.; Auner, G.W.; Rabah, R.; et al. A Robust Method for Automated Background Subtraction of Tissue Fluorescence. J. Raman Spectrosc. 2007, 38, 1199–1205. [Google Scholar] [CrossRef]
  36. Phounglamcheik, A.; Wang, L.; Romar, H.; Kienzl, N.; Broström, M.; Ramser, K.; Skreiberg, Ø.; Umeki, K. Effects of Pyrolysis Conditions and Feedstocks on the Properties and Gasification Reactivity of Charcoal from Woodchips. Energy Fuels 2020, 34, 8353–8365. [Google Scholar] [CrossRef]
  37. Ishimaru, K.; Hata, T.; Bronsveld, P.; Nishizawa, T.; Imamura, Y. Characterization of Sp2- and Sp3-Bonded Carbon in Wood Charcoal. J. Wood Sci. 2007, 53, 442–448. [Google Scholar] [CrossRef]
  38. Sheng, C. Char Structure Characterised by Raman Spectroscopy and Its Correlations with Combustion Reactivity. Fuel 2007, 86, 2316–2324. [Google Scholar] [CrossRef]
  39. Lin, X.; Dong, M.; Nie, W.; Rao, G.; Lu, J. Conversion Mechanism of Organic Components during the Eucalyptus Biomass Pyrolysis Process Based on the Multispectral Association Method. Energy Fuels 2024, 38, 7929–7940. [Google Scholar] [CrossRef]
  40. Monsen, B.; Tangstad, M.; Solheim, I.; Syvertsen, M.; Ishak, R.; Midtgaard, H. Charcoal for manganese alloy production. In Proceedings of the Infacon XI, New Delhi, India, 18–21 February 2007; pp. 18–21. [Google Scholar]
  41. Zahra, A.C.A.; Anniwaer, A.; Okura, H.; Chaerusani, V.; Zhang, P.; Rizkiana, J.; Kurnia, I.; Abudula, A.; Guan, G. Addition of Torrefied Algal Biomass to Improve Land-Based Biomass Gasification for Hydrogen-Rich Gas Production. Algal Res. 2023, 74, 103236. [Google Scholar] [CrossRef]
  42. Brown, R.A.; Kercher, A.K.; Nguyen, T.H.; Nagle, D.C.; Ball, W.P. Production and Characterization of Synthetic Wood Chars for Use as Surrogates for Natural Sorbents. Org. Geochem. 2006, 37, 321–333. [Google Scholar] [CrossRef]
  43. Guizani, C.; Escudero Sanz, F.J.; Salvador, S. The Nature of the Deposited Carbon at Methane Cracking over a Nickel Loaded Wood-Char. Comptes Rendus Chim. 2016, 19, 423–432. [Google Scholar] [CrossRef]
  44. Kameya, Y.; Hanamura, K. Kinetic and Raman Spectroscopic Study on Catalytic Characteristics of Carbon Blacks in Methane Decomposition. Chem. Eng. J. 2011, 173, 627–635. [Google Scholar] [CrossRef]
  45. Muradov, N. Catalysis of Methane Decomposition over Elemental Carbon. Catal. Commun. 2001, 2, 89–94. [Google Scholar] [CrossRef]
  46. Yamauchi, S.; Kurimoto, Y. Raman Spectroscopic Study on Pyrolyzed Wood and Bark of Japanese Cedar: Temperature Dependence of Raman Parameters. J. Wood Sci. 2003, 49, 235–240. [Google Scholar] [CrossRef]
  47. Jayakumari, S.; Jahrsengene, G.; Ksiazek, M.; Ringdalen, E. Investigations on CO2 Reactivity and Thermal Strength of Carbon Sources for Ferroalloy and Silicon Production. In Proceedings of the 62nd Conference of Metallurgists, COM 2023, Toronto, ON, Canada, 21–24 August 2023; Springer Nature: Cham, Switzerland, 2023; pp. 1009–1018. [Google Scholar]
  48. Kaffash, H.; Tangstad, M. The Effect of Densification on Compressive Strength of Charcoal. In Proceedings of the 16th International Ferro-Alloys Congress (INFACON XVI), Virtual, 27–29 September 2021. [Google Scholar]
Figure 1. Methane cracking setup for the batch production of low-reactivity biocarbon. In setup A, a 5-compartment basket was used. Setup B was without this insert, which can be seen to the left in the figure.
Energies 18 00558 g001
Figure 2. Schematic illustration of the furnace setup used for the CO2-reactivity test.
Energies 18 00558 g002
Figure 3. Carbon balance from the CDM experiments.
Energies 18 00558 g003
Figure 4. Weight % of carbon normalized on dry and ash-free bases. The first series (1000, 90, 0/100) is that for the untreated biocarbon.
Energies 18 00558 g004
Figure 5. Raman spectra of the biocarbon samples after methane cracking.
Energies 18 00558 g005
Figure 6. Exemplary Raman spectra and 5-band curve-fitting results (a) and comparison of deconvoluted D and G bands from Raman spectra of biocarbon samples after CDM (b).
Energies 18 00558 g006
Figure 7. Percentages of particles below 3.35 mm (a) and below 0.5 mm (b).
Energies 18 00558 g007
Figure 8. Weight loss rates of the fixed carbon for the treated material (a) for the entire period and (b) for the period between 2 and 4 min.
Energies 18 00558 g008
Table 1. The experimental matrix.
Exp. No.MaterialReactor T. (°C)Holding Time (min)EnvironmentGas Analysis
1All10003090/10 CH4/ArNo
2All10009090/10 CH4/ArNo
3All11003090/10 CH4/ArNo
4All11009045/55 CH4/ArNo
5All11009090/10 CH4/ArNo
6All1100900/100 CH4/ArNo
7Spruce Wood11007590/10 CH4/N2Yes
8Birch Wood11009090/10 CH4/N2Yes
9Wood Pellets11009090/10 CH4/N2Yes
10SEPs11009090/10 CH4/N2Yes
11Birch Bark11009090/10 CH4/N2Yes
Table 2. A summary of the weight gain and the distribution of produced gases formed in the individual experiments.
FeedstockSpruce WoodWood PelletsSEPsBirch Bark
Start weight of biocarbon (g)81.780.0100.082.5
Volatiles released prior to CH4 purge (g) and in % relative to start weight0.02
(0.02%)
0.74
(0.93%)
0.82
(0.82%)
0.99
(1.2%)
Weight prior to CH4 purge (g)81.779.299.281.5
Weight gained (g) and in % relative to start weight34.36
(42.1%)
26.48
(33.4%)
13.8
(13.9%)
34.91
(42.8%)
Total H2 out (mol)7.37.46.88.7
Total CH4 out (mol)3.34.04.54.0
Total C2H4 out (mol)0.10.10.10.1
Total H2 out (mol/mol CH4 in)0.80.70.70.8
Total H2 out (mol/kg biocarbon)89.992.468.2105.2
Total CH4 out (mol/kg biocarbon)40.150.644.848.4
Table 4. Ultimate analysis (wt.% dry, ash-free basis) of raw biocarbon and biocarbon treated under different conditions.
Spruce WoodBirch WoodWood PelletsSEPsBirch Bark
Biocarbon from pyrolysis
Carbon89.42 (±0.26)89.67 (±0.31)88.99 (±0.30)90.23 (±0.41)88.10 (±0.41)
Hydrogen0.79 (±0.04)0.80 (±0.08)0.78 (±0.09)0.68 (±0.06)0.82 (±0.08)
Nitrogen0.51 (±0.007)0.47 (±0.004)0.44 (±0.005)0.57 (±0.002)0.52 (±0.002)
Sulphur0.02 (±0.001)0.02 (±0.001)0.02 (±0.001)0.05 (±0.001)0.02 (±0.001)
Oxygen9.279.049.778.4710.54
Treated biocarbon, at 1100 °C, 90 min, and 90/10 (CH4/N2)
Carbon98.77 (±0.23)96.56 (±0.18)96.03 (±0.24)96.65 (±0.19)96.81 (±0.25)
Hydrogen0.08 (±0.01)0.23 (±0.02)0.29 (±0.02)0.15 (±0.02)0.12 (±0.02)
Nitrogen0.10 (±0.032)0.34 (±0.016)0.25 (±0.013)0.31 (±0.017)0.38 (±0.016)
Sulphur0.01 (±0.001)0.02 (±0.001)0.03 (±0.001)0.05 (±0.001)0.02 (±0.001)
Oxygen1.042.853.402.842.67
Treated biocarbon, at 1000 °C, 30 min, and 90/10 (CH4/Ar)
Carbon94.66 (±0.13)92.00 (±0.25)92.60 (±0.32)94.19 (±0.29)91.11 (±0.25)
Hydrogen0.31 (±0.02)0.52 (±0.03)0.44 (±0.10)0.45 (±0.03)0.64 (±0.05)
Nitrogen0.50 (±0.019)0.68 (±0.017)0.72 (±0.026)0.77 (±0.021)0.91 (±0.023)
Sulphur0.01 (±0.001)0.05 (±0.001)0.01 (±0.001)0.08 (±0.001)0.02 (±0.001)
Oxygen4.526.756.234.517.33
Treated biocarbon, at 1000 °C, 90 min, and 90/10 (CH4/Ar)
Carbon97.61 (±0.33)96.95 (±0.28)96.36 (±0.28)95.80 (±0.36)94.20 (±0.66)
Hydrogen0.24 (±0.054)0.21 (±0.033)0.17 (±0.038)0.16 (±0.063)0.24 (±0.05)
Nitrogen0.69 (±0.012)0.49 (±0.021)0.56 (±0.019)0.79 (±0.028)0.88 (±0.048)
Sulphur0.02 (±0.002)0.014 (±0.002)0.012 (±0.002)0.016 (±0.002)0.019 (±0.002)
Oxygen1.452.352.913.254.68
Treated biocarbon, at 1100 C, 30 min, and 90/10 (CH4/Ar)
Carbon95.00 (±0.41)95.56 (±0.36)95.11 (±0.48)95.03 (±0.45)94.96 (±0.19)
Hydrogen0.27 (±0.036)0.17 (±0.021)0.16 (±0.022)0.31 (±0.038)0.26 (±0.047)
Nitrogen0.18 (±0.029)0.30 (±0.035)0.27 (±0.045)0.34 (±0.053)0.31 (±0.019)
Sulphur0.01 (±0.001)0.01 (±0.001)0.01 (±0.001)0.01 (±0.001)0.01 (±0.001)
Oxygen4.543.964.454.314.45
Treated biocarbon, at 1100 °C, 90 min, and 45/55 (CH4/Ar)
Carbon96.67 (±0.23)95.68 (±0.22)95.36 (±0.31)95.19 (±0.35)95.16 (±0.44)
Hydrogen0.21 (±0.03)0.19 (±0.02)0.19 (±0.01)0.14 (±0.03)0.19 (±0.02)
Nitrogen0.20 (±0.02)0.29 (±0.04)0.25 (±0.04)0.25 (±0.05)0.55 (±0.02)
Sulphur0.014 (±0.001)0.013 (±0.001)0.016 (±0.001)0.02 (±0.001)0.019 (±0.001)
Oxygen2.913.844.194.404.11
Treated biocarbon, at 1100 °C, 90 min, and 90/10 (CH4/Ar)
Carbon96.73 (±0.13)95.99 (±0.15)95.59 (±0.18)95.56 (±0.19)95.38 (±0.19)
Hydrogen0.24 (±0.01)0.21 (±0.02)0.21 (±0.02)0.19 (±0.02)0.23 (±0.01)
Nitrogen0.27 (±0.023)0.26 (±0.014)0.20 (±0.011)0.18 (±0.012)0.24 (±0.013)
Sulphur0.05 (±0.001)0.01 (±0.001)0.01 (±0.001)0.01 (±0.001)0.02 (±0.001)
Oxygen2.713.534.004.064.13
Treated biocarbon, at 1100 °C, 90 min, and 0/100 (CH4/Ar)
Carbon95.53 (±0.19)94.01 (±0.14)95.97 (±0.25)95.23 (±0.27)93.89 (±0.19)
Hydrogen0.15 (±0.001)0.15 (±0.002)0.12 (±0.005)0.14 (±0.005)0.14 (±0.004)
Nitrogen0.55 (±0.009)0.68 (±0.004)0.63 (±0.002)0.47 (±0.002)0.44 (±0.001)
Sulphur0.01 (±0.29)0.09 (±0.001)0.01 (±0.001)0.01 (±0.001)0.01 (±0.001)
Oxygen3.775.073.264.155.52
Table 5. Ash-forming elements in produced biocarbons calculated as mg/kg of dry samples.
Ash AnalysisSpruce WoodBirch WoodWood PelletsSEPsBirch Bark
Biocarbon from pyrolysis
Calcium362041512890328016,549
Potassium27703595179713968048
Phosphorus291240272142957
Silicon134169122123340
Sodium18611885169910476831
Sulphur15817598140637
Magnesium3815053522621285
Manganese352304346247859
Aluminum212270142125353
Iron224330216139460
Copper35145
Zinc911445
Barium 58674879354
Titanium72111421
Treated biocarbon, at 1100 °C, 90 min, and 90/10 (CH4/N2)
Calcium255037062350326014,780
Potassium3402191991704578
Phosphorus15014313889357
Silicon119134154110200
Sodium106202135106180
Sulphur9816211370287
Magnesium2733724083901174
Manganese151259260384406
Aluminum641408885156
Iron198441182102278
Copper32326
Zinc47549
Barium 36553069205
Titanium387113
Treated biocarbon, at 1000 °C, 30 min, and 90/10 (CH4/Ar)
Calcium315031102620303016,280
Potassium10608403508506440
Phosphorus2102402062001320
Silicon108134139109441
Sodium131227147191374
Sulphur803645120280
Magnesium3694127194071196
Manganese226291326405772
Aluminum7442327686
Iron149459208108392
Copper66513693
Zinc54944
Barium 53683371308
Titanium1010169
Treated biocarbon, at 1100 °C, 90 min, and 90/10 (CH4/Ar)
Calcium321121822819261811,285
Potassium123164218200143
Phosphorus27421241281138
Silicon140168173135402
Sodium15118210064160
Sulphur112183128156224
Magnesium3409733573831165
Manganese9429187361446
Aluminum591099781172
Iron68466173284250
Copper252145
Zinc495346
Barium 55367063197
Titanium51052113
Treated biocarbon, at 1100 °C, 90 min, and 0/100 (CH4/Ar)
Calcium307927803710303114,770
Potassium14561630141013826800
Phosphorus189170123220620
Silicon156187181143413
Sodium104511756915062288
Sulphur1181006080210
Magnesium2824313412601122
Manganese312266297376989
Aluminum95853765311
Iron4913874178241
Copper796612
Zinc44444
Barium 92476784392
Titanium1131121
Table 6. Surface area and density of treated biocarbons from experiments 7–11 and untreated biocarbons.
Physico-Chemical PropertySpruce WoodBirch WoodWood PelletsSEPsBirch Bark
Biocarbon from pyrolysis
Surface area (N2) (m2 g−1)204223150105279
Density (g cm−3)1.971.992.042.021.70
Treated biocarbon
Surface area (N2) (m2 g−1)167
(18%)
148 (34%)133 (11%)88
(16%)
203
(27%)
Density (g cm−3)1.79
(9%)
1.81
(9%)
1.69 (17%)1.97
(3%)
1.62
(5%)
Table 7. Main Raman spectral parameters of the biocarbon samples after CDM (at 1100 °C, 90 min, and 90/10 (CH4/N2)).
ParameterSpruce WoodBirch WoodWood PelletsSEPsBirch Bark
ID/IG1.76 1.371.251.160.99
AD/AG3.082.351.291.511.26
AD/Atotal0.540.460.370.320.33
FWHMD (cm−1)159.3127.5120.2101.2104.3
FWHMG (cm−1)95.2102.6104.298.796.4
Table 8. The CO2-reactivity characteristics of the non-treated and treated samples.
CO2-ReactivityStart wt. (g)End wt. (g)Wt. Loss (%)Overall RR 11–2 min RR 22–4 min. RR 3
Non-treated biocarbons
SW2017.910.69.468.48-
BW1917.114.59.959.297.72
WP2017.711.76.16.84.56
SEP2018.19.55.055.174.02
BB2017.214.211.379.22-
Treated biocarbons
SW2018.95.93.885.242.59
BW2018.95.64.374.793.32
WP2017.811.14.835.863.49
SEP2018.95.52.624.452.53
BB2019.33.73.815.162.66
Reference (coke)
2017.81.12.664.071.85
1 The overall reaction rate in % Fixed C reacted/min. 2 The reaction rate in % Fixed C reacted/min, linear fit for the period 1–2 min. 3 The reaction rate in % Fixed C reacted/min, linear fit for the period 2–4 min.
Disclaimer/Publisher’s Note: The statements, opinions and data contained in all publications are solely those of the individual author(s) and contributor(s) and not of MDPI and/or the editor(s). MDPI and/or the editor(s) disclaim responsibility for any injury to people or property resulting from any ideas, methods, instructions or products referred to in the content.

