Article

Voltage Security-Constrained Energy Storage Planning Model Considering Multi-Agent Collaborative Optimization in High-Renewable Power Systems


1
Global Energy Interconnection Group Co., Ltd., Beijing 100031, China
2
State Key Laboratory of Advanced Electromagnetic Technology, Huazhong University of Science and Technology, Wuhan 430074, China
*
Author to whom correspondence should be addressed.
Energies 2025, 18(24), 6597; https://doi.org/10.3390/en18246597
Submission received: 21 October 2025 / Revised: 19 November 2025 / Accepted: 11 December 2025 / Published: 17 December 2025
(This article belongs to the Section F1: Electrical Power System)

Abstract

Enhancing system strength to ensure voltage security has become a critical challenge for power systems with high penetration of renewable energy (RE). As China accelerates its clean-energy transition, the conventional grid dominated by synchronous generators is evolving into a dual-high system characterized by both high shares of wind–solar generation and extensive power-electronic interfaces. This shift fundamentally alters the mechanisms of voltage support, rendering traditional short circuit ratio (SCR) index inadequate for describing grid strength. To address this gap, this study proposes a multi-renewable-station short circuit ratio (MRSCR) index that quantitatively evaluates the voltage support strength of RE-dominated systems, and further analyzes the mechanism by which multiple agents on the generation and grid sides affect MRSCR, enhancing the generality and applicability of the proposed index. The MRSCR is further formulated as a voltage security constraint and integrated into an energy storage planning model considering multi-agent collaborative optimization. The proposed model jointly optimizes the siting and capacity configuration of grid-forming energy storage under voltage security constraints. Case studies on the IEEE 14-bus system and a real provincial grid show that incorporating the MRSCR indicator effectively enhances the system’s voltage support performance and operational resilience, achieving these improvements with only a 5.45% increase in daily operating cost compared with baseline planning results. The framework provides a practical offline tool for energy storage planning, enabling both enhanced renewable integration and improved voltage security.

1. Introduction

The dual pressures of the global energy crisis and climate change have catalyzed an unprecedented acceleration in renewable energy (RE) deployment worldwide. Among various low-carbon options, wind and solar power have emerged as the primary engines driving the global energy transition, serving as both the cornerstone of sustainable development and a crucial pathway toward carbon peaking and carbon neutrality [1,2,3,4]. In China, this transition is advancing at remarkable speed: large-scale renewable deployment has become a central pillar of national energy strategy, with policies strongly promoting the replacement of high-carbon fossil fuels—coal, oil, and natural gas—with clean sources such as wind and solar.
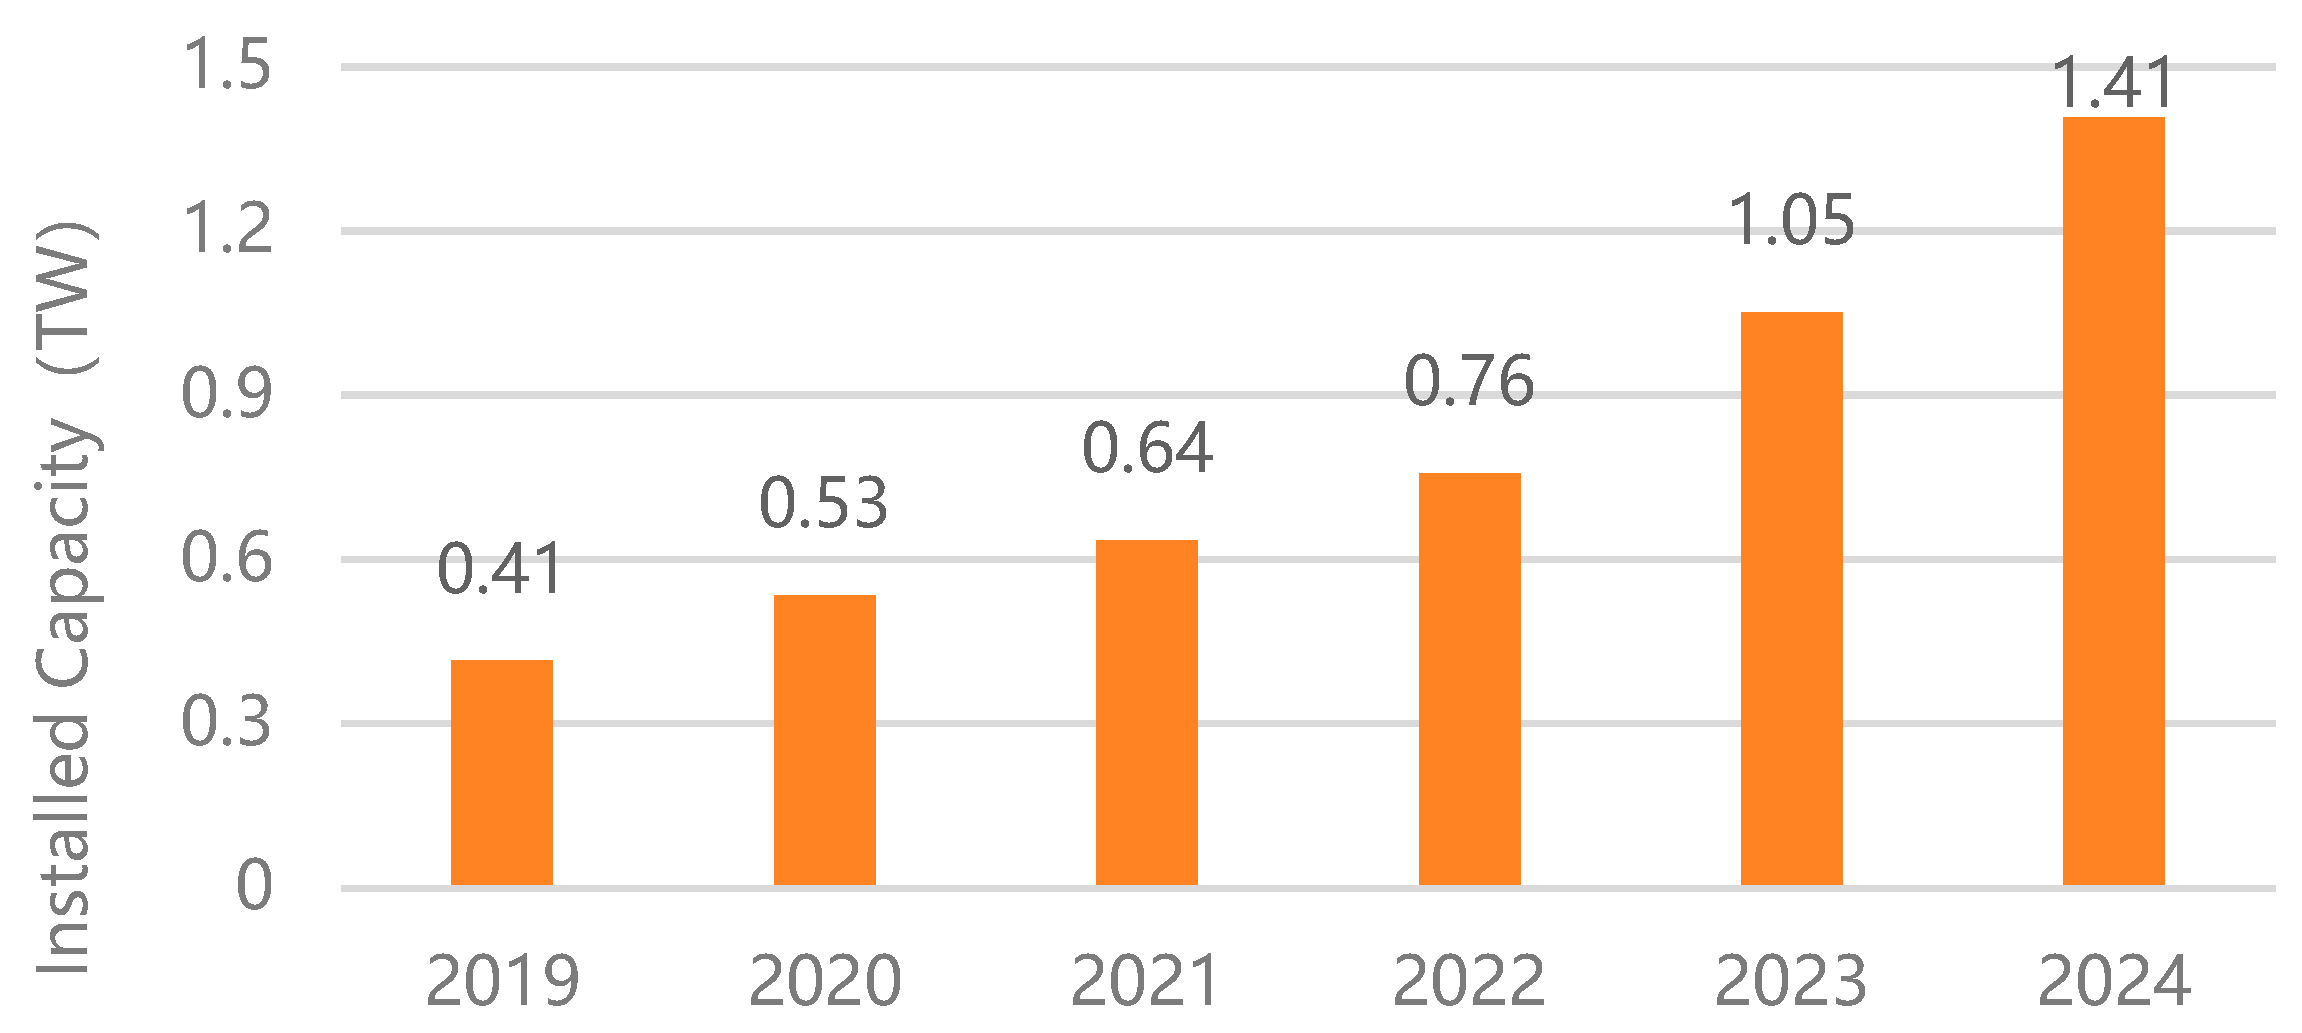
From a national resource and technology perspective, China faces clear structural constraints in its clean-energy portfolio. The remaining hydropower potential is limited, biomass resources are scarce and costly, and geothermal and marine energy technologies remain at a developmental stage. At the same time, increasingly stringent safety and regulatory requirements restrict further expansion of nuclear power. Consequently, large-scale, centralized development of wind and solar power represents the most practical and economically viable pathway for accelerating the country’s clean-energy transition. Over the past decade, China’s renewable power capacity has expanded at an extraordinary pace, with wind and photovoltaic (PV) installations repeatedly setting new records (Figure 1). Continuous advances in manufacturing, digital control, and grid integration technologies—together with economies of scale—have driven substantial cost reductions, reinforcing a positive feedback loop that sustains further deployment [5,6]. According to the National Development and Reform Commission (NDRC) and the National Energy Administration (NEA), China aimed for a combined installed capacity of wind and solar power exceeding 1200 GW by 2030, which has been achieved. Moreover, by 2035, China committed to reduce economy-wide greenhouse-gas emissions by 7% to 10% from peak levels, lift its share of non-fossil energy consumption to over 30%, and expand the installed capacity of wind and solar generation toward approximately 3600 GW [7,8,9,10,11], marking a fundamental shift toward a renewables-dominated generation mix.
Consequently, the conventional power system dominated by synchronous generators is evolving into a new-type system characterized by high penetration of wind–solar generation and power electronic equipment (hereinafter referred to as the “dual-high” features). This transformation brings two major challenges for system operation. Firstly, as renewable generation is inherently stochastic, volatile, and intermittent, a high share of renewables makes it more difficult to maintain the supply-demand balance, requiring additional flexible resources to avoid large-scale curtailment of renewable energy. Furthermore, power electronic devices are typically associated with low inertia and weak disturbance resistance, which limits their capability to support system frequency and voltage. As a result, stable grid integration becomes more difficult, and overall system strength continues to decline, posing increasingly severe challenges to supply security, operational safety, and renewable energy integration.
The fundamental prerequisites for the secure and stable operation of power system includes frequency and voltage remain within acceptable ranges under various disturbances without loss of stability. While frequency stability has been widely studied [12,13,14], voltage stability under disturbances deserves focused attention. Key considerations include (i) the magnitude of voltage deviation from the nominal operating point; (ii) whether the system can remain stable with sufficient stability margins; and (iii) whether it can withstand uncertainties, namely, robustness. Based on these considerations, the concept of system voltage support strength can be defined as the ability of system bus voltages to resist deviations and instability under disturbances such as generation fluctuations and short-circuit faults. A system with higher strength exhibits favorable dynamic responses, reflected in lower sensitivity of frequency and voltage to disturbances, along with adequate stability margins and robustness. Therefore, system voltage support strength essentially represents the capability to resist external disturbances, and sufficient strength is a core requirement for ensuring secure and stable power system operation.
Voltage support strength is the result of the combined effects of generation-side and grid-side characteristics [15]. The Chinese national standard GB 38755-2019 Guidelines for Power System Security and Stability explicitly stipulates that “power sources shall provide the system with the necessary inertia, short-circuit capacity, and active and reactive power support”, and that “in regions with a high share of renewable energy integration, renewable power plants shall provide the necessary inertia and short-circuit capacity support”, thereby clarifying that renewables need to provide support to the system during the planning and operational stages [16]. In traditional power systems, generation-side characteristics such as synchronous machines and conventional DC remain relatively fixed. For engineering applications, the industry therefore focuses on grid-side characteristics and often uses the short circuit ratio (SCR) as an approximation of voltage support strength. For example, the International Council on Large Electric systems (CIGRE), the North American Electric Reliability Corporation (NERC), the Australian Energy Market Operator (AEMO) all explicitly impose requirements on the SCR index [17,18,19,20]. Currently, extensive research exists on voltage stability issues in dual-infeed power systems, primarily focusing on quantitative assessment of grid strength. Many researchers have proposed SCR and impedance ratio indices to measure the system voltage support capability [21,22,23]. Reference [24] proposed the traditional SCR index for single-infeed system, but it did not account for interactions among multiple plants. To evaluate the voltage strength of multiple HVDC system simultaneously feeding into an AC power grid, CIGRE proposed the multi-infeed short circuit ratio (MISCR) based on the multi-infeed interaction factor [25]. Subsequent studies have further refined this approach, yielding indices such as the position-dependent short circuit ratio (PDSCR) [26], equivalent short circuit ratio (ESCR) [27], and short circuit ratio with interaction factor (SCRIF) [17]. These multi-infeed SCR indices are generalizations of the single-infeed SCR, but their derivations are mostly heuristic, lack rigorous theoretical foundations, and often neglect the impact of renewable generation plants on grid strength, limiting their applicability in modern power system. In addition, References [28,29] introduced the generalized short circuit ratio (GSCR) based on modal analysis. However, the modal method is computationally complex, and the accuracy and practicality of the index remain to be improved.
Since generation-side characteristics become highly complex and diverse due to the large-scale integration of heterogeneous renewable energy and power electronic devices in new power system. This introduces new connotations to system voltage support strength, making traditional indices such as SCR insufficient for comprehensively quantifying the overall voltage support strength of the system. Under the dual-high background, the characterization of system strength must account for the influence of multiple agents, including generation-side and grid-side equipment such as conventional synchronous generating units, renewable energy plants, and new energy storage: first, the stable operation of generation-side equipment requires a certain level of grid strength. Reference [30] addressed a typical scenario of strong grid infeed to a weak receiving-end startup mode and proposes an optimization method for unit minimum-startup schemes that satisfies system voltage stability constraints; Reference [31] comprehensively analyzed multiple factors limiting unit minimum-startup and proposes an optimization method for unit minimum-startup schemes that meets the overall system stability level; Reference [32] computed per-node short-circuit current weight indices based on the admittance matrix to quantitatively assess the contribution of units at different locations to the DC receiving-end short-circuit capacity, and proposes a unit commitment optimization model that accounts for DC near-area short-circuit capacity constraints; Reference [33] established a coupling model between conventional unit startup schemes and the grid strength of a power system with renewable integration, constrained by a critical short-circuit ratio indicator. Second, the generation characteristics of grid-connected equipment also help support the power system by enhancing its voltage support capability. In particular, highly flexible energy storage devices, as core equipment for the stable operation of new power system, can provide voltage support to dual-high system through grid-following or grid-forming converters. Therefore, it is worth in-depth study to determine how to reasonably quantify the system voltage support strength in order to guide the optimal siting and capacity configuration of energy storage devices. Reference [34] proposed a multi-objective optimization method for reactive power reserves in wind–solar storage hybrid systems by constructing a set of typical fault scenarios and applying grid partitioning techniques for dimensionality reduction, thereby improving the voltage stability margin of the grid. Reference [35] defined the transient voltage stability margin, transient disconnection margin, and transient regulation margin of the receiving-end distribution network after DC blocking. Based on the sensitivity analysis of the defined stability margins, a reactive power coordination optimization model was established with the collaborative participation of distributed PV and energy storage. Reference [36] proposed a multi-objective optimization configuration model for distributed energy storage, aiming to enhance the voltage stability margin of the distribution network and reduce reactive power injection from the upper-level grid. The aforementioned existing studies only consider the impact of single-sided generation resources on system voltage stability, neglecting the influence of source-side and grid-side interactions on system voltage support strength, and overlooking the coordinated voltage support capabilities provided by multiple flexible resources.
In view of the deficiencies of the above studies, this paper aims to comprehensively consider the coupling between source-side and grid-side characteristics in dual-high power system, and to realize the quantitative assessment and optimization of system voltage support strength through deriving the extended expression of the MRSCR index under multi-source coordination and its integration into the operational scheduling model. By doing so, this work seeks to fill the research gap in voltage support characterization under dual-high conditions, and to provide support for the planning and operation of power system. Specifically, this paper makes the following innovative contributions:
Firstly, a multi-renewable-station short circuit ratio (MRSCR) index applicable for evaluating the voltage support strength of power system with high renewable energy penetration is proposed. The influence mechanism by which multiple agents on the generation and grid sides affect MRSCR is further analyzed, thereby enhancing the generality and applicability of the proposed index.
Secondly, the proposed MRSCR index is transformed into a system voltage security constraint, establishing the coupling relationship between the operational states of multiple agents and the voltage support strength of renewable-integrated system. By embedding the proposed constraint into an energy storage planning model considering multi-agent collaborative optimization, guiding optimal storage siting and capacity planning decisions to ensure the voltage stability of system operation effectively.
Finally, through simulation on a modified IEEE 14-bus system, the proposed Volt-age Security Constrained Energy Storage Planning Model Considering Multi-Agent Collaborative Optimization is validated to enhance steady-state voltage support strength while ensuring efficient renewable energy accommodation. Furthermore, a large-scale provincial power grid case study demonstrates the scalability and practical applicability of the proposed model.

2. Research Methods

This section proposes the voltage support strength index and presents its corresponding quantification method. On this basis, the voltage security constraint is further established and the mechanisms by which different flexibility resources participate in supporting grid strength are analyzed to construct the voltage security constrained unit commitment model considering multi-agent collaborative optimization, thereby effectively enhancing voltage stability in modern power system and addressing the challenge of ensuring supply and security in dual-high power system.

2.1. Voltage Support Strength

The voltage support strength refers to the capability of a system to maintain voltage magnitude after being subjected to disturbances or faults. It is mainly related to the structure of the AC grid, reactive power compensation devices such as shunt capacitors, and the long-term reactive support provided by voltage-source equipment such as synchronous machines.
Within a power system, the short-circuit capacity associated with a particular node can be determined as the product of the three-phase fault current at that node and the nominal voltage of the system. This value reflects the voltage strength of the grid. The Short-Circuit Ratio (SCR) represents the ratio between the system’s available short-circuit capacity and the rated capacity of the interfaced electrical or power-electronic components.
For a long time, as a static analysis method, SCR has provided important guidance for power system planning and operation due to its simplicity and intuitiveness. However, existing extended index derived from traditional SCR often overlook the impact of renewable energy power plants on grid strength, making them difficult to effectively apply in dual-high power system. Therefore, there is an urgent need to propose a new SCR that is both theoretically sound and practically viable for engineering applications. This index should intuitively and effectively measure the voltage support strength of power system integrated with diverse renewable energy sources, thereby ensuring operational voltage stability.

2.1.1. Voltage Support Strength Index

To enhance the grid strength of the dual-high system and strengthen its voltage support capability, we introduce the MRSCR as a practical index for quantifying the grid’s voltage support strength, and convert it into the voltage safety constraint incorporated into power system optimal dispatch to ensure the system’s voltage support requirements.
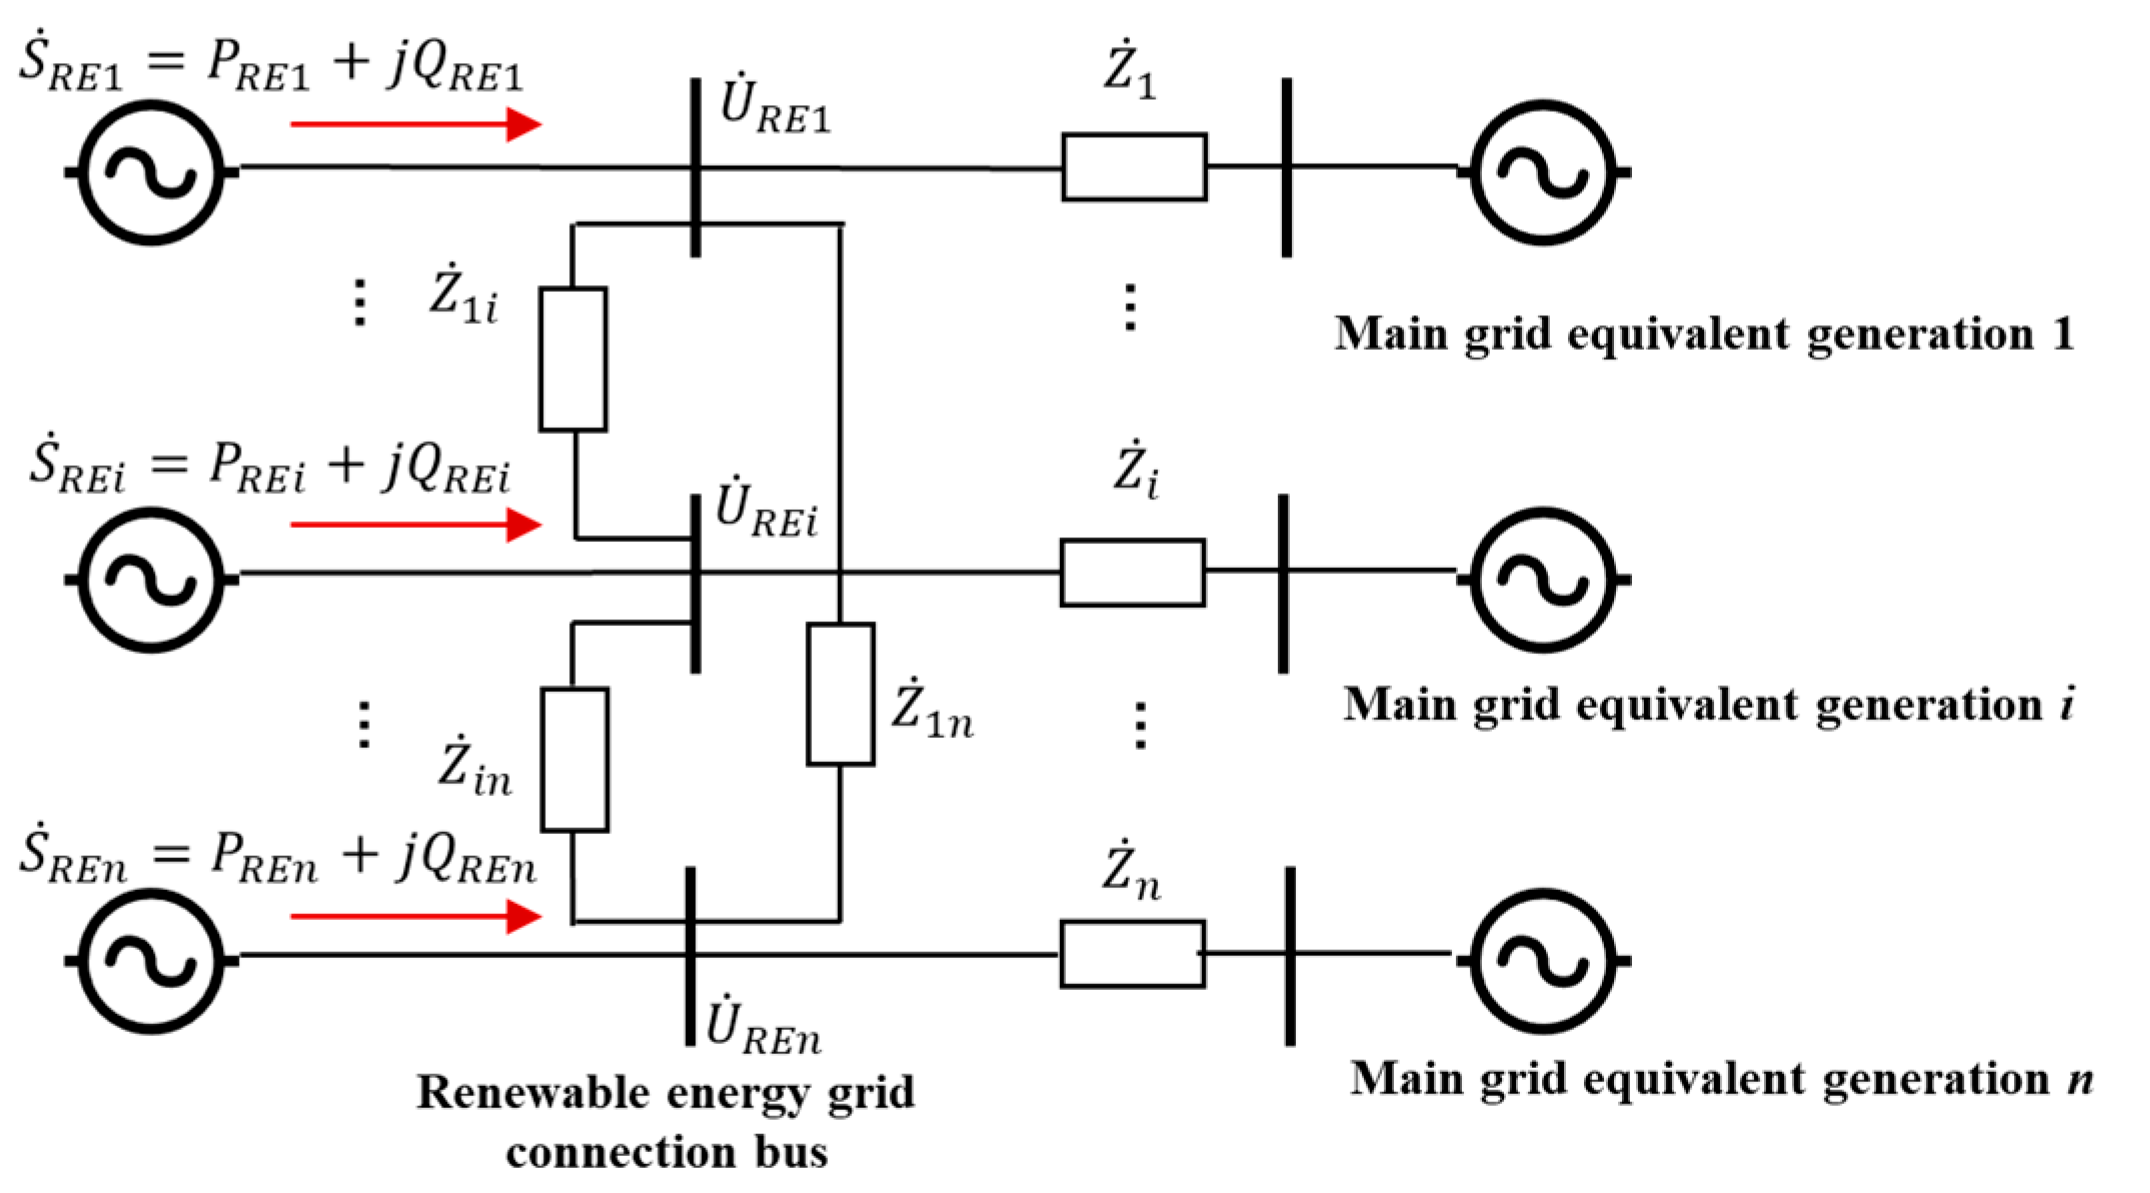
The Thévenin equivalent method can simplify an AC system with a high proportion of renewable energy integration into an ideal voltage source in series with an equivalent impedance. By applying the multi-port Thevenin equivalent, a simplified equivalent model of an AC system with n renewable energy plants connected simultaneously can be obtained, as illustrated in Figure 2.
As illustrated in Figure 2, S ˙ R E i ,     P R E i ,     Q R E i   a n d   U ˙ R E i denote, respectively, the apparent, active, and reactive power, as well as the voltage corresponding to renewable generation unit or plant i. The parameter Z ˙ i j represents the equivalent impedance between the grid connection points i and j after network conversion, while Z ˙ i characterizes the equivalent system-side impedance between the main grid equivalent source i and its related point of interconnection.
In Figure 2, the renewable-energy grid interface bus may refer to either the access node of a single renewable generation unit or the interconnection bus of a renewable power plant—specifically, the high-voltage side bus (or node) at the step-up substation of the renewable installation. If the injected currents from these interconnection buses into the AC system are denoted as I ˙ 1 , I ˙ 2 , , I ˙ n , the corresponding nodal voltage at each connection bus can then be expressed as [37,38]:
U ˙ RE 1 U ˙ RE 2 U ˙ RE n = Z ˙ eq 11 Z ˙ eq 12 Z ˙ eq 1 n Z ˙ eq 21 Z ˙ eq 22 Z ˙ eq 2 n   Z ˙ eq n 1 Z ˙ eq n 2 Z ˙ eq n n I ˙ 1 I ˙ 2 I ˙ n
where Z ˙ e q i j denotes the (i,j)-th element of the equivalent impedance matrix of the AC grid at the renewable energy grid connection buses.
The SCR can be characterized by the relative magnitude between the nominal system voltage after equipment connection and the voltage induced by the equipment. According to this definition, we define the SCR at the i-th renewable energy interconnection bus in the system as the MRSCR:
σ i MRSCR = U ˙ N i U ˙ RE i = U ˙ N i Z ˙ eq i i I ˙ i + j = 1 , j i n Z ˙ eq i j I ˙ j
where U ˙ N i is the nominal voltage of the i-th grid connection bus node; U ˙ R E i is the voltage induced at the i-th node by the power output of renewable energy equipment; and I ˙ i is the short-circuit current provided by the i-th renewable generation unit/plant. Let the actual operating voltage of the i-th grid connection bus node be U ˙ i .
By multiplying both numerator and denominator of Equation (2) by U ˙ i * / Z ˙ e q i i , the index can be transformed into a ratio represented by the three-phase short-circuit capacity and the equivalent injected power of the renewable energy plant, as follows:
σ i MRSCR = U ˙ i U ˙ N i / Z ˙ eq i i U ˙ i I ˙ i + j = 1 , j i n Z ˙ eq i j Z ˙ eq i i U ˙ i I ˙ j = U i 2 P i Z i i + j Ω j , j i ( P j Z i j )
where S i , P i denote the three-phase short-circuit capacity of the renewable energy grid connection bus and the equivalent injected power of the renewable energy plant, respectively; Ω j represents the set of existing renewable energy plants; P i , P j are the injected powers of renewable plants at nodes i and j, respectively; Z i i is the equivalent self-impedance of the renewable energy grid connection bus at node i; and Z i j is the equivalent mutual impedance between the renewable energy grid connection buses at nodes i and j.

2.1.2. Voltage Security Constraint

To ensure sufficient system voltage support strength and overall stability, a minimum SCR requirement can be specified according to system needs:
σ i MRSCR = U i 2 ( P i Z i i + j Ω j , j i P j Z j i ) σ min MRSCR
It can be observed that the system’s voltage support capability mainly depends on the output of online renewable generating units and the distribution of grid impedance, which is simultaneously affected by the operating modes of both generation-side and grid-side equipment Therefore, this paper derives extended expressions of the MRSCR caused by multiple agents.
(1)
Conventional Synchronous Generating Units
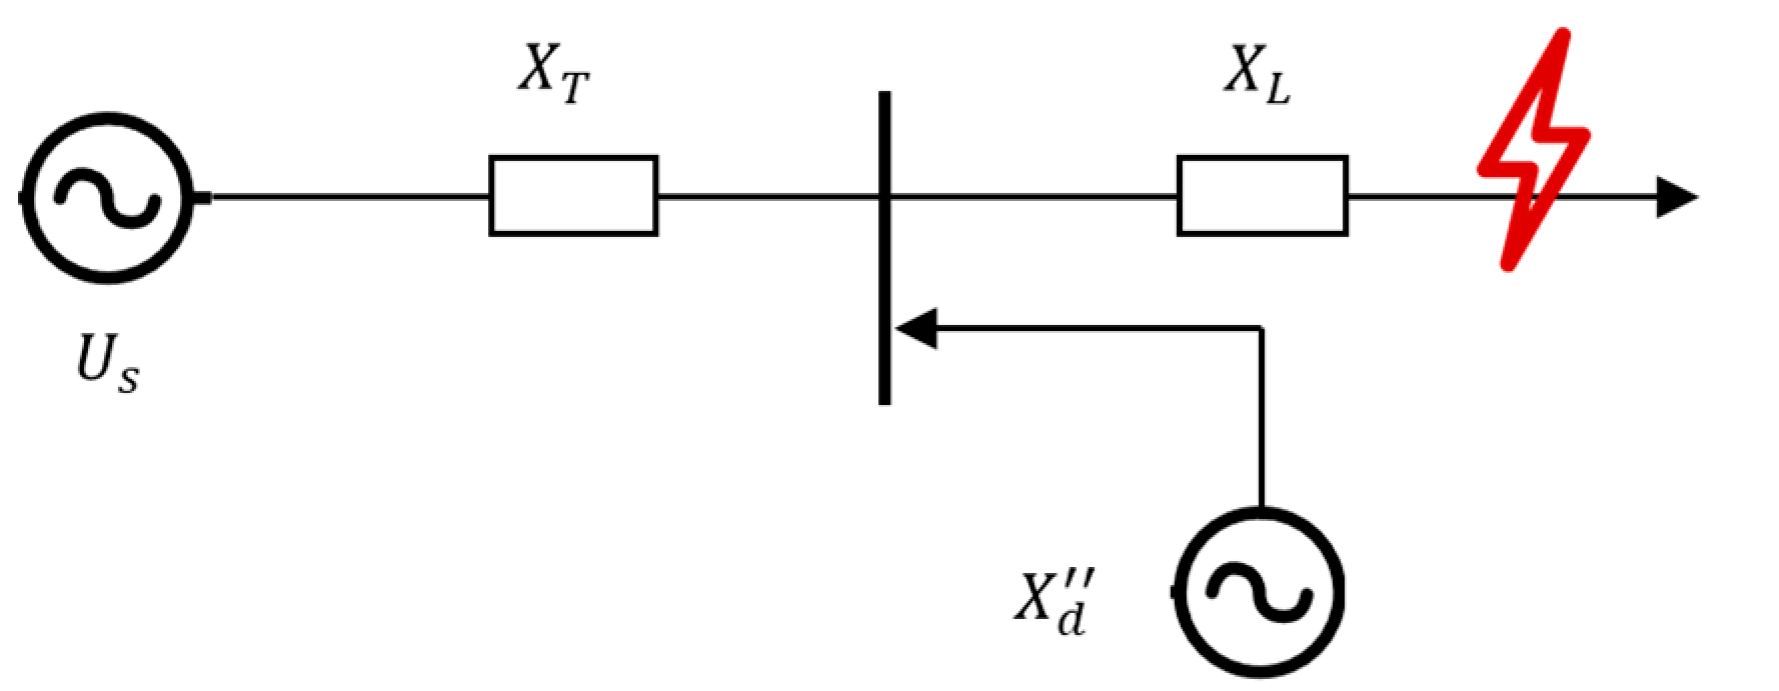
Based on the proposed MRSCR, the influence of switching conventional synchronous units on the system’s voltage support strength at different times is considered. When a three-phase short-circuit fault occurs in the grid, the sub-transient reactance of the synchronous generator is connected to the system as part of the equivalent circuit. The equivalent circuit is shown in Figure 3, where U S denotes the AC system voltage, X T is the equivalent transfer reactance of the network, X L is the equivalent positive-sequence reactance between the fault point and the synchronous generator connection point, and X d is the sub-transient reactance of the synchronous generator.
As shown in Figure 3, when a three-phase short-circuit fault occurs, if the synchronous generator is offline, the short-circuit current flowing into the fault point is
I ac = U s X T + X L
when the synchronous generator is in operation, the short-circuit current flowing into the fault point becomes
I ac = U S X T / / X d + X L = U S X T X d X T + X d + X L
Since both transmission lines and synchronous generator stator windings are inductive, that is X T > X T / / X d , it follows that the connection of conventional synchronous units increases the system short-circuit current, thereby enhancing the system short-circuit capacity. Accordingly, the MRSCR formula can be modified as
σ i MRSCR = U i 2 P i Z i i β + j Ω j , j i P j Z j i β Z β = f β c , X d
where β c is a 0–1 decision variable representing the commitment status of conventional synchronous units/plants; β c = 1 indicates that the plant is committed, while β c = 0 indicates it is not.
(2)
Renewable Energy Plants
Assume that a new renewable energy plant is connected at node n. Then, the MRSCR constraint can be expressed as:
σ i MRSCR = U i 2 P i Z e q i i + j Ω j , j i ( P j Z i j ) + n Ω n ( P n Z i n )
where Ω n is the set of candidate nodes for renewable energy plant connection, P n is the injected power of the new renewable energy plant at node n, and Zin is the equivalent mutual impedance between node r and node n for renewable energy integration.
(3)
Energy Storage
Energy storage offers strong dynamic active and reactive power regulation capabilities and flexible configuration, making it a valuable supplement for meeting power grid voltage security requirements. Therefore, based on differences in power conversion system (PCS) control methods, we analyze the impacts on the proposed MRSCR index from both grid-following and grid-forming energy storage perspectives.
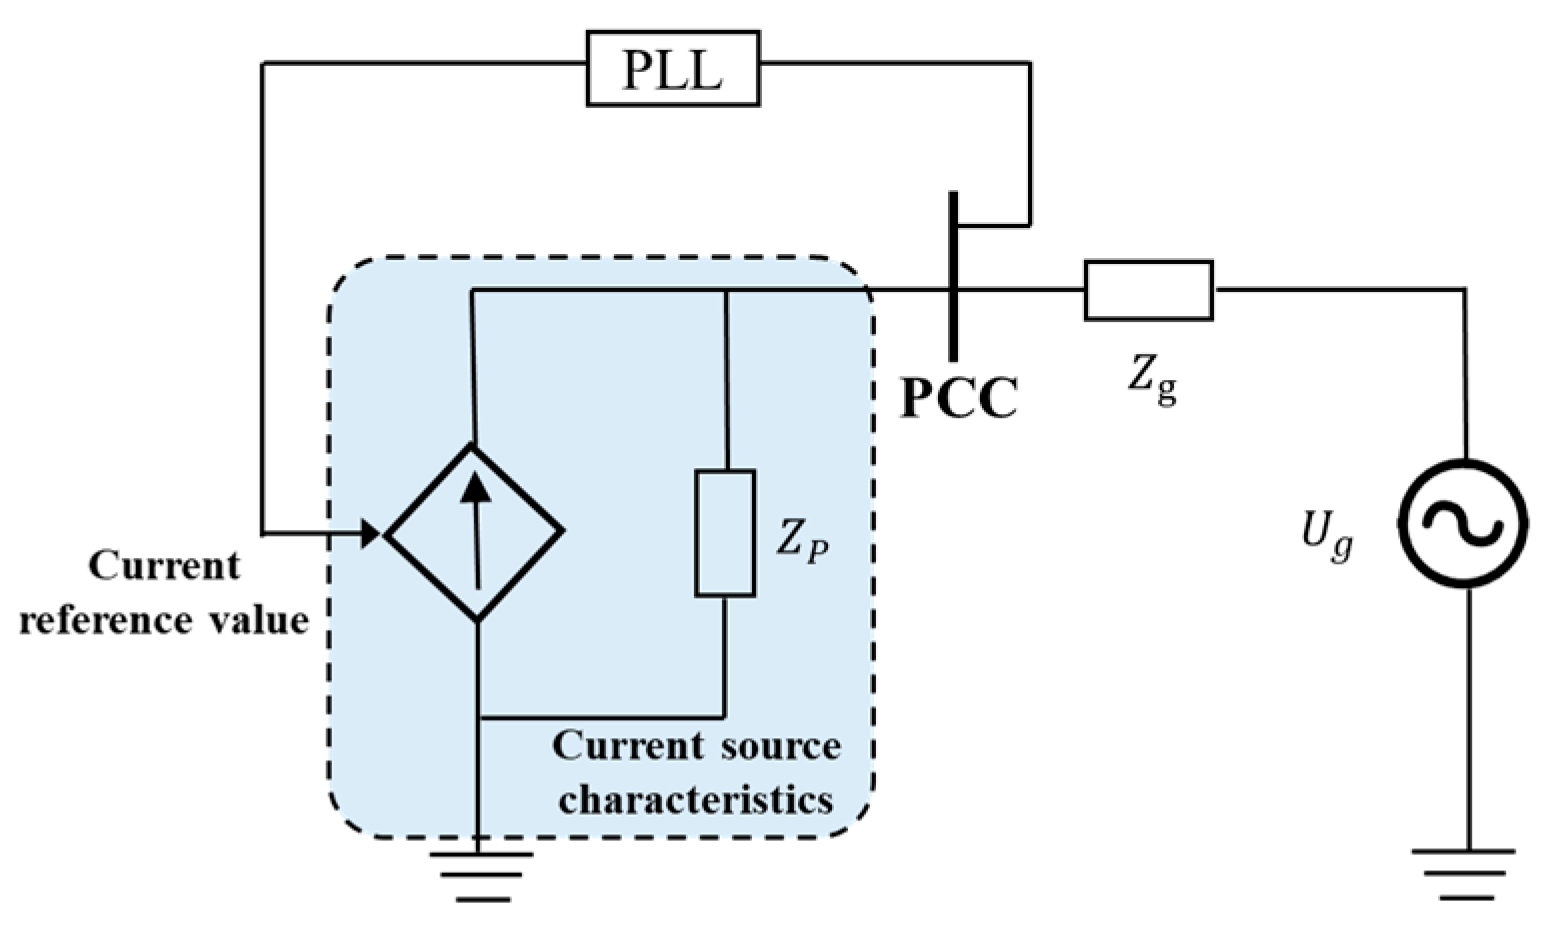
Due to its simple control structure and ability to achieve active and reactive power decoupling, grid-following control architecture, as shown in Figure 4, is commonly used in energy storage projects. Grid-following storage samples the voltage at the AC bus point of common coupling (PCC), uses a phase-locked loop (PLL) to synchronize with the grid, and controls power by regulating the current injected into the grid, which means that it can be regarded as an equivalent high-impedance current-source topology.
After a fault, grid-following energy storage will provide dynamic reactive current to supplement the grid with reactive power. When the short-circuit current supplied by the grid-following energy storage is known, the proposed MRSCR index can be expressed as:
σ i MRSCR = U i ( U i + I k GFL Z i k ) Z i i P i + j = 1 , j i N D Z j i P j
where the equivalent short-circuit current of grid-following storage is I k G F L .
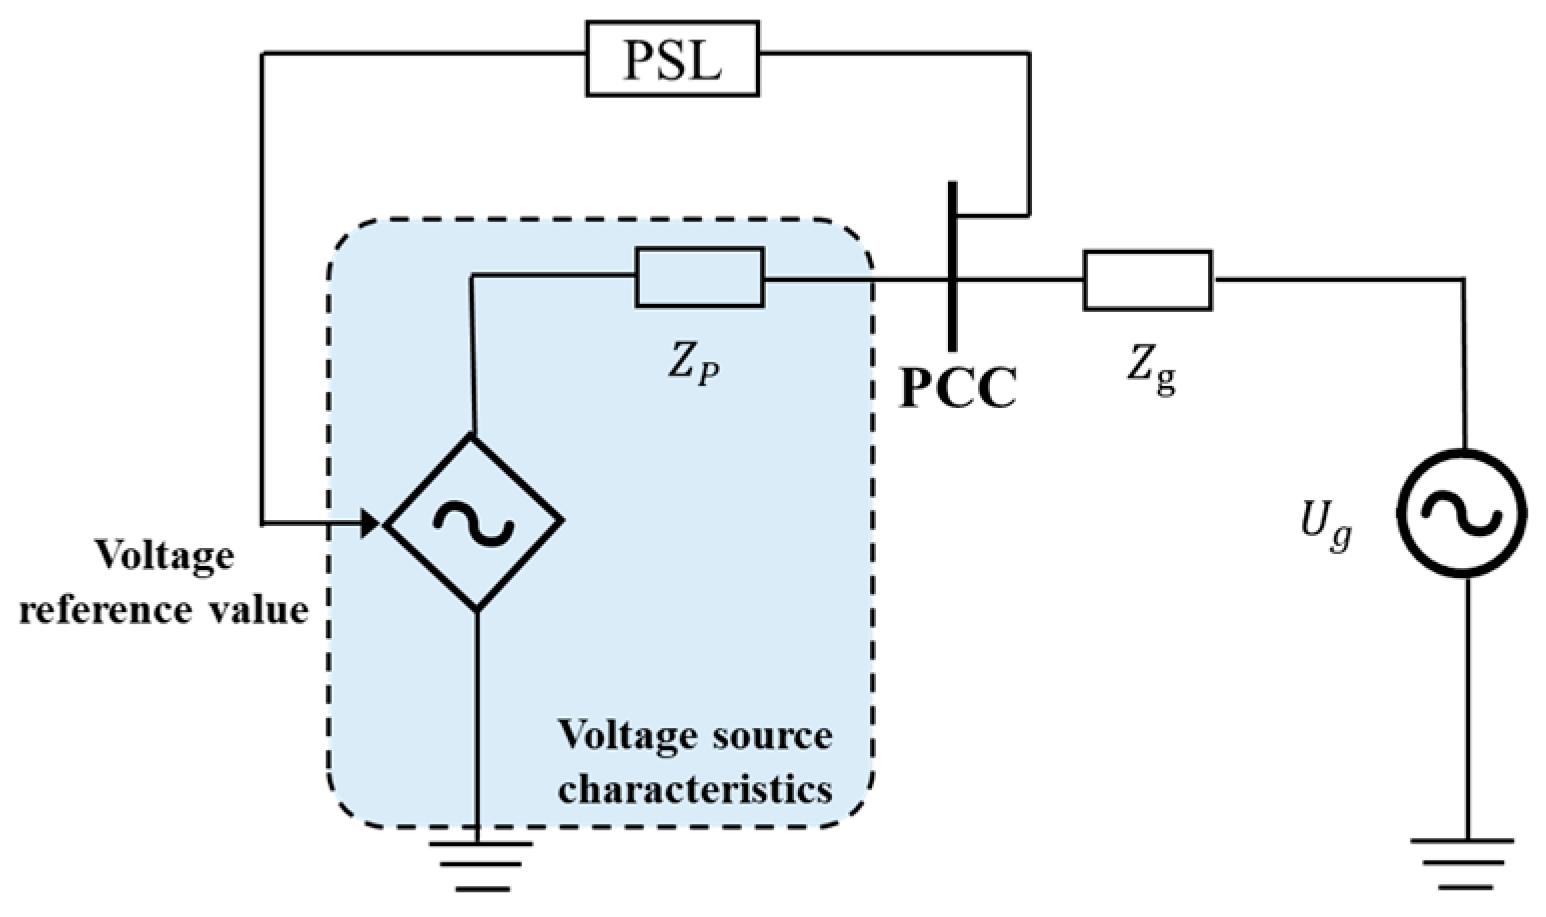
By contrast, as shown in Figure 5, grid-forming energy storage, can be equivalently represented during grid-connected operation as a conventional voltage source providing short-circuit capacity to the grid due to its reactive-power regulation characteristics. Its impact mechanism can be analyzed from the perspective of multi-infeed interaction factors (MIIF), converting its voltage-support effect into changes in self-impedance and mutual impedance [39].
The installation location, droop coefficient, and rated power of grid-forming storage affect the diagonal elements of the nodal admittance matrix. Its effect is similar to the internal reactance of synchronous generators, where the reactive power-voltage droop coefficient 1/Kv can be equivalently treated as a grounding reactance. The equivalent nodal impedance matrix can be recalculated to determine the changes in system self-impedance and mutual impedance, expressed as follows:
σ i MRSCR = U i 2 Z i i GFM P i + j = 1 , j i N D Z j i GFM P j Z j i GFM = Z j i Z k i Z k j Z k k + 1 / K V , Z i i GFM = Z i i Z k i Z k i Z k k + 1 / K V
Due to the overload limits of power semiconductor devices, when a grid fault occurs and to prevent damage to power devices from overcurrent, the converter’s output current magnitude for grid-forming converters is typically limited to the range of 1.1 p.u. to 1.5 p.u. by either inner-loop current limiting or virtual-impedance limiting algorithms. Therefore, this paper sets the reactive-voltage droop coefficient between 1.1 and 1.5 to prevent MRSCR calculation results from being erroneously high.
Based on the above analysis, the connection of grid-forming energy storage can effectively reduce all elements in the network equivalent impedance matrix compared with grid-following energy storage, significantly improving the MRSCR at all system nodes. Therefore, energy storage in subsequent studies would refer to grid-forming energy storage unless otherwise specified. In addition, subsequent case-study simulations will further compare and analyze the differences between grid-following and grid-forming energy storage in providing system voltage support capability.

2.2. Voltage Security Constrained Energy Storage Planning Model Considering Multi-Agent Collaborative Optimization

2.2.1. Extraction of Typical Renewable Energy Daily Output Curves

To account for the impact of seasonal load and wind power variations on model optimization, the K-Means clustering algorithm is applied to historical operation data to generate typical daily scenarios. K-Means is a widely used unsupervised learning method, suitable for selecting typical daily output characteristics, and is particularly effective in analyzing time series data in power system. The basic steps of extracting typical seasonal daily renewable energy output curves based on the K-Means algorithm are as follows:
  • Obtain renewable energy output curve data for the entire year or a specified period. Then extract key characteristic values—here, the maximum/minimum output, peak-to-valley difference, and the time of maximum/minimum output are selected as key features. These are normalized to ensure balanced data weights.
  • Set the number of clusters to K = 4 according to the number of seasons, and randomly select the initial cluster centers. The sum of squared errors is used as the clustering criterion. The K-Means algorithm is applied to cluster the feature values, and the cluster centers are iteratively adjusted until convergence. Output curves with similar characteristics are grouped, and from each group, the sample closest to the cluster center is selected as the typical day.
The application of clustering aims to extract the seasonal diversity characteristics of renewable generation outputs while maintaining an appropriate balance between representativeness and computational efficiency in the planning model. This approach has been widely used in renewable energy planning and system adequacy studies due to its balance between accuracy and solvability. It provides a transparent, interpretable, and computationally efficient way to reduce scenario dimensionality.
However, the use of K-Means clustering with four typical days (K = 4) to represent yearly variations is a simplification that cannot fully reflect the inherent variability and uncertainty of renewable generation in high-penetration systems. This simplification may underrepresent extreme but low-probability operating conditions, such as prolonged low-wind, low-solar, or coincident high-load events that affect voltage security and storage performance. Therefore, while clustering provides a reasonable approximation for deterministic offline planning, its simplifications may reduce the robustness of the obtained solutions.

2.2.2. Mathematical Model

Objective Function
The objective function is defined as the sum of the operation cost of the power system, the compensation cost of various reserve resources, and the investment cost of reserve resources under typical days, so as to improve the economic efficiency of system operation:
min f = w π w ( C T , w + C R , w ) + C I
C T , w = k i C i , w p ( k ) + C i , w u ( k ) + C i , w d ( k ) + δ R j , w c u r ( k ) P R j , w max ( k ) Δ k
C R , w = k C R , w u p ( k ) + C R R , w d n ( k )
C I = s ( 1 + s ) B l i f e ( 1 + s ) B l i f e 1 n C P P n es   + C E E n es   + s ( 1 + s ) L l i f e ( 1 + s ) L l i f e 1 i j φ l l ϕ l C l a i j l
where w is the index of typical scenarios; k is the index of time periods; i is the index of conventional synchronous units; π w is the weight of scenario w ; C T , w is the operation cost of thermal units in scenario w ; C R , w is the reserve compensation cost of all resources in scenario w ; C I is the investment cost of reserve resources. C i , w p k , C i , w u k , C i , w d k represent fuel cost, startup cost, and shutdown cost of unit i in period k, respectively. c c u r is the penalty factor for renewable energy curtailment; j is the index of renewable energy plants; δ R j , w c u r k is the curtailment rate in scenario w ; P R j , w m a x k is the maximum power output of renewable energy plant j in scenario w ; Δ k is the duration of one time interval, set to 1 h in this study. C R u p k   a n d   C R d n k are the upward and downward reserve compensation costs in period k, respectively. C P and C E are the cost coefficients of energy storage power and capacity; P n e s and E n e s are the rated power and planning capacity of energy storage n, respectively; s is the annual discount rate; and   B l i f e is the lifetime of energy storage.
The fuel cost is usually a quadratic function of output and is calculated using piecewise linearization as follows:
P G i ( k ) = P G i min U G i ( k ) + r = 1 N p w P G i r ( k ) C i p ( k ) = f i min U G i ( k ) + r = 1 N p w λ i r P G i r ( k )
C i u ( k ) 0 C i u ( τ ) c i u U G i ( k ) U G i ( k 1 )
C i d ( k ) 0 C i d ( τ ) c i d U G i ( k 1 ) U G i ( k )
where P G i ( k ) is the output of unit i; P G i m i n is its minimum output; U G i ( k ) is its on/off status; N p w is the number of segments; P G i r ( k ) is the output in segment r of plant i; f i m is the fuel cost when plant i is at minimum power output; λ i r is the fuel rate of segment r of plant i; and c i u , c i d are the startup and shutdown costs.
The reserve compensation cost includes synchronous units, renewable units, demand response, and energy storage, and is calculated as:
C R u p = c i u p R i u p ( k ) + c j u p R j u p ( k ) + c d u p R d u p ( k ) + c n u p R n u p ( k )
C R d n = c i dn R i dn ( k ) + c j dn R j dn ( k ) + c d dn R d dn ( k ) + c n dn R n dn ( k )
where c i u p , c j u p , c d u p , c n u p denote the unit upward reserve compensation costs of thermal units, renewable units, demand response, and energy storage, respectively; R i u p ( k ) ,   R j u p ( k ) ,   R d u p ( k ) ,   R n u p ( k ) denote their respective upward reserve capacities.
Constraints
(1)
Power System Operation Constraints
i P G i , w ( k ) + j ( 1 δ R j , w c u r ( k ) ) P R j , w max + n ( P n , w d ( k ) P n , w c ( k ) ) = D w ( k )
P G i min P G i , w ( k ) P G i max 0 P G i , w r ( k ) P G i r , max
0 δ R j , w c u r ( k ) 1
P G i , w ( k ) P G i , w ( k 1 ) =                                     R i u U G i , w ( k 1 ) + R i s u U G i , w ( k ) U G i , w ( k 1 ) + M 1 U G i , w ( k ) P G i ( k 1 ) P G i ( k ) =                                     R i d U G i , w ( k ) + R i s d U G i , w ( k 1 ) U G i , w ( k ) + M 1 U G i , w ( k 1 )
τ = k k + T i o n 1 U G i , w ( τ ) T i o n U G i , w ( k ) U G i , w ( k 1 ) T i o f f τ = k k + T i o f f 1 U G i , w ( τ ) T i o f f U G i , w ( k 1 ) U G i , w ( k )
P l max m S ( l , m ) i B G m P G i , w ( k ) + j B W m 1 δ W j , w c u r ( k ) P W j , w ( k ) D m , w ( k ) P l max
where D w ( k ) is the total load demand in scenario w , period k; P G i m i n and P G i m a x are the minimum and maximum technical outputs of unit i; P G i r , m a x is the maximum output of segment r of plant i; R i u / R i d are the ramp-up and ramp-down rates; R i s u / R i s d are the startup and shutdown ramping capacities; M is a sufficiently large positive constant; T i o n / T i o f f are the minimum startup/shutdown times of plant i; S is the power flow sensitivity matrix; B G m and B W m are the sets of thermal units and wind farms at node m; D m , w ( k ) is the active load at node m in period k; and p l m a x is the maximum transfer capacity of line l.
Equation (20) represents the system power balance constraint; Equation (21) constrains thermal unit outputs; Equation (22) constrains renewable curtailment; Equation (23) constrains ramping capacities; Equation (24) enforces minimum up/down times; Equation (25) constrains transmission capacities.
(2)
Energy Storage Constraints
0 P n , w c ( k ) P n ess   v n , w c ( k )
0 P n , w d ( k ) P n ess v n , w d ( k )
v n , w d ( k ) + v n , w c ( k ) 1
e n , w ( k ) = e n , w ( k ) + η c P c , w ( k ) 1 / η d P d , w ( k )
E _ n ess e n , w ( k ) Δ e n , w ( k ) E n ess
e n , w ( K ) e n , w ( k 0 )
where n is the index of energy storage; P n , w d ( k ) and P n , w c ( k ) are charging and discharging powers in scenario w, period k; v n , w c ( k ) and v n , w d ( k ) are binary variables for charging/discharging status; e n , w ( k ) is the stored energy; η c   a n d   η d are charging/discharging efficiency; K   a n d   k 0 are the initial and final time periods. Equations (26) and (27) constrain charging/discharging power; Equation (28) prohibits simultaneous charging and discharging; Equations (29) and (30) are storage dynamics constraints; Equation (31) ensures terminal energy is not lower than initial energy.
(3)
System Voltage Security Constraint
Combining the mathematical model of all resource entities on the MRSCR analyzed in Section 2.1, the proposed voltage safety constraint is finally expressed as follows:
U i , w U i , w + β B , f I f GFL Z i f P i , w Z i i β + j Ω j , j i ( P j , w Z j i β ) σ min MRSCR
Z i i β = f ( β C , X ) k β B g , k Z k i Z k j Z k k + 1 / K V Z j i β = f ( β C , X ) k β B g , k Z k i Z k i Z k k + 1 / K V
where β B f ,   β B g ,   β C are binary decision variables for grid-following storage, grid-forming storage, and conventional synchronous units, respectively, equal to 1 if committed. σ m i n M R S C R denotes the system critical SCR.

3. Case Study Analysis

To verify the effectiveness of the proposed model, simulation analyses are conducted based on a modified IEEE 14-bus system as well as a real-world case study from a province in China. The study considers the participation of synchronous generating units, renewable generating units, grid-following energy storage, and grid-forming energy storage in supporting system strength. In addition, to ensure the secure and stable operation of the system, the planning of energy storage devices is incorporated to guarantee sufficient voltage support strength.

3.1. IEEE 14 Parameters

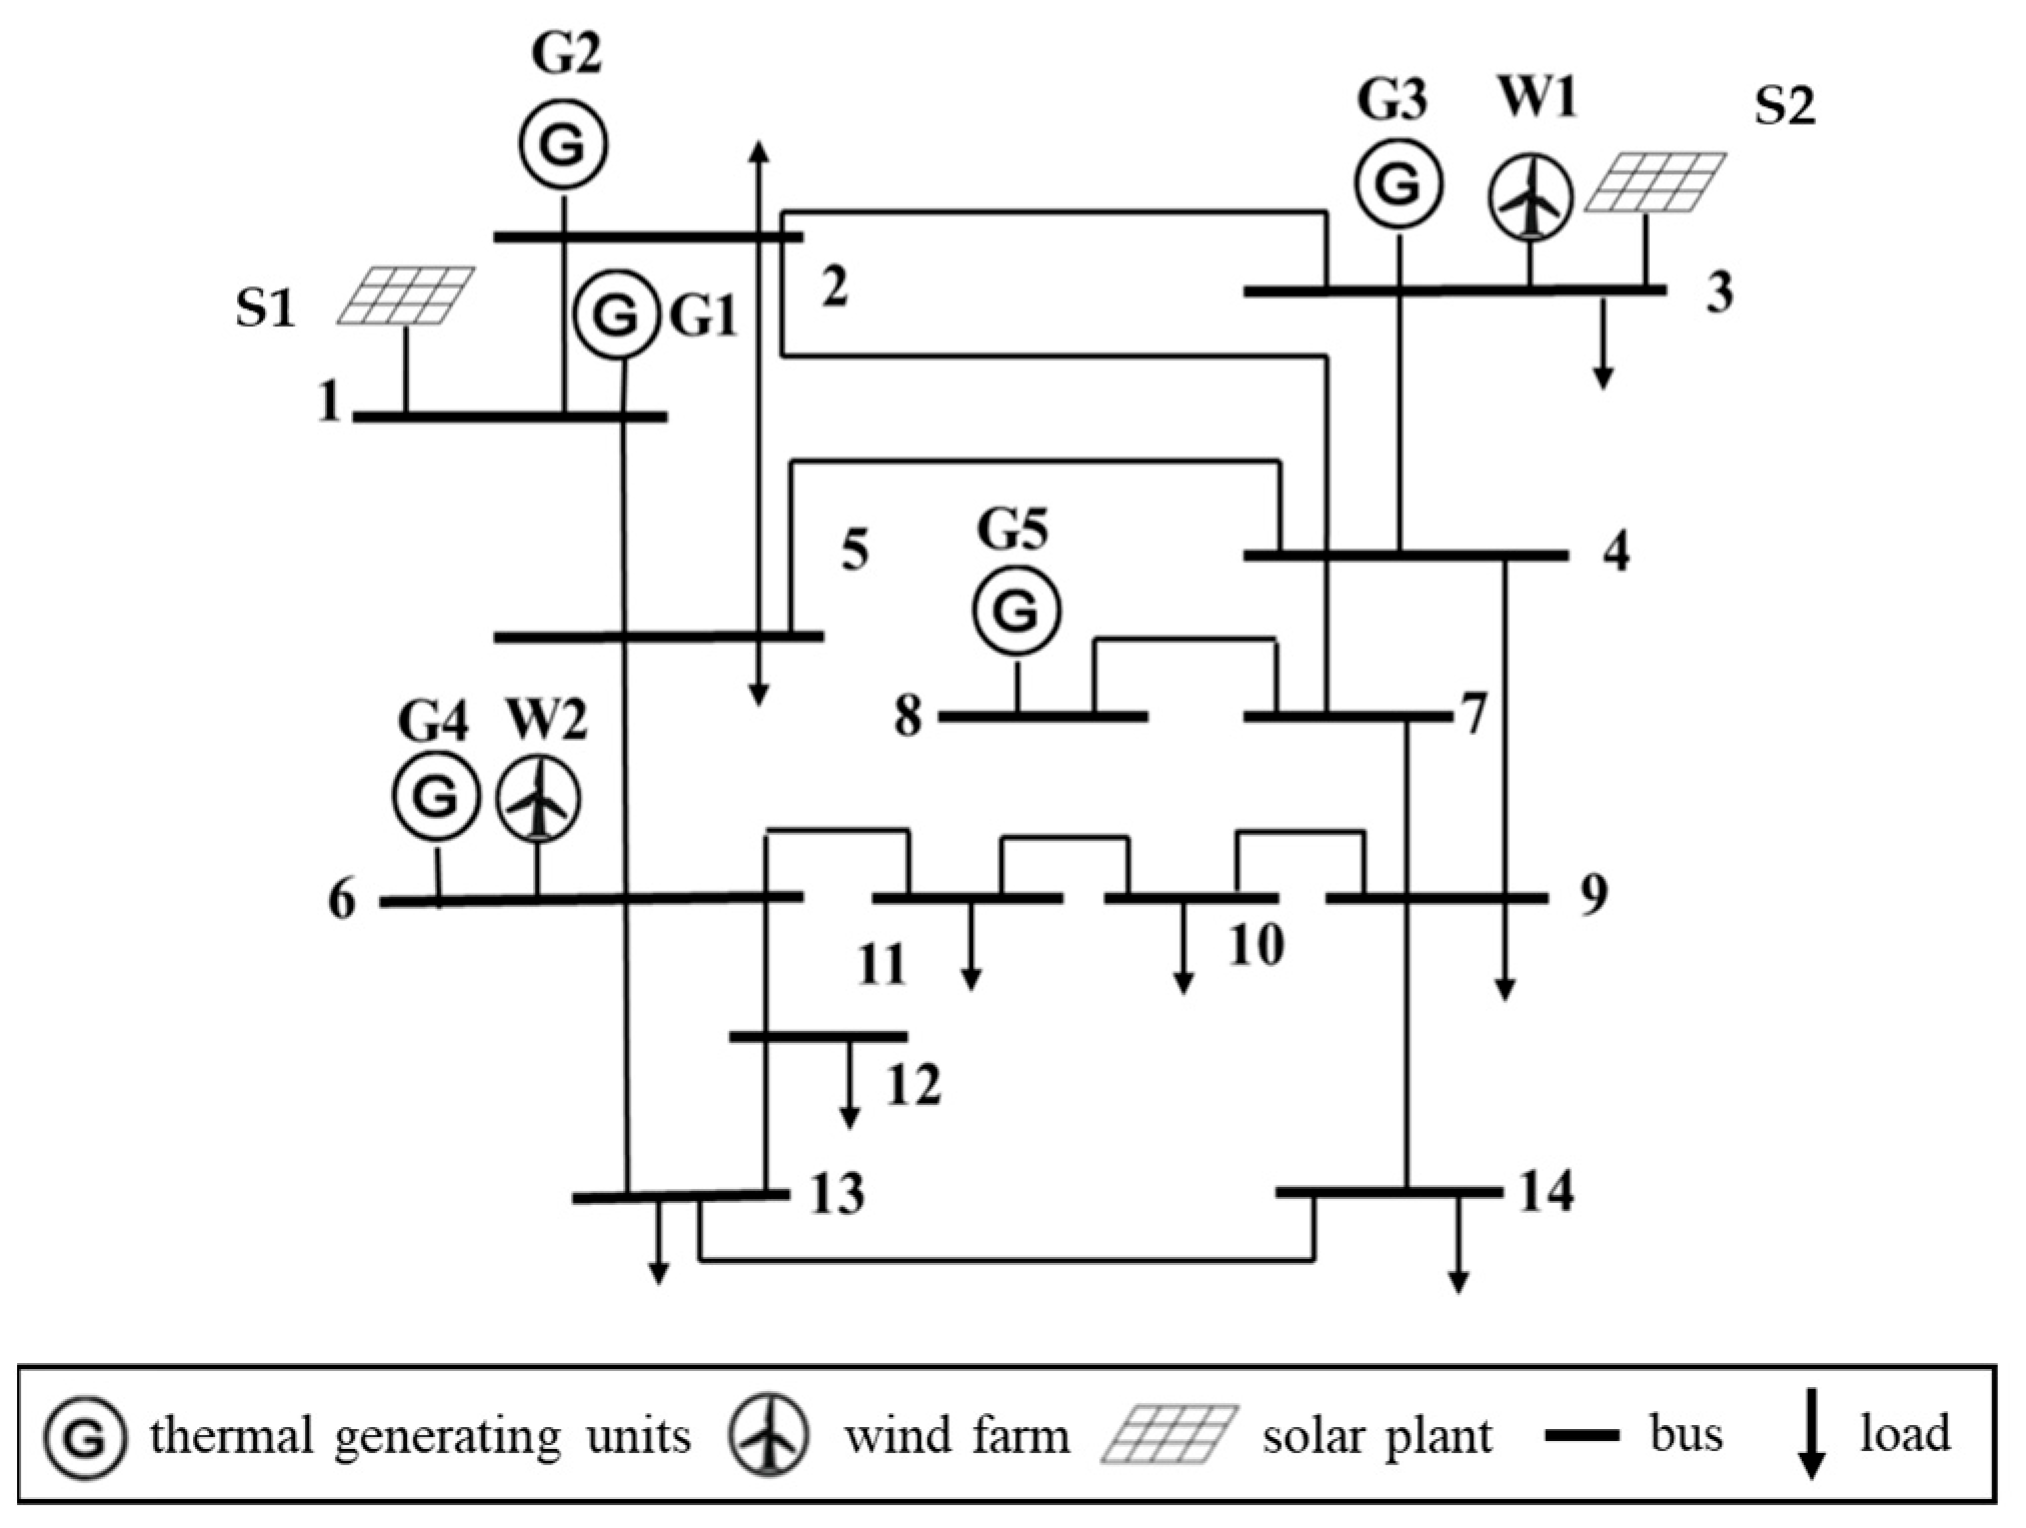
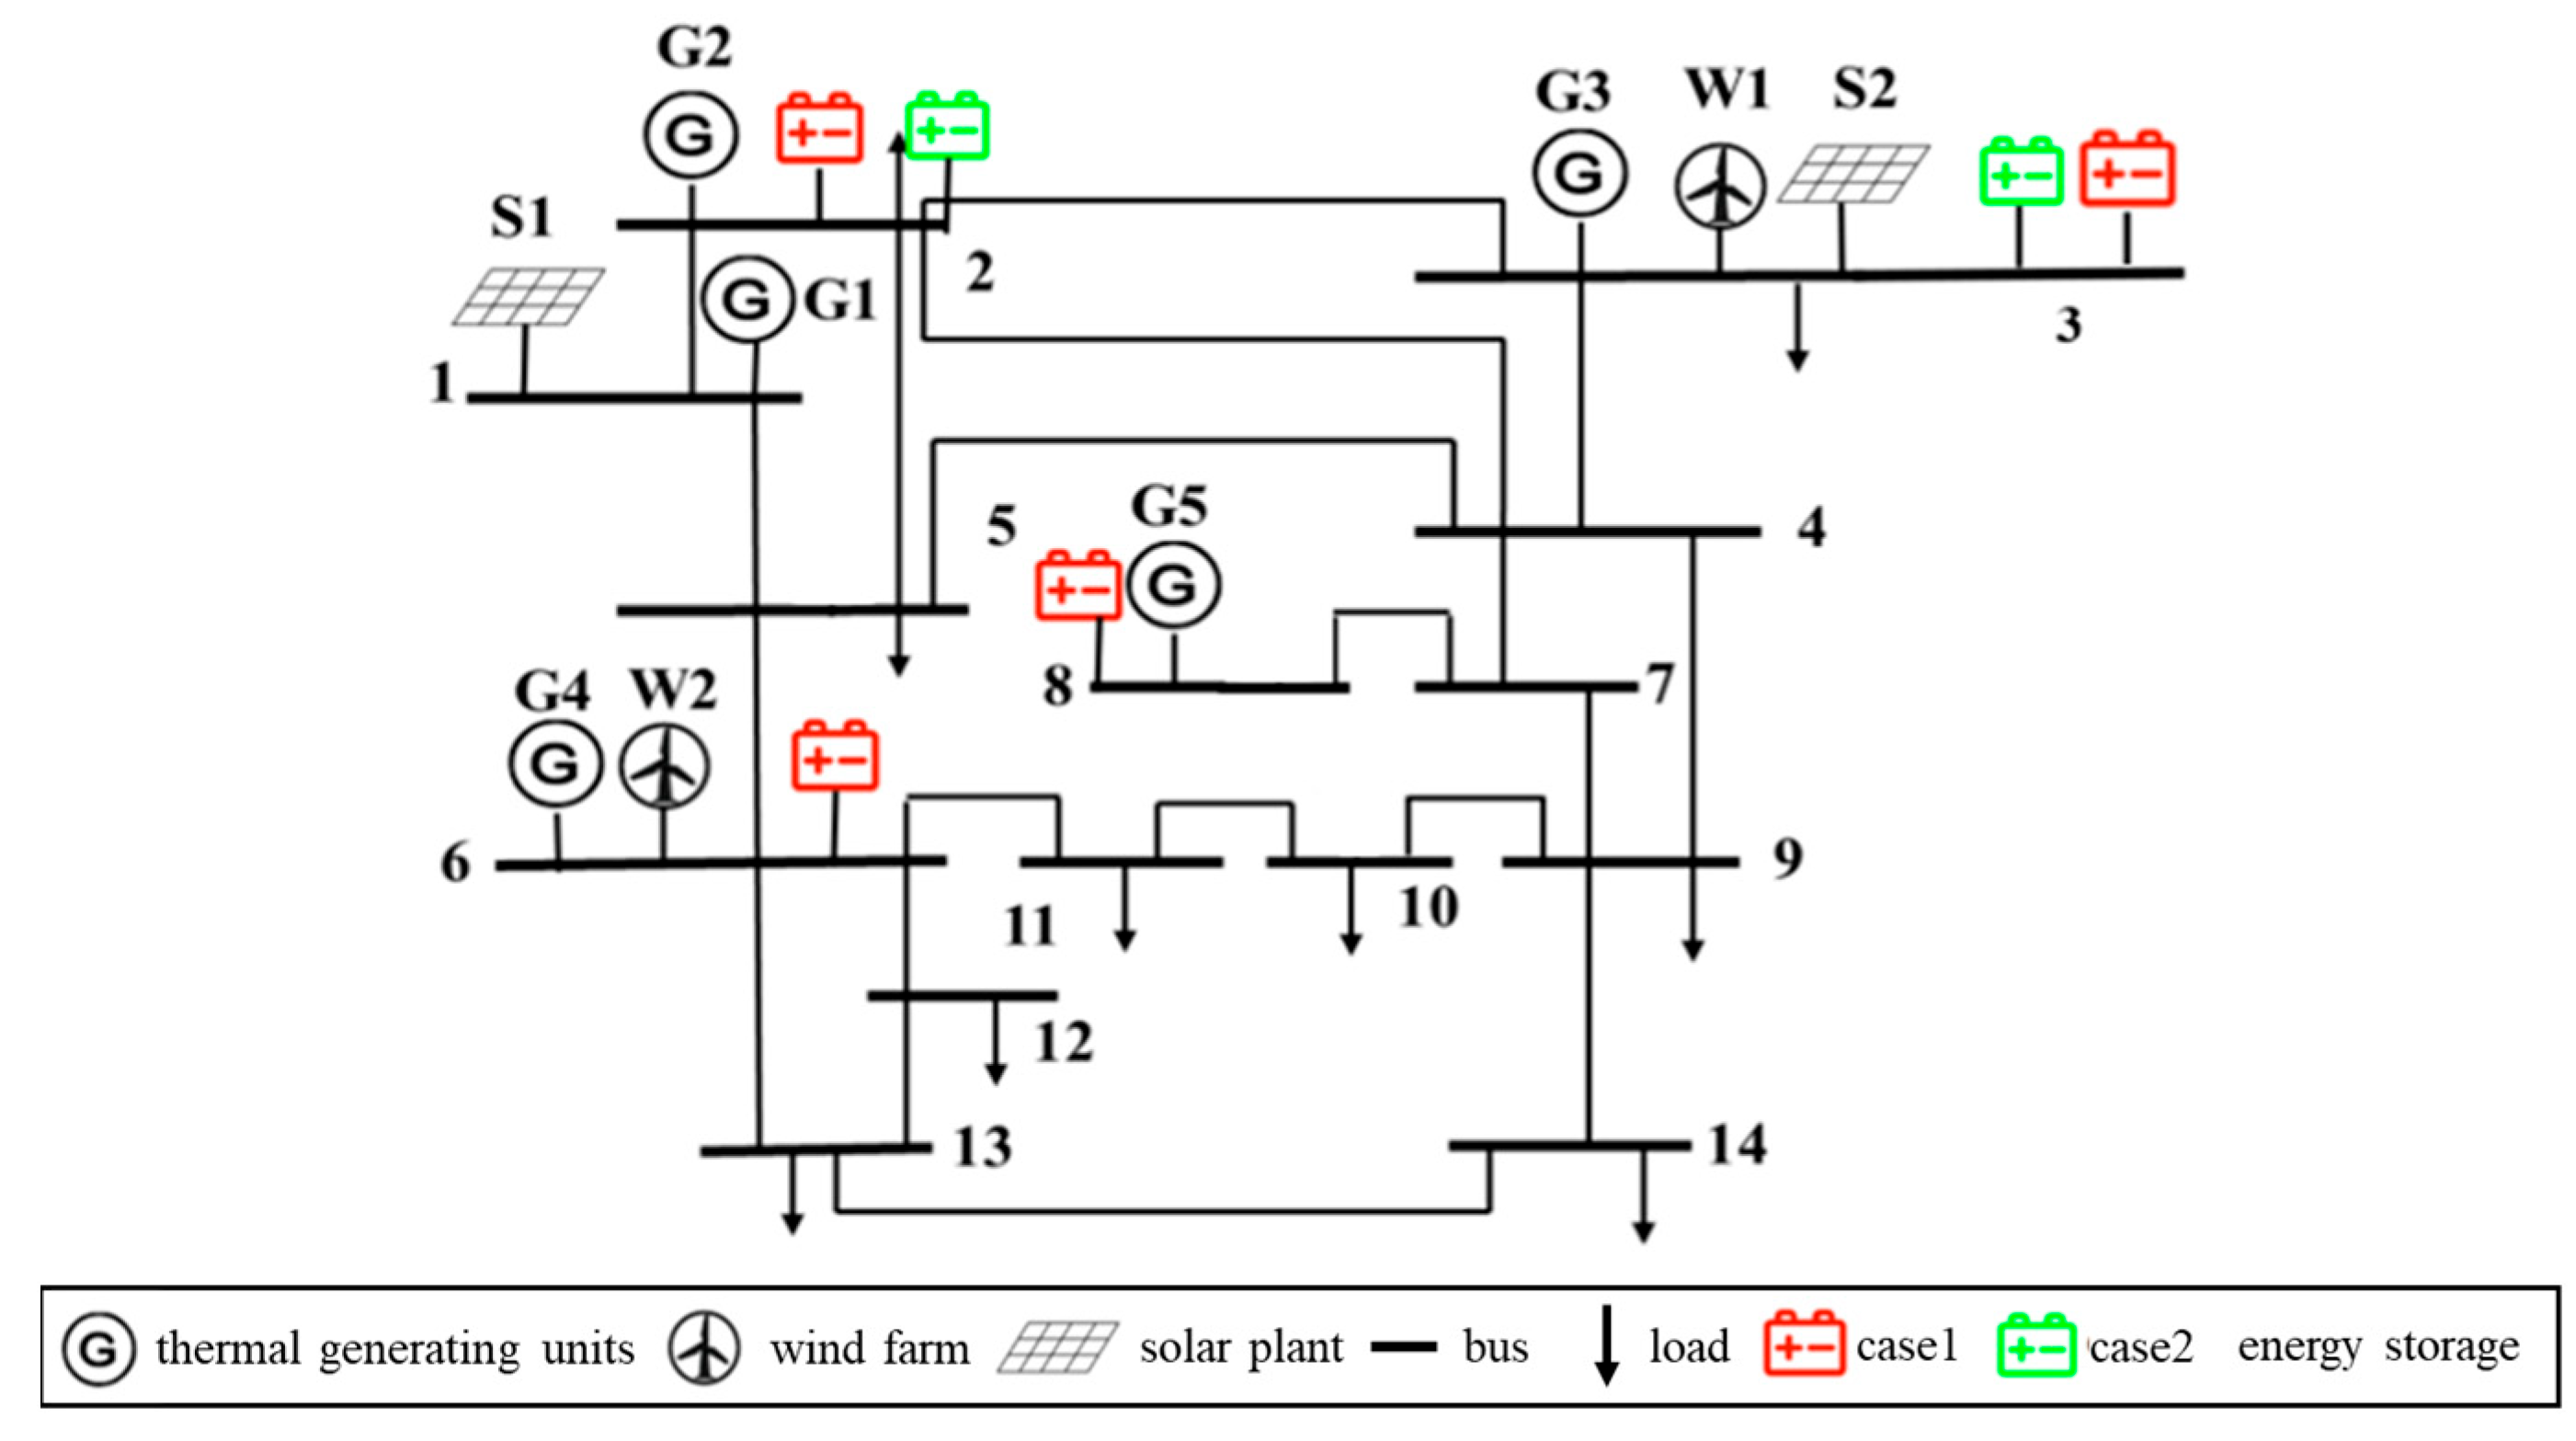
The IEEE 14-bus system is shown in Figure 6. The system includes two wind farms and two solar plants, and the relevant parameters of the thermal generating units and renewable energy units are listed in Table 1. In this case study, on the basis of conventional synchronous units providing active and reactive power support, lithium-ion battery energy storage is planned and deployed to ensure the voltage security of the system. The line parameters and interconnections between nodes are consistent with those of the standard IEEE 14-bus system.
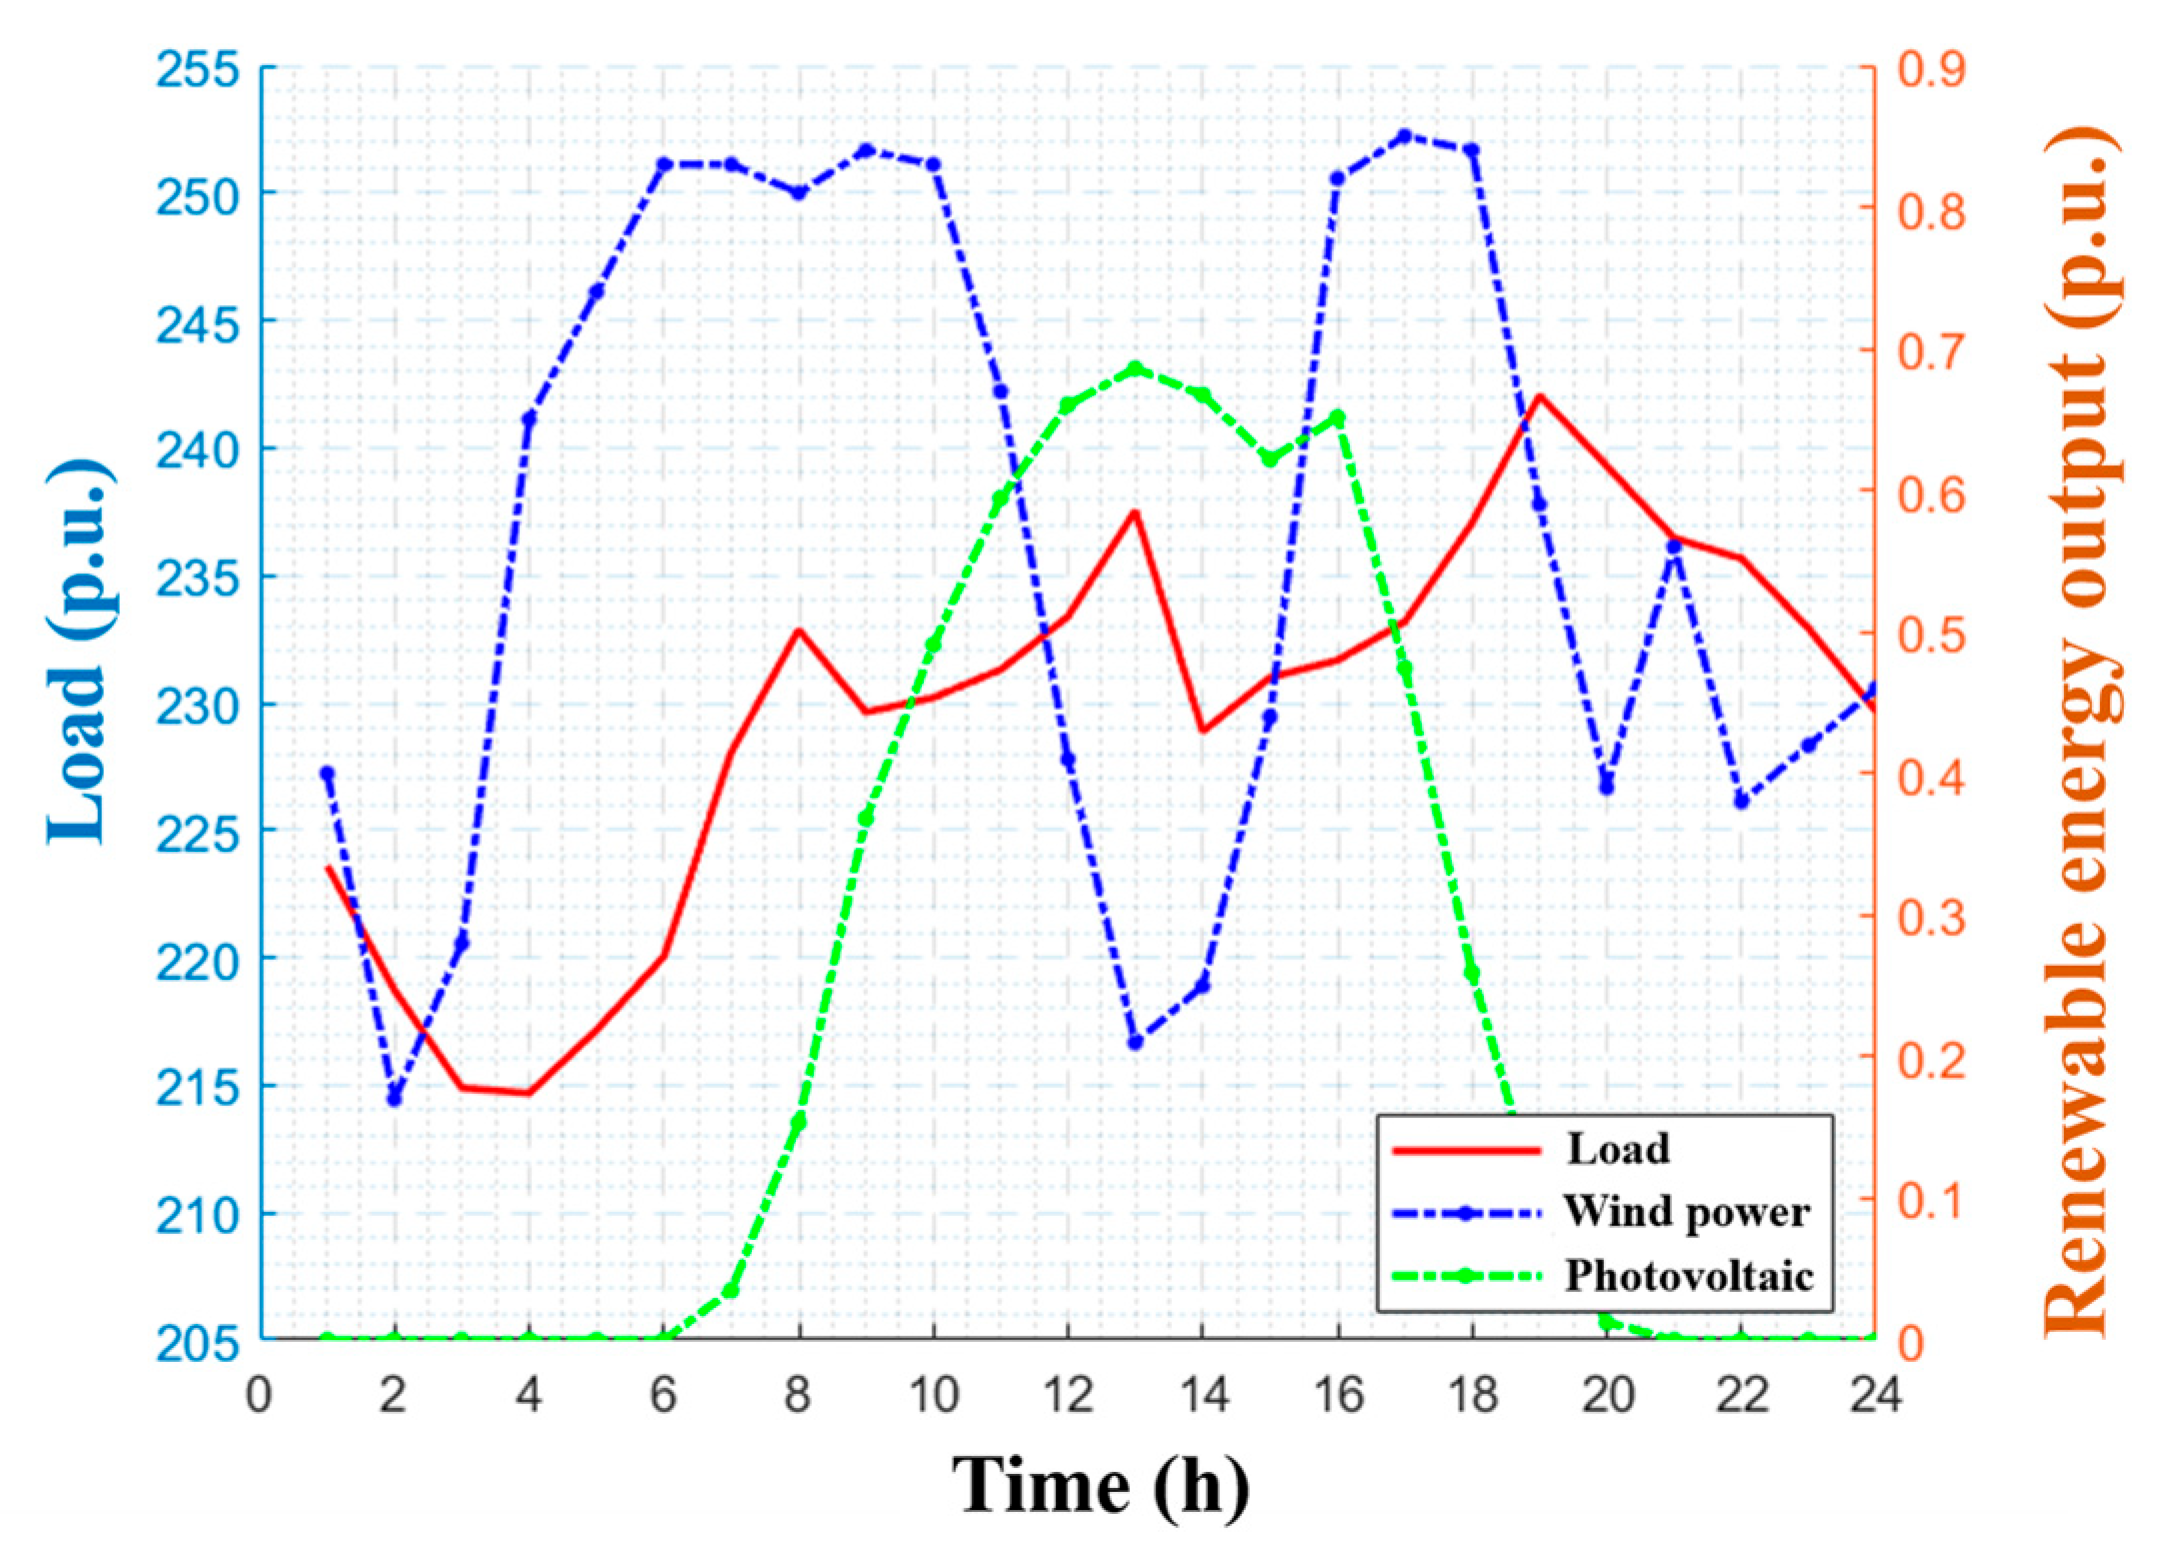
The per-unit curves of active load and wind power output under a typical day are shown in Figure 7. The critical SCR for multiple renewable energy plants is set to 2 [16].

3.2. Verification of the Effectiveness of Voltage Security Constraint

To verify the effectiveness of the proposed voltage security constraint, the following comparative cases are designed:
Case 1: Energy storage is configured without considering the voltage security constraint.
Case 2: Energy storage is configured with the voltage security constraint included.
Case 3: Energy storage is configured with the voltage ratio security constraint included, but the unit commitment schedule remains unchanged.
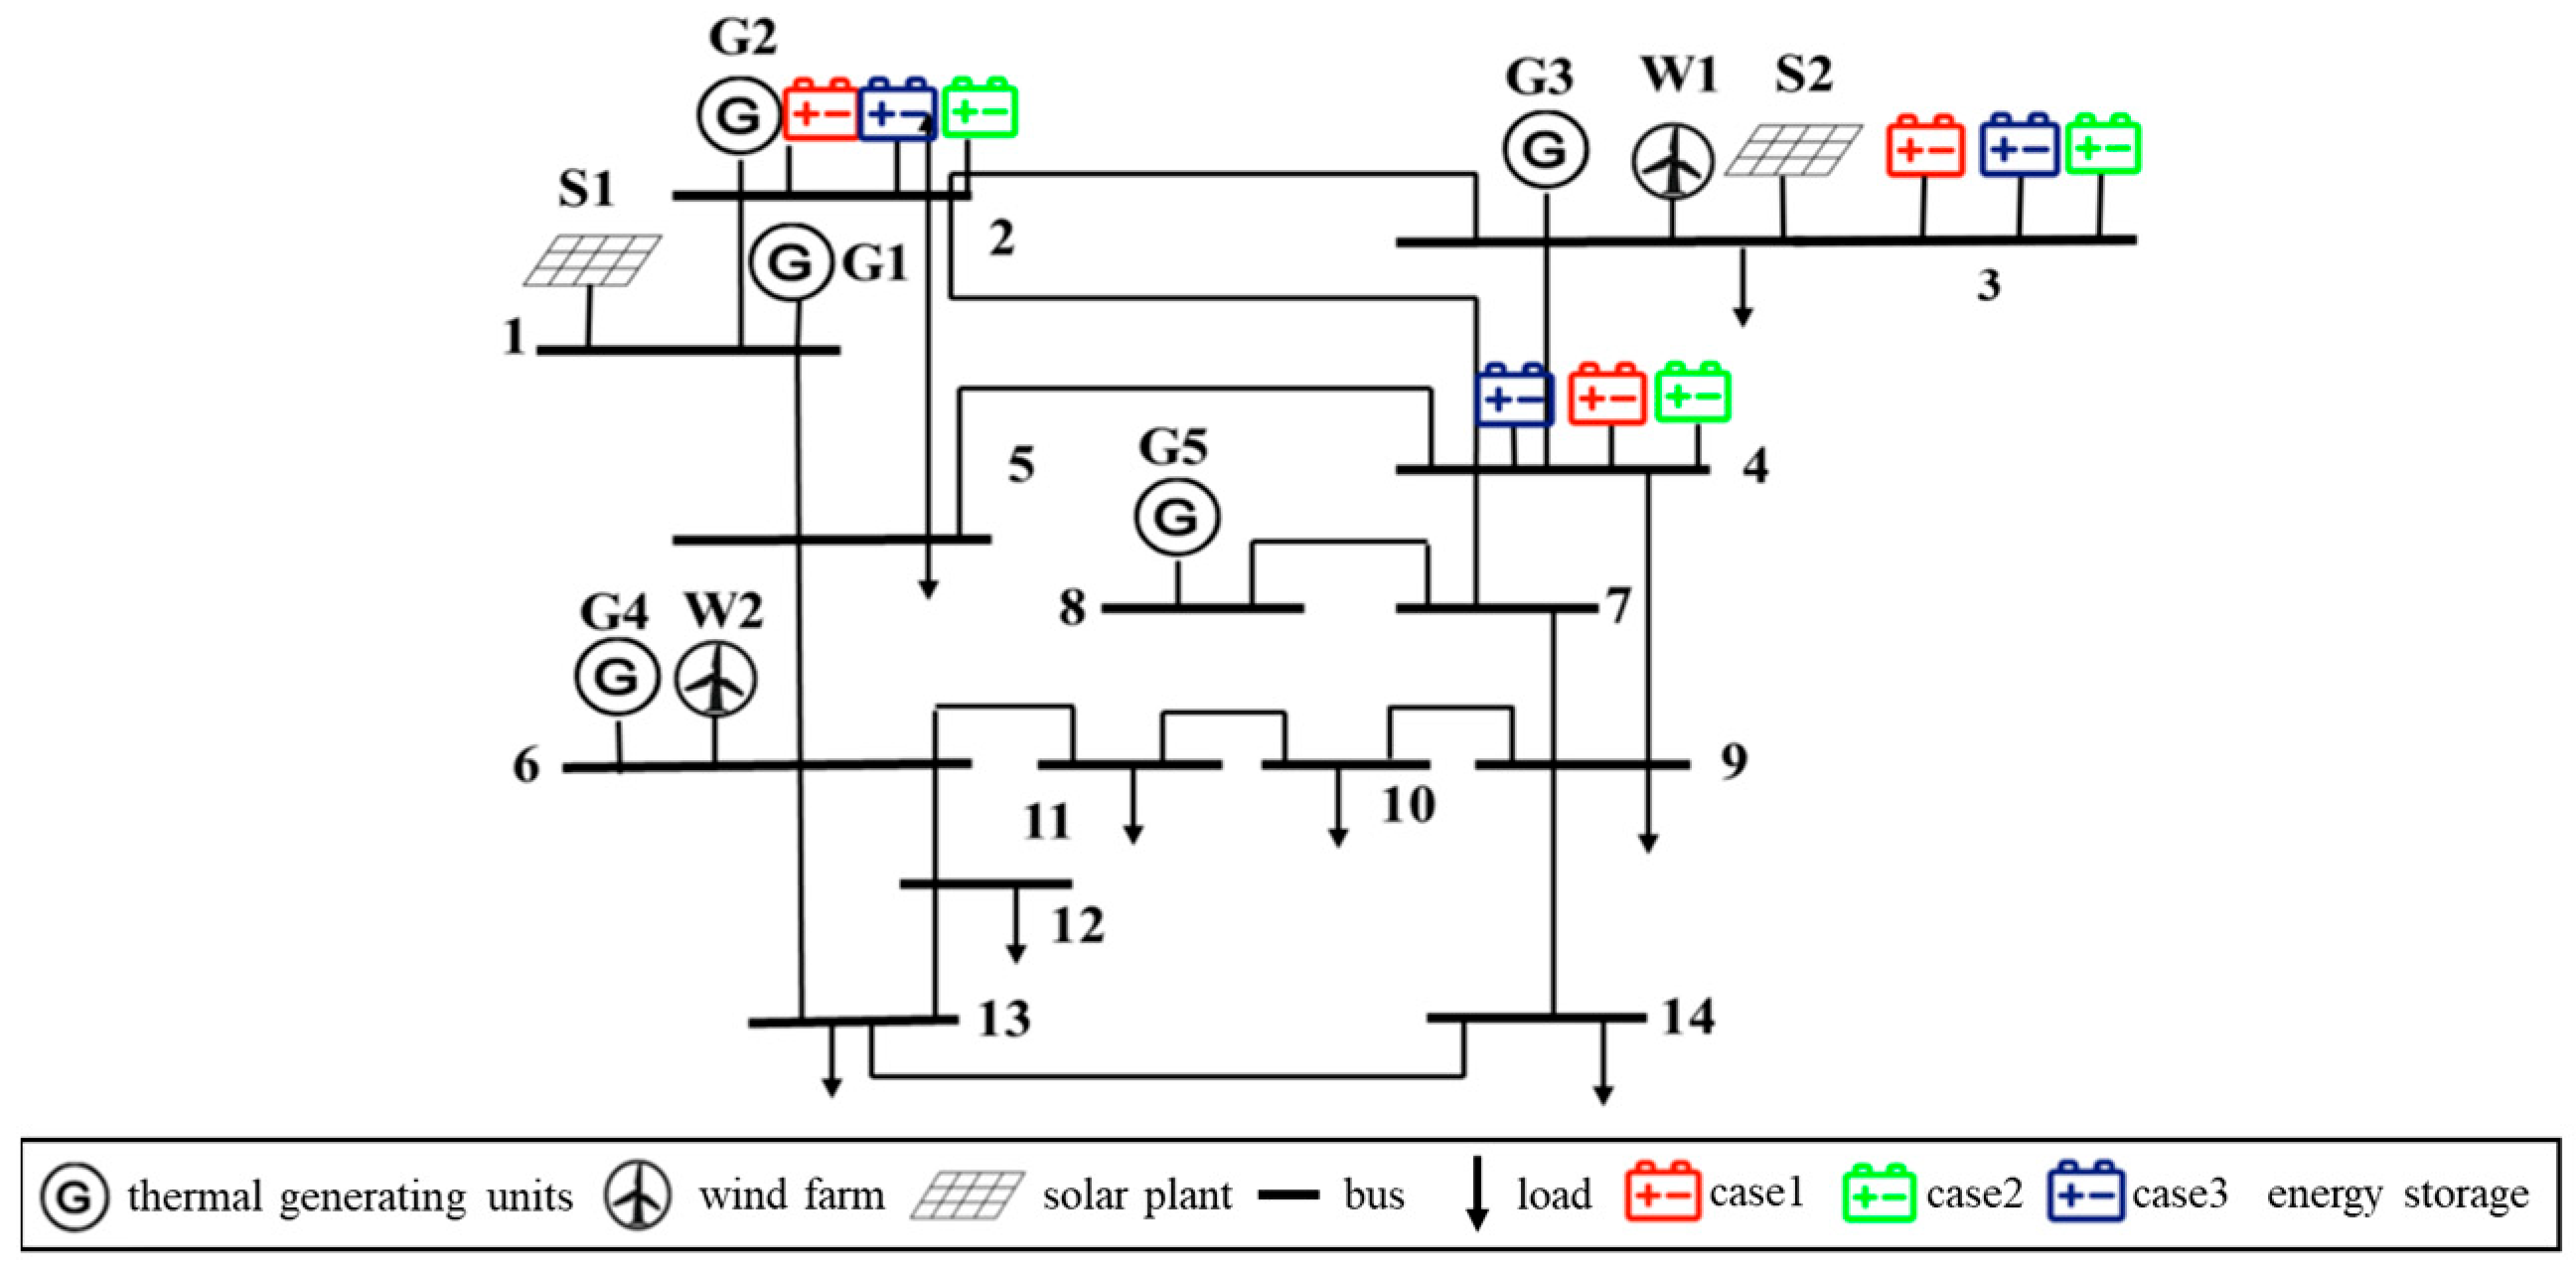
The simulation results of the system under different cases are shown in Table 2, and the planning results for energy storage siting are illustrated in Figure 8.
According to Table 2, when voltage security constraint is considered, Case 2 shows a 6.10% increase in the total daily average cost and a 9.52% increase in system operating cost compared with Case 1. In Case 3, the total daily average cost increases by 12.09%, and the system operating cost increases by 14.29% compared with Case 1.
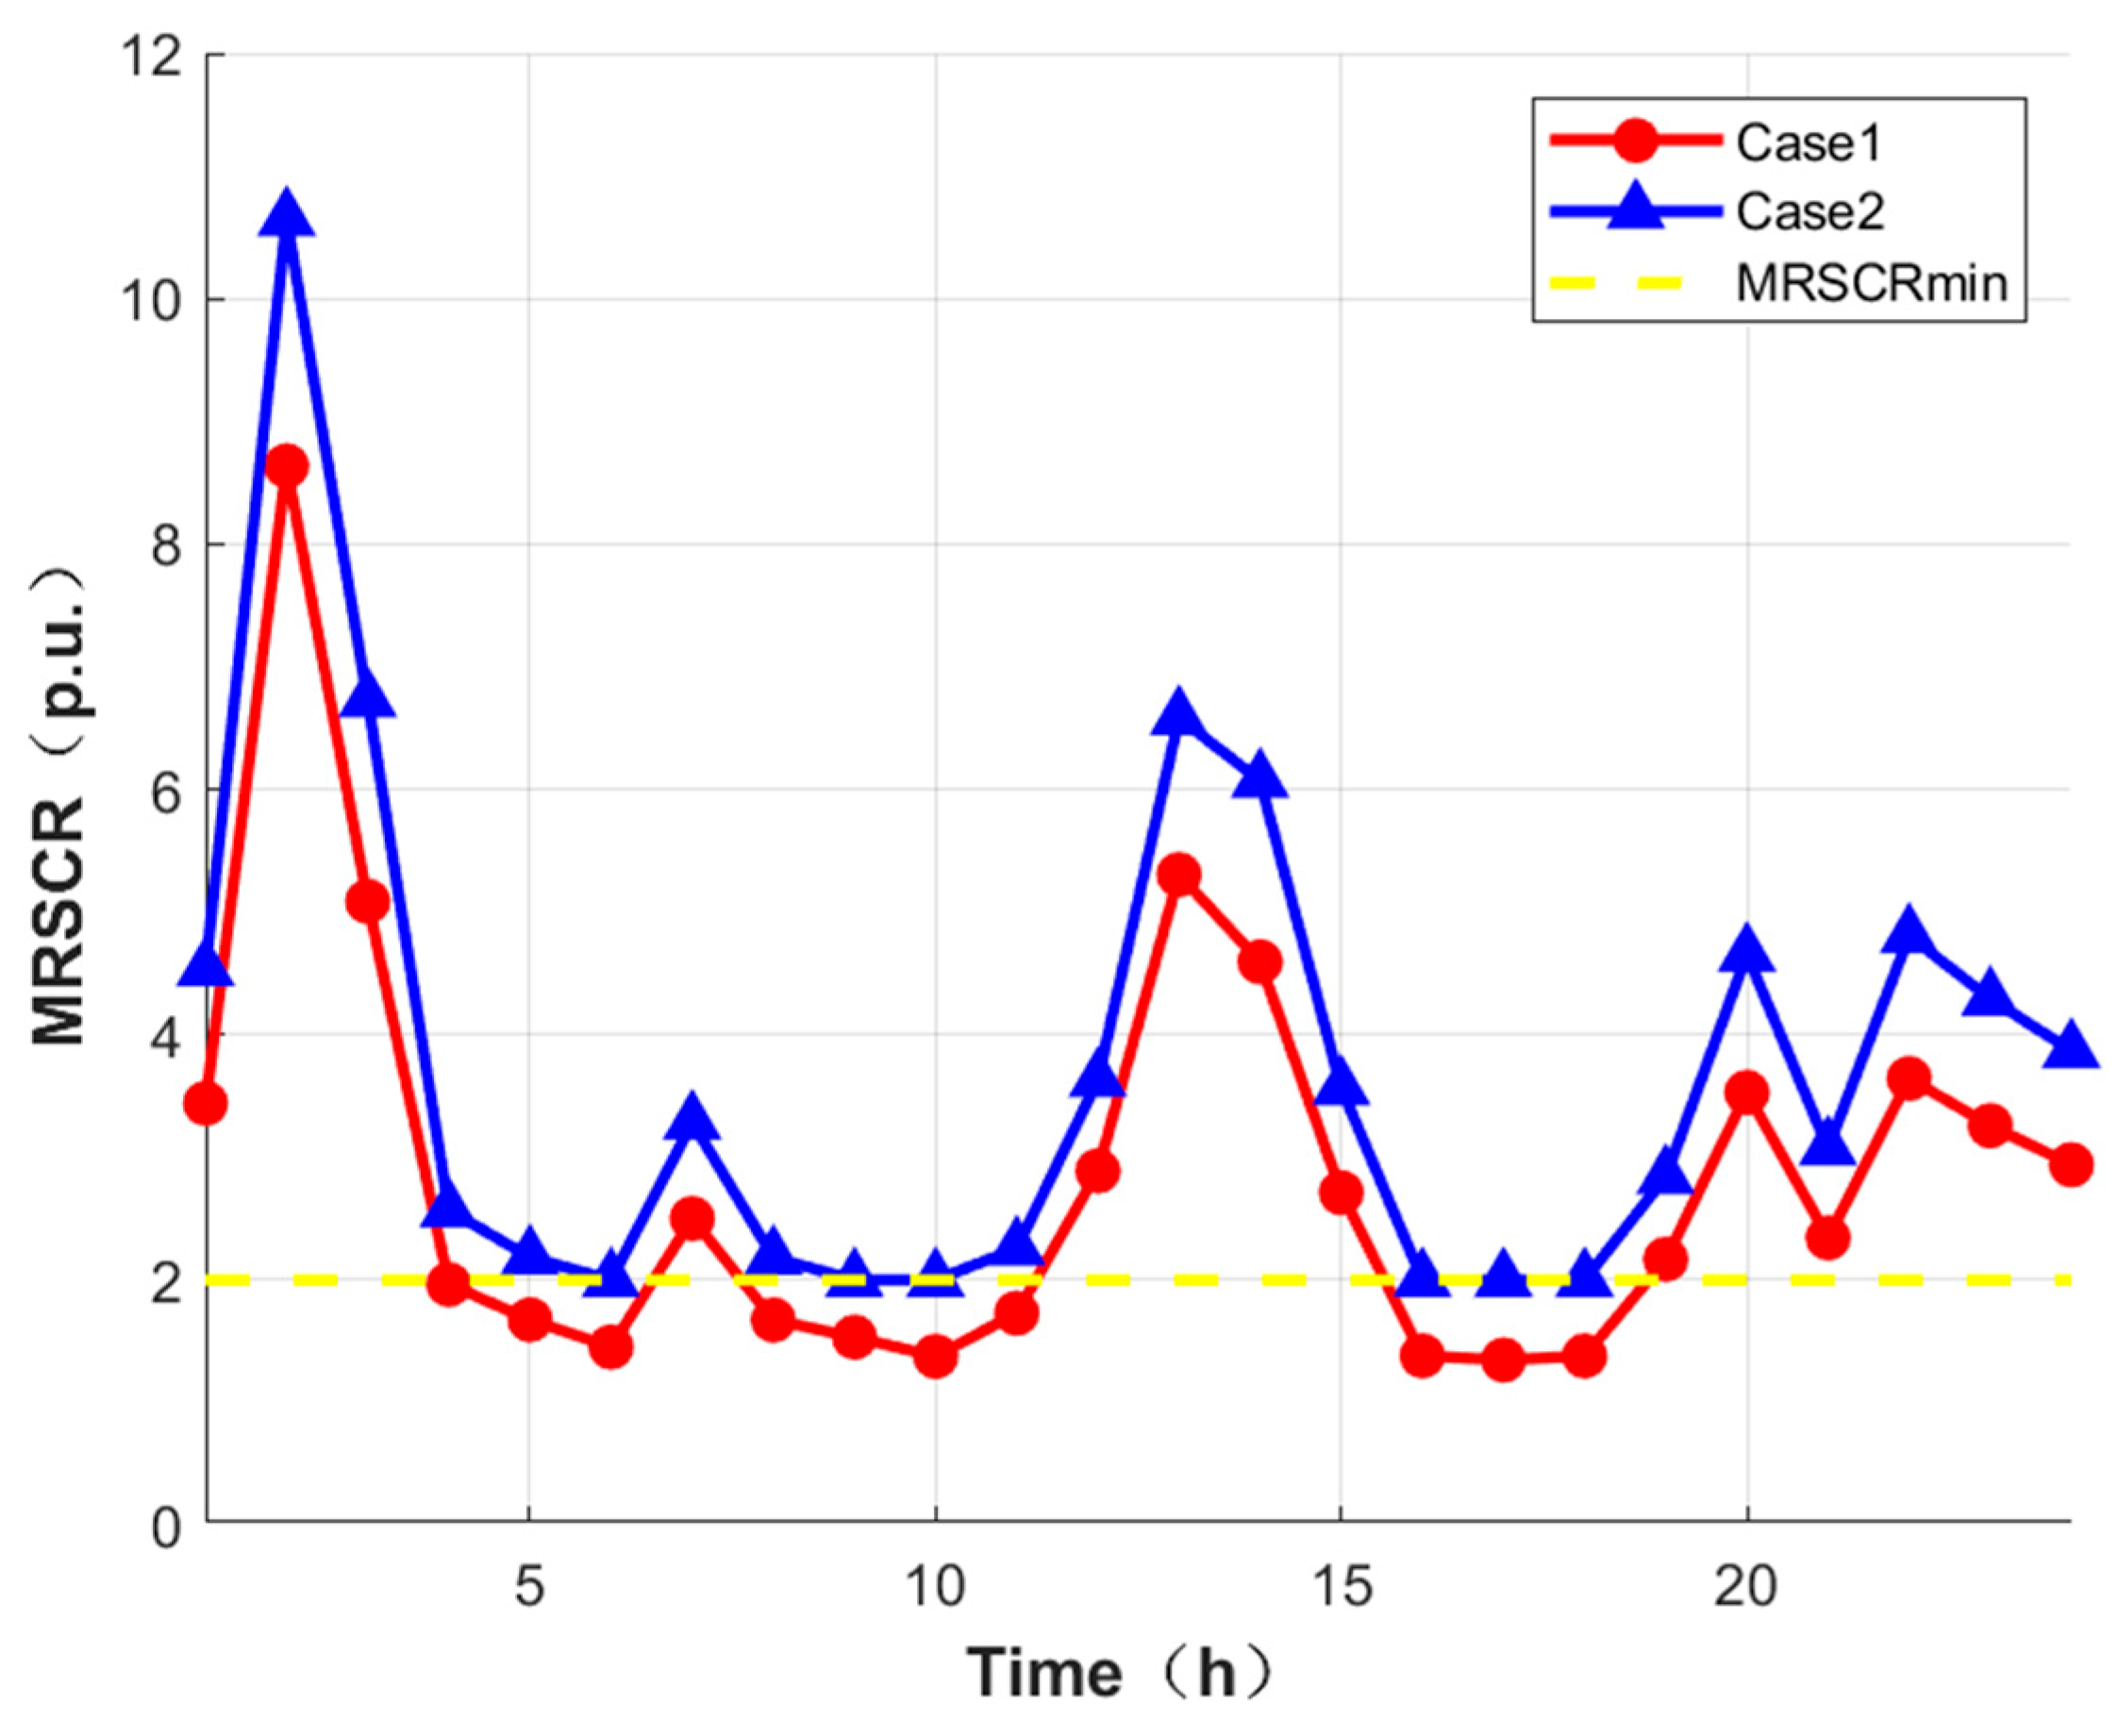
As shown in Figure 9, compared with Case 1, Case 2 ensures that the system MRSCR remains above the critical value throughout all time periods, thereby verifying the effectiveness of the proposed voltage security constraint.
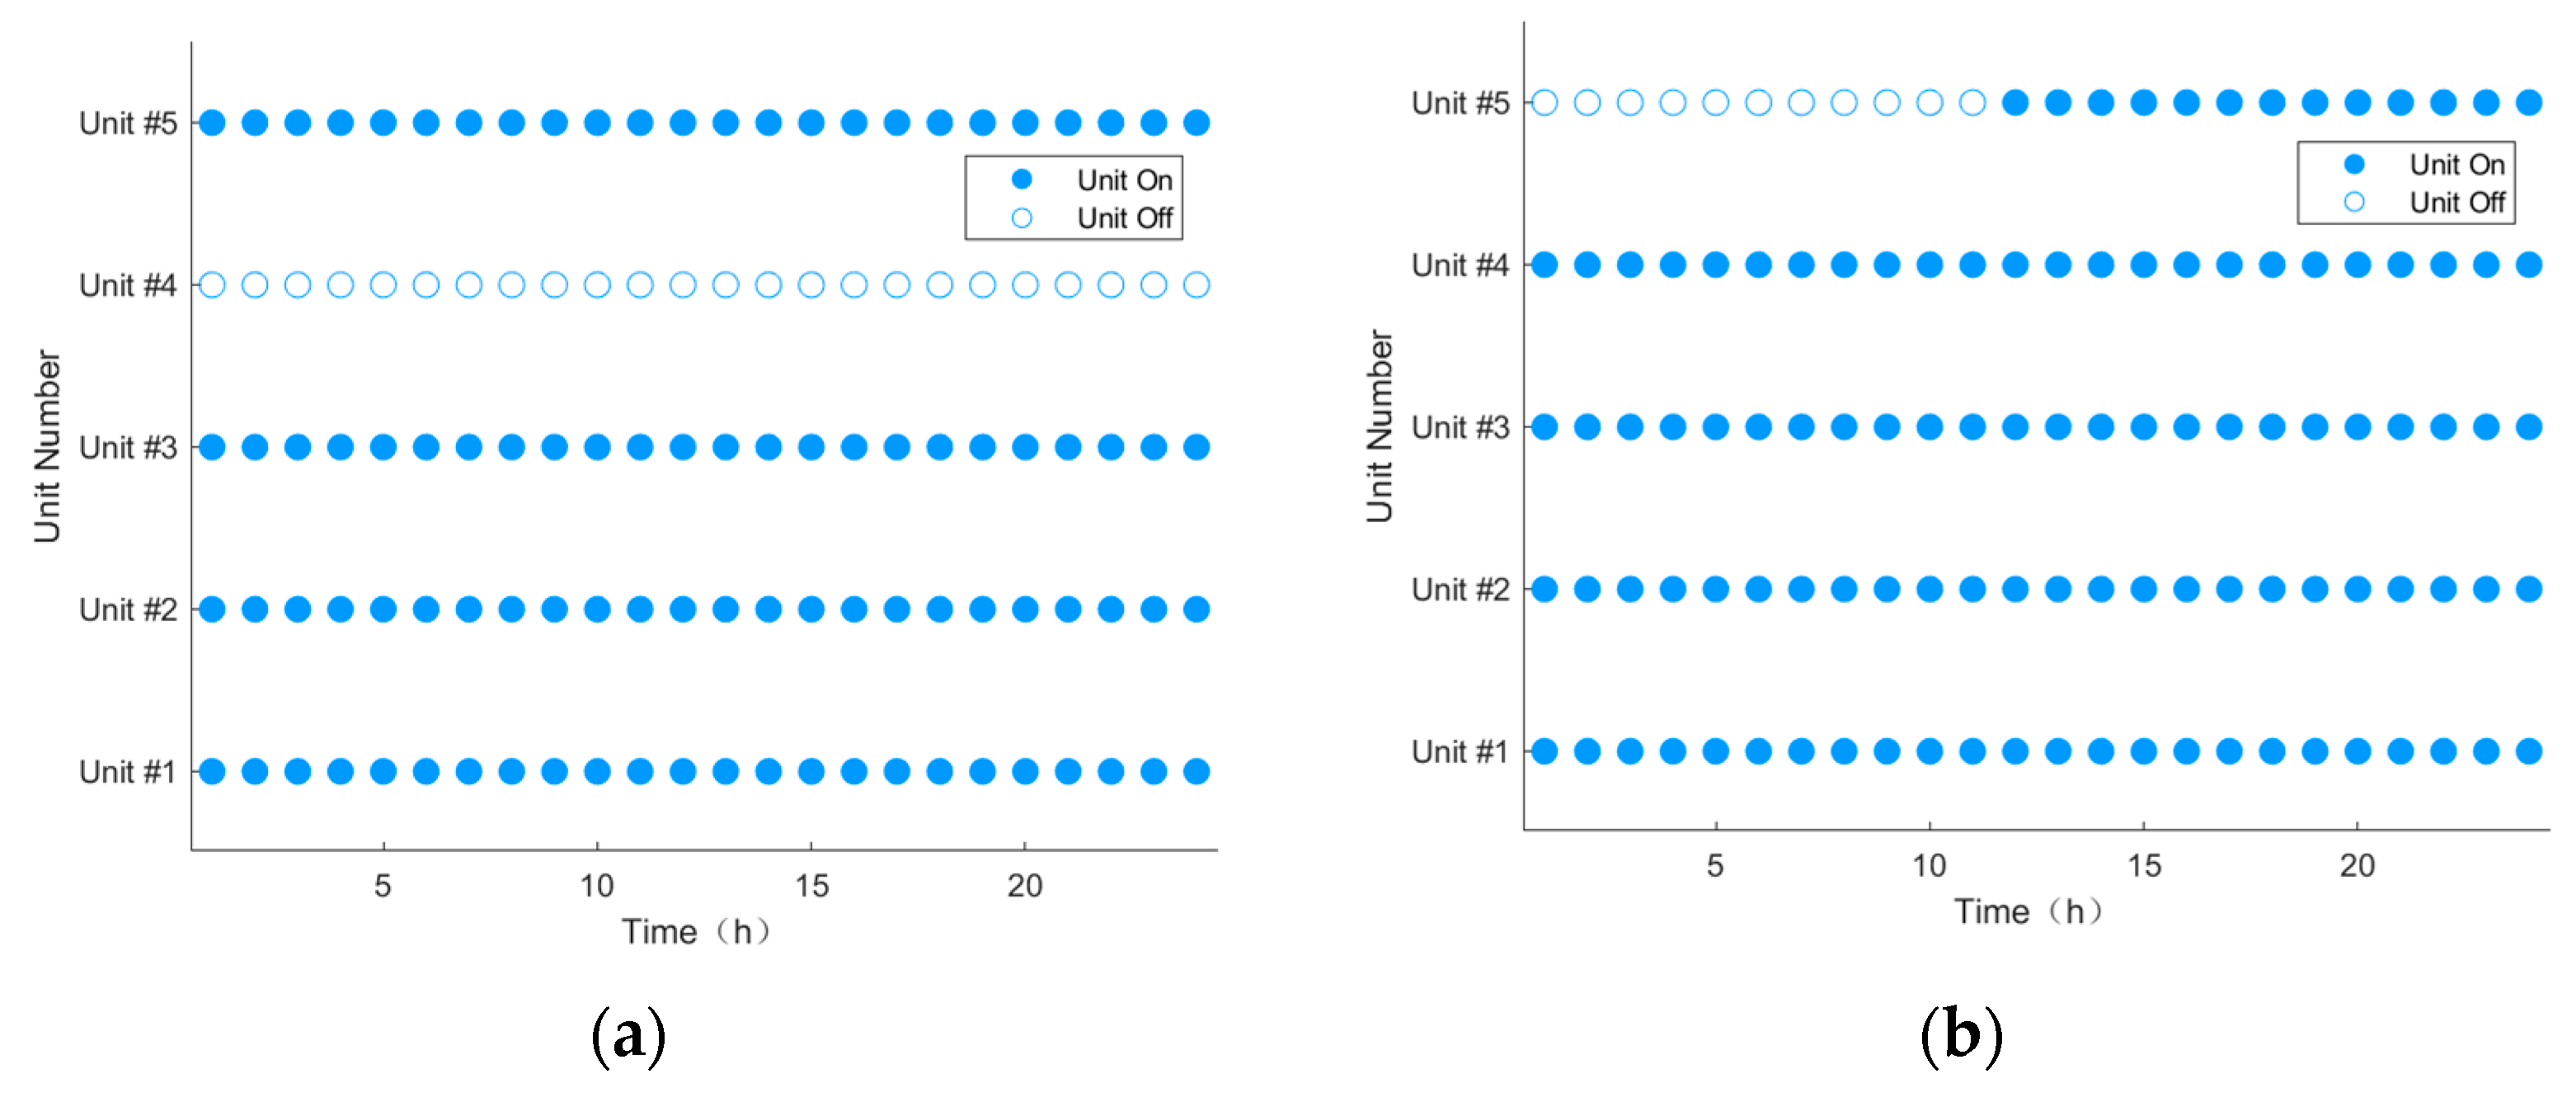
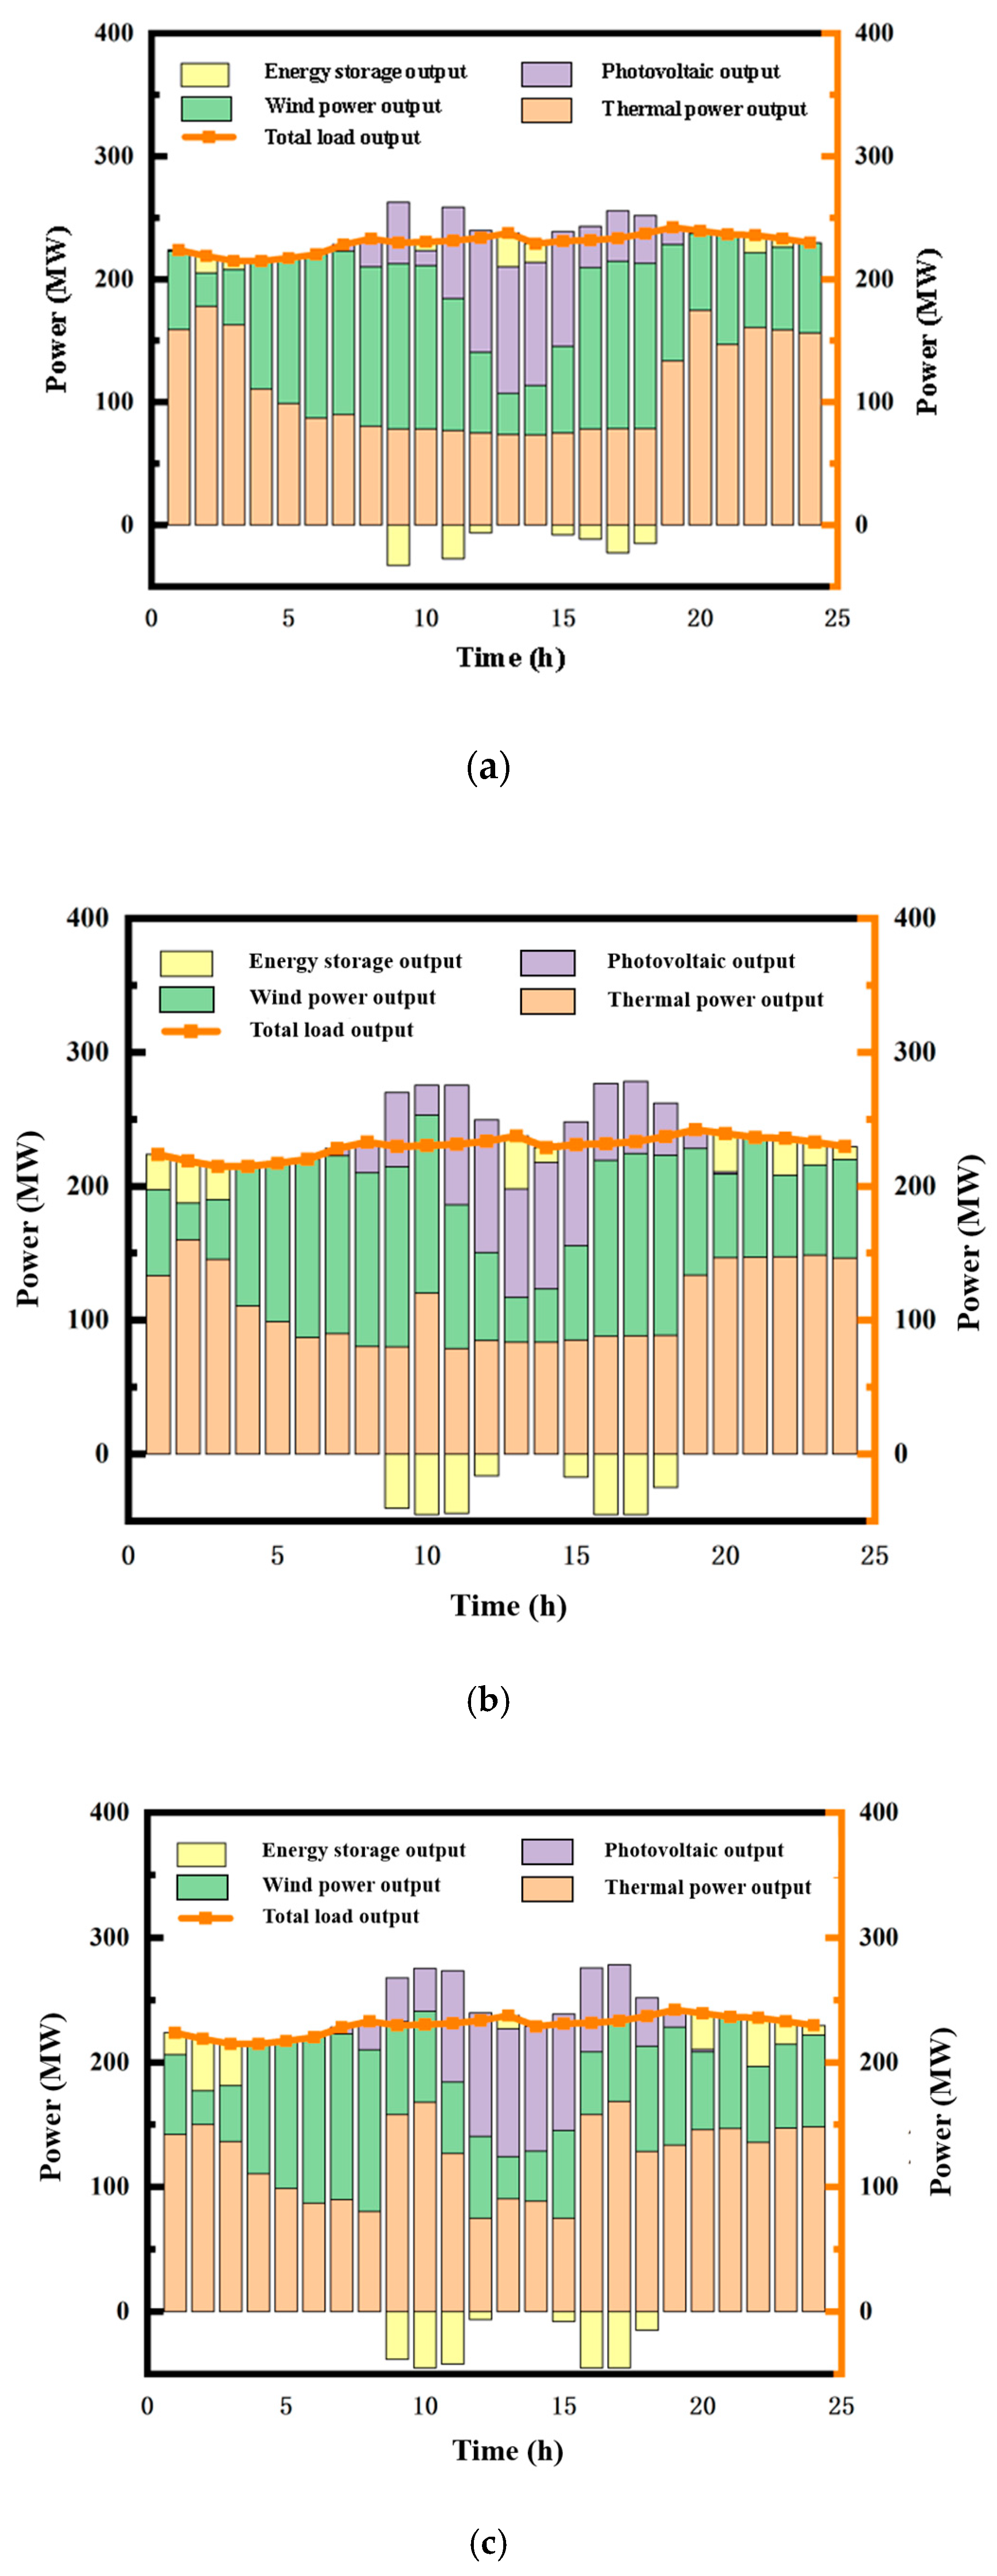
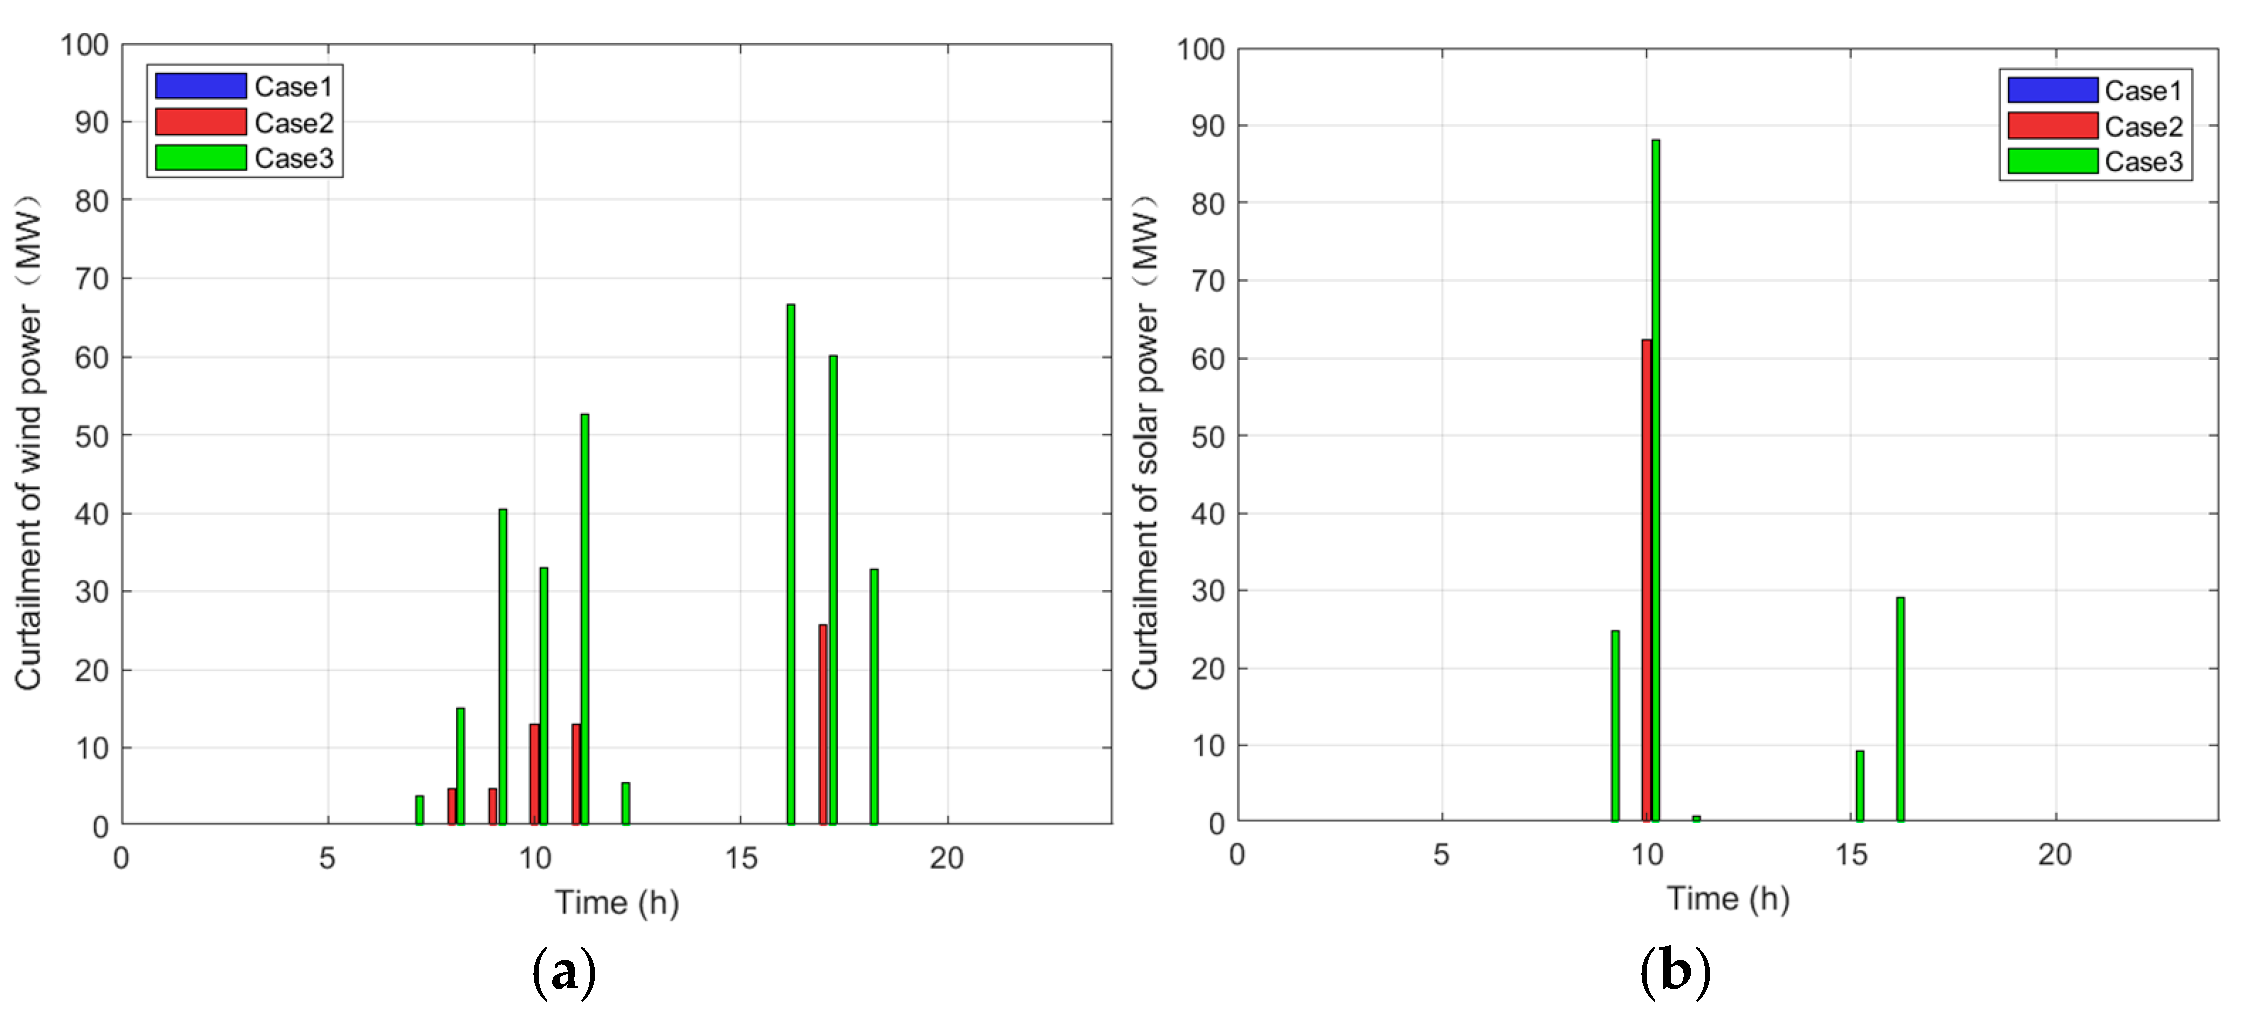
Further analysis of system operation under different cases is shown in Figure 9 and Figure 10. As illustrated in Figure 10 and Figure 11, compared with Case 2, Case 1 does not consider voltage security, and the energy storage configuration is mainly used to improve the economic performance of system operation. This is reflected by a significant reduction in overall thermal power output and a more effective accommodation of renewable energy. Moreover, as shown in Figure 12, compared with Case 3, Case 2 can enhance the voltage support strength of synchronous generators by adjusting their commitment schedules, thereby avoiding excessive renewable energy curtailment during certain time periods.

3.3. Analysis of the Voltage Support Role of Grid-Forming and Grid-Following Energy Storage

To verify the voltage support capability of grid-forming and grid-following energy storage systems, the following comparative cases are designed (with the unit commitment schedule fixed in order to fully reflect the voltage support role of energy storage):
Case 1: The voltage security constraint is considered, and only grid-following energy storage is planned.
Case 2: The voltage security constraint is considered, and only grid-forming energy storage is planned.
The simulation results of the planning results for energy storage siting are illustrated in Figure 13.
According to Table 3, a comparison between Case 1 and Case 2 shows that, under similar renewable energy curtailment rates, grid-forming energy storage requires significantly lower capacity and power to meet system voltage security requirements. As a result, its planning cost is 54.6% lower than that of grid-following energy storage. It is worth noting that the 54.6% advantage in low planning cost specifically refers to capacity-related investment costs (such as the capacities of batteries and converters), while ignoring the specific implementation costs of grid-forming converters (such as sophisticated control algorithms, fault-current limiting to protect power semiconductors, and the potential for control-loop instabilities).
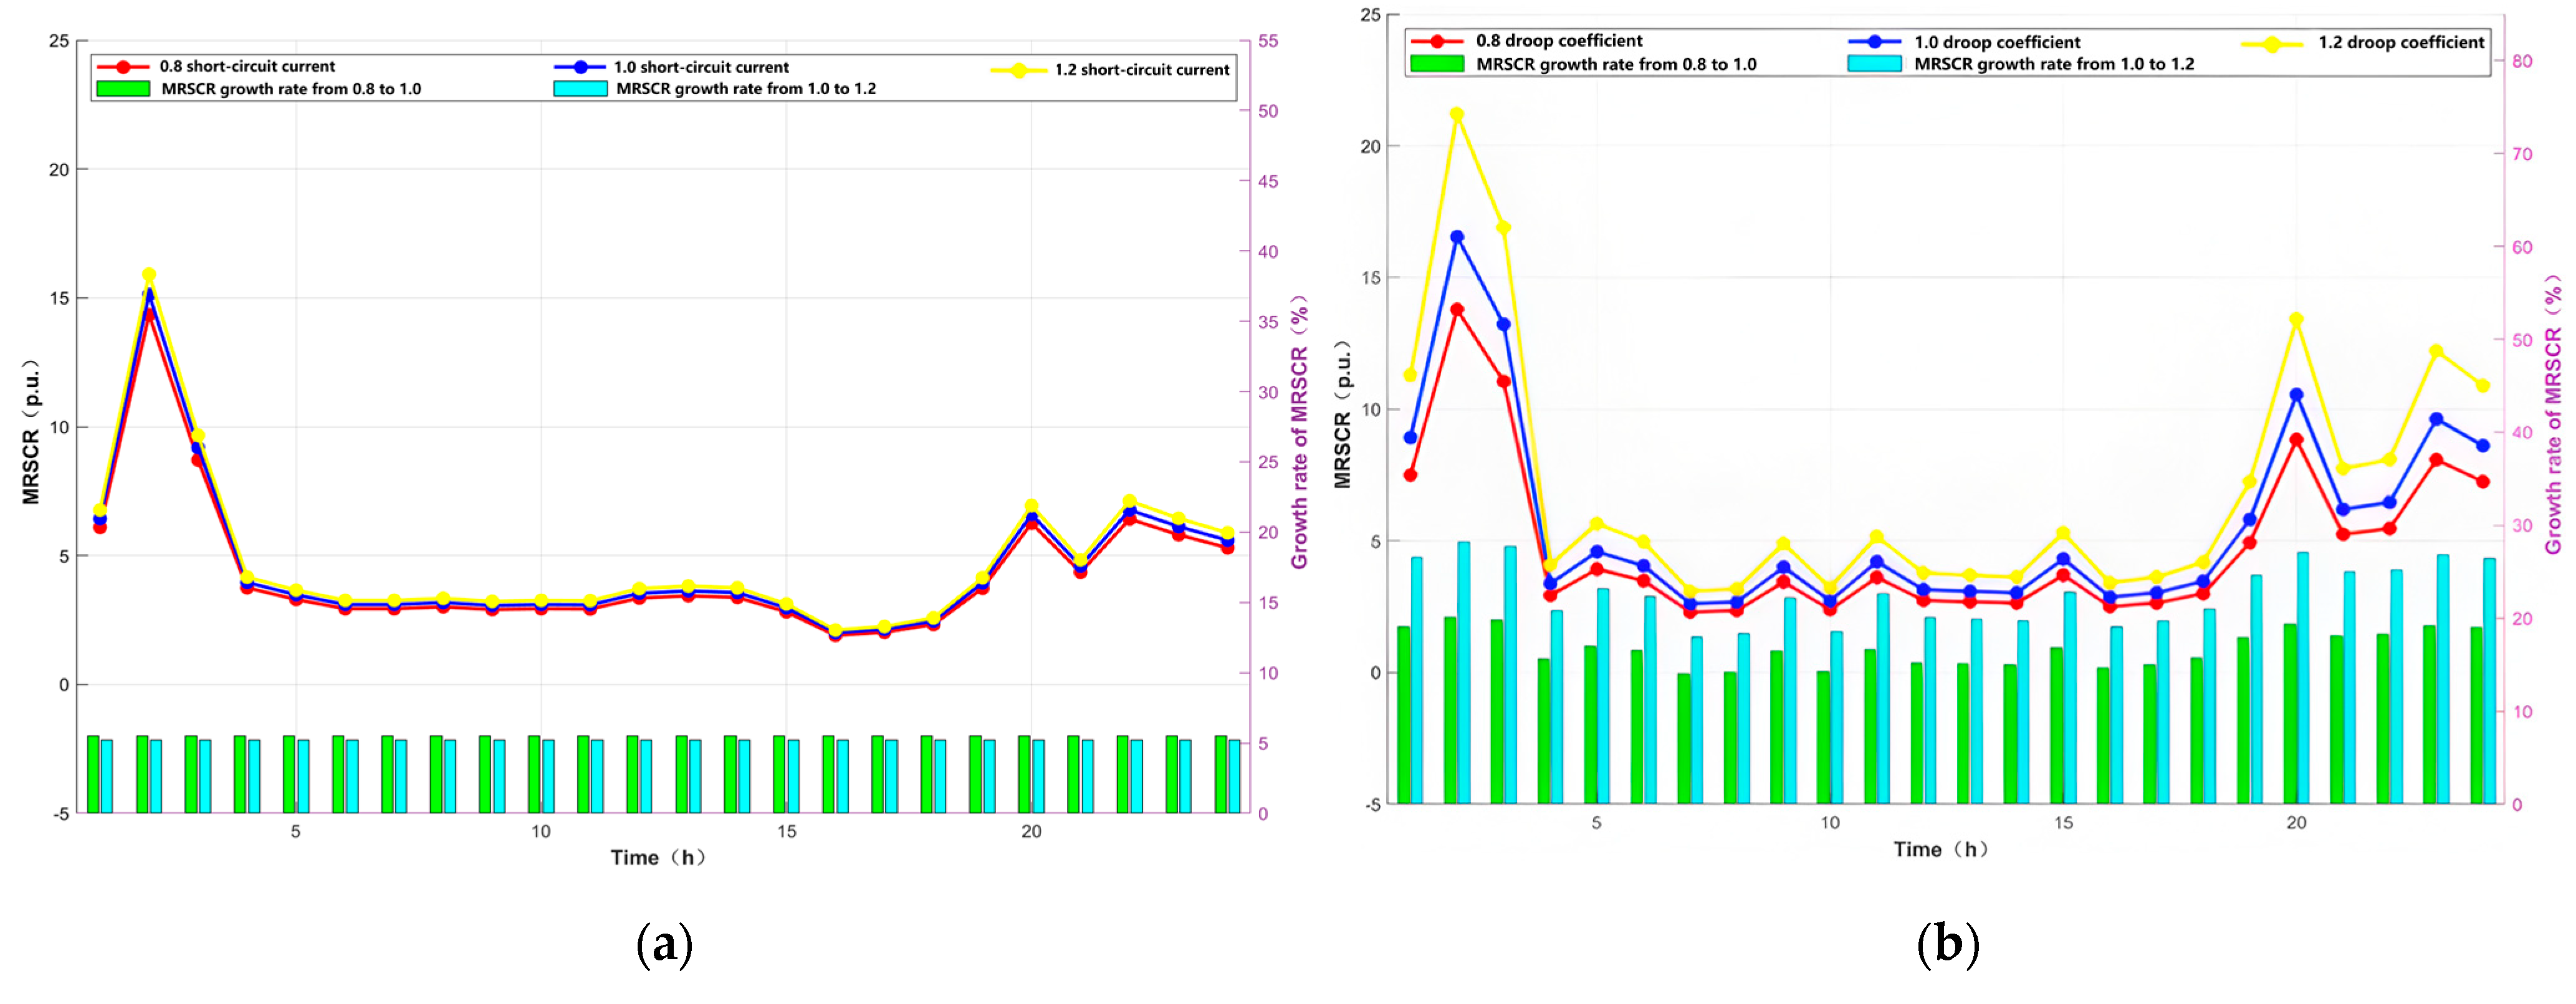
To further investigate the relative effectiveness of meshed-network and follower-network energy storage in system voltage support, with no wind/solar curtailment and with the planning results and unit start-stop schedules of Case 1 and Case 2 fixed, a sensitivity optimization analysis was conducted by varying the control parameters of the meshed/follower storage. As shown in Figure 14, compared with Case 1, Case 2 exhibits a higher system-wide average MRSCR across all periods. Moreover, the same proportional changes in control parameters produce a larger improvement in the overall system MRSCR under Case 2, which fully demonstrates the advantage of meshed-network storage in voltage support.

3.4. Scalability Tests in 750 kV Provincial Power System of a Province in Northwest China

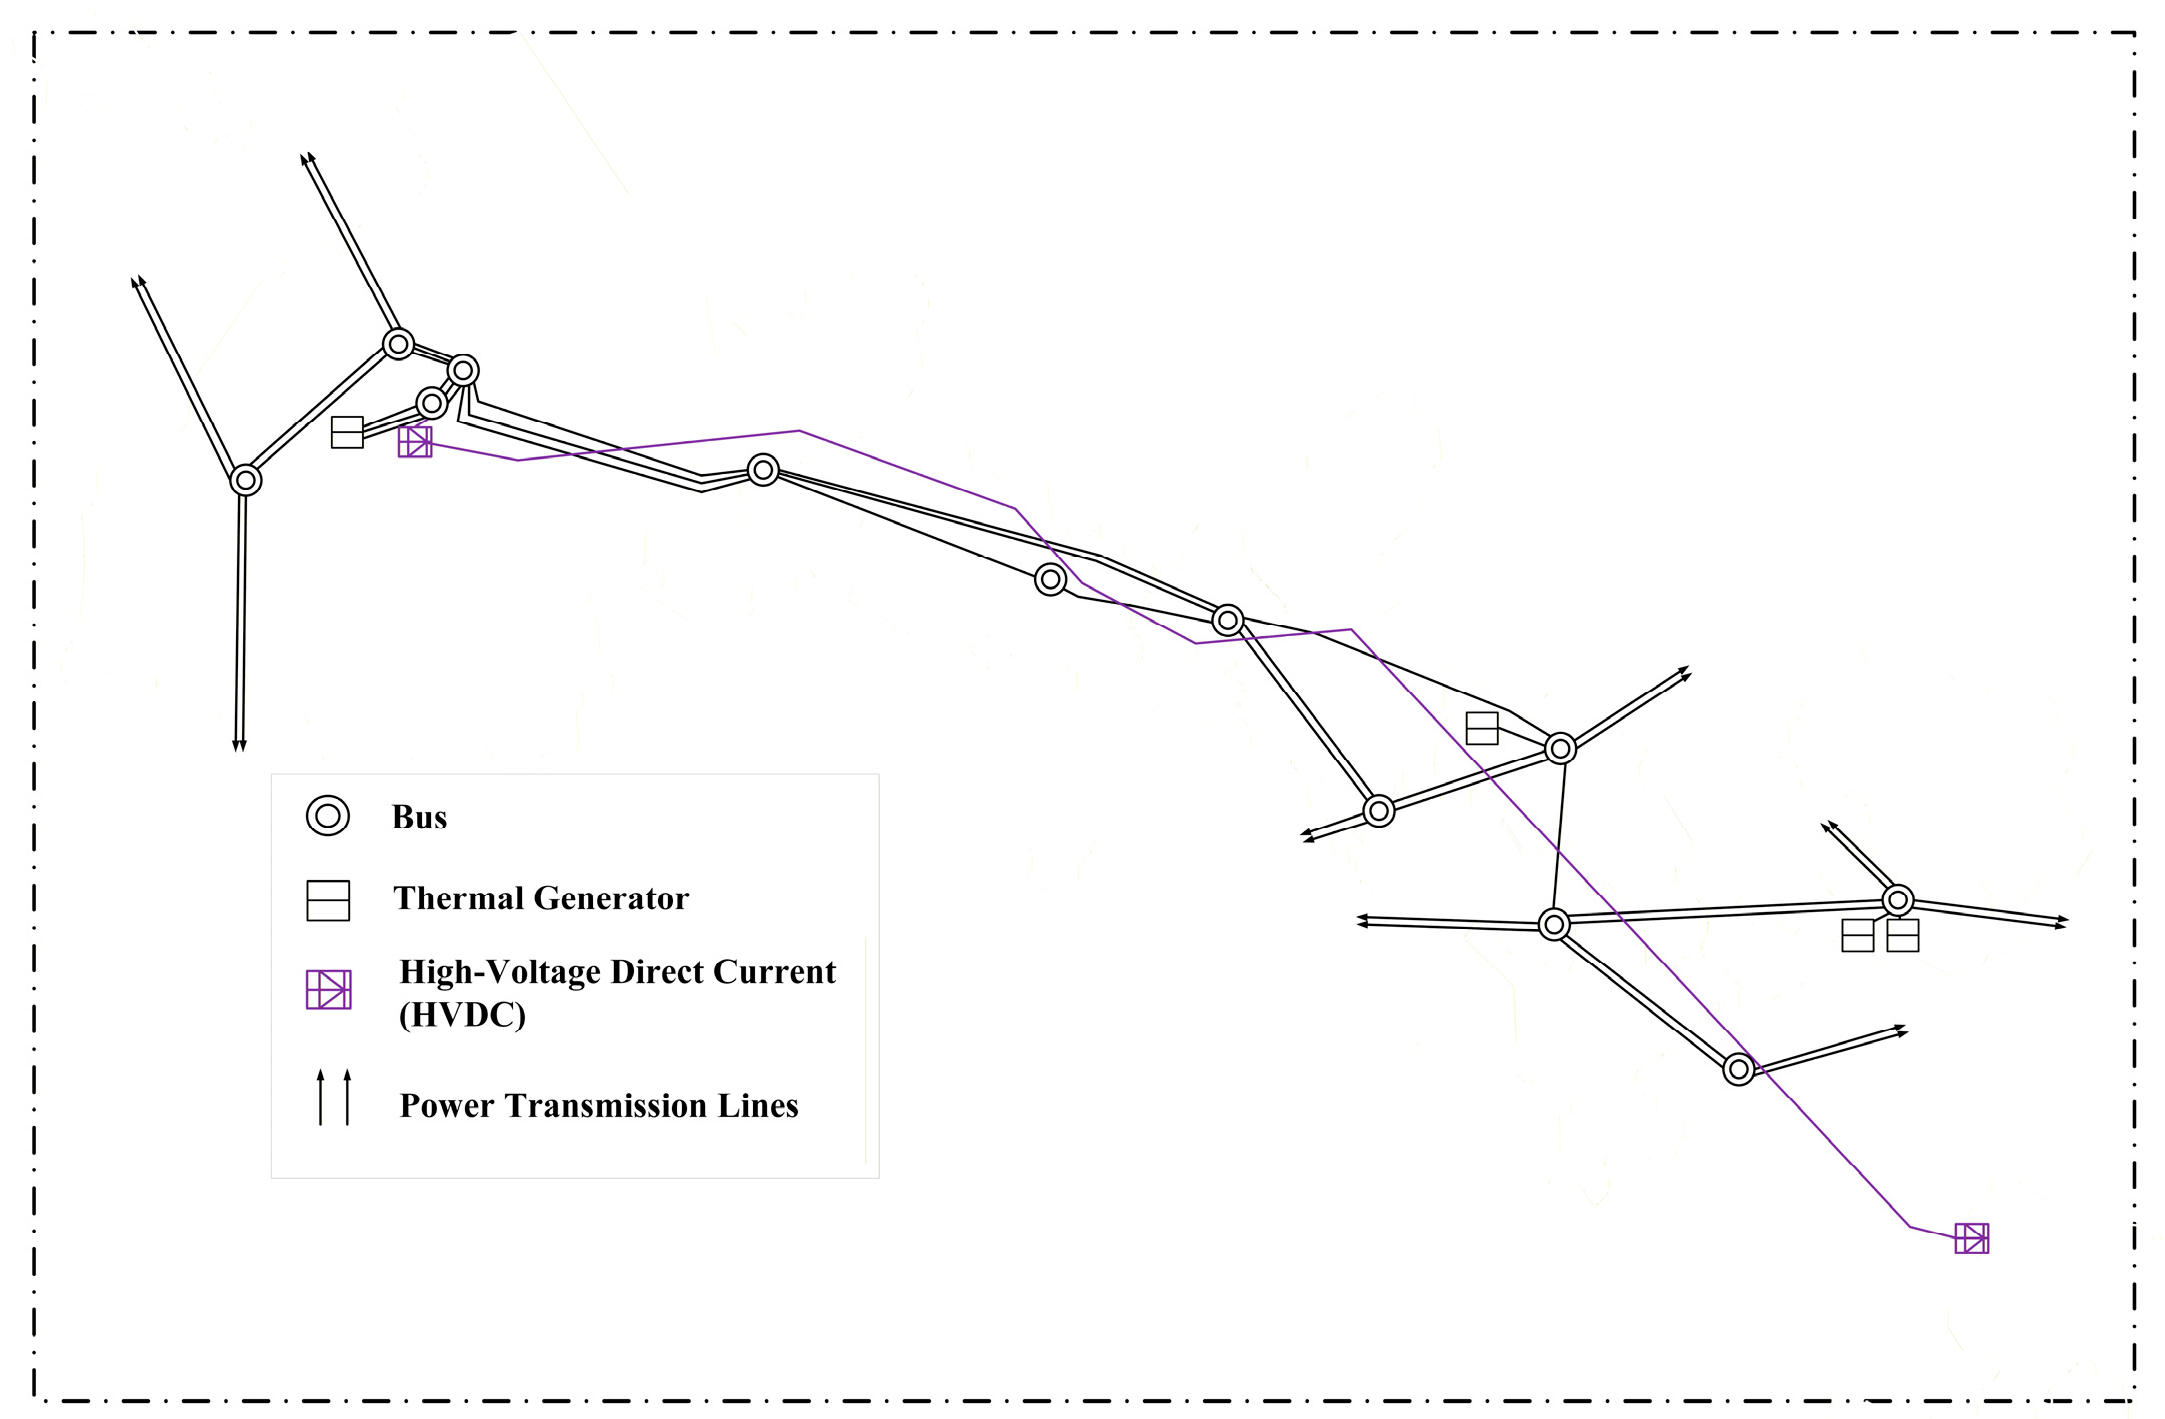
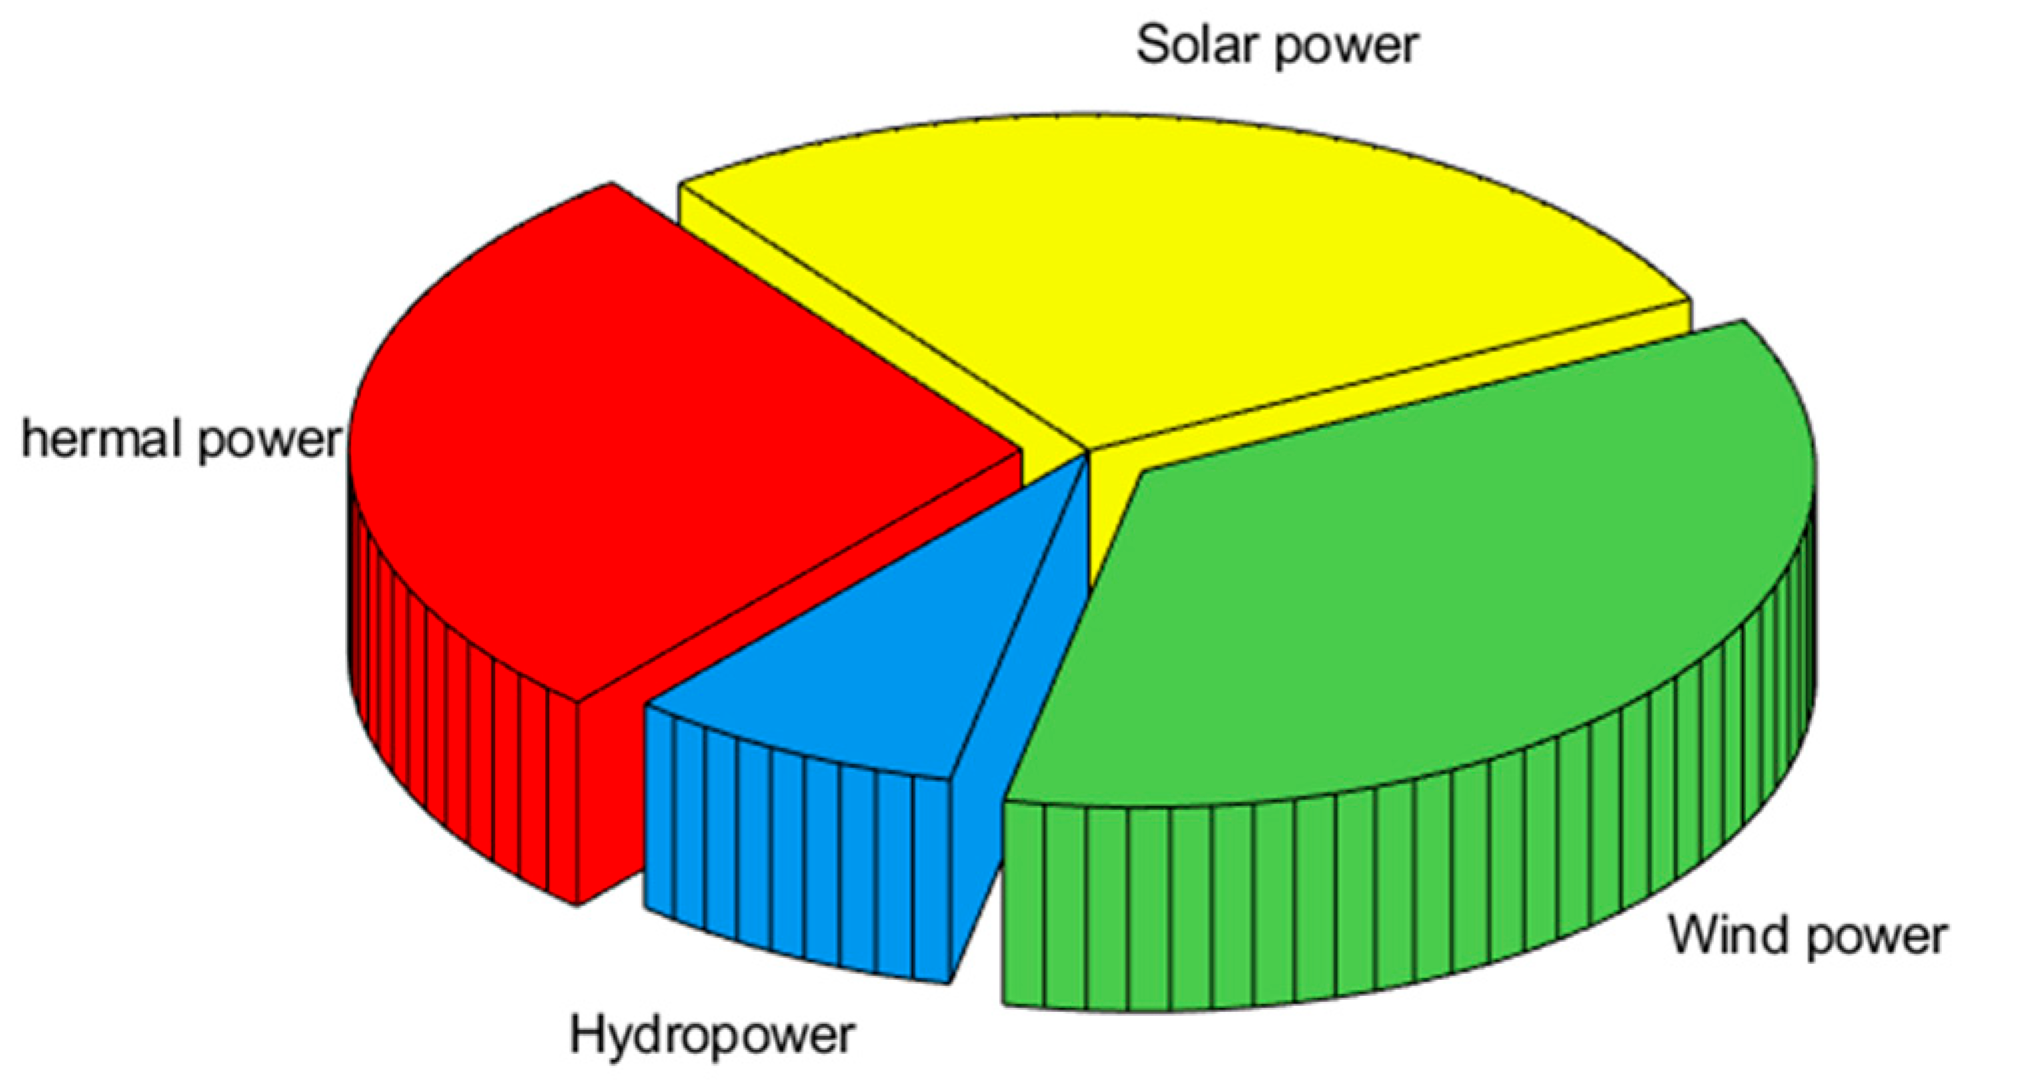
A large-scale case study is conducted based on actual parameters of the 750 kV power grid of a province in Northwest China as shown in Figure 15. The proportion of installed power capacity in the system is shown in Figure 16. The provincial system comprises 65 thermal generating units with a total capacity of 23,041 MW, 134 hydropower units with a total capacity of 6690.6 MW, 149 solar plants with a total capacity of 22,949.3 MW, and 141 wind farms with a total capacity of 29,280.6 MW. In addition, there are 10 interconnection lines with a total transfer capacity of 37,934.5 MW.
Typical wind power, solar power, and load curves are selected based on historical operation data, with a peak load of 25,210 MW. Based on the proposed voltage security constraint, the study considers enhancing grid strength and ensuring secure and stable system operation through the optimized deployment of grid-forming energy storage. The critical SCR for multiple renewable energy plants is set to 2.
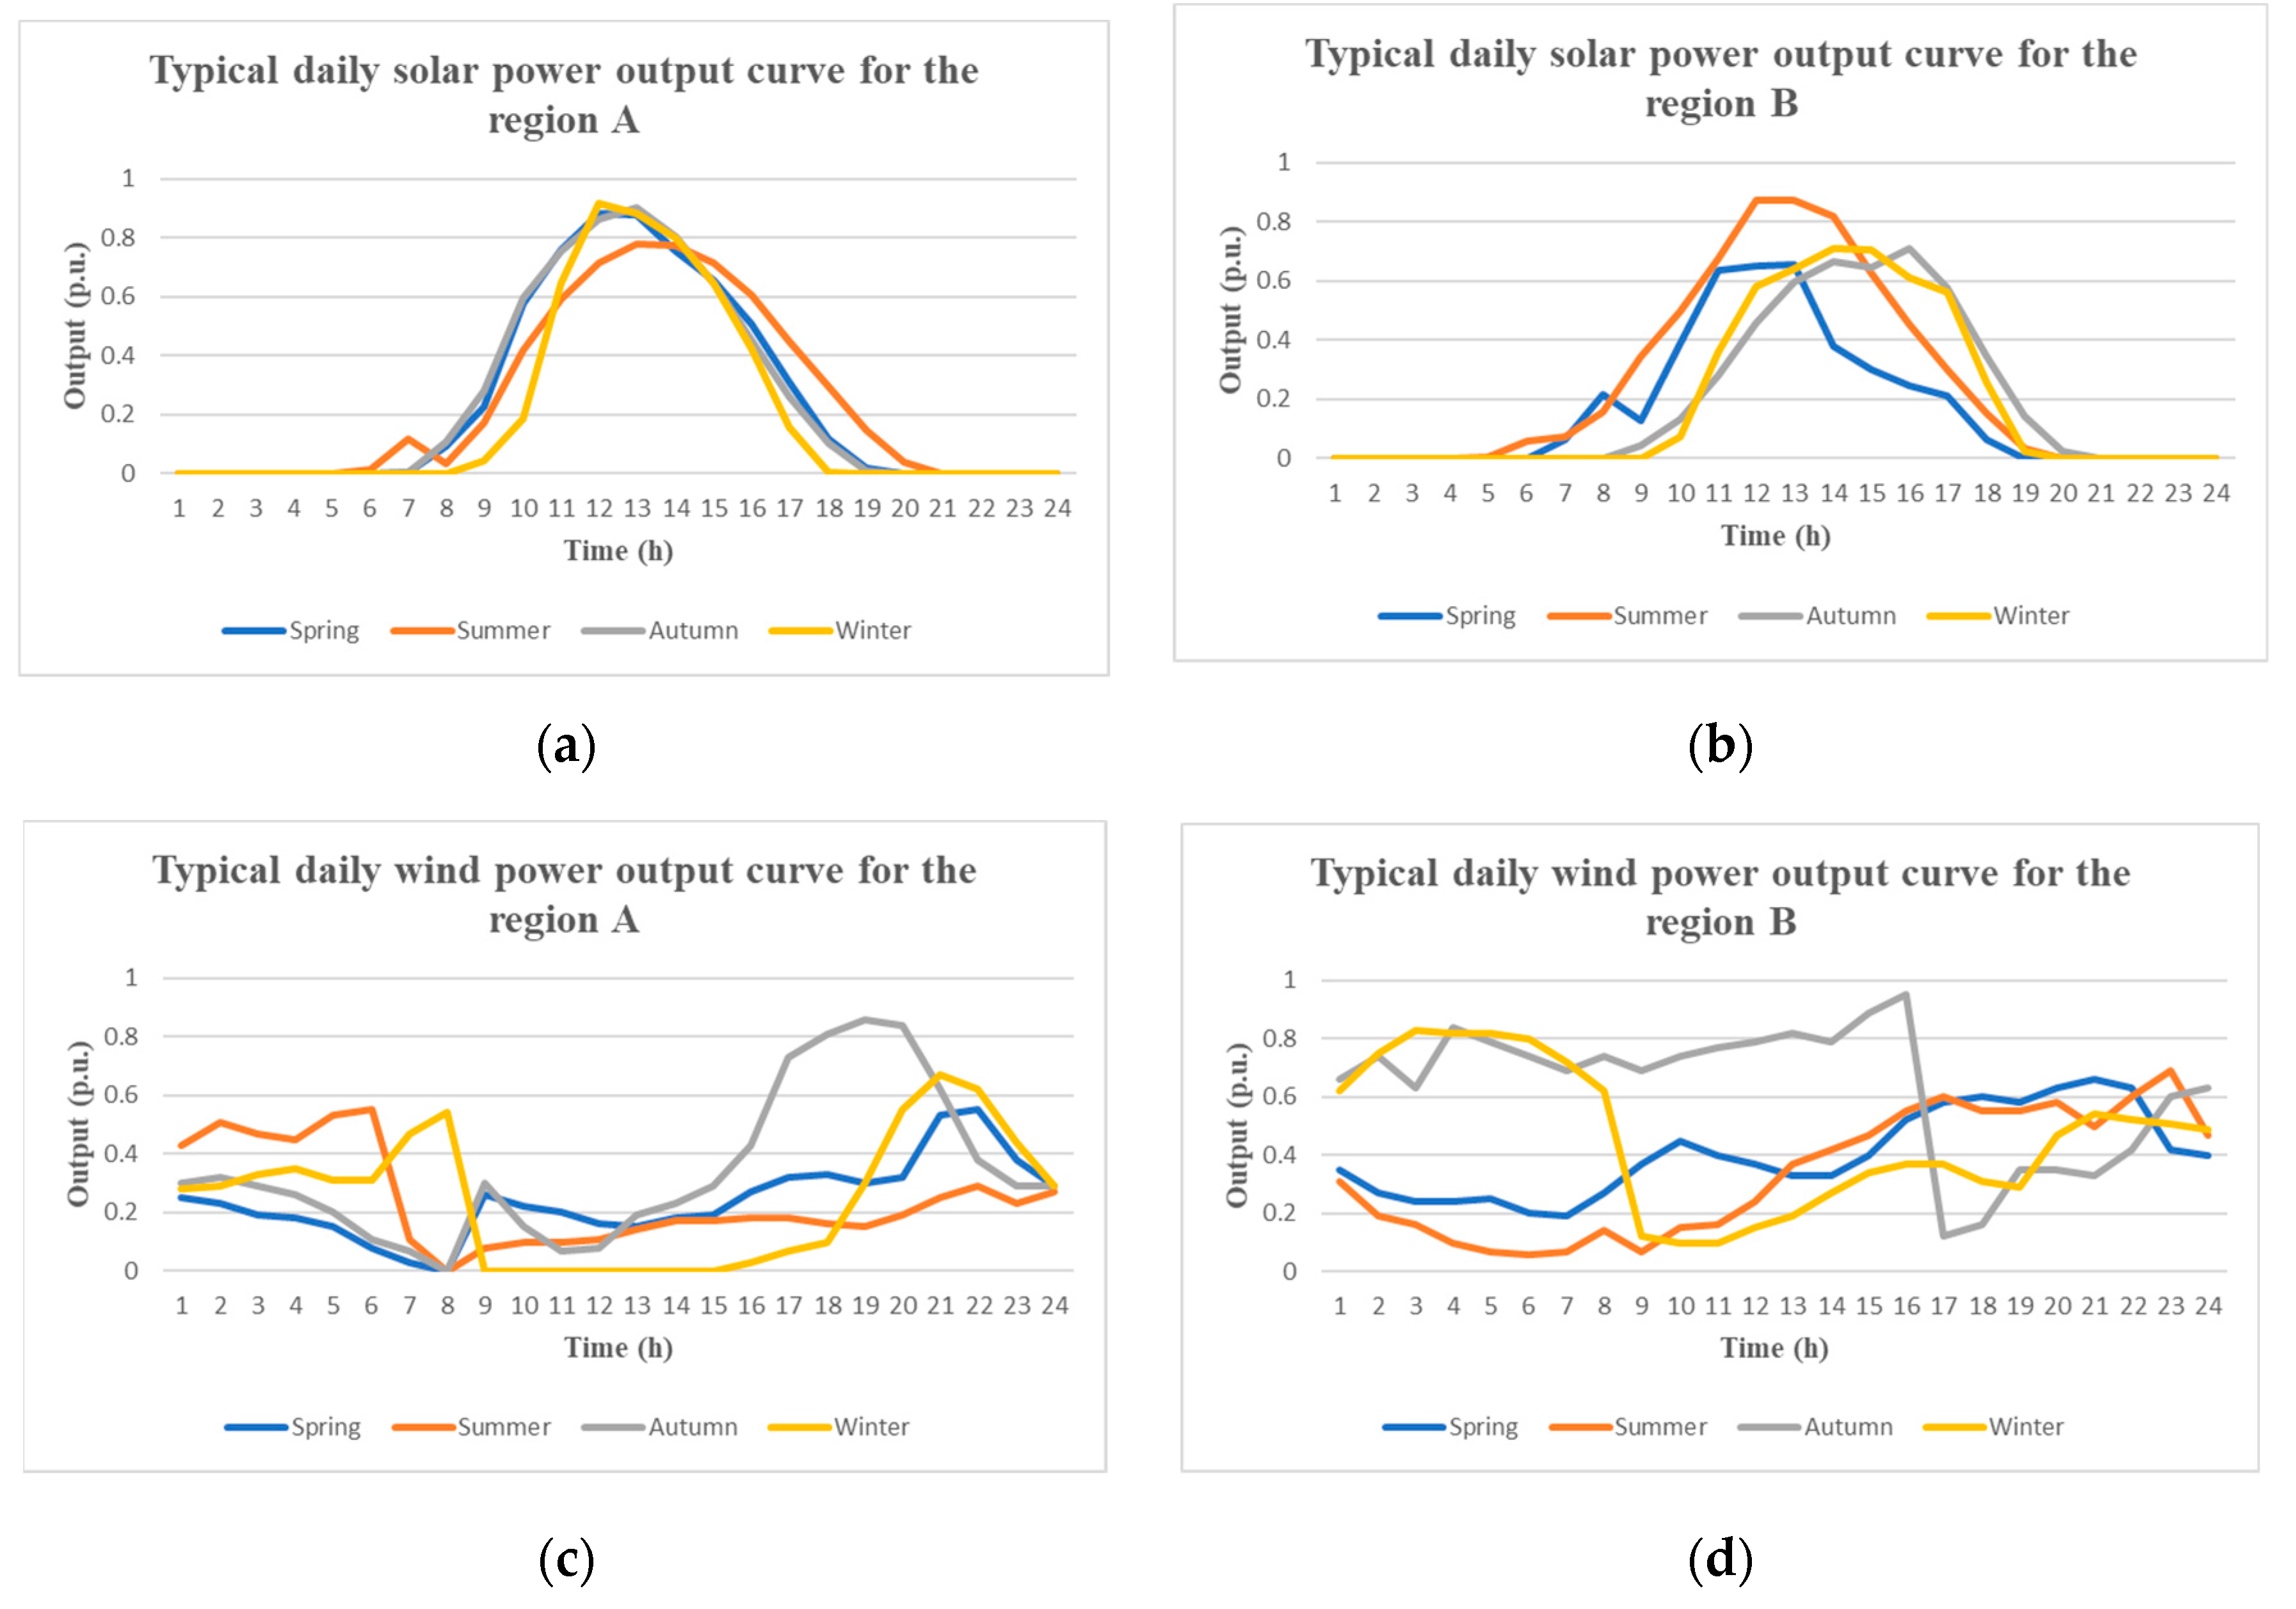
Taking the northern region A and the southern region B of the province as examples, the four typical daily output curves for different seasons are extracted through clustering analysis based on 10 years of renewable energy output data in these regions, as shown in Figure 17.
To verify the effectiveness of the proposed voltage security constraint, the following comparative cases are designed:
Case 1: Energy storage is configured without considering the voltage security constraint.
Case 2: Energy storage is configured with the security constraint included.
The simulation results of the system under different cases are shown in Table 4.
According to Table 4, when voltage stability is considered, Case 2 requires additional energy storage investment to ensure sufficient grid strength. As a result, the total daily average cost of the system increases by 5.45%, and the operating cost increases by 3.24% compared with Case 1.
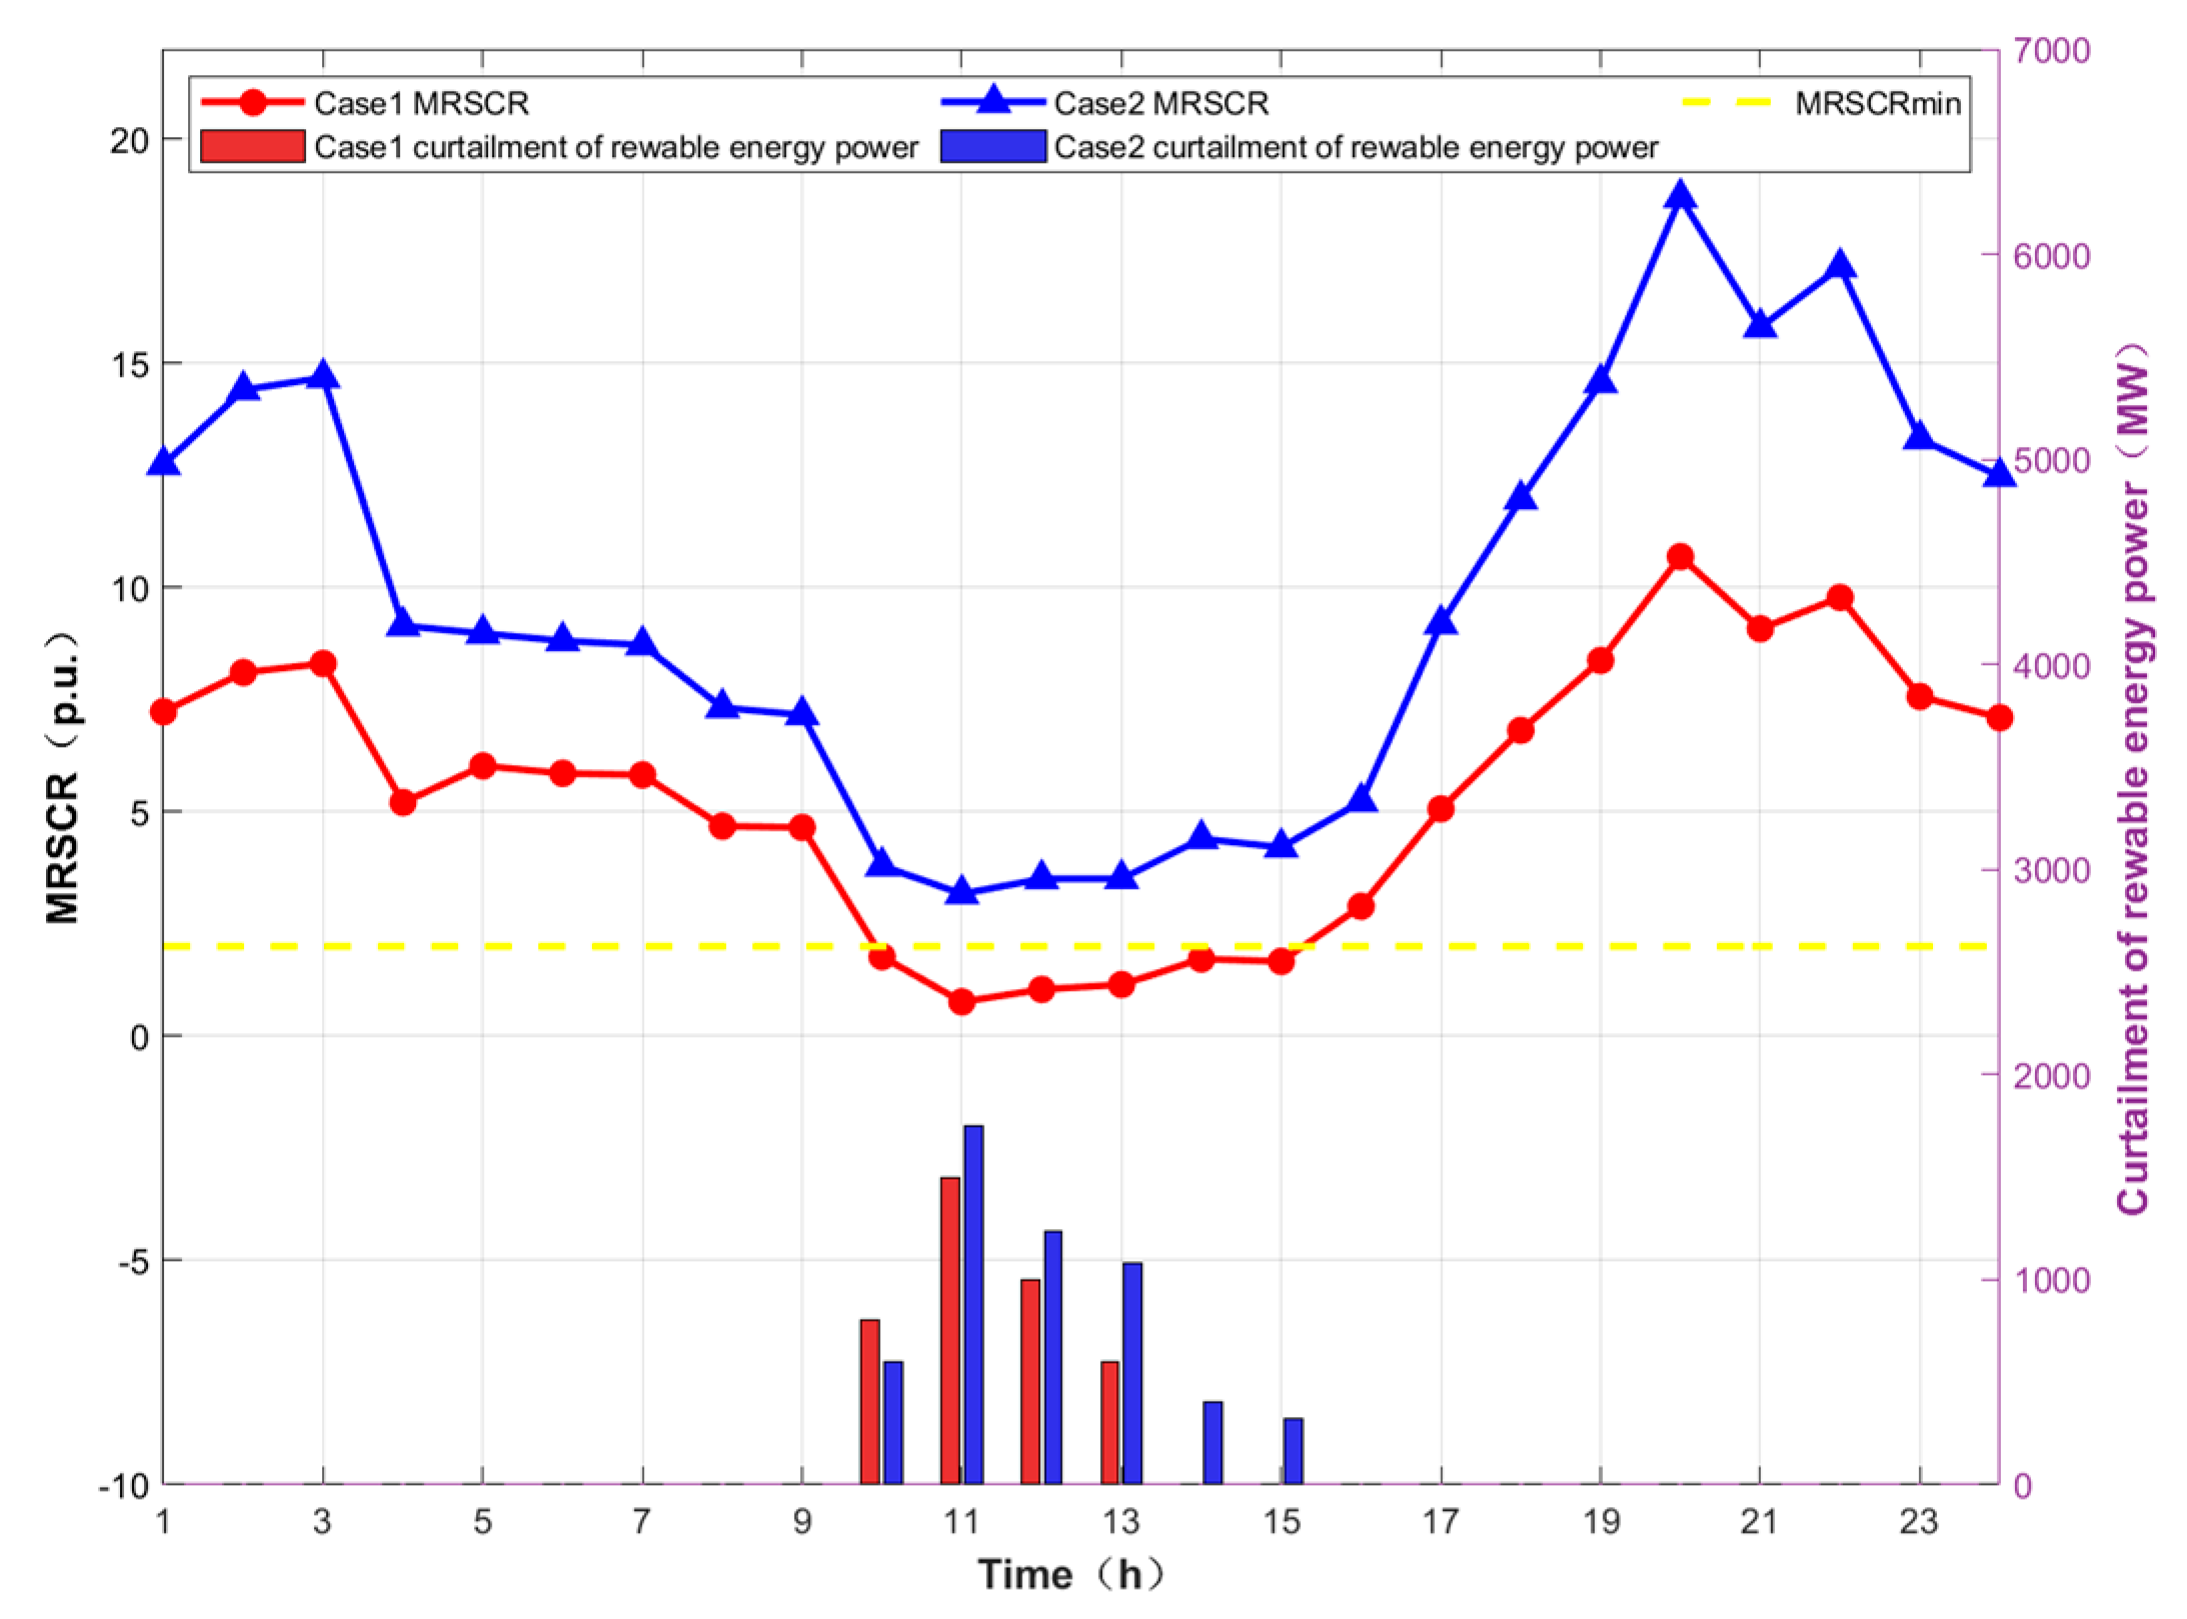
As shown in Figure 18, compared with Case 1, Case 2 ensures that no system voltage safety indicators exceed limits in any time period while having a smaller impact on the effective integration of renewable energy, thereby fully demonstrating the effectiveness of the proposed voltage security constraint in a larger-scale provincial network case.

4. Conclusions

This paper proposes a MRSCR index to quantify the voltage support strength of high-renewable power system, and embeds it as a voltage security constraint in the unit commitment model, enabling coordinated optimization among synchronous generators, energy storage, and renewable generation.
(1)
Compared with traditional voltage-support indices that usually focus on the influence of a single type of device—such as renewable generators, synchronous units, or static synchronous compensators—the proposed MRSCR index simultaneously considers the coordinated impact of multiple resources, including synchronous generators, renewable units, grid-following storage, and grid-forming energy storage.
(2)
By reflecting the coordinated voltage contribution of heterogeneous resources, the MRSCR-based optimization enables the system to achieve higher levels of renewable energy accommodation while maintaining voltage security. This supports a more balanced integration of economic efficiency and stability in high-renewable systems.
(3)
Through comprehensive case studies, we analyzed the voltage support performance of different energy storage types and demonstrated that embedding the MRSCR index into the energy storage planning and scheduling framework significantly improves the accuracy of siting and operational decisions.
The study provides a theoretical foundation and engineering practice pathways for voltage security and energy storage planning under dual-high power systems. However, in future work, the energy storage planning framework based on MRSCR needs to be further enhanced, using stochastic or robust optimization methods to fully capture the high-impact, low-probability events that pose the greatest threat to voltage security (such as periods of simultaneously high wind and high solar output).

Author Contributions

Methodology, H.J. and X.A.; Validation, J.H. and T.H.; Resources, H.J. and J.H.; Data curation, J.H. and J.W.; Writing—original draft, H.J., L.L. and T.H.; Writing—review & editing, H.J., J.H., J.W. and X.A. All authors have read and agreed to the published version of the manuscript.

Funding

This work was supported by the National Natural Science Foundation of China (Agent-based modeling and analysis on evolution of the energy technology system for alternative fuel vehicles, Grant No. 72131007).

Data Availability Statement

The data presented in this study are available on request from the corresponding author. The data are not publicly available due to ongoing analyses for further studies.

Conflicts of Interest

Author Han Jiang, Jinming Hou and Jiawei Wu were employed by the Global Energy Interconnection Group Co., Ltd. The remaining authors declare that the research was conducted in the absence of any commercial or financial relationships that could be construed as a potential conflict of interest.

Abbreviations

The following abbreviations are used in this manuscript:
RERenewable energy
PVPhotovoltaic
NDRCNational Development and Reform Commission
NEANational Energy Administration
SCRShort-circuit ratio
CIGREInternational Council on Large Electric systems
NERCNorth American Electric Reliability Corporation
AEMOAustralian Energy Market Operator
MISCRMulti-infeed short circuit ratio
PDSCRPosition-dependent short circuit ratio
ESCREquivalent short circuit ratio
SCRIFShort-circuit ratio with interaction factor
GSCRGeneralized short circuit ratio
MRSCRMulti-renewable-station short circuit ratio
PCSPower conversion system
PCCPoint of common coupling
PLLPhase-locked loop
MIIFMulti-infeed interaction factors

References

  1. Zhuo, Z.; Du, E.; Zhang, N.; Nielsen, C.P.; Lu, X.; Xiao, J.; Wu, J.; Kang, C. Cost increase in the electricity supply to achieve carbon neutrality in China. Nat. Commun. 2022, 13, 3172. [Google Scholar] [CrossRef]
  2. IPCC. Global Warming of 1.5 °C; IPCC: Geneva, Switzerland, 2018. [Google Scholar]
  3. IRENA. Global Energy Transformation: A Roadmap to 2050; IRENA: Abu Dhabi, United Arab Emirates, 2018. [Google Scholar]
  4. Global Energy Interconnection Development and Cooperation Organization. The Road to Global Carbon Neutrality; China Electric Power Press: Yangzhou, China, 2021. [Google Scholar]
  5. Sun, W.; Xiao, J.; Hou, J.; Jin, C.; Nie, Y. Investment Cost Forecasting for Low Carbon Power System Planning Considering Technical Progress and Scale Effect. IEEE Access 2022, 10, 114153–114164. [Google Scholar] [CrossRef]
  6. Hou, J.; Sun, W.; Xiao, J.; Jin, C.; Du, E.; Huang, J. Collaborative Optimization of Key Technology Progress and Low Carbon Transition of Power System. Autom. Electr. Power Syst. 2022, 46, 1–9. (In Chinese) [Google Scholar]
  7. Global Energy Interconnection Development and Cooperation Organization. Research on Asian Renewable Energy Development and Investment; China Electric Power Press: Yangzhou, China, 2020. [Google Scholar]
  8. Wu, J.; Xiao, J.; Hou, J.; Lyu, X. Development Potential Assessment for Wind and Photovoltaic Power Energy Resources in the Main Desert-Gobi-Wilderness Areas of China. Energies 2023, 16, 4559. [Google Scholar] [CrossRef]
  9. China’s New Climate and Energy Targets Toward 2035 Announced at the UN Climate Summit. Reuters. 2025. Available online: https://www.reuters.com/sustainability/cop/chinas-xi-announces-new-climate-targets-2025-09-24/ (accessed on 26 September 2025).
  10. Wu, H. Continuous policy support and continuous heating up of scenic large base construction. New Energy Sci. Technol. 2022, 35–36. [Google Scholar]
  11. Chen, D.; Li, S. Exploring the pathway to carbon neutrality in China based on a dynamic spatial Durbin quantile regression model. Sci. Rep. 2025, 15, 17442. [Google Scholar] [CrossRef] [PubMed]
  12. Shi, Q.; Li, F.; Cui, H. Analytical method to aggregate multi-machine SFR model with applications in power system dynamic studies. IEEE Trans. Power Syst. 2018, 33, 6355–6367. [Google Scholar] [CrossRef]
  13. Zhang, Z.; Du, E.; Teng, F.; Zhang, N.; Kang, C. Modeling frequency dynamics in unit commitment with a high share of renewable energy. IEEE Trans. Power Syst. 2020, 35, 4383–4395. [Google Scholar] [CrossRef]
  14. Zhang, Y.; Wu, S.; Lin, J.; Wu, Q.; Shen, C.; Liu, F. Frequency reserve allocation of large-scale RES considering decision-dependent uncertainties. IEEE Trans. Sustain. Energy 2023, 15, 339–354. [Google Scholar] [CrossRef]
  15. Zhou, L.; Xin, H.; Ju, P. System Strength Quantification Principle and Method of Multi-infeed Systems Based on Generalized Short-circuit Ratio: Reviews, Discussions and Outlooks. Proc. Chin. Soc. Electr. Eng. 2023, 43, 3794–3811. [Google Scholar]
  16. GB 38755-2019; Code on Security and Stability for Power System. Standardization Administration of the People’s Republic of China: Beijing, China, 2020. (In Chinese)
  17. IEEE. IEEE Std 2800-2022 IEEE Standard for Interconnection and Interoperability of Inverter-Based Resources (IBRs) Interconnecting with Associated Transmission Electric Power Systems; IEEE: New York, NY, USA, 2022. [Google Scholar]
  18. Davies, J.B. Systems with multiple DC infeed. Electra 2007, 233, 14–19. [Google Scholar]
  19. NERC. Integrating Inverter-Based Resources into Low Short Circuit Strength Systems; NERC: Atlanta, GA, USA, 2017. [Google Scholar]
  20. Australian Energy Market Operator. System Strength Requirements & Fault Level Shortfalls; Australian Energy Market Operator: Melbourne, VIC, Australia, 2018. [Google Scholar]
  21. Yu, L.; Sun, H.; Xu, S.; Zhao, B.; Zhang, J.; Li, Z. Overview of strength quantification indexes of power system with power electronic equipment. Proc. CSEE 2022, 42, 499–515. [Google Scholar]
  22. Hui, Y.; Huanhai, X.; Guanzhong, W. Analysis on oscillation of multi-infeed system with renewable energy and static var generator and calculation of its generalized short-circuit ratio. Autom. Electr. Power Syst. 2021, 45, 38–46. [Google Scholar]
  23. Kang, S.; Dong, W.; Guo, S. Critical short-circuit ratio of small-signal stability for a grid- connected renewable power generation system based on virtual synchronous generator control. Electr. Power Constr. 2022, 43, 131–140. [Google Scholar]
  24. Xu, X.; Mou, T.; Jia, L.; Jiang, C.; Gao, X.; Liu, C. Practical criteria of static voltage stability in power systems with high wind penetration. Autom. Electr. Power Syst. 2014, 38, 15–19. [Google Scholar]
  25. CIGRE. CIGRE Working Group B4.41. In Systems with Multiple DC Infeed; CIGRE: Paris, France, 2008. [Google Scholar]
  26. Wu, D.; Li, G.; Javadi, M.; Malyscheff, A.M.; Hong, M.; Jiang, J.N. Assessing Impact of Renewable Energy Integration on System Strength Using Site-Dependent Short Circuit Ratio. IEEE Trans. Sustain. Energy 2018, 9, 1072–1080. [Google Scholar] [CrossRef]
  27. John, B. Connection of Wind Farms to Weak AC Networks; CIGRE: Paris, France, 2016. [Google Scholar]
  28. Xin, H.; Dong, W.; Gan, D.; Di, W.; Yuan, X. Generalized Short Circuit Ratio for Multi Power Electronic Based Devices Infeed to Power Systems. Proc. Chin. Soc. Electr. Eng. 2016, 36, 6013–6027. [Google Scholar]
  29. Xin, H.; Gan, D.; Ju, P. Generalized Short Circuit Ratio of Power Systems with Multiple Power Electronic Devices: Analysis for Various Renewable Power Generations. Proc. Chin. Soc. Electr. Eng. 2020, 40, 5516–5527. [Google Scholar]
  30. Yang, L.; Cui, Y. Voltage stability analysis for Shanghai metropolitan grid with high-level power import and scale-reduced online units. East China Electr. Power 2014, 42, 2755–2757. [Google Scholar]
  31. Zhang, H.; Liu, F.; Li, W. Minimum startup method of a DC near-field thermal power unit based on a unit voltage supporting effect. Power Syst. Prot. Control 2020, 48, 141–147. [Google Scholar]
  32. Niu, S.B.; Ke, X.B.; Ren, C.; Huo, C.; Wang, Z.W.; Zhang, G.; Wei, L. Optimal method of operation modes for large-scale new energy DC sending-end power grid based on short circuit capacity quantitative assessment. Electr. Power Autom. Equip. 2021, 41, 123–129. [Google Scholar]
  33. Qin, J.; Li, H.; Sun, Y.; Wang, H. Optimal method of minimum start-up mode for conventional units considering new energy limit grid-connection strength constraint. Power Syst. Prot. Control 2023, 51, 127–135. [Google Scholar]
  34. Chen, G.; Wu, W.; Dai, Z.; Xu, Z.; Zhang, Y.; He, S. Multi-objective Optimization of Regional Reactive Power Reserve in Hybrid System with Wind, Photovoltaic and Energy Storage Considering Fault Scenario Set. Autom. Electr. Power Syst. 2022, 46, 194–204. [Google Scholar]
  35. Liu, Y.; Yao, L.; Liao, S. Transient Voltage Control of Distribution Network in Near-zone of DC Receiving End with Distributed Photovoltaics and Energy Storage Participated. Power Syst. Technol. 2023, 47, 1250–1261. [Google Scholar]
  36. Jalali, A.; Aldeen, M. Risk-based stochastic allocation of ESS to ensure voltage stability margin for distribution systems. IEEE Trans. Power Syst. 2019, 34, 1264–1277. [Google Scholar] [CrossRef]
  37. Sun, H.; Xu, S.; Xu, T.; Guo, Q.; He, J.; Zhao, B.; Zhu, Y. Definition and Index of Short Circuit Ratio for Multiple Renewable Energy Stations. Proc. Chin. Soc. Electr. Eng. 2021, 41, 497–506. [Google Scholar]
  38. Sun, H.; Zhao, B.; Xu, S.; Yu, L.; Wang, B.; Li, W. Definition, Classification, and Analysis Method of the Strength of Power System Integrated with High Penetration of Power Electronics. Proc. Chin. Soc. Electr. Eng. 2024, 44, 7039–7049. [Google Scholar]
  39. Wei, K. Energy Storage Planning Method for Improving Security and Stability of Multi-infeed Receiving-End System; North China Electric Power University: Beijing, China, 2023. [Google Scholar]
Figure 1. Changes in the installed scale of wind power and photovoltaic power generation in China in the past six years.
Energies 18 06597 g001
Figure 2. Simplified model of an AC system connected with multiple renewable energy plants.
Energies 18 06597 g002
Figure 3. Equivalent circuit diagram of short circuit faults.
Energies 18 06597 g003
Figure 4. Control block diagram of grid-following storage.
Energies 18 06597 g004
Figure 5. Control block diagram of grid-forming energy storage.
Energies 18 06597 g005
Figure 6. Modified IEEE 14-bus system.
Energies 18 06597 g006
Figure 7. Total system load and renewable power output curves.
Energies 18 06597 g007
Figure 8. Schematic diagram of energy storage siting planning.
Energies 18 06597 g008
Figure 9. Node MRSCR during each time period.
Energies 18 06597 g009
Figure 10. Schematic diagram of the start-up and shut-down schedule for the synchronous generating units in Case 1 (a) and Case 2 (b).
Energies 18 06597 g010
Figure 11. System Output Profiles under Case 1 (a), Case 2 (b), and Case 3 (c).
Energies 18 06597 g011
Figure 12. Schematic diagram of system wind curtailment (a) and solar curtailment (b) power during each time period.
Energies 18 06597 g012
Figure 13. Schematic diagram of energy storage siting planning.
Energies 18 06597 g013
Figure 14. Schematic diagram of the influence of control coefficients for Case 1 (a) and Case 2 (b).
Energies 18 06597 g014
Figure 15. Schematic diagram of the 750 kV grid structure in a province in Northwest China.
Energies 18 06597 g015
Figure 16. Schematic diagram of the proportion of installed power capacity in the system.
Energies 18 06597 g016
Figure 17. Typical daily renewable energy output curves in region A and region B across the four seasons.
Energies 18 06597 g017
Figure 18. Node MRSCR index during each time period.
Energies 18 06597 g018
Table 1. Generator parameters.
GeneratorG1G2G3G4G5W1W2S1S2
Capacity/MW10010060504090907070
Minimum Output/MW2020121080000
Minimum On/Off Time/h88888----
Table 2. Simulation results of the modified IEEE 14-bus system case.
Case 1Case 2Case 3
Average Daily Total Cost/105 ¥3.14263.34683.5748
Total Planning Cost/105 ¥0.28800.19200.1440
Operating Cost/105 ¥2.85463.15483.3308
Wind Curtailment Rate/%0.003.6018.12
Solar Curtailment Rate/%0.005.3013.46
Energy Storage Planning Scheme (Node, Installed Capacity/MWh)2, 40
3, 40
4, 40
2, 20
3, 40
4, 20
2, 20
3, 20
4, 20
Table 3. Simulation results of the modified IEEE 14-bus system case.
Case 1Case 2
Average Daily Total Cost/105 ¥3.68203.4294
Total Planning Cost/105 ¥0.45870.2082
Operating Cost/105 ¥3.22333.2212
Wind Curtailment Rate/%0.000.00
Solar Curtailment Rate/%3.082.41
Energy Storage Planning Scheme (Node, Installed Capacity/MWh)2, 45
3, 50
6, 50
8, 20
2, 60
3, 20
Table 4. Simulation results of the provincial power system case.
Case 1Case 2
Average Daily Total Cost/107 ¥6.125416.45894
Total Planning Cost/107 ¥0.419750.56850
Operating Cost/107 ¥5.705665.89044
Wind Curtailment Rate/%6.516.43
Solar Curtailment Rate/%7.709.16
Energy Storage Planning Scheme (Node, Installed Capacity/MWh)2, 1400
3, 800
31, 1400
53, 1400
2, 1400
3, 600
13, 600
31, 1200
33, 600
44, 1000
53, 800
59, 600
Disclaimer/Publisher’s Note: The statements, opinions and data contained in all publications are solely those of the individual author(s) and contributor(s) and not of MDPI and/or the editor(s). MDPI and/or the editor(s) disclaim responsibility for any injury to people or property resulting from any ideas, methods, instructions or products referred to in the content.