Article

Life Cycle Environmental Impact Assessment of Offshore Wind Power Combined with Hydrogen Energy Storage System

1
Energy Development Research Institute, China Southern Power Grid, Guangzhou 510663, China
2
Power Grid Planning Research Center, Guangxi Power Grid, Nanning 530021, China
3
China-EU Institute for Clean and Renewable Energy, Huazhong University of Science and Technology, Wuhan 430074, China
4
School of Energy and Power Engineering, Huazhong University of Science and Technology, Wuhan 430074, China
*
Authors to whom correspondence should be addressed.
Energies 2025, 18(23), 6279; https://doi.org/10.3390/en18236279
Submission received: 29 August 2025 / Revised: 17 November 2025 / Accepted: 26 November 2025 / Published: 28 November 2025
(This article belongs to the Special Issue Recent Advances in Renewable Energy and Hydrogen Technologies)

Abstract

To achieve carbon neutrality goals, offshore wind power combined with a hydrogen energy storage system (OWP-HESS) is critical for integrating intermittent renewables. This study applied a “cradle-to-grave” process-based life cycle assessment (PLCA) to evaluate a 77.4 MW offshore wind farm coupled with a 45.0 MW electrolysis cell system, covering manufacture, transportation, construction, operation and maintenance, and decommissioning phases. It focuses on two hydrogen production routes, alkaline electrolysis (AEL) and proton exchange membrane (PEM), and covers 12 environmental indicators. Moreover, considering optimal economic efficiency, to adapt to the characteristic of “electricity–hydrogen cogeneration”, as well as to facilitate reflecting the efficiency differences between the two electrolysis technologies, the functional unit is defined as “0.4 kWh green electricity + corresponding green hydrogen”. Results show that offshore wind’s environmental impacts mainly come from manufacture (79.00%, driven by concrete/steel), while hydrogen storage impacts focus on operation/maintenance (66.03% for AEL and 96.61% for PEM, driven by electricity). PEM’s green hydrogen global warming potential (GWP) (0.96 kg CO2-eq/kg) is much lower than AEL’s (1.81 kg CO2-eq/kg) and China’s fossil-based hydrogen (≈40 kg CO2-eq/kg). With an initial system lifespan of 25 years, a wind farm capacity factor of 41.30%, and a hydrogen production efficiency of 68.72% (AEL) and 69.89% (PEM), extending system lifespan by 5 years, raising wind farm capacity factor to 43%, and enhancing hydrogen production efficiency to 71% reduce emissions by 16.67%, 4.00%, and 2.16%, respectively. This study clarifies OWP-HESS’s environmental characteristics, confirms PEM’s low-carbon advantage, and provides support for its sustainable development.

1. Introduction

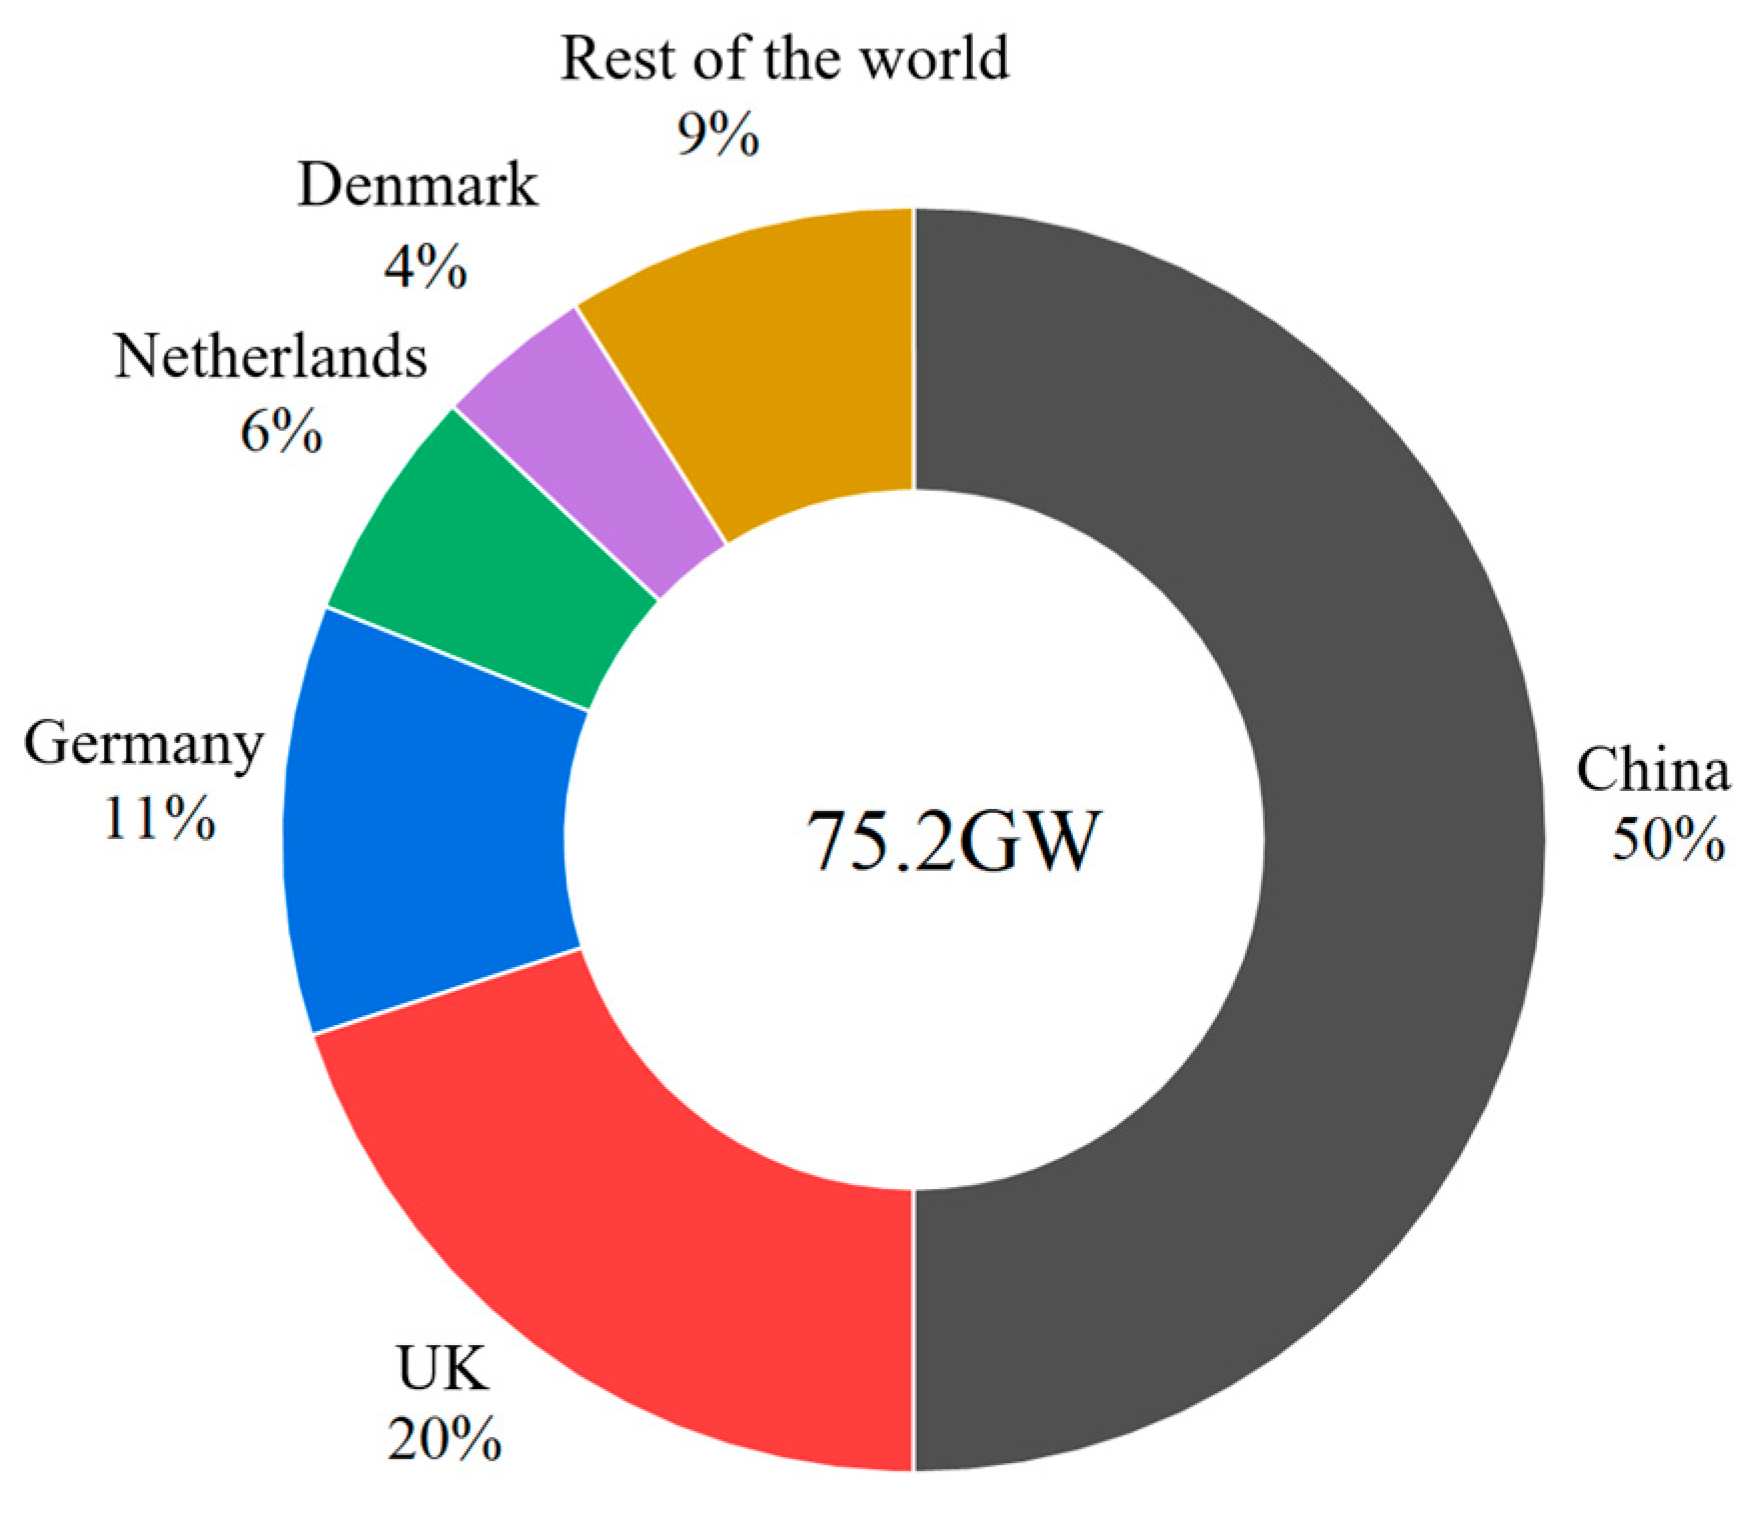
To mitigate the adverse impacts of climate change and meet the Paris Agreement’s goals, it is imperative for governments worldwide to transition towards sustainable energy systems. Carbon emissions from China’s power industry account for more than 50% of the country’s total emissions, under China’s dual-carbon targets; with the core milestones of peaking CO2 emissions by 2030 and achieving carbon neutrality by 2060 [1], to relieve power supply pressure during the energy transition, the Chinese government underlines the importance of energetically developing wind power, developing hydrogen energy in accordance with local conditions, and accelerating research and development of energy storage technologies. Wind energy is a widely accessible and renewable energy source with huge reserves, global distribution, and a long history of development and utilization. Theoretical reserves far exceed global power demand [2]. Offshore wind power provides several advantages over typical onshore wind power, including higher wind speeds, more steady output, and greater single-unit capacity. In China, it also has the advantage of being close to the load center (specifically the population centers of Eastern China), which has resulted in a significant rise in installed capacity in recent years. As illustrated in Figure 1, global total installed offshore wind capacity reached 75.2 gigawatts (GW) in 2023. China accounted for 50% of major markets, solidifying its position as the world’s largest and fastest-growing offshore wind power market. Looking ahead, offshore wind power will grow increasingly critical in China’s energy system, its importance growing more pronounced in the coming years.
In order to make offshore wind power a reliable and dependable source of electricity, the combination of offshore wind power and large-scale energy storage technology can effectively mitigate the impacts caused by the volatility, randomness, and intermittency of offshore wind power [3]. Therefore, large-scale energy storage technology is a key element in the structural reform of the energy sector to help clean and renewable energy sources with unstable output.
Hydrogen energy is green and clean, but it takes significant energy to produce. Therefore, the improvement of green hydrogen production via water electrolysis is an urgent problem. Due to the advantages of high energy density per mass, long storage time, and fast response time, hydrogen energy storage is regarded as a way to couple large-scale, unstable renewable energy with grid-connected power generation [4]. Under the premise of guaranteeing rated power supply to the grid when required, hydrogen is produced using fluctuating excess wind power that the grid cannot absorb. This realizes hydrogen storage and utilization instead of other passive storage methods. The hydrogen produced is green hydrogen, which is specifically used for electricity generation via hydrogen fuel cells or hydrogen gas turbines; this aligns with the offshore wind farm’s dual power supply model—direct grid supply and indirect supply via electrolysis–hydrogen storage.
To sum up, complementarity is the way forward for the common development of multiple clean and renewable energy sources. Coupling offshore wind power and hydrogen energy storage to form a complete joint energy supply system can effectively solve the respective problems of offshore wind power and hydrogen energy. OWP-HESS can reduce resource waste, improve energy quality, and promote the development of green hydrogen. However, OWP-HESS consumes more resources in the process of manufacture and construction than a standalone offshore wind farm without hydrogen energy storage, and the life cycle environmental impact of this system should not be ignored. Therefore, studying the life cycle environmental impacts of OWP-HESS and identifying the key impacts are of great theoretical and practical significance for their sustainable development. Liu et al. [5] conceived an integrated system of offshore wind power, seawater electrolysis-based hydrogen production, and salt cavern hydrogen storage, which achieves the efficient utilization of renewable energy as well as the integrated operation of hydrogen production and storage, and not only opens up a new way to promote the development of renewable energy for the coastal cities, but also points to a new direction of the technological advancement in the field of hydrogen energy.
For offshore wind power and hydrogen energy, Duan and Bu [6] proposed a new cloud stochastic framework to optimize the placement and sizing of hydrogen storage-based fuel cells. Luo et al. [7] investigated methods for hydrogen production from offshore wind power, including alkaline electrolysis (AEL), proton exchange membrane (PEM), and solid oxide electrolysis cell (SOEC) methods. Gao et al. [8] proposed a low-carbon energy scheduling model for integrated energy systems that takes into account dynamic hydrogen blending and offshore wind power hydrogen production. Song et al. [9] conducted a feasibility study on a Sino-Japanese supply chain for hydrogen production from offshore wind power, and explored the possibility of utilizing offshore wind power as a significant source of electrolytic hydrogen production in China. Wang et al. [10] presented an approach that relies on the development of whole wind farm modeling and optimization techniques as well as wind turbine aerodynamic and structural models and associated control strategies. Scolaro and Kittner [11] found that the use of offshore wind for hydrogen production may be well suited for sites with high levels of excess wind power generation in Germany and Denmark, as well as in China, the USA, and other countries. The current status and development trend of domestic and international research shows that the concept of OWP-HESS has been relatively complete. The system covers offshore wind power, electrolysis of water to produce hydrogen, and hydrogen storage and its conversion, and other technology routes have also been developed to varying degrees in recent years; it also and a certain degree of economic efficiency and the prospect of large-scale application. However, among the offshore wind farms that have been put into production, under construction, or in operation at present, there is no case that has adopted this coupled-development technical route. Therefore, it is necessary to further accelerate technical demonstration and transformation to realize commercialization as soon as possible.
In the research of life cycle theory, Choe et al. [12] reviewed the application of Life Cycle Sustainability Assessment (LCSA), its opportunities, challenges, and future. By focusing on traditional LCA methods, dynamic LCA methods, expanding LCA to multidimensional evaluations, and streamlining the methodological framework, Liu et al. [13] looked at the general course of the development of the LCA methodological framework, while further providing valuable insights into the enhancement, optimization, and distinct characteristics of such frameworks. Krishnan et al. compared the environmental impacts of alkaline electrolyzer and proton exchange membrane electrolyzer systems for green hydrogen production. There was no clear winner between the two in terms of environmental impact. A direct transition to green hydrogen may be better than moving from gray to blue hydrogen [14]. The research status and development trends show that life cycle assessment has currently gained widespread recognition. However, it has many deficiencies in deciding system boundaries, data sources, and methods, which hinder its development.
In terms of offshore wind power and hydrogen energy production and storage, Zhang et al. [15] conducted a comprehensive life cycle evaluation of the three main electrolytic water hydrogen production technologies, AEL, PEM, and SOEC. These technologies were analyzed in the context of integrating onshore and offshore wind power sources. Noh et al. [16] used LCA to analyze the environmental impacts and energy efficiency of offshore hydrogen supply chains tied to offshore wind farms (encompassing hydrogen conversion, transport to onshore facilities, and liquid H2 storage), finding that longer transport distances sharply reduce chain efficiency. Ghandehariun and Kumar [17] found that wind power generation is the most sensitive to the overall greenhouse gas emission uncertainty. Cao et al. [18] evaluated the integrated environmental impacts, hotspots, and dynamic emission reduction effects of hybrid composite blades from offshore wind farms in China. Davies and Hastings [19] showed that blue hydrogen is unlikely to contribute to any GHG emission reduction. Hassan et al. [20] provided a review of the current state of the art in research on the production of green hydrogen by electrolysis of water and life cycle evaluation. Henriksen et al. [21] pointed out that complementary research on hydrogen production excludes upstream water treatment considerations.
In summary, life cycle research in offshore wind and hydrogen energy has become a hot research topic in recent years, and a series of research results have been achieved. However, there are still problems such as incomplete research and insufficient data when combining the two within the full life cycle scale. Therefore, there is an urgent need for further in-depth research on offshore wind–hydrogen storage coupled energy supply systems.
To fill the research gap as mentioned above, this study takes the OWP-HESS as the research object and evaluates the life cycle environmental impact of the OWP-HESS and the economy of the system. The first step is to obtain the main structure of the OWP-HESS and identify the optimal model; model building is carried out to analyze the results of the life cycle environmental impacts, identify the key impact parameters, and carry out a sensitivity analysis of these parameters, as well as realizing system optimization. Finally, conclusions are drawn based on the comprehensively assessed environmental impacts and economic benefits.

2. Materials and Methods

2.1. Model Building

In the assessment of environmental impacts within the life cycle, LCA analysis summarizes and evaluates the impacts on the environment caused by all material flows of inputs and outputs, which include both direct and indirect impacts [22]. Economic Input–Output Life Cycle Assessment (EIO-LCA), as a top–down life cycle analysis tool, combines the characteristics of both LCA and Economic Input–Output (EIO) methods, derives the level of resource and energy consumption and emissions from the input–output table of the research object, and establishes the correspondence between the research object and each sector for evaluation. Process-based life cycle assessment (PLCA) is a bottom–up life cycle analysis tool; the method is more targeted and more accurate in analyzing the life cycle environmental impacts of the study object [23]. Its relevance and accuracy are higher than EIO-LCA. In this study, the OWP-HESS is selected as the research object, and the PLCA method is adopted to evaluate the environmental impacts of green electricity and green hydrogen produced by the OWP-HESS, using a cradle-to-gate life cycle assessment approach.
The inputs and outputs of each material flow can be directly accounted for in life cycle inventory analysis using the raw material data, or the data can be unitized to more visually characterize the inputs and outputs of the material flows relevant to each functional unit. For this investigation, the latter representation is chosen. The link between installed wind power capacity and total power generation must be utilized for computing the total power generation across the life cycle for further unitization.
E = C F × P × T
where  E  is the total life cycle power generation,  C F  is the capacity factor,  P  is the installed capacity, and  T  is the total life cycle lifetime.
To achieve the maximum economic benefits under current market prices, Li et al. [24] report that for a 300 MW rated-capacity offshore wind farm operating in a multi-energy islanded mode, the electrolyzer capacity corresponding to the optimal system configuration is approximately 180 MW. Based on this, a 60% hydrogen production ratio is employed in this study, and the total life-cycle hydrogen production is calculated as follows:
H = 60 % × P × T × η × W t h e o r y
where  H  denotes the total life cycle hydrogen production,  P  denotes the installed capacity of offshore wind power,  T  denotes the total life cycle lifetime,  η  denotes the hydrogen production efficiency of electrolyzed water, and  W t h e o r y  (a fixed constant) denotes the theoretical hydrogen production energy consumption.
It is necessary to assume a model connecting offshore wind power and hydrogen generation from electrolyzed water because there is no real example of an offshore wind–hydrogen storage system in operation. The material flow of the hydrogen production system must be scaled using a scaling factor to generate a life cycle inventory of the needed installed capacity in order to match it. Böhm et al. [25] found that the electrolysis cell’s scale factor (SF) in the electrolytic water-to-hydrogen system could reach 0.88, while Zhang et al. [26] found that the Balance of Plant (BoP) SF in the electrolytic water-to-hydrogen system could reach 0.7. These SF values are used in Equation (3) to scale material flows (e.g., raw material consumption) from small-scale electrolysis/BoP systems reported in the literature to the electrolyzer capacity in this study.
C j C i = X j X i S F
where  C i  denotes the mass of material flow in system  i C j  denotes the mass of material flow in system  j X i  denotes the installed capacity of system  i X j  denotes the installed capacity of system  j , and  S F  denotes the scaling factor.
As defined by the ISO 14040:2006 and 14044:2006 standards, LCA provides a systematic procedure for identifying, quantifying, and comparing environmental impacts across the full life cycle of products and services, from resource extraction to final disposal [22,27]. The specific indexes include the following 12 types, as indicated in Table 1.
In order to derive the characterization results for each EIA indicator, it is necessary to introduce the characterization factor. The calculation formula is:
E I P j = E I P j , i = ( M i × C F j , i )
where  E I P j  denotes the characterization result of the  j th environmental impact assessment index of the research object, and the unit is kg reference equivalent.  E I P j , i  denotes the contribution value of the  i th material flow of input and output to the  j th environmental impact assessment index, and the unit is kg reference equivalent.  M i  denotes the mass of the ith material flow of input and output, and the unit is kg.  C F j , i  denotes the characterization factor of the  i th material flow of input and output to the jth environmental impact evaluation index, which is a dimensionless parameter.
Let us consider the  G W P , which has a time period of 100 years.
G W P = G W P i = ( M i × C F G W P , i )
where  G W P  denotes the characterization result of the global warming potential (GWP) of the research object in kg CO2 equivalent,  G W P i  denotes the contribution value of the ith material flow of the inputs and outputs to GWP in kg CO2 equivalent, and  M i  denotes the mass of the ith material flow of the inputs and outputs in kg.  C F G W P , i  denotes the characterization factor of the  i th material flow of input and output to GWP, which is a dimensionless parameter.
To assess the relative environmental impacts of the research object, a normalized baseline value is introduced to normalize each environmental impact assessment (EIA) indicator to a dimensionless form. This process yields the normalized results of the EIA, which quantify the research object’s relative environmental impacts over its life cycle with respect to the selected normalized baseline value [25]. The formula for calculation is:
N E I P ( j ) = E I P ( j ) E I R ( j )
where  N E I P ( j )  denotes the normalization result of the  j th EIA indicator of the study object,  E I P ( j )  denotes the characterization result of the  j th EIA indicator, and  E I R ( j )  denotes the normalized baseline value corresponding to the  j th EIA indicator.
In order to estimate the overall environmental impact in life cycle assessment, a weighting factor (WF) must be introduced in order to weigh each EIA indicator independently and produce weighted EIA results. WF shows how serious the EIA indicator’s influence is. The equation is:
W E I ( j ) = W F ( j ) × N E I P ( j )
where  W E I ( j )  denotes the weighted result of the  j th environmental impact assessment (EIA) indicator of the research object,  W F ( j )  denotes the WF for the  j th EIA indicator, and  N E I P ( j )  denotes the normalized result of the  j th EIA indicator.

2.2. Goal and Scope

In this study, the actual case is selected from an offshore wind farm off the coast of Fujian and the electrolysis cell systems of the companies Proton and Hydrogenics. Equation (3) is used to scale up and match the installed capacity of the offshore wind farm and the electrolysis cell. Ultimately, the study object is chosen to be a 77.4 MW offshore wind farm with a 45.0 MW electrolysis cell for an OWP-HESS.
Two functional units are used for offshore wind power generation and hydrogen production and storage, which are treated separately, and finally the electricity–hydrogen combined energy supply unit is used as the functional unit of the whole system. In this study, 1 kWh of green electricity produced by offshore wind farms is selected as the functional unit of the grid-connected offshore wind link. The best system economics are achieved when the installed hydrogen production capacity is 60% of the installed power generation capacity. Offshore wind–hydrogen storage systems produce about 1.08 × 10⁻² kg of green hydrogen while producing 0.4 kWh of green electricity based on the AEL hydrogen route, and about 1.09 × 10⁻² kg of green hydrogen while producing 0.4 kWh of green electricity based on the PEM route, in the case of combined energy supply. Therefore, 0.4 kWh of green power with 1.08 × 10⁻² kg of green hydrogen (AEL) and 0.4 kWh of green power with 1.09 × 10⁻² kg of green hydrogen (PEM) are chosen as the functional quantity of the offshore wind–hydrogen storage system for the two hydrogen production routes. Based on the functional unit defined as “0.4 kWh of green electricity”, this study facilitates a robust comparison of the environmental impact contributions arising from differences in technical routes. The marginal discrepancy in hydrogen production outputs is attributed to the varying efficiencies between alkaline electrolysis (AEL) and proton exchange membrane (PEM) technologies, rather than differences in electricity input. This experimental design enables precise quantification of how technical route variations contribute to overall environmental impacts.
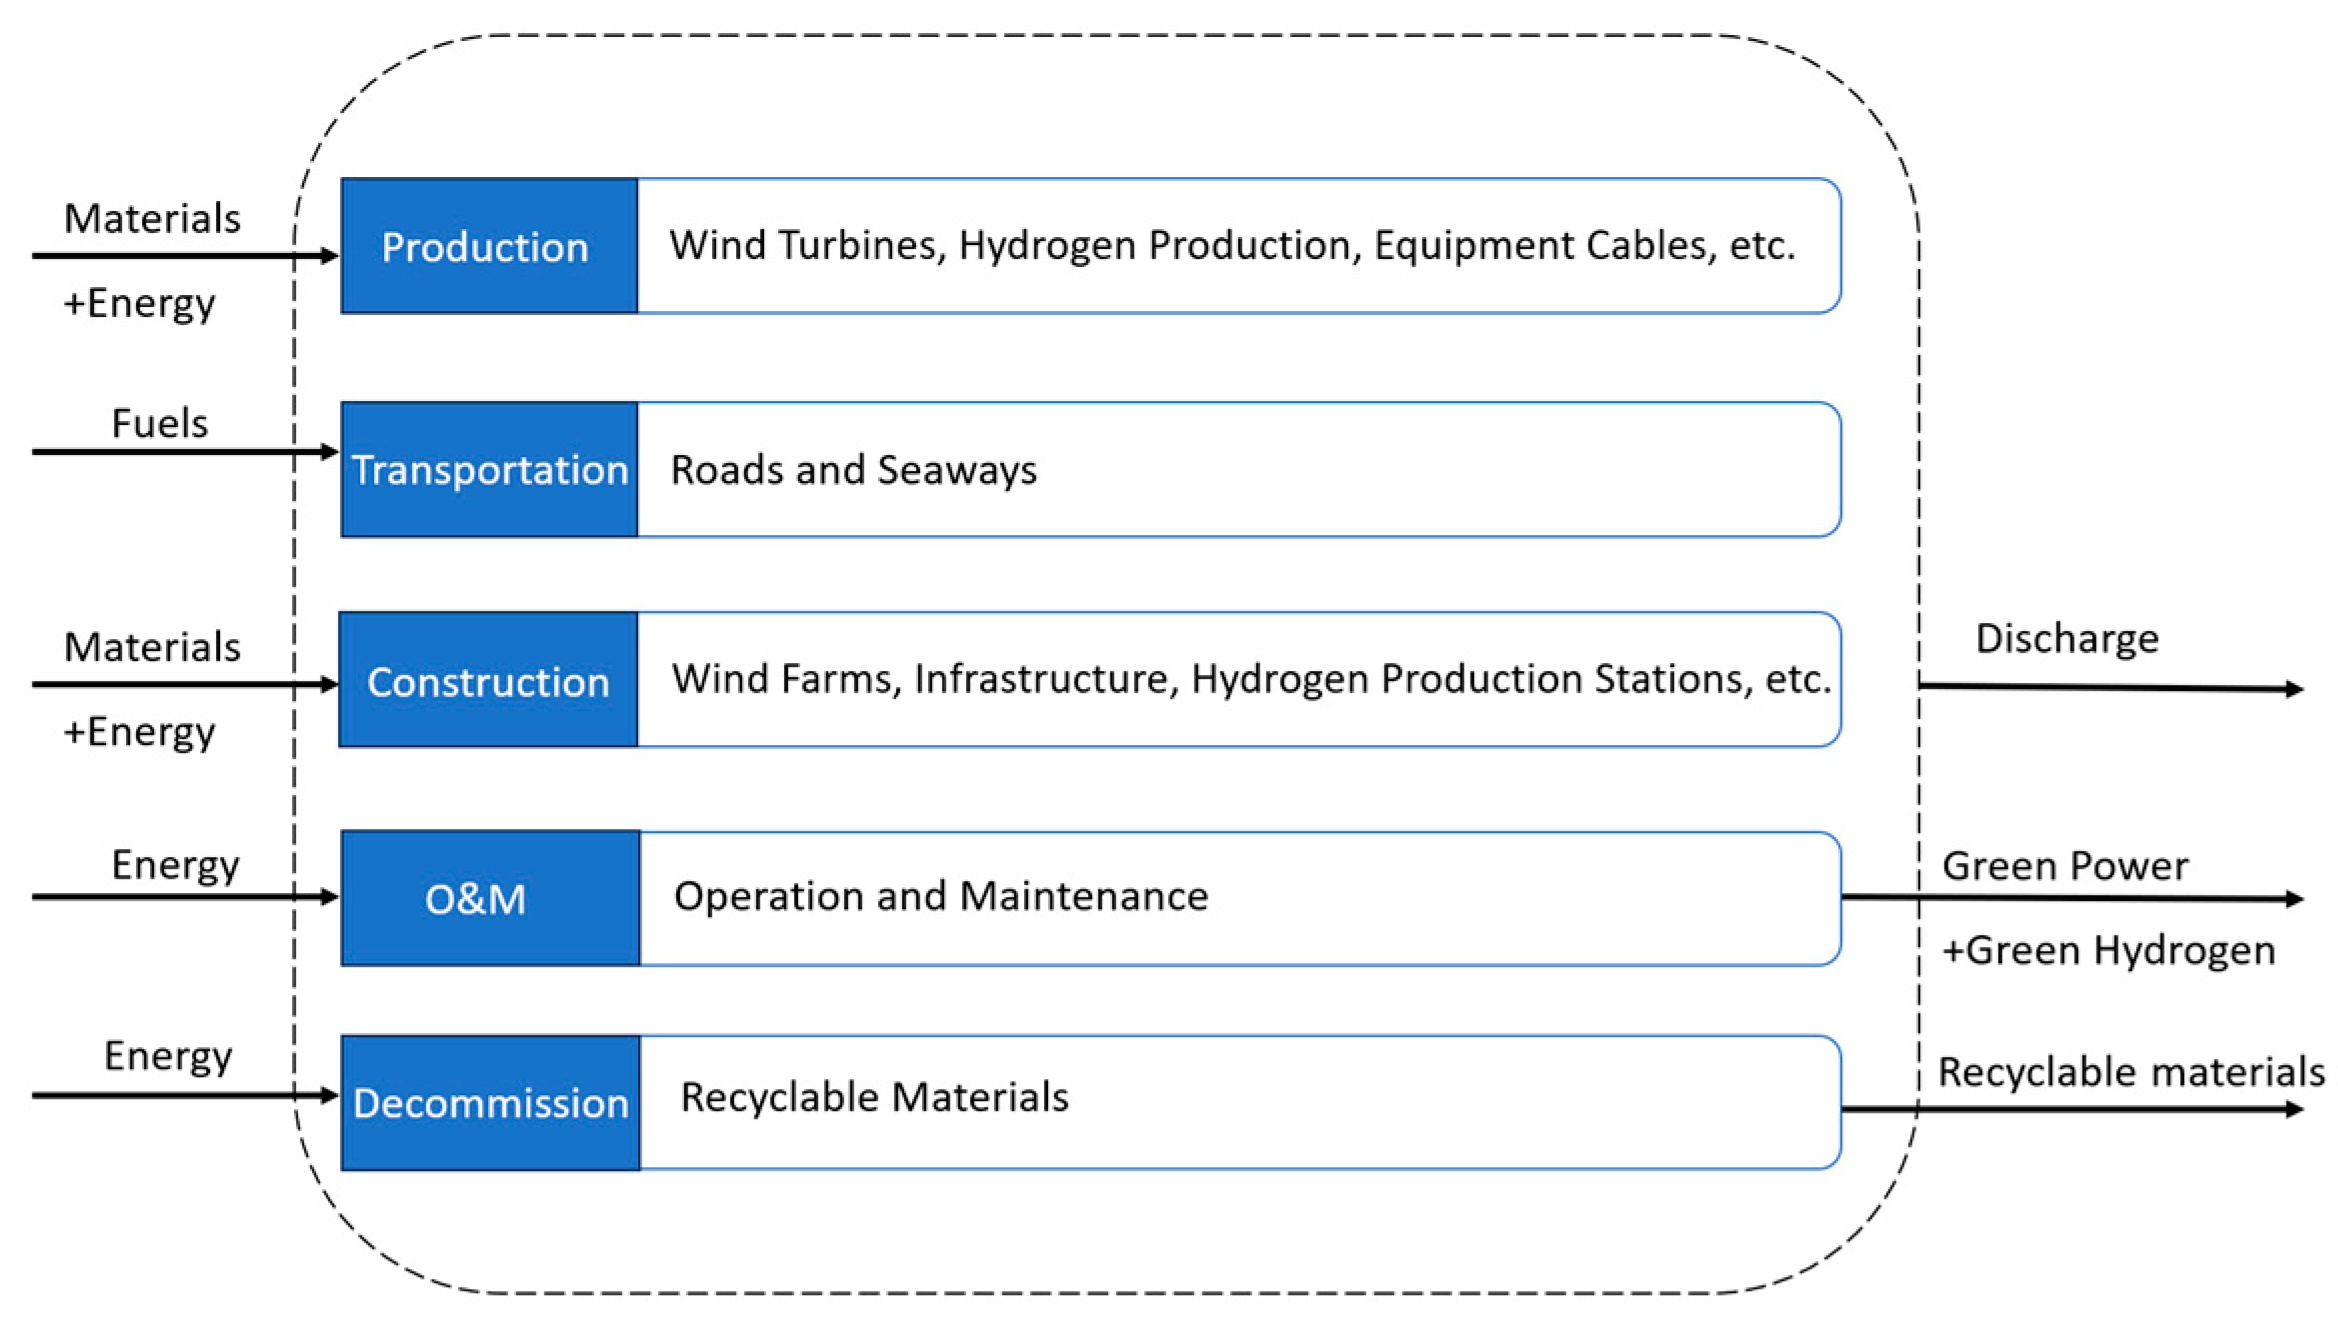
Figure 2 represents the system boundary diagram of the OWP-HESS, with the outer dashed box indicating the system boundary. Five phases are included within the whole system: the manufacture phase of the OWP-HESS equipment, the transport phase of the OWT–HESS equipment, the construction phase of the OWP-HESS, the operation and maintenance phase of the OWP-HESS, and the decommissioning phase of the OWP-HESS. The system boundary considers material, fuel and energy consumption, and direct and indirect emissions for all inputs and outputs during the life cycle. Considering the difficulty and cost of recycling, only the main recyclable materials from the offshore wind farm are recycled, and the lifetime of the offshore wind farm (25 years in total) is used as the time scale of the system boundary.

2.3. Technology Selection

The technical routes of the OWP-HESS are complex; adopting different schemes for each module would lead to excessive model redundancy. Thus, it is necessary to prioritize and focus on routes with high technical maturity and economic viability. The specific module selections are as follows.

2.3.1. Offshore Wind Power Generation and Grid-Connection Modules

Power Transmission Technology: Common wind farms and grid transmission methods include high-voltage alternating current (HVAC) and high-voltage direct current (HVDC) [28]. HVAC is suitable for nearshore wind farms but suffers from high long-distance transmission losses and risks of wind power disconnection during grid faults. HVDC can reduce long-distance losses, and flexible HVDC technology can isolate offshore wind farms from the grid to improve low-voltage ride-through capability. Although HVDC has higher construction costs for short distances, it facilitates batch expansion of wind farms. Combined with the scale (77.4 MW) and offshore distance (3 km) of the wind farm in this study, HVDC transmission is selected.
Grid-Connection Topology: The convergence topology of offshore wind power and onshore grid has three main structures: offshore DC convergence, onshore DC convergence, and onshore multi-terminal DC convergence. HVDC with offshore DC convergence is more suitable for scenarios with fewer wind farms, smaller scales, and shorter offshore distances (matching the wind farm in this study). Therefore, the following scheme is adopted: the offshore converter station converts the power of the wind power cluster to DC in situ, transmits it to the onshore via undersea DC cables, and then inverts it to AC for grid connection.

2.3.2. Hydrogen Production and Storage Modules

Hydrogen Production Technology: There are mainly three hydrogen production technologies based on alkaline electrolysis of water (AEL), proton exchange membrane electrolysis of water (PEM), and solid oxide electrolysis of water (SOEC), with decreasing technological maturity. AEL has high commercialization and low cost but lower environmental friendliness; PEM has developed rapidly in recent years, with higher efficiency (69.89% in this study, slightly higher than AEL’s 68.72%), no pollutant emissions, and its economic feasibility in coupling with wind power has been verified [29]; SOEC is still in the experimental stage with insufficient life cycle inventory data. Thus, only AEL and PEM routes are retained for subsequent environmental impact assessment.
Hydrogen Storage Technology: Comparing high-pressure gaseous hydrogen storage (high material requirements and leakage risks), liquefied hydrogen storage (high refrigeration energy consumption and safety hazards), adsorption hydrogen storage (continuous refrigeration required), and chemical hydrogen storage (e.g., ammonia-mediated), ammonia-mediated chemical hydrogen storage relies on mature storage and transportation infrastructure, avoids the energy consumption and safety issues of other schemes, and is suitable for offshore wind power scenarios [9]. Therefore, ammonia-mediated chemical hydrogen storage is selected.
In summary, based on technical feasibility, economy, and other comprehensive considerations, the advantageous case model selected in this study is HVDC transmission + offshore DC convergence grid-connection + AEL/PEM hydrogen production + ammonia-mediated hydrogen storage.

3. Results and Discussion

3.1. Life Cycle Inventory Analysis

3.1.1. Offshore Wind System

The life cycle inventory of an offshore wind power system contains material flows of inputs and outputs in five phases: manufacture, transport, construction, operation and maintenance, and decommissioning of components such as offshore wind turbines, submarine cables, BoPs, and other auxiliary equipment.
As an example, the offshore wind farm in Xinghua Bay, Fuqing, has a water depth of 5–15 m, and the center of the wind farm location is about 3 km from the coast. Currently, a total of 14 offshore wind turbines with an installed capacity of 5 MW and above from eight manufacturers from all over the world have been installed in this offshore wind farm [30]. The existing installed capacity of this offshore wind farm totals 77.4 MW, and the average annual wind power generation totals 279.9 GWh. This technology builds a new marine green hydrogen industry system that integrates the utilization of renewable energy (e.g., offshore wind power), seawater resources, and hydrogen production. The wind power component is designed on the basis of this wind farm.
The manufacture phase of the offshore wind power system mainly covers the following: blades, nacelles, and towers of the wind turbines, submarine cables, production of various equipment parts in the BoP, and so on [30]. The raw materials and energy consumption (listed in Table 2) required during the manufacture phase are unitized and recorded in an inventory.
The statistics of the transport phase of the offshore wind power system are complex and need to be assessed as a whole since the 14 wind turbines come from eight different manufacturers around the world [30]. According to the estimation of the wind farm employees, the transport distance was about 1000 km, and a 1500 t ocean freighter was chosen as a means of transport to calculate the heavy fuel oil consumption for the wind turbine transport. Due to the estimated nature of the transport data (lacking traceable, measurable records) and the difficulty of splitting aggregated transport information (from eight manufacturers) into standardized items, this part is not included in the separate life cycle inventory. Transport remains within the system boundary; its impacts are integrated via default data from the literature.
The construction phase of an offshore wind power system mainly covers the following: casting of the base bearing platforms for the wind turbines, laying of submarine cables, construction of the booster and converter stations, etc. [30]. The material consumption is shown in Table 3.
The O&M phase of an offshore wind power system covers the following: repair and replacement of equipment, consumption of lubricating oils and greases, and energy consumption for traffic during the period, among others. In general, during the life cycle of each wind turbine, one blade and 15% of the equipment parts need to be replaced, and the material consumption generated during the manufacture of these parts is discounted by the mass ratio. Within the operation phase, an average of 32 repairs and maintenance are usually carried out on offshore wind farms per year [30]. The material consumption is shown in Table 4.
The decommissioning phase of the offshore wind power system mainly covers the following: dismantling of all offshore wind power system equipment, dismantling of the turbine foundations, recycling of the main metals of the offshore wind power system, landfilling of non-recyclable materials, and fuel consumption during transport. As this offshore wind farm is still in the operation and maintenance phase, the data for the decommissioning phase are mainly based on the estimation of the technical staff of this offshore wind farm and the reference of related studies [30]. The material consumption is shown in Table 5.

3.1.2. Hydrogen Energy Storage Systems

The life cycle inventory of hydrogen energy storage system is divided into AEL hydrogen production technology and PEM hydrogen production technology, both of which include material flows of inputs and outputs in four phases: manufacture, transport, operation, and decommissioning of components such as electrolysis tanks, desalination equipment, BoP, and other auxiliary equipment.
Since the equipment of the electrolytic water-to-hydrogen system is essentially encapsulated after manufacture and transported to the offshore wind farm and then installed as a whole, the raw material and energy consumption during the installation period is relatively low, and the environmental impact at the full life cycle scale is negligible. Therefore, this study does not consider the environmental impact assessment of the construction phase of the hydrogen energy storage system life cycle.
According to the information about the electrolytic cell systems of Proton and Hydrogenics, the single power of the electrolytic water hydrogen production system is 5 MW, and nine electrolytic water hydrogen production plants are installed, with a total installed capacity of 45 MW. The efficiency of the AEL electrolytic water hydrogen production system, in terms of the low-level heating value (LHV) of the hydrogen, reaches 68.72%, whereas the efficiency of the PEM hydrogen production system has slightly higher efficiency than the AEL hydrogen production system at 69.89% [31]. This slight efficiency gap may be associated with the following factors: the difference between the liquid electrolyte of AEL and the solid proton membrane of PEM, the distinction in metal catalysts, and the contrast between AEL’s bubble trapping issue and PEM’s optimized flow channels [32].
The manufacture phase of the hydrogen storage system covers the following: electrolyzer, RO reverse osmosis desalination equipment, hydrogen-to-ammonia equipment, production of each equipment component in the BoP, and so on [31]. The raw material and energy consumption during the process is scaled, unitized, calculated, and recorded in an inventory. The material consumption of the hydrogen energy storage system based on the AEL and PEM hydrogen production route is shown in Table 6 and Table 7.
The material consumption of the desalination system based on RO reverse osmosis technology is shown in Table 8.
The data statistics of the transport phase of the hydrogen energy storage system need to be estimated. Nine sets of electrolyzers with 5 MW of standalone power, RO seawater desalination equipment, hydrogen–ammonia equipment, and the parts of the equipment in the BoP are transported to the wind farm by land and water. The average transport distance by land is about 100 km, and a Euro 6 diesel heavy truck is used; the average transport distance by sea is about 100 km, and a 150 t canal tugboat is used as a means of transport to calculate the diesel consumption for the transport of the hydrogen energy storage system. Due to the estimated nature of this transport data (lacking traceable records and standardized splitting methods), therefore, this component is no longer included in the separate life cycle inventory. Transport remains within the system boundary, with its impacts integrated via default data from the literature.
The O&M phase of the hydrogen storage system covers the following: consumption of electrical energy and pure water for hydrogen production from electrolysis of water (zirconium oxide, water vapor, and heat are also consumed in the AEL hydrogen system) and fuel consumption for transport during O&M, among others. The consumption of raw materials and energy in the process is calculated and recorded in an inventory on a scale and unitized basis. The material consumption of the hydrogen energy storage system based on the AEL and PEM hydrogen production routes is shown in Table 9 and Table 10.
The decommissioning phase of hydrogen energy storage systems mainly covers the removal of all hydrogen energy storage system equipment. Considering the fact that hydrogen energy storage systems are integral installations and the lack of data on the disposal and recycling of the related equipment materials, as well as the small number of recyclable materials, the decommissioning phase of hydrogen energy storage systems is generally considered to have a low life cycle environmental impact, taking into account only the consumption of electrical energy and fuel. Therefore, a separate life cycle inventory for the decommissioning phase of hydrogen energy storage systems is no longer included.

3.2. Systematic Environmental Impact Assessment

3.2.1. Offshore Wind Power Systems

In the life cycle model, Environmental quantities: CML 2001-Jan. 2016 was selected as the characterization indicator [31], each environmental impact indicator was characterized by Equation (4), and the life cycle stages of 12 environmental impact assessment indicators were obtained.
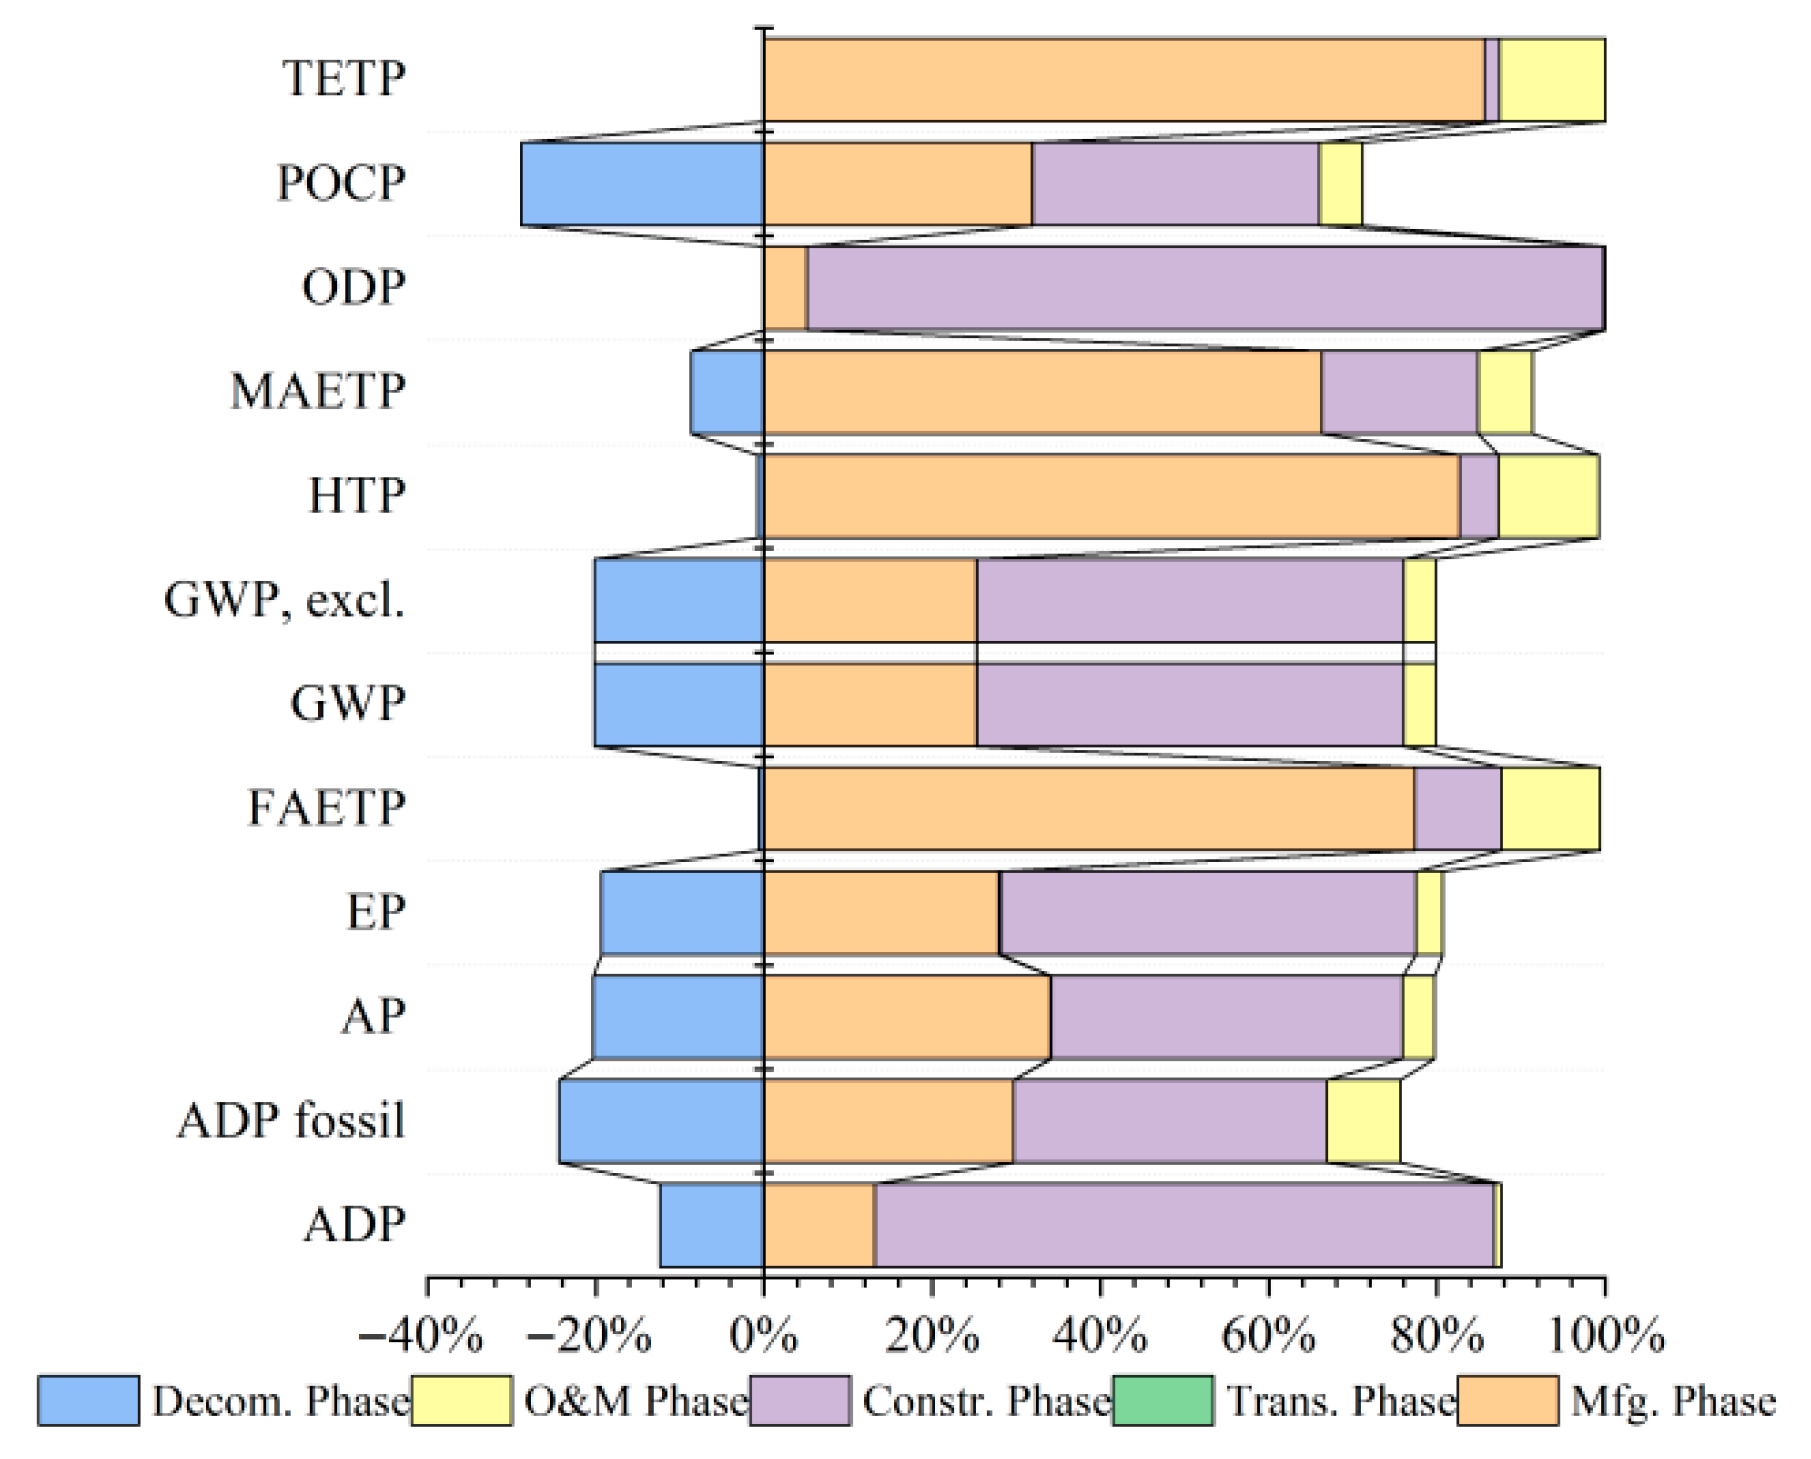
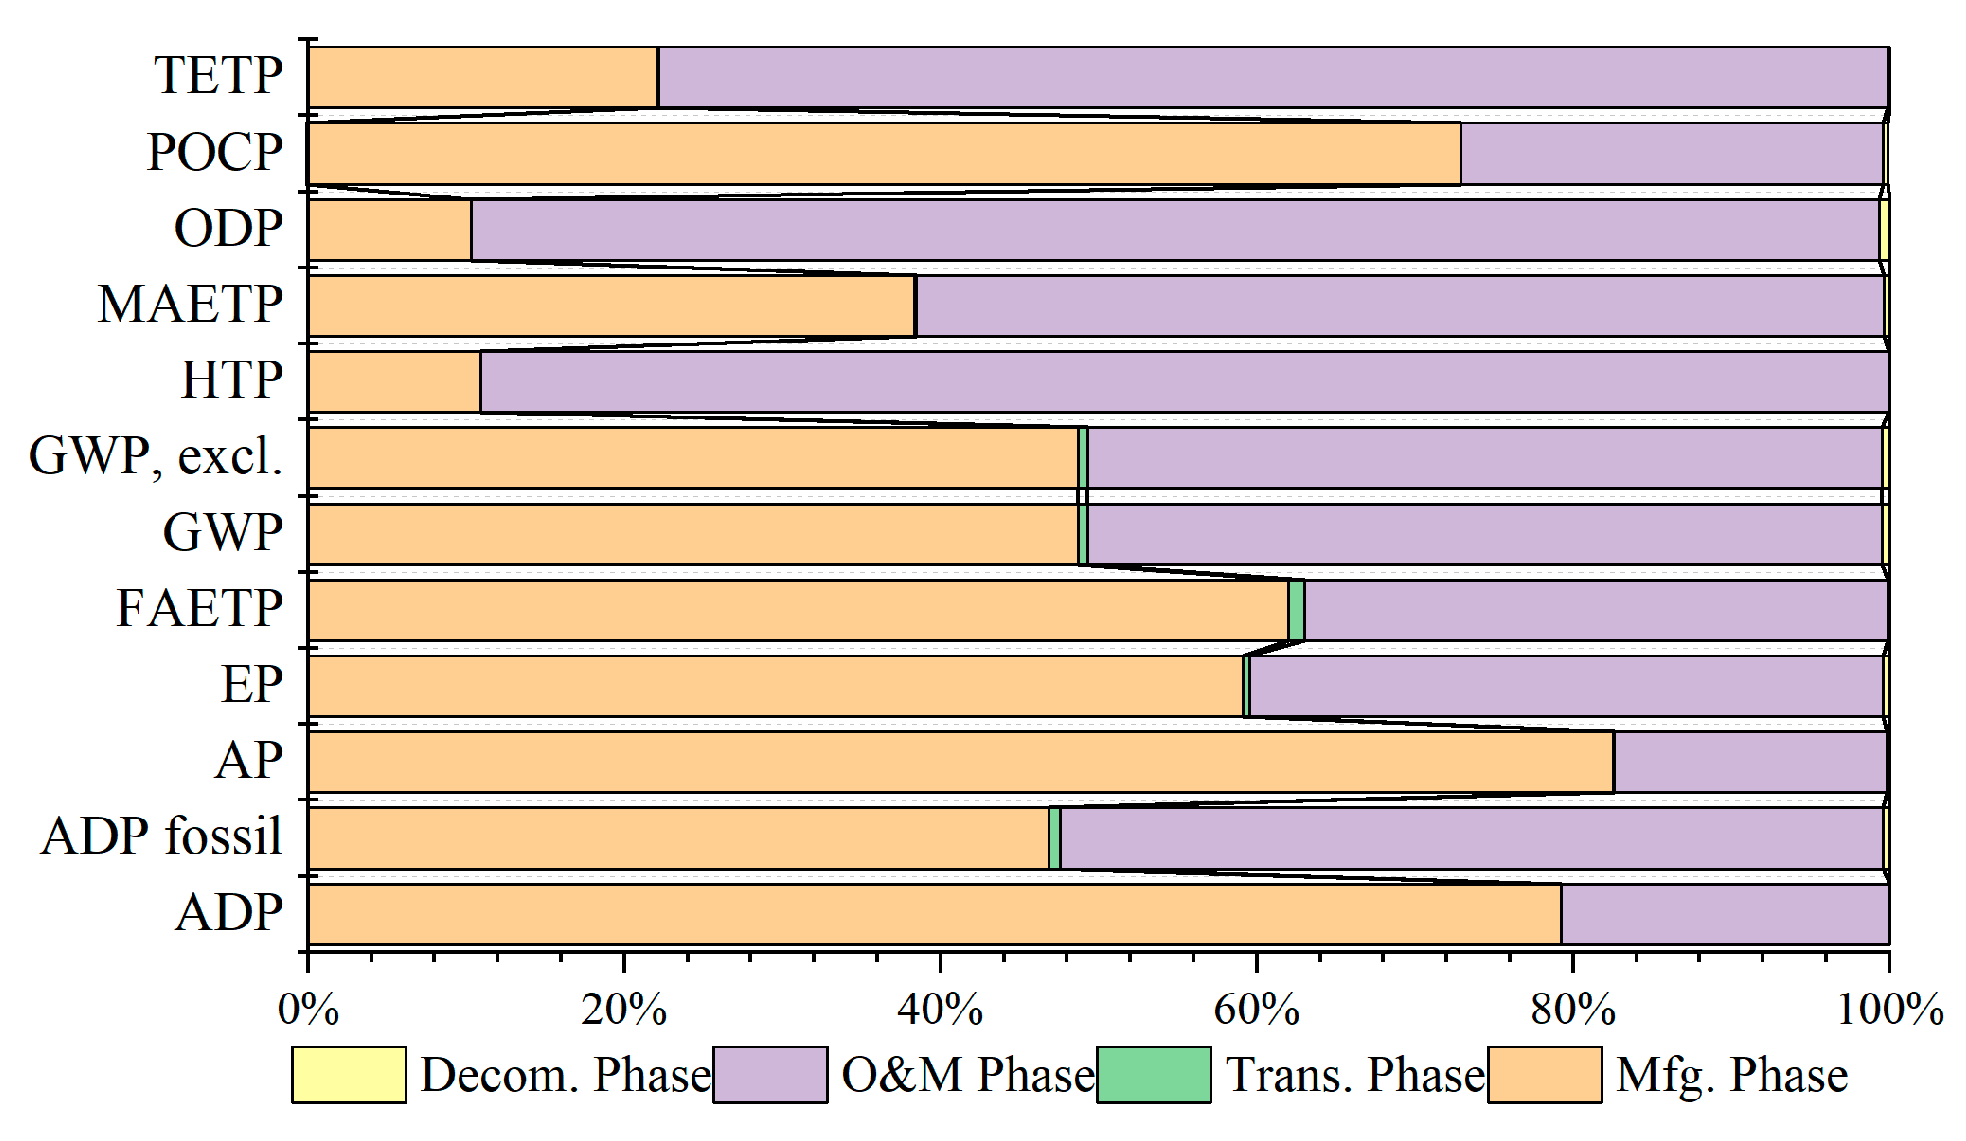
The characterization results in Figure 3 show that of the five life cycle phases, the manufacture and construction phases account for a very high proportion of the environmental impacts, while the transport stage accounts for the lowest proportion of the total EIA indicators. Taking GWP as an example, the manufacture and construction phases account for 42.33% and 86.19%, which dominates the life cycle environmental impacts. Similarly, these two phases play a clearly dominant role in life cycle environmental impacts among other environmental indicators. The decommissioning phase is the only phase with a net environmental benefit (reflected as a negative value in the characterization results), so it can be seen that reasonable recycling and reuse during the decommissioning stage is of great significance in reducing the life cycle environmental impacts of the system.
According to official data released by China’s Ministry of Ecology and Environment and the National Bureau of Statistics for 2022, the 2022 average CO2 emission factor of China’s power grid is about 0.57 kg CO2-eq/kWh, and the GWP of the offshore wind power system is 2.38 × 10⁻² kg CO2-eq/kWh; compared to the grid-connected electricity of the system, it can be reduced by 0.55 kg CO2-eq/kWh, which has a large potential for emission reduction. However, due to the marginal effect, this advantage will gradually diminish as the proportion of clean and renewable energy power generation in the national power structure increases. Therefore, it is necessary to explore new emission reduction advantages in the field of difficult electrification and replace fossil energy with clean and renewable energy, and green hydrogen is one of the effective solutions.
We selected think step LCIA Survey 2012, Global, CML 2016, incl biogenic carbon (global equivalents weighted) as the weighting standard, and each environmental impact indicator was weighted.
The weighted results in Figure 4 show that the total value of the life cycle environmental impact of the offshore wind power system is 3.12 × 10⁻¹³. The total environmental impact of the life cycle, the manufacture stage, transportation, construction, operation and maintenance, and decommissioning phases account for 79.00%, 0.01%, 16.82%, 10.23%, and −6.06%. The manufacturing stage dominates the environmental impacts.
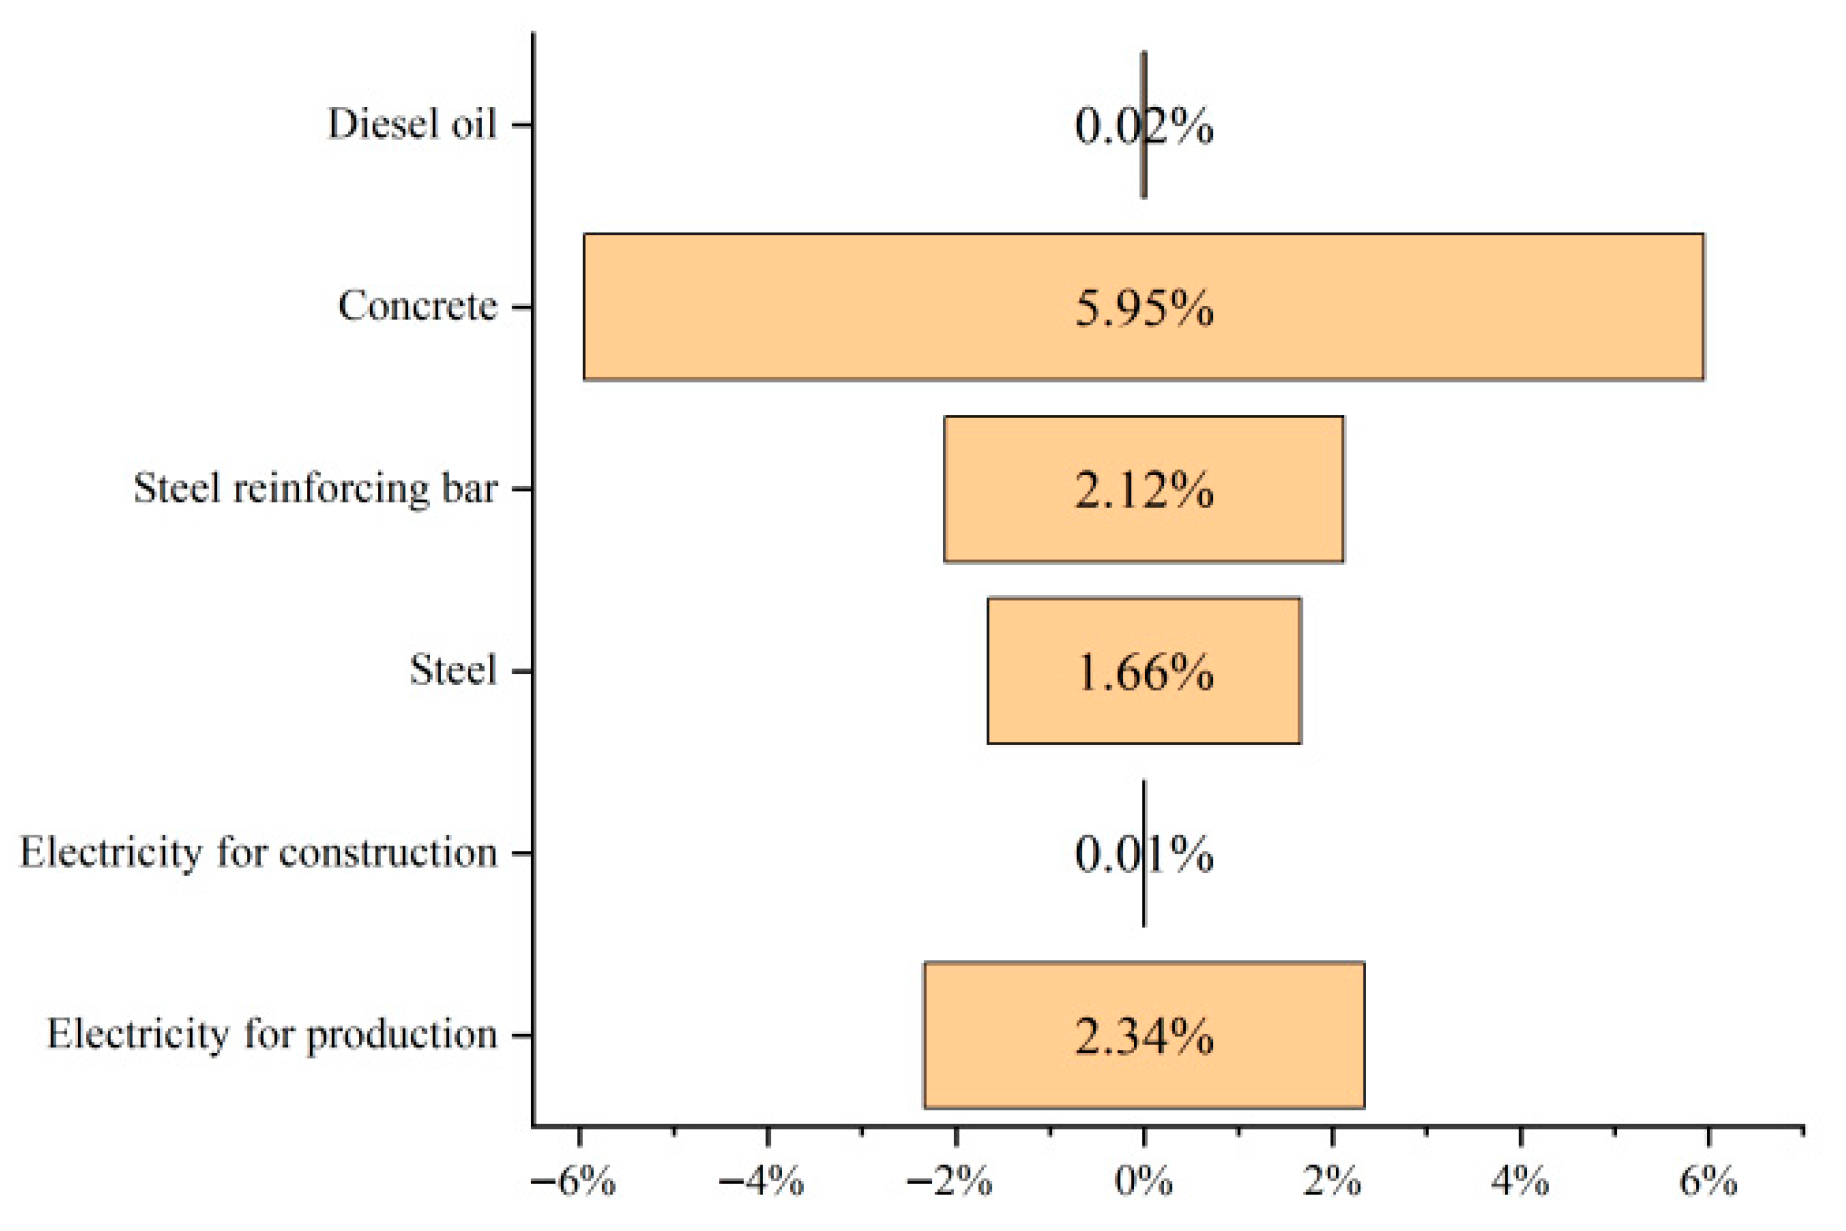
Taking GWP, an environmental impact assessment indicator, as an example, six types of material consumption, namely, electricity for manufacture, electricity for construction, iron and steel, steel reinforcement, concrete, and diesel fuel, were selected as key parameters of the material flow of input and output; and life span of wind turbine (LS) and capacity factor of wind farm (CF) were selected as key parameters of the offshore wind farm. The upper and lower deviations were selected as ±10%, and sensitivity analysis was selected in the result analysis to obtain the sensitivity analysis results of the above parameters.
Figure 5 displays the six types of material consumption; concrete is the most sensitive, and its changes have the greatest impact on the system’s environmental impact results; construction electricity is the least sensitive, and its changes have the least impact on the system’s environmental impact results.
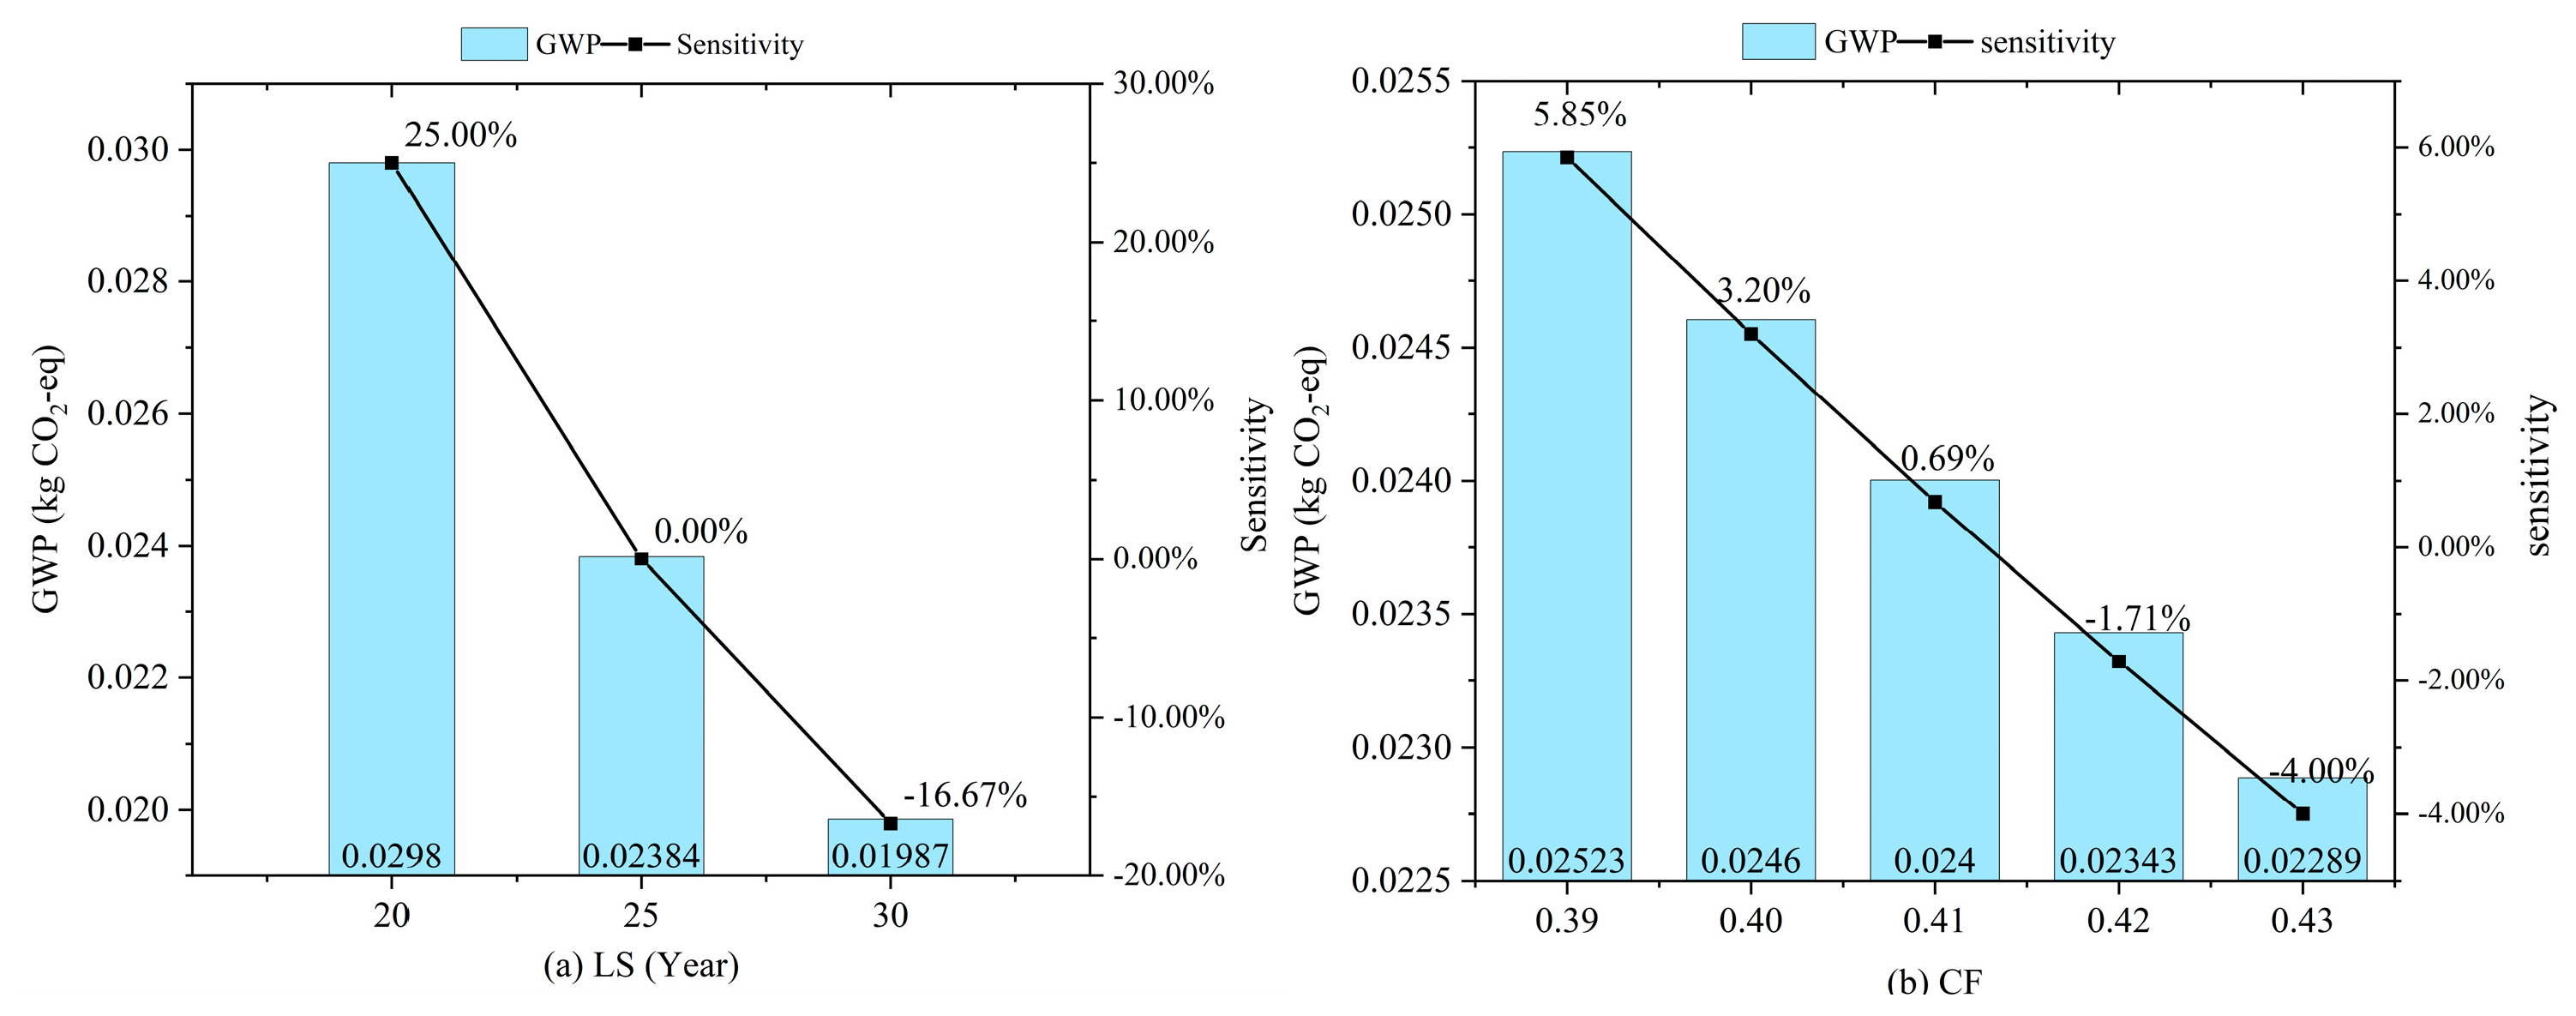
For the single sensitivity analysis of wind turbine life (LS) and wind farm capacity factor (CF), the initial LS of the system is 25 years and CF is 41.30%, and the sensitivity analysis results of the above parameters are obtained. Figure 6a shows that the 5-year WTG life is more sensitive and changes in it can have a significant impact on the system environmental impact results. Finding ways to increase the lifetime of WTGs is important for system-wide life-cycle emission reduction, and increasing the lifetime of WTGs by 5 years on the current basis can result in an emission reduction benefit of up to 16.67%. Figure 6b shows that increasing the wind farm capacity factor reduces the life cycle environmental impacts, and if the CF is increased to 43%, an emission reduction benefit of 4.00% can be obtained.
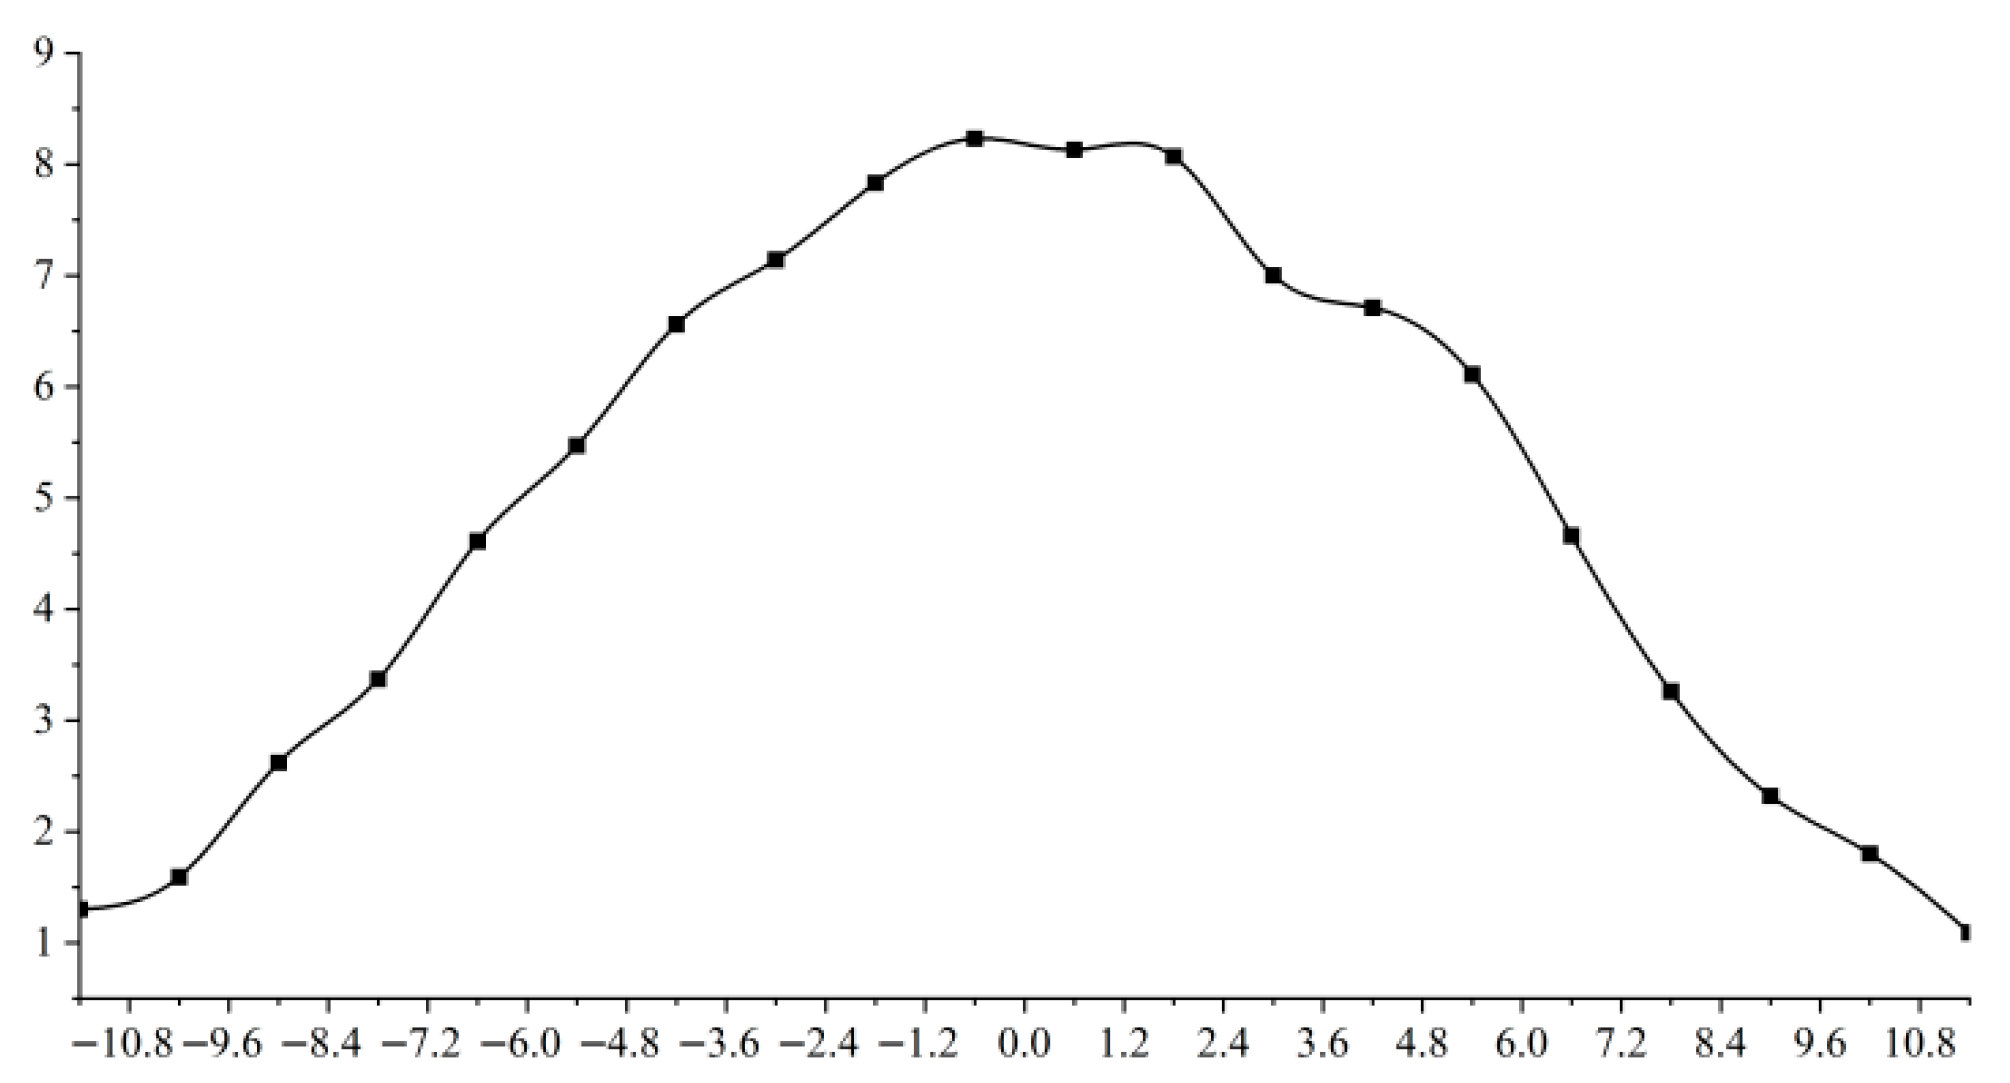
Take the EIA indicator GWP as an example. Parameterize the data, choose ±4% for upward and downward deviation, and choose normal distribution for the probability distribution function, 96% confidence interval, 20 clusters, and 10,000 simulations.
The results of the Monte Carlo analysis in Figure 7 show that when the inputs and outputs of the material flows are based on the corresponding values in the life cycle inventory and are implemented more often, the Monte Carlo simulation results of GWP are close to a normal distribution, which indicates that the propagation of input parameter uncertainty conforms to statistical laws and verifies the reliability of the simulation results. The inputs and outputs of material flows are in the interval 3σ < X ≤ μ + 3σ with probability P = 99.7%. This result indicates that the vast majority of information is covered within the 3σ interval and can represent the overall characteristics.
This shows that the results of the above life cycle environmental impact assessment are reliable.

3.2.2. Hydrogen Energy Storage Systems

Each EIA indicator was characterized to obtain the results of characterization of the 12 EIA indicators by life cycle stage.
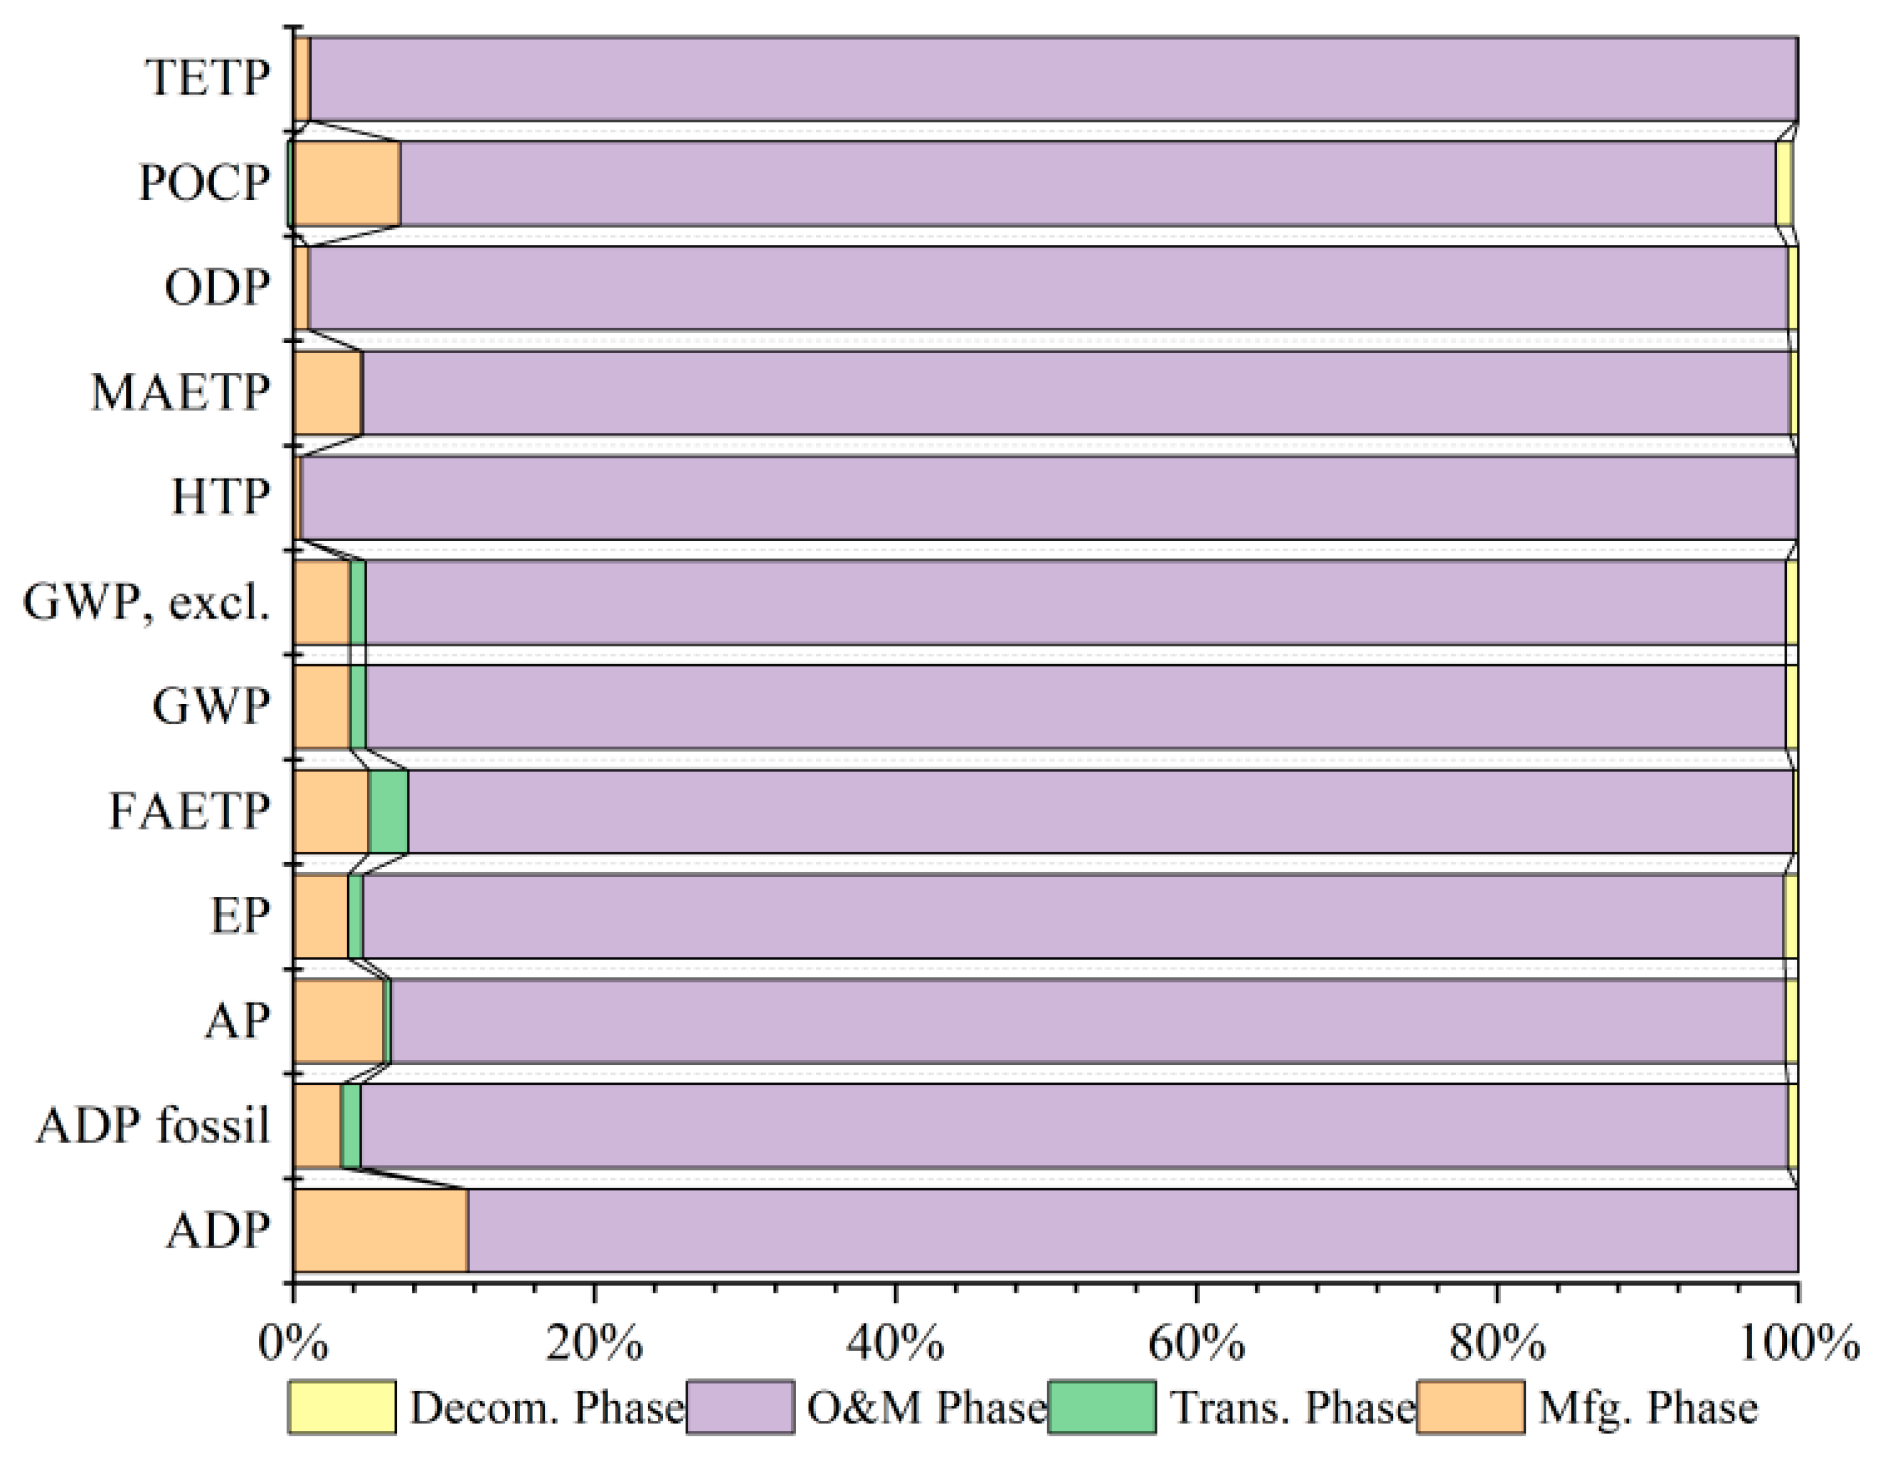
The results of the characterization in Figure 8 and Figure 9 show that of the four life cycle stages, the O&M stage of both routes contributes the largest share of environmental impacts, while the transport stage ranks the lowest of the full EIA indicators. As for the GWP for the hydrogen energy storage system, the O&M phase accounts for 50.29% based on the AEL hydrogen production route and 94.34% based on the PEM hydrogen production route, and this stage plays a dominant role in the life cycle environmental impact.
According to the data published by the International Energy Agency (IEA), two-thirds of the hydrogen produced in China comes from fossil energy sources, and the carbon dioxide emission factor of hydrogen in China is about 40 kg CO2-eq/kg, while the GWP of hydrogen produced by two technological routes of the offshore wind–hydrogen storage system is 1.81 kg CO2-eq/kg and 0.96 kg CO2-eq/kg, respectively. If the more environmentally friendly PEM hydrogen production route is adopted, the hydrogen produced by this system can reduce emissions by 39.04 kg CO2-eq/kg compared to Chinese hydrogen, which has a huge potential for emission reduction. In areas where electrification is difficult to achieve, the direct use of green hydrogen as a replacement for fossil energy sources, offshore wind–hydrogen storage systems are proving to be a powerful solution to achieve this goal.
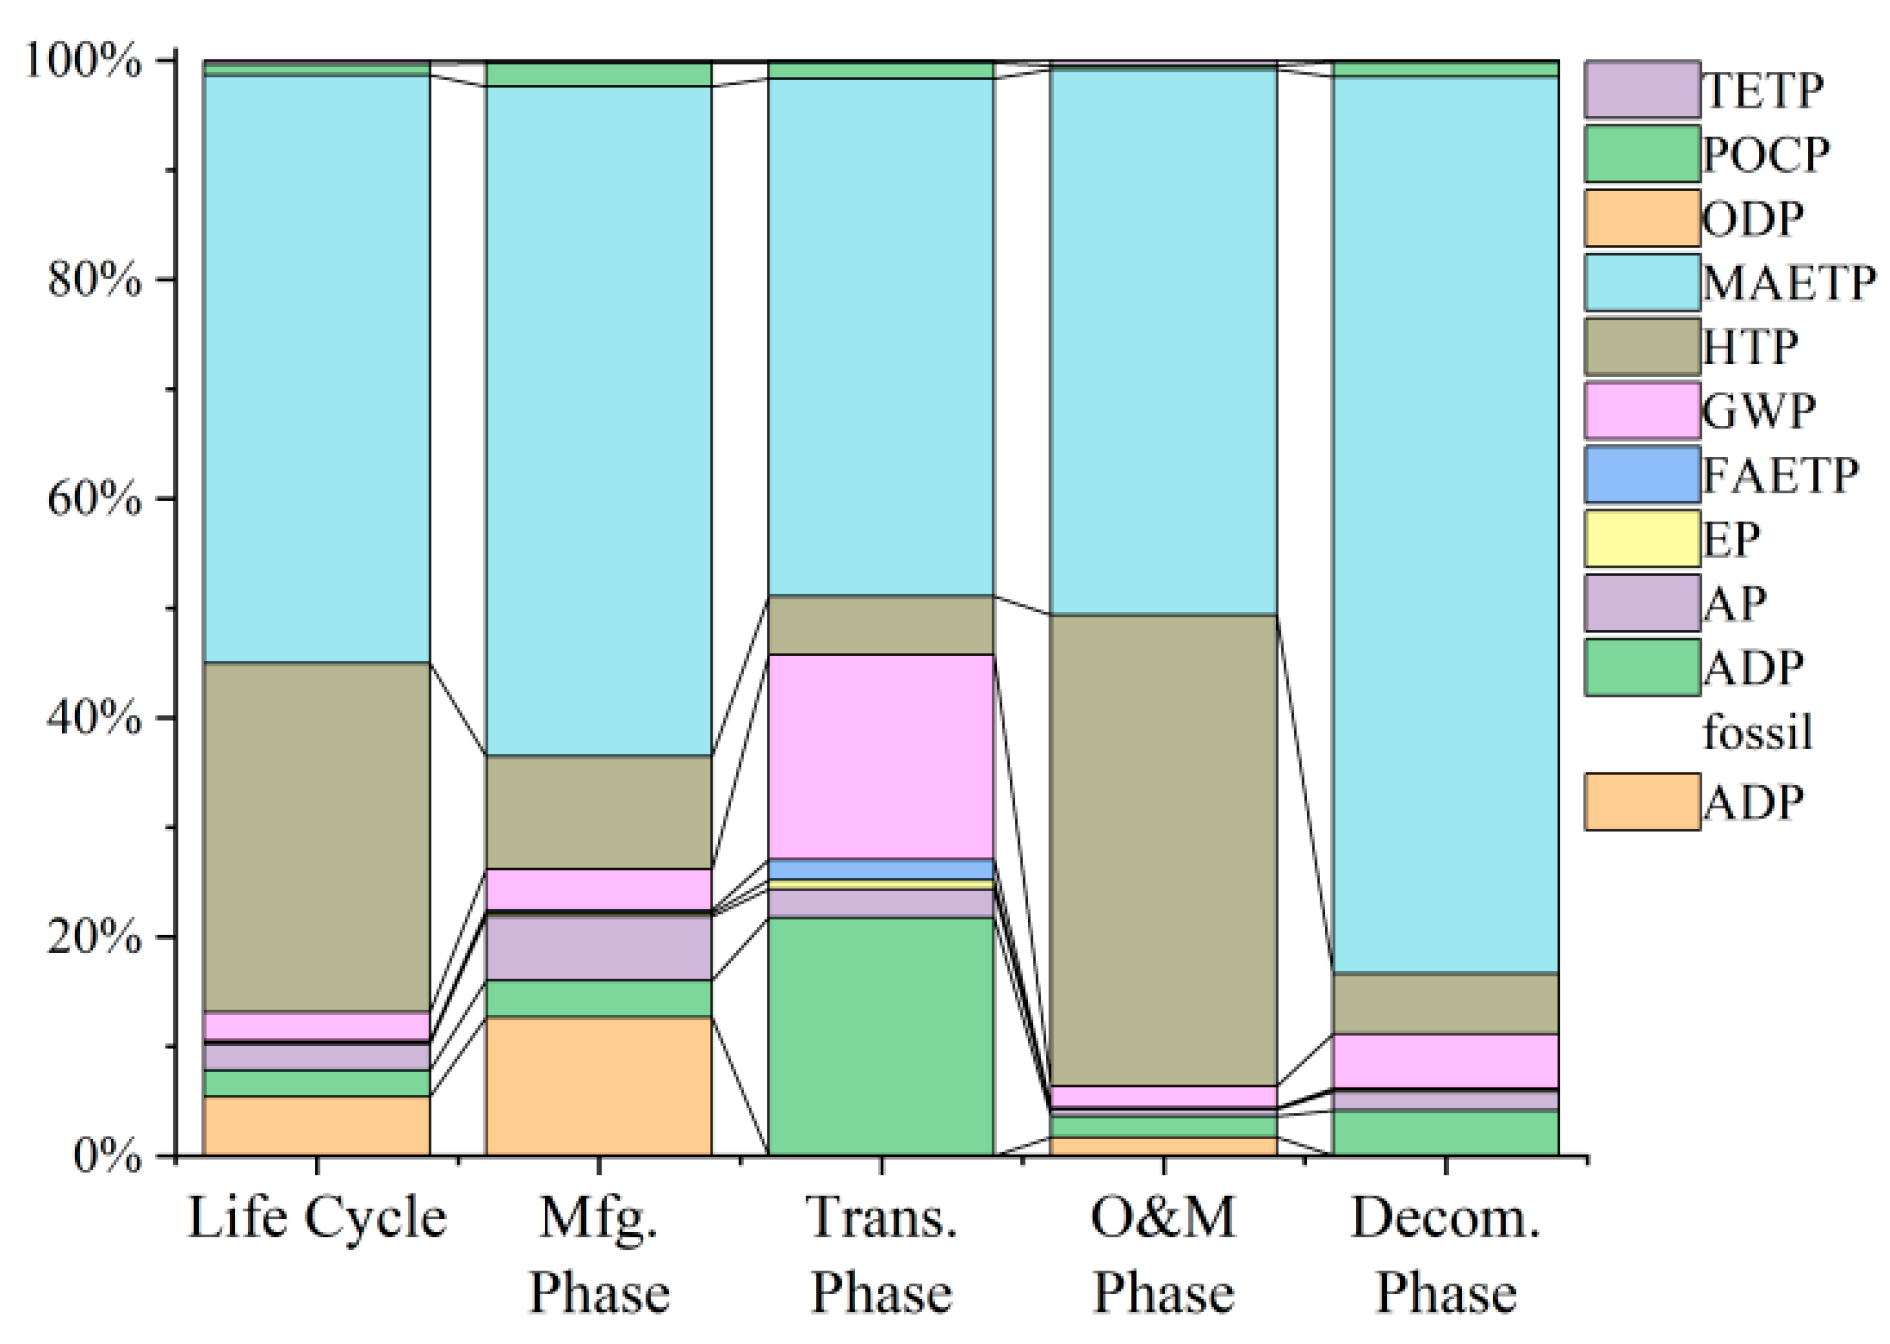
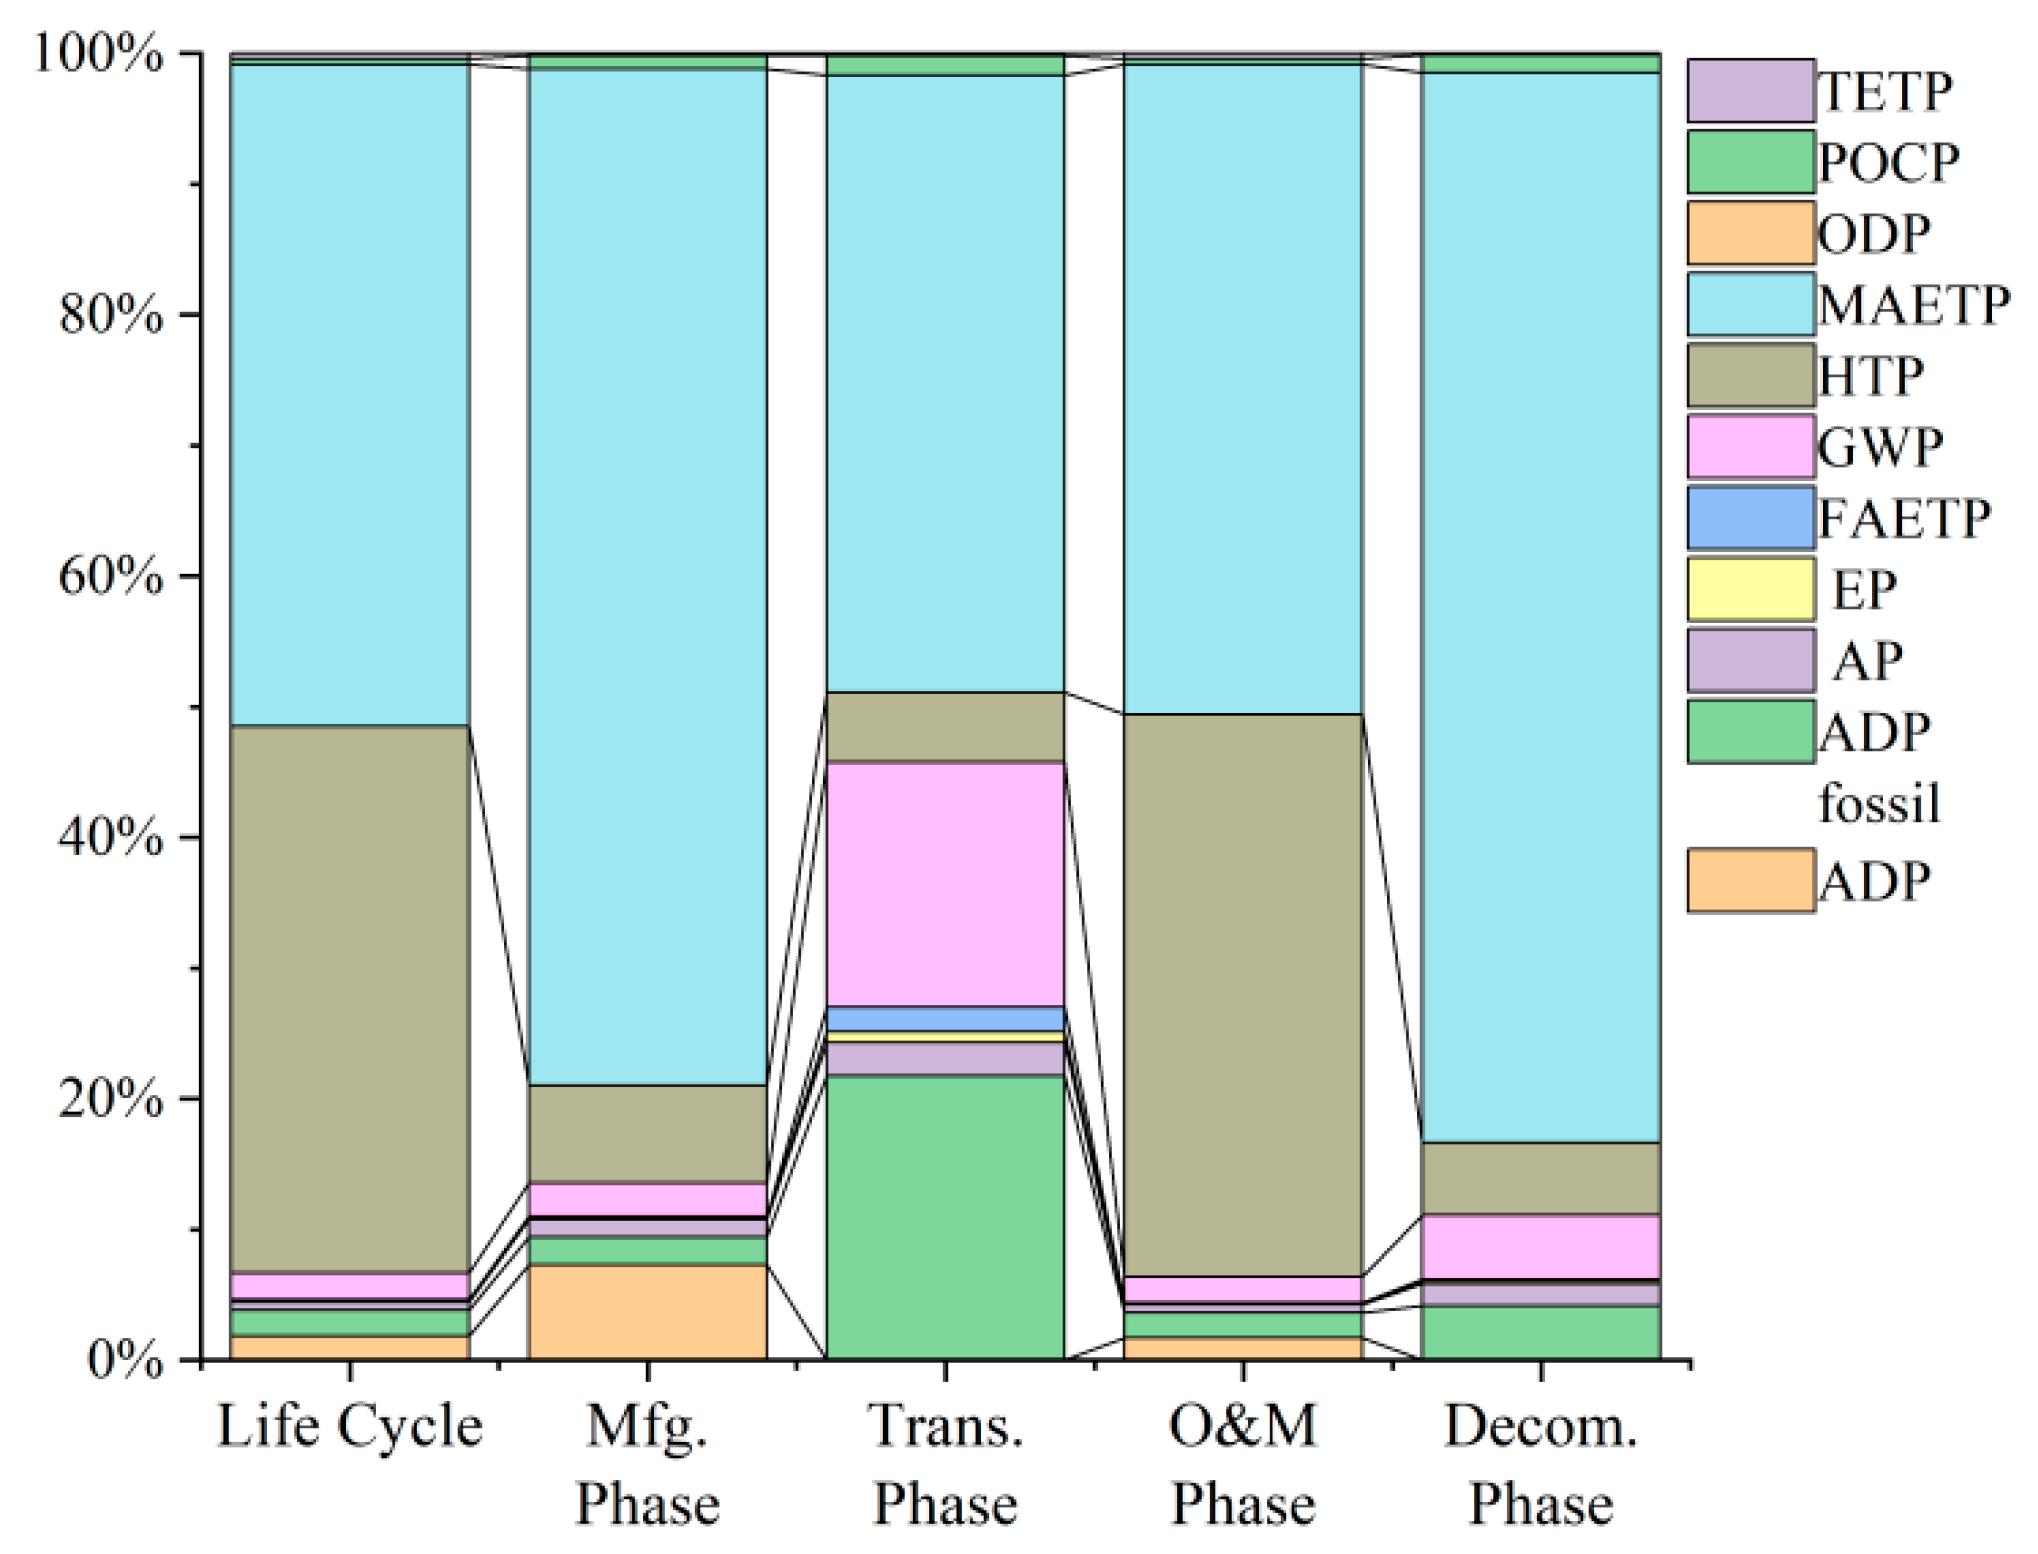
The weighted results in Figure 10 and Figure 11 show that the total value of the environmental impacts of the hydrogen storage system for the two routes is 1.55 × 10⁻¹¹ and 1.05 × 10⁻¹¹, respectively. Among the 11 EIA indicators, the two routes exhibit consistent rankings of indicator contribution proportions: MAETP ranks first with contribution proportions of 53.65% and 50.67%, followed by HTP in second place (33.91% and 41.82%), and ADP elements in third place (5.36% and 1.84%). In contrast, ODP and other indicators exert the weakest environmental impacts, accounting for nearly zero proportion. This suggests that the environmental impacts of hydrogen energy storage systems are mainly focused on “marine ecotoxicity” and “human health risks”. The O&M phase contributes via equipment wear (releasing heavy metals like Pt, Ir, and Ni) and auxiliary chemical leakage (coolants and corrosion inhibitors), affecting human health and marine ecology. The results of the analyses of the components show that the main reason for this discrepancy is the input steel. Low ADP indicates that the system has a relatively limited impact on the consumption of resources such as minerals and fossils. In the total environmental impact of the life cycle, manufacture, transportation, operation and maintenance, and decommissioning phases account for 33.67%, 0.08%, 66.03%, and 0.23% based on AEL, and 2.94%, 0.01%, 96.61%, and 0.34% based on PEM, respectively. This suggests that environmental impacts come mainly from operational processes.
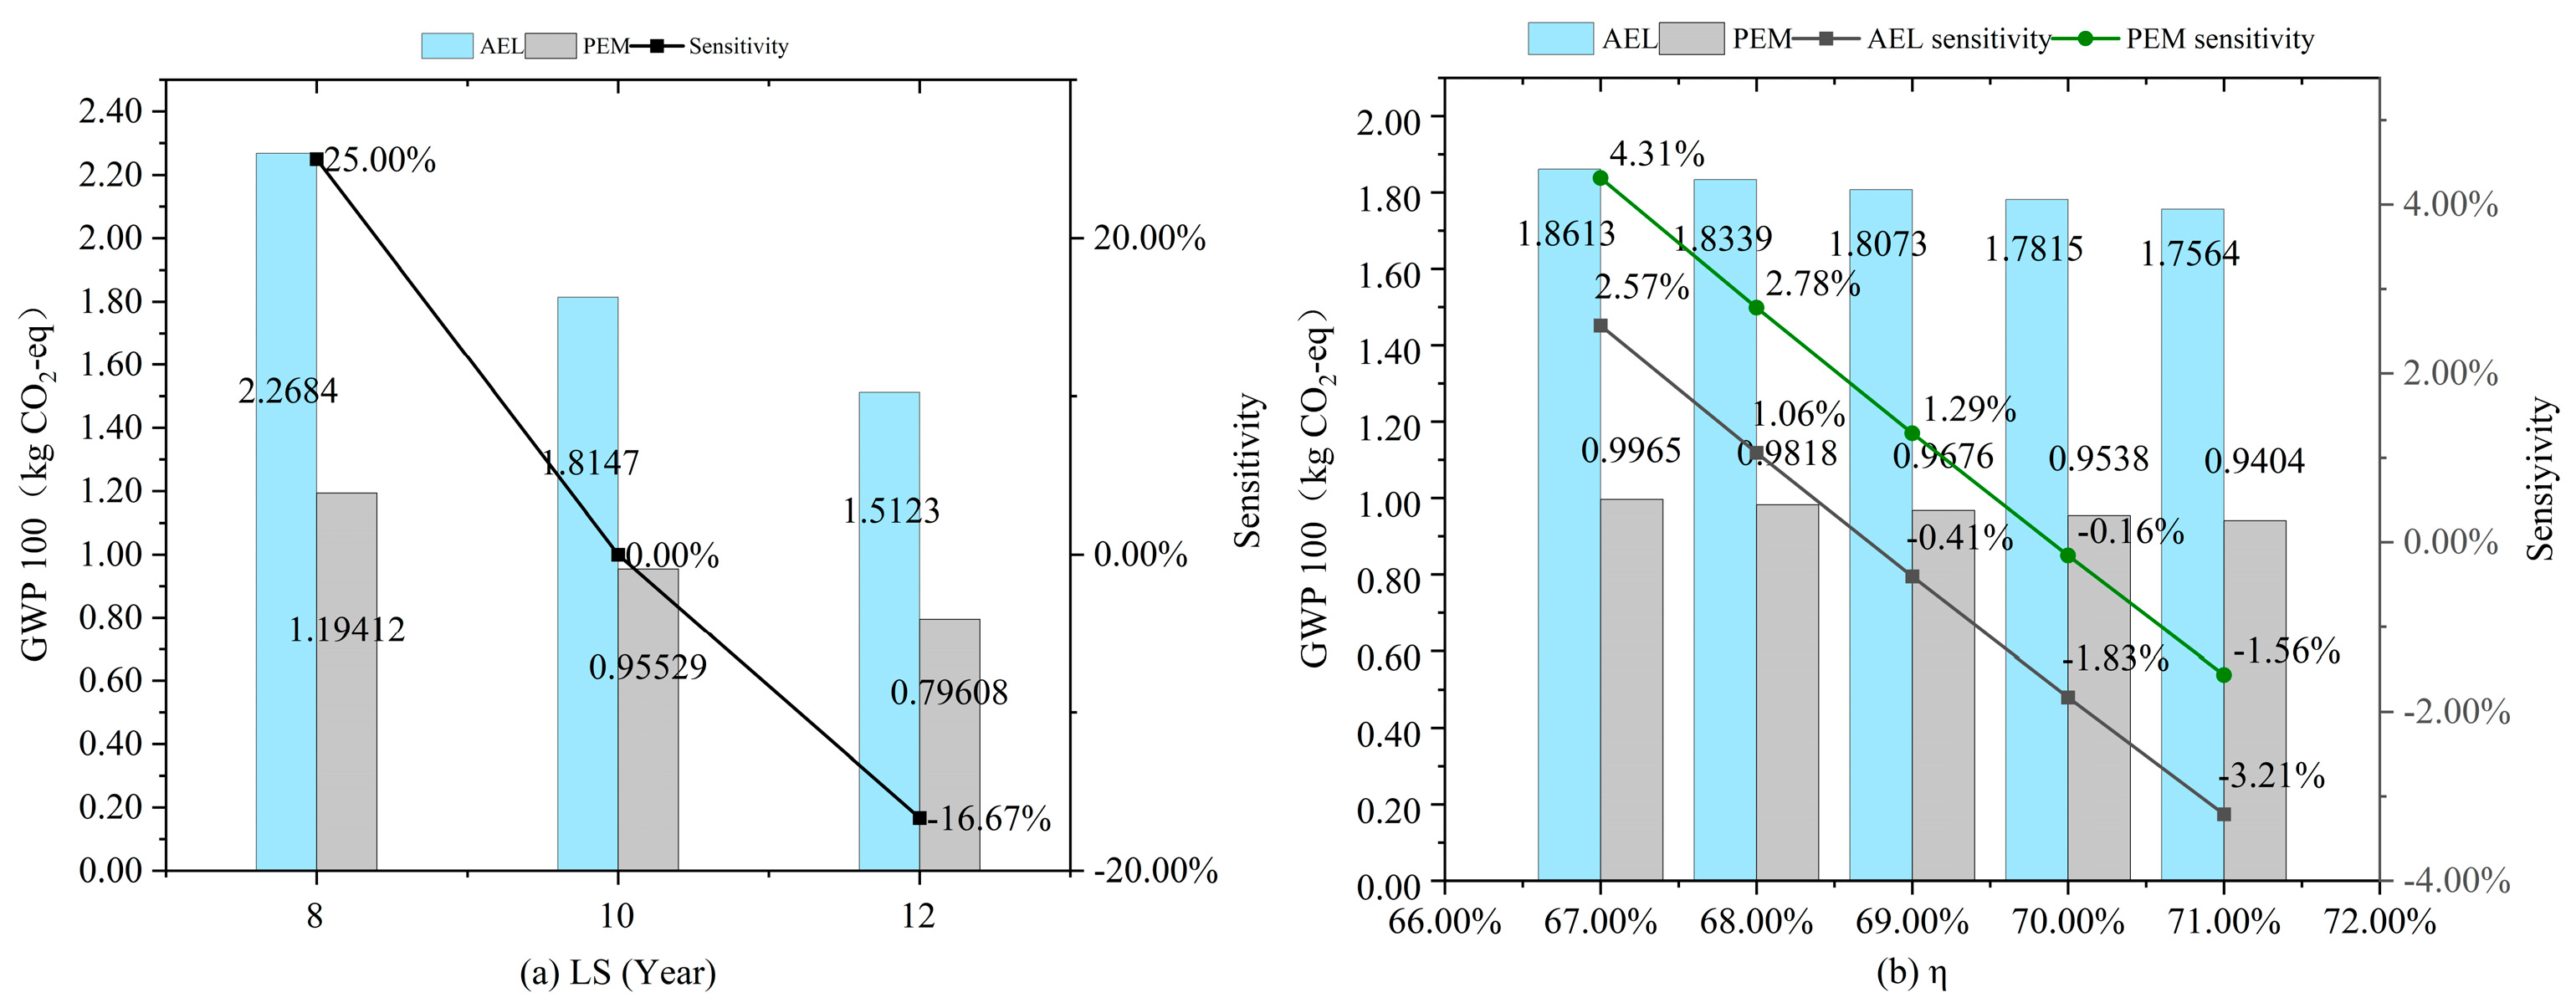
In the single sensitivity analysis of the electrolytic cell life span (LS) and hydrogen production efficiency (η) of the two routes, the initial LS of the system is 10 years, η is 68.72% and 69.89%, respectively, and the sensitivity analysis results of the above parameters are obtained.
Figure 12a shows that the 2-year electrolytic cell life is more sensitive, and changes in it can have a significant impact on the system’s environmental impact results. Finding ways to increase the life of the electrolytic cell is important for system-wide life-cycle emission reduction, and increasing the life of the WTGs by 2 years on the current basis could result in an emission reduction benefit of up to 16.67%. Figure 12b shows that increasing the hydrogen production efficiency reduces the life cycle environmental impacts, and if η is increased to 71%, emission reduction benefits of 3.21% and 1.56% are obtained, respectively. Since the hydrogen storage system based on the PEM hydrogen production route has a higher hydrogen production efficiency than the hydrogen storage system based on the AEL hydrogen production route, the emission reduction benefit when the efficiency is increased to 71% is lower than the latter.

3.2.3. Offshore Wind Power Combined with Hydrogen Energy Storage System

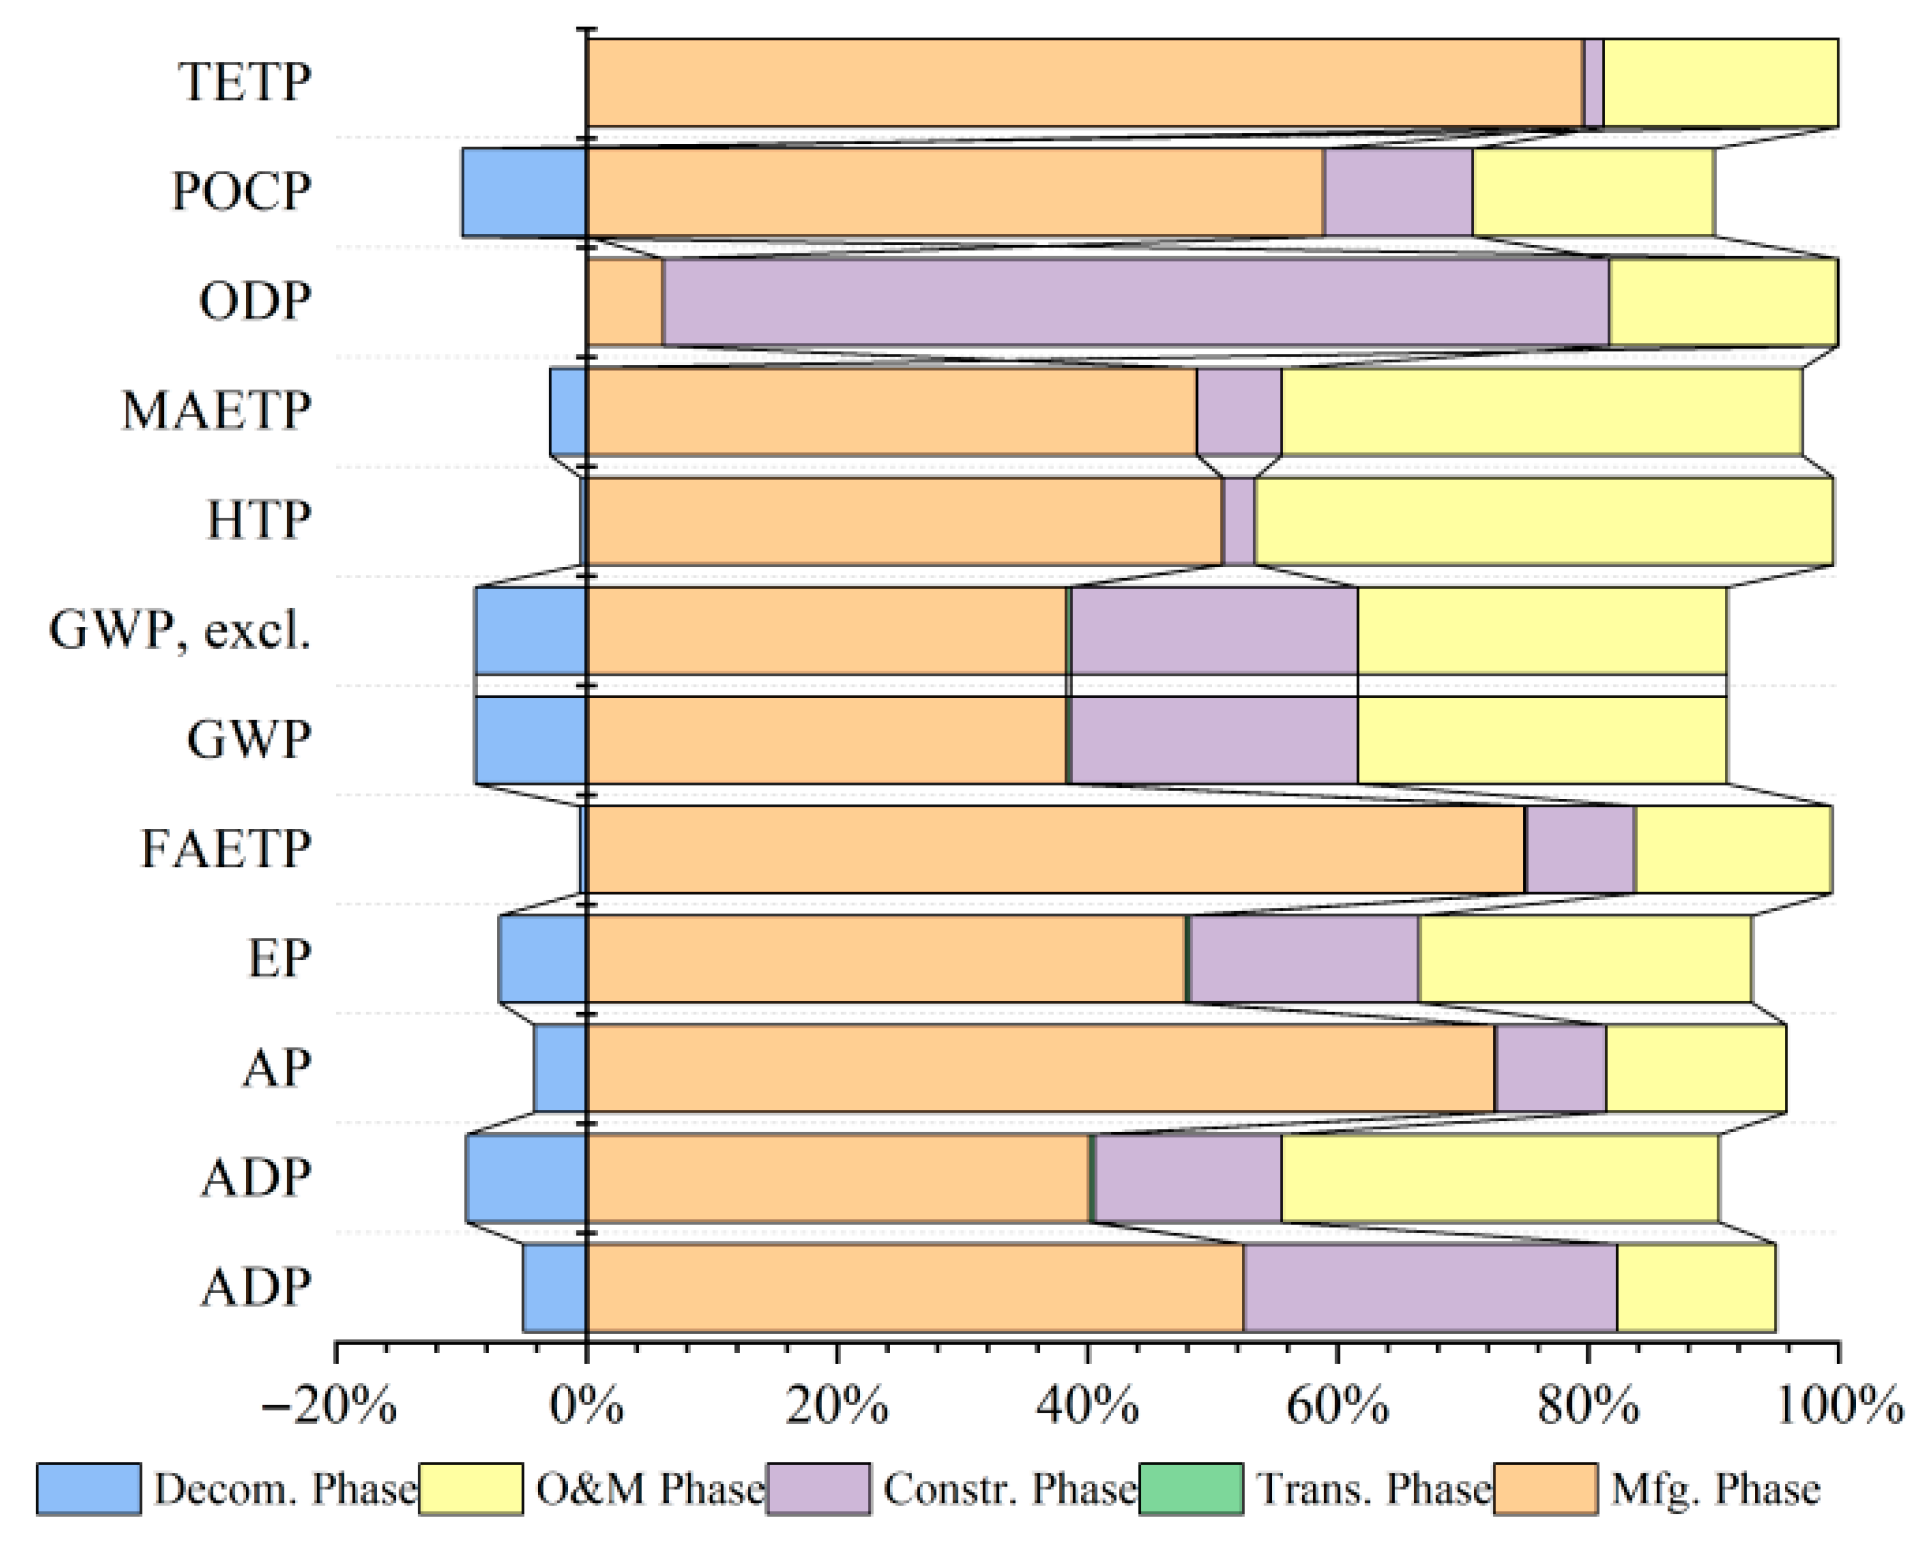
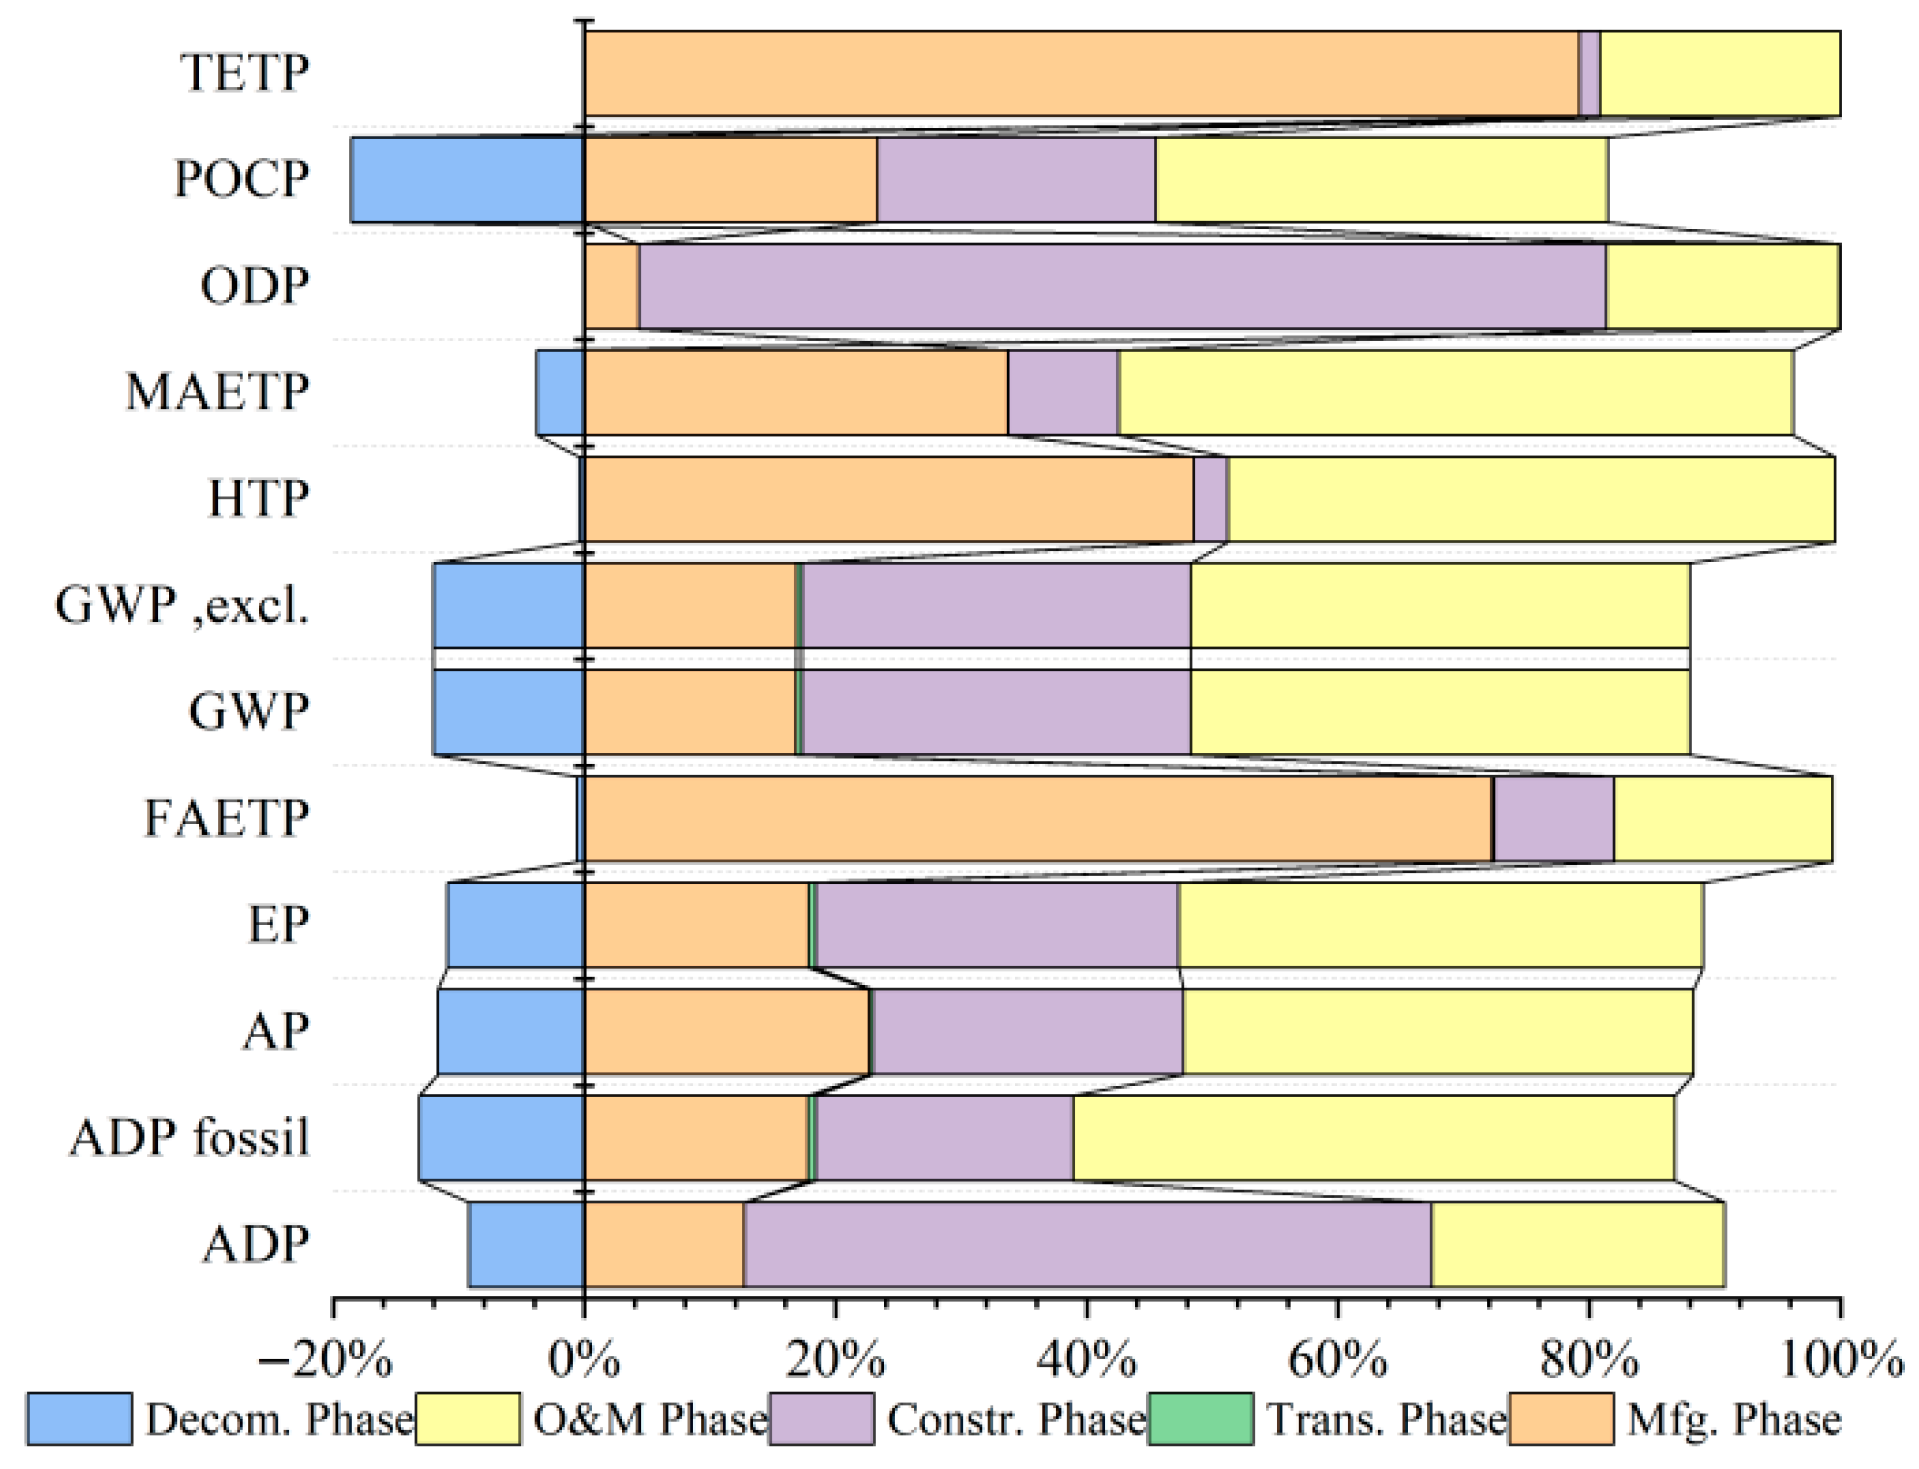
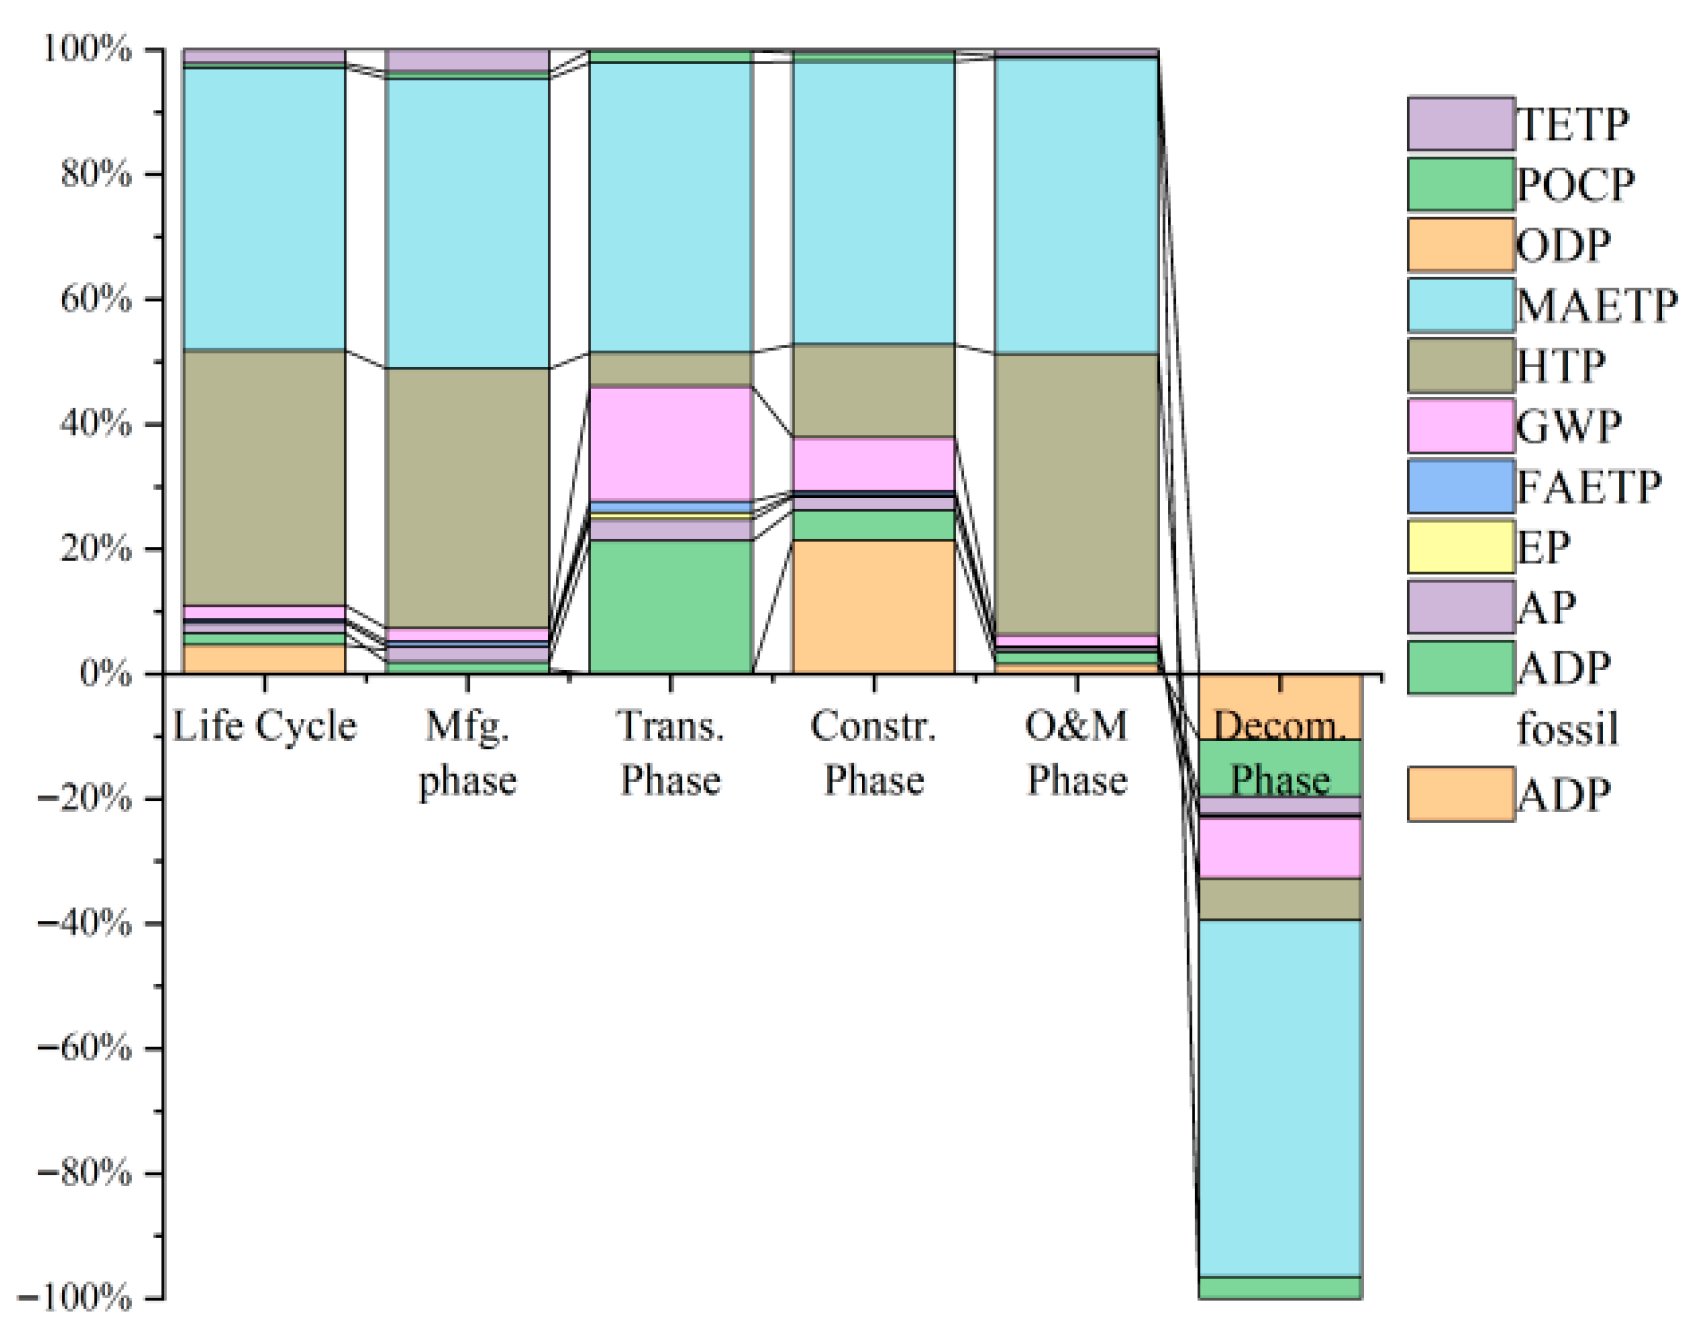
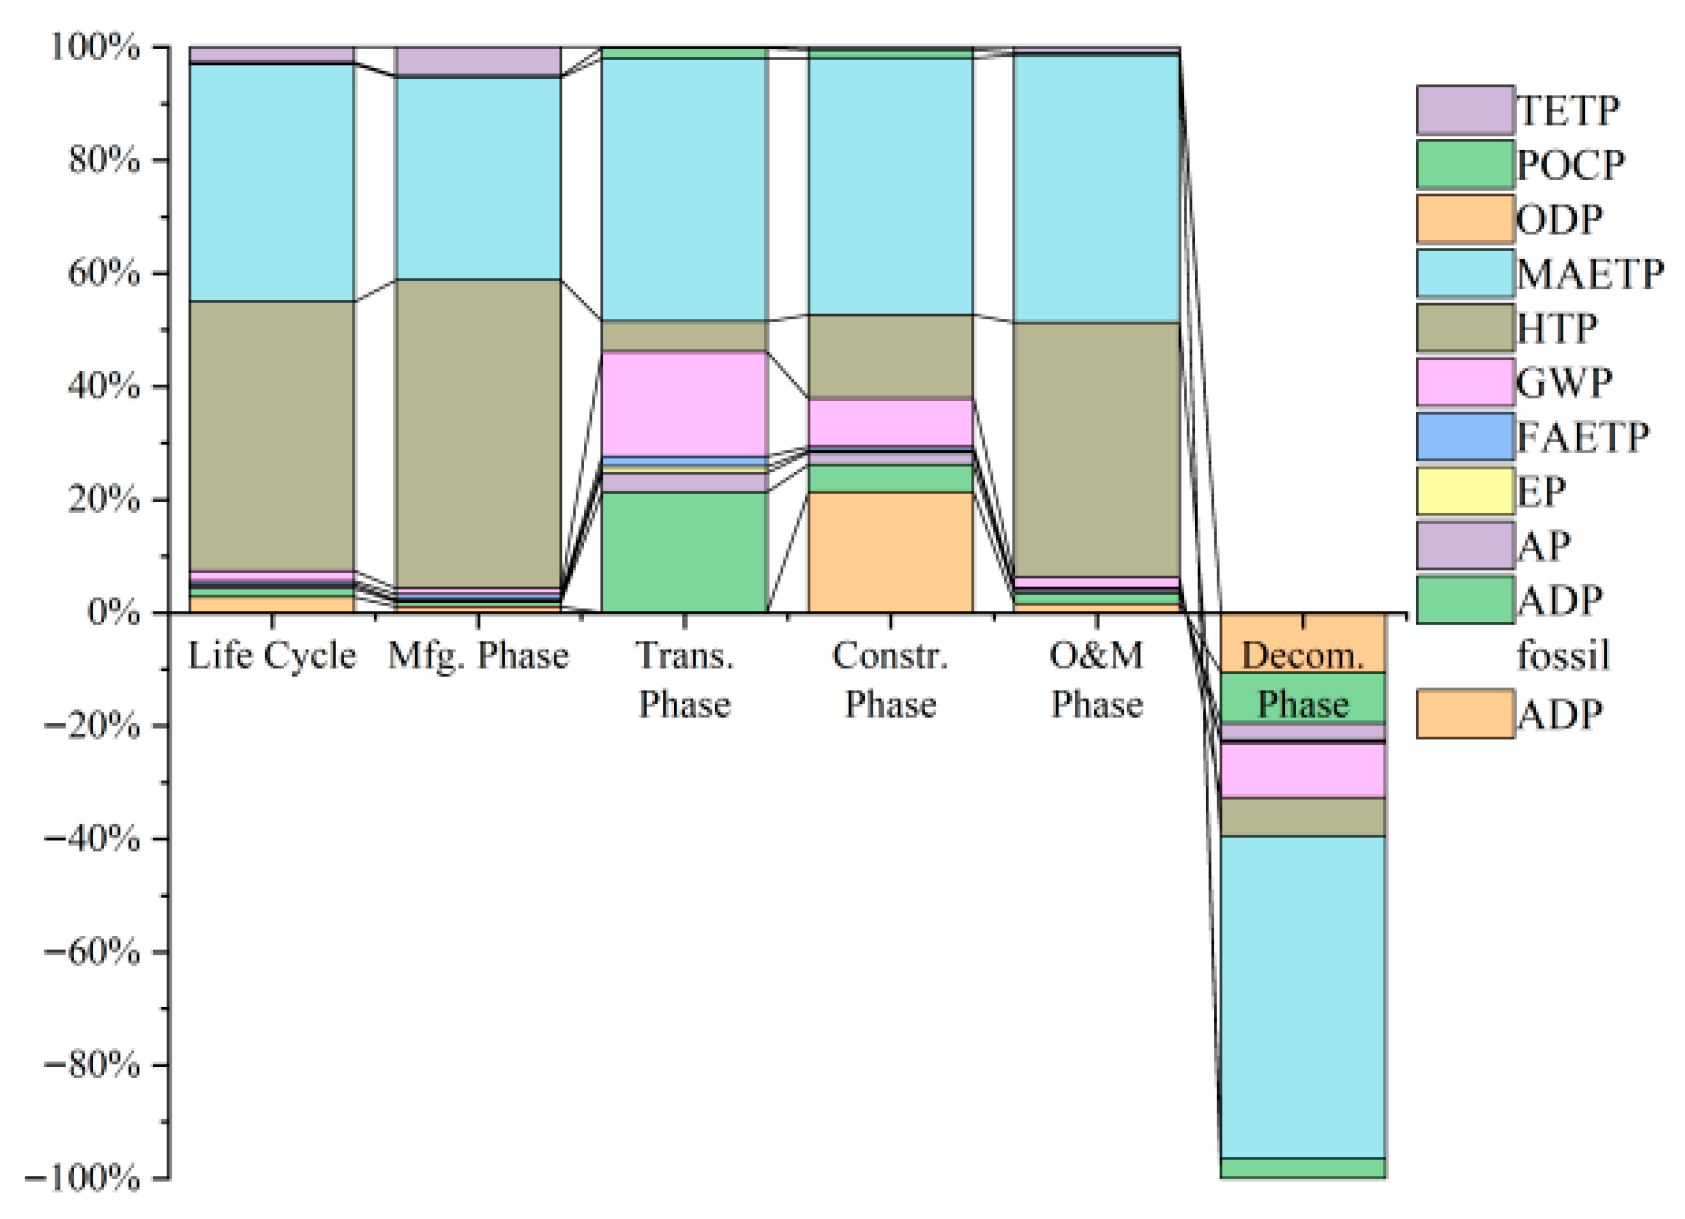
Combining the offshore wind power system and the hydrogen storage system, the life cycle environmental impact indicators of 0.4 kWh of green power and 1.08 × 10⁻² kg of green hydrogen based on the AEL hydrogen production route and 1.09 × 10⁻² kg of green hydrogen based on the PEM hydrogen production route, respectively, are linearly combined to obtain the life cycle environmental impact assessment results of the combined energy supply unit.
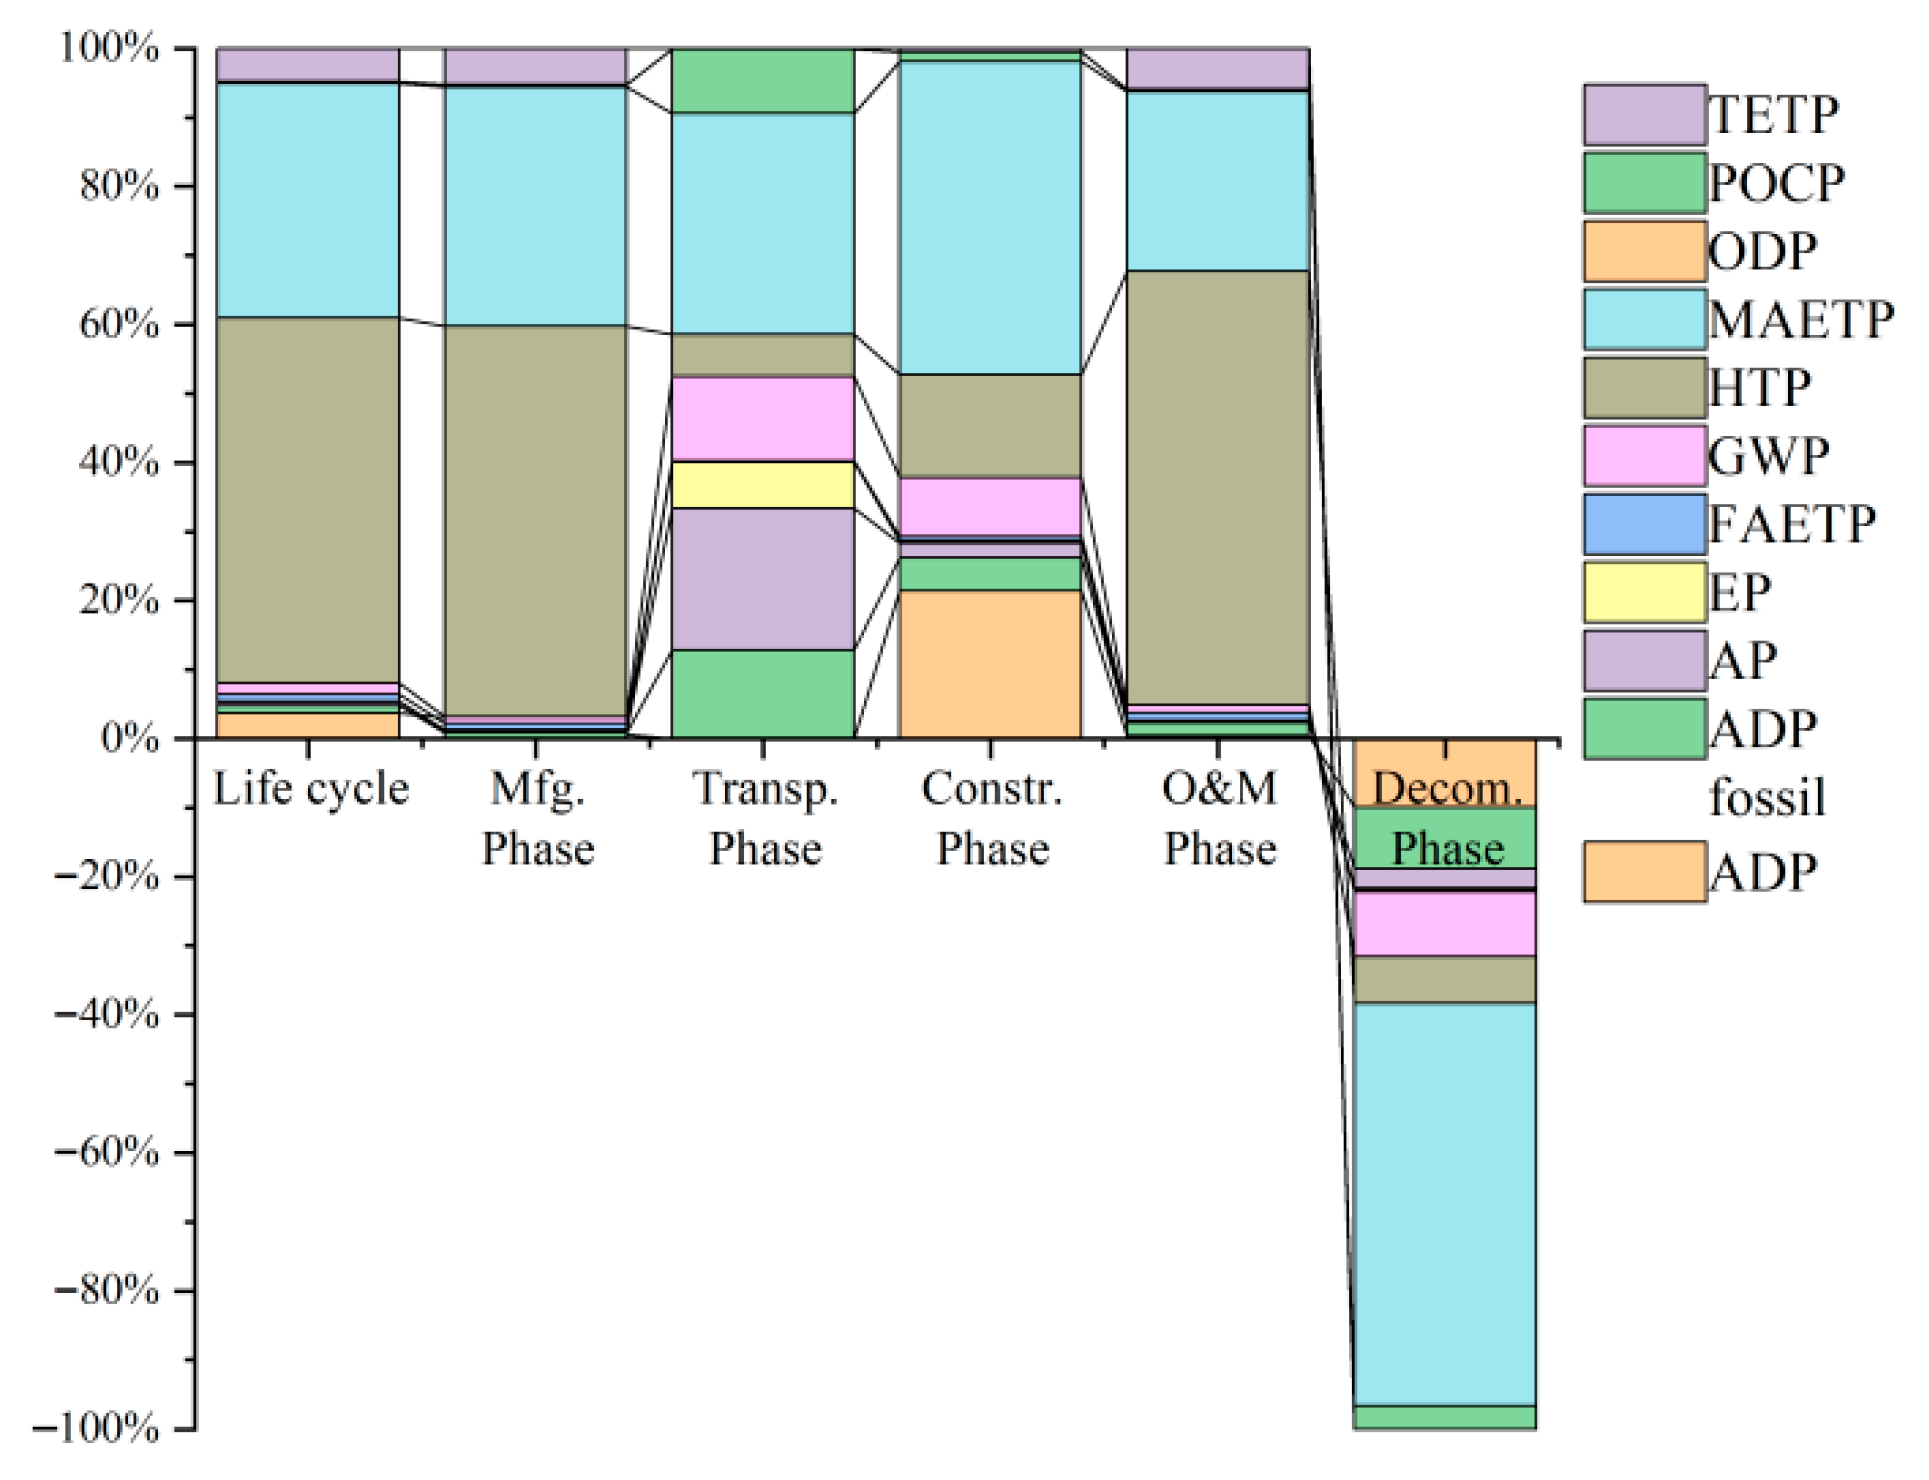
The characterization results in Figure 13 and Figure 14 show that the production and construction stages contribute the largest share of environmental impacts, while the transport stage ranks the lowest in all EIA indicators. Taking GWP for the hydrogen production route, the production and construction phases account for 46.62% and 27.88% based on AEL, and 22.19% and 40.72% based on PEM.
The decommissioning stage still has a significant effect in offsetting the negative life cycle environmental impacts of the system, primarily due to the recycling of core materials.
Taking the more environmentally friendly offshore wind–hydrogen storage system based on the PEM hydrogen production route as an example, the GWP of its combined energy supply unit 0.4 kWh green electricity with 1.09 × 10⁻² kg green hydrogen is 2.00 × 10⁻² kg CO2-eq/unit, which is still of great emission reduction benefit compared with the emission factors of grid electricity and national hydrogen production.
The weighted results in Figure 15 and Figure 16 show that the total environmental impact values of the hydrogen energy storage systems for the two routes are 2.92 × 10⁻¹³ and 2.39 × 10⁻¹³, respectively. For the offshore wind–hydrogen storage system based on the AEL hydrogen production route, the MAETP is ranked first with 45.22%; the HTP is ranked second with 40.81%; and the ADP ranked third with 4.64%. Based on the PEM hydrogen production route, HTP is ranked first with 47.61%, MAETP inf. is ranked second with 41.92%, and ADP is ranked third with 2.80%. This suggests that AEL has a slightly higher risk of toxicity to marine ecosystems and PEM has a more pronounced risk of toxicity to humans, and that materials need to be optimized for the different routes (e.g., AEL to reduce nickel leakage and PEM to reduce titanium/iridium use). On the other hand, the ODP of the two routes showed the weakest environmental impact with almost 0%. In the total environmental impact of the life cycle, the proportions of the manufacture stage, transportation, construction, operation and maintenance, and decommissioning phases are 53.02%, 0.05%, 7.18%, 42.21%, and −2.46% based on AEL, and 42.68%, 0.06%, 8.19%, 51.49%, and −3.00% based on PEM, respectively. This suggests that the OWP-HESS environmental impacts mainly come from the system’s “hardware production” (manufacturing of equipment such as turbines, electrolyzers, etc.) and “engineering construction” (turbine foundation pouring, submarine cable laying, etc.), as a subsequent optimization of the core objectives.
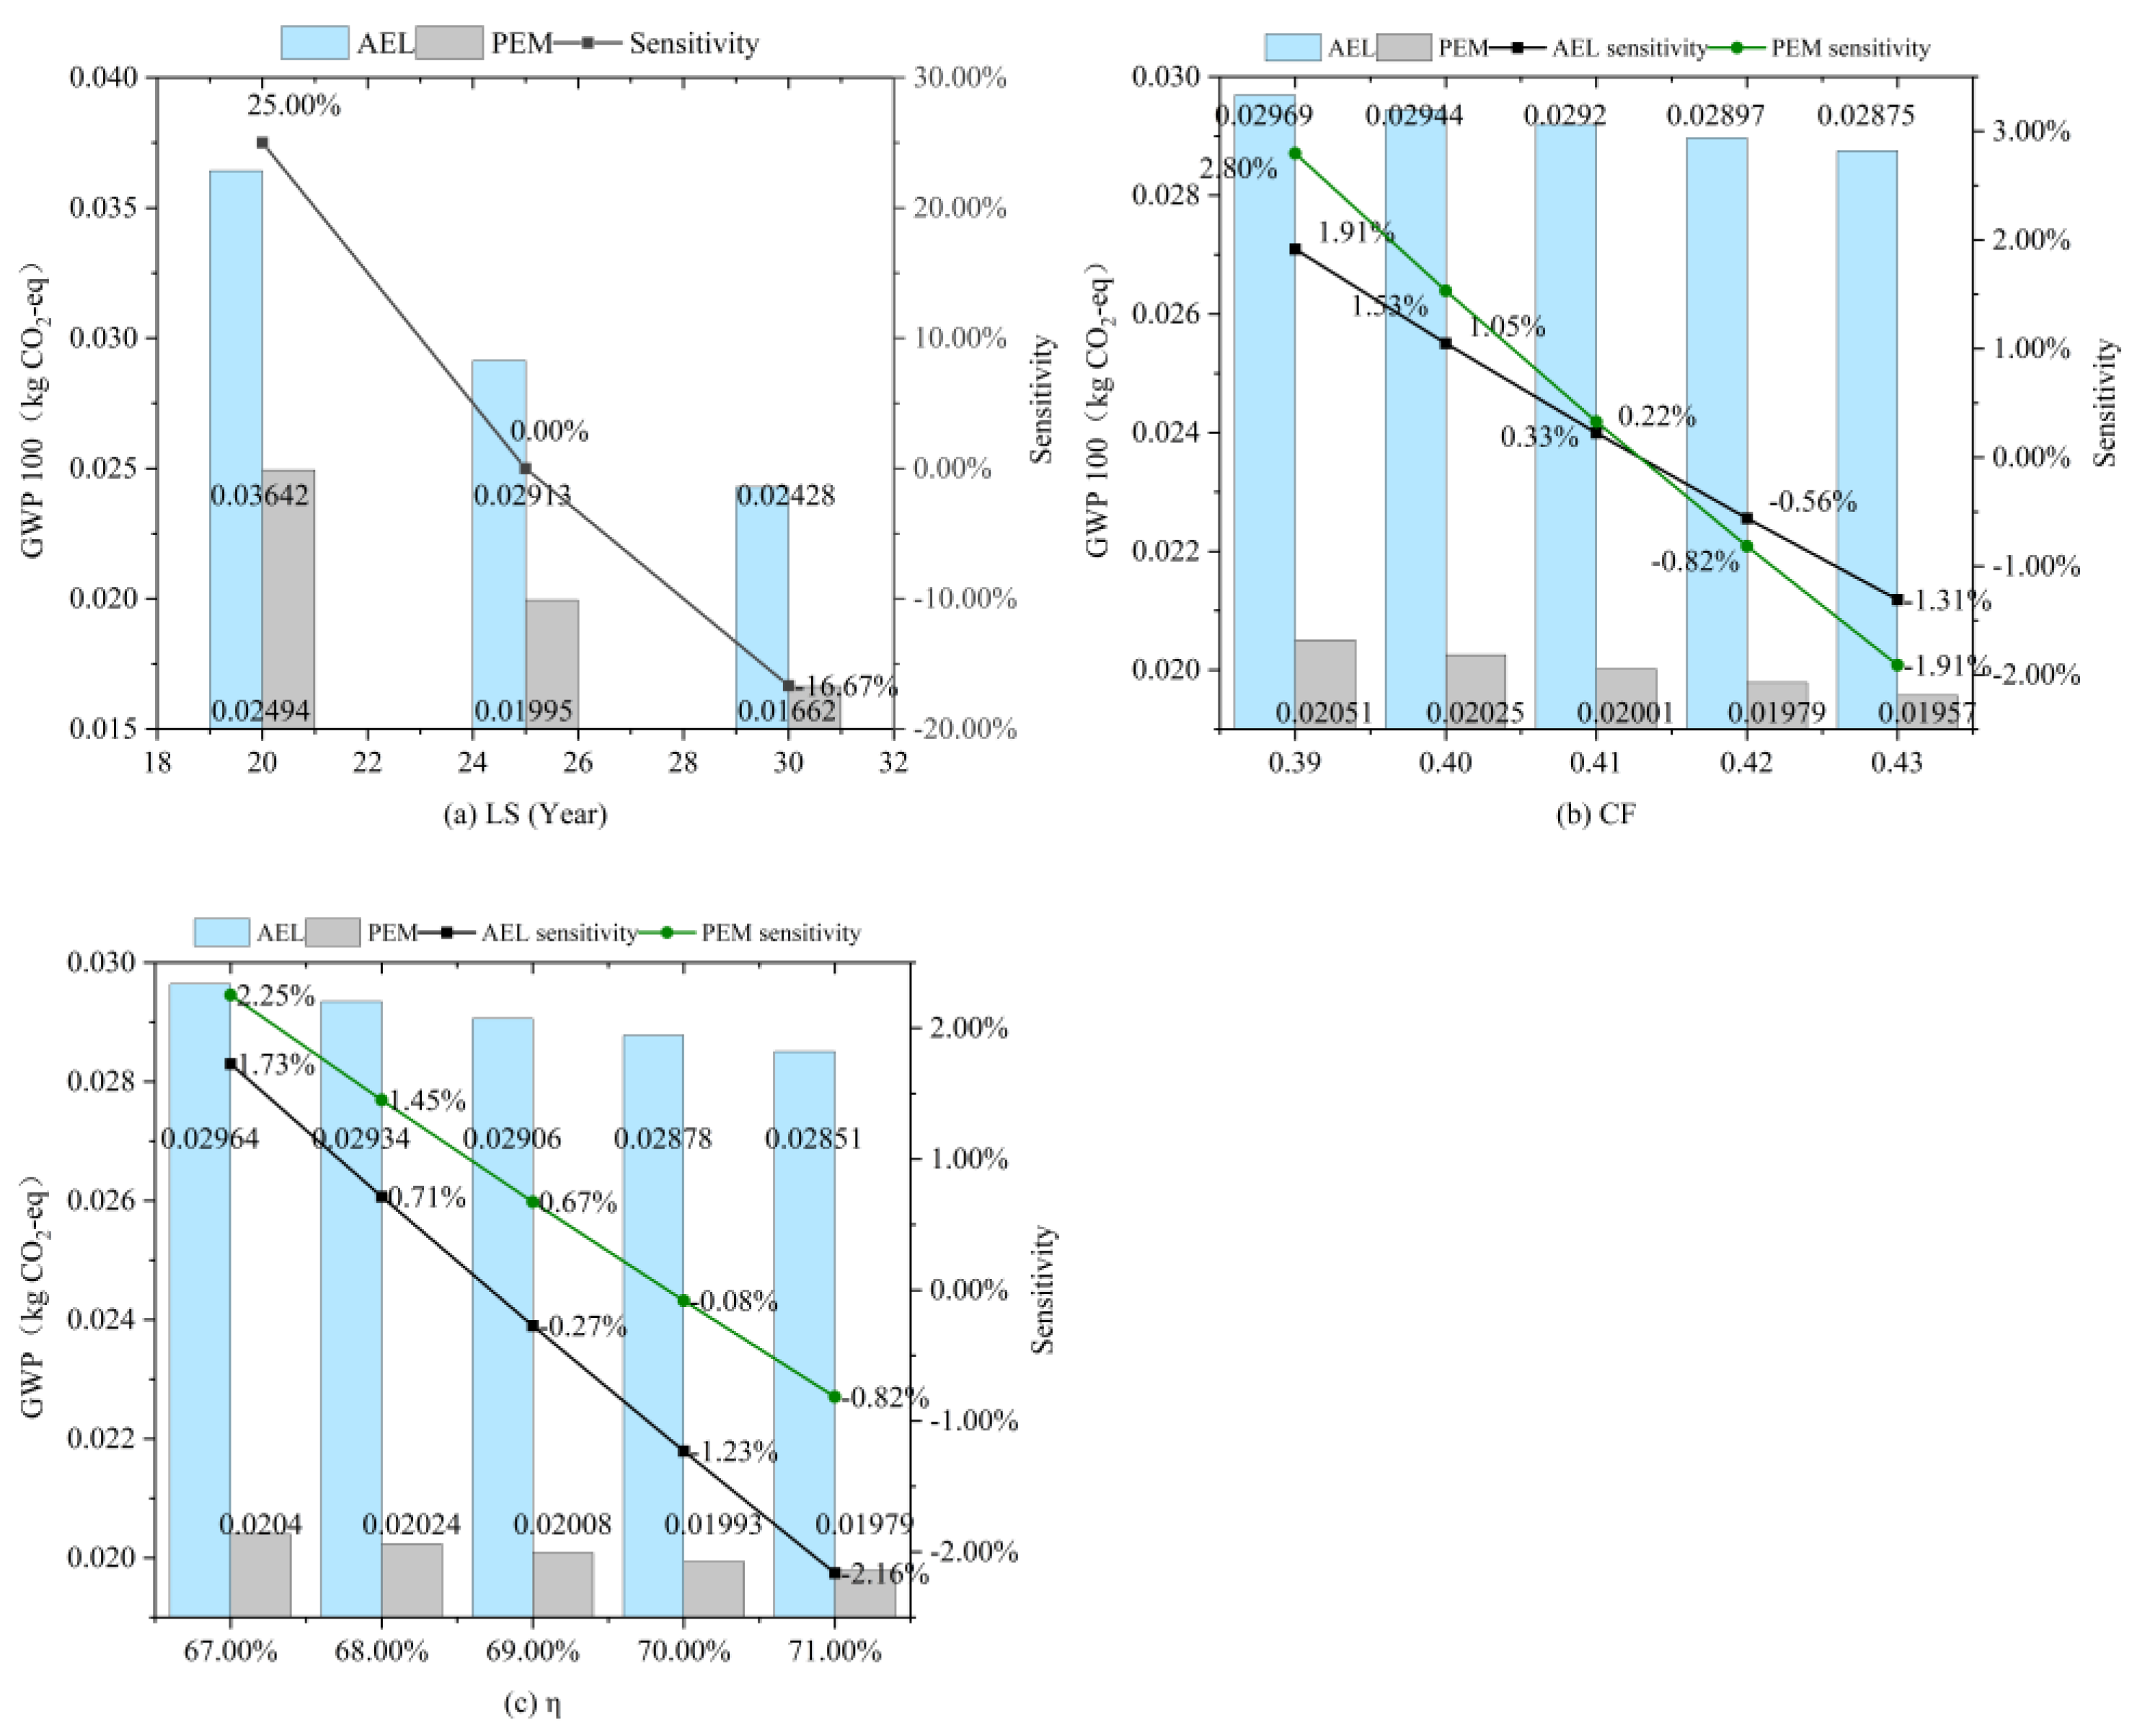
A single sensitivity analysis of the life span (LS), wind farm capacity factor (CF), and hydrogen production efficiency (η) of the offshore wind–hydrogen storage system for the two routes was performed, with the initial LS of the system being 25 years, CF 41.30%, η 68.72% and 69.89%, and the sensitivity analysis results of the above parameters were obtained.
Figure 17a shows that the 5-year OWP-HESS lifetime is more sensitive, and changes in it can have a significant impact on the system’s environmental impact results. Finding ways to increase the system lifetime is important for the full life cycle emission reduction of the system, and increasing the system lifetime by 5 years on the current basis can result in an emission reduction benefit of up to 16.67%. Figure 17b shows that increasing the capacity factor of wind farms can reduce the life cycle environmental impacts, and if the CF is increased to 43%, emission reduction benefits of 1.31% and 1.91% can be obtained, respectively. Figure 17c shows that increasing the hydrogen production efficiency reduces the system’s life cycle environmental impacts, and if η is increased to 71%, emission reductions of 2.16% and 0.82% are obtained.

4. Concluding Remarks

4.1. Conclusions

This study focuses on the offshore wind–hydrogen energy storage system as its research subject. It involves comparing the technical routes of each module within the system, defining research objectives, functional units, and system boundaries, compiling a comprehensive life cycle inventory, and identifying technical routes requiring further comparative investigation. Subsequently, a life cycle model for the offshore wind–hydrogen energy storage system is established. Using the process-based life cycle evaluation method, the OWP-HESS is split into two sub-systems, the offshore wind power system and the hydrogen energy storage system, for research, and finally the two sub-systems are unified. By constructing the life cycle inventory of the OWP-HESS, the material flows of the inputs and outputs of the whole system throughout its life cycle are quantified. On this basis, the life cycle model of the OWP-HESS is established, using the data from the life cycle inventory. The life cycle environmental impact is also evaluated, and conclusions are drawn based on the evaluation results and optimization directions are proposed. The main conclusions of this study are as follows:
OWP-HESS emerges as a viable pathway for renewable energy to break free from reliance on grid peak regulation services and achieve autonomous development, owing to its inherent capabilities of peak shaving and valley filling, hydrogen-based electricity storage, and utilization-oriented storage. The results of the life cycle environmental impacts show that the GWP per kWh of green electricity and per kg of green hydrogen produced by the system are 2.38 × 10⁻² kg CO2-eq/kWh and 0.96 kg CO2-eq/kg, respectively, and that the GWP for the combined energy supply unit of 0.4 kWh of green electricity and 1.09 × 10⁻² kg of green hydrogen is 2.00 × 10⁻² kg CO2-eq/unit, which has great emission reduction benefits compared to the emission factors of grid electricity and national hydrogen production, and can promote emission reductions in related industries that are difficult to electrify, avoiding the impact of marginal effects.
The advantageous model for offshore wind–hydrogen energy storage systems combines HVDC transmission for power transfer and DC collection for grid integration. The total environmental impact of the PEM route (2.39 × 10⁻¹³) is lower than that of AEL (2.92 × 10⁻¹³), and is better suited to the efficient coupling of offshore wind and hydrogen energy. The model also adopts an ammonia-mediated chemical hydrogen storage approach during the hydrogen storage phase—aligned with current technical maturity and market conditions, and leveraging well-established storage and transport infrastructures.
The results of the life cycle environmental impact assessment of the OWP-HESS show that within the offshore wind power system, the manufacture phase is the primary contributor to environmental impacts, accounting for 79.00% of the total. Specifically, the consumption of materials such as concrete and steel, as well as electricity usage during the manufacturing process, exert significant influences on indicators like GWP. Notably, the electrolyzer’s electricity has non-zero GWP, not from wind power’s operation, but from the study’s “cradle-to-grave” LCA—this aligns with the full-life-cycle perspective of our impact assessment. In contrast, the environmental impacts of the hydrogen energy storage system are predominantly concentrated in the operation and maintenance (O&M) phase: the O&M phase accounts for 66.03% of impacts for the alkaline electrolysis (AEL) route and a substantial 96.61% for the proton exchange membrane (PEM) route, with electricity consumption being the core driving factor in this phase. For the integrated system, the Marine Aquatic Ecotoxicity Potential (MAETP) represents 45.22% of impacts for the AEL route, while the Human Toxicity Potential (HTP) accounts for 47.61% for the PEM route. This toxicity stems from metal escape via electrode wear (Ni for AEL; Pt/Ir for PEM), the corrosion of metal components, and auxiliary system leakage, leading to metal particle/ion release into the environment. Material recycling during the decommissioning phase can effectively offset part of the negative environmental impacts, yielding a net environmental benefit.
Sensitivity analyses reveal the following findings: Extending the system lifespan from 25 years to 30 years achieves a 16.67% emission reduction benefit. Increasing the wind farm capacity factor from 41.30% to 43% leads to a 1.31–1.91% reduction in environmental impacts. When hydrogen production efficiency is enhanced to 71%, the AEL and PEM routes yield emission reduction benefits of 3.21% and 1.56%, respectively. Environmental impacts are most sensitive to the consumption of construction materials such as concrete and steel; reducing the use of materials with high environmental burdens or improving their recycling rates can significantly optimize system performance.

4.2. Future Research

This study establishes a life cycle model of OWP-HESS and evaluates the environmental impact of the system, and the results of the evaluation are helpful for the planning and optimization of industries related to the development of offshore wind power coupled with hydrogen energy storage. However, this study still has some imperfections in the process of researching the environmental impacts of the life cycle of OWP-HESS, and there is still room for further in-depth improvement of the research content, as listed below.
Adjust and optimize the advantageous model of OWP-HESS. The advantageous model and installed capacity ratio given in this study are based on the current technology level and market price, taking into account feasibility and economy. With the advancement of technology and the development of the market, more emerging technologies can be commercialized, and the advantage model and the installed capacity ratio will be changed accordingly. For example, the development of new energy storage materials provides new possibilities for optimizing the energy storage link of OWP-HESS: emerging advanced electrochemical storage materials (e.g., modified vanadium-based heterostructures or bio-additive-enhanced oxides [33,34], currently in early research stages) can serve as supplementary short-term storage for OWP-HESS, forming a hybrid system with hydrogen-based long-term storage to reduce operational environmental impacts and enhance flexibility. Future research should track technological and market advancements. Additionally, improved SOEC efficiency will reduce hydrogen production electricity use, potentially altering the conclusion that manufacturing and construction phases dominate environmental impacts.
Update and improve the life cycle inventory data of OWP-HESS. Some of the life cycle inventory data of OWP-HESS selected in this study comes from the literature, but this is second-hand data, which is not as accurate as the first-hand data obtained directly from manufacturers and related industries, and the timeliness is difficult to guarantee. For most LCA studies, the hardest part is to obtain first-hand data, and many choose to use second-hand data. However, in future research, we hope to focus on first-hand data to update and improve the life cycle inventory.
Select a more professional and advanced research platform. The main research platform chosen for this study is GaBi software, on which the establishment of life cycle models and the evaluation of environmental impacts are completed. However, GaBi software still has limitations such as imperfect data and incomplete functions, which affect the final quality of the study to a certain extent. Therefore, more advanced life cycle assessment tools, such as the Brightway2 open-source life cycle assessment tool, can be applied by researchers in future studies.


Author Contributions

Conceptualization, W.-C.M. and J.-Y.Y.; methodology, Z.-M.Y.; validation, Y.-W.C.; formal analysis, Z.R.; investigation, X.L.; resources, W.-C.M.; data curation, H.-Y.T.; writing—original draft, H.-Y.T. and J.-Z.L.; writing—review and editing, H.-Y.J. and J.-Z.L.; supervision, Y.-W.C.; project administration, J.-Y.Y.; funding acquisition, W.-C.M. All authors have read and agreed to the published version of the manuscript.

Funding

This research was funded by the Science and Technology Project of the Guangxi Power Grid (Grant No. GXKJXM20222198).

Data Availability Statement

Data will be made available upon request.

Conflicts of Interest

Authors Wen-Chuan Meng, Zai-Min Yang, Jing-Yi Yu, and Zhi Rao were employed by the China Southern Power Grid. Author Xin Lin was employed Guangxi Power Grid. The remaining authors declare that the research were conducted in the absence of any commercial or financial relationships that could be construed as a potential conflict of interest.

References

  1. Liu, M.; Tang, L.; Zeng, J.; Huang, G.; Liu, X.; Yao, S.; He, G.; Shang, N.; Tao, H.; Ren, S.; et al. Promoting Decarbonization in China: Revealing the Impact of Various Energy Policies on the Power Sector Based on a Coupled Model. Energies 2024, 17, 3234. [Google Scholar] [CrossRef]
  2. Lu, X.; McElroy, M.B.; Kiviluoma, J. Global Potential for Wind-Generated Electricity. Proc. Natl. Acad. Sci. USA 2009, 106, 10933–10938. [Google Scholar] [CrossRef]
  3. Liu, Y.; Lin, J.; Huang, R. A Novel Planning Method of Enhancing Grid-Connected Flexibility for Offshore Wind Power HVDC Integration Systems. Electr. Power Syst. Res. 2025, 242, 111431. [Google Scholar] [CrossRef]
  4. Zhang, C.; Song, P.; Hou, J.; Xiao, L.; Wang, X.; Yang, F.; Wang, X. Technical and Economic Analysis of Hydrogen Production, Storage and Transportation by Offshore Wind Power in Different Scenarios: A Guangdong Case Study. Int. J. Hydrogen Energy 2024, 94, 829–837. [Google Scholar] [CrossRef]
  5. Liu, X.; Huang, Y.; Shi, X.; Bai, W.; Huang, S.; Li, P.; Xu, M.; Li, Y. Offshore Wind Power-Seawater Electrolysis-Salt Cavern Hydrogen Storage Coupling System: Potential and Challenges. Energies 2025, 18, 169. [Google Scholar] [CrossRef]
  6. Duan, F.; Bu, X. A New Cloud-Stochastic Framework for Optimized Deployment of Hydrogen Storage in Distribution Network Integrated with Renewable Energy Considering Hydrogen-Based Demand Response. Energy 2025, 316, 134483. [Google Scholar] [CrossRef]
  7. Luo, Z.; Wang, X.; Wen, H.; Pei, A. Hydrogen Production from Offshore Wind Power in South China. Int. J. Hydrogen Energy 2022, 47, 24558–24568. [Google Scholar] [CrossRef]
  8. Gao, X.; Wang, S.; Sun, Y.; Zhai, J.; Chen, N.; Zhang, X.-P. Low-Carbon Energy Scheduling for Integrated Energy Systems Considering Offshore Wind Power Hydrogen Production and Dynamic Hydrogen Doping Strategy. Appl. Energy 2024, 376, 124194. [Google Scholar] [CrossRef]
  9. Song, S.; Lin, H.; Sherman, P.; Yang, X.; Nielsen, C.P.; Chen, X.; McElroy, M.B. Production of Hydrogen from Offshore Wind in China and Cost-Competitive Supply to Japan. Nat. Commun. 2021, 12, 6953. [Google Scholar] [CrossRef]
  10. Wang, X.; Li, L.; Palazoglu, A.; El-Farra, N.H.; Shah, N. Optimization and Control of Offshore Wind Systems with Energy Storage. Energy Convers. Manag. 2018, 173, 426–437. [Google Scholar] [CrossRef]
  11. Scolaro, M.; Kittner, N. Optimizing Hybrid Offshore Wind Farms for Cost-Competitive Hydrogen Production in Germany. Int. J. Hydrogen Energy 2022, 47, 6478–6493. [Google Scholar] [CrossRef]
  12. Choe, C.; Moon, J.A.; Gu, J.; Lee, A.; Lim, H. Life Cycle Sustainability Assessment for Sustainable Energy Future: A Short Review on Opportunity and Challenge. Curr. Opin. Green Sustain. Chem. 2024, 50, 100974. [Google Scholar] [CrossRef]
  13. Liu, M.; Zhu, G.; Tian, Y. The Historical Evolution and Research Trends of Life Cycle Assessment. Green Carbon 2024, 2, 425–437. [Google Scholar] [CrossRef]
  14. Krishnan, S.; Corona, B.; Kramer, G.J.; Junginger, M.; Koning, V. Prospective LCA of Alkaline and PEM Electrolyser Systems. Int. J. Hydrogen Energy 2024, 55, 26–41. [Google Scholar] [CrossRef]
  15. Zhang, J.; Wang, Z.; He, Y.; Li, M.; Wang, X.; Wang, B.; Zhu, Y.; Cen, K. Comparison of Onshore/Offshore Wind Power Hydrogen Production through Water Electrolysis by Life Cycle Assessment. Sustain. Energy Technol. Assess. 2023, 60, 103515. [Google Scholar] [CrossRef]
  16. Noh, H.; Kang, K.; Seo, Y. Environmental and Energy Efficiency Assessments of Offshore Hydrogen Supply Chains Utilizing Compressed Gaseous Hydrogen, Liquefied Hydrogen, Liquid Organic Hydrogen Carriers and Ammonia. Int. J. Hydrogen Energy 2023, 48, 7515–7532. [Google Scholar] [CrossRef]
  17. Ghandehariun, S.; Kumar, A. Life Cycle Assessment of Wind-Based Hydrogen Production in Western Canada. Int. J. Hydrogen Energy 2016, 41, 9696–9704. [Google Scholar] [CrossRef]
  18. Cao, Y.; Meng, Y.; Zhang, Z.; Yang, Q.; Li, Y.; Liu, C.; Ba, S. Life Cycle Environmental Analysis of Offshore Wind Power: A Case Study of the Large-Scale Offshore Wind Farm in China. Renew. Sustain. Energy Rev. 2024, 196, 114351. [Google Scholar] [CrossRef]
  19. Davies, A.J.; Hastings, A. Lifetime Greenhouse Gas Emissions from Offshore Hydrogen Production. Energy Rep. 2023, 10, 1538–1554. [Google Scholar] [CrossRef]
  20. Hassan, N.S.; Jalil, A.A.; Rajendran, S.; Khusnun, N.F.; Bahari, M.B.; Johari, A.; Kamaruddin, M.J.; Ismail, M. Recent Review and Evaluation of Green Hydrogen Production via Water Electrolysis for a Sustainable and Clean Energy Society. Int. J. Hydrogen Energy 2024, 52, 420–441. [Google Scholar] [CrossRef]
  21. Henriksen, M.S.; Matthews, H.S.; White, J.; Walsh, L.; Grol, E.; Jamieson, M.; Skone, T.J. Tradeoffs in Life Cycle Water Use and Greenhouse Gas Emissions of Hydrogen Production Pathways. Int. J. Hydrogen Energy 2024, 49, 1221–1234. [Google Scholar] [CrossRef]
  22. ISO 14040:2006; Environmental Management—Life Cycle Assessment—Principles and Framework. ISO: Geneva, Switzerland, 2006. Available online: https://www.iso.org/standard/37456.html (accessed on 25 November 2025).
  23. Weidner, T.; Tulus, V.; Guillén-Gosálbez, G. Environmental Sustainability Assessment of Large-Scale Hydrogen Production Using Prospective Life Cycle Analysis. Int. J. Hydrogen Energy 2023, 48, 8310–8327. [Google Scholar] [CrossRef]
  24. Li, Z.; Qiao, Y.; Lu, Z. Operation Mode Analysis and Configuration Optimization of Offshore Wind-Hydrogen System. Autom. Electr. Power Syst. 2022, 46, 104–112. [Google Scholar] [CrossRef]
  25. Böhm, H.; Zauner, A.; Rosenfeld, D.C.; Tichler, R. Projecting Cost Development for Future Large-Scale Power-to-Gas Implementations by Scaling Effects. Appl. Energy 2020, 264, 114780. [Google Scholar] [CrossRef]
  26. Zhang, X.; Bauer, C.; Mutel, C.L.; Volkart, K. Life Cycle Assessment of Power-to-Gas: Approaches, System Variations and Their Environmental Implications. Appl. Energy 2017, 190, 326–338. [Google Scholar] [CrossRef]
  27. ISO 14044:2006; Environmental Management—Life Cycle Assessment—Requirements and Guidelines. ISO: Geneva, Switzerland, 2006. Available online: https://www.iso.org/standard/38498.html (accessed on 25 November 2025).
  28. Zhichu, C.; Koondhar, M.A.; Kaloi, G.S.; Yousaf, M.Z.; Ali, A.; Alaas, Z.M.; Bouallegue, B.; Ahmed, A.M.; Ahmed Elshrief, Y. Offshore Wind Farms Interfacing Using HVAC-HVDC Schemes: A Review. Comput. Electr. Eng. 2024, 120, 109797. [Google Scholar] [CrossRef]
  29. Kang, K.; Cao, C.; Jiang, C.; Li, W.; Tang, C.; Liu, Q.; Huang, L.; Wen, C. Capacity Optimization for Minimizing the Cost on a Hydrogen Production System Coupling the Wind and Solar Power Generation with PEM Water Electrolysis. Energy 2025, 335, 138076. [Google Scholar] [CrossRef]
  30. Wei, Y. Comparative Research on the Lifetime Resource Consumption and Environmental Impact of an Offshore Wind Farm. Master’s Thesis, Xiamen University, Xiamen, China, 2019. [Google Scholar]
  31. Zhao, J. Life Cycle Assessment and Application Potential Analysis of Hydrogen Production System from Abandoned Electricity of Renewable Energy in China; Shanghai Jiao Tong University: Shanghai, China, 2020. [Google Scholar] [CrossRef]
  32. Hu, R.; Wen, C.; Ye, Z.; Qi, Y.; Zhang, B.; Kang, K.; Gao, Y.; Wang, D.; Tu, Z. A Comprehensive Review of Flow Channel Designs and Optimizations for Water Electrolysis Technology. Appl. Energy 2025, 400, 126643. [Google Scholar] [CrossRef]
  33. Wang, D.; Wen, C.; Xu, M.; Wen, W.; Tu, J.; Zhu, G.; Zhou, Z.; Tu, Z.; Fu, Y. In-Situ Construction of VN-Based Heterostructure with High Interfacial Stability and Porous Channel Effect for Efficient Zinc Ion Storage. J. Mater. Sci. Technol. 2025, 224, 205–215. [Google Scholar] [CrossRef]
  34. Wang, D.; Wen, C.; Zhu, G.; Tu, J.; Kang, K.; Qi, Y.; Zhang, B.; Zhou, Z. Modifying V2O5 Structure with Bio-Additive via Thermal Reconfiguration for Enhanced Cathode in Aqueous Zinc Ion Batteries. Chem. Eng. J. 2025, 512, 162448. [Google Scholar] [CrossRef]
Figure 1. Global total installed capacity offshore in 2023 (from Global Wind Energy Council’s global wind report 2024).
Energies 18 06279 g001
Figure 2. System boundary diagram of the OWP-HESS.
Energies 18 06279 g002
Figure 3. Characterization results of environmental impact assessment indicators for offshore wind power systems.
Energies 18 06279 g003
Figure 4. Weighting results of environmental impact assessment indicators for offshore wind power systems.
Energies 18 06279 g004
Figure 5. Results of sensitivity analysis of material flows of inputs and outputs of offshore wind system.
Energies 18 06279 g005
Figure 6. Sensitivity analysis results of (a) Wind turbine lifetime (LS, year), (b) Wind farm capacity factor (CF).
Energies 18 06279 g006
Figure 7. Results of Monte Carlo analyses of input and output material flows of environmental impacts of offshore wind power systems.
Energies 18 06279 g007
Figure 8. Characterization results of environmental impact assessment indicators for hydrogen energy storage system based on AEL hydrogen production route.
Energies 18 06279 g008
Figure 9. Characterization results of environmental impact assessment indicators for hydrogen energy storage system based on PEM hydrogen production route.
Energies 18 06279 g009
Figure 10. Weighting results of environmental impact assessment indicators of hydrogen energy storage system based on AEL hydrogen production route.
Energies 18 06279 g010
Figure 11. Weighting results of environmental impact assessment indicators of hydrogen storage system based on PEM hydrogen production route.
Energies 18 06279 g011
Figure 12. Sensitivity analysis results of (a) electrolytic cell lifetime, (b) hydrogen production efficiency.
Energies 18 06279 g012
Figure 13. Characterization results of environmental impact assessment indicators for offshore wind power–hydrogen storage system based on AEL hydrogen production route.
Energies 18 06279 g013
Figure 14. Characterization results of environmental impact assessment indicators for offshore wind power–hydrogen storage system based on PEM hydrogen production route.
Energies 18 06279 g014
Figure 15. Weighted results of environmental impact assessment indicators for OWP-HESS based on AEL hydrogen production route.
Energies 18 06279 g015
Figure 16. Weighting results of environmental impact assessment indicators of OWP-HESS based on PEM hydrogen production route.
Energies 18 06279 g016
Figure 17. Global sensitivity analysis results of (a) OWP-HESS life, (b) wind farm capacity factors, and (c) hydrogen production efficiency.
Energies 18 06279 g017
Table 1. CML2001 environmental impact assessment indicators [22].
Environmental Impact Assessment IndicatorsAcronyms
Abiotic Depletion ElementsADP
Abiotic Depletion FossilADP fossil
Acidification PotentialAP
Eutrophication PotentialEP
Freshwater Aquatic Ecotoxicity PotentialFAETP
Global Warming PotentialGWP
Global Warming Potential (excluding biogenic carbon) GWP, excl.
Human Toxicity PotentialHTP
Marine Aquatic Ecotoxicity PotentialMAETP
(steady-state) Ozone Layer Depletion PotentialODP
Photochemical Ozone Creation PotentialPOCP
Terrestrial Ecotoxicity PotentialTETP
Table 2. Inventory of the life cycle of offshore wind power systems in the manufacture phase.
MaterialsQuantitiesUnit
Steel1.54 × 10−3kg/kWh
Glass fiber1.11 × 10−4kg/kWh
Epoxy resin (chemistry)5.91 × 10⁻⁵kg/kWh
Copper2.50 × 10−5kg/kWh
Silicon steel sheet2.50 × 10−5kg/kWh
Magnet wire9.43 × 10−6kg/kWh
Caoutchouc3.32 × 10−6kg/kWh
Polythene2.96 × 10−6kg/kWh
Electricity6.89 × 10−3kWh/kWh
Table 3. Life cycle inventory for the construction phase of offshore wind farms.
MaterialsQuantitiesUnit
Concrete1.95 × 10−2kg/kWh
Shingle3.59 × 10−3kg/kWh
Steel reinforcing bar2.38 × 10−3kg/kWh
Steel wire8.92 × 10−5kg/kWh
Alloy lead5.91 × 10−5kg/kWh
Steel5.61 × 10−5kg/kWh
Copper conductor5.06 × 10−5kg/kWh
Polyethylene3.25 × 10−5kg/kWh
Polypropylene2.96 × 10−5kg/kWh
Silicon steel sheet4.86 × 10−6kg/kWh
Asphalt4.14 × 10−6kg/kWh
Rubber1.80 × 10−6kg/kWh
Iron1.43 × 10−6kg/kWh
Paint1.07 × 10−6kg/kWh
Aluminum6.15 × 10−7kg/kWh
Diesel1.10 × 10−4kg/kWh
Electricity7.87 × 10−5kWh/kWh
Table 4. Life cycle checklist for the O&M phase of offshore wind farms.
MaterialsQuantitiesUnit
Glass fiber3.29× 10−5kg/kWh
Steel1.91 × 10−5kg/kWh
Epoxy resin1.59 × 10−5kg/kWh
Lubricant1.23 × 10−5kg/kWh
Silicon steel sheet3.74 × 10−6kg/kWh
Grease2.20 × 10−6kg/kWh
Electromagnetic wire1.41 × 10−6kg/kWh
Diesel oil3.27 × 10−4kg/kWh
Table 5. Life cycle inventory for the decommissioning phase of offshore wind farms.
MaterialsMode of DisposalQuantitiesUnit
Concrete0% recycled/100% landfilled0/5.82 × 10−3kg/kWh
Steel90% recycled/10% landfilled3.53 × 10−3/3.92 × 10−4kg/kWh
Glass fiber0% recycled/100% landfilled0/1.11 × 10−4kg/kWh
Epoxy resin0% recycled/100% landfilled0/6.03 × 10−5kg/kWh
Copper95% recycled/5% landfilled3.27 × 10−5/1.73 × 10−6kg/kWh
Diesel 7.86 × 10⁻⁵kg/kWh
Table 6. Life cycle inventory of the manufacture phase of hydrogen energy storage systems based on the AEL hydrogen production route [31].
MaterialsQuantitiesUnit
Cold rolled steel1.84 × 10−1kg/kgH2
Aluminum6.02 × 10−4kg/kgH2
Copper2.68 × 10−3kg/kgH2
Nickel2.01 × 10−2kg/kgH2
Platinum1.60 × 10−5kg/kgH2
Potassium hydroxide1.46 × 10−2kg/kgH2
Graphite5.76 × 10−4kg/kgH2
Soft water85.30kg/kgH2
Carbon monoxide2.01 × 10−4kg/kgH2
Polyphenylene sulfide4.02 × 10−4kg/kgH2
Lubricant6.43 × 10−7kg/kgH2
Acrylonitrile-butadiene-styrene2.14 × 10−4kg/kgH2
Polytetrafluoroethylene1.04 × 10−4kg/kgH2
Table 7. Life cycle inventory of the manufacture phase of hydrogen energy storage systems based on the PEM hydrogen production route [31].
MaterialsQuantitiesUnit
Low alloy steel5.30 × 10−3kg/kgH2
High alloy steel2.10 × 10−3kg/kgH2
Stainless steel1.11 × 10−4kg/kgH2
Aluminum1.40 × 10−4kg/kgH2
Copper3.36 × 10−4kg/kgH2
Titanium5.83 × 10−4kg/kgH2
Iridium8.30 × 10−7kg/kgH2
Platinum8.00 × 10−8kg/kgH2
Activated carbon9.94 × 10−6kg/kgH2
Nafion™1.77 × 10⁻⁵kg/kgH2
Plastics1.11 × 10−4kg/kgH2
Cement6.19 × 10−3kg/kgH2
Table 8. Life cycle inventory of the manufacture phase of a desalination system based on RO reverse osmosis [15].
MaterialsQuantitiesUnit
Aerated concrete4.78 × 10−3kg/kgH2
Biological oxygen demand (BOD)1.18 × 10⁻³kg/kgH2
Carbon dioxide7.06 × 10−3kg/kgH2
Chemical oxygen demand (COD)2.23 × 10⁻³kg/kgH2
Citric acid1.36 × 10−4kg/kgH2
Electricity2.91kWh/kgH2
Ferric chloride7.06 × 10−3kg/kgH2
Glass fiber-reinforced pipe7.46 × 10−4kg/kgH2
Limestone4.67 × 10−2kg/kgH2
Neutral salt31.70kg/kgH2
Polyamide 6 film (PA6)7.30 × 10⁻⁵kg/kgH2
Polyethylene components (PE)3.27 × 10⁻⁴kg/kgH2
Polyvinyl chloride (PVAC)1.21 × 10⁻⁵kg/kgH2
Seawater1.00 × 10−3m3/kgH2
Sodium hydroxide2.52 × 10−2kg/kgH2
Sodium hypochlorite5.88 × 10−3kg/kgH2
Reinforcing steel3.03 × 10−3kg/kgH2
Sulphury acid6.19 × 10−2kg/kgH2
Total organic bound carbon9.56 × 10−5kg/kgH2
Table 9. Life cycle checklist for the O&M phase of hydrogen energy storage systems based on the AEL hydrogen production route [31].
MaterialsQuantitiesUnit
Pure water9.00kg/kgH2
Zirconium oxide1.21 × 10−3kg/kgH2
Water vapor9.37 × 10−4MJ/kgH2
Thermal energy1.18 × 10−1MJ/kgH2
Electricity55.51kWh/kgH2
Table 10. Life cycle checklist for the O&M phase of hydrogen energy storage systems based on the PEM hydrogen production route [31].
MaterialsQuantitiesUnit
Purified water9.00kg/kgH2
Electricity54.81kWh/kgH2
Disclaimer/Publisher’s Note: The statements, opinions and data contained in all publications are solely those of the individual author(s) and contributor(s) and not of MDPI and/or the editor(s). MDPI and/or the editor(s) disclaim responsibility for any injury to people or property resulting from any ideas, methods, instructions or products referred to in the content.