Article

Adaptive Risk-Driven Control Strategy for Enhancing Highway Renewable Energy System Resilience Against Extreme Weather

1
Gezhouba Group Transportation Investment Co., Ltd., Wuhan 430000, China
2
School of Energy and Power Engineering, Huazhong University of Science and Technology, Wuhan 430074, China
3
China-EU Institute for Clean and Renewable Energy, Huazhong University of Science and Technology, Wuhan 430074, China
*
Author to whom correspondence should be addressed.
Energies 2025, 18(20), 5417; https://doi.org/10.3390/en18205417
Submission received: 14 August 2025 / Revised: 8 September 2025 / Accepted: 17 September 2025 / Published: 14 October 2025
(This article belongs to the Special Issue Recent Advances in Renewable Energy and Hydrogen Technologies)

Abstract

Traditional centralized highway energy systems exhibit significant resilience shortcomings in the face of climate change mitigation requirements and increasingly frequent extreme weather events. Meanwhile, prevailing microgrid control strategies remain predominantly focused on economic optimization under normal conditions, lacking the flexibility to address dynamic risks or the interdependencies between transportation and power systems. This study proposes an adaptive, risk-driven control framework that holistically coordinates power generation infrastructures, microgrids, demand-side loads, energy storage systems, and transport dynamics through continuous risk assessment. This enables the system to dynamically shift operational priorities—from cost-efficiency in stable periods to robustness during emergencies. A multi-objective optimization model is established, integrating infrastructure resilience, operational costs, and traffic impacts. It is solved using an enhanced evolutionary algorithm that combines the non-dominated sorting genetic algorithm II with differential evolution (NSGA-II-DE). Extensive simulations under extreme weather scenarios validate the framework’s ability to autonomously reconfigure operations, achieving 92.5% renewable energy utilization under low-risk conditions while elevating critical load assurance to 98.8% under high-risk scenarios. This strategy provides both theoretical and technical guarantees for securing highway renewable energy system operations.

1. Introduction

The transportation sector contributes approximately 24% of global energy-related CO2 emissions, making its decarbonization critical to achieving international climate targets [1]. Recent advances suggest that integrating smart grid technologies with transportation infrastructure can substantially reduce emissions while preserving system reliability [2]. At the same time, as a vital component of national infrastructure, highway energy demand is rising at an unprecedented rate. However, conventional power supply models face fundamental challenges, including high long-distance transmission costs, limited reliability, and inadequate adaptability to environmental changes.
These limitations are further compounded by the increasing frequency and severity of extreme weather events due to global climate change. The inherent vulnerability of traditional power control under such conditions has been well documented, e.g., the 2024 Brazil floods that submerged critical substations serving major highways, causing nationwide transportation paralysis for 11 days [3]. These incidents led to widespread and prolonged outages, causing severe traffic disruptions, obstructing emergency routes, and posing serious threats to public safety. Consequently, the development of self-consistent energy systems—capable of proactive risk detection, precise assessment, and resilient response—has become a strategic imperative for ensuring the secure operation of national highway infrastructure.
Extensive research has focused on optimal microgrid scheduling, establishing a solid foundation for this study. At the algorithmic level, various intelligent optimization methods—such as the sparrow search algorithm and the honey badger algorithm [4]—have been used to improve the economic and environmental performance of microgrids. In terms of coordinated control, Niu et al. proposed a dispatch strategy based on distributed model predictive control for highway microgrids equipped with mobile energy storage systems [5]. Similarly, Karimi et al. developed a multi-layered, four-objective optimization framework to balance economic, reliability, environmental, and technical criteria [6]. On the demand side, improvements have been made through optimizing electric vehicle (EV) charging behaviors and deploying hybrid energy storage systems.
However, these existing approaches face significant limitations when applied to highway emergency scenarios. Most control strategies are designed for economic optimization under normal operating conditions [7]. Although some studies have considered reliability, it is often treated as a static constraint rather than a dynamic control that adapts to emergencies [8].
A more fundamental limitation lies in the conceptual boundaries of traditional microgrid control models, which are largely confined to the four-dimensional framework of “source–grid–load–storage”. Transportation-induced loads-particularly EV charging demand—are often modeled as exogenous, stochastic disturbances rather than as controllable resources [9]. As a result, control systems are reactive rather than proactive in managing these dynamics. Moreover, existing models often fail to capture the bidirectional interdependencies between transportation and power systems, where EV charging demand is both influenced by and imposes constraints on traffic flow [10]. To further elucidate the novelty of this study, Table 1 provides a comparative summary between the proposed framework and existing approaches in the literature across key dimensions, including control focus, risk handling, integration of transportation dynamics, optimization approach, and algorithmic solution.
This shortfall reveals a critical research gap. The core question is no longer how to satisfy energy demand more economically but whether the transportation system itself can be leveraged as a flexible asset, enabling a shift from passive response to active co-management. For example, EV charging demand at highway service areas is closely linked to upstream traffic flow: a 10% increase in vehicle throughput typically results in a 6–8% rise in peak-hour power demand [11]. Advanced traffic management techniques—such as dynamic speed regulation, congestion pricing, and adaptive routing—can shape traffic behavior to optimize energy consumption across the integrated transport energy system [12]. This shifts the traditional “load-following” model towards a more complex yet more powerful “transport energy co-optimization” problem.
Table 1. Comparative analysis of the proposed framework with existing studies.
AspectExisting Studies Proposed FrameworkNovelty Emphasis
Control FocusPredominantly economic optimization under normal conditions [9].Dynamic, risk-driven optimization shifting between economy, resilience, and recovery objectives.Hierarchical use of risk levels; shifts from passive economic operation to proactive resilience management [9]; focuses on scheduling under uncertainty, not dynamic priority-shifting.
Risk HandlingOften static reliability constraints; reactive response to failures [10].Proactive, adaptive hierarchical control based on continuous quantitative risk assessment.Risk-driven adaptive control; moves beyond static “N − 1” reliability to a predictive, graded response system [10]; reviews reliability optimization but not dynamic risk adaptation.
Traffic IntegrationTreated as exogenous, stochastic load demand [10].Endogenous, controllable variable within a holistic “source–grid–load–storage–road” co-optimization model.Integration of traffic as an endogenous variable; enables active shaping of traffic flow (e.g., via guidance) to alleviate energy stress, not just passive load forecasting [10]; models EV charging as an exogenous input.
Optimization ApproachOften single-objective (cost) or dual-objective (cost and emissions) [4].Multi-objective explicit trade-off among resilience (f1), cost (f2), and traffic impact (f3).Multi-objective co-optimization; introduces and quantifies traffic impact (f3) as a core objective, capturing the socio-economic cost of energy dispatch decisions on transportation [4]; uses a four-objective framework but does not include traffic impact.
AlgorithmConventional optimization or standard algorithms (e.g., standard NSGA-II) [13].Enhanced NSGA-II-DE hybrid algorithm combining global exploration (DE) and local exploitation (NSGA-II).Combination of NSGA-II with differential evolution (DE). The DE mutation operator enhances the ability to escape local optima and find a better-distributed Pareto front under high-dimensional, complex constraints [13]; is the standard NSGA-II algorithm.

2. Methodology

To systematically resolve the challenge of conflicting control objectives and resource coordination under varying operational conditions, this study proposes a cooperative control framework integrating power generation infrastructures, microgrids, demand-side loads, energy storage systems, and transport dynamics. The core concept is to establish a new control strategy that deterministically maps system risk levels to corresponding control modes, ensuring that appropriate actions are taken at the right time and towards the right objective.
This control strategy for enhancing highway renewable energy system resilience consists of three parts: the hierarchical synergistic control framework, the multi-objective optimization model, and the optimization algorithm based on improved non-dominated sorting genetic algorithms-II (NSGA-II). Figure 1 shows in detail the complete procedure of the optimization strategy.

2.1. Hierarchical Synergistic Control Framework

The highly complex, dynamic multi-objective optimization problem is firstly decomposed into four sub-problems, each with clearly defined goals. Risk assessment level acts as the sole trigger for state transitions, ensuring that control objectives and priorities are dynamically realigned. As the system transitions across different risk levels, its core mission and operational logic shift accordingly. This architecture strikes a balance between theoretical optimality and practical implementability, greatly enhancing its applicability in real-world scenarios. The mapping between risk levels, control modes, optimization objectives, and synergy dimensions is presented in Table 2.
The risk assessment module operates as a continuous and quantitative process, synthesizing a wide array of exogenous and endogenous inputs to compute a composite risk index R. Key inputs include: (1) extreme weather forecasts [14] (e.g., typhoon track, predicted wind speed, and precipitation); (2) real-time system statuses [4] (e.g., equipment availability, state-of-charge of energy storage, and main grid connection integrity); and (3) traffic flow predictions [15]. This index R is dynamically updated and mapped to predefined thresholds corresponding to the four risk levels (low, medium, high, and severe).
The system switches control modes automatically when the risk index R crosses predefined thresholds. For example, an upgrade of the typhoon alert from blue to yellow would increase R, potentially pushing it past the threshold for low-risk mode and triggering a shift to medium-risk mode. This initiates preemptive measures like charging energy storage systems.
Tier 1: Economic operation mode (low-risk): When the system is assessed to be within the low-risk category, the primary control objective is to minimize total operational costs. Control strategies prioritize the utilization of renewable energy sources such as solar and wind power, stabilize power fluctuations through energy storage systems, and maintain deep standby for high-cost generators, such as diesel units, to reduce unnecessary expenditure and carbon emissions.
Tier 2: Preventive control mode (medium-risk): When potential threats (e.g., typhoon alerts or abnormal load forecasts) elevate the system into the medium-risk category, the control objective shifts to maximizing the system’s resilience margin. At this stage, the system adopts proactive, though temporarily less economical, preventive measures. These include pre-charging energy storage systems to higher states of charge (SOC), implementing dynamic pricing or information-based guidance to influence traffic flows, and creating a “buffer zone” of operational flexibility to mitigate future disruptions.
Tier 3: Emergency response mode (high-risk): When subjected to major external shocks (e.g., loss of grid connection or sudden component failure) and classified as high-risk, the system shifts into an emergency response mode. Economic considerations are deprioritized, and the sole objective becomes the minimization of power outages to critical infrastructure. The control system initiates a priority-based load-shedding sequence, ensuring continuous supply to vital assets such as tunnels, communication hubs, and emergency facilities, while activating all available backup power sources, including mobile storage and standby generators.
Tier 4: Recovery control mode (severe-risk): In the post-disruption recovery phase, categorized as severe-risk, the primary goal becomes minimizing system restoration time. Key technologies in this phase include fault location, isolation, and service restoration, as well as black-start capabilities. Renewable-based islanding units (e.g., photovoltaic (PV)-storage microgrids with autonomous operation functionality) are leveraged to form “power islands”, which serve as anchor points for phased restoration of the broader energy network.

2.2. Multi-Objective Optimization Model

To operationalize the aforementioned control framework, this section formulates a multi-objective co-optimization model, treating system resilience, comprehensive operational cost, and traffic network impact as parallel, non-dominated objective functions. This formulation allows for explicit characterization of the nonlinear trade-offs among these objectives, enabling control decisions to adapt in accordance with shifting risk conditions and system priorities.

2.2.1. Objective Functions

The model contains the following three core objective functions. Under different control levels, the solution algorithm searches for optimal solutions with different focuses on the Pareto front based on the core task of that level.
(1)
Objective 1: Minimize the weighted power loss (f1)
This is equivalent to maximizing system resilience and is the primary optimization objective under the “High-risk” and “Severe-risk” classes, which are typically triggered by extreme weather events and their cascading effects. Its core is to guarantee the continuity of power supply to critical loads, which is a direct quantification of system viability. Mathematically, this objective is expressed as minimizing the sum of the weighted losses of all loads over the optimization period. The formula for this is given as Equation (1):
min   f 1 = t = 1 T i = 1 N L w i P s h e d , i ( t ) Δ t
where T is the optimization dispatch period, usually 24 h; N L is the total number of loads in the system; P s h e d , i ( t ) is the actual power cut (kW) to load i at time t, i.e., the power that is cut off due to insufficient supply; Δ t is the length of a single dispatch time step; and w i is the importance weighting factor for load i.
Loads are categorized into three classes according to their role in ensuring life safety, traffic operations, and essential services. For example, primary loads such as tunnel lighting, ventilation, fire-fighting systems, communication base stations, and surveillance equipment will have their weights w i set to very high values (e.g., 0.9) to ensure that the optimization algorithm gives priority to other primary loads in securing their power supply in any resource-constrained situation. Secondary loads such as general lighting in the service area and convenience stores have the second highest weight (e.g., 0.5), while tertiary loads such as landscape lighting and large advertising screens have the lowest weight (e.g., 0.1). Through this weighting mechanism, the objective function f 1 is no longer a simple power loss but a precise quantification of the “loss of core system functions”.
(2)
Objective 2: Minimize the overall operating costs (f2)
This objective is the primary optimization objective of the “Low-risk” class and aims to improve the daily operating economy of the system. Its composition comprehensively integrates all the costs involved in the operation of the system, reflecting the concept of full life cycle cost. The formula is given as Equation (2):
min   f 2 = t = 1 T C m a i n t ( t ) + C f u e l ( t ) + C g r i d ( t ) + C e n v ( t )
Among them, each cost item includes the following:
Operation and maintenance cost ( C m a i n t ( t ) ): This includes the operation and maintenance cost per unit of power generation or charging/discharging power of all distributed energy equipment such as photovoltaic, wind turbine, energy storage system, and diesel generator. This cost reflects the physical loss caused by the operation of the equipment.
Fuel cost ( C f u e l ( t ) ): This mainly includes the cost of diesel fuel consumed for the operation of diesel generator sets. This cost is a quadratic function of the output power of the diesel generator and accurately reflects its fuel consumption characteristics.
Grid interaction cost ( C g r i d ( t ) ): This is the cost of exchanging energy with the main grid considering time-of-use electricity prices. It is positive when the system buys power from the grid and negative when the system sells power to the grid.
Environmental costs ( C e n v ( t ) ): This is a key component of the model introduced to reduce carbon emission. It calculates the cost of environmental penalties for major pollutants such as C O 2 , S O 2 , and N O x produced by diesel generators and thermal power purchased from the grid, based on their emissions and the cost per unit of pollutant for environmental remediation or carbon tax. This cost term enables optimization decisions to spontaneously favor cleaner, lower-carbon energy use while pursuing economics.
(3)
Objective 3: Minimize the impact of the traffic network (f3)
This objective involves the traffic aspect of the proposed “source–grid–load–storage–road” framework. It quantifies the inverse impact of energy dispatch decisions on the operational efficiency of the transportation system and incorporates it into the optimization model. Preventive control or emergency response scenarios are often initiated by weather disruptions, traffic diversion, or charging service restriction measures to ensure grid stability, which may result in some vehicles having to make detours or wait in long queues in the service area, thus increasing the travel time of users. The objective aims to minimize this negative traffic impact due to energy system dispatch. It is formulated as Equation (3):
min   f 3 = t = 1 T j = 1 N V T d e l a y , j ( t )
where N V is the total number of affected vehicles travelling through the road section, and T d e l a y , j ( t ) is the additional delay time incurred by vehicle j at moment t due to traffic control (e.g., speed limit, path guidance) or charging time. The introduction of this objective ensures that the control system, when attempting to solve the energy problem by influencing the traffic, chooses the solution that is “friendly” to the amount of traffic and least disruptive to the traffic system, reflecting the idea of synergistic optimization between the two systems.

2.2.2. Key Constraints

In order to ensure that the solution by the optimization algorithm is physically feasible, operationally safe, and operationally sound, the model must satisfy a set of strict equality and inequality constraints.
(1)
Power system constraints
Power balance constraints: This is the basic physical law that must be satisfied for power system operation. At any moment t, the total power generation of all power sources in the system (including distributed renewable energy sources, diesel generator output, discharging power of the energy storage system, and power purchased from the main grid) must be precisely equal to the sum of the total load of the system (including all types of electrical load, power charged to the energy storage system, and power sold to the main grid) and the network transmission loss.
P P V ( t ) + P W T ( t ) + P D G ( t ) + P E S S , d i s ( t ) + P g r i d , b u y ( t ) = P L o a d ( t ) + P E S S , c h ( t ) + P g r i d , s e l l ( t ) + P l o s s ( t )
Generator output constraints: The actual output power of each type of generating set (PV, wind, diesel) must be between the minimum and maximum values allowed by its technology. In the case of renewable energy sources, the maximum output is limited by the current meteorological conditions (light and wind speed).
P g e n , m i n P g e n ( t ) P g e n , m a x
Grid interaction power constraints: The power exchanged between the system and the main grid must not exceed the rated capacity of the contact line transformers and the upper limit specified in the relevant power trading contract.
P g r i d , m i n P g r i d ( t ) P g r i d , m a x
Energy storage system operation constraints: The operation of the energy storage system must simultaneously satisfy the constraints of its internal state and physical capacity in order to prevent battery performance degradation or safety accidents due to improper use such as overcharging, overdischarging, and overcurrent.
Charge stat:
S O C   c o n s t r a i n t : S O C m i n S O C ( t ) S O C max
Charge and discharge power constraints:
0 P E S S , c h t P c h , m a x   and   0 P E S S , d i s t P d i s , m a x
Charging and discharging state mutual exclusion constraint: The energy storage system can only be in one of the charging or discharging states at the same moment.
Diesel generator climbing constraint: The rate of adjustment of the output power of a rotating standby power source such as a diesel generator is limited by its mechanical inertia and the speed of response of the combustion system and cannot be increased or decreased infinitely fast. This constraint ensures the enforceability of the dispatch program.
| P D G ( t ) P D G ( t 1 ) | Δ P D G , m a x
(2)
Traffic system constraints
Traffic flow conservation constraints: for any node in the road network (e.g., service area entrances and exits, ramp junctions), the total traffic flow into the node should be equal to the total traffic flow out of the node in a unit of time.
Road section capacity constraints: the actual traffic flow on any road section cannot exceed the design capacity of the road section; otherwise, it will lead to the collapse of traffic flow.
(3)
Electricity—traffic coupling constraints
Charging load and traffic flow coupling constraints: this is the core mathematical bridge connecting the energy system and the traffic system. The charging load power in the service area is not an isolated random variable but a function determined by the real-time traffic state.
P c h a r g e ( t ) = f ( Q t r a f f i c ( t ) , ρ E V ( t ) , C I t r a f f i c ( t ) )
The function takes the real-time monitored traffic flow Q t r a f f i c ( t ) , the penetration rate of new energy vehicles ρ E V ( t ) , and the congestion index C I t r a f f i c ( t ) as inputs and outputs an accurate prediction of the current charging load. Embedding this constraint in the optimization model achieves a deep integration of the two systems at the mathematical model level, enabling energy scheduling to respond prospectively to changes in traffic states.

2.3. Optimization Algorithm Based on Improved NSGA-II

Although the standard NSGA-II algorithm is excellent in the field of multi-objective optimization [13], it may still expose its inherent limitations when dealing with highly complex real-world engineering problems, such as the highway self-consistent energy system in this study, especially under the uncertainty and disturbances introduced by extreme weather scenarios. The hybrid design of NSGA-II-DE specifically aims to escape local optima and explore a wider range of solutions, which is crucial for maintaining resilience under these unforeseen conditions where the optimal operating point may shift dramatically. Genetic operators such as Simulated Binary Crossover (SBX) and Polynomial Mutation (PM), which are relied upon by the standard NSGA-II, are excellent in local fine-grained search and can effectively dig deeper into the discovered good regions. However, they may prematurely converge to a local Pareto front due to the insufficient global exploration capability in some cases, thus missing out on the higher-quality and wider-distributed global optimal solution set [16].
In order to overcome the potential shortcomings, this study proposes a hybrid algorithm incorporating the idea of differential evolution (DE) [17], denoted as NSGA-II-DE, which is aimed at combining the powerful global exploration capability of the DE algorithm with the efficient local exploitation capability of the NSGA-II algorithm.
The core of the differential evolution algorithm lies in its mutation strategy, which makes use of the difference vectors between individuals in the population to perturb the individuals so as to generate new candidate solutions. Its classical mutation operation can be expressed as follows:
v i t + 1 = x r 1 t + F x r 2 t x r 3 t
where x r 1 t ,   x r 2 ( t ) , and x r 3 ( t ) are three mutually different individuals randomly selected from the current population iteration, and F is a scaling factor to control the perturbation magnitude of the difference vector. This adaptive mutation approach based on intra-population differences has a profound theoretical foundation: it can automatically adjust the search step size, generating smaller perturbations for local search when the population is clustered and larger perturbations for global exploration when the population is dispersed.
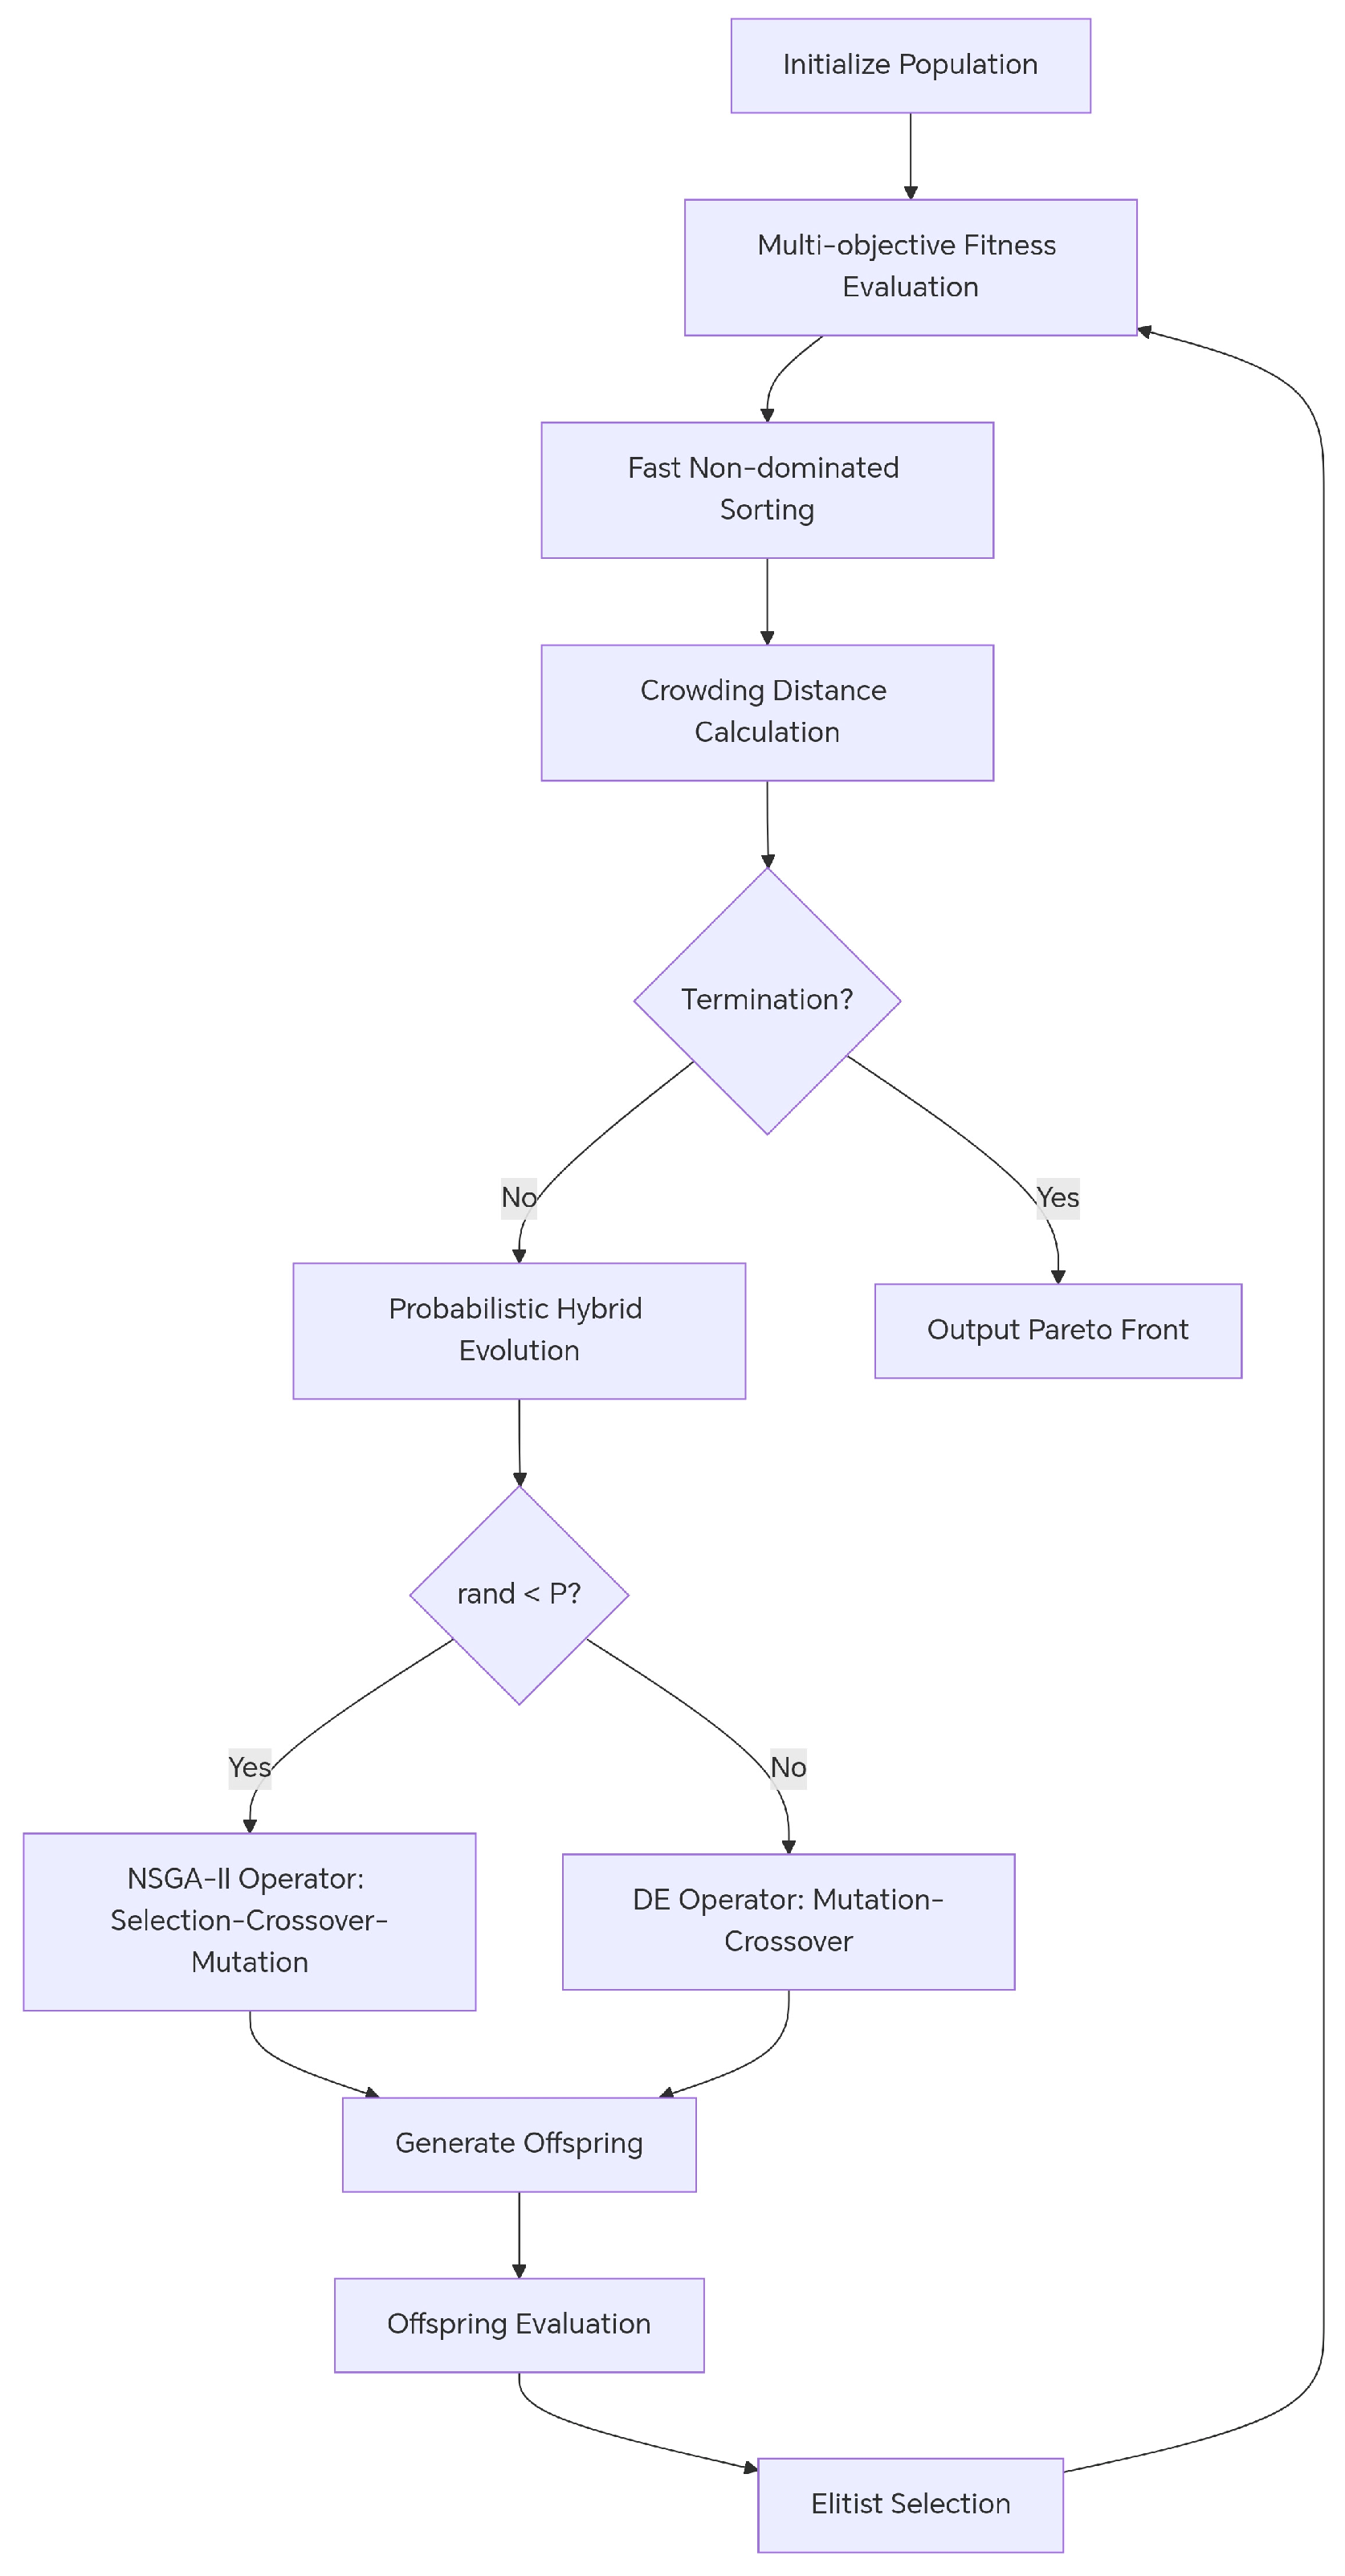
The flowchart of the NSGA-II-DE algorithm is illustrated in Figure 2. The algorithm begins by initializing the population to establish a search starting point, then enters the main iterative optimization loop. Each iteration involves the following: (1) multi-objective fitness evaluation of the current population, calculating values for the three objectives (i.e., system resilience, operational cost, and traffic impact); (2) fast non-dominated sorting to stratify solutions based on Pareto dominance; and (3) crowding distance calculation to promote solution diversity. For each offspring generation, a random number is compared against a preset probability P. If the random number < P, the NSGA-II operator performs SBX and PM, favoring local exploitation. Otherwise, the DE operator executes differential mutation and binomial crossover, enabling global exploration. Offspring from both operators are combined, creating a synergistic search strategy that balances local refinement with global exploration. After offspring evaluation, an elitist selection strategy merges parent and offspring populations. The next generation is selected based on non-dominated rank and crowding distance.
Upon meeting termination criteria, the algorithm outputs a high-quality Pareto front, providing optimal trade-offs between resilience, cost, and traffic impact. This process achieves a dynamic balance between convergence and diversity, significantly enhancing performance on complex multi-objective problems.

2.4. Assumptions

The proposed model is built upon several key assumptions: (1) The risk assessment module provides accurate and timely risk level classifications. (2) Traffic flow data and forecasts are available and responsive to management strategies. (3) All system components (generators, storage, converters) operate within their defined limits without unexpected failures unless explicitly modeled as part of the risk. (4) The physical damage to infrastructure from extreme weather is not dynamically modeled within the optimization horizon but is instead represented through its impacts on availability.

3. Verification Analysis

In this study, the representative test functions in the ZDT and DTLZ series are selected as the benchmark platform for algorithm performance evaluation. The ZDT1 function has a convex Pareto front, which is a classical test for the basic convergence ability of the algorithm [13]. The Pareto front of the ZDT3 function consists of multiple discontinuous segments, which is specifically used to test the algorithm’s ability to maintain the diversity of the population and the ability to explore the whole world. The DTLZ2 function is a multi-objective optimization problem, and its concave Pareto front consists of several discrete segments [18]. objective optimization problem with a concave Pareto frontier capable of testing the performance of the algorithm in a high-dimensional objective space. This varied set of test functions can examine the algorithms’ overall capabilities from many angles and guarantees the thoroughness and objectivity of the performance evaluation.
The selection of comparison algorithms follows the principles of representativeness and fairness: NSGA-II-DE, as the improvement algorithm proposed in this study, is the core object of evaluation; the standard NSGA-II algorithm serves as a recognized multi-objective optimization benchmark algorithm to provide a reference baseline for the performance enhancement; and the multiple objective particle swarm optimization (MOPSO) algorithm serves as another class of mainstream group intelligence optimization algorithms for verifying the general superiority of the improvement strategies. The three algorithms compete fairly under the same computational resource constraints (population size = 100, maximum number of iterations = 500), and each test function is run independently for 30 times to ensure the reliability of the statistical results.
The selection of performance evaluation indexes reflects the scientific and comprehensive nature of multi-objective optimization evaluation. Inverse generation distance (IGD), which is currently acknowledged as the most comprehensive performance index, can assess both the convergence of the solution set and the uniformity of distribution simultaneously. Hypervolume (HV) quantifies the algorithm’s overall optimization effect by calculating the volume of the target space covered by the solution set. The generation distance (GD) specifically measures the degree of convergence of the solution set obtained by the algorithm to the true Pareto frontier; the smaller the value, the better the convergence. These three metrics complement each other and can comprehensively portray the algorithm performance from multiple dimensions, such as convergence speed, solution quality, and distribution uniformity.
The average performance metrics of each algorithm after 30 independent runs on the three standard test functions are shown in Table 3. Figure 3 gives the distribution of the Pareto frontiers obtained by the three algorithms for a certain representative run on the ZDT1, ZDT3, and DTLZ2 test problems.
As evidenced by the results in Figure 3, all three algorithms demonstrate excellent convergence capability when handling the convex ZDT1 frontier with simple morphology (Figure 3a), with their solution sets closely approximating the true Pareto front. However, significant performance divergence emerges when addressing the complex ZDT3 frontier comprising five discontinuous segments, as shown in Figure 3b.
This divergence becomes more pronounced in the higher-dimensional DTLZ2 problem, as shown in Figure 3c. The solution set generated by the proposed NSGA-II-DE algorithm (blue dots) not only achieves optimal convergence on the 3D spherical front but also exhibits the widest and most uniform distribution. Comparatively, the standard NSGA-II (orange dots) produces a slightly scattered solution set, while MOPSO (yellow dots) demonstrates noticeable convergence deficiency and distribution irregularity.
In terms of convergence (GD metrics), the NSGA-II-DE achieves the most superior or tied-best GD values on all three test problems. Especially on ZDT1 and DTLZ2, its convergence accuracy is significantly higher than that of the standard NSGA-II and MOPSO, proving that the fused DE operator can drive the population to approach the true Pareto frontier more effectively.
In terms of comprehensive performance (IGD and HV metrics), IGD and HV are the standard for measuring the convergence and diversity of algorithms. On the ZDT1 and DTLZ2 problems, NSGA-II-DE achieves the best in these two metrics, outperforming the other two algorithms across the board. The results are particularly noteworthy on the most challenging ZDT3 problem, where NSGA-II-DE achieves the highest score among the three algorithms on the HV metric, which represents the overall quality of the solution set, despite the fact that the standard NSGA-II leads in the IGD metrics by an extremely narrow margin. This fully demonstrates that NSGA-II-DE maintains the top diversity, and its overall quality and convergence of the solution set are superior.
In conclusion, the hybrid NSGA-II-DE algorithm, by integrating differential evolution strategy, inherits the NSGA-II framework’s strengths while enhancing performance in solving complex high-dimensional problems. Particularly on the challenging DTLZ2 problem, the HV metric of NSGA-II-DE reaches 0.6935, which is an 8.0% improvement over NSGA-II’s, confirming the algorithm’s capability in high-dimensional optimization. It simultaneously ensures solution diversity and delivers Pareto-optimal solution sets with satisfactory convergence and comprehensive quality.

4. Results and Discussion

4.1. Calculation Scenarios and Parameter Settings

The hierarchical control framework, the multi-objective model, and the optimization algorithm developed in Section 2 and Section 3 are now applied to a realistic typhoon transit emergency scenario to validate their integrated performance. This scenario is constructed based on a typical coastal highway with a length of 50 km along the southeast coast of China, with a simulation period of 24 h. The scenario accurately simulates the whole process from the risk accumulation before the typhoon to the compound risk outbreak during the peak impact period (severe traffic accidents caused by severe weather at T = 10 h, forming the cascade risk of “Environment → Traffic → Energy”) and the system recovery after the typhoon, which provides a highly realistic simulation environment for comprehensive testing of the dynamic adaptability and robustness of the hierarchical control strategy. This provides a highly realistic virtual experiment platform for comprehensively testing the dynamic adaptability and robustness of the hierarchical control strategy. The evolution of the event is precisely divided into three phases with distinct physical characteristics to ensure that the response capability of the hierarchical control strategy under different system states can be comprehensively tested:
Stage 1: Pre-typhoon (T = 0~8 h): This stage is a period of gradual risk accumulation, where weather conditions gradually deteriorate, but traffic flow remains basically normal.
Stage 2: Peak typhoon impact (T = 8~16 h): This stage is a compound risk outbreak period, where the weather deteriorates sharply. Especially critical is that at T = 10 h, severe weather triggered serious traffic accidents, which then led to widespread traffic congestion, forming a typical “environment → traffic → energy” cascade risk propagation chain.
Stage 3: Typhoon transit recovery period (T = 16~24 h): This stage is the system resilience recovery period; the external disturbances are weakened, but the lag effect of the previous events (e.g., the charging demand in the service area is maintained at a high level) still exists.
While this scenario is based on a coastal highway vulnerable to typhoons, the proposed framework is generalizable. The risk indicators can be adapted to other extreme events. The core principle of dynamic, risk-driven priority shifting between economy, resilience, and traffic impact remains universally applicable to critical infrastructure systems seeking to enhance their climate adaptation capabilities.

4.2. Control Strategy Performance Analysis

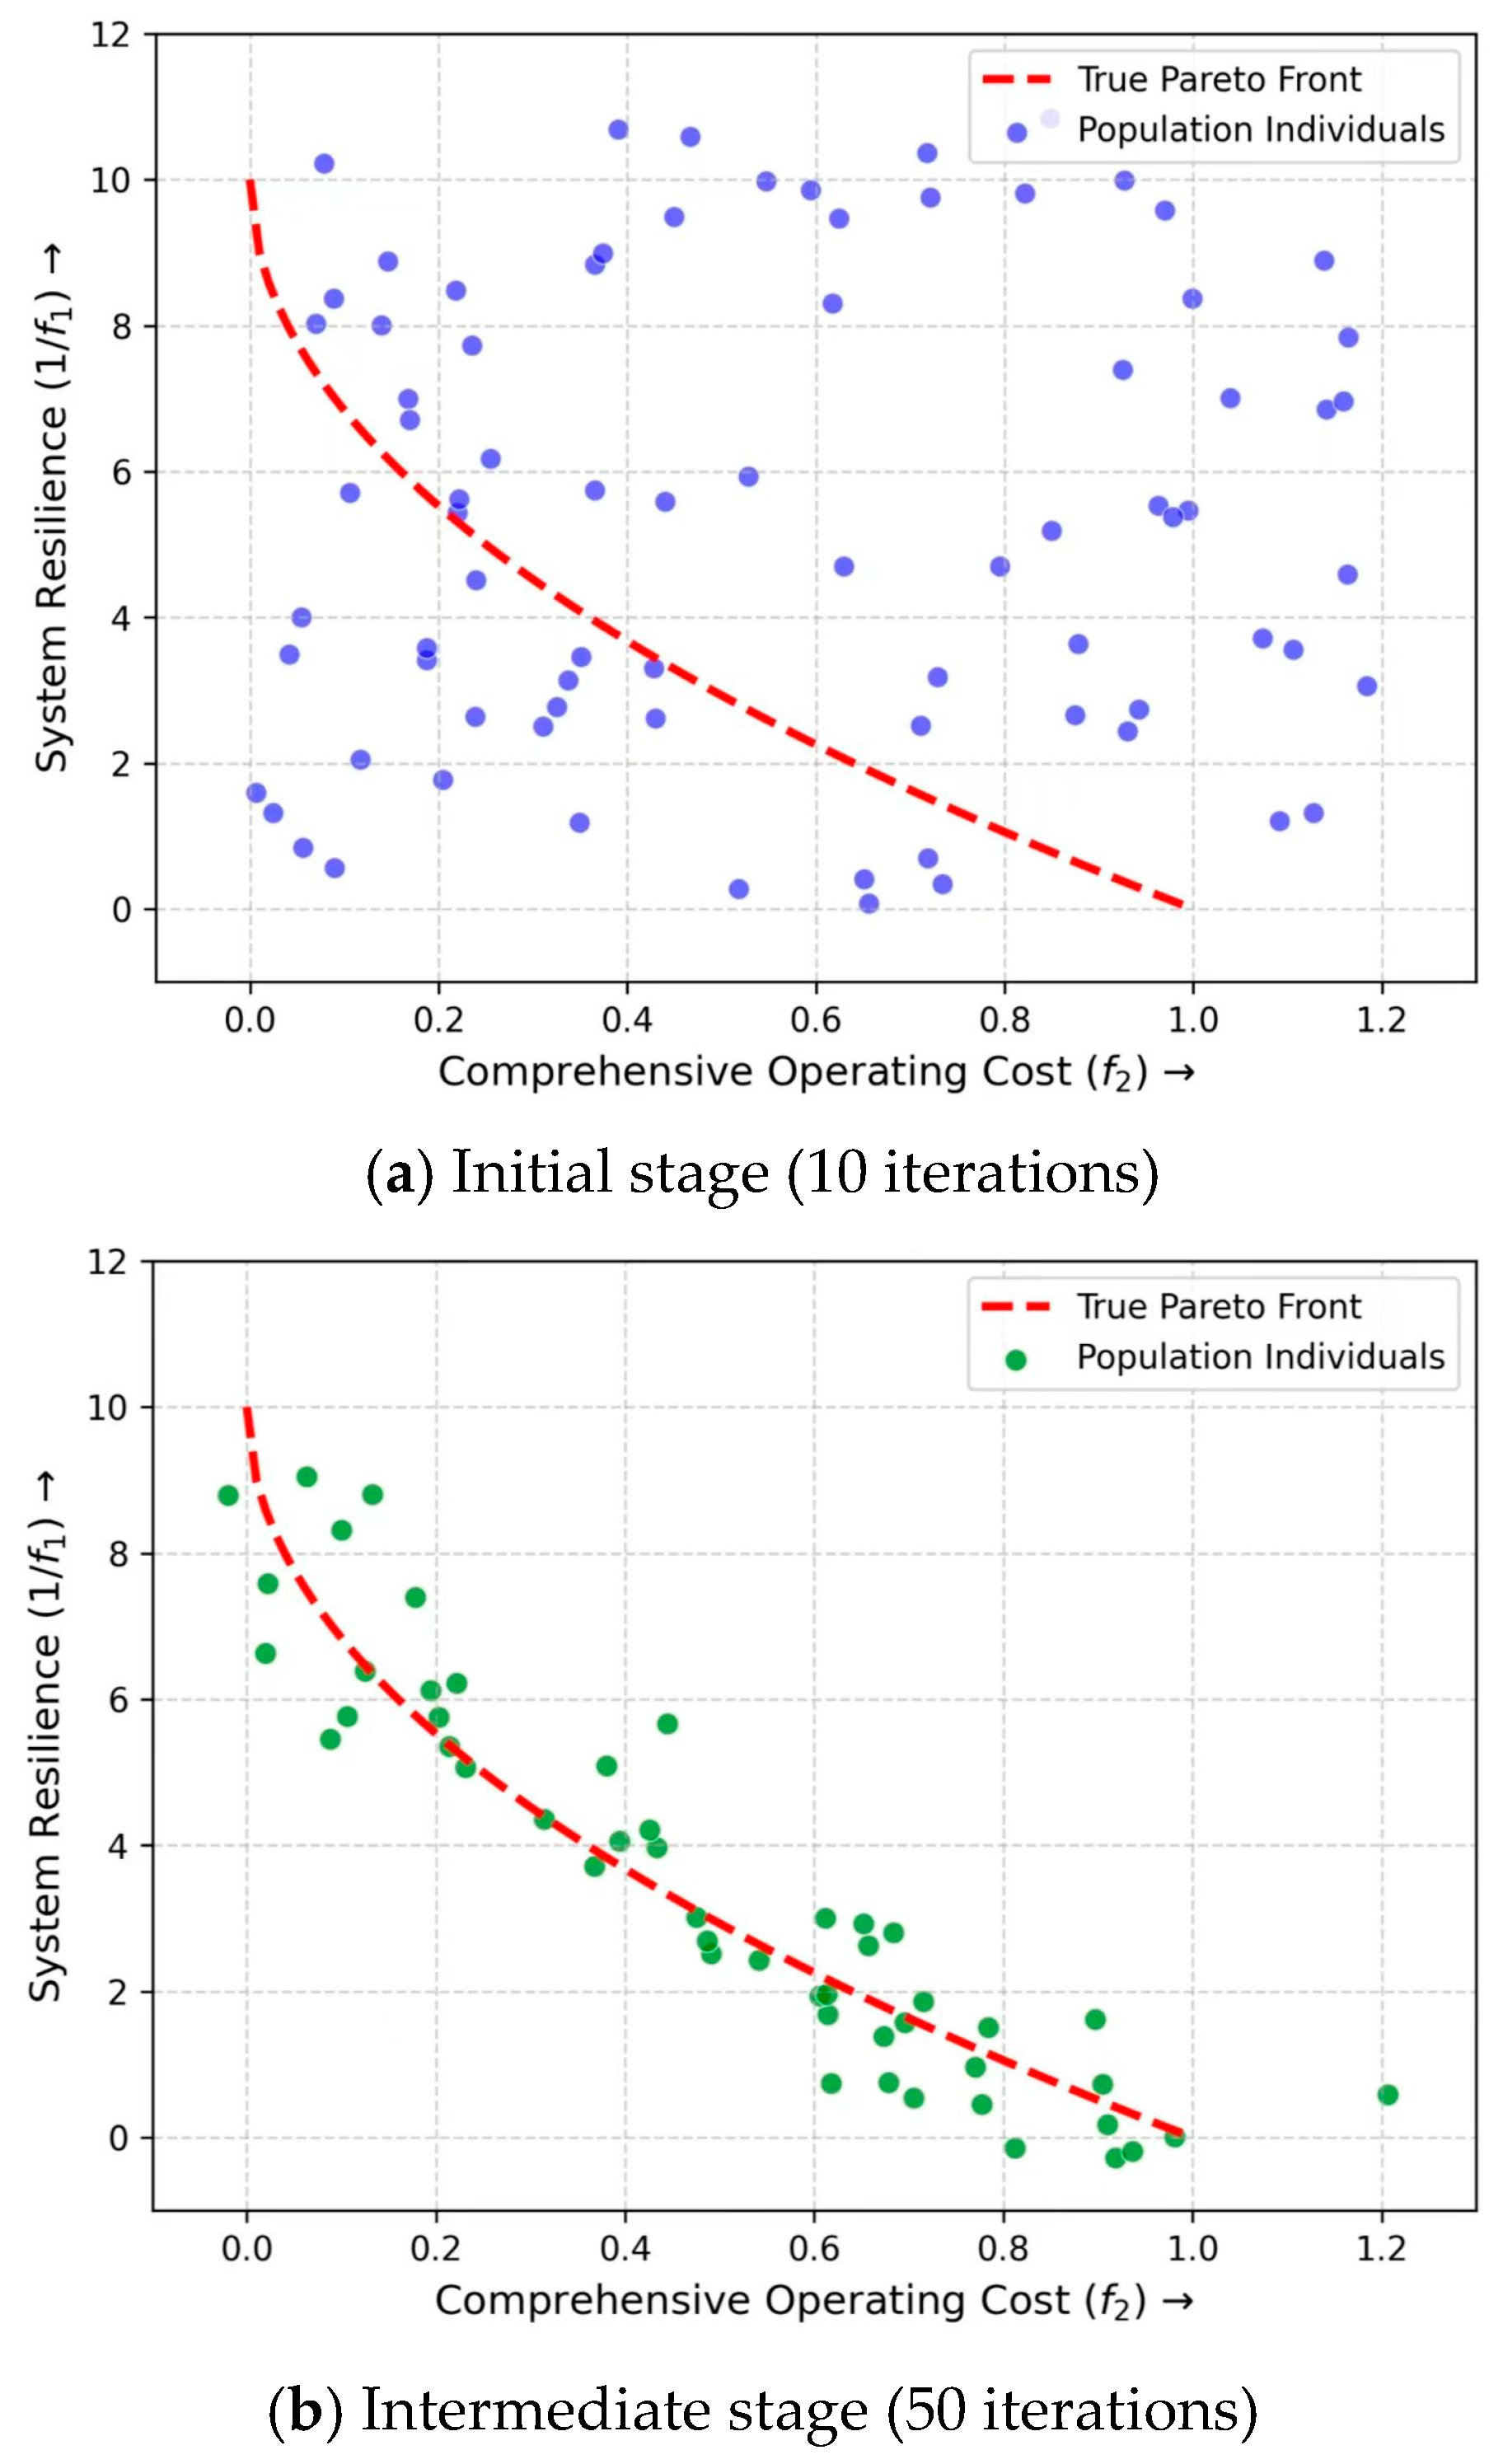
Under the multi-objective cooperative optimization strategy, Figure 3 presents the Pareto frontier evolution of the algorithm population at different iterations (10, 50, and 200) under high-risk contingency scenarios. The figure is visualized in two dimensions with the two key objectives of system resilience (1/ f 1 ) and operating cost ( f 2 ), clearly revealing how the algorithm gradually finds the optimal solution set from a random initial population.
As shown in Figure 4, in the early stage of the algorithm startup, the solutions (blue scatters) in the population show a broad and random distribution in the target space. This indicates that the algorithm is in the global exploration phase, where the goal is to find regions in the vast solution space where good-quality solutions may exist. At this point, the solutions are of varying quality and are far from the true Pareto optimal frontier (black dashed line). After 50 iterations, the population has converged significantly towards the true frontier by means of the non-dominated sorting and the elite retention strategy. Most of the poorly performing dominated solutions have been eliminated, and the solution set is beginning to outline the Pareto frontier. After 200 iterations, the algorithm has sufficiently converged. The resulting set of solutions (red stars) not only closely fits the true Pareto frontier but, more importantly, maintains a good diversity across the frontier, evenly covering a wide range of trade-offs from “high resilience, high cost” to “low resilience, low cost”. The trade-off choices are evenly covered from “high resilience, high cost” to “low resilience, low cost”, and there is no obvious vacancy or aggregation in the solution set.
This evolution process fully proves that the NSGA-II-DE hybrid algorithm adopted in this paper can well balance the two core performance dimensions of convergence and diversity when solving the complex multi-objective optimization problem of highway energy systems. The algorithm can not only find the optimal solution quickly but also provide widely distributed, high-quality alternatives for decision-makers, which lays a solid algorithmic foundation for subsequent decision analysis.

4.3. Control Strategies Under Different Risk Levels

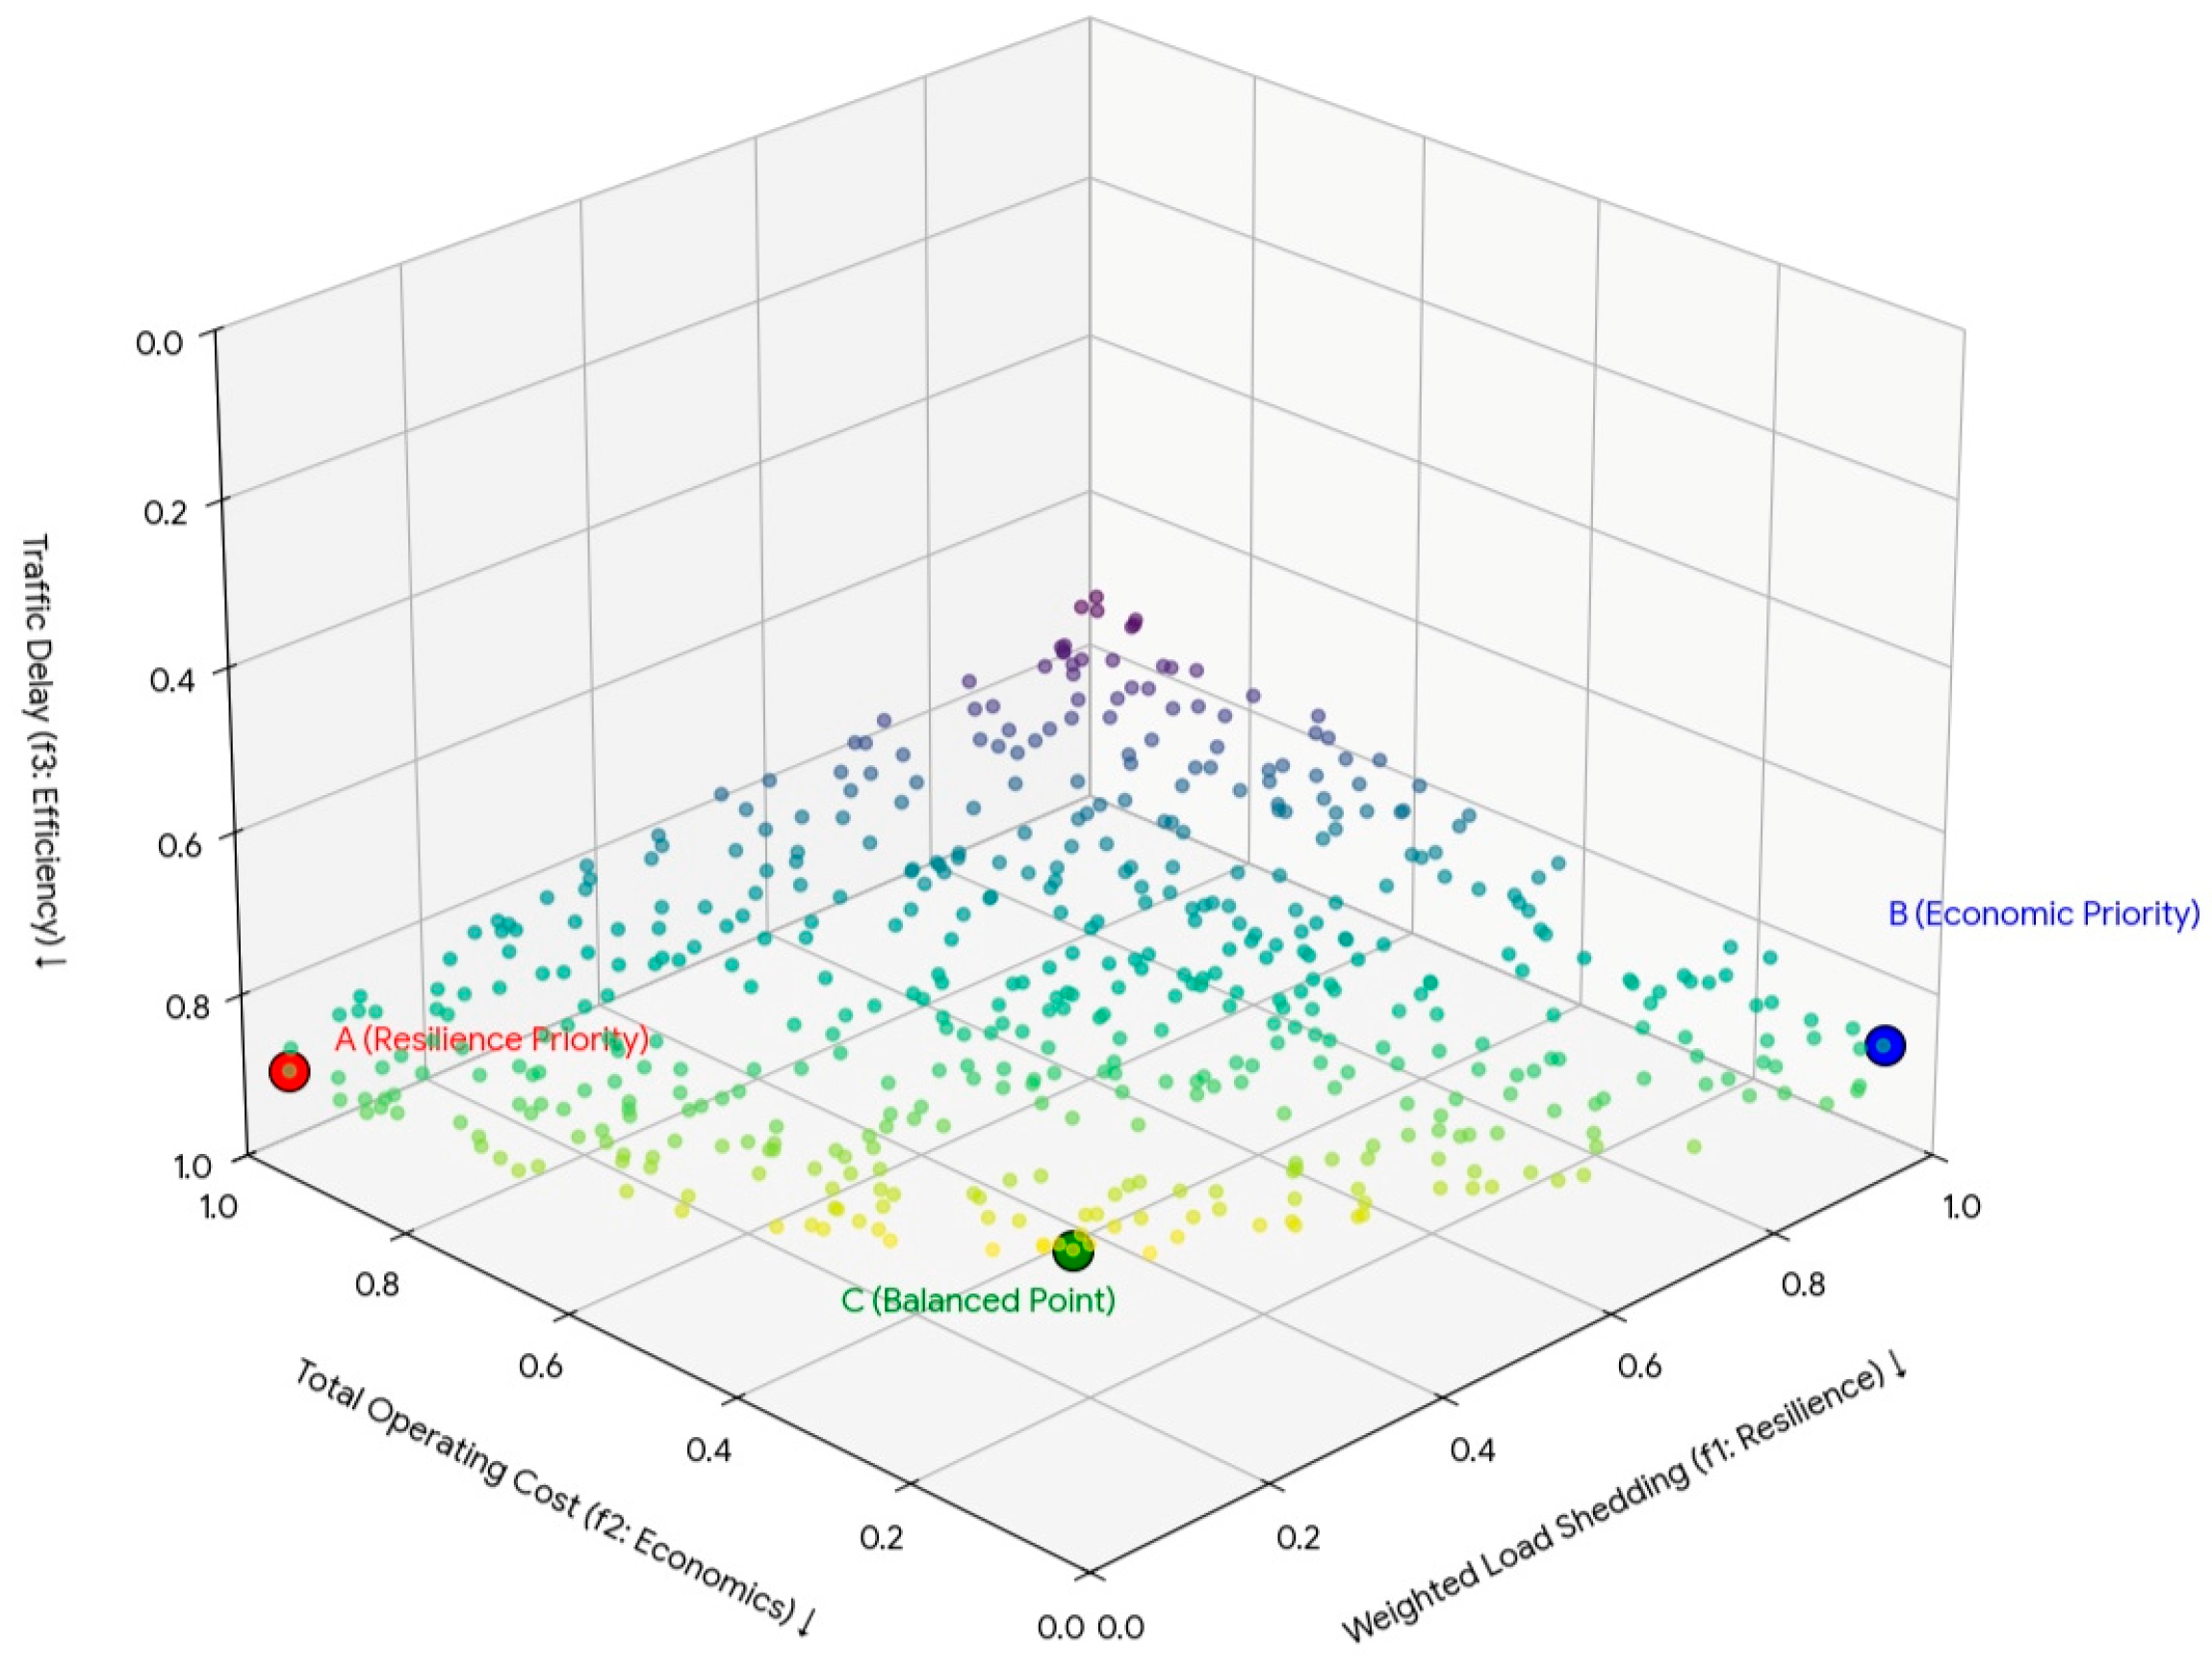
The essence of multi-objective optimization is not to provide a single, absolute “optimal solution” but to reveal the inherent trade-offs between different, or even conflicting, objectives so as to provide the decision-maker with a “decision menu” containing a series of the best choices. Figure 5 shows the Pareto-optimal solution set of the three core objective functions—weighted power loss ( f 1 ), integrated operating cost ( f 2 ), and traffic impact ( f 3 )—obtained by the NSGA-II-DE algorithm proposed in this paper in a high-risk contingency scenario.
Each point in the graph represents a feasible, non-dominated scheduling solution. “Non-dominated” means that there is no other feasible solution that can improve at least one objective without sacrificing the other. An in-depth analysis of the distribution pattern of this solution set can provide highway operations managers with extremely insightful decision-making:
Solution A with red point (conservative strategy): This solution is located at one extreme of the solution set, where the weighted power loss value is close to zero, representing the highest level of system resilience. However, in order to achieve this goal, the solution pays a high price: its integrated operating cost and traffic impact are also at the highest level of all the solutions. This corresponds in reality to an ultra-conservative “safety at all costs” decision, which could be applied to scenarios with very high safety requirements, such as military or national strategic corridors.
Solution B with blue point (aggressive strategy): This solution is at the other extreme of the solution set, with relatively low operating costs and traffic delay, but at the expense of a certain degree of system resilience, which may allow for short-term disruptions of some minor, non-critical loads. This corresponds to a relatively aggressive “economy and efficiency at manageable risk” decision, which may be appropriate for ordinary highways with low traffic volumes and low social impact.
Solution C with green point (balanced trade-off strategy): This solution is located in the knee point region of the Pareto frontier. These solutions are generally considered the most attractive because they represent a relatively balanced trade-off between the three objectives. From this point, either a further increase in resilience or a further reduction in costs or traffic impacts comes at a disproportionately large cost to the other objectives. As such, it usually represents the most cost-effective compromise.
By presenting the decision-maker with such a complete and visualized Pareto-optimal frontier, rather than a single solution with algorithmically predetermined weights, the model proposed in this study puts the final decision-making power back in the hands of the operational manager with expertise and experience. The decision-maker can choose from a series of optimal scheduling solutions that best meet the current needs and management philosophy, based on the tolerance for risk, emergency fund constraints, and specific requirements for the level of traffic service, thus realizing collaborative intelligent decision-making.
Through the interpretation of the Pareto front, we can see that under different choices of emergency control strategies, the system can achieve different balance points between resilience, cost, and traffic impact. This leads to the core of the control strategy in this study: the system is not static and fixed at a certain equilibrium point but can adaptively “drift” on the Pareto-optimal frontier according to the dynamic evolution of the risk so as to match the core tasks at different stages. This subsection aims to demonstrate this dynamic adaptive process through concrete simulation experiments. We will compare how the system’s energy scheduling and resource allocation behaviors change within the “low-risk” economic operation mode, the “high-risk” emergency response mode, and the post-disaster restoration control mode. In this way, the effectiveness of this hierarchical control framework can be visually observed.
(1)
Low-risk scenario simulation (economic operation mode)
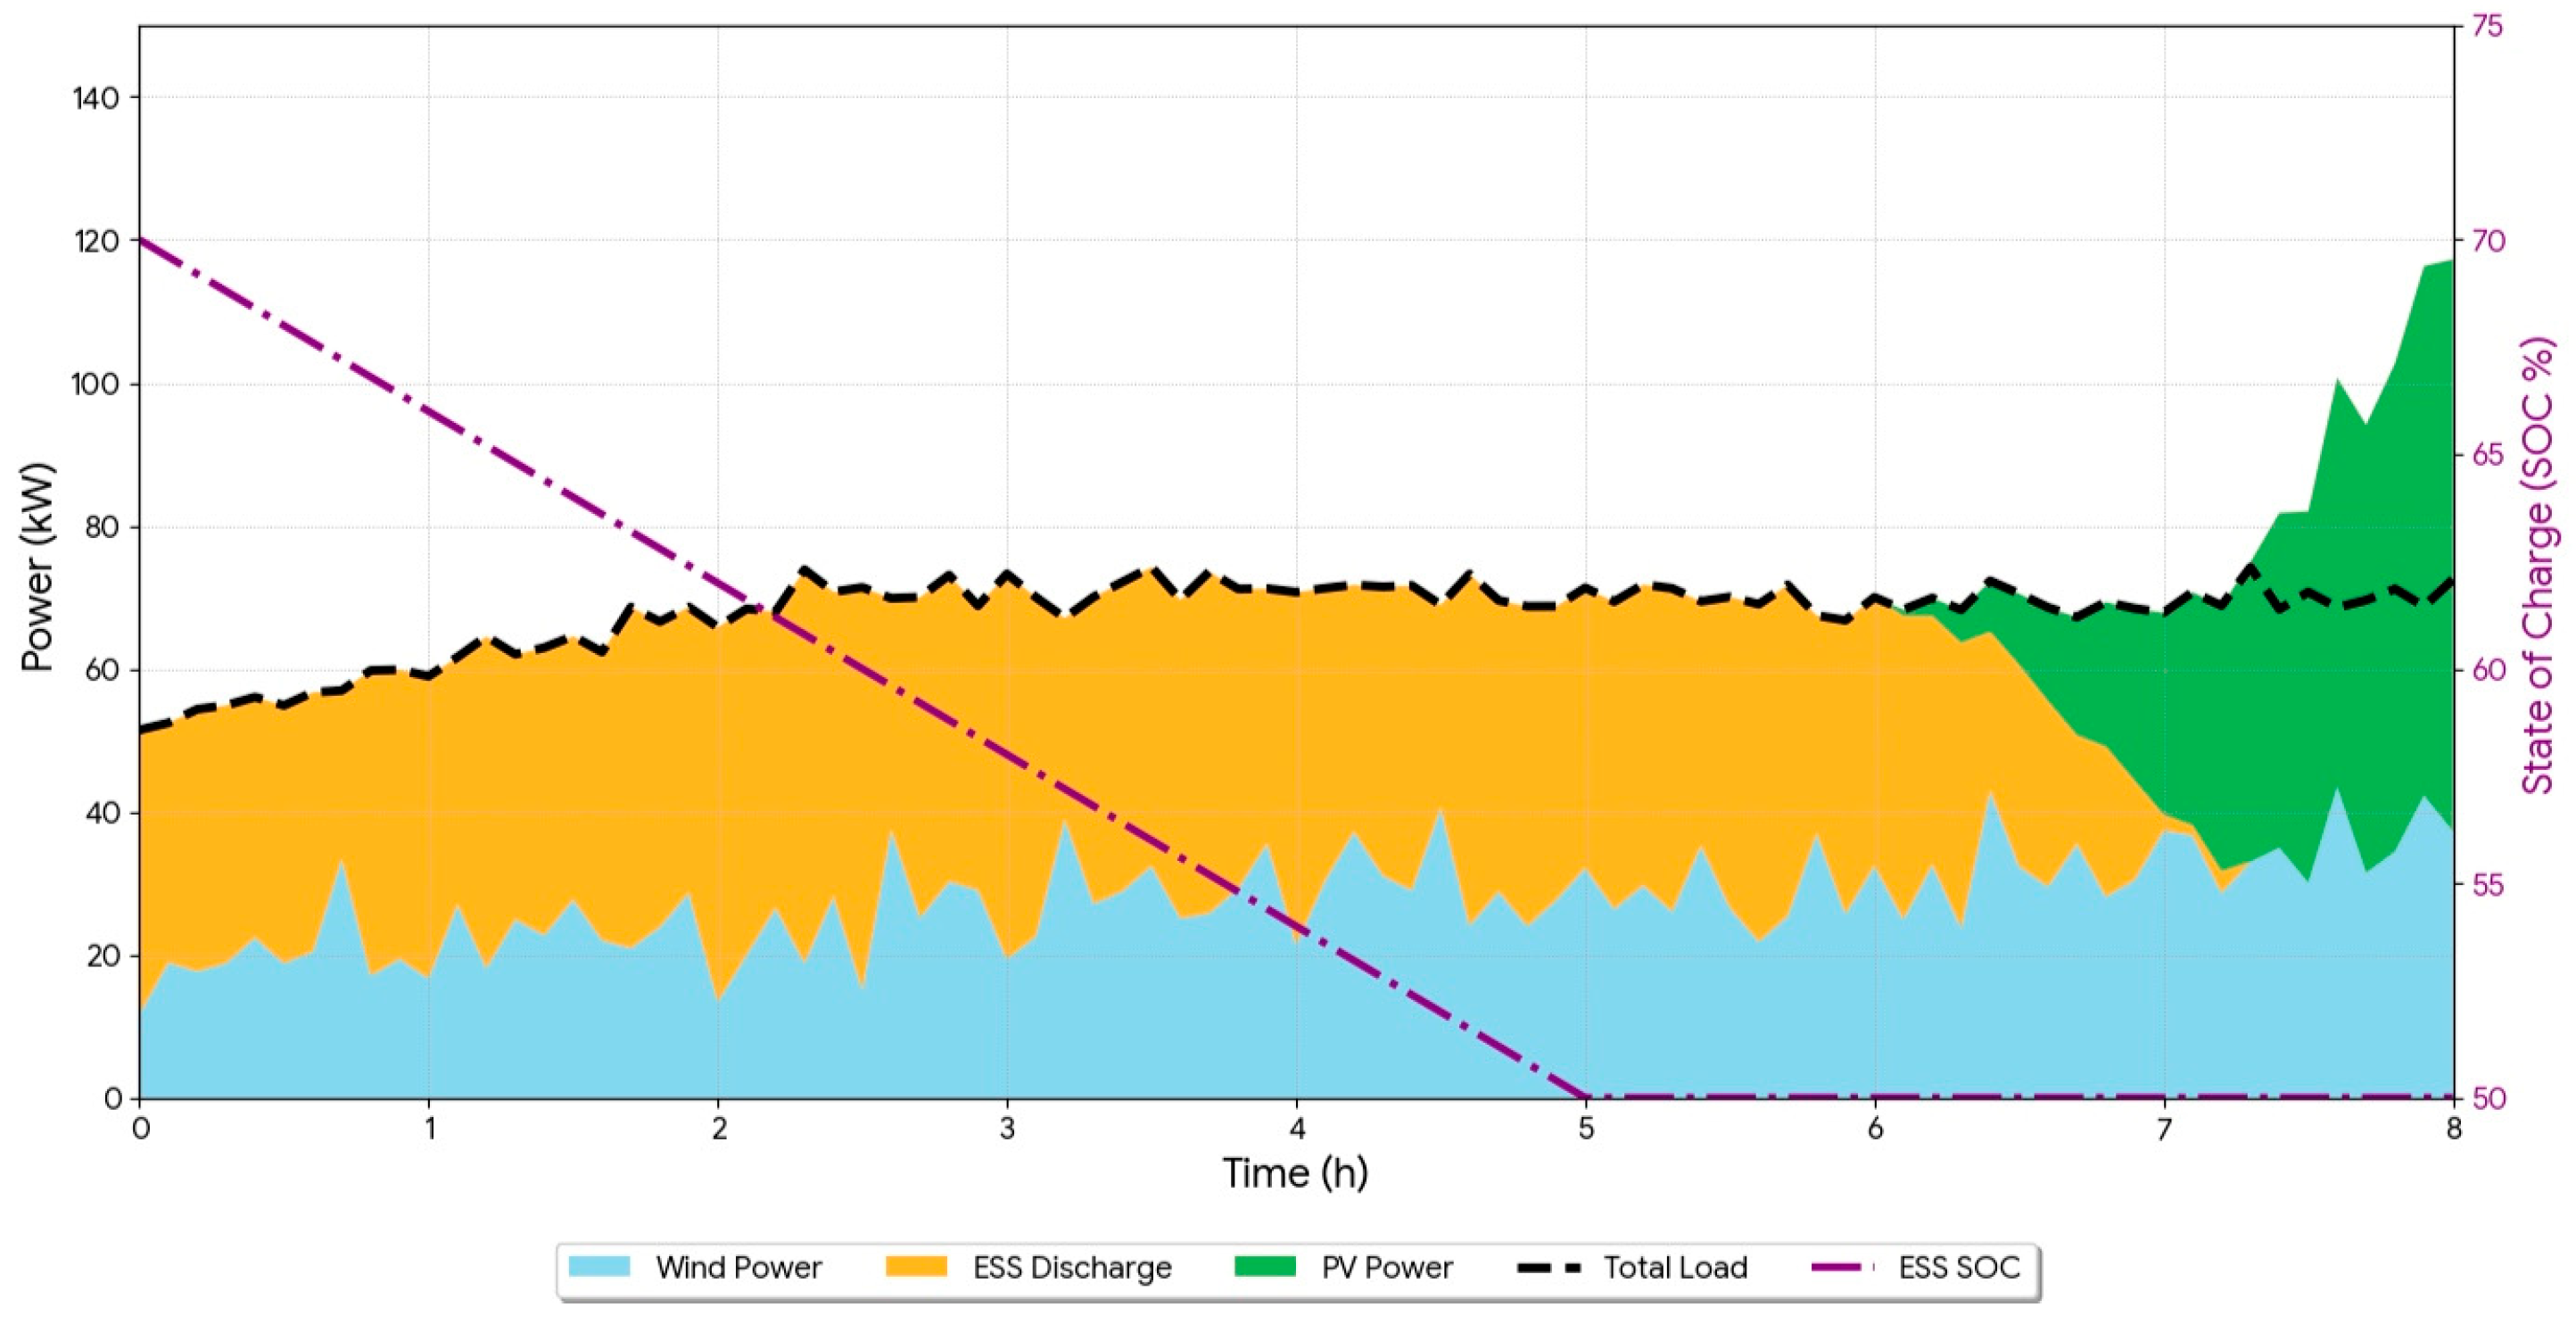
The period T = 0–8 h before typhoon landfall is selected as a representative low-risk scenario. During this phase, the external environment remains relatively stable with all internal system units operating normally. Following the control framework defined in the previous section, the system automatically activates economic operation mode. In this mode, the NSGA-II-DE optimization algorithm has as its primary optimization objective the minimization of the overall operating cost ( f 2 ). Figure 6 shows the optimized dispatch power curves of the power units in this mode.
The analysis of Figure 6 reveals the typical behavioral characteristics of a self-consistent energy system in an economic operation mode, which is centered on maximizing the use of renewable energy sources with zero marginal cost. During T = 0–6 h at night, the system controller prioritizes energy storage discharge, supplemented by wind power generation. As the photovoltaic output gradually rises from zero after sunrise (from about T = 6 h onwards), the system prioritizes the full consumption of all available clean energy, and the discharge pressure on the storage system decreases. The diesel generators, which are the costliest backup power source, are always switched off in this economic operation mode. The entire scheduling process is cost-effectiveness driven, achieving a dynamic balance of internal energy supply–demand and a significant reduction in overall system operating costs through the energy storage system’s refined time-shift management of renewable energy. Under this operational mode, the system attains a remarkable 92.5% local consumption rate for renewable energy.
(2)
High-risk scenario simulation (emergency response mode)
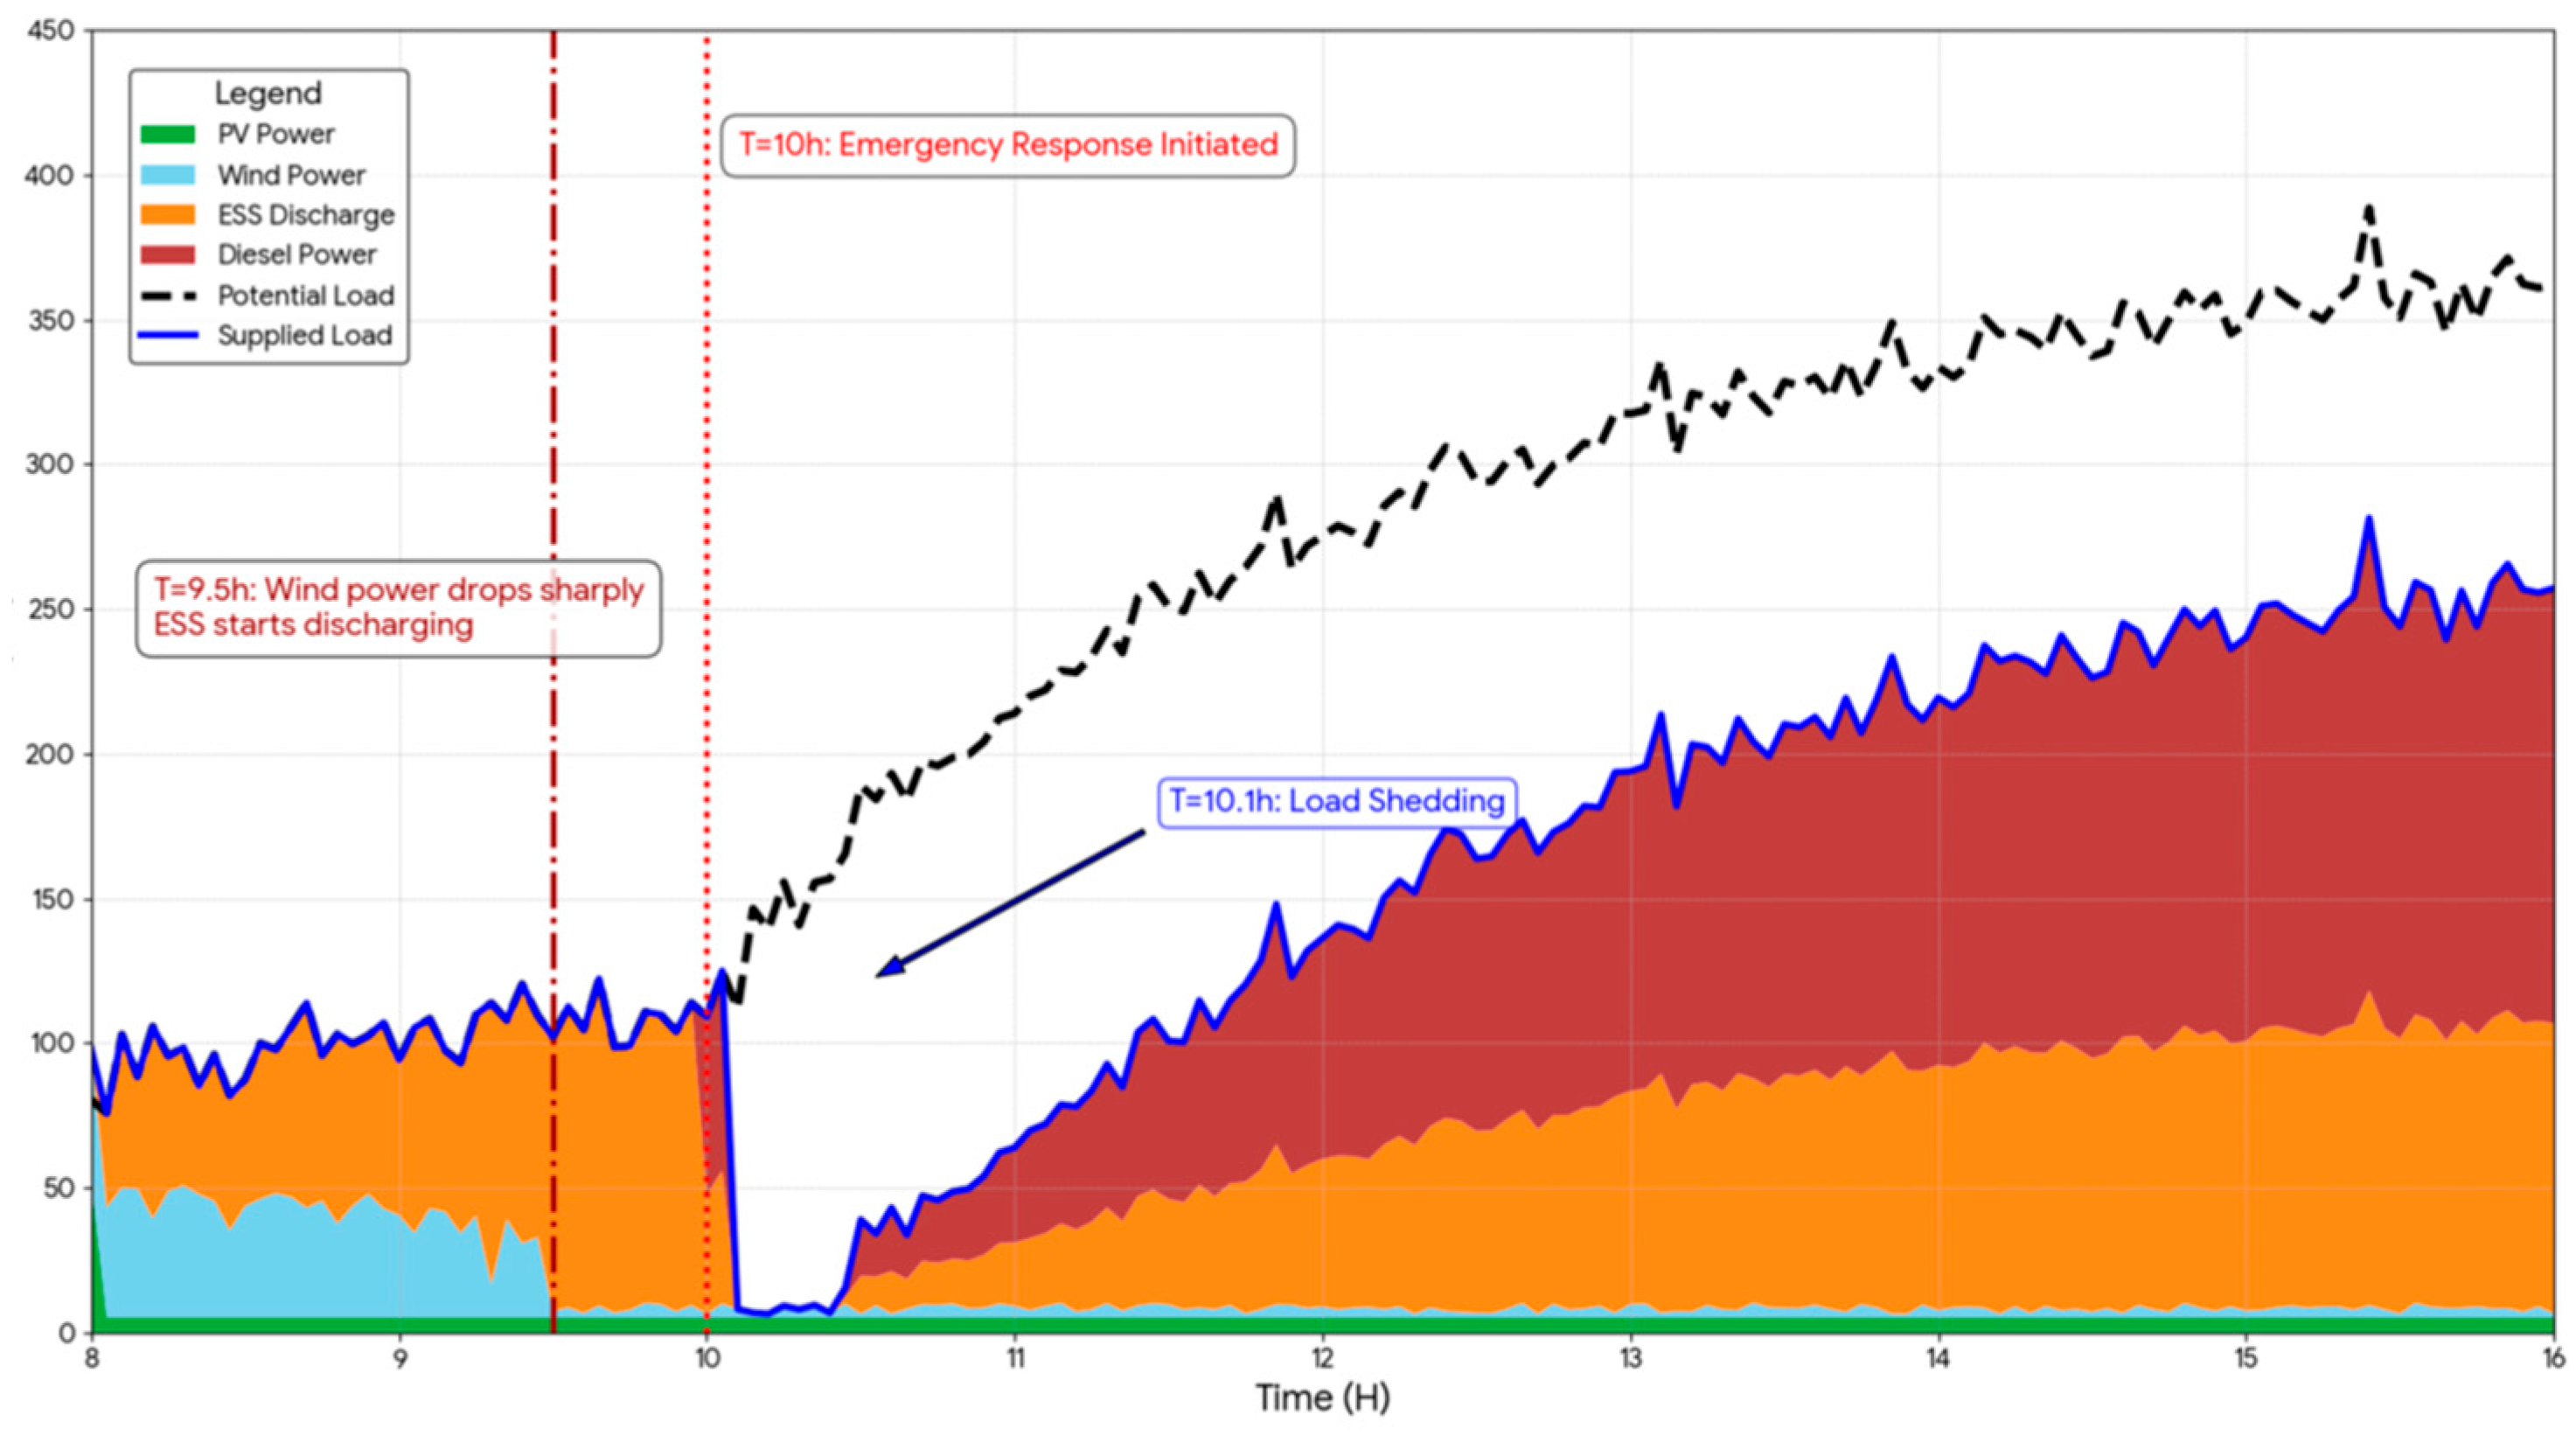
The period of T = 8–16 h, which experiences the most intense typhoon impacts, is selected as the high-risk scenario. During this period, due to the superimposed effects of strong winds and heavy rains brought about by the typhoon’s landfall as well as sudden traffic accidents at T = 10 h, the system risk assessment value rises sharply and enters the “high-risk” zone. The control system is driven by the risk assessment result and switches automatically and instantaneously to the emergency response mode. At this point, the weighting of the optimization algorithm’s objective function is fundamentally altered, and maximizing system resilience (i.e., minimizing the weighted power loss, f 1 ) replaces economics as the sole and overriding optimization objective. Figure 7 demonstrates the emergency response scheduling results of the system in this mode.
By comparing Figure 6 with Figure 7, a fundamental shift in the control logic of the system can be clearly seen. After the risk at T = 10 h rises sharply, the control system immediately executes the preset load hierarchical control strategy and decisively removes the tertiary non-critical loads, such as landscape lighting and large advertising screens in the service area, so as to prioritize the supply of valuable power resources to the core safety functions. The operational target of the energy storage system switches from economic arbitrage mode to critical load unprotection mode, with all available capacity allocated to maintain a stable power supply for the critical loads (e.g., tunnel lighting and telecommunication base stations). Despite the high operating costs, the diesel generators are immediately started up and connected to the grid as a last resort in order to ensure that the system does not functionally collapse if the main grid were to be disconnected at any time. The integrated effect of these decisive measures manifests in maintaining a power supply reliability rate exceeding 98.8% for the critical loads throughout the high-risk impact period, thereby preventing catastrophic system failures.
(3)
Recovery control mode
After the severe test during the peak typhoon period, the system enters the recovery phase at T = 16 h. The control objective in this phase dynamically shifts from ensuring emergency power supply to restoring system resilience while managing costs. Figure 8 shows the optimal scheduling strategy in this phase, where diesel generators are shut down and wind turbines charge the battery units.

5. Conclusions

In this study, a set of risk-driven multi-dimensional collaborative hierarchical control strategies is systematically constructed to address the energy security challenges faced by grid-connected highways under climate mitigation targets and increasing extreme weather events. The proposed “source–grid–load–storage–road” control framework breaks through the limitations of traditional energy dispatching that mainly responds to the load passively by deeply coupling the road traffic flow as an endogenous variable with the energy system and provides a brand-new theoretical framework for realizing the collaborative and proactive management of the transport energy system. By constructing a multi-objective optimization model with system resilience, integrated cost, and traffic impact as the objectives and solving it with the improved NSGA-II-DE algorithm, this study not only provides an optimized dispatch scheme but also reveals the intrinsic trade-offs between different objectives to the decision-makers. The generated Pareto-optimal frontier provides powerful decision-making support for operations managers in complex emergency scenarios. Through exhaustive typhoon emergency scenario validation, the hierarchical control strategy demonstrates automatic mode switching responsive to risk levels, achieving 92.5% renewable energy utilization under low-risk conditions while elevating critical load assurance to 98.8% under high-risk scenarios.
Although this scenario is based on a highway vulnerable to typhoons, the proposed framework is universal. Risk indicators can be applied to other extreme events such as floods, snow and ice, and extreme heatwaves. The core principle of dynamically shifting priorities based on risk between economic efficiency, resilience, and traffic impacts is universally applicable for critical infrastructure systems seeking to enhance climate adaptation capabilities. Future work will focus on pilot field trials, hardware-in-the-loop testing, and developing a simplified algorithm for real-time operation, alongside a more comprehensive evaluation incorporating economic and regulatory dimensions.

Author Contributions

Conceptualization, F.W.; Formal analysis, W.Z.; Investigation, H.L., W.Z. and L.H.; Writing—original draft, H.L. and W.Z.; Writing—review & editing, L.H. and F.W.; Supervision, P.C., X.T., J.L. and W.Q.; Project administration, P.C., X.T., J.L., W.Q. and F.W.; Funding acquisition, P.C., X.T., J.L. and W.Q. All authors have read and agreed to the published version of the manuscript.

Funding

This research was funded by the project “Research on Key Technologies and Equipment for Green Intelligent Transportation” by China Energy Engineering Corporation (CEEC) grant number CEEC2023-ZDYF-06 And The APC was funded by CEEC2023-ZDYF-06.

Data Availability Statement

The data that support the findings of this study are available on request from the corresponding author. The data are not publicly available due to privacy or ethical restrictions.

Conflicts of Interest

Authors Peiqiang Cui, Xiaowu Tian, Jin Liu and Weijie Qin were employed by the company Gezhouba Group Transportation Investment Co., Ltd. The remaining authors declare that the research was conducted in the absence of any commercial or financial relationships that could be construed as a potential conflict of interest.

References

  1. International Energy Agency (IEA). Transport; IEA: Paris, France, 2022; Available online: https://www.iea.org/reports/transport (accessed on 8 September 2025).
  2. Creutzig, F.; Niamir, L.; Bai, X.; Callaghan, M.; Cullen, J.; Díaz-José, J.; Figueroa, M.; Grubler, A.; Lamb, W.F.; Leip, A.; et al. Demand-side solutions to climate change mitigation focusing on transport sector. Nat. Clim. Change 2022, 12, 240–248. [Google Scholar] [CrossRef]
  3. Brazilian Institute of Applied Economics. Energy infrastructure collapse during extreme flood events. Sustain. Prod. Consum. 2024, 38, 45–58. [Google Scholar]
  4. Fathy, A.; Rezk, H.; Ferahtia, S.; Ghoniem, R.M.; Alkanhel, R. An efficient honey badger algorithm for scheduling the microgrid energy management. Energy Rep. 2023, 9, 2058–2074. [Google Scholar] [CrossRef]
  5. Niu, M.B.; Wang, H.C.; Li, J.; Liu, H.; Yin, R. Coordinated energy dispatch of highway microgrids with mobile storage system based on DMPC optimization. Electr. Power Syst. Res. 2023, 217, 109119. [Google Scholar] [CrossRef]
  6. Karimi, H.; Jadid, S.; Hasanzadeh, S. Optimal-sustainable multi-energy management of microgrid systems considering integration of renewable energy resources: A multi-layer four-objective optimization. Sustain. Prod. Consum. 2023, 36, 126–138. [Google Scholar] [CrossRef]
  7. Luo, L.; Abdulkareem, S.S.; Rezvani, A.; Miveh, M.R.; Samad, S.; Aljojo, N.; Pazhoohesh, M. Optimal scheduling of a renewable-based microgrid considering photovoltaic system and battery energy storage under uncertainty. J. Energy Storage 2020, 28, 101306. [Google Scholar] [CrossRef]
  8. Lei, B.; Ren, Y.; Luan, H.; Dong, R.; Wang, X.; Liao, J.; Fang, S.; Gao, K. A review of optimization for system reliability of microgrid. Mathematics 2023, 11, 822. [Google Scholar] [CrossRef]
  9. Richardson, P.; Flynn, D.; Keane, A. Optimal charging of electric vehicles in low-voltage distribution systems. IEEE Trans. Power Syst. 2012, 27, 268–279. [Google Scholar] [CrossRef]
  10. Shao, C.; Wang, X.; Shahidehpour, M.; Li, K. An MILP-based optimal power and transportation coordination model for electrified highways. IEEE Trans. Smart Grid 2020, 3, 1904–1916. [Google Scholar]
  11. Li, Y.; Chai, S.; Zhang, X.; Wang, G.; Zhu, R.; Chung, E. STPNet: Quantifying the Uncertainty of Electric Vehicle Charging Demand via Long-Term Spatiotemporal Traffic Flow Prediction Intervals. IEEE Trans. Intell. Transp. Syst. 2023, 24, 15018–15034. [Google Scholar] [CrossRef]
  12. Kotegov, R.; Abokersh, M.; Mateu, C.; Shobo, A.; Boer, D.; Vallès, M. Multi-method optimization of solar district energy systems with battery and thermal energy storage via real-time TRNSYS-Python coupling. Appl. Energy 2025, 400, 126528. [Google Scholar] [CrossRef]
  13. Deb, K.; Pratap, A.; Agarwal, S.; Meyarivan, T. A fast and elitist multiobjective genetic algorithm: NSGA-II. IEEE Trans. Evol. Comput. 2002, 6, 182–197. [Google Scholar] [CrossRef]
  14. Yang, J.; Su, C. Robust optimization of microgrid based on renewable distributed power generation and load demand uncertainty. Energy 2021, 223, 120043. [Google Scholar] [CrossRef]
  15. Dey, B.; Bhattacharyya, B.; Márquez, F.P.G. A hybrid optimization-based approach to solve environment constrained economic dispatch problem on microgrid system. J. Clean. Prod. 2021, 307, 127196. [Google Scholar] [CrossRef]
  16. Liu, R.; He, G.; Wang, X.; Mallapragada, D.; Zhao, H.; Shao-Horn, Y.; Jiang, B. A cross-scale framework for evaluating flexibility values of battery and fuel cell electric vehicles. Nat. Commun. 2024, 15, 280. [Google Scholar] [CrossRef] [PubMed]
  17. Das, G.; De, M.; Mandal, K.K. Multi-objective optimisation of hybrid renewable energy system by using novel autonomic soft computing techniques. Comput. Electr. Eng. 2021, 94, 107350. [Google Scholar] [CrossRef]
  18. Deb, K.; Thiele, L.; Laumanns, M.; Zitzler, E. Scalable multi-objective optimization test problems. In Proceedings of the 2002 Congress on Evolutionary Computation—CEC’02 (Cat. No. 02TH8600), Honolulu, HI, USA, 12–17 May 2002; Volume 1, pp. 825–830. [Google Scholar] [CrossRef]
Figure 1. Multi-objective cooperative optimization strategy flowchart.
Energies 18 05417 g001
Figure 2. NSGA-II-DE algorithm flowchart.
Energies 18 05417 g002
Figure 3. Comparison of Pareto frontiers.
Energies 18 05417 g003
Figure 4. NSGA-II-DE algorithm Pareto frontier evolution process.
Energies 18 05417 g004aEnergies 18 05417 g004b
Figure 5. Pareto-optimal solution set for multi-objective optimization in emergency scenarios.
Energies 18 05417 g005
Figure 6. Economic optimal dispatch results for low-risk scenario.
Energies 18 05417 g006
Figure 7. Emergency response scheduling results for high-risk scenario.
Energies 18 05417 g007
Figure 8. Scheduling strategy for T = 16–24 h recovery period.
Energies 18 05417 g008
Table 2. Matrix of hierarchical synergistic control strategy.
Risk LevelControl LevelCore Optimization ObjectivesSynergistic Control Dimension
Low-riskTier 1 control: Economic operationMinimization of integrated operating costsSource–grid–load–storage
Medium-riskTier 2 control: Preventive controlMaximize system resilience marginSource–grid–storage–road
High-riskTier 3 control: Emergency responsePower loss minimizationSource–load–storage–road
Severe-riskTier 4 control: Restorative controlMinimization of system recovery timeGrid–source–load
Table 3. Performance comparison of algorithms on benchmark test functions.
Test FunctionsAlgorithmGeneration Distance (GD)Inverse Generation Distance (IGD)Hypervolume (HV)
ZDT1NSGA-II0.00150.01440.8523
MOPSO0.00040.00880.8625
NSGA-II-DE0.00030.00470.8700
ZDT3NSGA-II0.00110.19031.2456
MOPSO0.00060.19561.3197
NSGA-II-DE0.00060.19171.3279
DTLZ2NSGA-II0.00900.07910.6422
MOPSO0.01420.10820.5841
NSGA-II-DE0.00800.05500.6935
Disclaimer/Publisher’s Note: The statements, opinions and data contained in all publications are solely those of the individual author(s) and contributor(s) and not of MDPI and/or the editor(s). MDPI and/or the editor(s) disclaim responsibility for any injury to people or property resulting from any ideas, methods, instructions or products referred to in the content.