The performance results obtained from simulations of 14 different scenarios were evaluated. This evaluation includes combustion temperature, turbine energy production, CO2 purity, CO2 recovery ratio, heating utility, cooling utility, electricity utility, methanol production energy, total energy consumed, methanol produced, and hydrogen used.
3.1. Flue Gas Composition
The temperature and composition of the flue gas produced during combustion are influenced by several factors, including the temperature and composition of the feed gas, the characteristics of the sewage sludge used as fuel, the furnace design, and the amount of biogas used to aid combustion. Since the biogas content, fuel characteristics, and furnace specifics remain constant across all models, the primary factors affecting the temperature and composition of the flue gas are the combustion gas composition and its temperature.
The characteristics of the gas entering the combustion process are affected by the configuration of oxygen, the temperature of the pre-combustion heater, and the rate of flue gas recycling. Although different methods for separating oxygen can produce varying results, their impact on the combustion gas composition is minimal when the same oxygen configurations are used.
Table 16 presents the flue gas composition and temperatures generated under the 0–50–100% O
2 configurations. To maintain the flue gas temperature at approximately 900 °C, the recycle rates were set at 60%, 75%, and 90% for the 0%, 50%, and 100% O
2 configurations, respectively.
The table indicates that, as expected, the nitrogen mass fraction in the flue gas increases with the addition of a higher proportion of air during combustion. The N
2 mass fractions are 65.4%, 52.4%, and 2.1% for the 0%, 50%, and 100% O
2 configurations, respectively. In contrast, during air combustion, the CO
2 fraction starts at 20.91%, rises to 33.3% in the 50% O
2 configuration, and reaches 83.4% in pure O
2 combustion. Sung et al. conduct experiments on sewage sludge oxyfuel combustion and air combustion, presenting their findings in their study [
35]. The simulation values mentioned align with these experimental value ranges.
The impact of the O2 configurations on the post-recycle molar CO2 content is minimal, varying only from 154.4 to 154.8 mol. This is because the CO2 produced comes from carbon in the sewage sludge composition, which is the same for all cases. For the same reason, the ash mass concentration remained constant around 2% across all configurations. On the other hand, oxygen concentration increased from 0.5% to 1.9% in the 100% O2 configuration.
These findings suggest that the flue gas CO2 content in the oxyfuel combustion scenario is around 94% upon the release of water. Consequently, after the simulation, it was determined that additional CO2 capture methods would not be necessary in the 100% O2 configuration.
Sensitivity Analysis of Flue Gas Recycle Ratio
A sensitivity analysis is conducted for 50% and 100% O2 configurations to examine the effect of the flue gas recycle ratio on the flue gas CO2 mass fraction, combustion temperature, and molar CO2 content. The sensitivity analysis is performed in 1% increments over the flue gas recycle rate range of 50% to 90%. The 100% O2 configuration, which does not have carbon capture, was also selected for sensitivity analysis because CO2 separation does not influence the findings in this section, which specifically focuses on oxyfuel combustion.
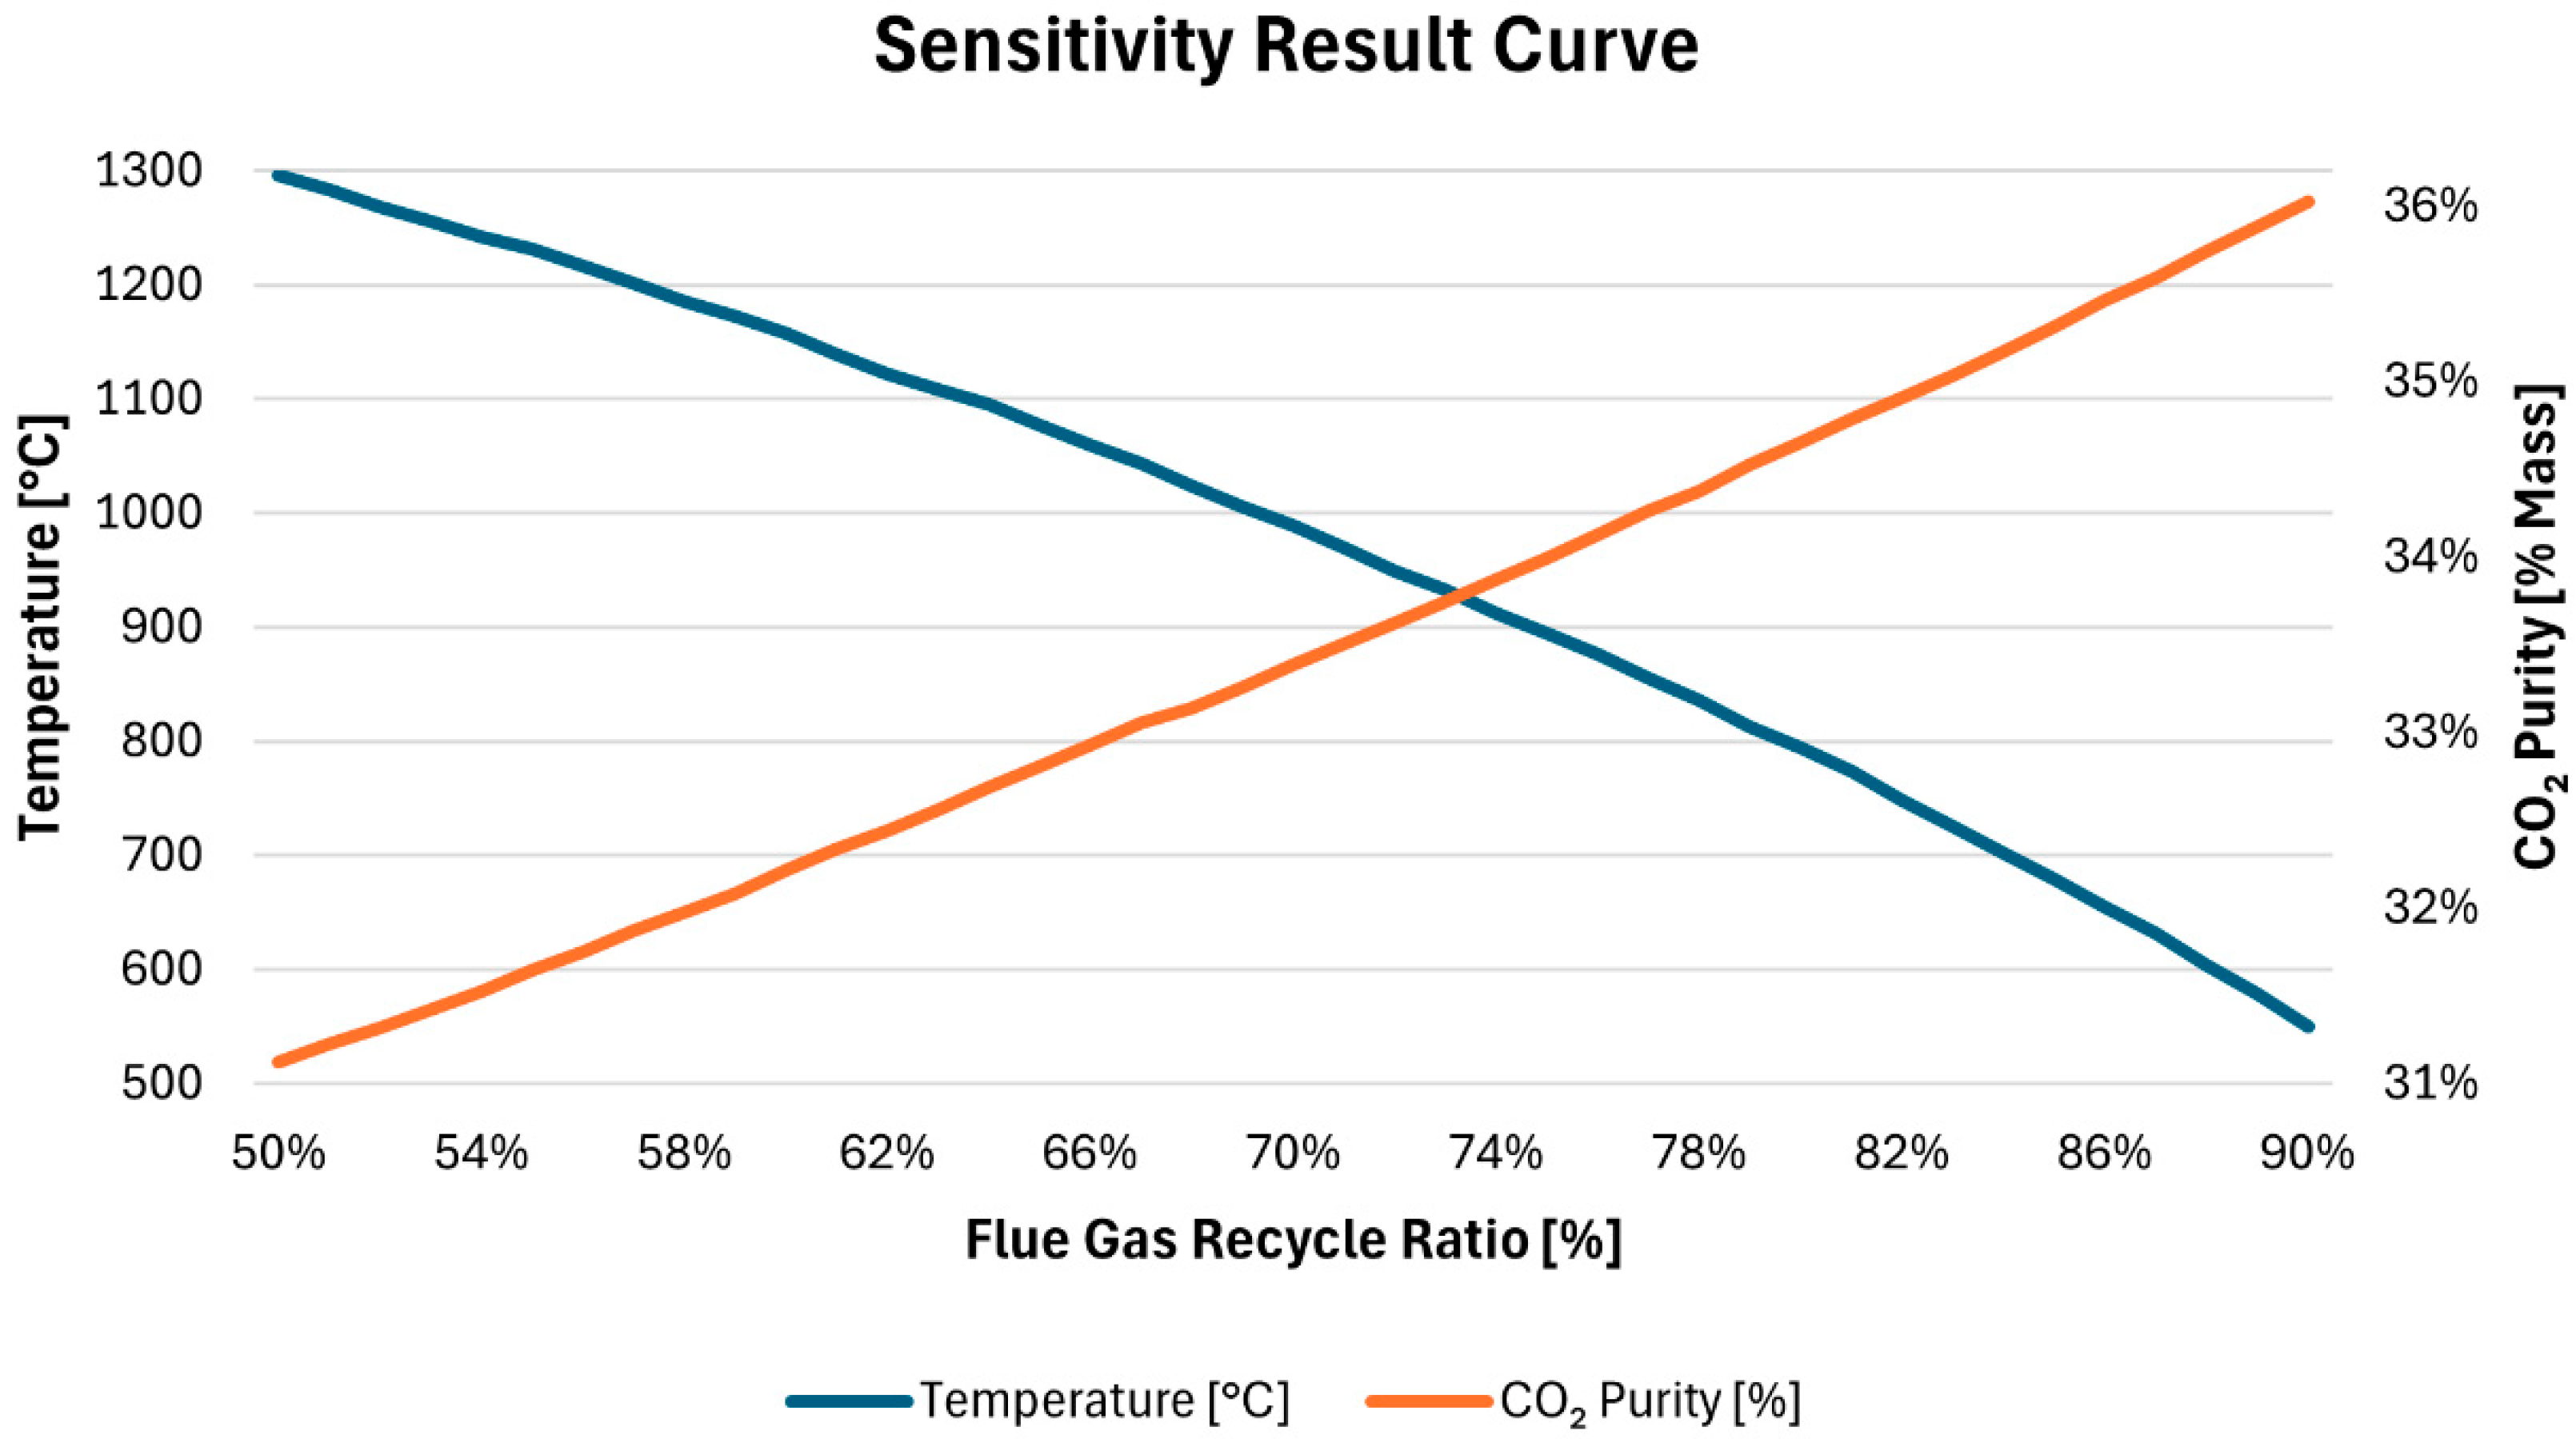
Figure 11 illustrates how the flue gas CO
2 fraction and combustion temperature vary with the flue gas recycle ratio, ranging from 50% to 90%, in a configuration with 50% oxygen. The CO
2 mass fraction begins at 31% with a 50% flue gas recycle ratio and increases almost linearly, reaching 36% at a 90% flue gas recycle ratio. This increase in the flue gas CO
2 mass fraction is expected, as a higher flue gas recycle ratio results in a greater CO
2 input during combustion.
In contrast, the combustion temperature exhibits a nearly linear negative relationship with the increasing recycle ratio. Starting at 1300 °C at a 50% recycle ratio, the combustion temperature drops to below 600 °C at a 90% recycle ratio. This decline can be attributed to the increase in the mass flow of gas involved in the combustion process as the flue gas recycle ratio rises. With more gas entering the furnace, there is a smaller increase in temperature due to the additional mass flow.
For a fluidized bed furnace, a 75% recycle rate achieves an optimal combustion temperature of 900 °C. However, it is important to note that the change in molar CO2 content in the flue gas after recycling is minimal and not represented in the graph. At a 50% recycle ratio, the molar content is 154.38 moles, which increases slightly to 154.41 moles at a 100% recycle ratio.
Figure 12 presents the results of the sensitivity analysis conducted with a 100% oxygen configuration. The graph shows that both the combustion temperature and the CO
2 fraction in the flue gas are significantly higher compared to those in the 50% oxygen configuration. The increase in combustion temperature can be attributed to the absence of inert nitrogen gas in the supplied pure oxygen, as well as the significantly reduced mass of the flue gas. This combination allows for higher combustion temperatures while maintaining the same heating value. Furthermore, the reduction in nitrogen content within the flue gas leads to a higher CO
2 fraction.
The trends observed in this graph are similar to those in
Figure 11. The flue gas CO
2 purity starts at approximately 65% with a 60% recycle ratio and rises to 0.90 with a 95% recycle ratio. At the same time, the combustion temperature decreases from 1750 °C to 600 °C. On the other hand, the change in molar CO
2 content in the flue gas is more significant in the 100% O
2 configuration compared to the 50% O
2 configuration, increasing from 152.7 mol to 154.5 mol as the recycle ratio increases.
The graph in
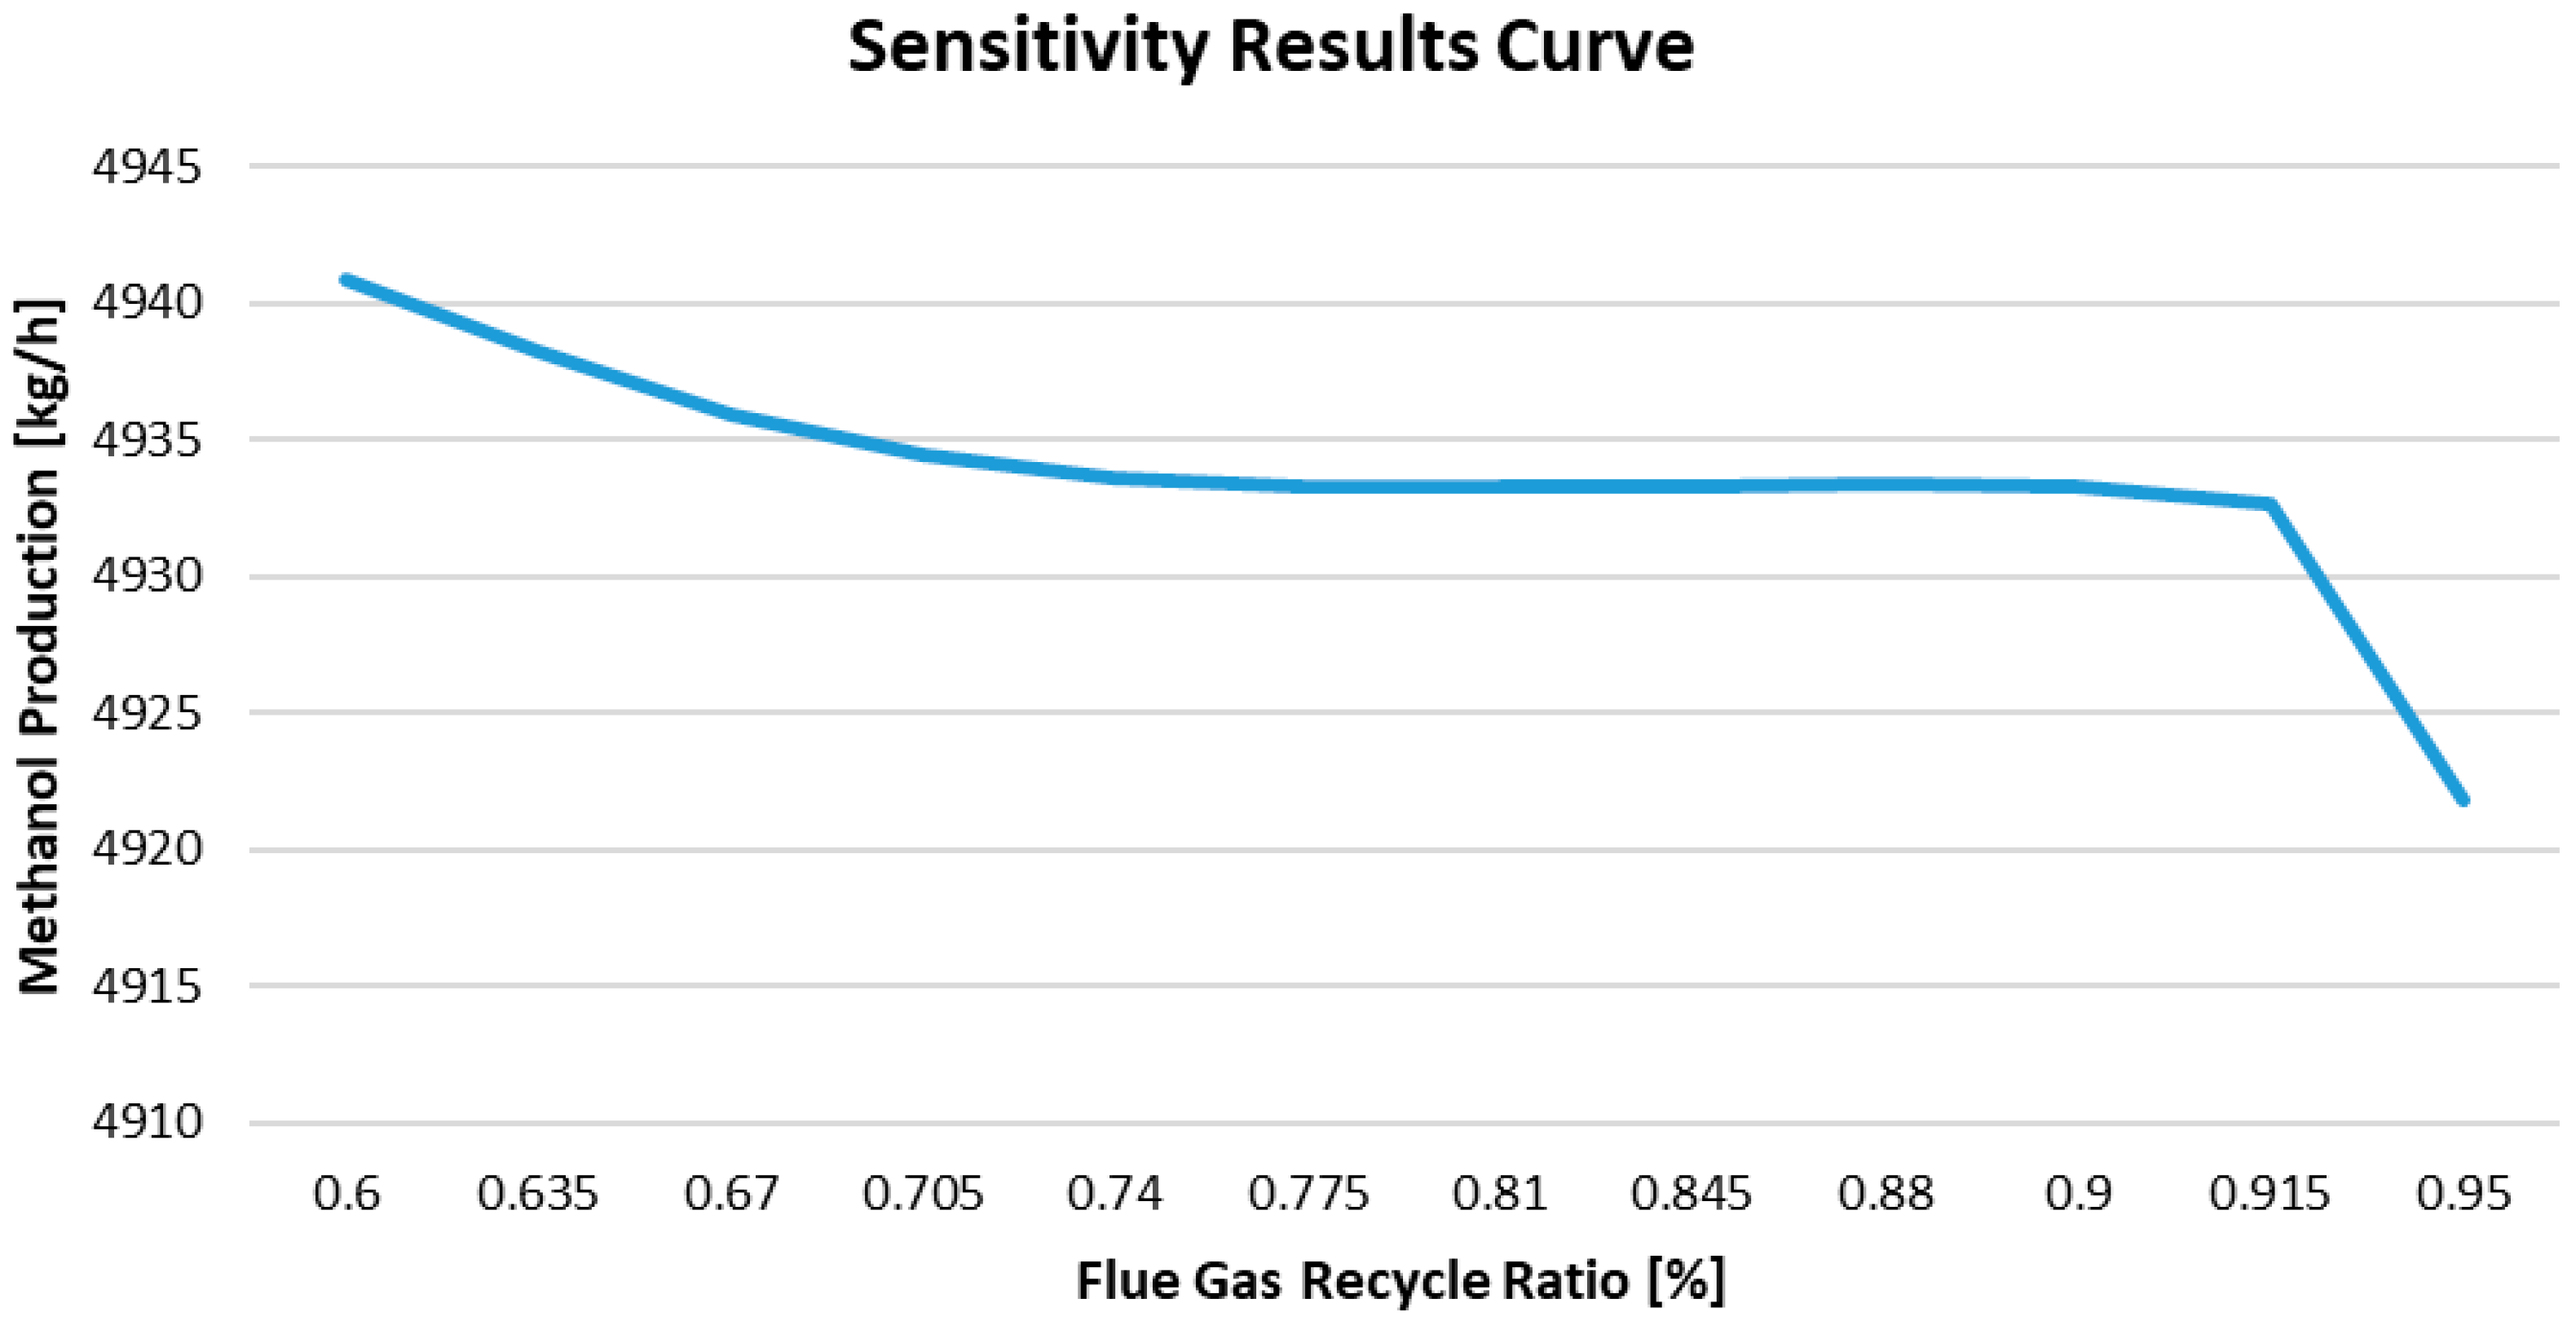
Figure 13 illustrates the relationship between the flue gas recycle ratio and methanol production. As the flue gas recycle ratio increases from 60% to about 70%, the methanol production decreases from 4940 kg/h to 4935 kg/h. For recycle ratios between 70% and 91%, production remains relatively stable, with values ranging from 4932 to 4933 kg/h. However, when the flue gas recycle ratio increases from 91% to 95%, there is a sharp decline in methanol production, dropping from 4932 kg/h to 4922 kg/h.
The optimal recycle ratio range appears to be between 70% and 90%, where methanol production is more stable and losses are minimal. At higher recycle ratios, a significant portion of the gas entering the reactor becomes inert (such as N2, CO2, and water vapor), which decreases the concentrations of reactants and significantly slows the reaction rate. Consequently, methanol production declines rapidly at these higher ratios.
3.2. Performance Comparison of Cases
Table 17 presents the performance data for all cases. The CO
2 purity results indicate that a very high purity level of 99.6% was achieved in all cases, except for the membrane and oxyfuel combustion methods. This can be attributed to the fact that methods such as MEA and IL specifically absorb CO
2 in the solvent. In contrast, cryogenic methods can freeze CO
2 because its freezing point is higher than −118 °C in dry flue gas.
Although the membrane material exhibits high CO2 selectivity, it is also permeable to other gases, such as nitrogen. In oxyfuel combustion, although oxygen is directly used during combustion, the nitrogen content in sewage sludge results in lower purity levels compared to other methods. Nonetheless, all methods achieved the targeted CO2 purity of 95% in dried flue gas.
The recovery results present a more varied picture. The MEA CC method achieved CO2 recovery rates of 89.8% and 90.0% for the 0% and 50% oxygen configurations, respectively. The similarity of these values indicates that the performance of the MEA CC method is not significantly affected by the flue gas CO2 mass fraction. On the other hand, a higher recovery rate is observed on the IL CC side. In oxyfuel combustion, there is no additional CO2 separation process beyond dehydration, allowing all flue gas to be considered directly purified CO2, resulting in a 100% recovery rate. In several instances, the results approached the targeted 90% recovery rate, with many cases exceeding it. The methanol production rates are directly proportional to the recovery rates and are therefore highest in oxyfuel combustion. Additionally, although the amount of hydrogen used is directly proportional to the recovery rates, methods employing electrolysis for oxygen separation require less external hydrogen.
The results indicate that oxyfuel combustion conditions are the most effective option for producing methanol and recovering CO2. In contrast, Case 3, which employs membrane CO2 capture combined with air combustion, shows the poorest performance in both CO2 capture and methanol production.
3.3. Energetic Comparison of Cases
A comparison was made of the heating, cooling, and electricity utilities associated with various CO
2 and O
2 separation technologies, as illustrated in
Table 18.
In air combustion cases with 0% O2 configuration, membrane and cryogenic technologies exhibited the lowest heating demands, ranging from 8.08 to 8.13 MW. In contrast, MEA CC had the highest heating demand at 20.26 MW. The cooling demand varied significantly, with ionic liquids requiring at least 47.32 MW, while MCC had the highest cooling demand at 53.01 MW. The CCC recorded the highest electricity consumption at 6.45 MW, primarily due to the high-pressure compressors in the Helium-HEX (heat exchanger) system, which are necessary for cooling. Conversely, the MEA CC exhibited the lowest electricity consumption due to the limited number of pressure changers.
When combined with ASU at a 50% O2 configuration, all systems experienced a slight increase in electricity consumption, ranging from 2 to 3.5 MW, due to ASU compression requirements. In the 50% O2 ASU configuration, the highest cooling and heating utilities are 59 MW and 19.5 MW, respectively, in the MEA carbon capture process, which is comparable to other CC methods in terms of heating and cooling demands. When comparing the ASU and electrolysis in the 50% O2 setup, it becomes evident that electrolysis consumes more utilities overall. The elevated heating requirements can be attributed to the high mass flow rate of water in the electrolysis cycle, which must be maintained at a constant temperature of 70 °C. Additionally, electrolysis demands a significant amount of electricity, with a very high energy consumption of 43.4 MW (for oxyfuel combustion). However, the hydrogen produced through electrolysis, along with the reduction in the external hydrogen supply needed, can offset the utility cost advantage that the ASU has over electrolysis.
In cases of combustion with pure oxygen, the increased water mass from electrolysis leads to heating utility requirements of 39.16 MW and electricity utility requirements of 46 MW. In comparison, the values for the pure oxygen ASU combination are 9.7 MW for heating and 9.1 MW for electricity.
Total utilities are highest in the MEA cases, but CCC and MCC have higher target utilities. The difference between the target utilities and total utilities is attributed to the heating–cooling imbalance and the higher electricity consumption in these cases. Case 9 exhibits the highest total utility at 116.63 MW, whereas Case 3 shows the lowest total utility at 66.9 MW. On the target utility front, Case 11 is the most energy-intensive, with 56.65 MW, while Case 1 demonstrates the highest energy efficiency. In the optimized HEX scenario (target utility scenario), air combustion with MEA CC results in the lowest utility consumption.
In their study comparing the energy consumption of various CO
2 capture methods, Hua et al. report that cryogenic processes had the highest energy consumption, ranging from 6 to 10 MJ/kg CO
2. Chemical absorption required between 4 and 6 MJ/kg CO
2, while membrane technologies exhibited a broader energy range of 0.5 to 6 MJ/kg CO
2 [
36]. Since the simulation conducted in this work assessed the energy requirements of the entire system, it is not appropriate to directly compare these figures with those reported by Hua et al. However, it is feasible to compare which carbon capture methods yield the highest total utility from combustion in the air. Based on the target utility results, cryogenics again demonstrated the highest consumption, consistent with the findings of Hua et al. Nevertheless, an evaluation based on total utility produced a different outcome. This situation shows that the scenario without a HEX moves the simulation away from realism.
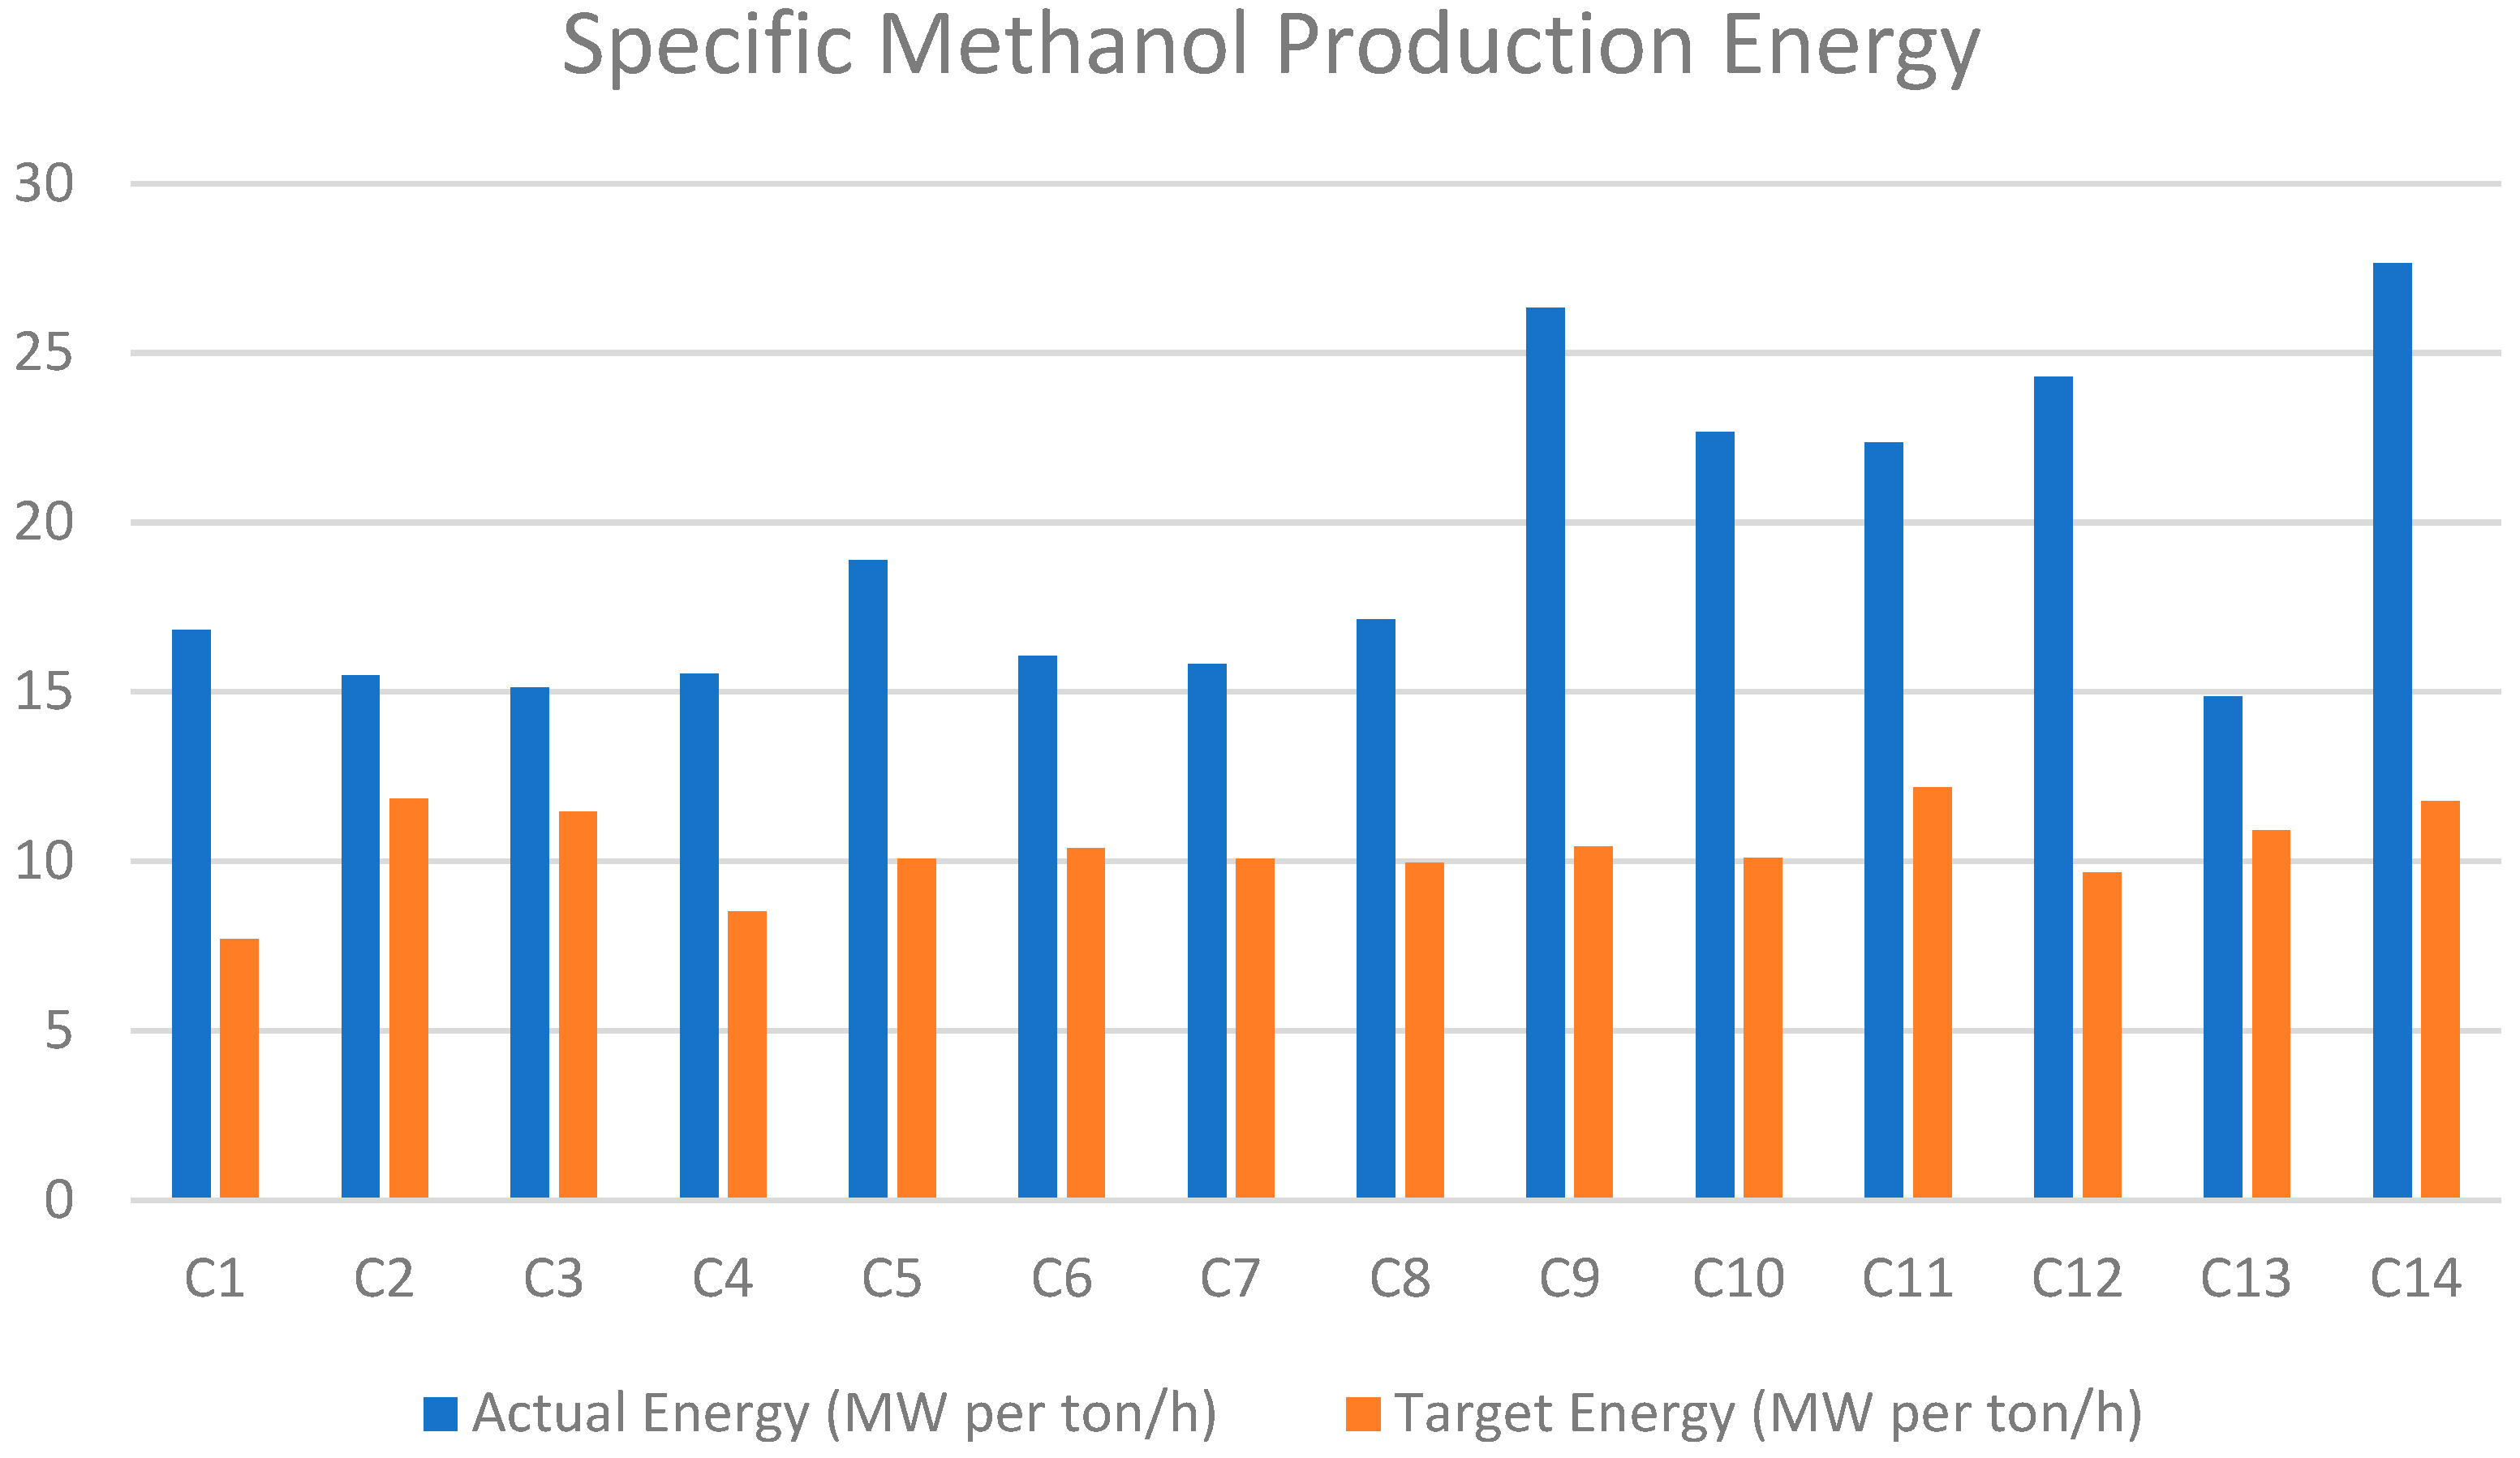
Figure 14 illustrates the total energetic utility by each case in MW per ton of methanol produced. Based on these results and considering the target utility values, Case 1 (MEA 0%) achieves the highest energy efficiency (utility per produced methanol), consuming 7.7 MW per ton/hour. In contrast, Case 11 (EL MCC 50%) has the lowest energy efficiency, with a consumption of 12.19 MW.
In the scenario that heat exchangers are not considered (total utility case), the highest energy efficiency is achieved with ASU oxyfuel combustion, reaching 14.9 MW per ton of methanol produced. Membrane CC air combustion yields approximately 15.12 MW per ton of methanol produced.
To sum up, ASU’s oxyfuel combustion was the most efficient technology in terms of methanol-specific energy, but air combustion with MEA carbon capture became more viable when focusing on target utilities.
3.4. Economic Results
This section compares and evaluates the CAPEX, OPEX, LCOE, LCOS, carbon capture costs, and the levelized cost of methanol production (LCOM) for the 14 cases. Detailed information on equipment costs, utility expenses, raw material costs, and product sales results of these cases can be found in
Table A1.
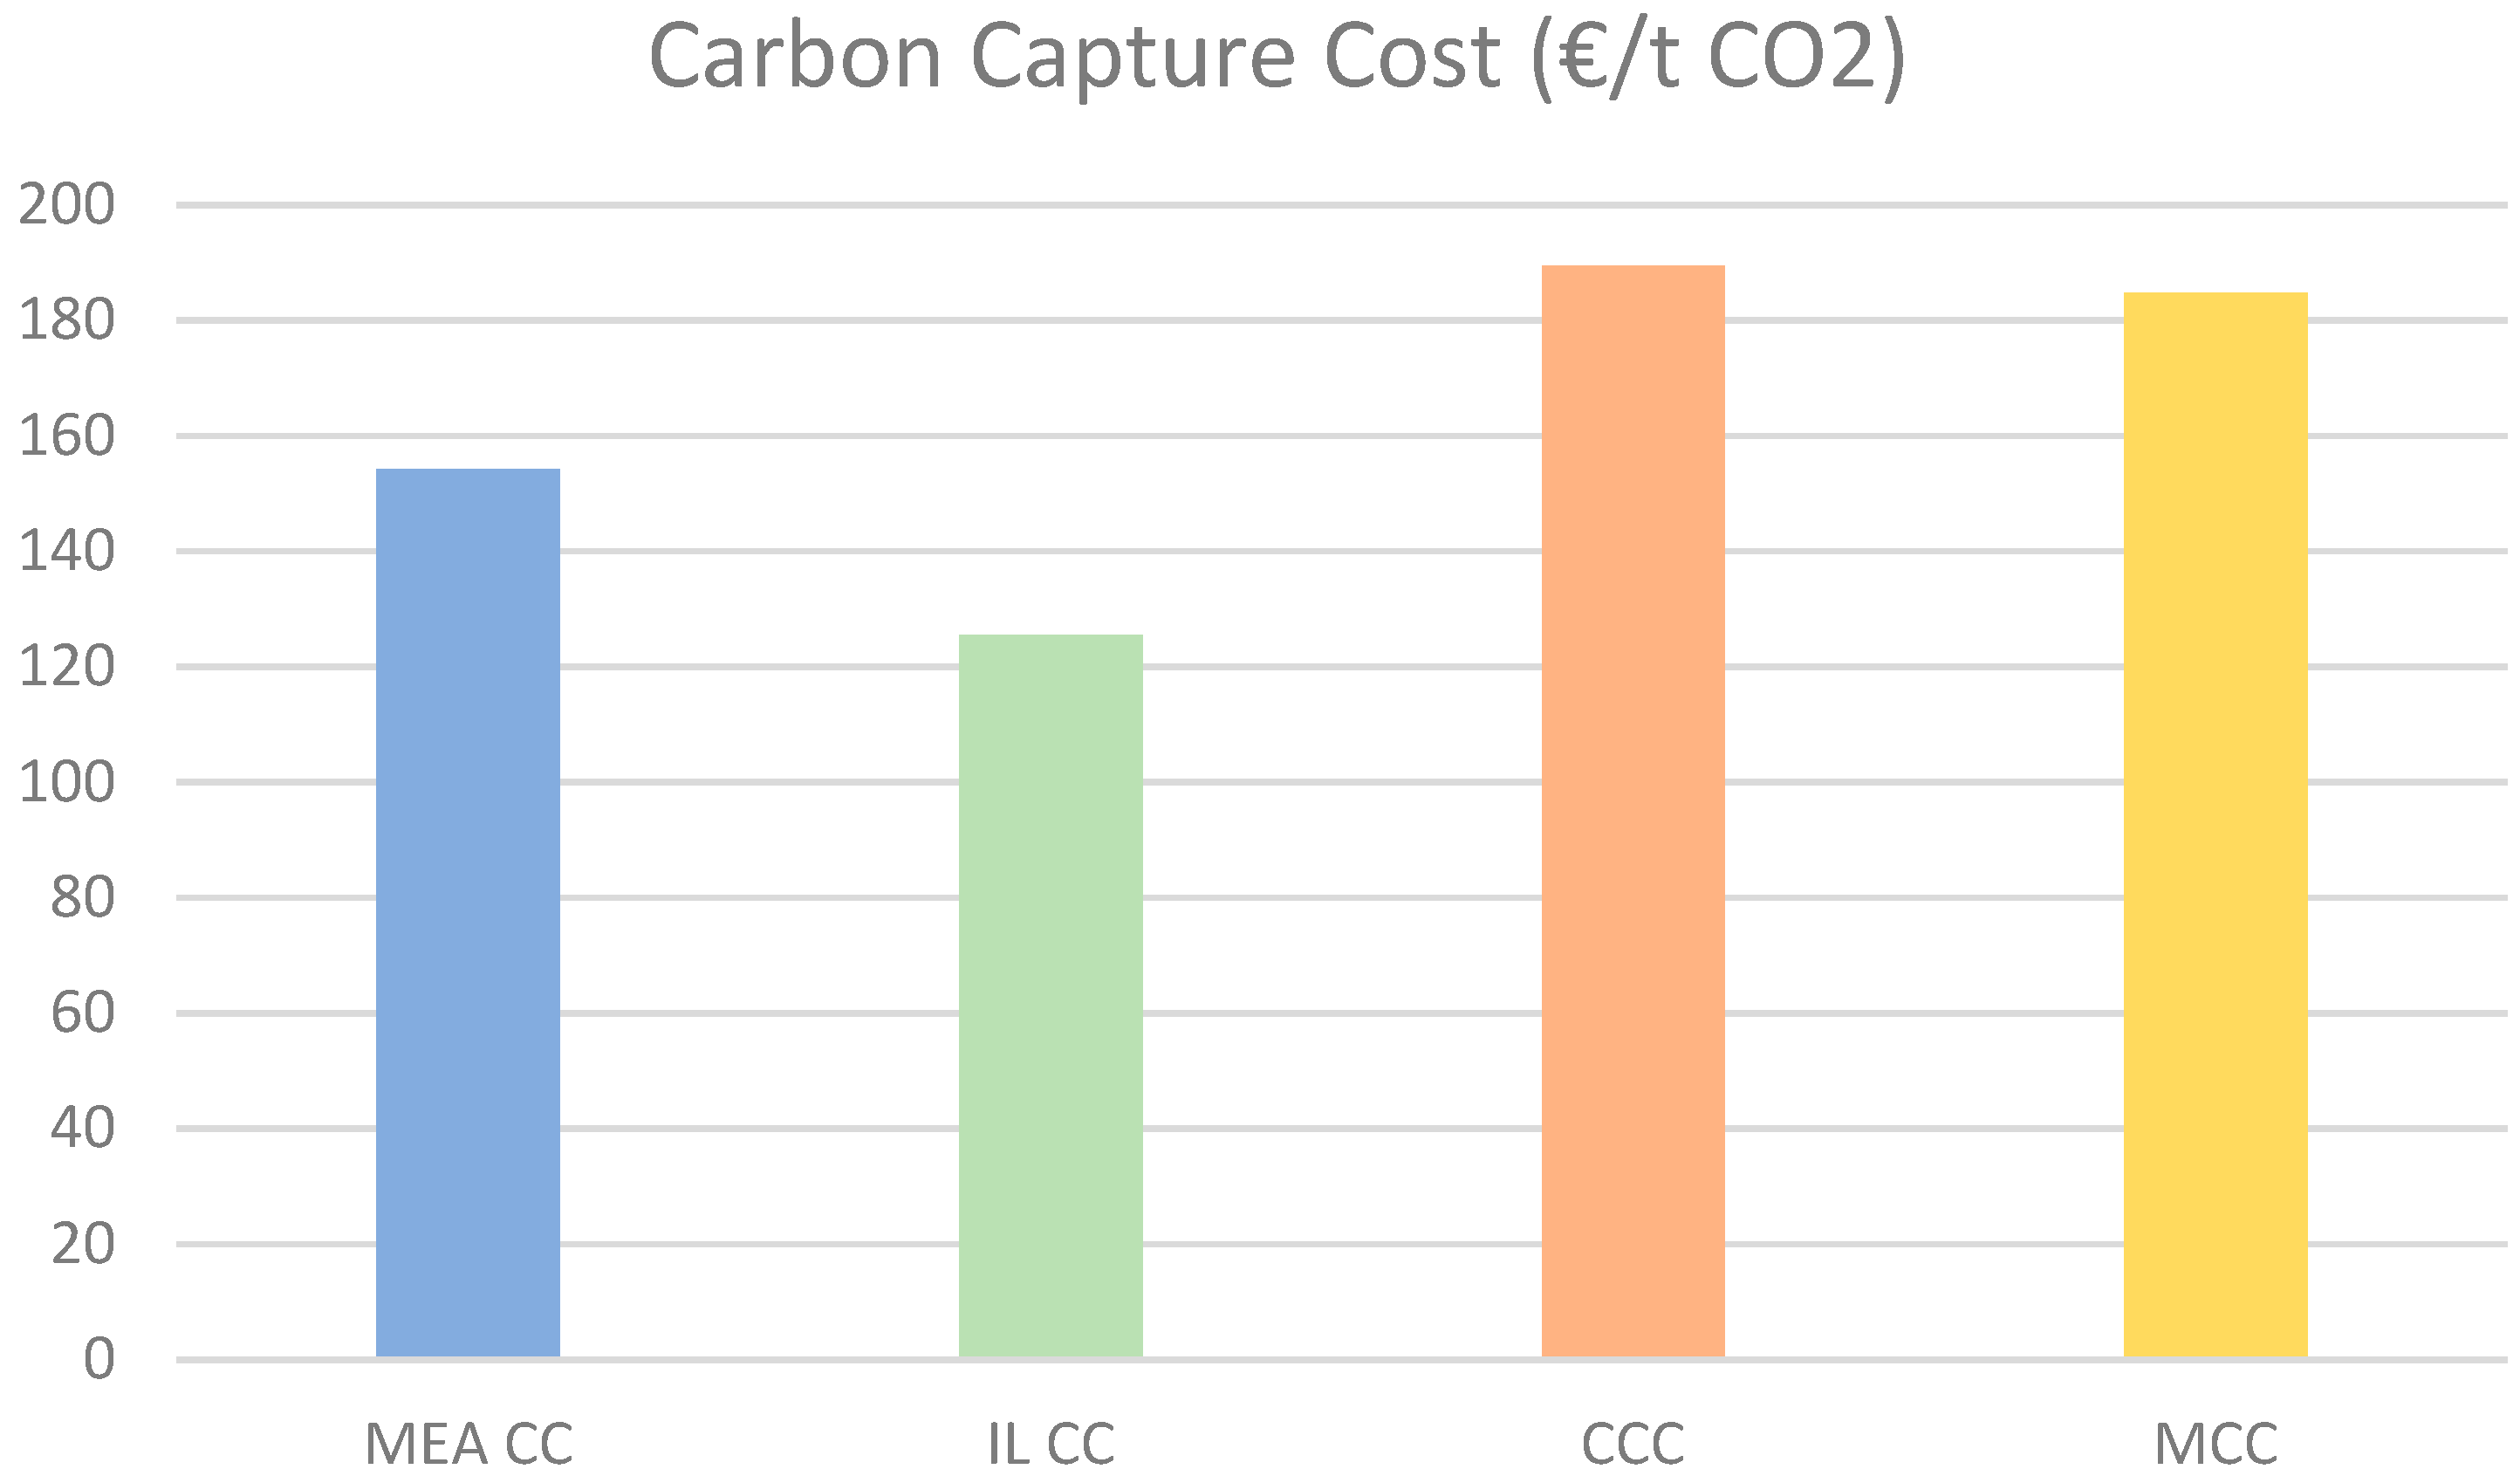
Figure 15 illustrates the carbon capture costs associated with various methods: MCC, CCC, MEA CC, and IL CC. The graph indicates that CCC costs the most at €190 per ton. In contrast, IL CC is the most economical method, costing €125 per ton, while MEA CC costs €155 per ton, and membrane CC is priced at €185 per ton.
The higher costs associated with cryogenic and membrane methods can be attributed to their greater electricity consumption. The rising electricity prices in Germany, combined with the assumption of an undiscounted electricity price, have caused the costs of these electricity-intensive methods to appear inflated. Additionally, the high capital costs of compressors in the helium cooling system of the cryogenic CC model further contribute to these results.
Kniep et al. estimate the carbon capture cost from the Polaris membrane to be around
$50 per ton, which is significantly lower than the findings presented in this work [
37]. This disparity may be attributed not only to the increase in electricity prices but also to dollar inflation since 2016. In a separate study conducted in 2024, Bertone et al. estimate the carbon capture cost for MEA to range from €156 per ton to €90 per ton, with costs decreasing as capacity increases [
38]. As anticipated, the simulation results presented in this work were consistent with those of the study by Bertone et al., which was conducted under European conditions.
Table 19 presents the CAPEX, OPEX, LCOE, and LCOS for the 14 cases. The highest CAPEX is associated with the ASU CCC at €87 million, while the lowest CAPEX is found in the IL CC air combustion case at €30.10 million. The CAPEX for air combustion methods is generally lower than that of other technologies. This is primarily due to the significant costs of equipment for both the ASU and the electrolyzer, as well as the substantial electricity required for oxygen separation in both methods.
Regarding OPEX, the EL oxyfuel combustion method incurs the highest costs. Elevated electricity prices, combined with the fact that hydrogen production costs are the same across different methods (at €3.55/kg H2, for steam methanol reforming, or SMR), contribute to the high expense of electrolysis, which exceeds €11/kg H2. Conversely, air combustion has a lower cost level compared to all carbon capture methods in terms of OPEX.
When evaluating the LCOE, the high CAPEX and OPEX associated with electrolysis result in a substantial cost. Cases utilizing IL, MEA, and MCC with air combustion show a minimum LCOE ranging from €550 to €590 per MWh. LCOS also varies in proportion to the LCOE, with values ranging from €450 per ton for Case 14 to €87.25 per ton for Case 4.
From a cost perspective, the affordable price of IL CC, combined with low OPEX costs, results in relatively favorable LCOE and LCOS figures. Based on these results, Case 4 emerges as the most cost-effective option in terms of both LCOE and LCOS, while Case 14 is identified as the most expensive. These findings are consistent with the results related to CO2 capture costs.
Figure 16 presents the LCOM for the various cases analyzed. The trend observed in this table aligns closely with the LCOE and the LCOS. Among the cases, Case 4 emerges as the most cost-effective method at €768 per ton of methanol, followed by Case 1 at €787 per ton. These findings indicate that chemical absorbents, the most utilized post-combustion method on the market, also yield the lowest costs.
In Case 3, the membrane technology delivers a cost of €815 per ton of methanol. It could potentially surpass Case 4’s performance if a less commercial, yet higher-permeability method was employed. Notably, when a 50% CO2 configuration is applied in the ASU method, the membrane achieves a lower cost of €929 per ton of methanol compared to the other cases.
Interestingly, a different trend is observed with air combustion, where the costs and performance of the membrane increase with the flue gas CO2 mass fraction. Additionally, Case 13, which utilizes ASU oxyfuel combustion, performs comparatively well with an LCOM of €939 per ton of methanol.
The system primarily produces two products: methanol and electricity. Since the power and energy output of the system are divided between these two products, both the LCOE and the LCOM figures are significantly higher than those reported in existing literature. Additionally, in contrast to many studies in the existing literature, this system incorporates process steps for separating O2 and H2, as well as capturing SOx and NOx. While these additional processes enhance the system’s comprehensiveness, they also lead to higher LCOM and LCOE due to the need for extra equipment and utility expenses.
For instance, in a techno-economic and lifecycle analysis of the methanol production process that incorporates carbon capture from biomass, Tariq et al. calculate critical metrics such as equipment sizing, CAPEX estimation, OPEX estimation, and LCOM data, yielding a LCOM result of
$413 per ton of methanol [
39]. This figure is notably lower than even the lowest amount found in this work. The discrepancy arises because Tariq et al. employ a PV-based system for hydrogen production, which costs
$2.80 per kilogram of hydrogen. They also assume an electricity price ranging from
$50 to
$100 per MWh and did not generate electricity within their system.
Hossain et al. conduct a techno-economic study on a combined generation system based on a sewage sludge plant [
40]. In their research, they calculated parameters such as net present value and internal rate of return, ultimately finding a LCOE ranging from
$80 to
$90. This figure is significantly lower than the LCOE estimates presented in this work, as their study did not account for carbon capture or methanol production. On the other hand, including analyses of the internal rate of return and profitability in this work, as seen in Hossain et al., would have provided a clearer understanding of the system’s feasibility and profitability.
Pellegrini et al. also perform an economic analysis of a combined energy and methanol production plant [
41]. In their study, they assess equipment and capital costs. Similarly to the method used in this work, they calculate the revenues and expenses related to methanol and electricity based on market unit prices. They also compare the operating costs of both the standard system and the modified version, including the cost of methanol production.
In evaluating the economic analyses, using the HEX integrated system could have significantly lowered energy costs and reduced the LCOE, LCOS, LCOM, and carbon capture cost. Additionally, the exorbitant costs associated with certain equipment in the APEA analysis, such as the turbines, HEXs, and compressors in the CCC’s helium cooling system, which amount to tens of millions of euros, along with potential inefficiencies in the models, significantly impacted the energy and techno-economic analysis sections. Addressing these shortcomings in the modeling could enhance the realism of the simulation results, bringing them more in line with existing literature.
