Article

Partial Discharge Inception Modeling in Insulation Systems for Aviation and Aerospace Applications

1
Center for Advanced Power Systems, Florida State University, Tallahassee, FL 32310, USA
2
GE Research, Niskayuna, NY 12309, USA
*
Author to whom correspondence should be addressed.
Energies 2025, 18(23), 6225; https://doi.org/10.3390/en18236225
Submission received: 30 September 2025 / Revised: 5 November 2025 / Accepted: 20 November 2025 / Published: 27 November 2025
(This article belongs to the Special Issue Energy, Electrical and Power Engineering: 4th Edition)

Abstract

The increasing diffusion of high-voltage electrical assets in the field of aviation and aerospace sectors, due to the transition towards electrified transportation, brings significant challenges related to electrical insulation that need to be addressed. This work proposes a procedure to obtain reliable and partial discharge-free designs of aviation/aerospace electrical and electronic components, which stem from the recently developed three-leg approach. A partial discharge (PD) inception model that contains an explicit dependence on pressure is proposed and validated through a wide range of pressure levels ranging from 0.05 to 3 bar in air and CO2. Model fitting to measured partial discharge inception voltage (PDIV) values appears to be very good in air as well as CO2 environments; therefore, it can be speculated that the proposed approach can be used to predict PDIV in the case of solid insulation systems at different operating pressures, enabling PD-free insulation system designs to be carried out.

1. Introduction

Aviation and aerospace sectors are inevitably moving towards total or partial (hybrid) electrification [1,2,3]. Such a move is, however, dependent on the achievement of large specific power generated and delivered within the electrical asset. This, in turn, will require nominal voltage values to rise, likely well beyond 1 kV, with unconventional types of voltage waveforms as those provided by a power electronics supply. It is evident that this situation is evolving into “hic sunt leones” territory [4] if massive research efforts are not promptly promoted, especially in terms of reliability, resilience, and safety areas.
A major challenge is certainly the design of insulation systems of any electrical and electronic asset component, which is not just a problem of voltage, but rather of the electrical field. Indeed, insulation intrinsic and extrinsic aging are driven by the electric field (together with temperature and mechanical stress) [5], and insulation thickness is often calculated, based on intrinsic-aging life models, using a mean field concept. The underlying assumption is that extrinsic aging, i.e., mostly PD, is absent for all life [6,7]. Electrification plans moving towards higher voltage include the massive use of power electronics and a reduction in dimensions and weight that will reflect into large field gradients and peak values in the bulk and surfaces of insulation systems, thus increasing the likelihood of PD inception.
In summary, while increasing voltage is an aspect of this evolution, packaging (rising specific power in weight and volume) and using more effective power supply (modulated AC and DC) are the real challenges for insulation system reliability.
Notably, insulation design concepts and procedures come from AC sinusoidal heritage, as they are based on experience and field returns with AC supply voltage (seldom with DC). Also, creepage and clearance specifications were conceived when examining AC sinusoidal (and DC) supply, and surface electric field distribution was to be mostly uniform. These may not be conditions that one can expect in modern insulation systems of electrified assets. An AC voltage waveform can be significantly distorted, compared to an AC sinusoidal waveshape, by DC components and power electronics. Even DC voltage may not be constant in time and magnitude, being affected by ripple, energization, voltage polarity inversion, and transients. Electric field distribution can be significantly divergent, especially on surfaces at triple points and in insulation bulk around wires and conductive parts (as in printed circuit boards, PCBs, and laminated busbars, LBBs).
Partial discharges are another feature of interest. They are generally measured for quality control and diagnostics of electrical asset components under AC sinusoidal voltage; however, they are currently not well-understood, and not enough scientific work has been performed in the case of DC and power electronic waveforms.
As a consequence, hard times for electrical asset component reliability can be expected as full electrification will become a central development for aviation and aerospace transport evolution.
As mentioned, insulation system design must account for both intrinsic and extrinsic aging, being the former “reaction” of insulating materials to applied stresses, which determines the design stresses and life/reliability, and the latter the extra-aging occurring due to designs, manufacturing, or commissioning flaws, that can significantly reduce life, causing premature failure. The most sought driver of extrinsic aging is partial discharges, which can occur due to defects or design solutions, such as cavities present in bulk insulation, interfaces, insulation surface, and triple points. In the case of organic insulating materials (composing most insulation systems), PD will cause accelerated local degradation, which ends up with insulation perforation and, in general, electrical asset outage. Given that this is an event that cannot even be imagined in aircraft/aerospace structure operation, the study of PD must take central importance in insulation system design and safe operation of any electrical asset component, considering that, to complicate the picture, PD inception voltage (PDIV) can considerably diminish with increasing altitude. Hence, aircraft or spaceship components that are PD-free at standard atmospheric pressure (SAP) may be affected by PD at flying altitude.
U.S. Advanced Research Projects Agency-Energy (ARPA-E) has understood this challenge and put in place projects where insulation system design in electrified aircraft has a central focus, from Aviation-class Synergistically Cooled Electric-motors with Integrated Drives (ASCEND) to Connecting Aviation By Lighter Electrical Systems (CABLES). Under CABLES, General Electric (GE) Research, with Florida State University, has proposed utilizing a revisited concept of GIL (gas-insulated line or cables) for power distribution within an aircraft, where gas made by pressurized carbon dioxide (CO2) is the main electrical insulating medium. This would allow higher-efficiency and lower-weight power transmissions on electrified aircraft to be achieved at voltage levels around +/−5 kV [8,9,10].
In this project, a driving topic has been the design of cable and connector insulation systems, involving gas and solid insulating materials, focusing on surface insulation sub-system design and relevant triple points. For this purpose, the concept of partial-discharge-free design was developed in order to reach criteria that can ensure that cable and accessories operate at any planned altitude in the absence of extrinsic (PD) aging.
This paper aims to illustrate how robust and PD-free design of aviation/aerospace electrical and electronic components can be achieved by applying a recently developed design procedure (the three-leg approach, [11]), which involves a new model for the estimation of PD inception field (PDIE) and voltage (PDIV) in bulk defects and on insulation surface. Such a new model has an explicit dependence on pressure and known parameter values. Various experimental investigations on test objects under AC (sinusoidal and modulated) and DC (see, e.g., [11,12,13,14,15]) proved the validity of the three-leg approach and allowed model parameter values to be estimated in air, but here, the model is applied to both air and CO2 insulation. Even if the three-leg approach can work for both internal and surface defects, in this paper, only the latter is used, in relation to the design of gas-insulated cable spacers at variable pressure levels (higher and lower than standard atmospheric pressure, SAP).
Work on the effect of pressure on PD phenomenology, generally without modeling PD inception, can be found already in the literature, e.g., [16,17,18,19,20,21,22], where the dependence of PD magnitude, associated frequency on pressure/altitude, is illustrated and discussed based on experimental results and theoretical considerations. The innovative contribution of this paper is to present the application of a new approach (the three-leg) to achieve PD-free design of insulation systems at variable pressure levels used in aviation and aerospace, with specific reference to the mentioned new aircraft cable structure. The proposed model, derived from Niemeyer’s work [23,24,25], is simple and practical, with the advantage that it can be applied to any insulation structure, type of defect, and voltage waveform, with unknowns that can be calculated by resorting to electric field calculation. In addition, the first two legs of the approach can provide both PDIE and PDIV.
Section 2 of this paper describes cable and test object setup, while the fundamental tool for PD-free design, i.e., the three-leg approach and the new model for partial discharge inception in insulation bulk defect, surface and interfaces, is dealt with in Section 3. Results of tests performed for surface discharges at lower and higher-than-SAP levels, precisely from 0.05 bar to 3 bar, and fitting to the estimates provided by the modeling approach, are described and discussed in Section 4.

2. Cable and Test Set

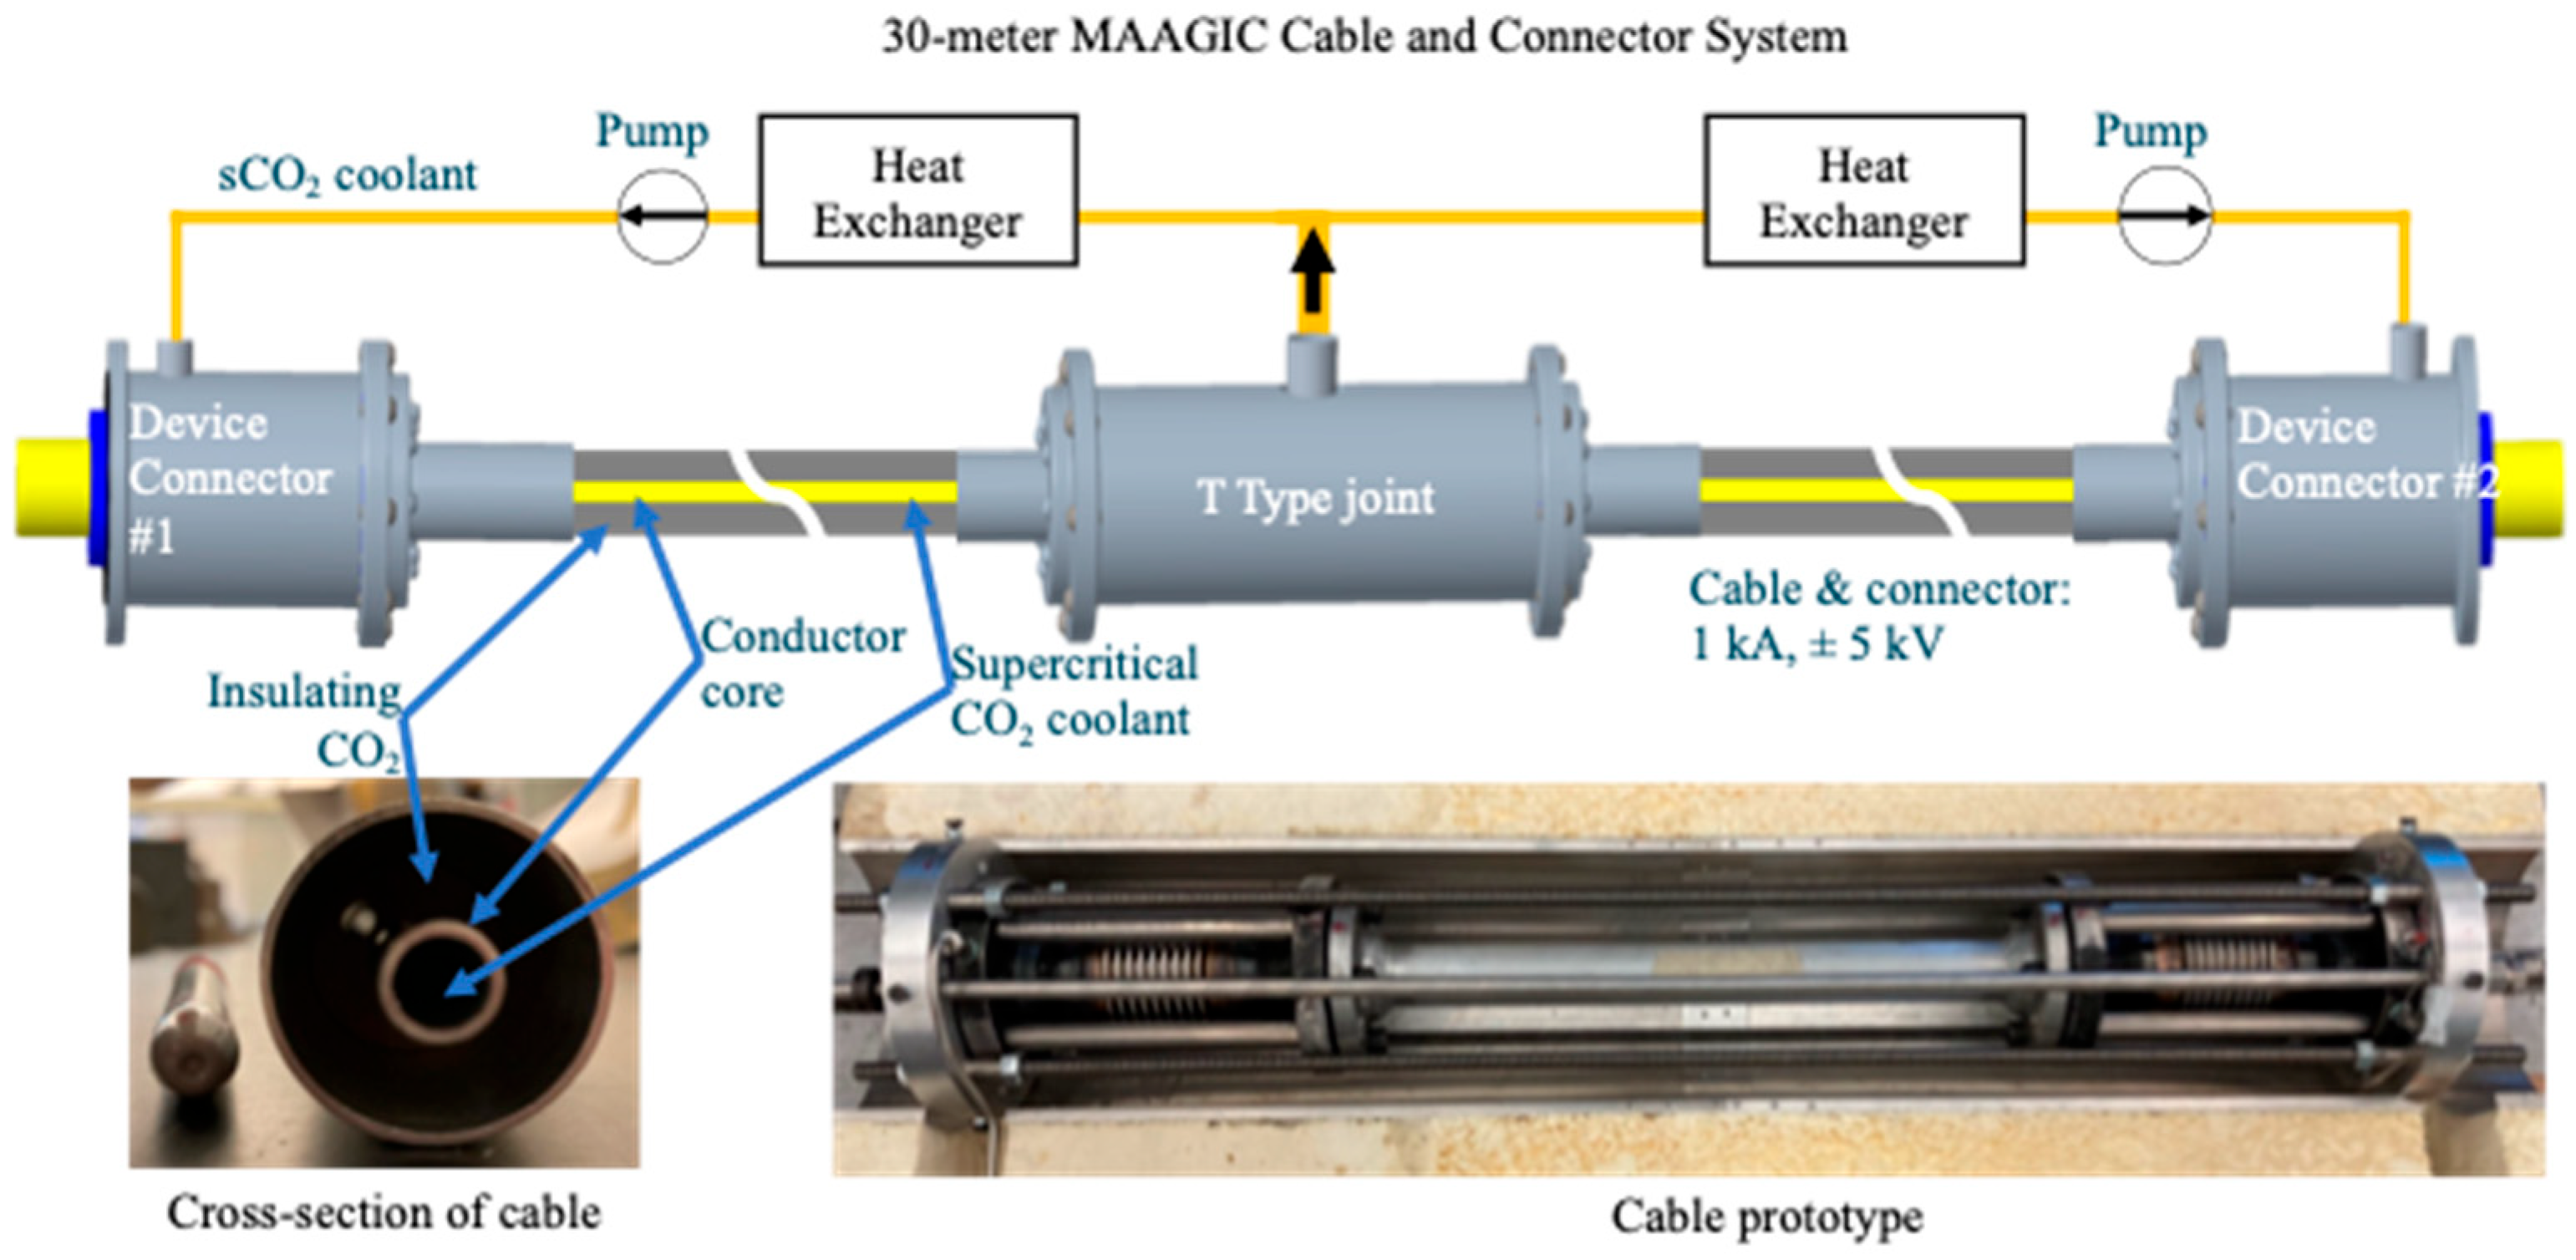
The drawing and picture of the project cable model are in Figure 1. Gas insulation was chosen to be CO2 at a pressure of 5 bar, considering that CO2 is also used in the same aircraft concept as a cooler. There is no expectation of much better dielectric performance than dry air, but the latter can easily increase humidity content due to ambient contamination penetrating the cable system, thus showing worse performance with operation time. Also, the typical compressed air available at airports might not have the purity required for HV insulation. On the other hand, air at low pressure will be the typical environment of most insulation components of an aircraft at cruise altitude; thus, air has been included in a global evaluation of PD inception model performance, from low to high pressure (lower and higher than SAP).
As regards solid insulation used, e.g., for cable spacers and connectors, various materials were considered. In this paper, we focus on Alumina, i.e., Al2O3, a typical inorganic insulating material for aerospace and aircraft applications where high operating temperatures are sought, and FR4, a fiberglass-reinforced epoxy laminated (thus, organic–inorganic materials) often used for PCB insulation. Variation in insulation system dimensions can be taken into consideration by using the size effect algorithm, which provides the expression that can be able to transform the value of the electric field (or electric strength) as derived by laboratory tests on small test objects, to that which can be used in the full-size insulation [26].
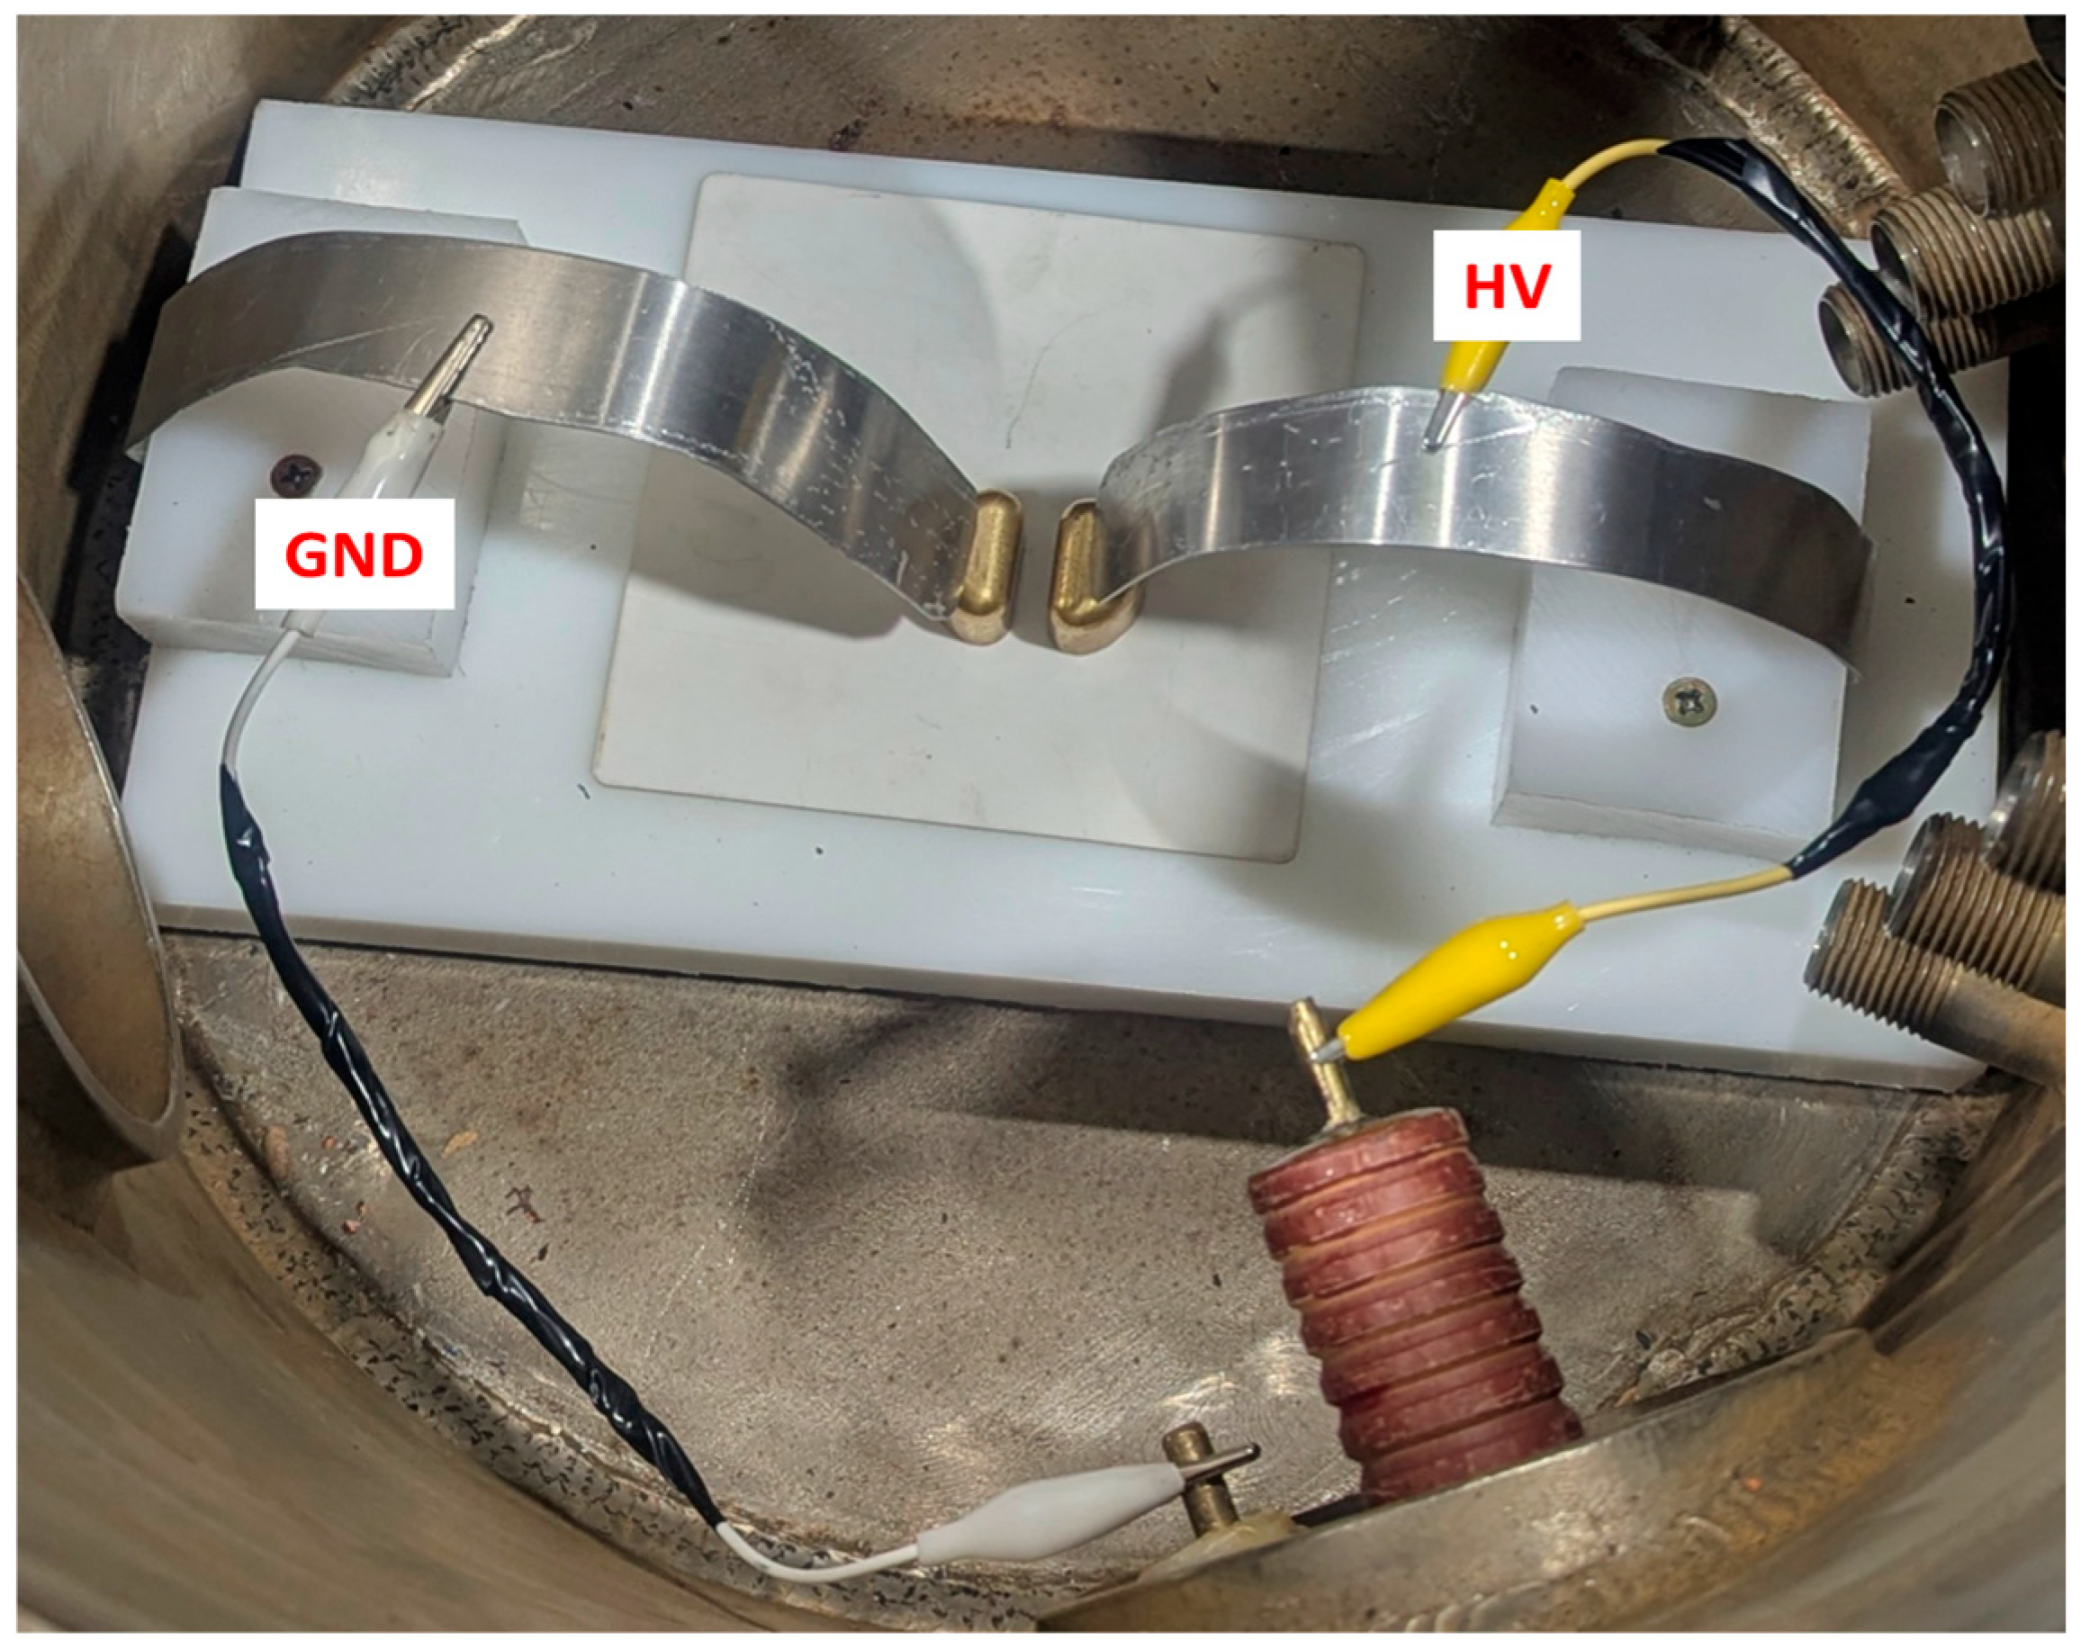
PD inception voltage tests were performed in two types of chambers, using the same electrode arrangement of Figure 2, which is able to generate surface discharges on the insulation on which they are placed. Figure 3 displays the test electrode setup placed inside the pressure chamber with surface discharge electrodes and insulation specimen mounted on the test platform. The electrodes were made from brass, and their curvature radius at the triple points (PA and PB) is 0.1 mm. An aluminum holder, as shown in Figure 3, keeps the electrodes such that the distance between them is maintained undisturbed (from mechanical actions that might occur while closing the pressure chamber lid). The distance between the electrodes is manually adjusted to the required value with the help of a vernier caliper.
PDIV measurements were performed by increasing the supply voltage (through steps of 0.1 kV each lasting 30 s) until detection of steady PD phenomena, according to IEC 60270 [6]. AC sinusoidal voltage was used, rather than power electronics waveforms (as pulse-width modulated, PWM), since modeling and experiments indicate that in simple test object geometries, as flat specimens or twisted pairs, the difference between AC sinusoidal PDIV (peak-to-peak value) and AC-modulated repetitive PDIV (RPDIV) is generally small [27]. This assumption was validated during the research described in this paper, carrying out PDIV tests under AC sinusoidal and 2-level bipolar PWM (AC modulated) waveforms, the latter with modulation and carrier frequency of 60 Hz and 1 kHz, respectively, on the same specimen at SAP and 500 mbar. PDIV mean values (over 5 repetitions) differing by only 4% at SAP, and 9% at 500 mbar were obtained (referring to peak voltage and distance between electrodes l = 5 mm). PDIV tests were repeated at least 5 times to obtain robust mean values, waiting for 30 min between one test and the other (to allow the disappearance of space charge deposited by PD activity). Also, at least three specimens were tested at each pressure level and electrode distance, from 5 to 10 mm.
Figure 4 sketches the test arrangement. The sensor for PD was a high-frequency current transformer, HFCT, with a bandwidth from 10 kHz to 50 MHz. The PD detector had a software filter that could be used to comply with an IEC 60270 bandwidth and sensitivity of 1 mV (corresponding to about 1 pC after calibration). The PD detection system has innovative software, based on the Separation, Recognition, Identification (SRI) approach, which allows automatic measurements and analytics to be performed. The identification output (based on fuzzy logic) is the likelihood of PD typology in descending order of harmfulness, that is, internal, surface and corona PD. For the tests performed by the electrode system of Figure 2 and Figure 3, identification was mostly surface PD, with likelihood ranging from 1 at SAP and high pressures to 0.8 at 200 mbar and below. The nature (surface) and location (triple point) of PD were confirmed by simultaneous UV camera observation at SAP.
Tests at low pressure (specifically, 0.5, 0.2 and 0.05 bar) in air were performed in a pressure chamber that can reach 0.01 bar, 90 °C, with variable humidity and up to 50 kV. Tests at high pressure (2 and 3 bar) were carried out in a cell specifically designed for this project [8], able to reach 10 bar. Tests at low pressure (0.8 and 0.5 bar) in a CO2 environment were also performed using the above-mentioned pressure chamber.

3. PD-Free Design

3.1. The Driving Approach to Reliable and PD-Free Design: Three-Leg Approach

Innovative insulation system design has been exploited through the so-called three-leg approach. It aims at determining insulation dimensions, as regards bulk and surface sub-systems, reaching the specified life and reliability and avoiding the inception of PD during operation (PD-free insulation system design) [12].
Since both intrinsic aging and PD are caused by the electric field magnitude, the field distribution in the considered insulation system must be calculated, e.g., using simulation software (COMSOL 6.3 in the following). This is the first leg. The second leg is life and discharge modeling, where the former establishes conventional insulation dimensions (thickness, surfaces) and the latter deals with the value of the partial discharge inception field for a given defect height and location and surface length (creepage); see Equation (1). Eventually, the third leg consists of PD measurements and accelerated life tests to validate the results predicted by legs 1 and 2. Specifically, the PDIV estimated by means of legs 1 and 2, increasing the voltage in the simulations (first leg) until the maximum electrical field matches that provided by (1) (second leg), can be experimentally validated.
Since PDIV has a stochastic component (due to the availability of the first electron and memory effect), it should come, e.g., as a mean value from repeated tests. Apart from providing a number value of pC or mV from PD measurements, it is of fundamental importance that such a number is associated with the type of defect generating PD, that is, with its harmfulness as regards degradation rate, and condition maintenance plans. Therefore, a PDIV measurement tool must be endowed with an analytical software that can provide the identification of PD, in relation to their harmfulness, e.g., internal, surface or corona discharges (in descending order of induced extrinsic aging rate) [28]. Internal PD are partial discharges occurring in cavities embedded in insulation, where the orthogonal (radial) component of the electric field drives avalanches from HV to LV cavity sides (and vice versa if AC). Electrical trees can incept and grow fast, causing insulation breakdown. Surface PD are generated by the tangential field and develop on the insulation surface/interfaces. The field is weaker (compared to the orthogonal component), and even if some PD pulses can have a large magnitude, surface degradation needed to generate an electrical tree in the orthogonal field direction may take a long time. Corona discharges occur in air, with the major byproduct being ozone, which is able to cause light chemical decomposition of the insulation surface. They may not affect, in practice, insulation reliability.
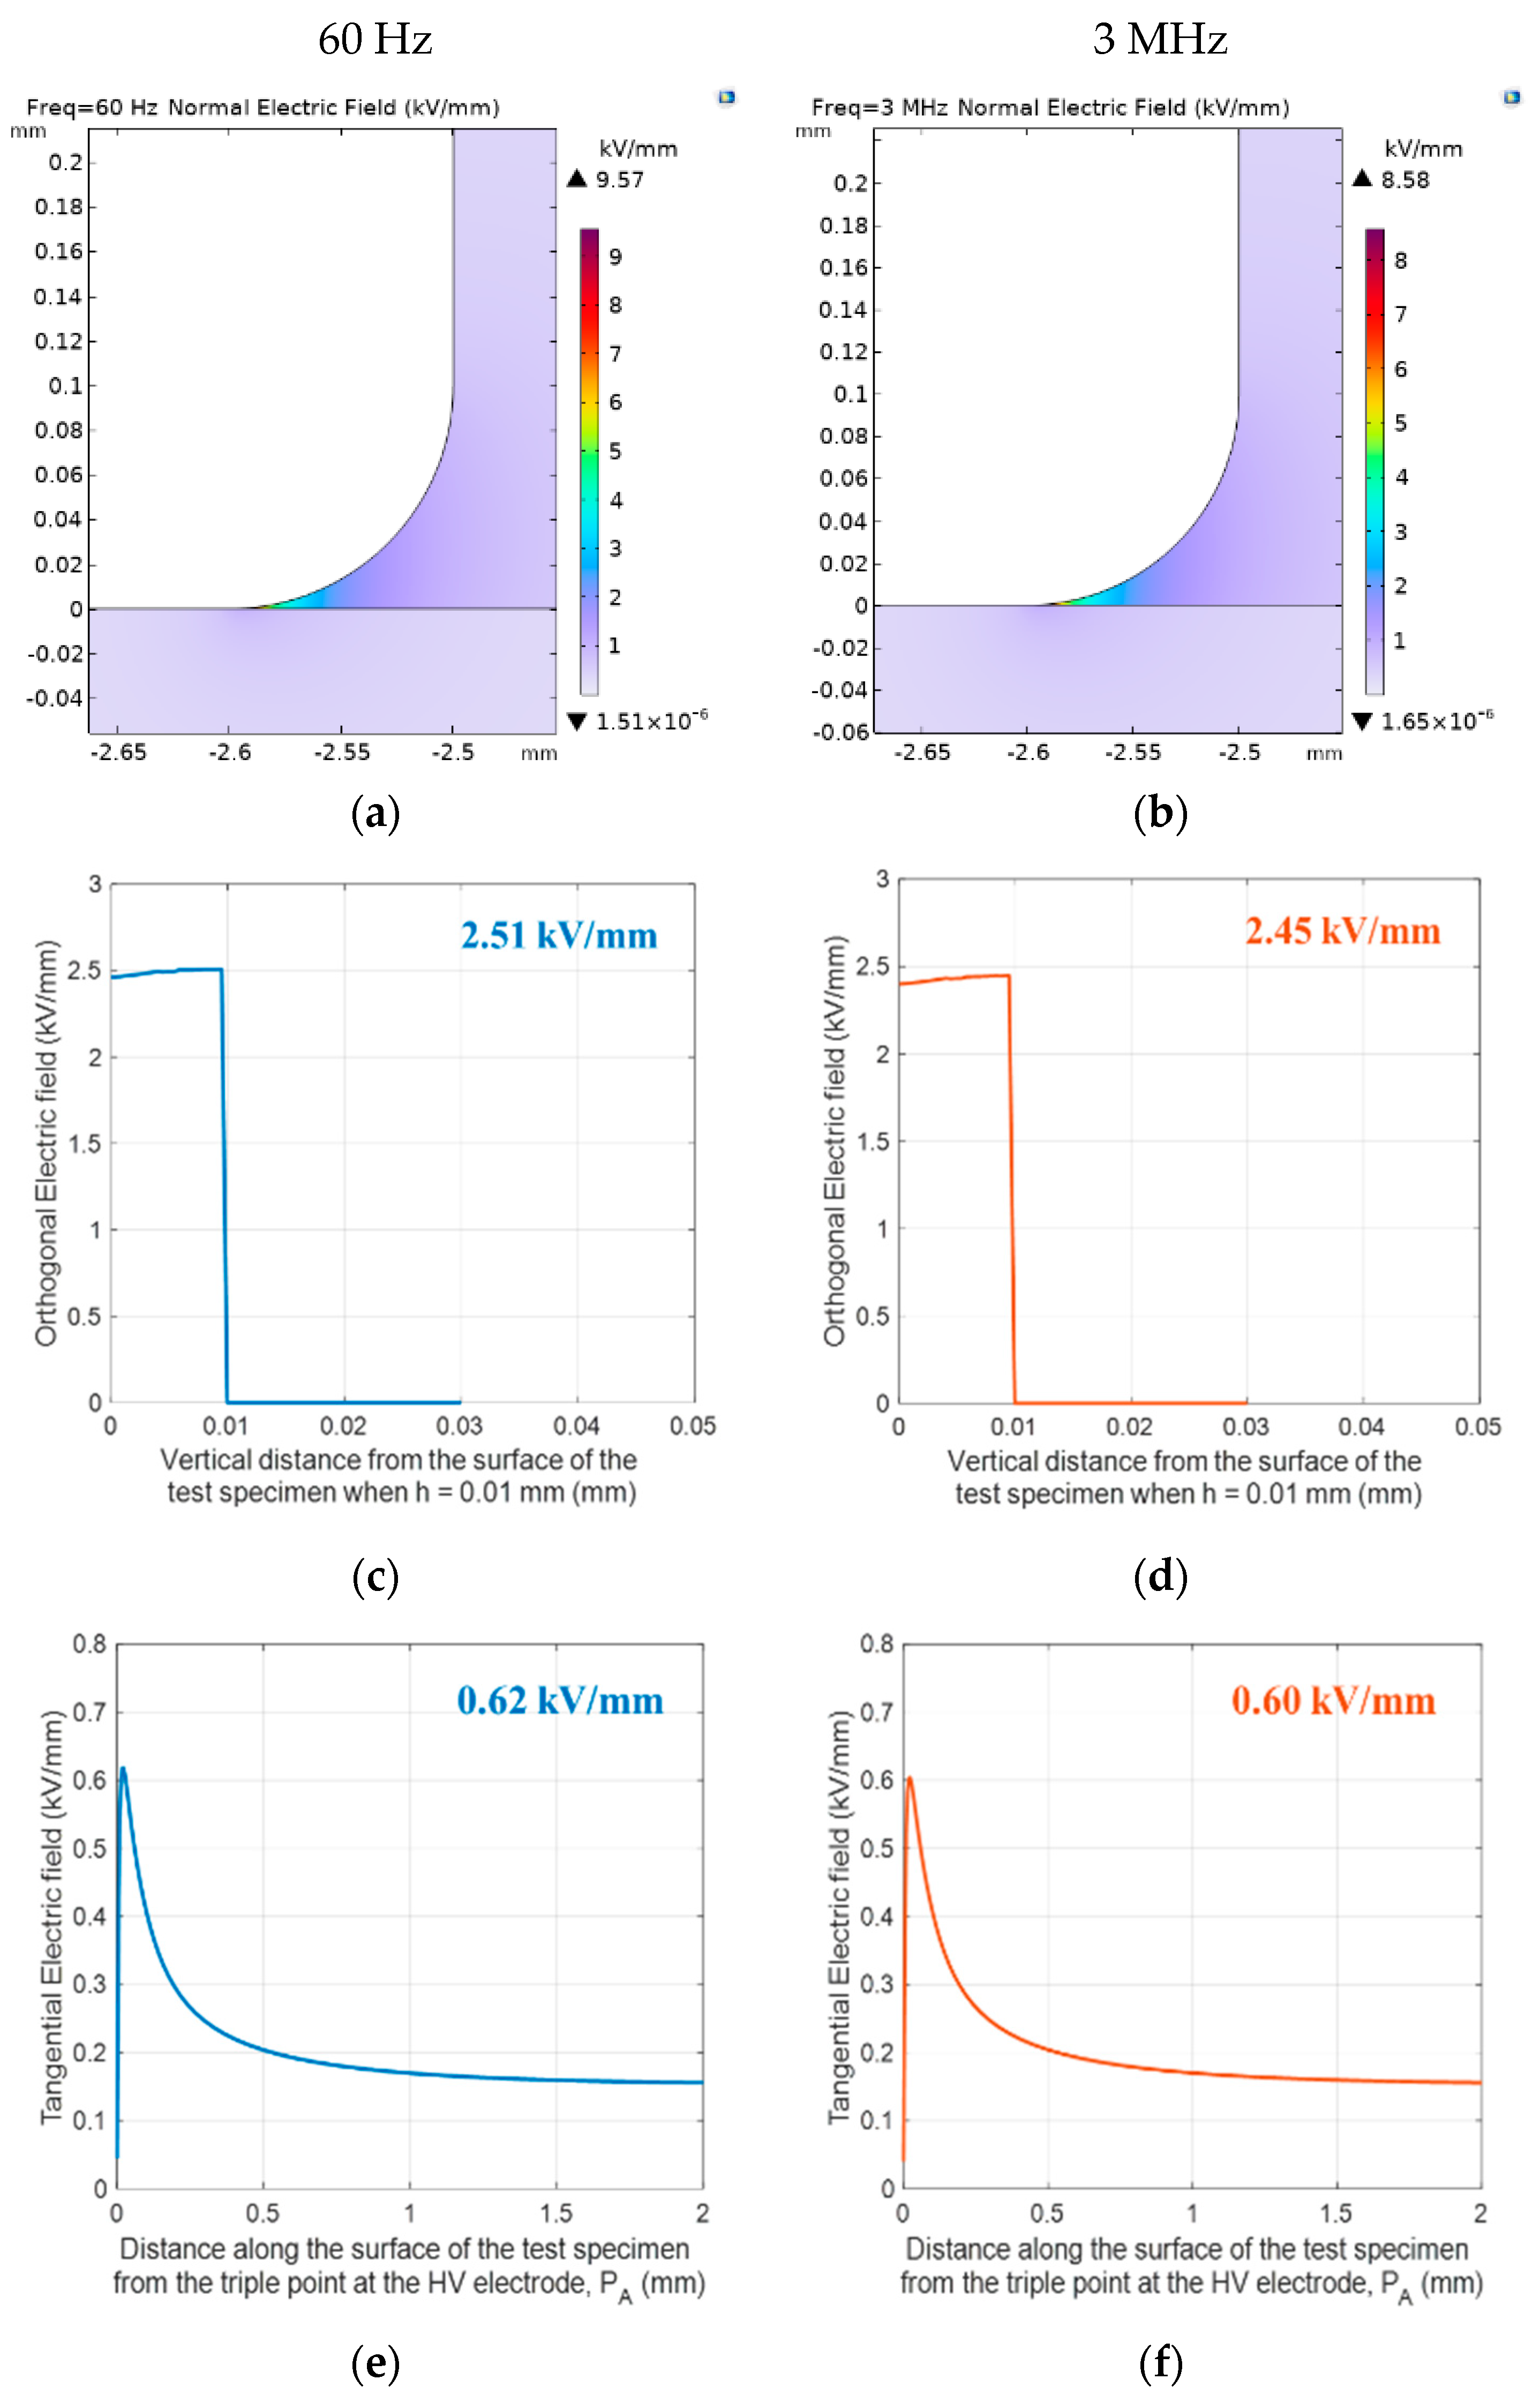
As regards testing voltage waveform and its impact on PDIV, it must be noted that since voltage waveshape is not contemplated in the discharge inception model (1), it cannot be expected that PDIV will change significantly from AC sinusoidal to AC modulated waveshapes, as long as the electric field distribution does not vary, too. Figure 5 shows an example of electric field distribution at the electrode contour, where orthogonal and tangential field profiles near the electrode triple point (Figure 2) are displayed at low and high AC sinusoidal frequency. As can be seen, electric field profiles do not change noticeably with frequency for the considered test objects.

3.2. Discharge Model

A new PD inception model was proposed in [11,13] for various insulation materials (where it was validated at SAP), starting from the Niemeyer model [23,24,25]. A global discharge inception model, holding for both internal and surface discharges, was obtained, which has a close form and can be fully exploited by resorting to electric field profile simulation. Details on the derivation of the new surface PD inception model are reported in [10,11,13,14]. Summarizing, its expression is
P D I E = E i = E p c r p 1 + B p k s l 1 / β
where l is the distance between triple points of HV and ground electrodes (creepage) for surface discharges or cavity height for internal PD, E p c r , B , β are model parameters based on discharge physics [13,23]. They are known, having been estimated by several tests performed on different materials and electrode systems (providing internal surface PD), at various pressures, under AC and DC voltage [11,14], and in an air environment. k s is a scale parameter which defines a region (near to triple point for surface discharges or in a cavity) where the field is approximately maximum and uniform. It can be speculated that k s ≈ 1 for internal PD, but it is <1 when surface PD starts from triple points where the electric field is divergent: the larger the divergence, the lower k s [13]. A simplified estimate for k s that can allow straightforward and explicit use of the PD inception model, based on electric field profile calculation, is
k s = l K E p + l K E p l
with E p being the maximum value of the field as obtained from the electric field profile calculation and K 0.95 . In this way, the estimate of k s depends only on gap/distance, geometry and material property (permittivity in AC and conductivity in DC), while the other model parameters relate to discharge physics. Eventually, it is noteworthy that model parameters have different values for internal and surface discharges (with the latter also being related to surface material characteristics) [14]. Also, it must be pointed out that the model has a deterministic nature; thus, PDIV estimation can change (slightly) when the underlying assumption (i.e., infinite availability of avalanche-firing electrons) is affected by supply voltage waveshape. For example, in the presence of voltage impulses with very high slew rates, PDIV in capacitive objects could be slightly higher than for lower slew rates. This is due to the random availability of a firing electron that could be achieved at a higher voltage than for a slower rise time. To complete the overview, it must also be underlined that, erroneously, the PDIV value is generally associated only with the voltage waveform, with the assumption that the faster the voltage rise time, the lower the PDIV. However, the major contribution is brought by the electric field distribution (leg 1): if the peak field is enhanced in part of the insulation, as in turn to turn or to ground in motor stators, then PDIV will decrease since the matching voltage equating peak field and PDIE is lower. This, however, is not expected to occur significantly in capacitive objects, as cables at power supply frequencies, including power electronics.
Table 1 reports model parameter estimates obtained in air and CO2, at SAP, based on model fitting to experimental surface PDIV results. The results related to CO2 were explicitly obtained from testing related to the MAAGIC project. Humidity, electrode shape and machining are the same in all tests (same electrodes, test in a climatic chamber, lab environment controlled). As can be seen from Table 1, the difference between parameter estimates in air is limited, which would result theoretically in small variation between discharge inception voltage characteristics at different pressures between the two gases (as shown in the next section).
Eventually, it is noteworthy that the experiments carried out by the test configuration of Figure 2 were always providing predominant surface discharge typology, as an output of PD measurement and analytics (identification). This was expected, considering that the test arrangement was devised specifically to infer surface insulation properties.

3.3. Example of Application of the Three-Leg Approach: Designing the Electrode Test Set

The three-leg approach can help to design the electrode profile and test cell in order to generate the wanted type of PD, e.g., gas or surface discharges. Referring to the electrode system of Figure 2, the generation of surface PD implies that the tangential electrical field on the insulation specimen surface gives rise to lower PDIV than that promoted by the orthogonal field component starting from the triple point (which triggers gas discharges); see Figure 2 (tangential and orthogonal fields are in l and h directions, respectively). Depending on electrode shape/contour profile, this can occur, or both surface and gas PD can incept together, or even gas discharge can incept at a lower voltage than internal.
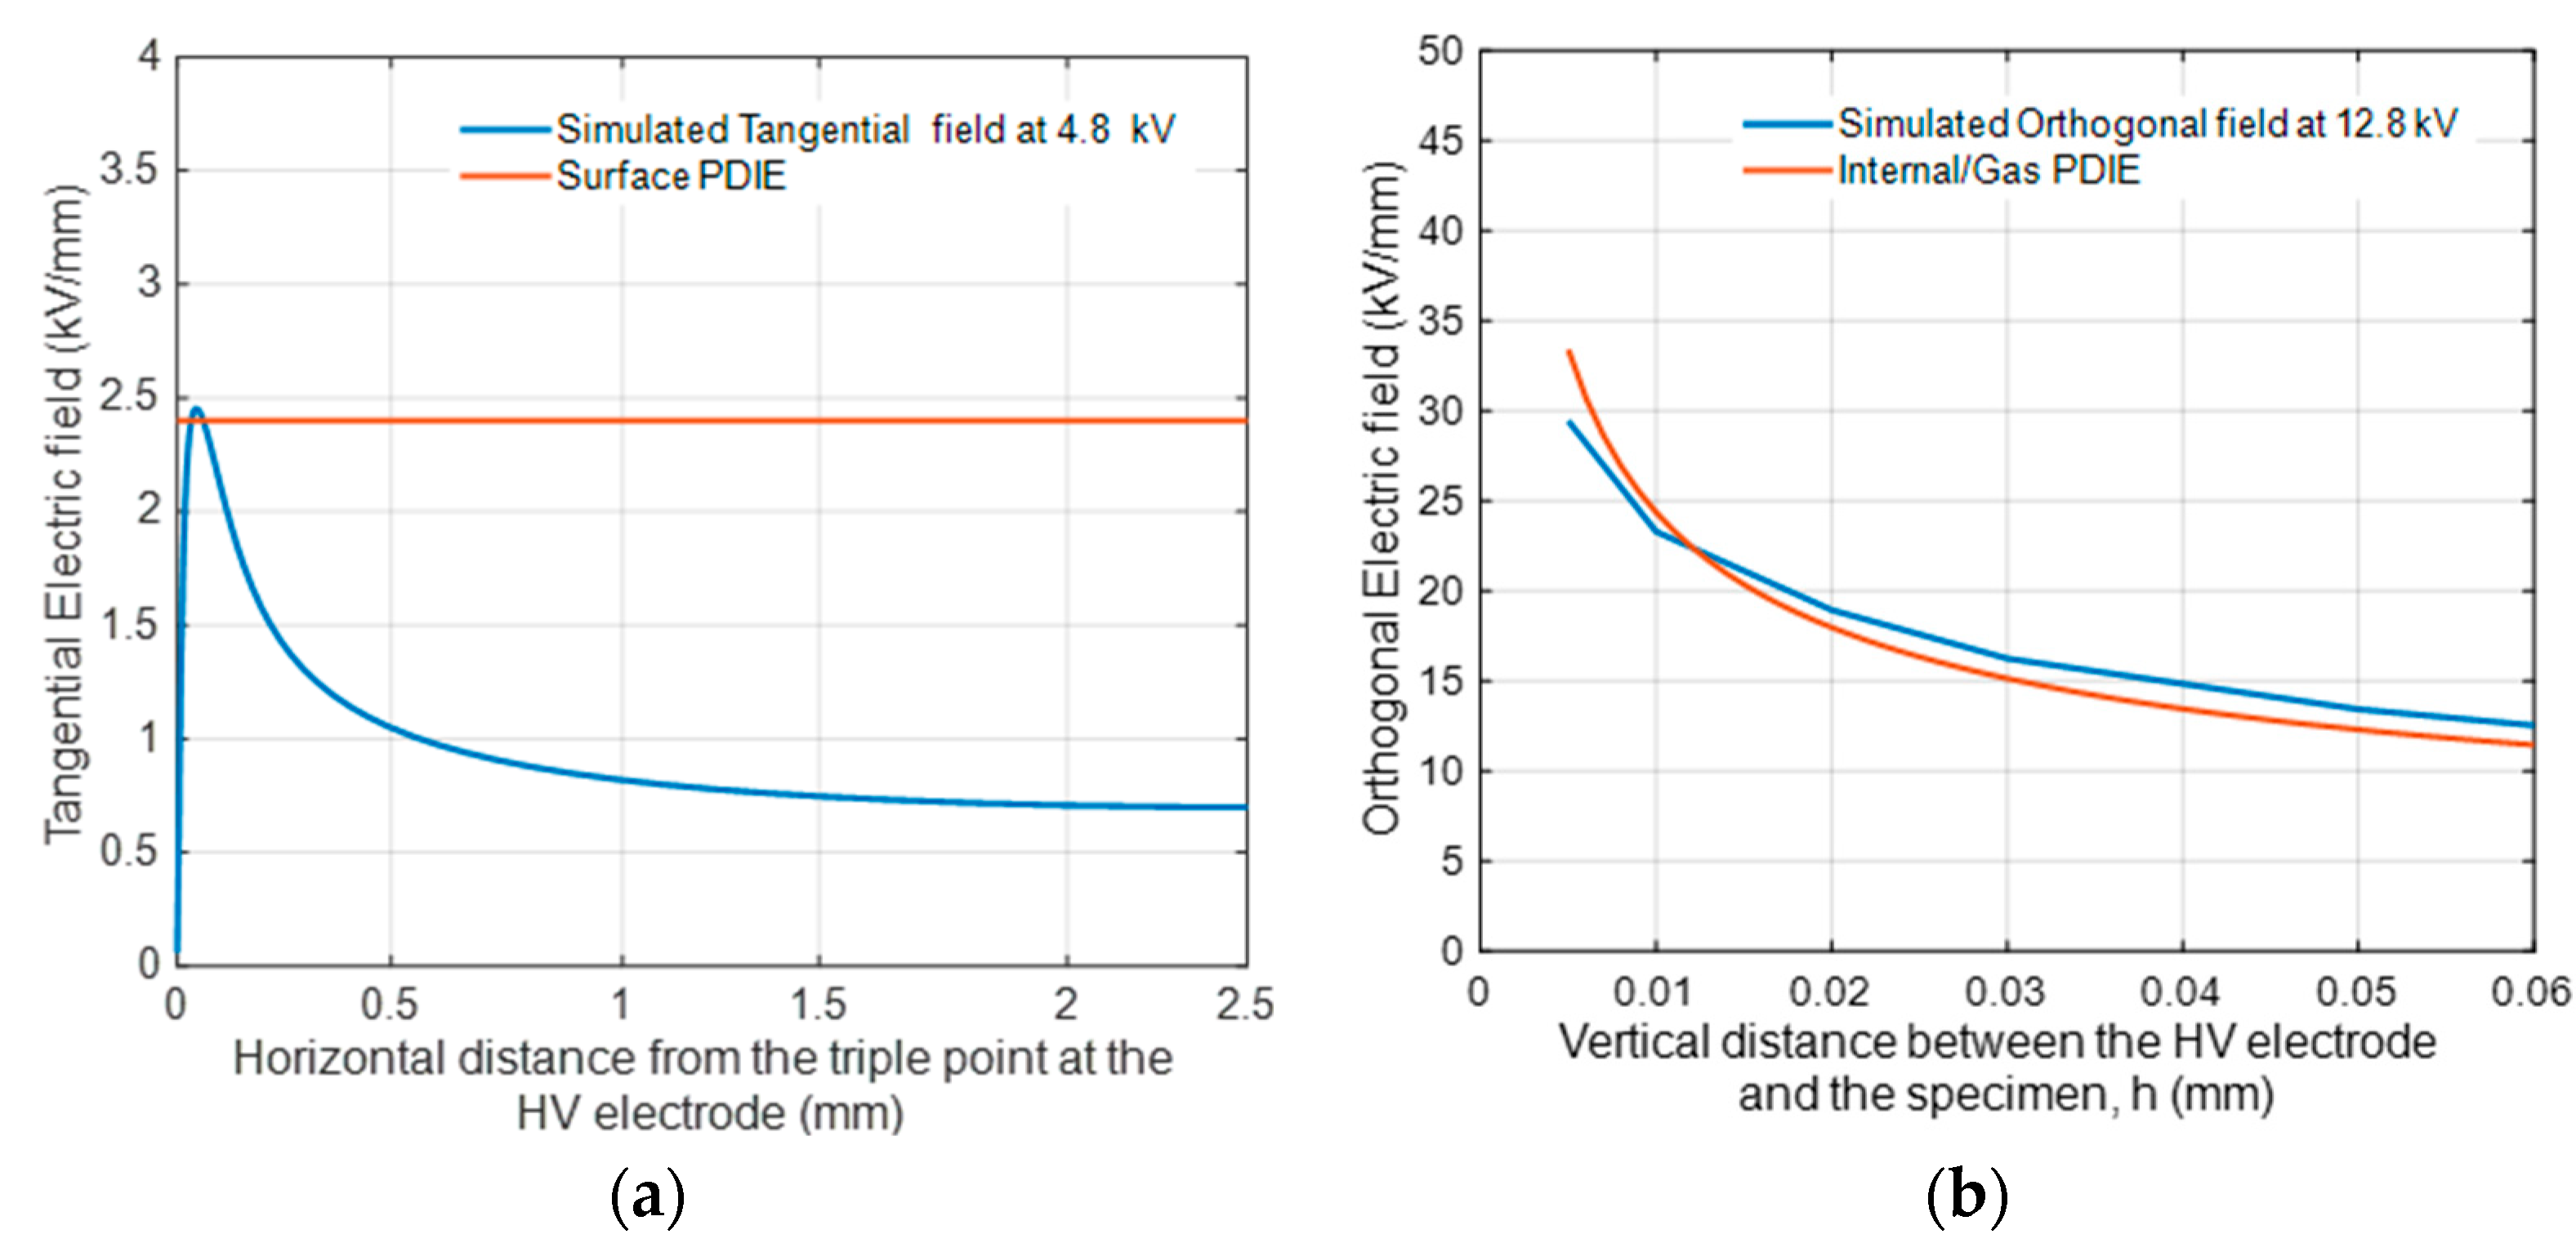
Legs 1 and 2 can be applied for this purpose. Having calculated the electric field profile, the intersection of its maximum value EP (actually, KEP), with the PD inception field model estimate will provide the PDIE, and that voltage at which this occurs is PDIV. As shown in Figure 6a,b, even if the orthogonal field has larger peak value than the surface one (20 μm far from the triple point), due to the different values involved in gas and surface discharge models (1), the PDIV for surface discharge, i.e., 4.8 kV, is lower than that for internal discharges, 12.8 kV, as wanted. Validation through PD measurements performed by the innovative PD detection and analytics software provides measured values of PDIVsurface = 5.0 kV, thus very close to the estimated value. Also, identification provides a likelihood of 1 (i.e., certainty) of surface discharge as PD typology.

4. Experimental Results and Model Fitting

Electric field calculations on Alumina and FR4, in air and CO2, using the test electrode configuration shown in Figure 2, were carried out by COMSOL for an excitation voltage of 1 kV, AC sinusoidal 60 Hz (the field profiles do not change increasing the frequency; thus, they would hold also for PWM modulation waveform, at least for non-extreme slew rates). The mesh used for electric field calculation is a user-controlled mesh, which is refined and is smaller near the electrodes in order to obtain an accurate representation of the simulated electric field profile. A minimum element size of 1 µm was considered to avoid interface spikes/instability. Material permittivity was taken from measurements performed by a dielectric analyzer. The values of the maximum (peak) field, E p , s i m and ks, for Alumina and FR4 specimens, which are calculated from the simulated electric field profile, and (2), at a distance of 5, 7.5 and 10 mm between the electrodes, are reported in Table 2. E p , s i m and ks values were noticed to change slightly with the change in surrounding ambiance (air/CO2), due to the minimum difference in the relative permittivity values of CO2 and air, i.e., 1.009 for the former.
PDIV measurements were performed on Alumina and FR4 specimens using the surface discharge electrode setup of Figure 2, with 5, 7.5 and 10 mm distances between electrodes, at SAP, pressures lower than SAP (0.5, 0.2 and 0.05 bar) and higher than SAP (1.5, 2 and 3 bar) in an air and CO2 environment. As mentioned, measurements were carried out in controlled humidity and using the same set of electrodes. Tests were stopped after PDIV was detected, avoiding insulation and surrounding gas degradation.
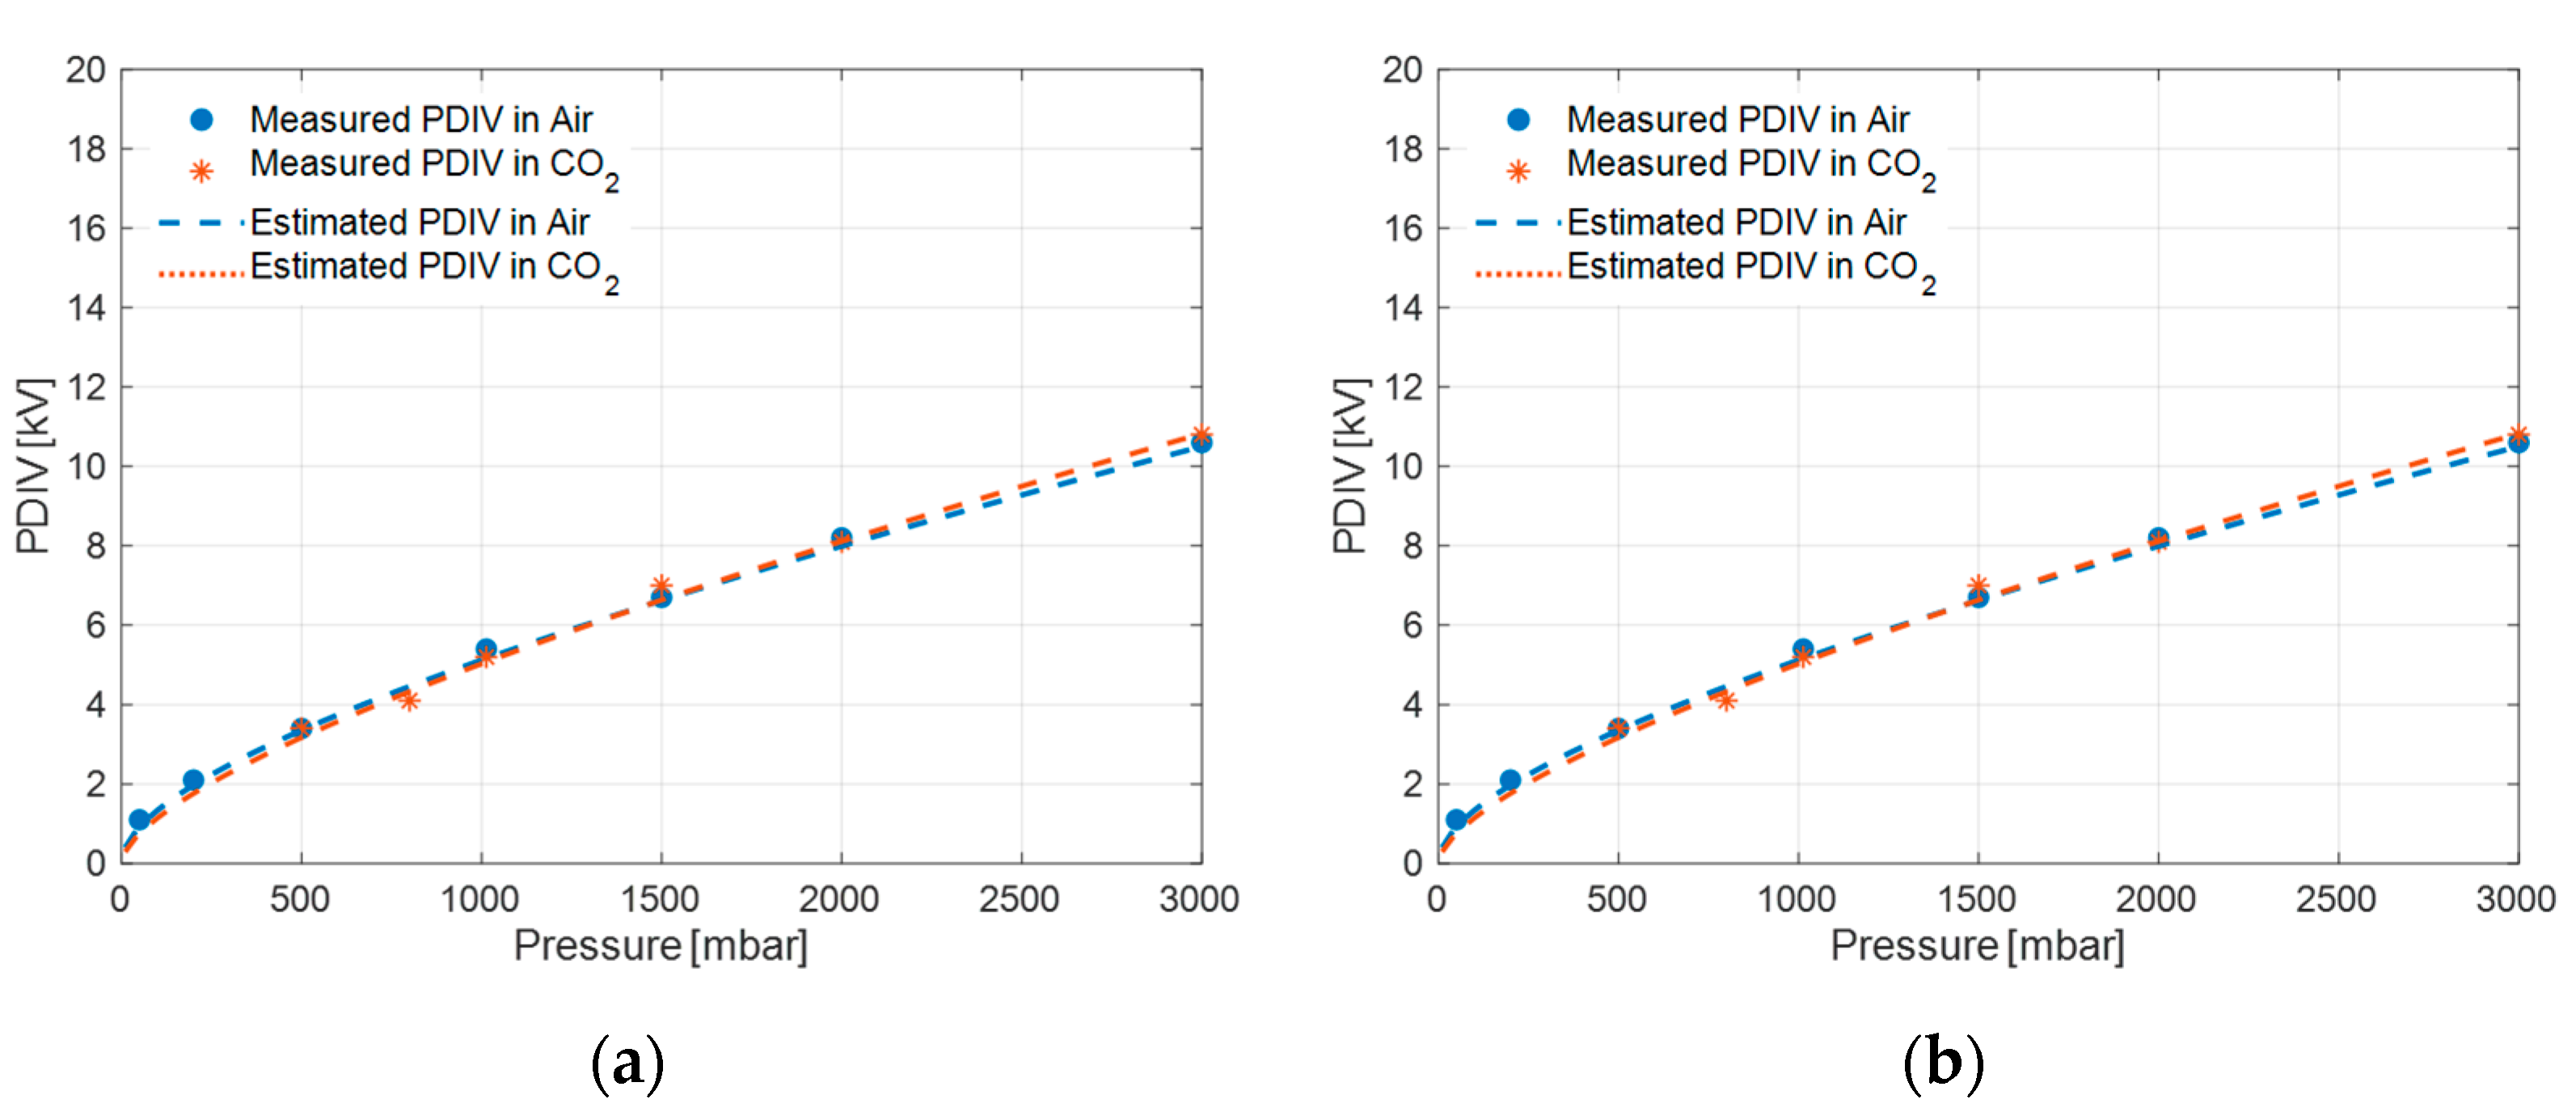
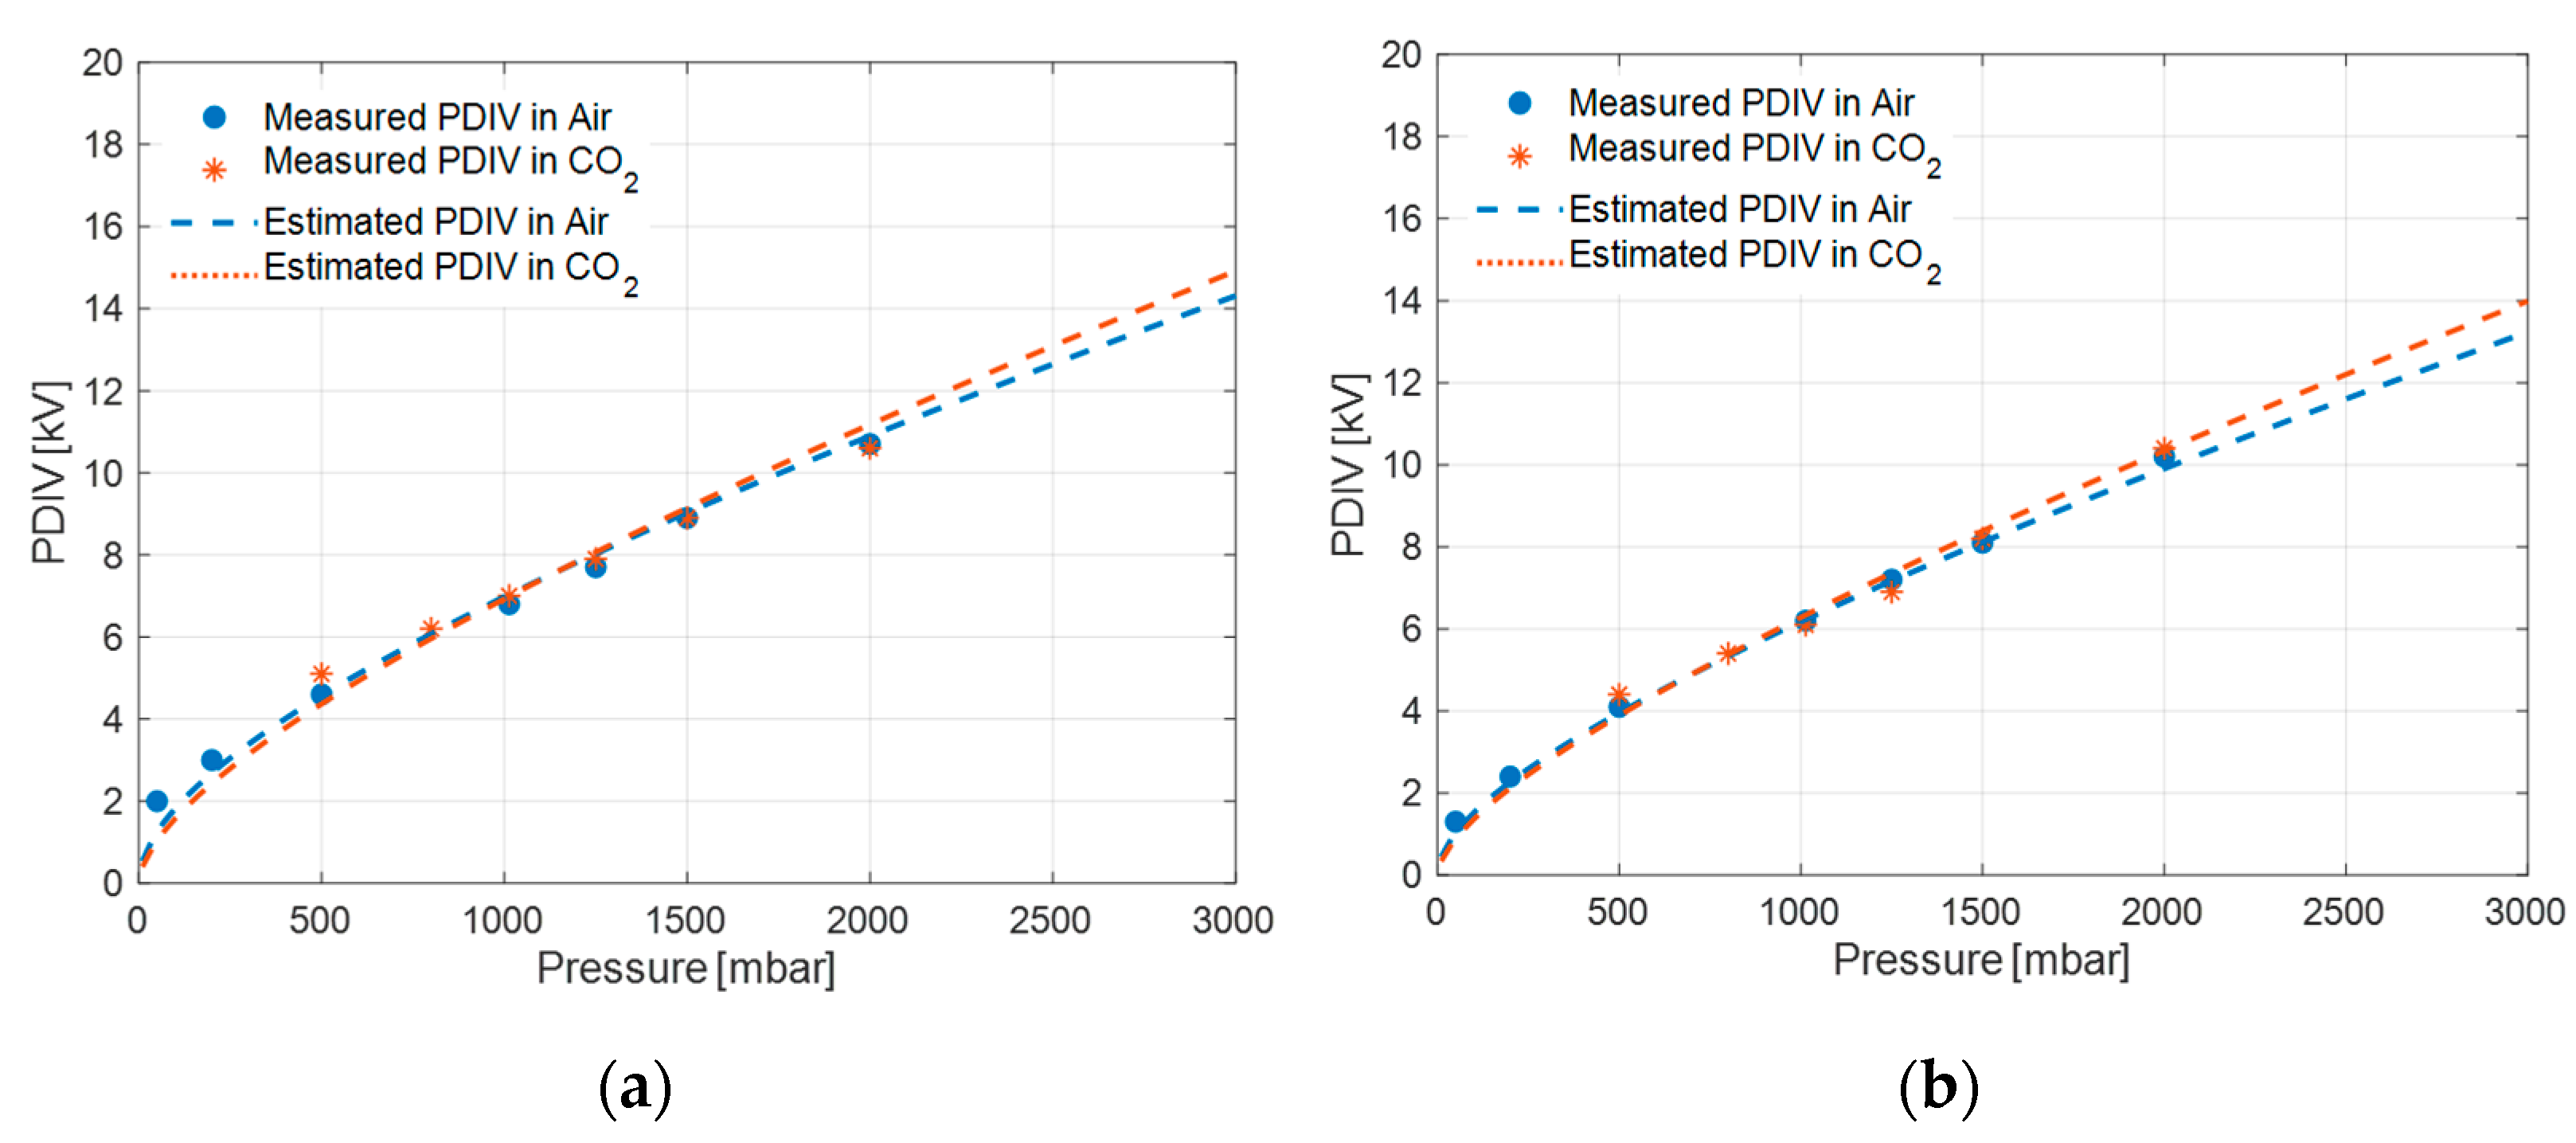
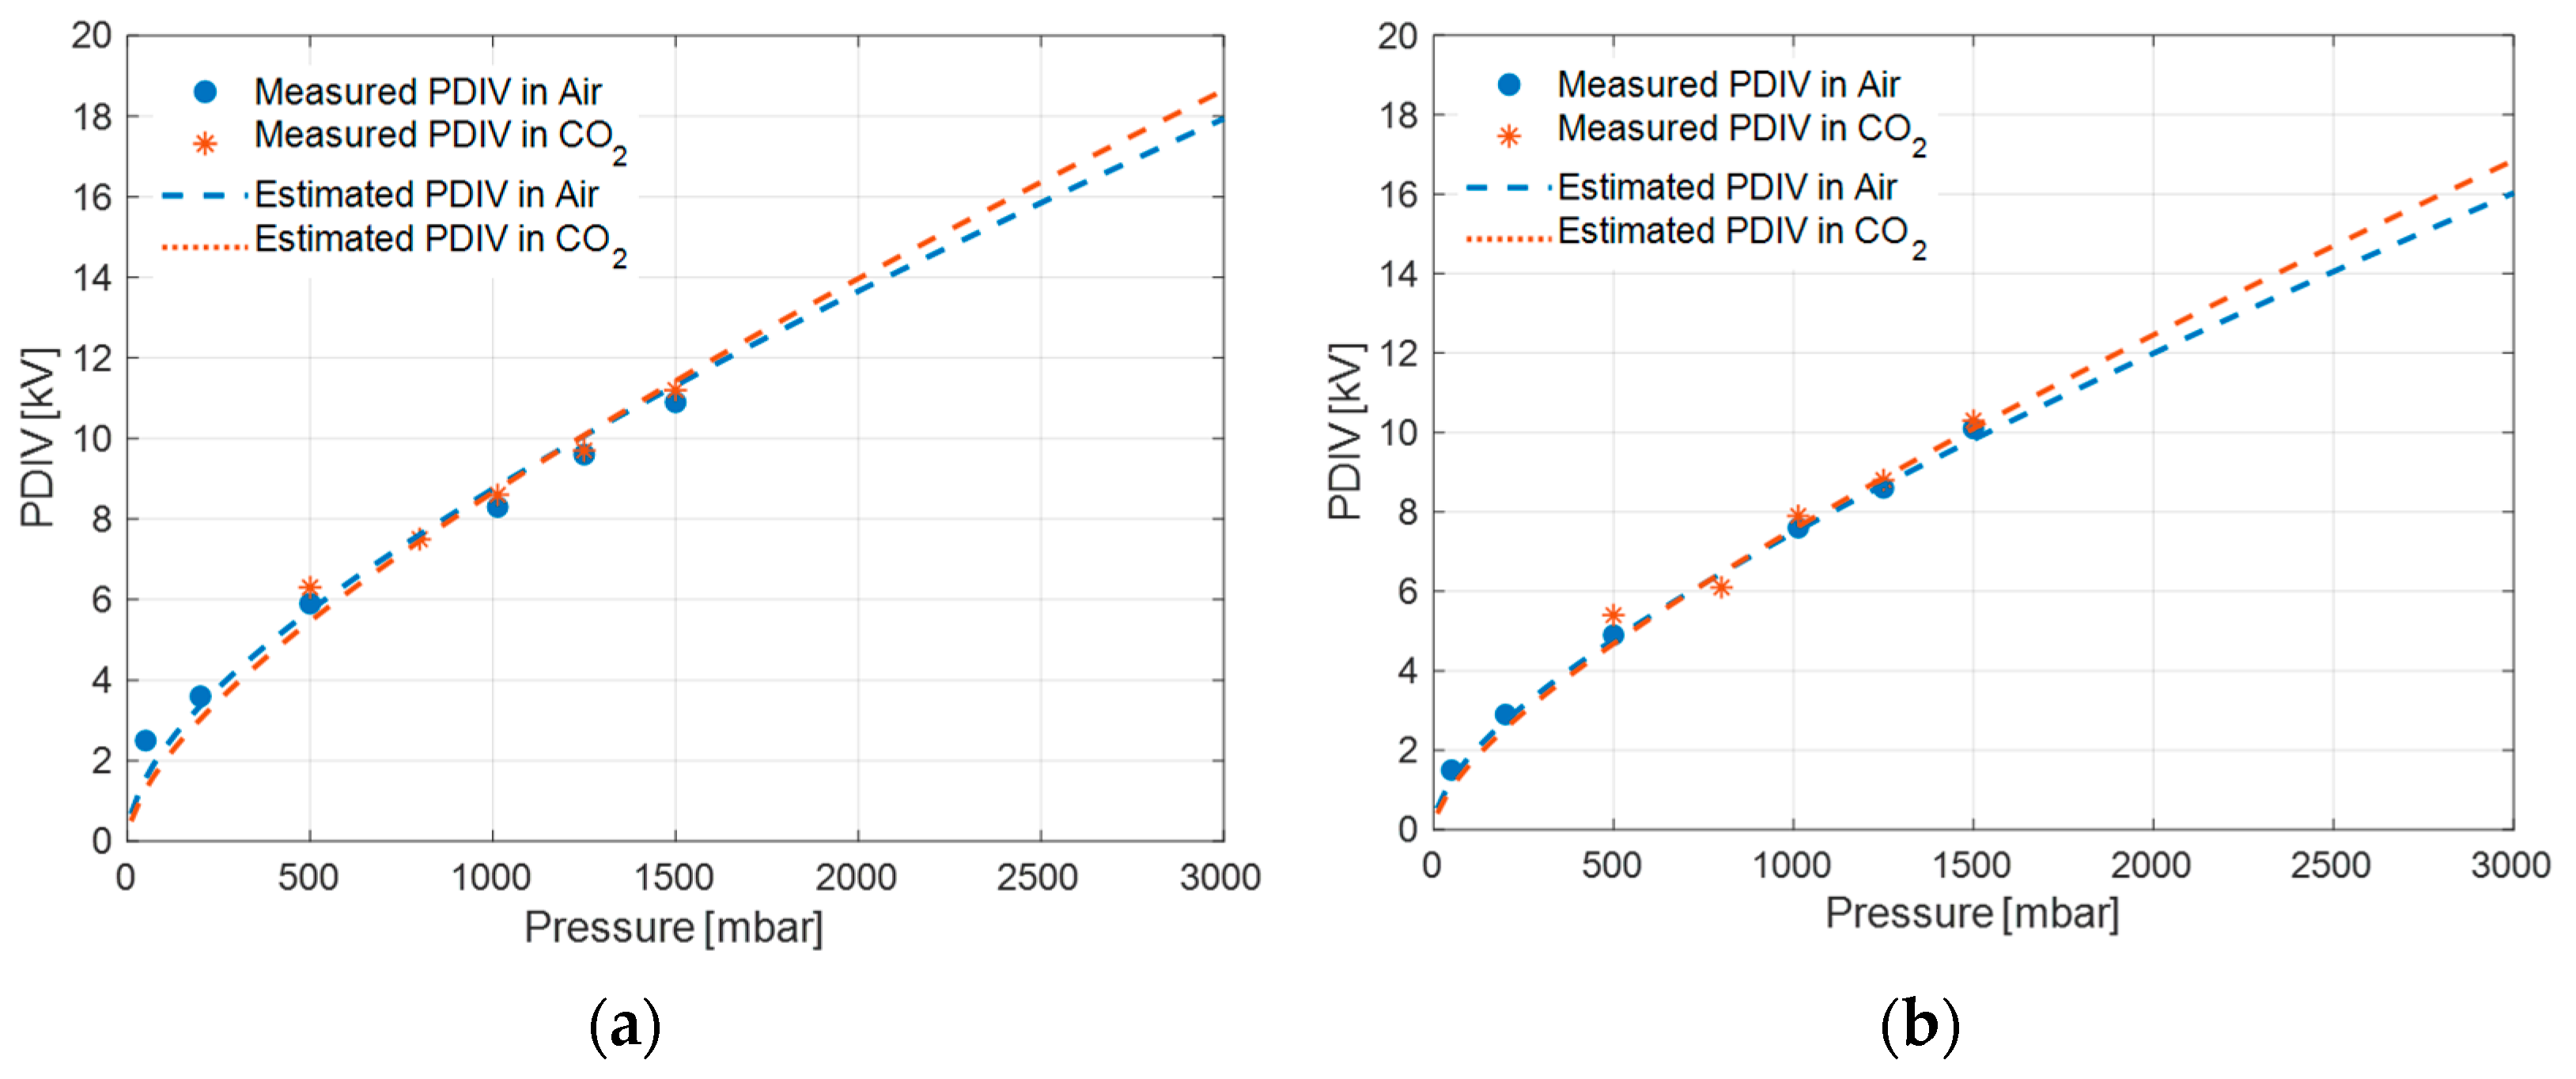
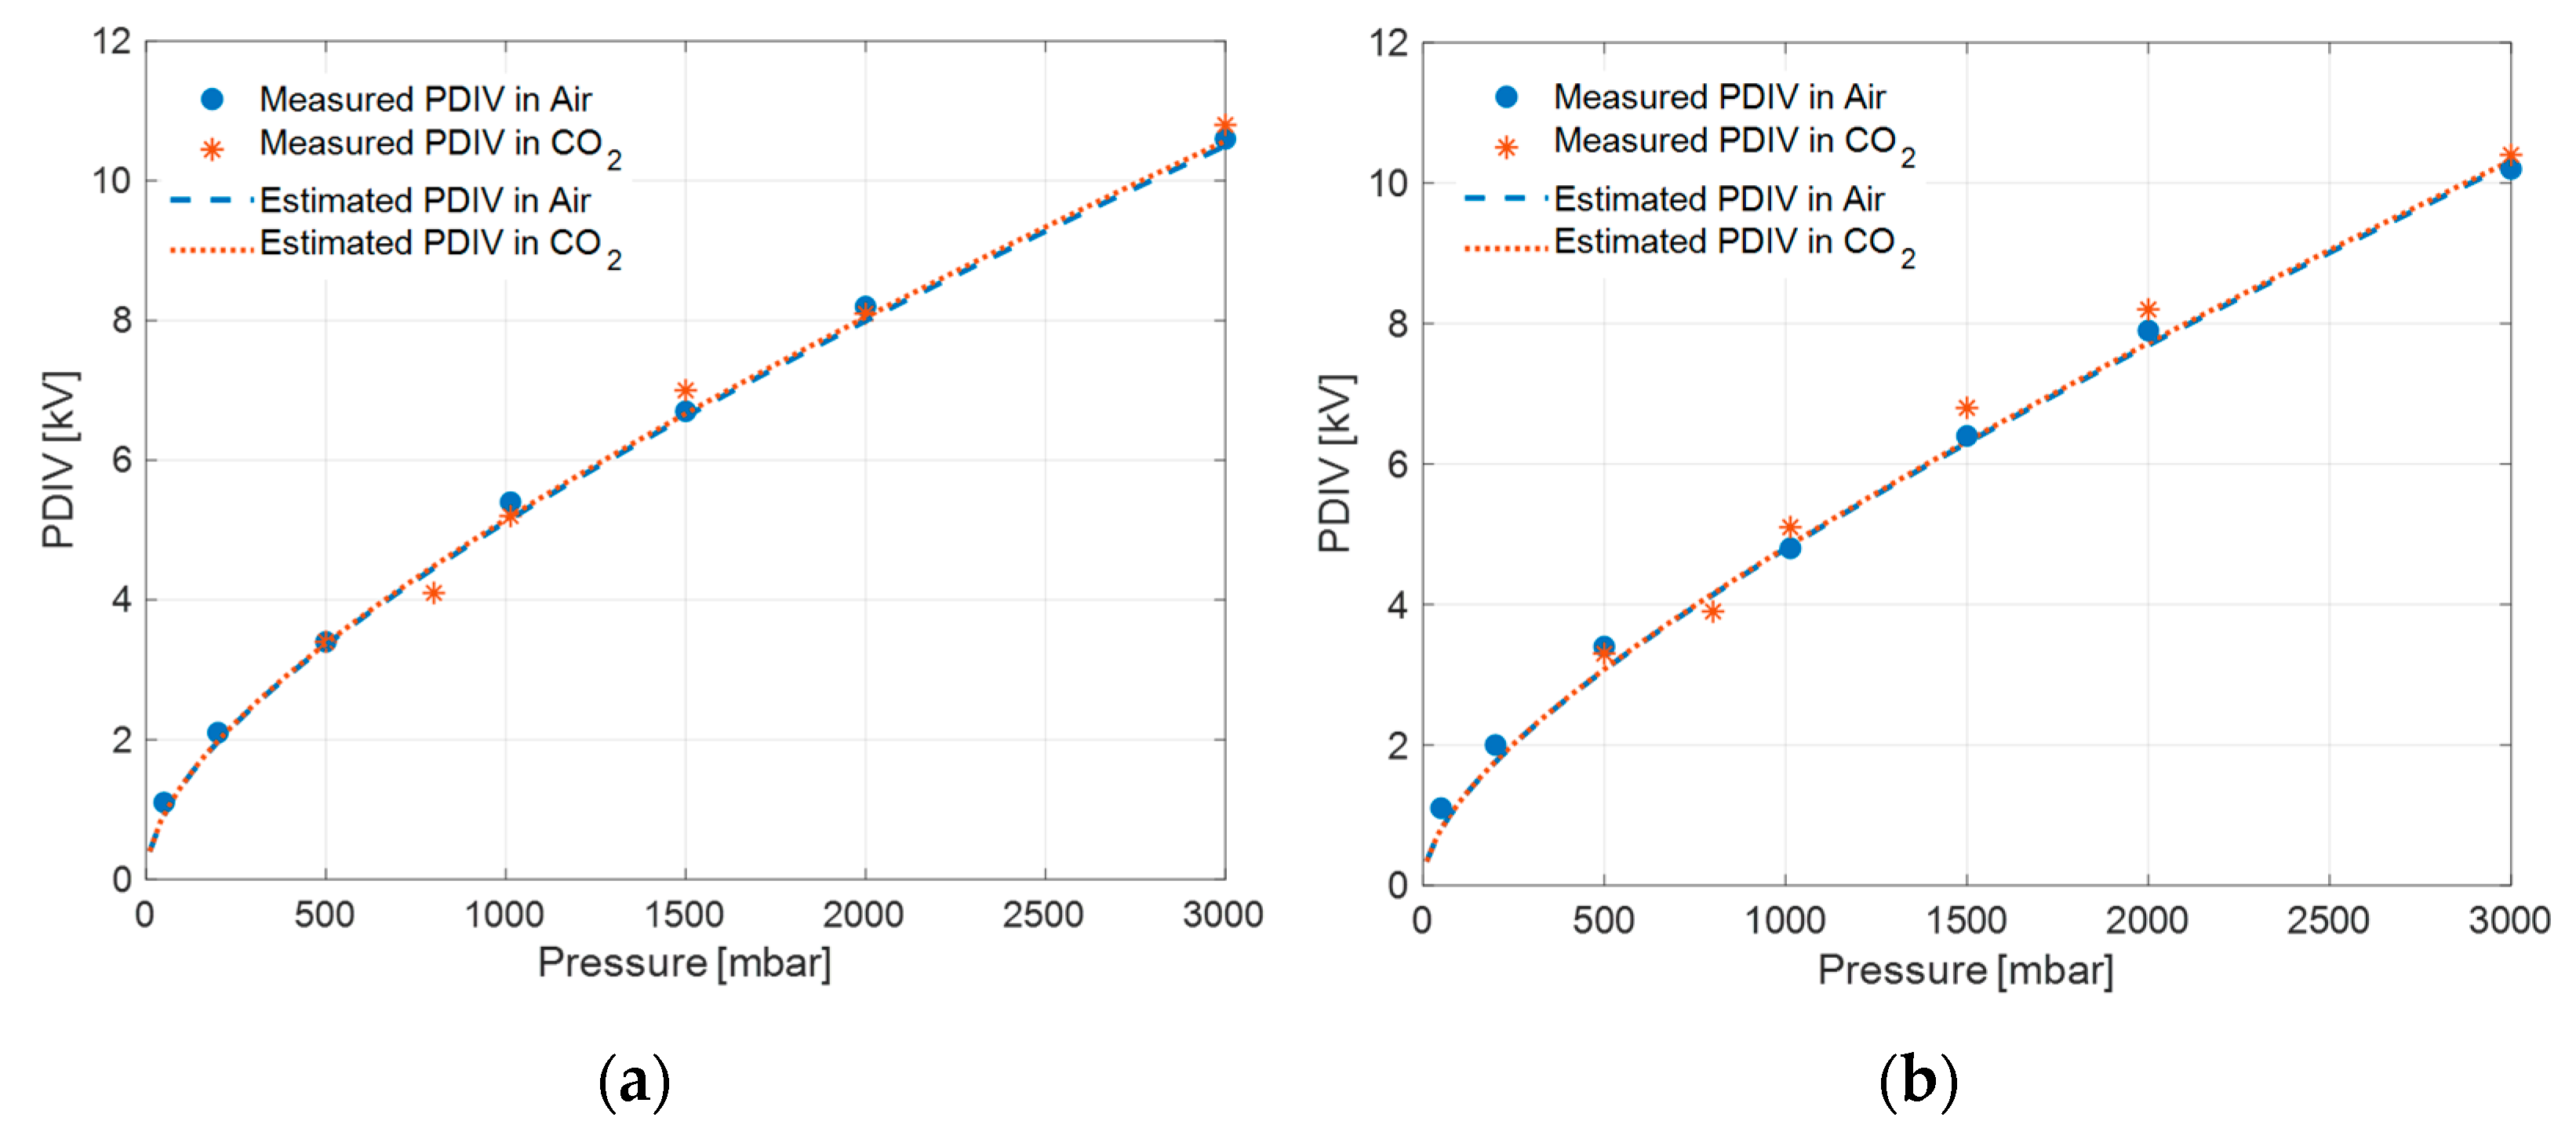
The measured and theoretical PDIV values (from model (1)) of Alumina and FR4 specimens, at a distance of 5, 7.5 and 10 mm between electrodes in air and CO2, at different pressures above and below SAP, are plotted in Figure 7, Figure 8 and Figure 9. The experimental points are fitted to the discharge model (1) in a broad range of pressure values, keeping model parameters constant, i.e., B = 4.0, β = 2.3 in CO2 and B = 4.3, β = 2.0 in air and (E/p)cr = 8.0 in both cases.
It can be seen from Figure 7, Figure 8 and Figure 9 that the theoretical values obtained from the surface discharge model (1) for Alumina and FR4 specimens, and the test cell of Figure 2, are in very good agreement with the experimental values for both a CO2 and an air environment, by considering slightly different values for model parameters B and β . However, a good fit is also observed using B = 4.3 and β = 2.0 for both environments, which are the values already estimated based on SAP measurements on different materials in air; see Figure 10. This latter observation fits to breakdown voltage measurements presented in the literature, e.g., [29], according to which breakdown voltage (BV) with divergent field does not change significantly from dry air to CO2, if not increasing electrode distance significantly. This indicates that the selection of CO2 is convenient mostly since the quality of the gas remains constant with time and aging, while air can become less pure and more humid, thus displaying unpredictable PDIV variation with operation time. Also, it seems that the performance of Alumina is marginally better when compared to FR4 (Figure 7, Figure 8 and Figure 9).
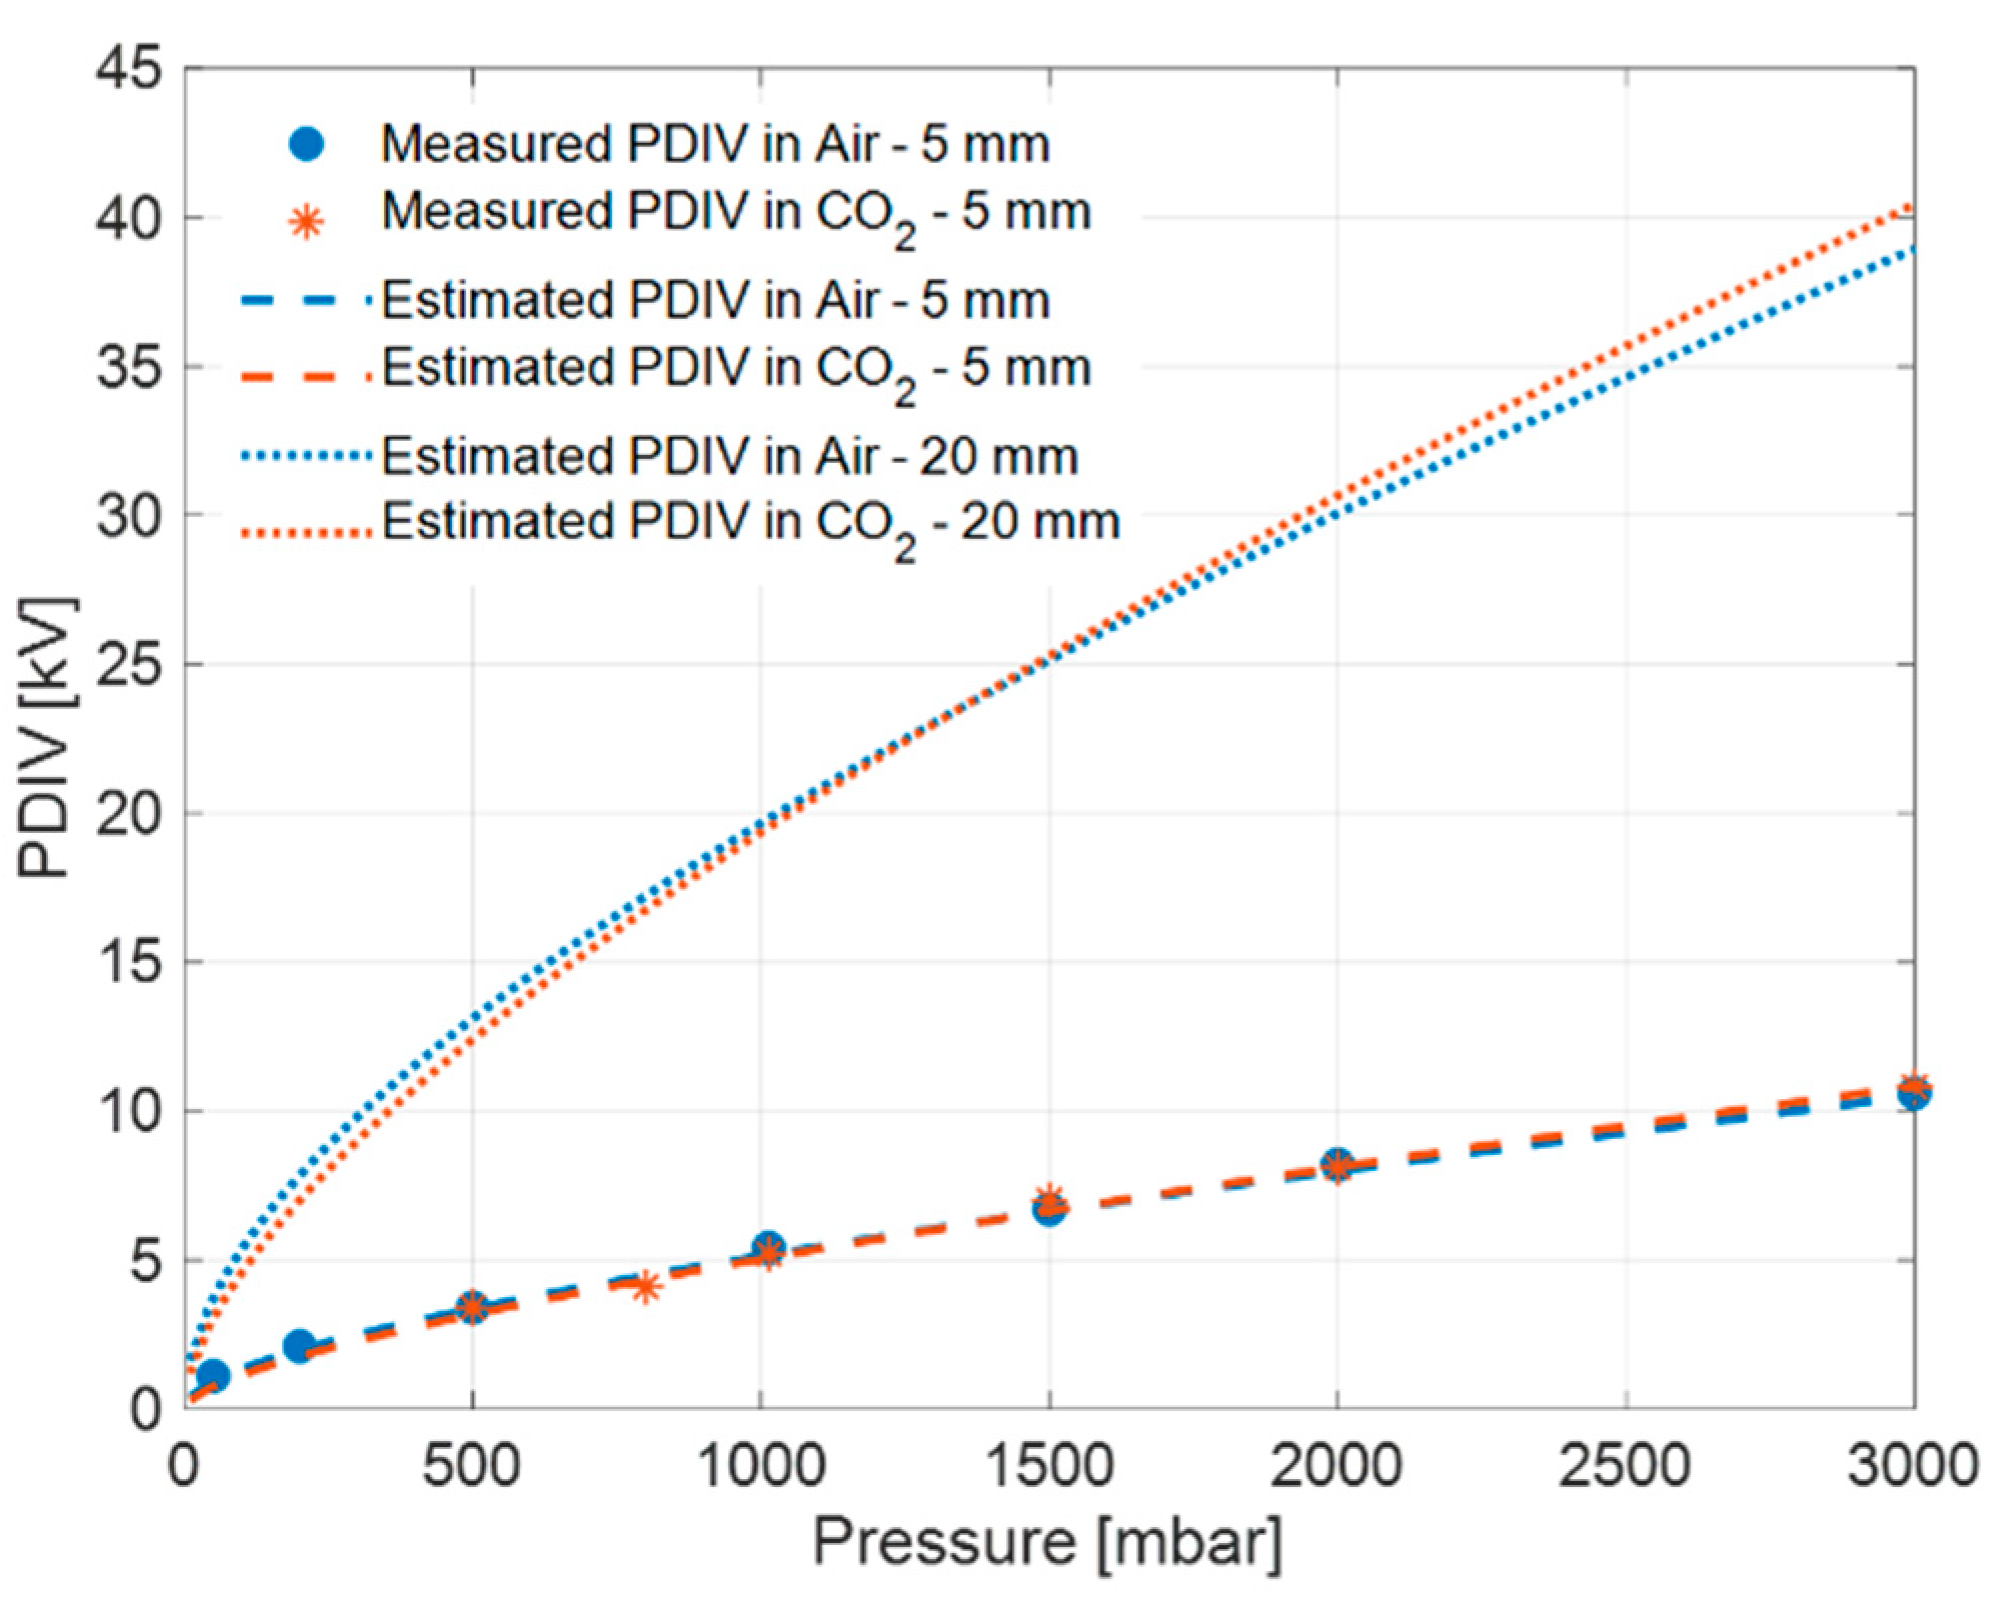
Applying the general inception model (1) to the distance of 20 mm, the curves in Figure 11 for CO2 and air are obtained. PDIV values almost coincide in air and CO2, and they are significantly larger than for 5 mm creepage.
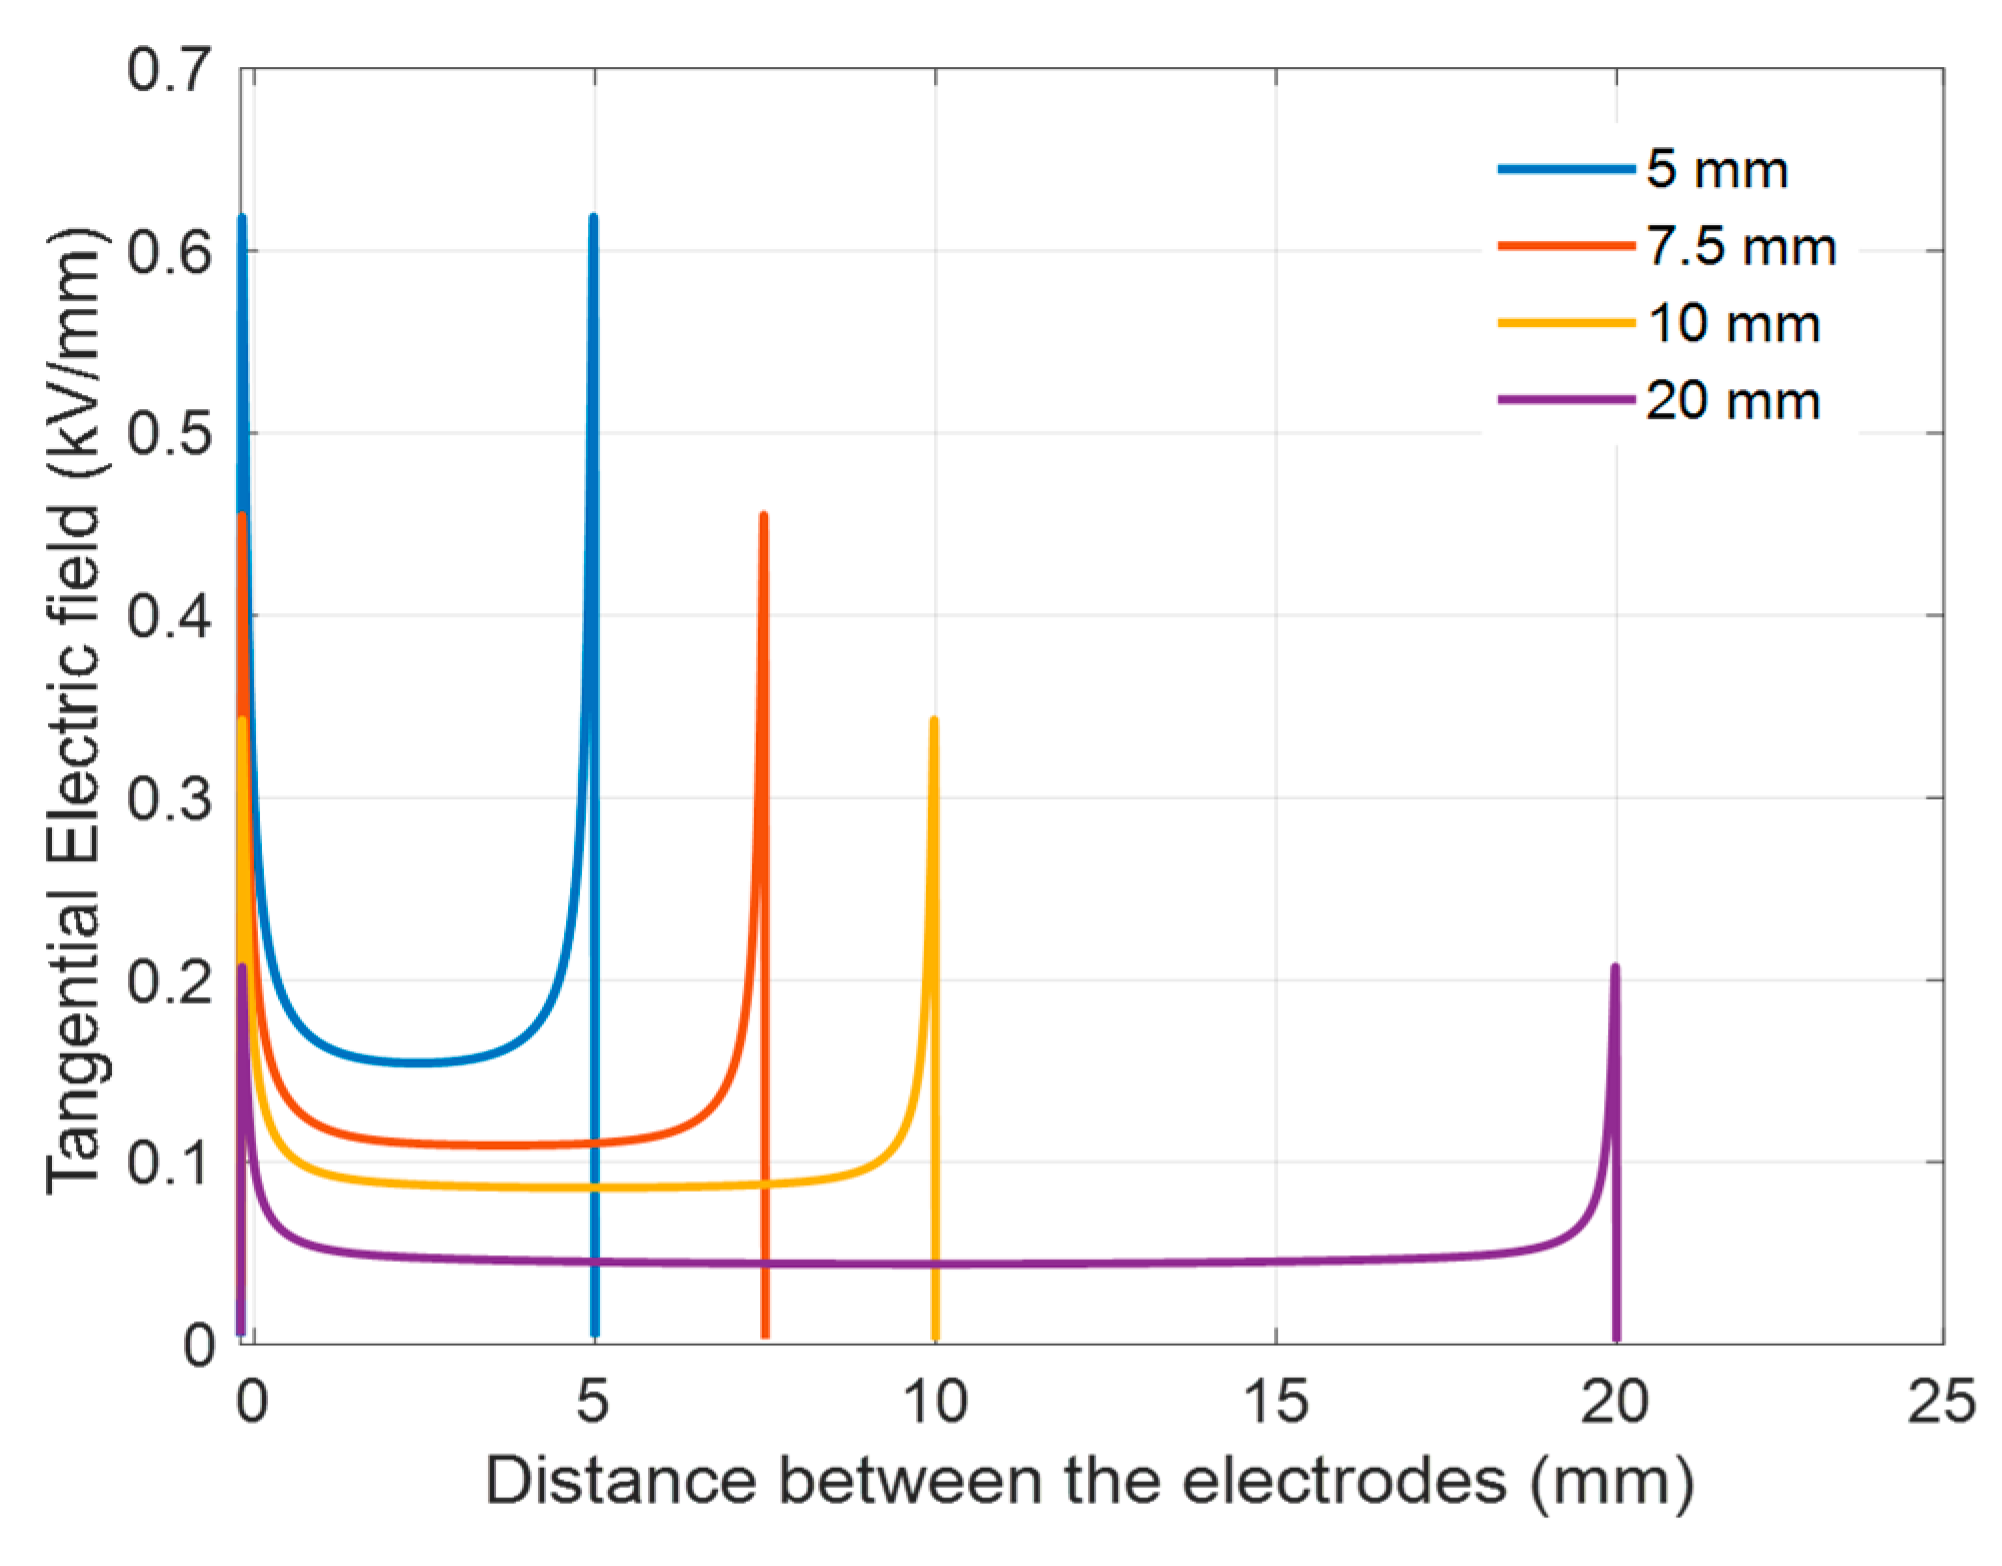
This result, i.e., larger surface PDIV with increasing creepage, seems to be obvious, but it is not. It has been shown [12] that PDIV increases with distance only when the electrical field profile is not too divergent, so that the maximum (peak) field decreases significantly when the distance between electrodes increases. Indeed, Figure 12, which reports the electric field simulations with different creepage distances considering the HV electrode of Figure 2, highlights that the peak field at triple points decreases noticeably increasing the creepage distance, d. As regards PD inception, model (1) provides Ei values having little variation, in spite of increasing d, since ks keeps a very low value (thus, the product ksd at the denominator of (1) is almost constant). Hence, the increase in PDIV is due mostly to the decrease in peak electric field. On the contrary, as shown in [11], if the field distribution is highly divergent so that the peak value does not change with distance, the PDIV becomes almost insensitive to the distance between electrodes.
These considerations highlight that the concept of designing an insulation system according to creepage and clearance may be questionable when, as for electrified transportation applications, significant electric field gradients occur on the insulation surface. If the electric field peak does not vary greatly with distance and Ei is almost constant, increasing the distance of the HV electrode to ground does not actually raise the PDIV. Other solutions, as changing electrode/contact shape, should be pursued for this purpose, thus allowing an insulation system to operate at a nominal voltage lower than PDIV (PD-free design).

5. Conclusions

The approach proposed in this paper would make it possible to predict the PDIV at variable pressure in insulation systems involving solid and gas insulation, at least referring to air and CO2. In particular, focus here is on the design of surface insulation sub-systems, relevant to gas-insulated cable spacers and connectors. Applying the first two legs of the three-leg approach, spacers of different geometry and shape can be designed as PD-free at any altitude of interest, choosing the best solution for each candidate material. Other gases and solid insulating materials can be investigated, checking the validity of the model parameter values used here (and for several other materials).
Such a modeling and simulation framework would work to carry out PD-free insulation system designs in electrified aircraft/aerospace electrical and electronic assets, which can be validated by PD tests performed at SAP (or any other pressure). Having the possibility to predict PDIV variation with pressure at the design stage would drastically increase the safety and reliability of asset components, as well as reduce design and testing costs. However, the objective of making available smart, automatic PD monitoring systems to be installed in aircraft and aerospace assets shall not be forgotten, since the extent of aging could not be fully predictable at the design stage (due, e.g., to modification of asset layout, type and intensity of stresses or use of inaccurate life models for insulation system design).
It has also been shown that a PD-free design cannot simply rely upon concepts that, as creepage and clearance, are based on the risk of destructive discharges (flashover). It must be pointed out, indeed, that already the inception of PD is prejudicial for equipment and related asset reliability (without having to consider destructive macroscopic surface processes).
Eventually, it is noteworthy that this model-based design approach is completely scalable; thus, once the design parameters (materials, voltage waveform and amplitude) have been defined, it can be applied to any type of insulation system dimension and configuration.
The work to be completed is still significant, including model behavior varying temperature and humidity, and different voltage waveforms, especially DC, where the electric field distribution is driven by conductivity (temperature and field dependent). It can also be speculated that considering gases with higher attachment coefficients might require experiments to re-estimate model parameter values. This does not affect, however, model validity and use.
Author Contributions

Conceptualization, G.C.M.; methodology, G.C.M., S.B.M. and M.S.; software, S.B.M.; validation, G.C.M., S.B.M., M.S., K.Y. and H.X.; formal analysis, G.C.M., S.B.M. and M.S.; investigation, G.C.M., S.B.M. and M.S.; resources, G.C.M., K.Y. and H.X.; data curation, S.B.M. and M.S.; writing—original draft preparation, G.C.M. and S.B.M.; writing—review and editing, G.C.M., S.B.M., M.S., K.Y. and H.X.; visualization, S.B.M., M.S., K.Y. and H.X.; supervision, G.C.M.; project administration, G.C.M., M.S., K.Y. and H.X.; funding acquisition, G.C.M., K.Y. and H.X. All authors have read and agreed to the published version of the manuscript.

Funding

This work was supported by the U.S. Department of Energy (DOE) under Contract No. ZGJ-9-92284 to FSU from funding provided by the U.S. Department of Energy Office of Energy Efficiency and Renewable Energy, Advanced Manufacturing Office, through prime contract No. DE-AC36-08GO28308.

Data Availability Statement

The original contributions presented in the study are included in the article, and further inquiries can be directed to the corresponding authors.

Conflicts of Interest

Authors K.Y. and H.X. were employed by the company GE Research. The remaining authors declare that the research was conducted in the absence of any commercial or financial relationships that could be construed as potential conflicts of interest.

Abbreviations

The following abbreviations are used in this manuscript:
ARPA-EAdvanced Research Projects Agency-Energy
ASCENDAviation-class Synergistically Cooled Electric-motors with Integrated Drives
CABLESConnecting Aviation By Lighter Electrical Systems
GILGas-Insulated Line
HFCTHigh-Frequency Current Transformer
HVHigh Voltage
HVDCHigh-Voltage Direct Current
LBBLaminated Busbar
LVLow Voltage
PCBPrinted Circuit Board
PDPartial Discharge
PDIVPartial Discharge Inception Voltage
PWMPulse Width Modulation
RPDIVRepetitive Partial Discharge Inception Voltage
SAPStandard Atmospheric Pressure

References

  1. Madonna, V.; Giangrande, P.; Galea, M. Electrical power generation in aircraft: Review, challenges, and opportunities. IEEE Trans. Transp. Electrif. 2018, 4, 646–659. [Google Scholar] [CrossRef]
  2. Lizcano, M.; Williams, T.S.; Shin, E.; Santiago, D.; Nguyen, B. Aerospace environmental challenges for electrical insulation and recent developments for electrified aircraft. Materials 2022, 15, 8121. [Google Scholar] [CrossRef]
  3. Buticchi, G.; Wheeler, P.; Boroyevich, D. The more-electric aircraft and beyond. Proc. IEEE 2022, 111, 356–370. [Google Scholar] [CrossRef]
  4. Eco, U. The Name of the Rose; Bernd Eichinger/Bernd Schaefers Prod.; Bompiani: Milan, Italy, 1980. [Google Scholar]
  5. IEC 60505; Evaluation and Qualification of Electrical Insulation Systems. IEC Technical Committee: Geneva, Switzerland, 2011.
  6. IEC 60270; High-Voltage Test Techniques—Partial Discharge Measurements. IEC Technical Committee: Geneva, Switzerland, 2015.
  7. Kreuger, F.H. Partial Discharge Detection in High-Voltage Equipment; Butterworth-Heinemann: London, UK, 1990. [Google Scholar]
  8. Available online: https://arpa-e.energy.gov/programs-and-initiatives/search-all-projects/megawatt-any-altitude-gas-insulated-cable-system-aircraft-power-distribution-maagic (accessed on 1 September 2024).
  9. Yin, W.; Younsi, K.; Ndiaye, I. Electric Component for an Electric System. U.S. Filed Patent US20230046156A1, October 2023. [Google Scholar]
  10. Myneni, S.B.; Shafiq, M.; Montanari, G.C.; Younsi, K.; Han, X. Validation of a Surface Partial Discharge Inception Model for Insulating Materials in Air and CO2 at Sea Level and Altitude Environments. In Proceedings of the AIAA AVIATION Forum and ASCEND 2024, Las Vegas, NV, USA, 28 July–2 August 2024; p. 3956. [Google Scholar]
  11. Montanari, G.C.; Nath, D.; Cambarieri, P. A new approach to the design of surface subsystems of polymeric insulators for HV and MV apparatus under AC voltage. High Volt. 2023, 8, 651–658. [Google Scholar] [CrossRef]
  12. Montanari, G.C.; Schwartz, S.; Cuzner, R.; Kolesar, S. Innovative Design of Laminated bus Bars for Electrical ships: Three-Leg Approach. In Proceedings of the IEEE Electric Ship Technology Symposium, Old Town Alexandria, VA, USA, 1–4 August 2023. [Google Scholar]
  13. Cambarieri, P.; Montanari, G.C. Derivation of a Surface Discharge Model for the Design of the Surface Components of Insulation Systems used in Industrial Electronics Environments. IEEE J. Emerg. Sel. Top. Ind. Electron. 2023, 4, 698–706. [Google Scholar] [CrossRef]
  14. Cambarieri, P.; Montanari, G.C. A Surface Discharge Model for Partial Discharges Under DC Stress. IEEE J. Emerg. Sel. Top. Ind. Electron. 2024, 5, 1314–1321. [Google Scholar] [CrossRef]
  15. Montanari, G.C.; Myneni, S.B.; Shafiq, M.; Chen, Z. A New Approach to Account for the Risk of Partial Discharge Inception in the Design of Insulation Systems Fed by Power Electronics Waveforms. In Proceedings of the IEEE Transportation Electrification Conference and Expo, Anaheim, CA, USA, 18–20 June 2025; pp. 1–6. [Google Scholar]
  16. Rui, R.; Cotton, I. Impact of low-pressure aerospace environment on machine winding insulation. In Proceedings of the IEEE International Symposium on Electrical Insulation, San Diego, CA, USA, 6–9 June 2010; pp. 1–5. [Google Scholar]
  17. Rumi, A.; Marinelli, J.; Barater, D.; Cavallini, A.; Seri, P. The Challenges of Reliable Dielectrics in Modern Aerospace Applications: The Hazard of Corona Resistant Materials. IEEE Trans. Transp. Electrif. 2022, 8, 4646–4653. [Google Scholar] [CrossRef]
  18. Jiang, J.; Zhang, B.; Li, Z.; Zhang, C.; Ranjan, P.; Zhang, X. Partial discharge investigation under low air pressure and variable frequency for more-electric-aircraft. IEEE Trans. Dielectr. Electr. Insul. 2021, 28, 1793–1801. [Google Scholar] [CrossRef]
  19. Schumann, W.O. Über das Minimum der Durchbruchfeldstärke bei Kugelelektroden. Arch. Elektrotech. 1923, 12, 593–608. [Google Scholar] [CrossRef]
  20. Lusuardi, L.; Cavallini, A.; de la Calle, M.G.; Martínez-Tarifa, J.M.; Robles, G. Insulation design of low voltage electrical motors fed by PWM inverters. IEEE Electr. Insul. Mag. 2019, 35, 7–15. [Google Scholar] [CrossRef]
  21. Lusuardi, L.; Rumi, A.; Cavallini, A.; Barater, D.; Nuzzo, S. Partial discharge phenomena in electrical machines for the more electrical aircraft. Part II: Impact of reduced pressures and wide bandgap devices. IEEE Access 2021, 9, 27485–27495. [Google Scholar] [CrossRef]
  22. Borghei, M.; Ghassemi, M. Insulation materials and systems for more-and all-electric aircraft: A review identifying challenges and future research needs. IEEE Trans. Transp. Electrif. 2021, 7, 1930–1953. [Google Scholar] [CrossRef]
  23. Niemeyer, L. A generalized approach to partial discharge modeling. IEEE Trans. Dielectr. Electr. Insul. 1995, 2, 510–528. [Google Scholar] [CrossRef]
  24. Nijdam, S.; Teunissenc, J.; Ebert, U. The physics of streamer discharge phenomena. Plasma Sources Sci. Technol. 2020, 29, 103001. [Google Scholar] [CrossRef]
  25. Niemeyer, L.; Ullrich, L.; Wiegart, N. The mechanism of leader breakdown in electronegative gases. IEEE Trans. Dielectr. Electr. Insul. 1989, 24, 309–324. [Google Scholar] [CrossRef]
  26. Occhini, E. A statistical approach to the discussion of the dielectric strength in electric cables. IEEE Trans. Power Appar. Syst. 1971, 90, 2671–2682. [Google Scholar] [CrossRef]
  27. Montanari, G.C.; Shafiq, M.; Chen, Z. A Discussion on the Dependence of Partial Discharge Inception Voltage on Supply Voltage Waveform: Sinusoidal and modulated AC. In Proceedings of the 2024 IEEE Electrical Insulation Conference (EIC), Minneapolis, MN, USA, 2–5 June 2024; pp. 392–396. [Google Scholar]
  28. Montanari, G.C.; Hebner, R.; Seri, P.; Ghosh, R. Self-assessment of health conditions of electrical assets and grid components: A contribution to smart grids. IEEE Trans. Smart Grid 2020, 12, 1206–1214. [Google Scholar] [CrossRef]
  29. Onal, E. Breakdown characteristics of gases in non-uniform fields. J. Electr. Electron. Eng. 2004, 4, 1177–1182. [Google Scholar]
Figure 1. Overall design of the 30 m MAAGIC cable and connector system, with a photo of the cross-section of the cable and its prototype.
Energies 18 06225 g001
Figure 2. (a) Model of electrode setup and test specimen used in the present study, (b) the highlight of the electrode contour and (c) photo of the brass electrode (PA and PB are triple points of HV and ground electrode, respectively, and l is the distance between PA and PB).
Energies 18 06225 g002
Figure 3. Test electrode setup placed inside the pressure chamber with surface discharge electrodes and insulation specimen mounted on the test platform.
Energies 18 06225 g003
Figure 4. Scheme of the complete measurement setup, with the high-frequency current transformer (HFCT), the partial discharge analyzer (PDA) and the PC. The voltage divider provides the low-voltage AC phase reference signal to the PDA.
Energies 18 06225 g004
Figure 5. Examples of field distribution and profiles at the electrode contour. (a,b) are electrode contour, near triple point. (c,d) are the orthogonal field profiles when h = 0.01 mm. (e,f) are tangential electric field profiles from the triple point, PA. The maximum value (in kV/mm) is indicated.
Energies 18 06225 g005
Figure 6. Application of legs 1 (simulated tangential field by COMSOL) and 2 (PDIE model) to evaluate the PD inception voltage (PDIV) of the FR4 specimen with test electrodes separated by distance of 5 mm in CO2: (a) tangential field profile and discharge model characteristics at PDIVsurface = 4.8 kV, (b) orthogonal field profile and discharge model characteristics at PDIVinternal = 12.8 kV. Distances are referred to electrode profile of Figure 5a.
Energies 18 06225 g006
Figure 7. Comparison of theoretical and measured PDIV values of Alumina (a) and FR4 (b) specimens at a distance of 5 mm between electrodes in CO2 and air environment at different pressures lower and higher than SAP (by considering the parameters B and β of surface discharge model in CO2 and air environment as B = 4.0, β = 2.3 and B = 4.3, β = 2.0, respectively, and (E/p)cr = 8.0 in both cases).
Energies 18 06225 g007
Figure 8. Comparison of theoretical and measured PDIV values of Alumina (a) and FR4 (b) specimens at a distance of 7.5 mm between electrodes in CO2 and air environment at different pressures lower and higher than SAP (by considering the parameters B and β of surface discharge model in CO2 and air environment as B = 4.0, β = 2.3 and B = 4.3, β = 2.0, respectively, and (E/p)cr = 8.0 in both cases).
Energies 18 06225 g008
Figure 9. Comparison of theoretical and measured PDIV values of Alumina (a) and FR4 (b) specimens at a distance of 10 mm between electrodes in CO2 and air environment at different pressures lower and higher than SAP (by considering the parameters B and β of surface discharge model in CO2 and air environment as B = 4.0, β = 2.3 and B = 4.3, β = 2.0, respectively, and (E/p)cr = 8.0 in both cases).
Energies 18 06225 g009
Figure 10. Comparison of theoretical and measured PDIV values of Alumina (a) and FR4 (b) specimens at 5 mm between electrodes in CO2 and air environment at different pressures, lower and higher than SAP, by considering the same parameters B and β of the surface discharge model in CO2 and air environment, i.e., B = 4.3, β = 2.0.
Energies 18 06225 g010
Figure 11. PDIV behavior with pressure derived by model (1) with l = 20 mm (Figure 2). Comparison with the model and experimental data at l = 5 mm for Alumina.
Energies 18 06225 g011
Figure 12. Electric field profiles (at 1 kV sinusoidal AC) for the test object of Figure 2 with varying distance between HV electrode and ground, l, from 5 mm to 20 mm.
Energies 18 06225 g012
Table 1. For air and CO2, estimated by experiments at SAP.
Environment E / p c r B β k s
Air8.04.32.0<1
CO28.04.02.3<1
Table 2. Specimens, test object of Figure 2.
SpecimenDistanceAir EnvironmentCO2 Environment
E p , s i m  (kV/mm) k s E p , s i m  (kV/mm) k s
Alumina5 mm0.61800.00420.61500.0042
7.5 mm0.45490.00280.45400.0028
10 mm0.36230.00210.36100.0021
FR45 mm0.51300.00860.51120.0088
7.5 mm0.39890.00570.39680.0059
10 mm0.32960.00430.32840.0044
Disclaimer/Publisher’s Note: The statements, opinions and data contained in all publications are solely those of the individual author(s) and contributor(s) and not of MDPI and/or the editor(s). MDPI and/or the editor(s) disclaim responsibility for any injury to people or property resulting from any ideas, methods, instructions or products referred to in the content.