Article

Sustainable Valorization of Forest Waste Hydrolysis Residues to Solid Biofuel: Insights into Conversion Mechanisms and Fuel Properties

by
Mohit Kumar
1,
Robert Cheatham
2,
Md Shahadat Hossain
1,
Toufiq Reza
2,
Timothy A. Volk
3,
Ankita Juneja
1,* and
Deepak Kumar
1,*
1
Department of Chemical Engineering, SUNY College of Environmental Science and Forestry, Syracuse, NY 13210, USA
2
Department of Chemistry and Chemical Engineering, Florida Institute of Technology, Melbourne, FL 32901, USA
3
Department of Sustainable Resources Management, SUNY College of Environmental Science and Forestry, Syracuse, NY 13210, USA
*
Authors to whom correspondence should be addressed.
Energies 2025, 18(23), 6156; https://doi.org/10.3390/en18236156
Submission received: 22 October 2025 / Revised: 13 November 2025 / Accepted: 19 November 2025 / Published: 24 November 2025

Abstract

The conversion of lignocellulosic biomass into high-value fermentation products generates a lignin-rich hydrolysis residue (LRR), which is predominantly combusted for process heat, offering limited valorization potential. This study investigates the hydrothermal carbonization (HTC) of this residue derived from forest residue biomass (FRB) to produce high-energy-density hydrochar. HTC, a thermochemical conversion process conducted in the presence of water, enables direct processing of wet lignin-rich residues without the need for drying or solvent-based lignin extraction or purification, thereby reducing costs and complexity. Experiments were conducted at 200–280 °C, with a fixed reaction time of 1 h, and the resulting hydrochars were thoroughly characterized for their chemical composition, structural morphology, and thermal behavior. Thermogravimetric analysis confirmed improved pyrolysis properties of the HTC products. Hydrochar yield decreased by 26.26% as the temperature increased from 200 to 280 °C, accompanied by marked improvements in fuel quality. The maximum higher heating value, observed at 280 °C, was 1.75 times greater than that of raw LRR. Elemental analysis and a Van Krevelen evaluation confirmed enhanced carbonization, as evidenced by increasing carbon content and decreasing oxygen content. The specific surface area peaked at 2.66 m2/g at 200 °C before declining with further temperature increases. This study demonstrates a sustainable pathway for valorization of lignin-rich residues from lignocellulosic biorefineries into solid biofuels, advancing circular bioeconomy and offering insights into using HTC for energy and environmental applications.

1. Introduction

Over the past few decades, energy demand has surged dramatically, driven by global economic growth and industrialization. However, fossil fuel combustion’s ecological and social impacts are becoming increasingly apparent. The emissions emitted due to the use of fossil-based fuels contribute significantly to ecological damage, air contamination, and the hastening of climate change [1]. Moreover, even a 10% rise in fuel prices can cause industrial activity to decline by approximately 17.6% to 20.27% [2,3]. These challenges call for a shift towards cleaner, more sustainable energy sources to lower carbon emissions, improve energy security, and boost the economy.
As a result, developing and adopting low-carbon and renewable fuels have become the focal point of extensive research and innovation, both domestically and internationally. Among various renewable energy options, lignocellulosic biomass stands out as a promising alternative due to its abundance, carbon-neutral nature, and potential to be a sustainable source of green energy. The versatility of biomass makes it an increasingly attractive subject of scientific inquiry, with numerous studies highlighting its advantages in reducing dependency on fossil fuels [4,5]. Forest residue biomass (FRB), generated during forestry operations and comprising branches, treetops, bark, and low-grade wood materials, is a sizable and underutilized renewable biomass resource [6]. In the United States alone, more than 150 million metric tons (dry basis) of FRB are produced each year, offering a large and underexploited source of carbon for bioenergy and bioproduct generation [6,7]. Due to the high content of structural carbohydrates and lignin, FRB is a viable renewable energy source capable of replacing fossil fuels in various applications [8].
Like any other lignocellulosic feedstock, various biochemical- and thermochemical-based methods have been investigated for the valorization of FRB. Biochemical processes often involve converting biomass into monomeric sugars, followed by fermentation to produce liquid fuels and other valued biochemicals [9,10,11]. Most of these studies focused on maximizing the sugar yields during enzymatic hydrolysis are often underutilized. However, a lignin-rich residue (LRR) remaining after hydrolysis is typically burned to produce heat or electricity on site, contributing little to the overall value of the biorefinery [12]. Given the high lignin content in forest biomass, effectively valorizing these LRRs is critical for improving overall carbon conversion efficiency and enhancing the economic viability of the biorefinery. Although studies have explored lignin valorization into high-value chemicals, these processes generally require the extraction of high-quality lignin, often using costly solvents, and are carried out at the front end of the biorefinery process, limiting scalability.
In contrast, thermochemical conversion technologies, including pyrolysis, gasification, hydrothermal liquefaction, and hydrothermal carbonization (HTC), offer diverse and more direct pathways for converting biomass into solid, liquid, or gaseous fuels [13,14]. Pyrolysis is conducted at elevated temperatures in the absence or in limited oxygen to produce biochar, syngas, and bio-oil, while hydrothermal processes treat wet biomasses in the autogenously generated pressure of water. Biochar is defined as the carbonaceous material derived from the waste lignocellulosic biomasses via thermal decomposition in the absence of oxygen or in the presence oxidizing agent [15,16]. Among various thermochemical conversion options, HTC is particularly well-suited for LRR due to its ability to directly process wet biomass without energy-intensive drying, making it ideal for moist hydrolysis residues. HTC operates in hot compressed water, typically at temperatures between 150 and 300 °C and pressures of 2 to 10 MPa, converting biomass into hydrochar, a carbon-rich solid, along with an aqueous phase containing soluble organics and a small amount of gas [1,17,18]. The process involves a series of reactions, including hydrolysis, dehydration, decarboxylation, polymerization, and condensation [19]. The resulting hydrochar exhibits properties comparable to low-grade conventional solid coal, retains a substantial portion of the original carbon, and demonstrates higher carbon utilization efficiency than many other thermochemical pathways [19,20,21]. Although hydrochar has been explored for various applications such as soil amendment, catalyst support, and pollutant adsorption, its promise as a renewable solid fuel is especially noteworthy.
The main objective of this study is to investigate the production and characterization of hydrochar derived from LRR of forest biomass under varying process temperatures. The novelty of this study lies in utilizing LRR as a direct feedstock for hydrochar production. While most existing studies focus on HTC of raw lignocellulosic biomass, the valorization of LRR from biochemical conversion processes remains largely unexplored, especially for solid fuel applications. The work provides a comprehensive assessment of the structural evolution, fuel quality, and energy properties of LRR-derived hydrochar and evaluates its potential as a renewable solid biofuel. By linking upstream sugar production with downstream solid fuel recovery, this study demonstrates a circular and efficient biorefinery approach for maximizing carbon conversion and complete biomass utilization.

2. Materials and Methods

2.1. Materials

Biomass from sugar maple forest residue chips was collected from the SUNY ESF Heiberg Memorial Forest in Onondaga and Cortland Counties, New York. After air drying, the biomass was ground using a Wiley Mill to pass through a 2 mm sieve (ASTM mesh no. 10). The cellulase and hemicellulase enzyme cocktails, Cellic Ctec2 and Cellic Htec2, were generously provided by Novozymes North America, Inc. (Franklinton, NC, USA). All other chemicals used during the hydrolysis process (sodium azide, sodium hydroxide, sodium acetate, and sulfuric acid) were obtained from commercial vendors, including VWR (Radnor, PA, USA) and Fisher Scientific (Waltham, MA, USA).

2.2. Pretreatment and Enzymatic Hydrolysis

Biomass was subjected to a two-step pretreatment process comprising hot water extraction followed by disk refining, as detailed in Hossain et al. [6]. The hot water pretreatment was performed in a 300 mL 4848 series stainless steel Parr reactor vessel (Parr Instruments, Moline, IL, USA), at 195 °C for 13 min, with a solid loading of 13.5%. These conditions were previously identified as optimal for maximizing sugar yields during enzymatic hydrolysis [6]. The pretreated slurry was subjected to mechanical refining using a laboratory-scale disk mill (Quaker City Mill model 4E, Philadelphia, PA, USA). Further details of the process can be found in our previous work [6].
Enzymatic hydrolysis of hydrothermally pretreated biomass without any washing, neutralization, or solid–liquid separation was performed at 10% solid loading, following the procedure outlined in our previous study [6]. The pH of the pretreated biomass was adjusted to 5 using NaOH, and 1 M sodium acetate buffer (pH 5) was added to achieve a final concentration of 50 mM, maintaining the pH at 5.0. The samples were mixed thoroughly before adding cellulase, hemicellulose enzymes, and deionized water to reach the desired hydrolysis volume. Enzymatic saccharification was performed using Cellic® Ctec2 and Htec2 enzymes (Novozymes North America, Inc., Franklinton, NC, USA) at concentrations of 0.334 mL per gram of dry substrate (30 FPU/g) and 0.083 mL per gram of dry substrate, respectively [6]. As the primary objective of this portion of the study was to generate sufficient lignin-rich residues for subsequent HTC, enzymatic hydrolysis was conducted at a higher working volume (200 mL vs. 50 mL in the previous study) in sterilized 500 mL Kimax glass flasks. The hydrolysis occurred in a shaking incubator at 50 °C and 200 rpm for 72 h. At the end of hydrolysis, LRRs were recovered through filtration. The solid residues were washed with distilled water to remove impurities and dried in an air oven at 50 °C. The dried samples were stored in a polybag for subsequent HTC experiments.

2.3. Composition Analysis of LRR

The chemical composition of LRR was determined using the laboratory analytical procedure for biomass analysis from the National Renewable Energy Laboratory (NREL). The structural sugars and lignin content were quantified using a two-step acid hydrolysis method (NREL/TP-510-42618) [22]. In the first step, 0.3 g of LRR was treated with 3 mL of 72% sulfuric acid at 30 °C for 1 h. The partially hydrolyzed samples were diluted to a 4% sulfuric acid concentration and autoclaved at 121 °C for 1 h. After autoclaving, the samples were vacuum filtered using ashed Pyrex filter crucibles (ASTM 10–15 μm) to obtain a filtrate for analyzing acid-soluble lignin (ASL) via spectrophotometry and structural carbohydrates using HPLC. The acid-insoluble lignin in the solid fractions was assessed by drying the crucibles at 105 °C for 24 h, weighing the dried content, and then ashing in a muffle furnace at 575 ± 25 °C for 24 h. The chemical composition was further assessed through proximate and ultimate analyses. Additionally, the Van Krevelen diagram was used to compare the fuel characteristics of the hydrochar with those of conventional coal.

2.4. Hydrothermal Carbonization

The HTC of LRR was conducted in a 300 mL 4848 series stainless steel Parr reactor (Parr Instruments, Moline, IL, USA) (Figure 1). A series of laboratory-scale HTC experiments was conducted at temperatures ranging from 200 to 280 °C. To evaluate the effect of process temperature on the physicochemical properties of the resulting hydrochar for solid fuel applications, a combination of analytical techniques was employed. To assess the effect of temperature on LRR transformation, experiments were conducted at five target temperatures: 200, 220, 240, 260, and 280 °C. Several other studies have focused on the effect of temperature alone, such as Kojić et al. [23] for spent mushroom substrate, Yu et al. [24] for anaerobic granular sludge, and Liang et al. [7] for forest biomass. Table 1 presents a detailed summary of the experimental conditions, temperature, reaction time, and pressure used in the HTC experiments to assess their effect on the properties of the resulting hydrochar.
In each experiment, 10 g of LRR was mixed in 150 mL of deionized water to form a slurry. The Parr reactor was heated to the predetermined reaction temperature and maintained at that temperature for a designated residence time of 60 min with stirring at 300 rpm. The residence time refers to the isothermal holding period during which the reactor was kept at the target temperature, excluding preheating and cooling phases. At the end of the holding time, the reactor was rapidly cooled to room temperature by immersion in ice-water. The solid carbonaceous hydrochar and liquid products were separated using quantitative filtration and washed with deionized water. The hydrochar samples were then dried in an oven at 105 °C for 24 h and ground into smaller particles using a mortar and pestle. All experiments were performed in duplicate to ensure reproducibility and consistency. The hydrochars were labeled LRR200, LRR220, LRR240, LRR260, and LRR280, corresponding to their respective HTC temperatures.

2.5. HTC Product Characterization

The ash content of the LRR and the hydrochar samples was measured following the standard procedure outlined in ASTM D1762-84 [25]. This procedure provides a reliable method for determining the various components of the biomass that are critical to understanding its combustibility and overall fuel quality [26]. The volatile matter (VM) content was measured in an electric muffle furnace at 900 °C. The fixed carbon (FC) content was then calculated by subtracting the sum of the volatile matter and ash contents from 100 percent, following the procedure described by Zhang et al. [27]. Energy analysis, Fourier-transform infrared spectroscopy (FTIR), scanning electron microscopy (SEM), and thermogravimetric analysis (TGA) were conducted to characterize the hydrochar. The detailed procedure of the characterization of the hydrochar is discussed in the following sections.
To evaluate surface porosity, the BET surface area, pore volume, and pore size distribution were computed using Nitrogen Adsorption and Micromeritics HPVA II (Norcross, GA, USA). In short, nitrogen gas was adsorbed and kept at a constant temperature and relative pressure range of −196.15 °C and 0.009 to 0.995. Using nitrogen adsorption, isothermal data were analyzed using the Microactive software to determine the BET surface area for relative pressure (P/Po) ranges of 0.05 to 0.35. Through nitrogen adsorption, the computed total pore volume was determined, with a P/Po equivalent of roughly 0.99. The micropore volume was calculated using a t-plot analysis utilizing the nitrogen adsorption isotherms, and the pore size distribution was ascertained using the Microactive software.

2.5.1. Mass Yield, Energy Density, and Energy Yield of Hydrochars

The organic mass, ash yield, and organic yield were estimated using Equations (1), (2), and (3), respectively [25]. The mass yield, energy density, and energy yield of the hydrochars were calculated using Equations (4)–(6), as described by Phang et al. [21]. The mass yield quantifies the proportion of the original biomass that remains after the HTC process, indicating the material’s conversion efficiency during carbonization.
Organic mass   % = total mass ash content
Ash yield   % = Ash content of the hydrochar Ash content of dry feedstock × 100
Organic yield   % = Organic mass of hydrochar organic mass of dry feed stock × 100
Hydrochar yield   w t % = Mass hydrocha Mass Feedstock × 100
Energy density ratio (EDR) = HHV hydrochar HHV Feedstock
Energy yield   % = Hydrochar yield × Energy density ratio

2.5.2. Elemental Analysis

Elemental analyses (carbon (C), hydrogen (H), sulfur (S), and nitrogen (N) contents) of the LRR and hydrochar were performed using a CHN Analyzer (CHN 628, Leco), which allowed for the determination of the carbon (C), hydrogen (H), sulfur (S), and nitrogen (N) contents. The oxygen content (O) was calculated by difference, subtracting the sum of the measured C, H, S, and N contents from 100%. This elemental analysis is crucial for understanding the chemical composition of the raw feedstock and the hydrochar, as it provides insight into the changes that occur during the HTC process, which influences the material’s fuel properties and energy potential.

2.5.3. Higher Heating Value

The HHV of raw LRR and the derived hydrochars’ HHV were calculated using the CHNS analyzer data using the correlation explained in Equation (7). The HHV, expressed in MJ/kg, provides a critical measure of the materials’ energy content, reflecting the total heat released when the sample undergoes complete combustion in excess oxygen. The correlation employed accounts for the elemental composition of the samples, which is vital for calculating the HHV accurately.
HHV M J k g = 0.3491 C + 1.1783 H + 0.1005 S 0.1034 O 0.0151 N 0.021 A s h

2.5.4. Fourier Transform Infrared Spectroscopy

The samples’ FTIR spectra were obtained using an FTIR spectrometer (Tensor II, Bruker). The samples were analyzed in the wavenumber range of 4000–400 cm−1 using the Attenuated Total Reflectance (ATR) technique. FTIR spectroscopy provides valuable information about the molecular structure and functional groups present in the samples. It is beneficial for identifying the chemical changes that occur during the HTC process, such as alterations in the lignocellulosic structure, the formation of aromatic structures, and the reduction of oxygen-containing functional groups, which are key to assessing the transformation of biomass into hydrochar.

2.5.5. Scanning Electron Microscopy

The surface morphology of the samples was analyzed using Scanning Electron Microscopy (SEM, SU3500, Hitachi, Tokyo, Japan). Before analysis, the samples were coated with a thin layer of gold using ion sputtering at 20 mA current for 10 s to ensure electrical conductivity. SEM imaging was then performed at an accelerating voltage of 20 kV to observe the fine details of the sample’s surface structure. This technique provides high-resolution images, which allow for examining changes in the texture, porosity, and overall surface characteristics of the raw LRR and hydrochars. Such morphological changes are essential for understanding the HTC process’s impact on the biomass’s structural integrity, influencing its fuel properties and combustion behavior.

2.5.6. Thermogravimetric Analysis

Thermogravimetric analysis was conducted using a TGA 550-2342 analyzer (TA Instruments, New Castle, DE, USA) to evaluate the thermal behavior and pyrolysis properties of raw LRR and HTC samples. TGA allows for continuous recording of the mass loss of the samples as a function of temperature and time, providing in-depth insights into the thermal decomposition behavior and thermal stability of the materials. In each experiment, approximately 5–10 mg of the sample was accurately weighed and placed in a platinum crucible within the TGA chamber. The sample was then subjected to a controlled heating program starting at ambient temperature (25 °C), with a constant heating rate of 10 °C/min, up to a maximum temperature of 600 °C. This temperature range was chosen to capture the pyrolysis and thermal degradation behavior of coal-like HTC samples. Before the analysis began, the samples were subjected to isothermal heating at room temperature (25 °C) for 5 min. This initial hold was essential for ensuring that the sample reached a stable weight and for allowing complete purging of the system with an inert gas to remove any moisture or volatile impurities from the sample. During the experimental process, nitrogen was used as the purging gas at a 60 mL/min flow rate to maintain an inert atmosphere and prevent any oxidative reactions during the heating process. The analyzer continuously recorded TG and Differential Thermogravimetric (DTG) data. The TG curve represents the total mass loss of the sample over time or temperature, and the DTG curve displays the mass loss rate as a function of temperature. The TG and DTG data were used to analyze the thermal stability and pyrolysis characteristics of both LRR and hydrochars.

2.6. Master Plot

The Master plot method is a widely used approach to analyze the reaction mechanisms of biomass pyrolysis. The master plot method simplifies the reaction mechanism analysis by comparing experimental data with theoretical reaction models to identify the dominant mechanism. The pyrolysis reaction mechanism has been analyzed using the Criado method [28]. The mathematical expressions for theoretical and experimental master plots are defined as follows [29].
Z ( α ) Z ( 0.5 ) = f α × g ( α ) f ( 0.5 ) × g ( 0.5 )
Z ( α ) Z ( 0.5 ) = T α T 0.5 2 × d α / d T α d α / d T 0.5
where f α and g α represent the differential and integral expressions of the solid–gas reaction model, respectively. These functions are essential for determining the controlling mechanism of the pyrolysis process. The specific mathematical expressions for f(α) and g(α) corresponding to different reaction models can be found in the literature [30,31]. The experimental master plot is compared with theoretical plots of standard reaction models, such as first-order, Avrami-Erofeev, diffusion-controlled, and contracting geometry models. The best-fitting model is the most likely pyrolysis reaction mechanism. The master curves were generated using algebraic equations for various heterogeneous solid material reactions, as reported by Kumar et al. [30]. The theoretical plot was obtained by graphing Equation (8), which gives the theoretical plot, while the experimental plot was obtained by plotting Equation (9).

2.7. Statistical Analysis

Statistical analysis has been done by utilizing a one-way analysis of variance (ANOVA) built into Microsoft Excel to determine the significant differences between the means. Some groups consisted of three, and some consisted of two replicates. All the analyses were conducted at a 95% confidence level (p < 0.05). The specific group comparisons were understood based on the p-values.

3. Results and Discussion

3.1. Composition of LRR and Hydrolysate

The hydrolysate obtained after enzymatic hydrolysis contained 44.77 g/L glucose and 16.80 g/L xylose. The sugar concentrations were similar to those obtained at a smaller-scale hydrolysis, reported in our previous study [6]. As most of the cellulose and hemicellulose were converted to these soluble sugars, the recovered solids (LRR) were mainly composed of lignin (77.3%), along with small amounts of glucan (7.91%) and xylan (2.55%). The lignin content in the LRR is more than 3-fold higher compared to lignin (22.6%) in raw biomass. These results indicate that most of the lignin in the biomass remains insoluble during hydrothermal treatment at relatively mild temperatures used in hot water pretreatment and enzymatic hydrolysis [32].

3.2. The Appearances of Hydrochars

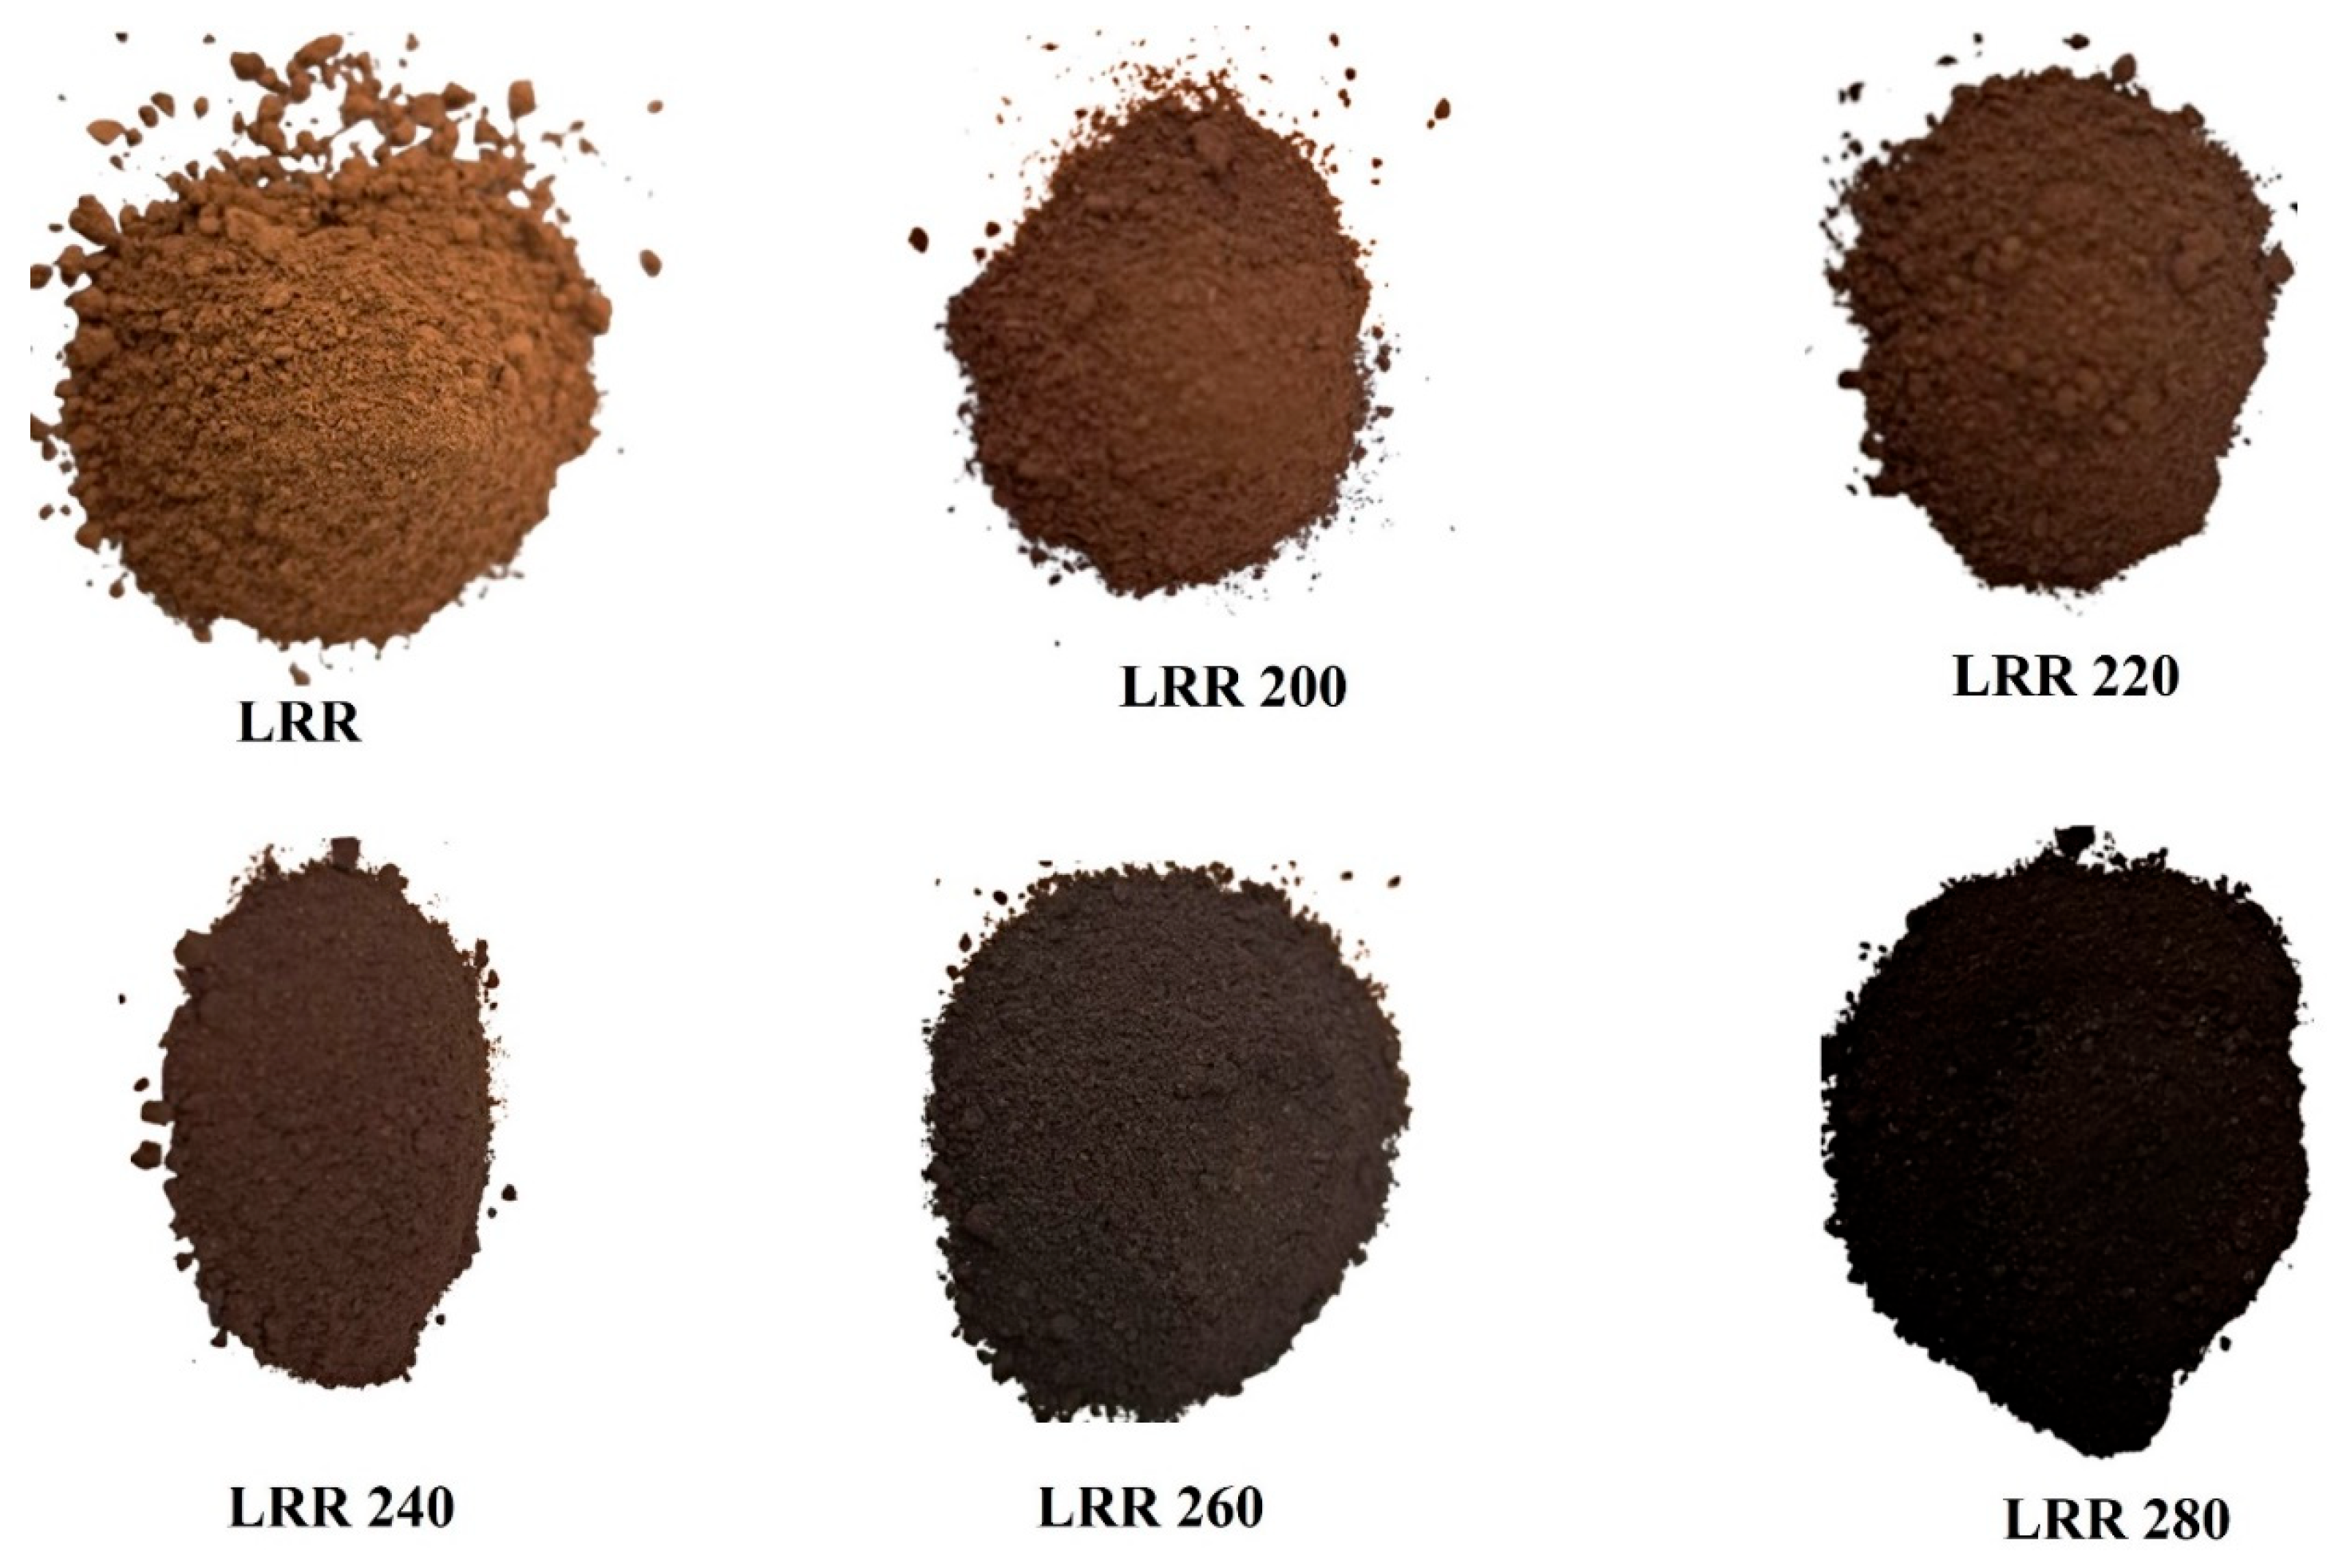
A visual inspection of the hydrochars produced at various temperatures, as shown in Figure 2, reveals distinct morphological changes. LRR200 retained a heterogeneous structure, showing little distinction from the raw LRR. In contrast, hydrochars generated at 220 °C to 280 °C exhibited a more uniform and homogeneous appearance. These samples were visually consistent and could be easily ground into fine powders. The enhanced uniformity at higher temperatures suggests that HTC promotes a more complete transformation of lignin-rich residues into carbonaceous solids. This visual transformation supports the effectiveness of HTC in producing structurally consistent materials suitable for downstream applications. Improved homogeneity not only enhances the material’s suitability as a solid biofuel but also increases its potential for environmental applications such as sorbents or soil amendments. These observations indicate that higher HTC temperatures facilitate better conversion of biomass into high-quality, carbon-rich hydrochars.

3.3. Hydrochar Yield, Energy Densification, and Energy Yield

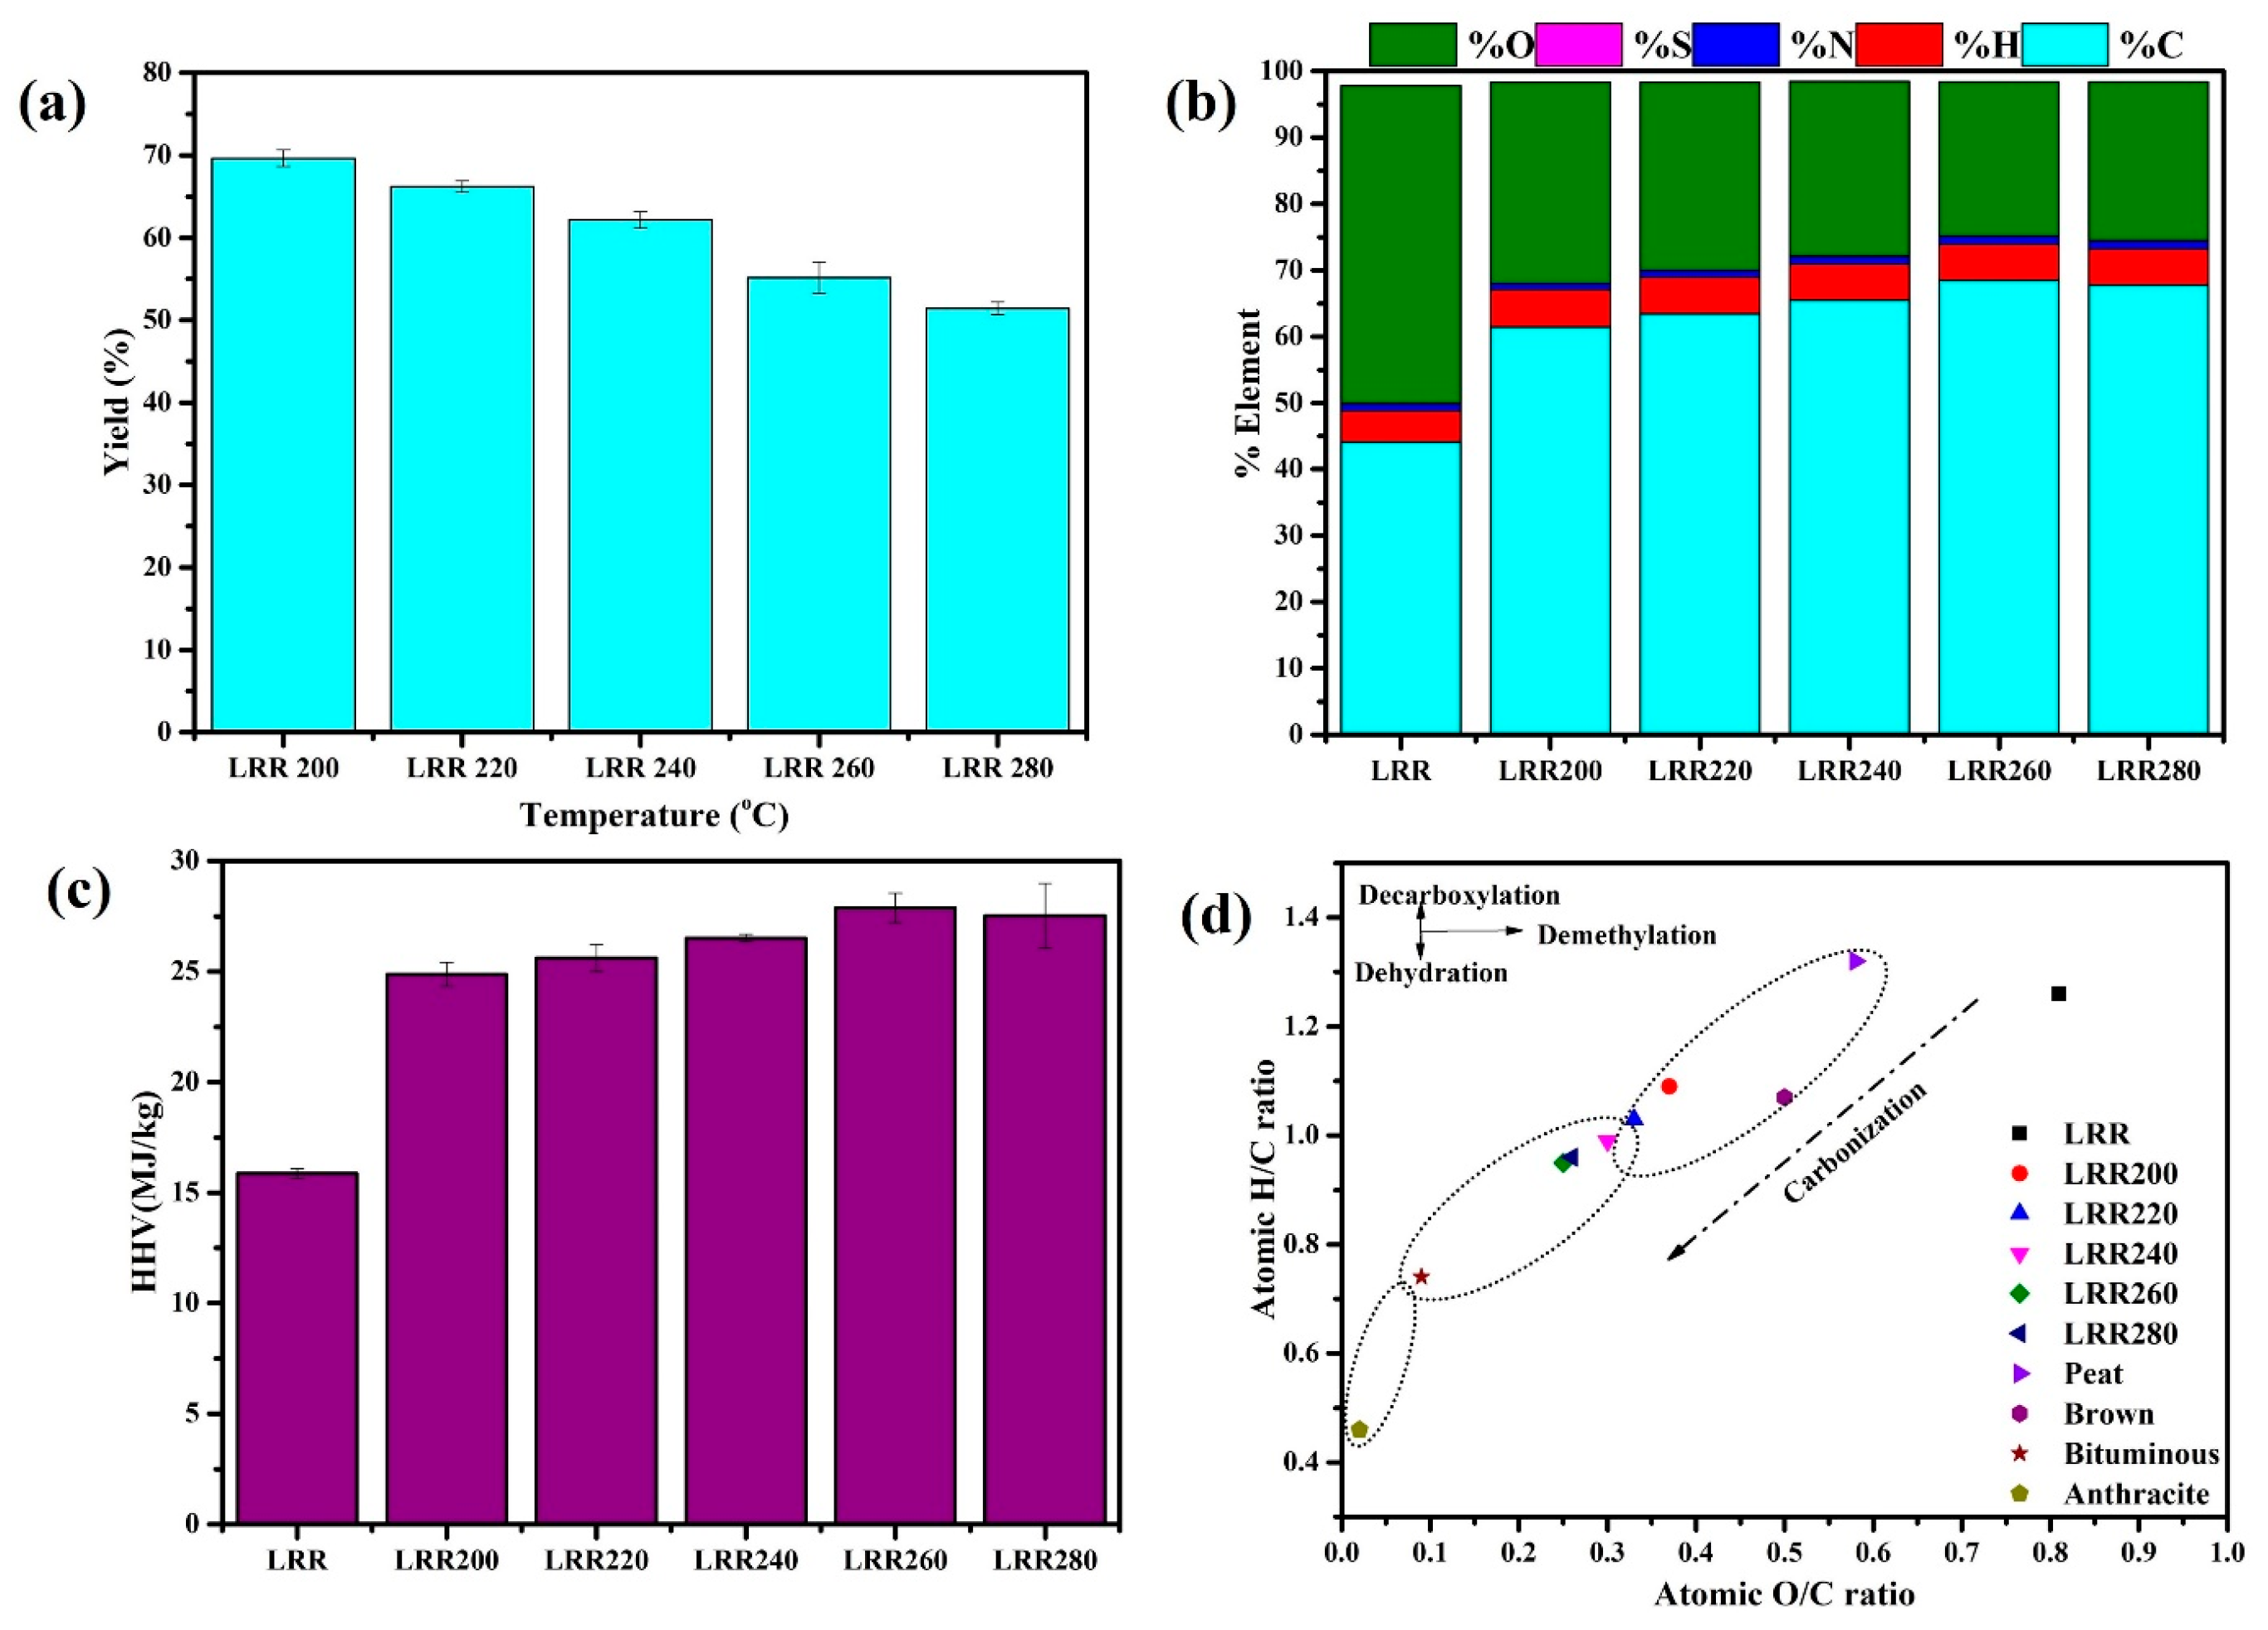
Hydrothermal temperature is a critical factor influencing the yield of hydrochar produced during HTC. As reported in Table 1 and illustrated in Figure 3a, the hydrochar yield exhibited a significant (p < 0.05) decline, decreasing from 69.64% to 51.43% as the temperature increased from 200 °C to 280 °C. The hydrochar yields recorded were 69.64, 66.20, 62.16, 55.14, and 51.43% at HTC temperatures of 200, 220, 240, 260, and 280 °C, respectively. This decrease in yield was primarily due to the different stages of thermal decomposition of LRR throughout the HTC process [33]. Specifically, the major constituents of LRR underwent various chemical reactions such as dehydration and decarboxylation, which result in the decomposition of LRR components into liquid, solid, and gaseous products [34]. At lower HTC temperatures (200–240 °C), the observed yield reduction, 4.94% from 200 °C to 220 °C and 6.10% from 220 °C to 240 °C, can be linked to the hydrolysis and liquefaction of hemicellulose and partial degradation of cellulose and lignin [35]. These components are somewhat more prone to hydrolysis, leading to their conversion into liquid by-products. Beyond 240 °C, secondary decomposition reactions become increasingly dominant. These reactions involve the breakdown of the solid char, resulting in a significant loss of mass of the solid. Between 240 °C and 260 °C, the hydrochar yield decreased significantly (p < 0.05) by 11.21%, as enhanced thermal energy facilitates further degradation of previously formed char structures. Similar findings were reported by Liang et al. [7], who studied the HTC of forest residues and observed a comparable decline in hydrochar yield (from 70% at 200 °C to 42.83% at 280 °C) with increasing temperature. Jia Luo et al. [1] investigated the valorization of kitchen waste hydrolysis residues to produce green solid fuel. They reported hydrochar yield ranging from 50% to 30%, with higher HTC temperatures accelerating the reaction kinetics but leading to reduced solid yields due to increased decomposition and volatilization.
The energy densification ratio (EDR) is a key parameter that quantifies the energy of the produced hydrochar; it is defined as the ratio of the energy content (HHV) of the hydrochar and the feedstock [33]. It is used to evaluate the energy properties of the produced hydrochar [27]. The EDR in this study varies from 1.57 to 1.73 as the HTC temperature increases from 200 to 280 °C (Table 2), representing an increase of nearly 10.73%, which can be attributed to decreased oxygen and hydrogen content with increasing temperature [36]. However, an insignificant (p > 0.05) change in EDR was found for LRR220 as compared to LRR, and its increase was around 2.55%. The highest EDR of 1.76 was observed for the hydrochar produced at 260 °C. An insignificant lower value of 1.73% in the EDR of hydrochar at 280 °C compared to 260 °C is due to the somewhat lower value of HHV and higher oxygen values at 280 °C. A similar trend of EDR values was also reported by Lin et al. [37] for the HTC of paper sludge in the temperature range of 180 to 300 °C. Fan et al. [36] prepared the hydrochar from macadamia nut shells using HTC. They reported that the energy densification increased with temperature from 1.15 at 180 °C to 1.39 at 260 °C for 120 min HTC. Kojic et al. [23] found a similar increase in EDR from 1.38 at 180 °C to 1.58 at 260 °C for the hydrothermally carbonized spent mushroom substrate hydrochar.

3.4. Fuel Properties

3.4.1. High Heating Value

HHV is a crucial indicator of the fuel properties of solid fuels, as it quantifies the total energy released during the combustion of a given mass of fuel [34]; therefore, assessing the HHV of hydrochar derived from biomass feedstocks is essential to evaluate its energy potential [38]. As shown in Figure 3c, the HHV of the hydrochars, calculated based on elemental analysis, exhibited a significant increase with rising HTC temperatures. The HHV of the hydrochar produced at 260 °C reached 27.88 MJ/kg, representing a 75.68% enhancement compared to that of the raw LRR (15.87 MJ/kg). This substantial increase can be attributed to the thermal degradation of low-energy chemical bonds and the formation of higher-energy carbon-rich structures during HTC [39]. Additionally, the increase in HHV can also be linked to reduced ash content, oxygen removal, and an increase in carbon content, which has also been reported in other studies [38]. An insignificant (p > 0.05) decrease of 1.29% in HHV at 280 °C was observed compared to 260 °C, likely due to increased ash formation at 280 °C. A similar trend was reported by Lin et al. [37], who observed that the HHV of HTC-treated paper sludge peaked at 210 °C before decreasing at higher temperatures. The increase in HHV relative to raw LRR confirms the enhanced fuel properties of the hydrochar.

3.4.2. Ultimate Analysis

The carbon content of LRR increased significantly from 44% to a maximum of 67%, indicating enhanced carbonization (Table 2). At 200 °C, the carbon content increased by 71.86%, with gains of 2.26% observed between 240 °C and 260 °C. In contrast, the oxygen content showed a consistent decline from 48.01% to 25.07%, reaching its lowest value at 260 °C (25.07%) with no significant change observed at 280 °C (25.43%). It is observed that hydrochar obtained at 280 °C, the content of H and O is higher, and the content of C is lower at 260 °C, and this is because at the higher reaction temperature (280 °C), more extensive reactions such as decarboxylation and dehydration occur, leading to the release of light non-condensable gases and oxygenated compounds. These reactions result in a greater loss of carbon into the liquid and gas phases, thereby producing a hydrochar with a slightly lower carbon content and relatively higher hydrogen and oxygen contents compared to the sample obtained at 260 °C. A similar trend has also been reported by Reza et al. [40]. The steady enrichment in carbon and reduction in oxygen with rising HTC temperature directly contributed to the observed increase in HHV, as a higher carbon-to-oxygen ratio is associated with improved energy density. This increase in carbon content surpasses that of conventional biomass fuels such as peat and brown coal, emphasizing the improved carbonization potential of LRR under hydrothermal conditions (Figure 3b). This pattern is attributed to HTC-induced dehydration, decarboxylation, and condensation reactions [33,41]. These findings are consistent with those reported by Liang et al. [7], who observed a similar increase in carbon content, from 47.85% to 70.75%, in HTC-treated forest residues.
The hydrogen content in LRR initially rose from 4.65% to 5.61% at 200 °C, but subsequently, a significant (p = 0.012) decline to 5.32% occurred with further increasing temperatures. Nitrogen content, initially 1.07%, reached its lowest value at 200 °C and peaked at 240 °C, while remaining relatively constant at other temperatures. Sulfur content remained largely unchanged across the temperature range, with only minor reductions observed. The reduction in oxygen content, carbon enrichment, and stabilization of nitrogen and sulfur collectively demonstrate the effectiveness of HTC in enhancing the fuel characteristics of LRR. These compositional improvements support the potential of HTC-treated LRR as a high-energy solid fuel [38,42,43].

3.4.3. Van Krevelen Plot

The ultimate analysis data (Table 2) was used to generate the van Krevelen diagram (Figure 3d), which illustrates the evolution of LRR hydrochar composition with increasing HTC temperature. This diagram is between the atomic ratios of hydrogen to carbon (H/C) and oxygen to carbon (O/C), which provide insight into the dominant reaction pathways, such as dehydration and decarboxylation, occurring during HTC. This diagram is a well-established tool for assessing the chemical transformation of biomass during thermal treatments, particularly for tracking the degree of coalification achieved in the resulting hydrochar [37,44,45].
As shown in Figure 3d, both H/C and O/C ratios declined significantly with increasing HTC temperature up to 280 °C, from 1.26 to 0.95 and from 0.81 to 0.26, respectively, indicating progressive aromatization and carbon enrichment. These changes reflect the breakdown of oxygenated functional groups and hydrogen loss, resulting in a more carbon-dense, coal-like material [37]. The diagram also includes conversion trajectories of various coal ranks to enable a comparative evaluation of the coalification degree.
With increasing HTC temperature, the LRR samples exhibit a distinct shift toward regions representing more mature coal types. Specifically, the LRR200 sample falls within the peat and brown coal regions, while LRR240, LRR260, and LRR280 align progressively with the bituminous coal region. These transitions clearly demonstrate the efficacy of HTC in accelerating the coalification of LRR, particularly at higher temperatures.
The van Krevelen trajectory also highlights that hydrochars possess markedly lower H/C and O/C ratios compared to raw LRR, supporting their classification as more coal-like fuels [35]. The extent of carbonization, influenced strongly by HTC temperature, is further evidenced by the increasing carbon content, decreasing oxygen content, and enhanced HHV observed in hydrochars. These compositional and energetic improvements validate the potential of HTC as a pretreatment strategy for upgrading lignocellulosic residues into energy-dense solid fuels [37].

3.4.4. Proximate Analysis

Significant changes were observed in volatile matter (VM), fixed carbon (FC), and ash content with increasing HTC temperatures (Table 2). The FC content increased from 28.91% at 200 °C to 42.15% at 280 °C, while the VM content steadily decreased from 68.90% to 56.22%. These trends reflect dehydration, decarboxylation, and demethylation reactions that occur during HTC, which convert LRR into carbon-rich solid biofuels with improved combustion properties [38,45].
Reducing volatile matter in hydrochars is beneficial for direct combustion, as it lowers pollutant emissions and improves combustion efficiency, as noted by Koji et al. [23]. The combustibility of the hydrochars can be further evaluated using the fuel ratio (FR), defined as the ratio of fixed carbon to volatile matter. In this study, the FR increased from 0.42 in raw LRR to 0.75 in LRR280, indicating enhanced fuel quality. A similar increase in FR (from 0.38 to 0.75) was reported for kitchen waste hydrochar over an HTC temperature range of 180–280 °C [1]. The rise in FR with HTC temperature is primarily attributed to an increase in fixed carbon and the concurrent decrease in volatile matter content, reflecting substantial devolatilization and carbonization [43]. The fuel ratio is closely associated with combustion characteristics, such as flame intensity and stability. A higher FR or increased fixed carbon is typically linked to a more stable flame and improved combustion stability, while excessive volatile matter may lead to flame instability and poor heat balance [1].
The ash content (wt.%) is another critical factor in assessing hydrochar quality, as it influences fouling, slagging, and overall combustion performance. In this study, the initial ash content of raw LRR was 2.19 wt.%, serving as a baseline for evaluating HTC effectiveness (Table 2). The ash content in hydrochars varied between 1.55 and 1.70 wt.% across different HTC temperatures. At 200–220 °C, a notable decrease to 1.70 wt.% indicates effective removal of inorganic materials during early HTC stages [46]. The lowest ash content (1.55 wt.%) was observed at 240 °C, suggesting enhanced demineralization or transformation of inorganic constituents at this temperature. However, insignificant (p > 0.05) increases were recorded at 260 °C (1.61 wt.%) and 280 °C (1.63 wt.%), potentially due to the concentration of mineral matter as organic content continues to degrade. He et al. [45] reported a similar pattern of ash content variation in pine wood hydrochar when temperature varied from 180 °C to 240 °C. They reported that the ash content in the hydrothermally carbonized sample at 240 °C was 1.69%, compared to 2.84% in the raw sample. Another research reported by Liang et al. [7] reported an ash content of 7.57% in raw forest residues and observed a declining trend up to an HTC temperature of 220 °C (4.76%). At 240 °C, the ash content slightly increased to 5.54%, followed by another decline to 2.66% at 280 °C.
The ash content in LRR-derived hydrochars remains substantially lower than that of many conventional coals, ranging from 4.6% to 13.4% in lignite, 5.7% in sub-bituminous coal, and 5.8% in Balingian coal [47,48,49]. Lower ash content in hydrochar is advantageous for combustion applications, as it minimizes fouling and slagging risks and improves overall thermal efficiency [1].

3.5. Effect of Hydrothermal Carbonization on the Microstructure of LRR

The FTIR spectra (Figure 4) interprets the chemical structure and functional group transformations occurring in LRR and their HTC hydrochar samples generated at different temperatures. While the overall spectral profiles of the raw LRR and HTC-treated samples exhibit similar characteristic absorption bands, variations in peak intensities and shapes reflect notable changes in functional group composition induced by thermal treatment. The changes in transmittance intensity at various wavenumbers provide insight into the thermal degradation and chemical modifications of lignocellulosic components during the HTC process [7].
The broad absorption peak around 3374 cm−1 corresponds to hydroxyl (-OH) stretching from cellulose, hemicellulose, and lignin. A progressive decrease in intensity at higher HTC temperatures indicates dehydration, decarboxylation, and condensation reactions, leading to reduced hydroxyl content [36]. Peaks at 2943 cm−1 and 2831 cm−1 correspond to C-H asymmetric and symmetric stretching of aliphatic CH2 and CH3 groups. The reduction in peak intensity with increasing temperature suggests depolymerization of aliphatic chains and progressive aromatization with rising HTC severity [7]. The absorption band at 1697 cm−1 corresponds to C=O stretching from carboxyl, ketone, or conjugated carbonyl groups. A significant reduction at higher HTC temperatures indicates decarboxylation and loss of carbonyl functional groups, contributing to increased aromaticity and carbonization [36].
Peaks at 1589 cm−1, 1500 cm−1, and 1413 cm−1 are characteristic of C=C skeletal vibrations of aromatic rings in lignin. The persistence of these peaks across all HTC samples suggests structural stability of lignin, although subtle changes in intensity variations imply structural modifications such as demethoxylation and condensation [7]. Additional peaks at 1203 cm−1, 1100 cm−1, and 1026 cm−1 are associated with C-O-C stretching in cellulose and hemicellulose as well as C-OH vibrations in polysaccharides. These bands significantly weaken at higher HTC temperatures, confirming the decomposition of hemicellulose and cellulose, and the increasing carbonization of the biomass matrix [43]. The peak at 824 cm−1, representing out-of-plane aromatic C-H bending, remains present in all samples, further indicating that lignin is retained as the dominant structural component [23].
The FTIR analysis demonstrates that HTC progressively reduces the presence of oxygen-containing functional groups while enhancing aromaticity and carbon content. The loss of hydroxyl and carbonyl groups indicates enhanced hydrophobicity, making the material more suitable for fuel applications. With minor modifications, the lignin remains the dominant structure, making hydrochar thermally stable [1,31].

3.6. Surface Morphology and Structural Modifications from SEM Analysis

The SEM images presented in Figure 5 reveal significant morphological transformations of the LRR during HTC. The raw LRR sample displays well-organized fibrous and lamellar structures, characteristic of the natural lignocellulosic matrix. The smooth surface morphology suggests a compact structure, typical of untreated biomass residues. At lower HTC temperatures (LRR200 and LRR220), gradual structural breakdown of the lignin matrix becomes evident. The development of rough, irregular, and fractured surfaces indicates the depolymerization of lignin and hemicellulose under mild hydrothermal conditions, suggesting pore development and enhanced surface roughness, consistent with previous studies on low-temperature HTC of lignocellulosic biomass [23]. For sample LRR 240, further fragmentation and particle aggregation are observed. The surface becomes more granular, indicating intensified chemical transformations and carbonization. At this stage, pore collapse or condensation reactions begin to dominate, leading to the formation of denser structures, as reported in the literature for intermediate HTC conditions [7]. At higher temperatures (LRR260 and LRR280), the SEM images show significant structural collapse and particle fusion, forming compact agglomerates with smoother surfaces [7]. SEM-based analysis provides clear insights into the structural evolution of lignin-rich residues during HTC. Early-stage HTC (200 °C to 220 °C) primarily facilitates hemicellulose degradation and surface roughening, while higher temperatures (260 °C to 280 °C) lead to lignin breakdown and carbonaceous agglomerate formation. These findings are consistent with those reported by Liang et al. [7] in their investigation of HTC-treated forest waste across a similar temperature range (200 to 280 °C).

3.7. Textural Properties and BET Surface Area Analysis

To quantitatively evaluate the variations in pore volume and specific surface area (SSA) of LRR during the HTC process, the surface characteristics of the hydrochar were analyzed using the BET method. The SSA, total pore volume (TPV), and micropore volume (MPV) of the resulting hydrochars are summarized in Table 2. At lower HTC temperatures (<220 °C), a notable increase in SSA and pore volume was observed. Specifically, at 200 °C, the SSA and MPV were recorded as 2.66 m2/g and 0.0275 cm3/g, respectively. This increase in SSA as compared to raw 0.20 m2/g can be attributed to removing volatile matter during HTC, which creates new voids and improves porosity.
However, as the HTC temperature continued to rise beyond 220 °C, structural changes in the hydrochar resulted in the collapse and fusion of pores [7]. The breakdown of specific structural components and the formation of fragments contributed to pore blockage, preventing further porosity development. For instance, at 240 °C, the SSA of LRR declined to 0.15 m2/g. It is likely that the organic matter generated at this stage had not fully transitioned to the liquid phase, further obstructing the pore network [43]. With a further increase in temperature, the blocked debris dissipated, leading to a partial recovery in SSA [7]. Similar trends in SSA have been observed in other biomass-derived hydrochars, such as kitchen waste hydrolysis residue [1], wheat straw [50], and maize straw [51]. Overall, the porosity of hydrochar increased initially and then declined as HTC temperature rose. This pattern aligns with findings from SEM analysis, further corroborating the validity of the observed BET results. Liang et al. [7] suggested that micropores in hydrochar are unstable under prolonged exposure to high HTC temperatures, leading to structural collapse. The consistency between porosity measurements and SEM observations reinforces the reliability of these findings, offering valuable insights into the thermal behavior of LRR during HTC.

3.8. TGA and DTG Analysis

TGA is crucial for examining materials’ thermal properties and stability, such as LRR and their hydrochar derivatives. This technique measures changes in the sample’s mass under a controlled temperature program. It offers insights into decomposition patterns and thermal behavior, vital for their potential use as solid fuels or in other energy-related applications [46]. Additionally, these analyses help determine the residual mass after thermal decomposition and assess the thermal stability and reactivity of hydrochar.
By plotting mass loss against temperature, a thermogravimetric curve is generated, revealing key aspects of the material’s thermal performance [47].
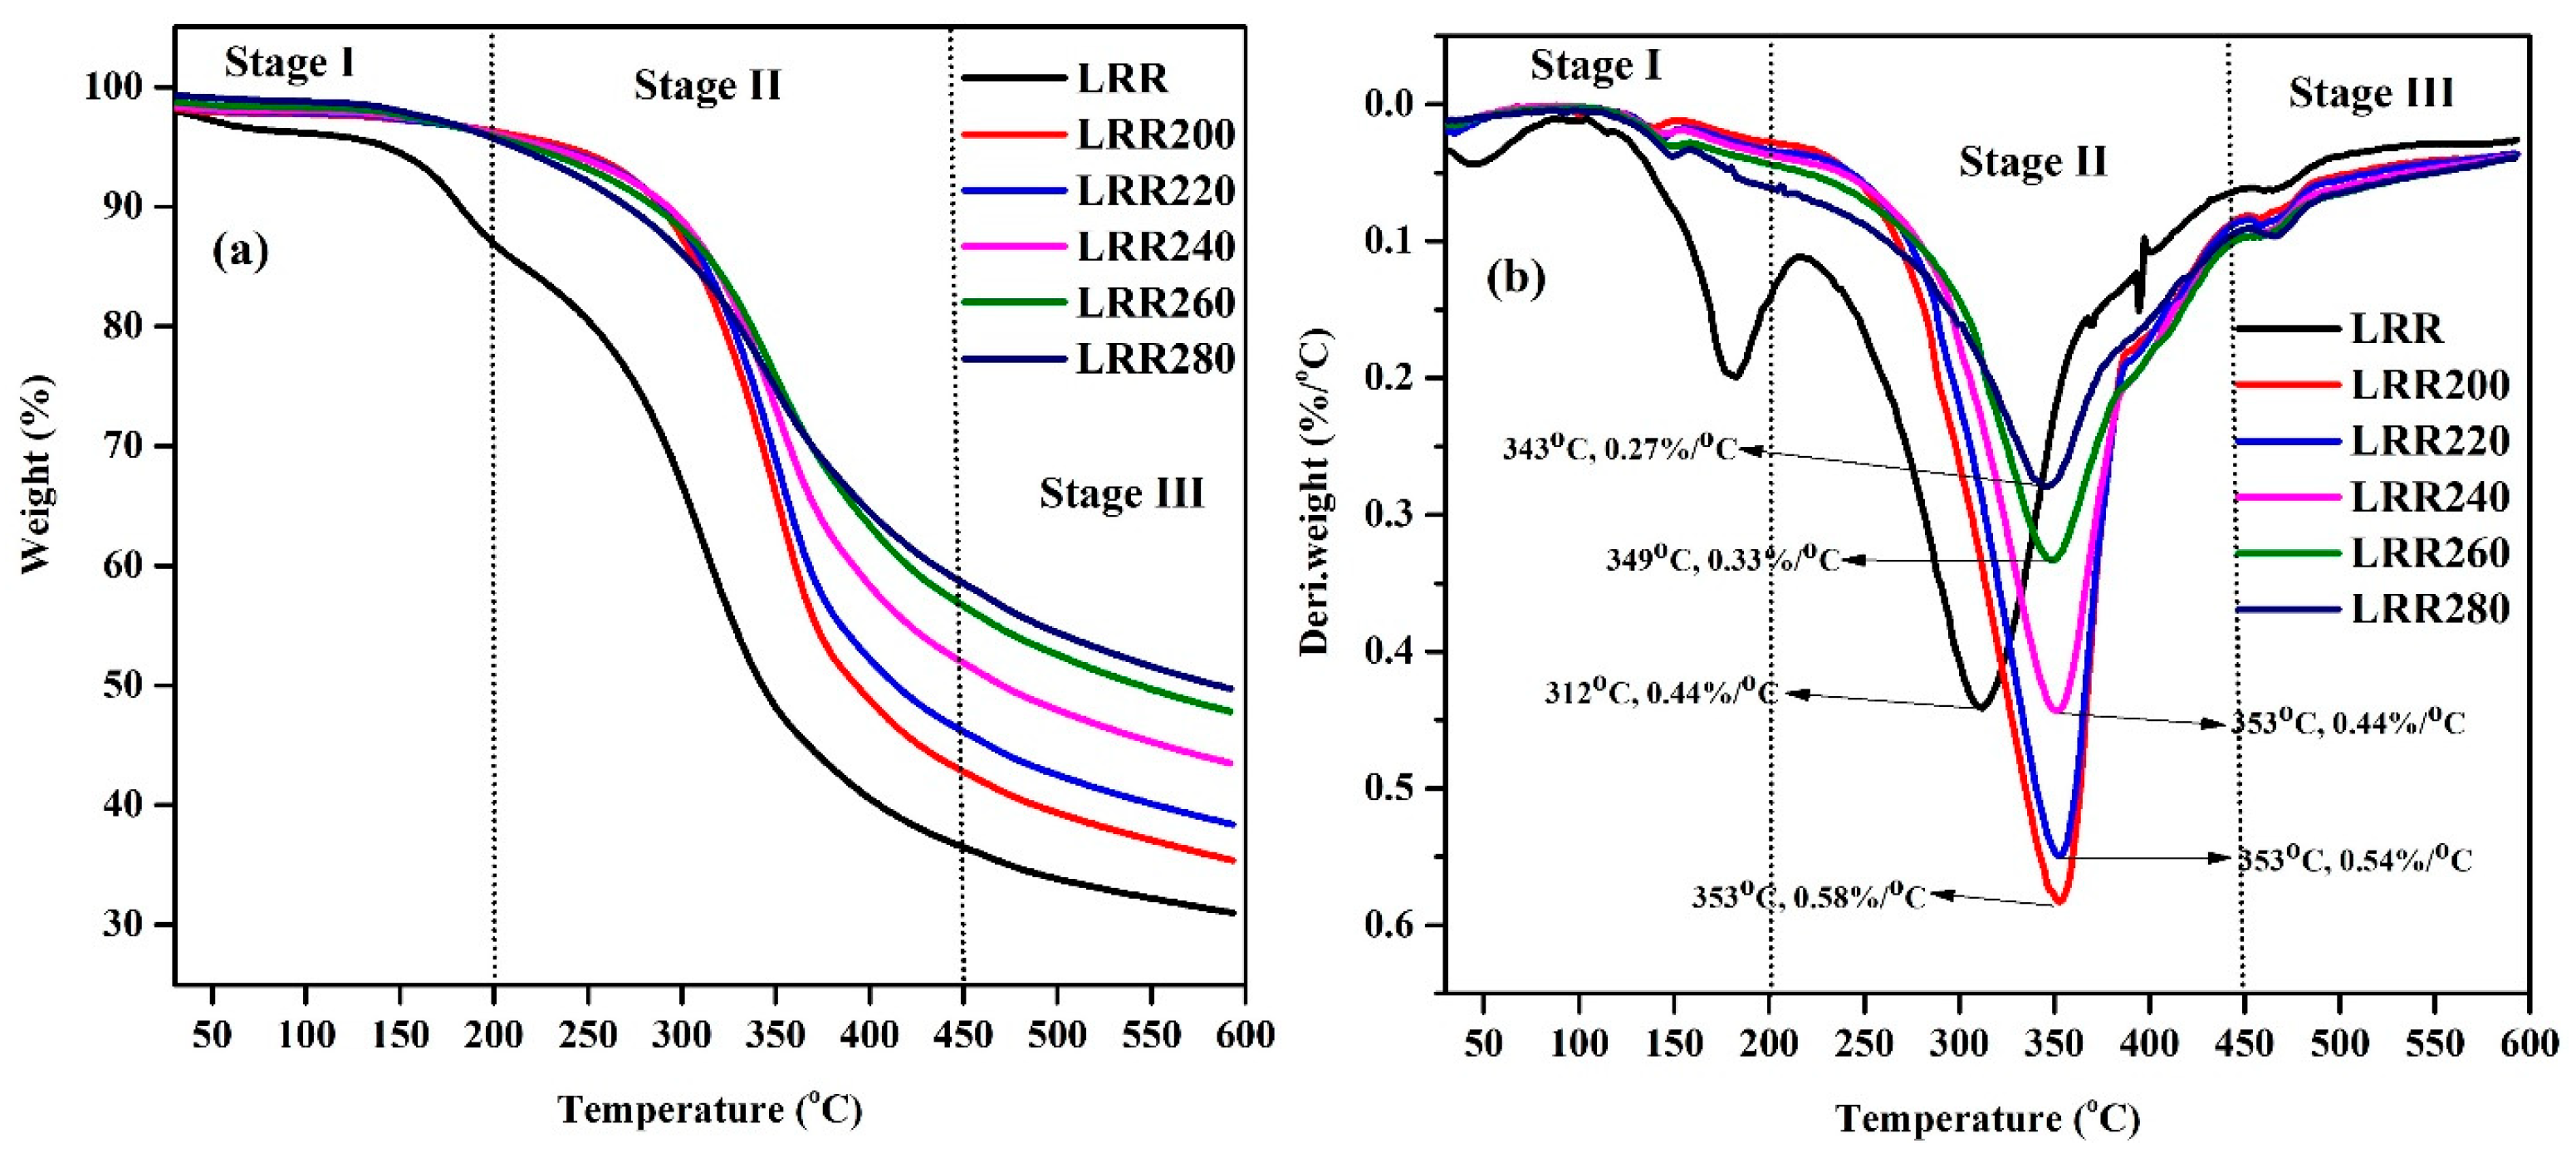
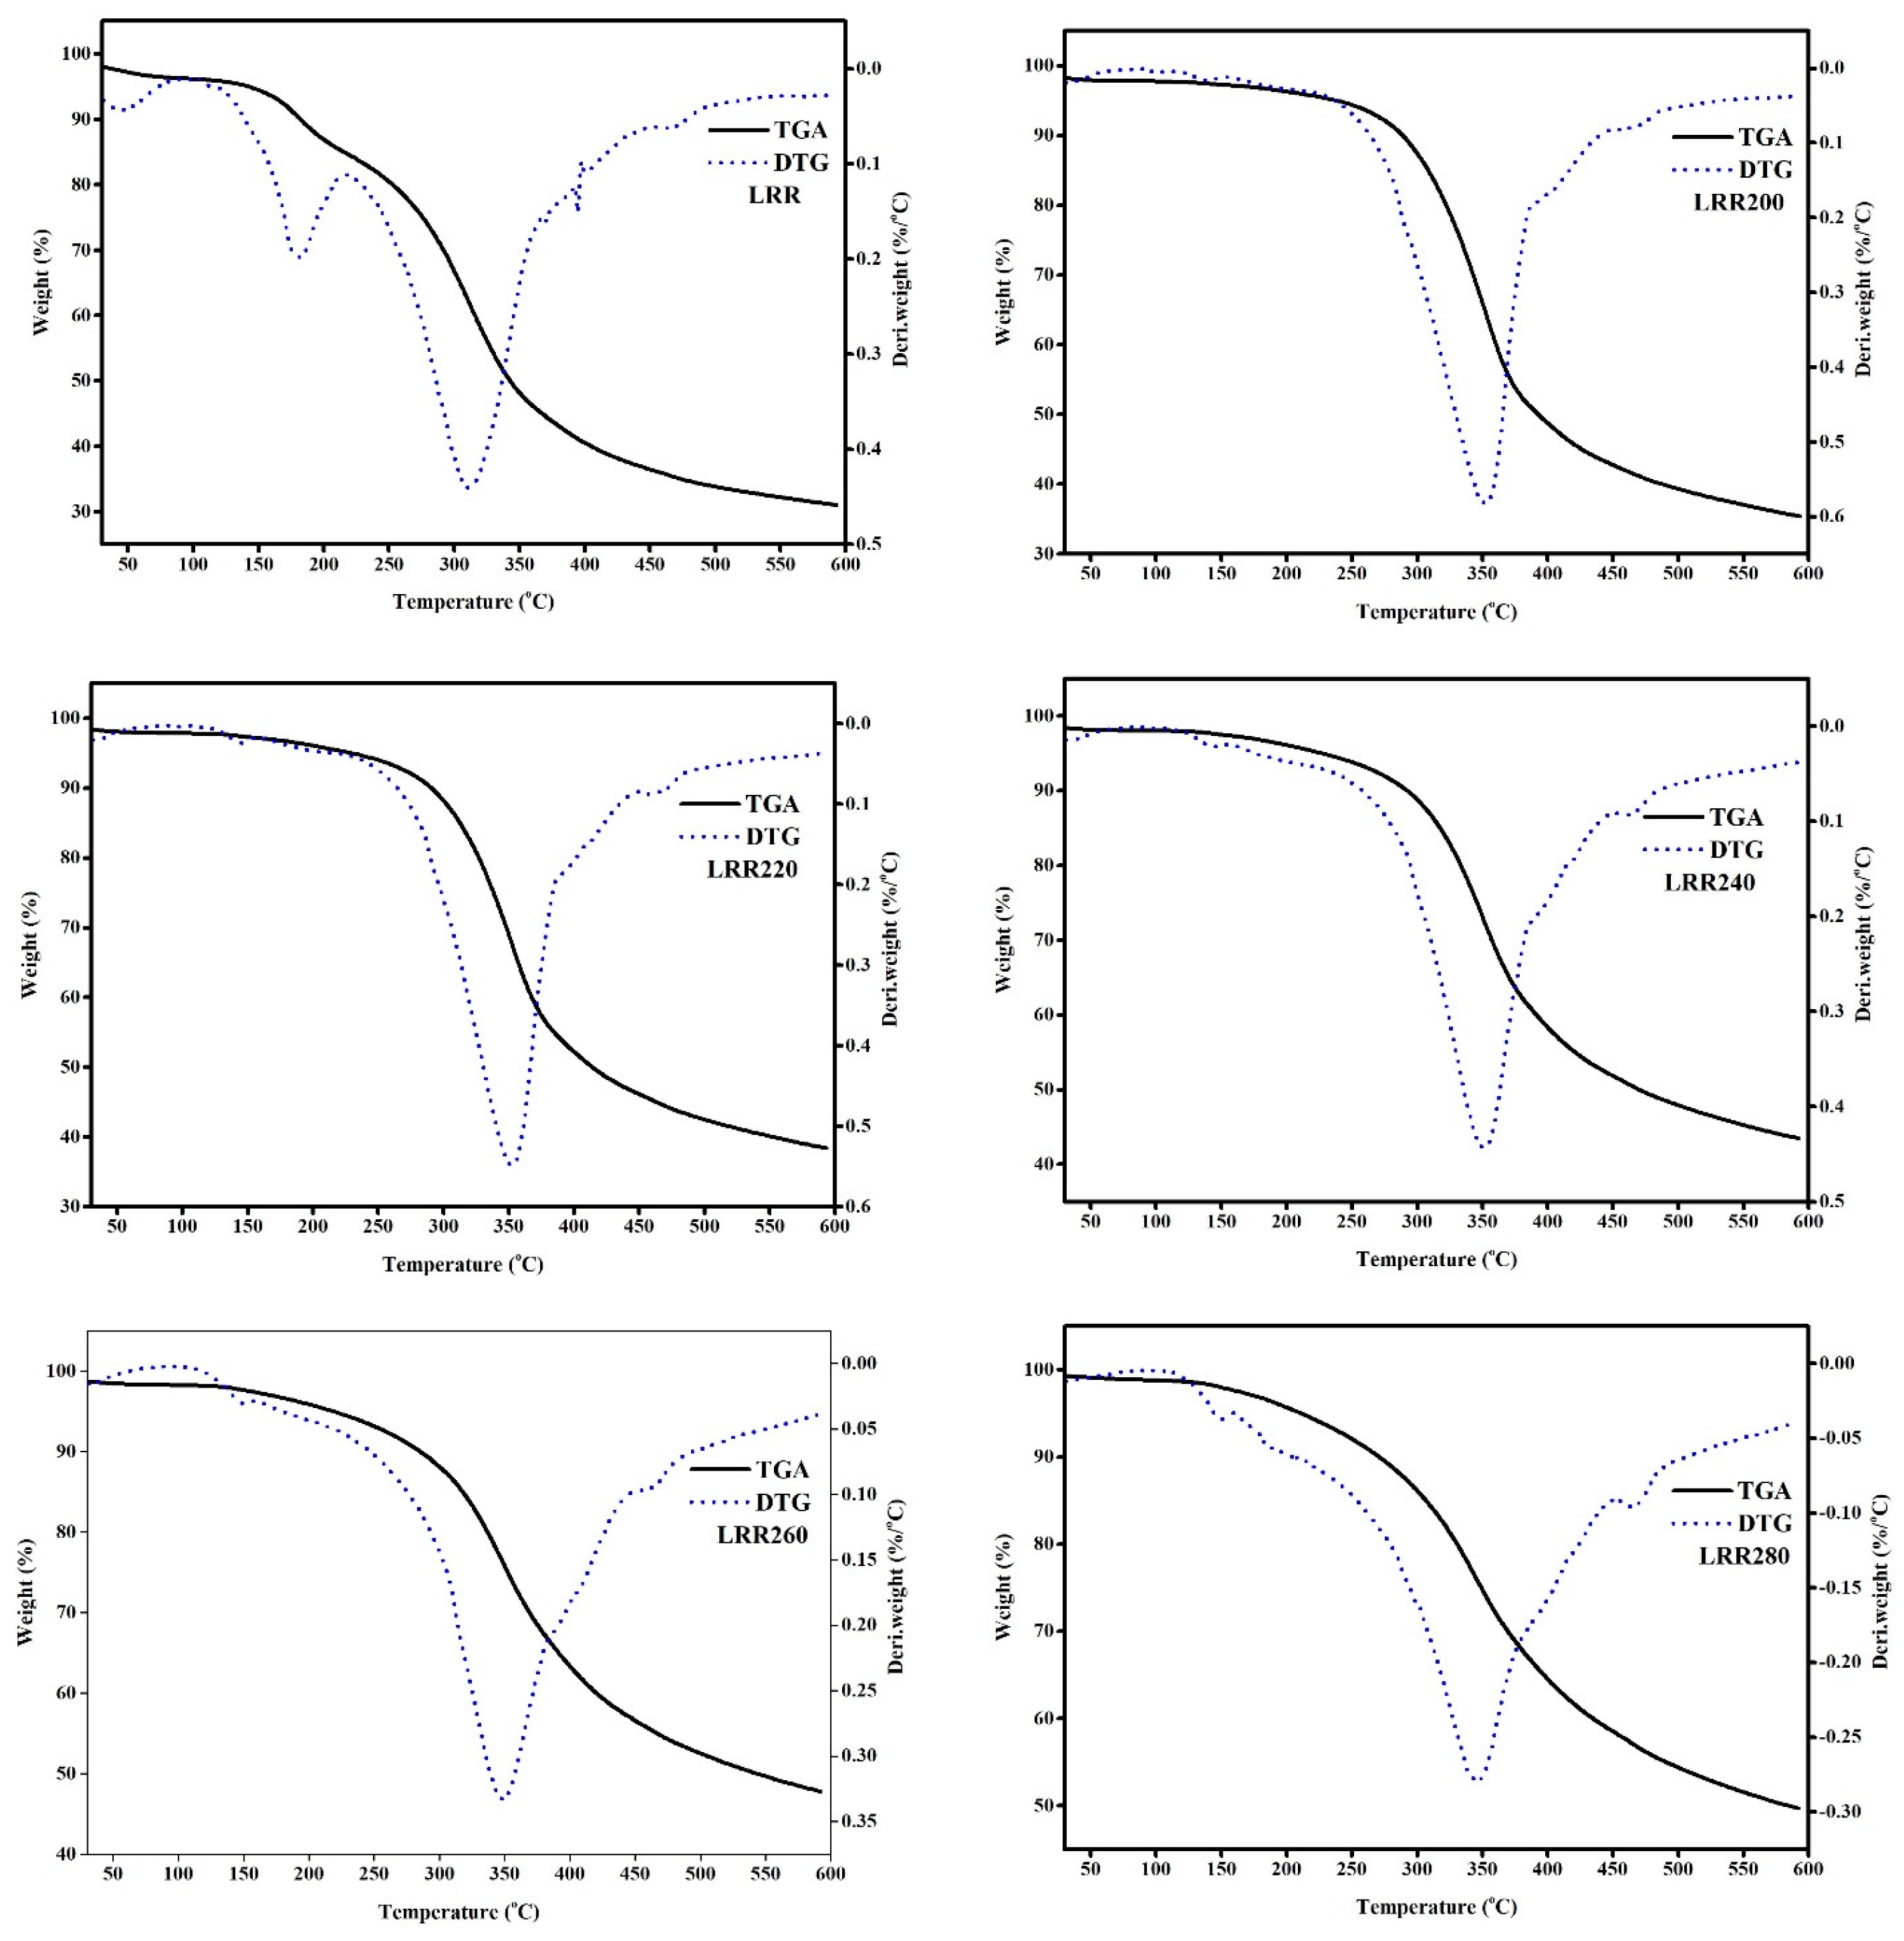
Figure 6a,b illustrate the TGA and derivative thermogravimetric (DTG) curves, respectively, for all HTC samples. TGA and DTG curves for individual samples are shown in Figure 7. The TGA curve displays biomass weight loss as a function of temperature, highlighting distinct degradation stages. In contrast, the DTG curve emphasizes the rate of weight loss, pinpointing the temperature ranges of major thermal events. DTG curves provide a clearer understanding of reaction characteristics, including the initial temperature (Ti), final temperature (Tf), and the temperature corresponding to the maximum weight loss rate (Tm). These parameters shed light on the transformations occurring during the pyrolysis process [7]. Table 3 summarizes the observed trends, underscoring the significant impact of HTC treatment on different samples.
This study performed a TGA of LRR and its hydrochar under an inert atmosphere at a heating rate of 10 °C/min, as illustrated in Figure 6a. The analysis revealed that the degradation of the samples occurs in three distinct stages, which were comprehensively examined to understand the thermal behavior of the materials (Table 3). Notably, the TGA and DTG profiles of hydrochar exhibited significant changes in the weight loss proportions across different stages of pyrolysis compared to the LRR. These variations can be attributed to alterations in the reactive components of hydrochar resulting from the hydrothermal carbonization (HTC) process, as opposed to its raw feedstock [48]. Pyrolysis generally progresses through three stages: the drying process, the active pyrolysis process, and the passive pyrolysis process [46]. The weight losses associated with these stages occur as follows:
Stage I (30–200 °C): This stage primarily involves the loss of moisture and small organic molecules [15]. For LRR, the weight loss in this stage was 11.06%, reflecting significant moisture content. Drying, which removes most of the moisture from the raw material, predominantly occurs before 200 °C. Stage II (200–450 °C): This active pyrolysis stage is characterized by the volatilization of organic compounds, including hemicellulose and other reactive components, producing significant quantities of volatile substances and non-condensable gases [49]. LRR exhibited a weight loss of 54.46% in this stage, indicating the decomposition of organic entities. Stage III (450–600 °C): The passive pyrolysis stage involves the formation of char and ash as the remaining lignin and carbonaceous material undergo further thermal degradation [49]. The weight loss in this stage for LRR was 5.50%, corresponding to the residual decomposition of stable components.
The reaction rate during the drying process of stage I (below 200 °C) was substantially higher for LRR than for hydrochar, suggesting that the HTC process enhances the hydrophobicity of the fuel by reducing its moisture content. This is further corroborated by the TGA data, which shows a clear peak for raw LRR in the 100–200 °C range, indicative of hemicellulose content. The hydrolysis of hemicellulose during HTC significantly alters the thermal degradation profile, enhancing the stability and energy content of the hydrochar. In the second stage of pyrolysis, occurring within the temperature range of 200–450 °C, most weight loss is associated with thermal decomposition of hemicellulose and cellulose, the primary structural components of biomass [17]. Notably, the extent of weight loss during this stage decreases progressively with increasing HTC temperature, highlighting the enhanced thermal stability of hydrochars as compared to their raw feedstock. The third stage, which occurs at the highest temperatures (450–600 °C), corresponds to the residual weight loss resulting from the conversion of remaining biomass into char and ash. This stage indicates the final thermal transformation processes, predominantly involving lignin degradation and stabilizing carbonaceous residues. Lignin exhibits a notably more complex decomposition behavior compared to hemicellulose and cellulose. Its gradual weight loss spans a broad temperature range from 160 °C to 600 °C, reflecting its higher resistance to pyrolysis [49]. This resistant nature of lignin is evidenced by the extended tailing observed in the DTG curve, as it decomposes steadily over a prolonged temperature range.
Figure 7 provides a detailed representation of the thermal degradation stages of lignocellulosic biomass components, illustrating the sequential breakdown of hemicellulose, cellulose, and lignin under increasing temperatures. Being the least thermally stable, hemicellulose decomposes first, followed by cellulose, which breaks down at relatively higher temperatures. Lignin, the most thermally resistant component, contributes to the persistent degradation profile observed in hydrochars and residual biomass [49]. These observations underscore the intricate thermal behavior of lignocellulosic components and the influence of HTC on modifying their decomposition characteristics, offering insights into optimizing biomass conversion processes for energy applications.
The DTG curves displayed a distinctive shoulder in the 200–250 °C range, suggesting that light side chains and volatile components were reduced but not eliminated under mild HTC conditions. This indicates that pyrolysis was only partially effective in breaking down these volatile compounds at lower HTC temperatures. However, when the HTC temperature reached 240 °C or higher, this shoulder peak completely disappeared, leaving a dominant peak within the 300–400 °C range. This shift signifies that the decomposition of volatile compounds is more pronounced at elevated HTC temperatures, leading to more extensive breakdown of the biomass components [49].
The raw LRR exhibited a higher decomposition rate (DTG peak) of 0.20%/°C than the hydrochar samples (0.03–0.06%/°C) in the 30 to 200 °C temperature range. The average rate of weight loss in this stage was higher (0.07%/°C) in LRR and decreased after HTC. This can be attributed to the transformation of hemicellulose during HTC. This alteration increases the decomposition rates of the hydrochar at moderate HTC temperatures, as the biomass components become more reactive and easier to break down. At higher HTC temperatures, the cellulose undergoes further conversion into more stable forms, resulting in a slower decomposition rate in the active pyrolysis zone (200–450 °C). In stage II, the average weight loss rate of LRR was 0.20%/°C, and the decrease rate of weight loss recorded after HTC was the lowest, 0.15%/°C for LRR280. This is evident in the DTG curves, where the decomposition rate decreases with increasing temperature, reflecting the stabilization of the biomass [36].
Furthermore, the peak intensity in the 450–550 °C range gradually increased as the HTC temperature was raised. This trend suggests that hydrochars treated under more severe HTC conditions generate more stable components that resist decomposition at lower temperatures. These stable components, likely high-carbon, low-oxygen substances, do not easily break down in the active pyrolysis zone. As the temperature exceeds 500 °C, the decomposition of C-C and C-H bonds within the samples becomes more gradual, further stabilizing the structure of the pyrolyzed char. Above 450 °C, the weight of the pyrolysis char remained relatively unchanged, indicating that the biomass components were effectively converted into stable, carbon-rich substances that are resistant to further degradation. This suggests that the HTC process not only enhances the thermal stability of the biomass but also contributes to forming a more energy-dense material, particularly at higher treatment temperatures. Liu et al. [17] have reported a similar trend in TGA and DTG analysis and discussion of hydrothermally carbonized forestry residues. Yang et al. [49] stated that the hydrolysis residues have been utilized as an additive for solid fuel. They performed the TGA and DTG analysis up to 700 °C and found similar trends in the thermal decomposition behavior curves.

3.9. Deconvolution

The deconvolution process separates overlapping peaks into individual fitted peaks, each representing a distinct thermal decomposition event. Different colors are used to describe these fitted peaks, labeled as Fit Peak 1, 2, 3, etc., and the cumulative fit is shown as a red curve (Figure 8). The number of peaks varies with the sample, indicating changes in the complexity of the decomposition process. For instance, LRR280 has six peaks, while LRR200 and LRR220 have four. The peak positions and intensities vary across the samples, indicating that the samples’ thermal stability and composition change with the HTC conditions [52]. The red curve aligns closely with the experimental data (black curve), indicating the accuracy of the deconvolution process.
As the HTC temperature increases, for example, from LRR200 to LRR280, aromaticity tends to increase while oxygenated functional groups become less prominent. This leads to higher thermal stability, as evident from the shift in peaks to higher temperatures in the LRR280 sample. Lower-temperature peaks (e.g., Fit Peak 1 and 2) may correspond to the loss of volatile compounds and light oxygenated species. Intermediate peaks might represent the decomposition of hemicellulose, cellulose, or partially carbonized biomass [53]. Higher-temperature peaks (e.g., Fit Peak 5 or 6) could be attributed to decomposing more thermally stable components, such as lignin or highly aromatic structures [53]. The increase in the number of peaks in LRR240, LRR260, and LRR280 suggests that the structure of the carbonized material becomes more complex with higher HTC temperatures, likely due to polymerization and aromatization. The progression from LRR to LRR280 indicates that the HTC process modifies the biomass progressively, forming materials with different thermal decomposition behaviors. The deconvolution of DTG curves highlights the thermal decomposition characteristics of HTC samples, reflecting changes in composition and stability with varying HTC temperatures. Higher HTC temperatures typically lead to materials with increased thermal stability and complexity, which is evident in the LRR280 sample. The close match between the cumulative fit and the experimental data confirms the deconvolution accuracy. Similarly, Soh et al. [53] studied the deconvolution of DTG peaks of five oil palm biomasses, and a similar discussion was recorded.

3.10. Reaction Mechanism

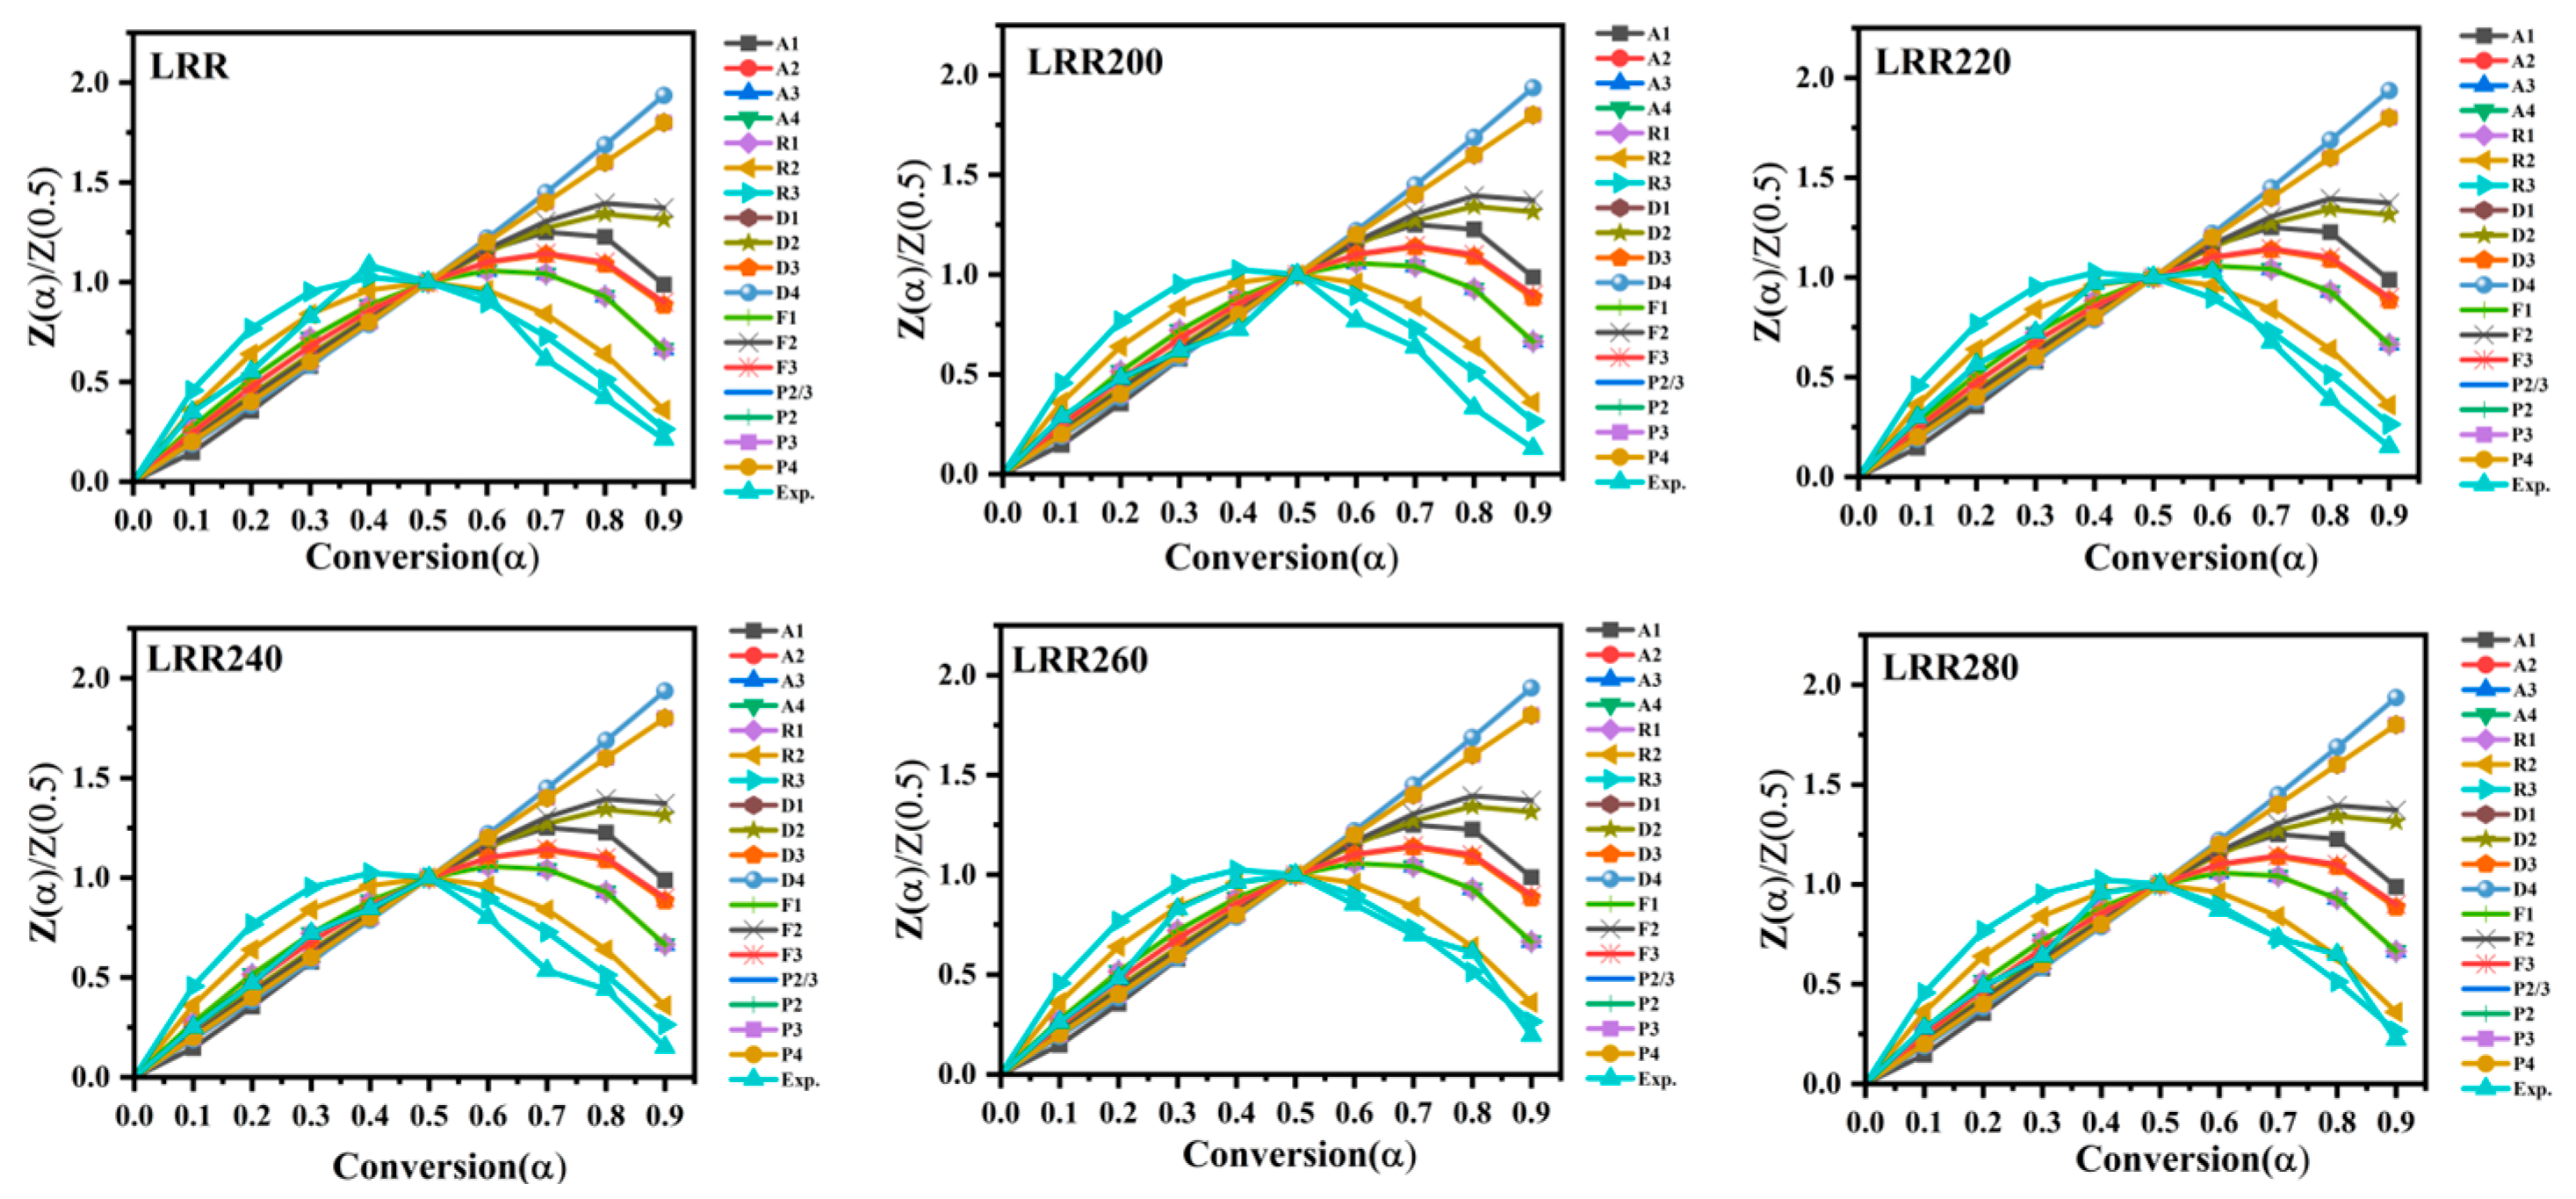
During biomass pyrolysis, chemical reactions among different components compete, while physical diffusion effects also play a role [54]. To investigate the pyrolysis mechanism, master plots were employed, as illustrated in Figure 9. The experimental curve was enclosed within various theoretical curves, allowing for comparison. The theoretical expressions and their corresponding reaction models are available in the literature [28,45]. The Criado method was utilized to determine the dominant reaction mechanism for the pyrolysis of LRR and its HTC samples at different conversion levels, with a heating rate of 10 °C/min. The master plots corresponding to various reaction mechanisms are depicted in Figure 9, covering all individual biomass samples and their HTC samples within the conversion range α = 0.1 to 0.9.
Figure 9 shows that the degradation profiles of raw LRR and LRR260 samples closely align with the theoretical D3 mechanism (three-dimensional diffusion, Jander model) for α ≤ 0.2. Interestingly, for α ≤ 0.3, the degradation profile of LRR200 also exhibits the closest match with the D3 master plot. Similarly, for α ≤ 0.5, the degradation profiles of LRR220, LRR240, and LRR280 conform to the D3 mechanism. The D3 model suggests that a product layer forms around the reacting particles, slowing the reaction rate down. This is described by the parabolic rate equation, which is particularly relevant in the early stage of the reaction [45,55]. During pyrolysis, cellulose decomposition releases a significant amount of biogas, inducing diffusion effects [49,56]. The D3 mechanism is characteristic of solid-state reactions where diffusion is the dominant process. The physical phenomena underlying this mechanism could involve heat diffusion from an external heat source into biomass particles or the diffusion of hot product gases out of the sample. As the conversion progresses, the product layer thickens around the particle, hindering the diffusion of reactants to the solid surface. As a result, the rate of product formation decreases proportionally with the increasing thickness of the product layer.
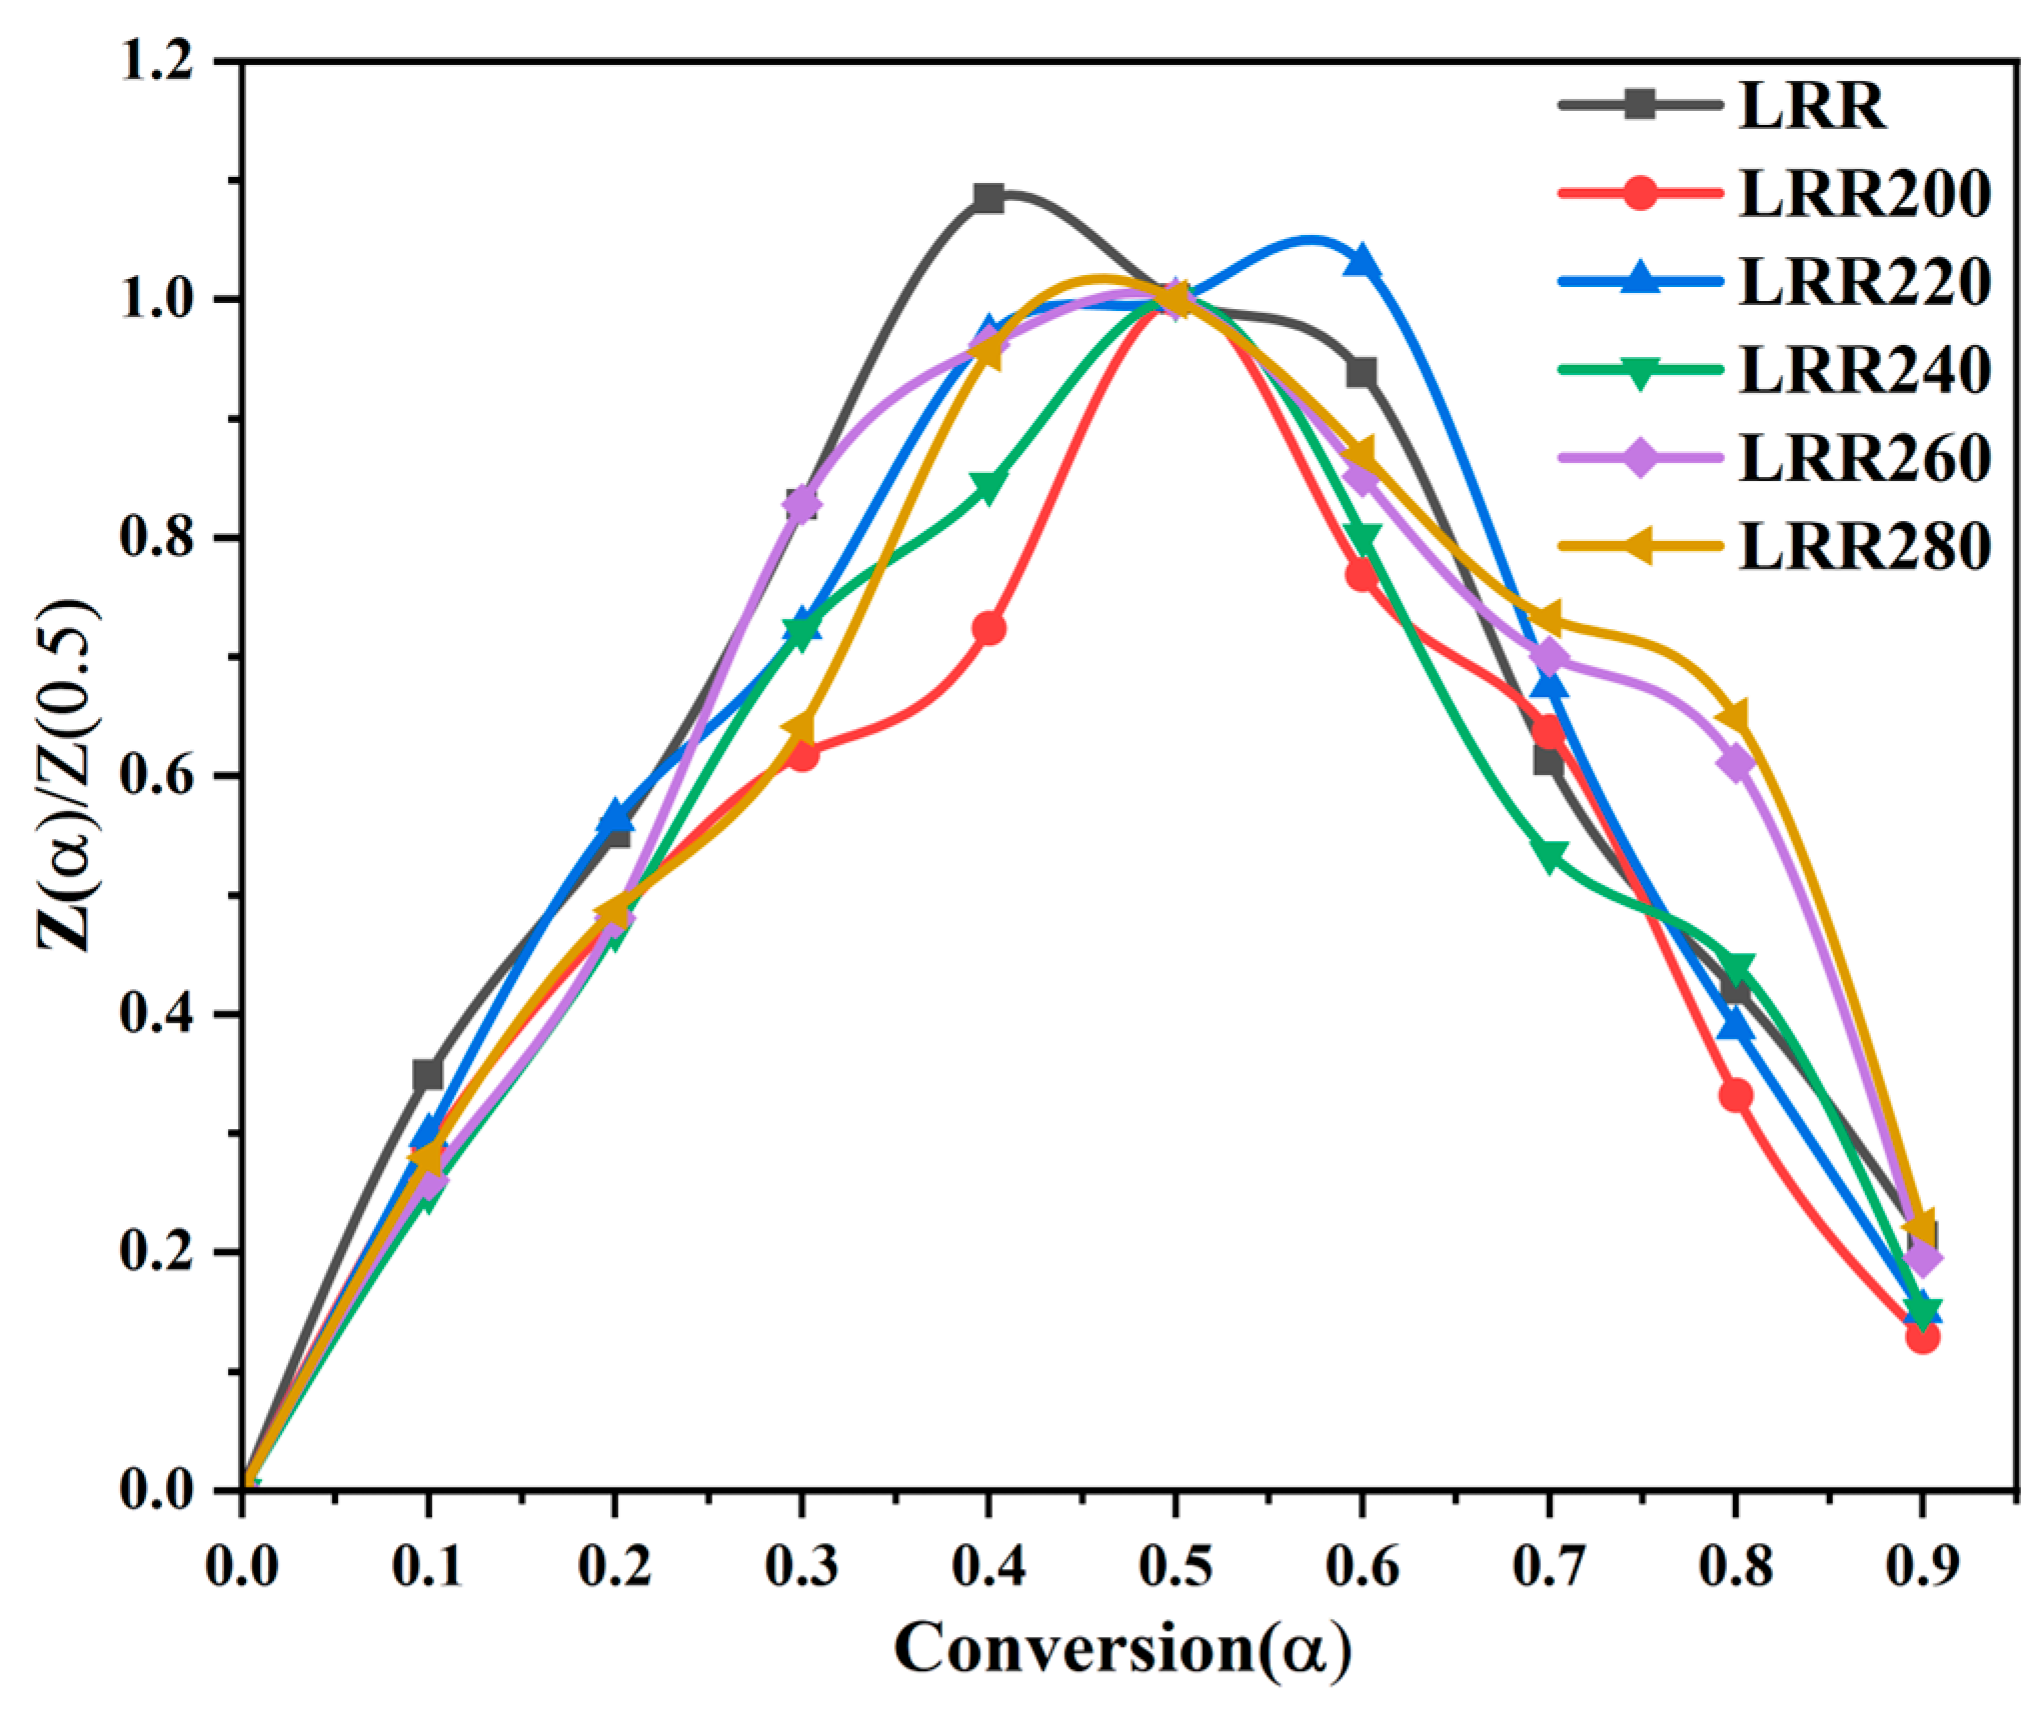
For the conversion range 0.5 < α ≤ 0.9, the experimental degradation profiles of LRR and its HTC blends exhibit the closest match with the master plots corresponding to either R2 (second-order random nucleation, two nucleation sites per particle) or R3 (third-order random nucleation, three nucleation sites per particle) mechanisms. In the R2 mechanism, degradation initiates at random points on the particle surface, which serve as growth centers for the propagation of the degradation reaction [57]. This leads to faster biomass decomposition, as increased growth centers accelerate the breakdown of biomass structures. The degradation reaction primarily involves the rupture of ordered cellulose chains, facilitating rapid thermal decomposition. For higher conversion levels (α > 0.5), where temperatures exceed 350 °C, the elevated thermal conditions can enhance the rupture of ordered cellulose chains, forming low-molecular-weight fragments. These fragments may then act as new nucleation sites, promoting further random nucleation and growth of degradation reactions. Additionally, the amorphous cellulose domain can contribute to this process by serving as an active center for degradation, thereby accelerating the overall decomposition. The experimental reaction mechanism curves for all the samples are depicted in Figure 10, which shows the effect of HTC temperature on the reaction mechanism of the raw LRR and their HTC samples. It can be inferred from Figure 10 that up to 10% conversion, the pyrolysis follows the same reaction mechanism, which is attributed to the moisture removal and other light volatile matter devolatilization, irrespective of HTC temperature. After this conversion level, it follows the different reaction paths for decomposition, it is due to the variation in HTC temperature on hydrochar samples.

4. Conclusions

This study investigated the potential valorization of lignin-rich solid residues generated from the enzymatic hydrolysis of forest residues through HTC for solid fuel production. HTC was conducted at 200–280 °C for 1 h. The results indicate that the temperature significantly affects the structural, chemical, and thermal properties of the resulting hydrochars, as evidenced by an increase in FC and ED, along with a decrease in VM. Higher temperatures promote dehydration and decarboxylation reactions, leading to enhanced aromatic condensation and carbon enrichment within the resulting hydrochar. Consequently, the hydrochar yield decreased to 51.43% at 280 °C, while the energy density and fixed carbon content increased due to progressive carbonization. The atomic H/C and O/C ratios declined from 1.26 and 0.81 in the raw LRR to 0.95 and 0.26 in highly carbonized hydrochar, respectively, resulting in an increase in heating value from 15.88 to 27.88 MJ/kg at 260 °C. This substantial improvement can be attributed to the continuing elimination of oxygenated functional groups, the thermal degradation of low-energy chemical bonds, and the formation of higher-energy carbon-rich structures during HTC. These findings confirm that HTC effectively enhances the fuel quality, and temperature plays a critical role in hydrochar properties. The novelty of this study lies in demonstrating, for the first time, the efficient conversion of lignin-rich enzymatic hydrolysis residues, a byproduct of biochemical conversion that is typically underutilized, into high-quality hydrochar. The resulting hydrochar confirms promise for use as a renewable solid fuel or as a precursor for activated carbon and other carbon-based materials. The TGA and DTG analyses revealed distinct differences in the thermal behavior of LRRs and the hydrochars, primarily due to variations in their VM and FC content. The HTC process induced morphological transformations in the LRR, impacting its surface area and porosity. Both the pore volume and the specific surface area, measured via BET analysis, initially increase with temperature and then decrease. The specific surface area reaches its maximum value of 2.66 m2/g at 200 °C. The FTIR analysis confirmed that dehydration and decarboxylation occurred during the HTC process. It is also revealed that while lignin remained structurally stable, cellulose underwent activation followed by decomposition as the HTC temperature increased, further highlighting lignin’s superior thermal stability. These findings reinforce the potential of HTC as an efficient method for converting LRRs into a high-quality solid fuel. However, the present study focused primarily on hydrochar production and its characterization, without quantifying liquid or gaseous products, which is a limitation of this study. Future work will extend to mass balance closure, kinetic modeling, and techno-economic analysis to find the scope for the large-scale feasibility of HTC of lignin-rich residues.

Author Contributions

M.K.: methodology, formal analysis, investigation, and writing—original draft. R.C.: investigation. M.S.H.: investigation. T.R.: methodology and writing—review & editing. T.A.V.: methodology, resources, and funding acquisition. A.J.: conceptualization, methodology, supervision, writing (review & editing), and funding acquisition. D.K.: conceptualization, methodology, data curation, validation, writing (review & editing), supervision, and funding acquisition. All authors have read and agreed to the published version of the manuscript.

Funding

This work was financially supported by: (i) “USDA Partnerships for Climate-Smart Commodities” under NYS Dept. of Environmental Conservation MOU AM12965, and (ii) the Northeastern States Research Cooperative (NSRC).

Data Availability Statement

The datasets generated and analyzed during the current study are available from the corresponding author upon reasonable request.

Acknowledgments

The authors extend their sincere gratitude to the Bioinspired Institute’s Materials Research Core Facility at Syracuse University, Syracuse, New York, for facilitating the analysis of biomass samples and providing access to essential research facilities.

Conflicts of Interest

The authors declare no conflicts of interest.

References

  1. Luo, J.; Lin, Z.; Xie, T.; Chen, J.; Zhang, Y.; Li, P. Valorization of Kitchen Waste Hydrolysis Residue for Green Solid Fuel Application: Conversion Mechanism and Fuel Characteristics. Fuel 2024, 375, 132556. [Google Scholar] [CrossRef]
  2. Sekoai, P.T.; Ouma, C.N.M.; du Preez, S.P.; Modisha, P.; Engelbrecht, N.; Bessarabov, D.G.; Ghimire, A. Application of Nanoparticles in Biofuels: An Overview. Fuel 2019, 237, 380–397. [Google Scholar] [CrossRef]
  3. Liu, H.; Li, J. Environmental Consequences of Fuel Price Shocks in China. China Econ. Rev. 2023, 80, 102018. [Google Scholar] [CrossRef]
  4. Xu, Z.; Qi, R.; Xiong, M.; Zhang, D.; Gu, H.; Chen, W. Conversion of Cotton Textile Waste to Clean Solid Fuel via Surfactant-Assisted Hydrothermal Carbonization: Mechanisms and Combustion Behaviors. Bioresour. Technol. 2021, 321, 124450. [Google Scholar] [CrossRef]
  5. Huang, W.; Zheng, D.; Chen, X.; Shi, L.; Dai, X.; Chen, Y.; Jing, X. Standard Thermodynamic Properties for the Energy Grade Evaluation of Fossil Fuels and Renewable Fuels. Renew. Energy 2020, 147, 2160–2170. [Google Scholar] [CrossRef]
  6. Hossain, M.S.; Therasme, O.; Volk, T.A.; Kumar, V.; Kumar, D. Optimization of Combined Hydrothermal and Mechanical Refining Pretreatment of Forest Residue Biomass for Maximum Sugar Release during Enzymatic Hydrolysis. Energies 2024, 17, 4929. [Google Scholar] [CrossRef]
  7. Liang, W.; Wang, G.; Xu, R.; Ning, X.; Zhang, J.; Guo, X.; Ye, L.; Li, J.; Jiang, C.; Wang, P.; et al. Hydrothermal Carbonization of Forest Waste into Solid Fuel: Mechanism and Combustion Behavior. Energy 2022, 246, 123343. [Google Scholar] [CrossRef]
  8. Stafford, W.; De Lange, W.; Nahman, A.; Chunilall, V.; Lekha, P.; Andrew, J.; Johakimu, J.; Sithole, B.; Trotter, D. Forestry Biorefineries. Renew. Energy 2020, 154, 461–475. [Google Scholar] [CrossRef]
  9. Sun, Y.; Cheng, J. Hydrolysis of Lignocellulosic Materials for Ethanol Production: A Review. Bioresource 2002, 83, 1–11. [Google Scholar] [CrossRef]
  10. Jørgensen, H.; Kristensen, J.B.; Felby, C. Enzymatic Conversion of Lignocellulose into Fermentable Sugars: Challenges and Opportunities. Biofuels Bioprod. Biorefin. 2007, 1, 119–134. [Google Scholar] [CrossRef]
  11. Hendriks, A.T.W.M.; Zeeman, G. Pretreatments to Enhance the Digestibility of Lignocellulosic Biomass. Bioresour. Technol. 2009, 100, 10–18. [Google Scholar] [CrossRef]
  12. Vázquez, V.; Giorgi, V.; Bonfiglio, F.; Menéndez, P.; Gioia, L.; Ovsejevi, K. Lignocellulosic Residues from Bioethanol Production: A Novel Source of Biopolymers for Laccase Immobilization. RSC Adv. 2023, 13, 13463–13471. [Google Scholar] [CrossRef]
  13. Zhuang, X.; Zhan, H.; Huang, Y.; Song, Y.; Yin, X.; Wu, C. Conversion of Industrial Biowastes to Clean Solid Fuels via Hydrothermal Carbonization (HTC): Upgrading Mechanism in Relation to Coalification Process and Combustion Behavior. Bioresour. Technol. 2018, 267, 17–29. [Google Scholar] [CrossRef] [PubMed]
  14. Gu, L.; Li, B.; Wen, H.; Zhang, X.; Wang, L.; Ye, J. Co-Hydrothermal Treatment of Fallen Leaves with Iron Sludge to Prepare Magnetic Iron Product and Solid Fuel. Bioresour. Technol. 2018, 257, 229–237. [Google Scholar] [CrossRef]
  15. Pstrowska, K.; Łużny, R.T.; Fałtynowicz, H.; Jaroszewska, K.; Postawa, K.; Pyshyev, S.; Witek-Krowiak, A. Unlocking Sustainability: A Comprehensive Review of Up-Recycling Biomass Waste into Biochar for Environmental Solutions. Chem. Chem. Technol. 2024, 18, 211–231. [Google Scholar] [CrossRef]
  16. Pyshyev, S.; Miroshnichenko, D.; Malik, I.; Bautista Contreras, A.; Hassan, N.; Abd Elrasoul, A. State of the Art in the Production of Charcoal: A Review. Chem. Chem. Technol. 2021, 15, 61–73. [Google Scholar] [CrossRef]
  17. Liu, F.; Yu, R.; Guo, M. Hydrothermal Carbonization of Forestry Residues: Influence of Reaction Temperature on Holocellulose-Derived Hydrochar Properties. J. Mater. Sci. 2017, 52, 1736–1746. [Google Scholar] [CrossRef]
  18. Lee, J.; Lee, K.; Sohn, D.; Kim, Y.M.; Park, K.Y. Hydrothermal Carbonization of Lipid Extracted Algae for Hydrochar Production and Feasibility of Using Hydrochar as a Solid Fuel. Energy 2018, 153, 913–920. [Google Scholar] [CrossRef]
  19. Funke, A.; Ziegler, F. Hydrothermal Carbonization of Biomass: A Summary and Discussion of Chemical Mechanisms for Process Engineering. Biofuels Bioprod. Biorefin. 2010, 4, 160–177. [Google Scholar] [CrossRef]
  20. Kannan, S.; Gariepy, Y.; Raghavan, V. Optimization of Enzyme Hydrolysis of Seafood Waste for Microwave Hydrothermal Carbonization. Energy Fuels 2015, 29, 8006–8016. [Google Scholar] [CrossRef]
  21. Phang, F.J.F.; Tiong, S.I.X.; Wang, Y.S.; Soh, M.; Chew, J.J.; Khaerudini, D.S.; Thangalazhy-Gopakumar, S.; How, B.S.; Loh, S.K.; Yusup, S.; et al. Hydrochars Derived via Wet Torrefaction of Empty Fruit Bunches: Effect of Temperature and Time, Comparison to Oil Palm Trunks Counterpart, and Their Pyrolysis Behavior. J. Anal. Appl. Pyrolysis 2024, 179, 106441. [Google Scholar] [CrossRef]
  22. Sluiter, A.; Hames, B.; Ruiz, R.; Scarlata, C.; Sluiter, J.; Templeton, D.; Crocker, D. Determination of Structural Carbohydrates and Lignin in Biomass; NREL/TP-510-42618; Laboratory Analytical Procedure (LAP), National Renewable Energy Laboratory: Golden, CO, USA, 2008. Available online: https://www.nrel.gov/docs/gen/fy13/42618.pdf (accessed on 21 October 2025).
  23. Kojić, M.M.; Petrović, J.T.; Petrović, M.S.; Stanković, S.M.; Porobić, S.J.; Marinović-Cincović, M.T.; Mihajlović, M.L. Hydrothermal Carbonization of Spent Mushroom Substrate: Physicochemical Characterization, Combustion Behavior, Kinetic and Thermodynamic Study. J. Anal. Appl. Pyrolysis 2021, 155, 105028. [Google Scholar] [CrossRef]
  24. Yu, Y.; Lei, Z.; Yang, X.; Yang, X.; Huang, W.; Shimizu, K.; Zhang, Z. Hydrothermal Carbonization of Anaerobic Granular Sludge: Effect of Process Temperature on Nutrients Availability and Energy Gain from Produced Hydrochar. Appl. Energy 2018, 229, 88–95. [Google Scholar] [CrossRef]
  25. ASTM D1762-84; Standard Test Method for Chemical Analysis of Wood Charcoal. ASTM International: West Conshohocken, PA, USA, 2021.
  26. Kambo, H.S.; Dutta, A. Strength, Storage, and Combustion Characteristics of Densified Lignocellulosic Biomass Produced via Torrefaction and Hydrothermal Carbonization. Appl. Energy 2014, 135, 182–191. [Google Scholar] [CrossRef]
  27. Zhang, L.; Wang, Q.; Wang, B.; Yang, G.; Lucia, L.A.; Chen, J. Hydrothermal Carbonization of Corncob Residues for Hydrochar Production. Energy Fuels 2015, 29, 872–876. [Google Scholar] [CrossRef]
  28. Criado, J.M.; Málek, J.; Ortega, A. Applicability of the Master Plots in Kinetic Analysis of Non-Isothermal Data. Thermochim. Acta 1989, 147, 377–385. [Google Scholar] [CrossRef]
  29. Mishra, R.K.; Mohanty, K. Thermocatalytic Conversion of Non-Edible Neem Seeds towards Clean Fuel and Chemicals. J. Anal. Appl. Pyrolysis 2018, 134, 83–92. [Google Scholar] [CrossRef]
  30. Kumar, M.; Upadhyay, S.N.; Mishra, P.K. Effect of Montmorillonite Clay on Pyrolysis of Paper Mill Waste. Bioresour. Technol. 2020, 307, 123161. [Google Scholar] [CrossRef]
  31. He, Q.; Gong, Y.; Ding, L.; Guo, Q.; Yoshikawa, K.; Yu, G. Reactivity Prediction and Mechanism Analysis of Raw and Demineralized Coal Char Gasification. Energy 2021, 229, 120724. [Google Scholar] [CrossRef]
  32. Eom, I.Y.; Yu, J.H. Structural Characterization of the Solid Residue Produced by Hydrothermal Treatment of Sunflower Stalks and Subsequent Enzymatic Hydrolysis. J. Ind. Eng. Chem. 2015, 23, 72–78. [Google Scholar] [CrossRef]
  33. Ul Saqib, N.; Sarmah, A.K.; Baroutian, S. Effect of Temperature on the Fuel Properties of Food Waste and Coal Blend Treated under Co-Hydrothermal Carbonization. Waste Manag. 2019, 89, 236–246. [Google Scholar] [CrossRef]
  34. Reza, M.T.; Uddin, M.H.; Lynam, J.G.; Hoekman, S.K.; Coronella, C.J. Hydrothermal Carbonization of Loblolly Pine: Reaction Chemistry and Water Balance. Biomass Convers. Biorefinery 2014, 4, 311–321. [Google Scholar] [CrossRef]
  35. Pińkowska, H.; Wolak, P.; Złocińska, A. Hydrothermal Decomposition of Xylan as a Model Substance for Plant Biomass Waste—Hydrothermolysis in Subcritical Water. Biomass Bioenergy 2011, 35, 3902–3912. [Google Scholar] [CrossRef]
  36. Fan, F.; Yang, Z.; Li, H.; Shi, Z.; Kan, H. Preparation and Properties of Hydrochars from Macadamia Nut Shell via Hydrothermal Carbonization. R. Soc. Open Sci. 2018, 5, 181126. [Google Scholar] [CrossRef]
  37. Lin, Y.; Ma, X.; Peng, X.; Hu, S.; Yu, Z.; Fang, S. Effect of Hydrothermal Carbonization Temperature on Combustion Behavior of Hydrochar Fuel from Paper Sludge. Appl. Therm. Eng. 2015, 91, 574–582. [Google Scholar] [CrossRef]
  38. Li, H.; Wang, S.; Yuan, X.; Xi, Y.; Huang, Z.; Tan, M.; Li, C. The Effects of Temperature and Color Value on Hydrochars’ Properties in Hydrothermal Carbonization. Bioresour. Technol. 2018, 249, 574–581. [Google Scholar] [CrossRef] [PubMed]
  39. Liu, Z.; Quek, A.; Kent Hoekman, S.; Balasubramanian, R. Production of Solid Biochar Fuel from Waste Biomass by Hydrothermal Carbonization. Fuel 2013, 103, 943–949. [Google Scholar] [CrossRef]
  40. Reza, M.T.; Coronella, C.; Holtman, K.M.; Franqui-Villanueva, D.; Poulson, S.R. Hydrothermal Carbonization of Autoclaved Municipal Solid Waste Pulp and Anaerobically Treated Pulp Digestate. ACS Sustain. Chem. Eng. 2016, 4, 3649–3658. [Google Scholar] [CrossRef]
  41. Hoekman, S.K.; Broch, A.; Robbins, C. Hydrothermal Carbonization (HTC) of Lignocellulosic Biomass. Energy Fuels 2011, 25, 1802–1810. [Google Scholar] [CrossRef]
  42. Yang, W.; Wang, H.; Zhang, M.; Zhu, J.; Zhou, J.; Wu, S. Fuel Properties and Combustion Kinetics of Hydrochar Prepared by Hydrothermal Carbonization of Bamboo. Bioresour. Technol. 2016, 205, 199–204. [Google Scholar] [CrossRef]
  43. Wang, Q.; Sarkar, J. Pyrolysis Behaviors of Waste Coconut Shell and Husk Biomasses. Int. J. Energy Prod. Mgmt. 2018, 3, 34–43. [Google Scholar] [CrossRef]
  44. Wang, Z.; Bui, Q.; Zhang, B.; Pham, T.L.H. Biomass Energy Production and Its Impacts on the Ecological Footprint: An Investigation of the G7 Countries. Sci. Total Environ. 2020, 743, 140741. [Google Scholar] [CrossRef]
  45. He, Q.; Cheng, C.; Raheem, A.; Ding, L.; Shiung Lam, S.; Yu, G. Effect of Hydrothermal Carbonization on Woody Biomass: From Structure to Reactivity. Fuel 2022, 330, 125586. [Google Scholar] [CrossRef]
  46. Santos Santana, M.; Pereira Alves, R.; da Silva Borges, W.M.; Francisquini, E.; Guerreiro, M.C. Hydrochar Production from Defective Coffee Beans by Hydrothermal Carbonization. Bioresour. Technol. 2020, 300, 122653. [Google Scholar] [CrossRef]
  47. Thiru, S.; Kola, R.; Thimmaraju, M.K.; Dhanalakshmi, C.S.; Sharma, V.; Sakthi, P.; Maguluri, L.P.; Ranganathan, L.; Lalvani, J.I.J.R. An Analytical Characterization Study on Biofuel Obtained from Pyrolysis of Madhuca longifolia Residues. Sci. Rep. 2024, 14, 14745. [Google Scholar] [CrossRef] [PubMed]
  48. Atallah, E.; Zeaiter, J.; Ahmad, M.N.; Leahy, J.J.; Kwapinski, W. Hydrothermal Carbonization of Spent Mushroom Compost Waste Compared against Torrefaction and Pyrolysis. Fuel Process. Technol. 2021, 216, 106795. [Google Scholar] [CrossRef]
  49. Yang, Y.; Zhao, J.; Zhang, M.; Wang, D. Utilizing Hydrolysis Residue from Bioethanol Production as an Additive for Solid Fuel Pellets. Fuel 2023, 348, 128582. [Google Scholar] [CrossRef]
  50. Ma, L.; Goldfarb, J.L.; Song, J.; Chang, C.; Ma, Q. Enhancing Cleaner Biomass-Coal Co-Combustion by Pretreatment of Wheat Straw via Washing versus Hydrothermal Carbonization. J. Clean. Prod. 2022, 366, 132991. [Google Scholar] [CrossRef]
  51. Wang, G.; Zhang, J.; Lee, J.Y.; Mao, X.; Ye, L.; Xu, W.; Ning, X.; Zhang, N.; Teng, H.; Wang, C. Hydrothermal Carbonization of Maize Straw for Hydrochar Production and Its Injection for Blast Furnace. Appl. Energy 2020, 266, 114818. [Google Scholar] [CrossRef]
  52. Patil, Y.; Ku, X. Pyrolysis Kinetics and Thermodynamic Behavior of Pseudo Components of Raw and Torrefied Maple Wood. Energy Sources Part A Recovery Util. Environ. Eff. 2024, 46, 462–474. [Google Scholar] [CrossRef]
  53. Soh, M.; Chew, J.J.; Liu, S.; Sunarso, J. Comprehensive Kinetic Study on the Pyrolysis and Combustion Behaviours of Five Oil Palm Biomass by Thermogravimetric-Mass Spectrometry (TG-MS) Analyses. Bioenergy Res. 2019, 12, 370–387. [Google Scholar] [CrossRef]
  54. Lopez-Velazquez, M.A.; Santes, V.; Balmaseda, J.; Torres-Garcia, E. Pyrolysis of Orange Waste: A Thermo-Kinetic Study. J. Anal. Appl. Pyrolysis 2013, 99, 170–177. [Google Scholar] [CrossRef]
  55. Mallick, D.; Poddar, M.K.; Mahanta, P.; Moholkar, V.S. Discernment of Synergism in Pyrolysis of Biomass Blends Using Thermogravimetric Analysis. Bioresour. Technol. 2018, 261, 294–305. [Google Scholar] [CrossRef]
  56. Mishra, G.; Kumar, J.; Bhaskar, T. Kinetic Studies on the Pyrolysis of Pinewood. Bioresour. Technol. 2015, 182, 282–288. [Google Scholar] [CrossRef]
  57. Poletto, M.; Zattera, A.J.; Santana, R.M.C. Thermal Decomposition of Wood: Kinetics and Degradation Mechanisms. Bioresour. Technol. 2012, 126, 7–12. [Google Scholar] [CrossRef]
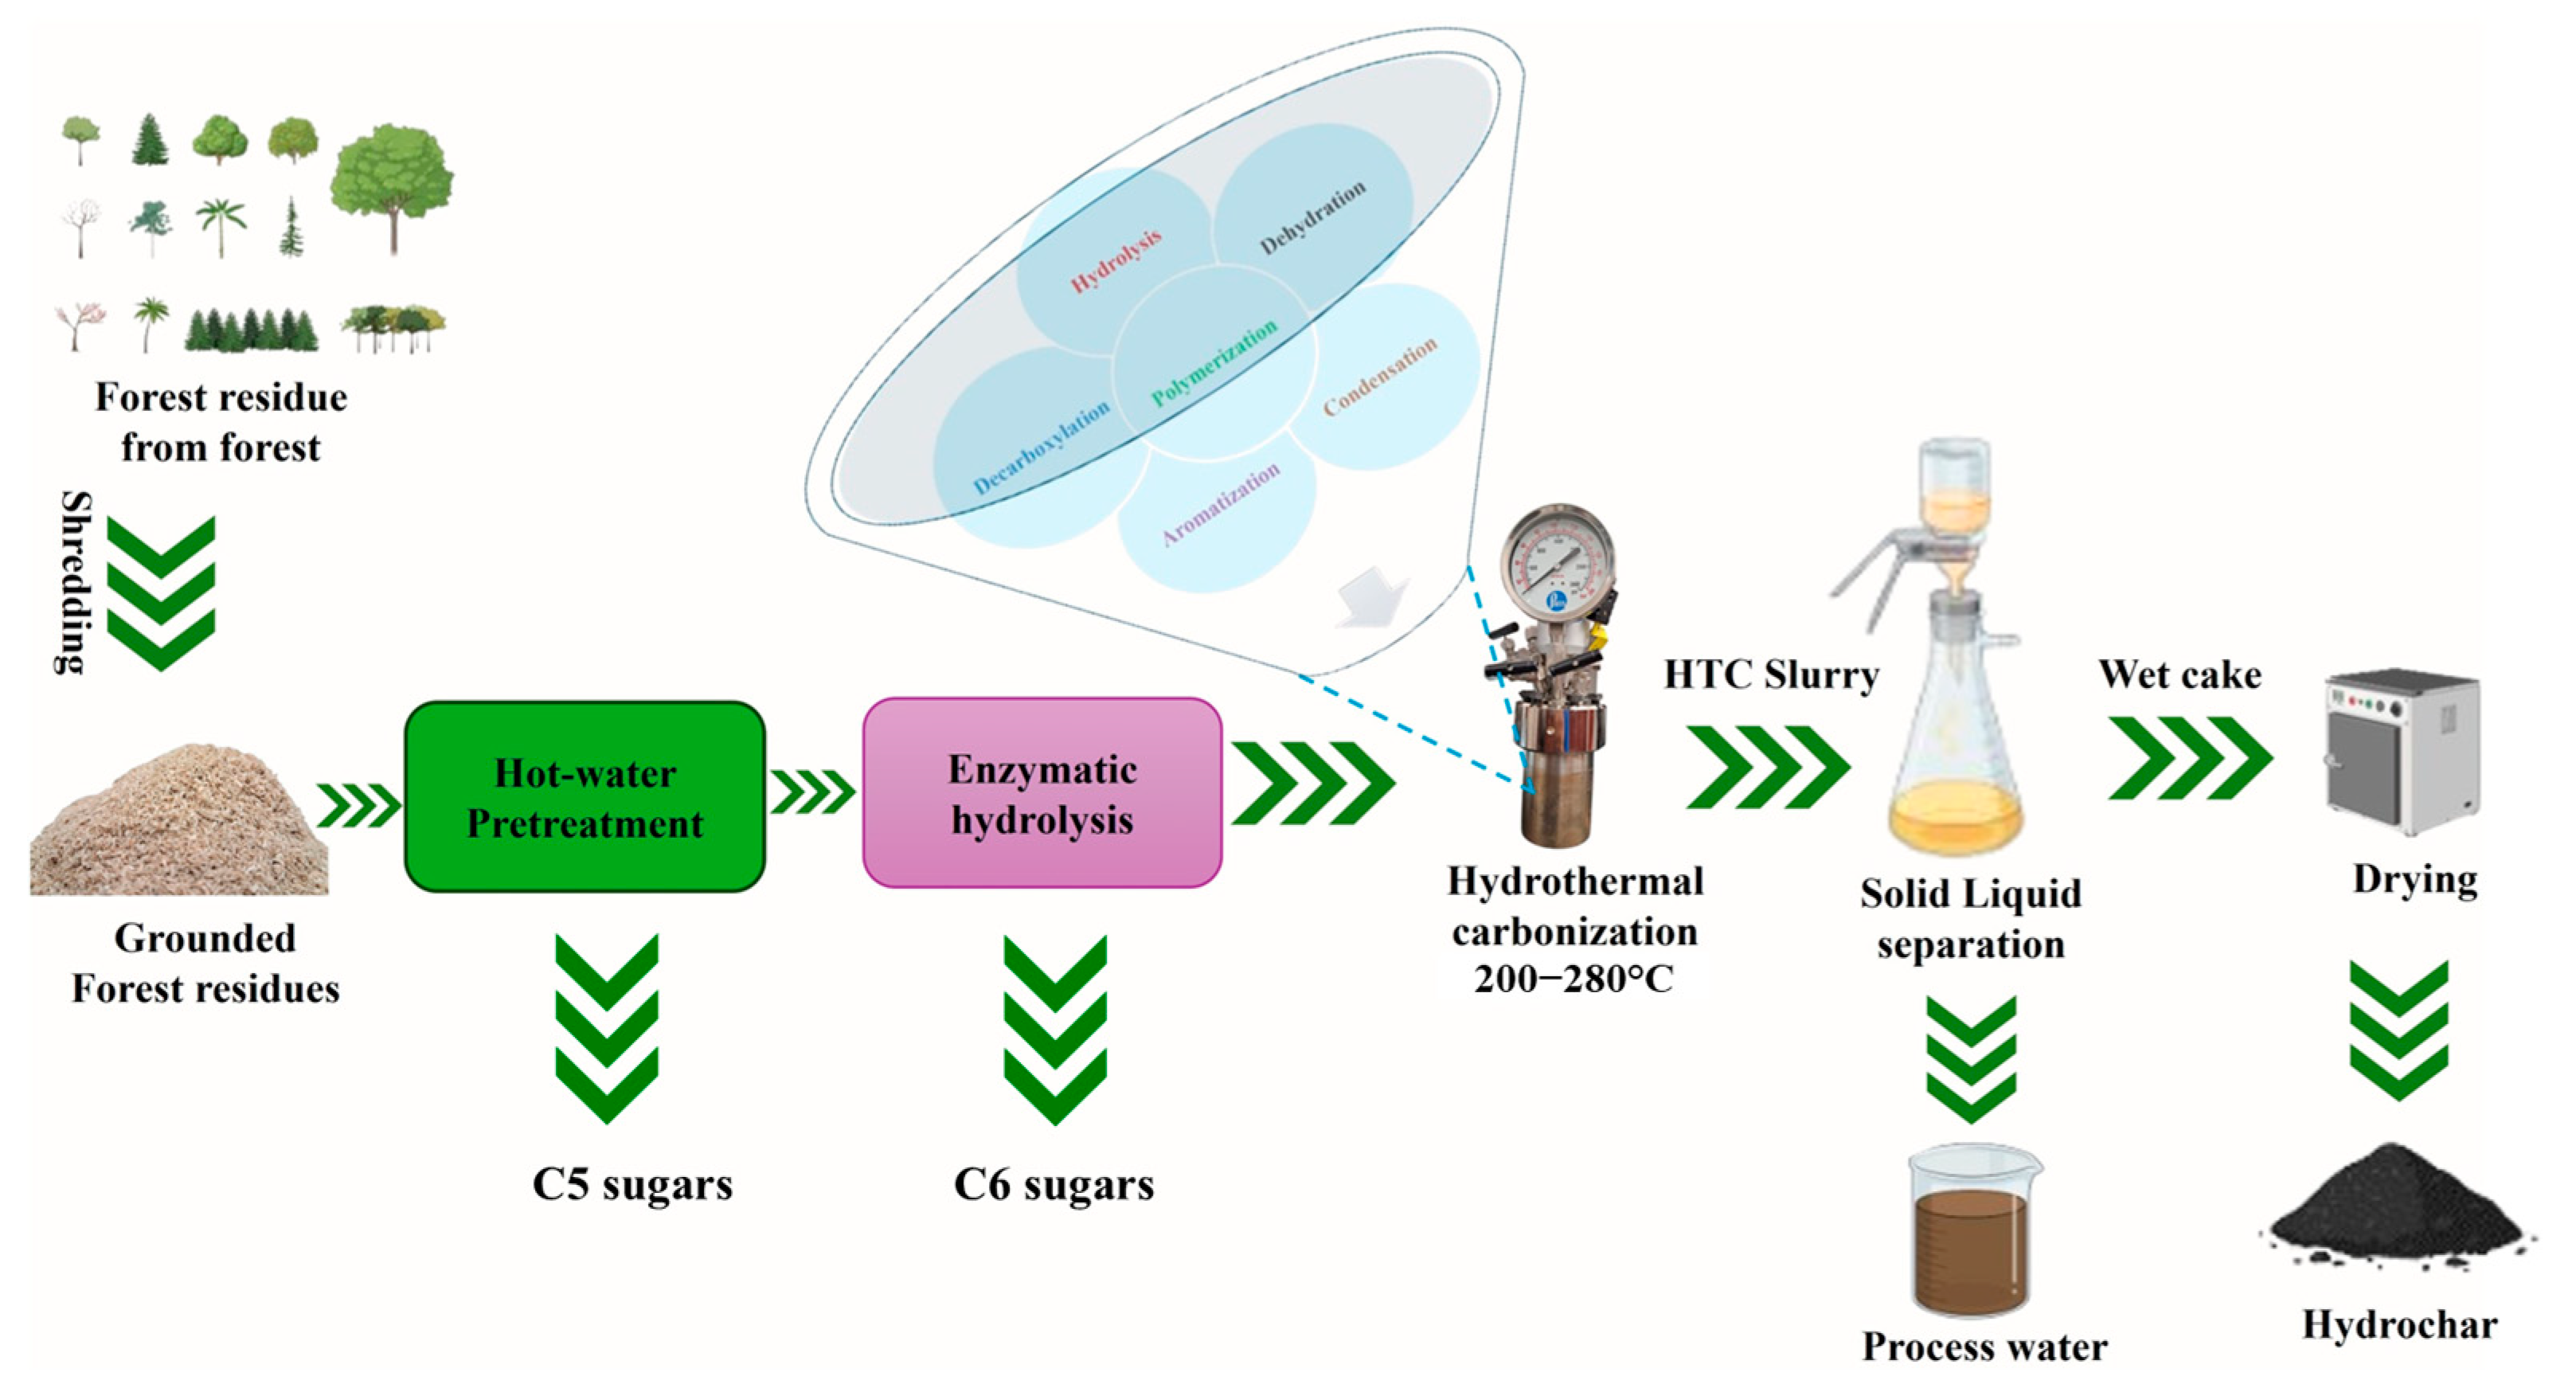
Figure 1. Overall procedure of hydrochar production from forest residues.
Energies 18 06156 g001
Figure 2. The appearances of hydrochars derived from LRR at various temperatures.
Energies 18 06156 g002
Figure 3. Results of the impact of HTC temperatures on (a) Hydrochar yield, (b) Ultimate analysis results, (c) Higher heating values (HHV) of the samples, and (d) Van Krevelen diagram illustrating the relationship between H/C and O/C atomic ratios. For (a,c), means and standard deviations are reported for three replications.
Energies 18 06156 g003
Figure 4. FTIR spectra of lignin-rich residues (LRR) and their hydrothermally carbonized (HTC) hydrochar LRR200, LRR220, LRR240, LRR260, and LRR280.
Energies 18 06156 g004
Figure 5. SEM images of lignin-rich residues (LRR) and their hydrothermally carbonized (HTC) hydrochar LRR200, LRR220, LRR240, LRR260, LRR280.
Energies 18 06156 g005
Figure 6. (a) TG and (b) DTG analysis of different HTC samples.
Energies 18 06156 g006
Figure 7. TGA and DTG analysis of LRR and HTC samples at the heating rate of 10 °C/min.
Energies 18 06156 g007
Figure 8. Deconvoluted DTG curves under different nitrogen atmospheres at a heating rate of 10 °C/min of LRR and corresponding HTC samples at various temperatures.
Energies 18 06156 g008
Figure 9. Reaction mechanism of LRR and HTC samples at a heating rate of 10 °C/min.
Energies 18 06156 g009
Figure 10. Experimental reaction mechanism of LRR and HTC samples at a heating rate of 10 °C/min.
Energies 18 06156 g010
Table 1. HTC experimental conditions and hydrochar yields.
SamplesReaction Conditions
Temperature (°C)Avg Heating Rate (°C/min)Avg Pressure (Bar)Holding Time (min)
LRR----
LRR2002004.1317.0060
LRR2202204.0420.0060
LRR2402403.6935.0060
LRR2602603.6645.5060
LRR2802803.5467.0060
Table 2. Physicochemical properties of LRR, LRR200, LRR220, LRR240, LRR260 and LRR280 on a dry basis #.
ParametersLRRLRR200LRR220LRR240LRR260LRR280
Hydrochar yield (wt.%, dry basis)-69.64 ± 0.85 a66.20 ± 0.57 b62.16 ± 0.75 c55.14 ± 2.09 d51.43 ± 0.48 d
Organic mass (wt.%, dry basis)97.8167.9464.4960.6135.5549.80
Organic yield (wt.%, dry basis)10069.4665.9361.9754.7550.91
Ash yield (wt.%, dry basis)10077.6378.0870.7873.5274.43
Proximate analysis (wt.%, dry basis)
Volatile matter 68.90 ± 0.2167.73 ± 0.7863.92 ± 0.0762.22 ± 0.1057.75 ± 1.6956.22 ± 0.73
Fixed carbon28.91 ± 0.2230.57 ± 0.7834.37 ± 0.0836.22 ± 0.1340.64 ± 1.6842.15 ± 0.73
Ash content2.19 ± 0.041.70 ± 0.021.70 ± 0.051.55 ± 0.081.61 ± 0.091.63 ± 0.03
Ultimate analysis (wt.%, dry basis)
C44.17 ± 0.2161.46 ± 0.5563.46 ± 0.6165.50 ± 0.1666.98 ± 0.2366.55 ± 2.38
H4.64 ± 0.175.61 ± 0.055.47 ± 0.145.45 ± 0.005.32 ± 0.005.33 ± 0.11
N1.07 ± 0.030.97 ± 0.021.00 ± 0.031.13 ± 0.021.06 ± 0.001.05 ± 0.02
O48.01 ± 0.1330.26 ± 0.1628.27 ± 0.2326.29 ± 0.825.07 ± 0.0625.43 ± 0.63
S0.08 ± 0.120.00 ± 0.000.09 ± 0.120.09 ± 0.130.05 ± 0.000.01 ± 0.02
H/C1.26 ± 0.051.09 ± 0.011.03 ± 0.030.99 ± 0.000.95 ± 0.000.95 ± 0.04
O/C0.81 ± 0.000.37 ± 0.000.33 ± 0.000.30 ± 0.010.25 ± 0.000.26 ± 0.01
CHO index0.36−0.36−0.37−0.40−0.45−0.43
Fuel properties
HHV (MJ/kg)15.8824.8825.6226.5227.8827.52
Fuel ratio0.420.450.530.580.700.75
Energy densification-1.571.611.671.761.73
Energy yield (%)-109.19106.88103.8896.9289.21
BET Surface Area
Specific surface area (SSA), m2/g0.20 ± 0.082.66 ± 0.351.61 ± 0.140.15 ± 0.001.00 ± 0.051.54 ± 0.13
# Values followed by the same letter in the row are not significantly different (p > 0.05).
Table 3. Thermo-gravimetric and differential thermo-gravimetric parameters analyses of lignin-rich residues (LRR) and the hydrochar LRR200, LRR220, LRR240, LRR260, and LRR280.
SamplesInitial Temperature (Ti, °C)Final Temperature (Tf, °C)Weight LossDTG Peak Temperature (Tm, °C)DTG, Rmax (%/°C)Average Rate of Weight Loss (%/°C)Residual Weight (%)
Stage I
LRR3020011.061830.200.07
LRR200302001.941970.030.01
LRR220302002.311980.030.01
LRR240302002.281980.030.01
LRR260302002.841990.040.02
LRR280302003.611990.060.06
Stage II
LRR20045054.463120.440.20
LRR20020045053.493530.580.20
LRR22020045049.943530.540.19
LRR24020045044.253530.440.18
LRR26020045039.263430.390.16
LRR28020045037.153430.270.15
Stage III
LRR4506005.504640.060.0430.99
LRR2004506007.414580.080.0535.39
LRR2204506007.754600.090.0538.39
LRR2404506008.414580.090.0643.46
LRR2604506008.864580.100.0647.77
LRR2804506008.874660.100.0649.67
Disclaimer/Publisher’s Note: The statements, opinions and data contained in all publications are solely those of the individual author(s) and contributor(s) and not of MDPI and/or the editor(s). MDPI and/or the editor(s) disclaim responsibility for any injury to people or property resulting from any ideas, methods, instructions or products referred to in the content.