Article

Analysis of the Demagnetization of a PMSG Using a Coupled Electromagnetic–Fluid–Thermal Numerical Model

by
Jorge E. Morón-Monreal
,
Francisco J. Martinez-Rios
*,
Concepcion Hernandez
and
Marco A. Arjona
Graduate Studies and Research Division, La Laguna Institute of Technology, TNM, Torreon 27000, Coahuila, Mexico
*
Author to whom correspondence should be addressed.
Energies 2025, 18(23), 6149; https://doi.org/10.3390/en18236149
Submission received: 31 August 2025 / Revised: 25 October 2025 / Accepted: 30 October 2025 / Published: 24 November 2025
(This article belongs to the Special Issue Advances in Permanent Magnet Synchronous Generator)

Abstract

This article presents a multiphysics simulation methodology to predict the temperature-dependent demagnetization phenomenon of a 900 W permanent-magnet synchronous generator (PMSG). For the 2D electromagnetic model, a commercial finite element method (FEM) package was used to determine the power loss distribution under steady-state conditions, accounting for temperature-dependent demagnetization. The thermal analysis was carried out on a 3D model using computational fluid dynamics (CFD) software, where a polyhedral mesh, rotor rotation effects, and turbulent modeling were implemented. Two simulation cases were evaluated: Case 1, electromagnetic losses at constant temperature without FEM-CFD coupling; Case 2, bidirectional FEM-CFD coupling under steady-state conditions. The analysis confirms that in Cases 1 and 2, there is no risk of irreversible demagnetization, thus validating the selection of the permanent magnet (PM) and the design of the PMSG. Additionally, the methodology accurately captured the heat transfer effects resulting from natural convection and turbulent flow in the critical regions. The CFD modeling convergence criteria, based on residuals and flow monitors, demonstrated numerical stability and a satisfactory mesh discretization in both the FEM and CFD domains, providing valid feedback on the PM temperatures. The proposed methodology provides a robust and accurate tool for coupled electromagnetic–fluid–thermal analysis of the PMSG at rated operating conditions.

1. Introduction

Permanent magnet synchronous generators (PMSGs) have gained significant popularity in wind energy conversion systems (WECS) due to their high power density, high torque, high efficiency, operational stability, and ease of maintenance [1]. Among the most widely adopted WECS are variable-speed systems, which employ either PMSGs or doubly fed induction generators (DFIGs). PMSGs, in particular, offer superior dynamic response, support the implementation of various control strategies, and benefit from advancements in power electronics [2]. However, one major challenge is the risk of PM demagnetization in PMSGs. Therefore, a comprehensive analysis is required to identify and diagnose the factors that may lead to irreversible demagnetization.
Computational models play a critical role in accurately designing new generators [3], developing control schemes [4], performing fault analysis [5], and applying optimization [6]. With advances in computational capabilities, it is now possible to run simulations more quickly and obtain more reliable predictions of machine behavior.
In recent decades, the FEM has become one of the most widely used approaches for electromagnetic analysis of electrical machines. FEM offers substantial advantages, such as the ability to model complex 2D and 3D geometries, incorporate nonlinear materials, and reduce domain size by exploiting the periodicity of electrical machines. Accurate power-loss calculation enables a detailed assessment of the magnetic field distribution within the domain, allowing for steady-state, transient, and fault-condition analyses.
Chen [7] investigated the design of a direct-drive outer rotor PMSG for wind turbines using neodymium-iron-boron (NdFeB) magnets, applying an equivalent magnetic circuit (EMC) model during the initial design and optimization, followed by FEM for detailed performance evaluation and PM safe operation. In [8], the preliminary design of a 2 MW direct-drive PMSG using EMC was conducted. Furthermore, its performance with FEM under no-load and transient conditions was analyzed using a coupled-circuit model to assess the effects of parallel and radial magnetization on the RMS phase voltage, leakage coefficient, and total harmonic distortion (THD) of the air gap flux density.
In [9], a nonlinear dynamic model of anisotropic PMs was implemented to analyze reversible and irreversible magnetization losses of a spoke-type PMSG under no-load, load, and short-circuit conditions using 2D FEM. Other works, such as [10], presented 2D FEM models coupled with external circuits to analyze steady-state and transient conditions in a 2.5 kVA surface-mounted PMSG under passive and diode-rectifier loads, accounting for armature reaction, magnetic saturation, and rectifier nonlinearities.
NdFeB magnets have become the most widely used PMs in rotating electrical machines due to their high coercivity and remanent flux density. However, accounting for demagnetization effects during the early design stage remains challenging. Post-design analyses are therefore required to evaluate PM performance under irreversible demagnetization caused by strong opposing fields, elevated temperatures, or mechanical stresses.
In the literature, three main approaches of the demagnetization analysis can be identified: analytical models, simplified or coupled numerical models, and experimental methods. Numerous studies have addressed demagnetization phenomena in PM machines [11,12]. For example, [13] proposed a temperature-dependent demagnetization model based on a generalized algorithm to derive demagnetization curves from a single normal or intrinsic curve for a PM. A linearized temperature-dependent model for FEA was introduced in [14]. The comparison of FEA-based demagnetization models in PMSMs is reported in [15], where linear and exponential models gave the most accurate performance. Further confirmation of the superiority of exponential modeling near the knee point of the demagnetization curve is provided in [16].
In [17], EMC-based demagnetization analysis and magnet volume reduction were applied to an interior permanent magnet synchronous motor (IPMSM), while [18] presented a low-cost computational methodology for partial demagnetization of a 1.5 kW surface permanent magnet synchronous generator (SPMSG) by means of a permeance network model (PNM), showing good agreement with the FEA results.
In [19], electromagnetic loss modeling was analyzed for both conventional and improved FEM approaches for a high-speed permanent magnet machine (HSPMM), incorporating CFD to assess temperature-dependent demagnetization. Similarly, ref. [20] studied local and global demagnetization in a Halbach magnetized compensated pulsed alternator using a linear demagnetization model and FEM, accounting for armature reaction and PM temperature rise. In [21], an algorithm is proposed to solve the equations of a discrete coupled-phenomena model for analyzing partial demagnetization of PMs under electromechanical and electrothermal transients in a line-start permanent-magnet synchronous motor (LSPMSM).
From the machine designer’s perspective, thermal analysis is often more complex than electromagnetic analysis due to the 3D nature of the problem and the presence of intricate thermal phenomena. The demand for more efficient and compact designs has heightened the importance of accurate thermal modeling. For instance, capturing fluid–thermal effects in the end windings and air gap regions characterized by confined geometries and turbulence requires advanced modeling approaches. Today, methods such as lumped-parameter thermal networks (LPTN), FEM, and CFD allow precise coupled electromagnetic–thermal simulations.
Boglietti et al. [22] presented a comprehensive review of thermal analysis methods for electrical machines, comparing LPTN, FEM, and CFD approaches in terms of accuracy, complexity, and computational resources. Similarly, ref. [23] reviewed the advances in thermal management techniques, with emphasis on hot-spot temperature estimation, loss analysis, and cooling systems.
One of the fastest and most computationally efficient alternatives for thermal analysis is LPTN. The level of model discretization determines the accuracy of this method. In this approach, the problem is discretized into thermal nodes that represent different regions of the machine (rotor, stator, windings, PMs, shaft, housing, etc.), which are interconnected via thermal resistances that model heat transfer by conduction, convection, and radiation. Some disadvantages include the dependence on empirical data, the need for experimental calibration, expertise in defining appropriate nodes and resistances, resulting in lower accuracy than FEM and CFD [24,25,26,27,28,29].
In thermal analyses, the FEM enables accurate modeling of geometrical features, materials, and different operating conditions. This methodology has proven effective in predicting critical temperature points. However, it presents challenges in calculating thermal resistances at interfaces and convection, as well as in accurately representing natural convection and radiation phenomena [30,31,32,33].
The CFD analysis employed in this work is considered one of the most comprehensive and complex approaches for thermal analysis in electrical machines. The setup and calculations of 3D models can be time-consuming; however, CFD enables the estimation of convective heat transfer coefficients [34], as well as the evaluation of internal and external flow patterns. It also allows the evaluation of various cooling schemes, including natural and forced convection, water-jacket cooling, and oil-spray cooling [35,36]. Consequently, CFD can solve conjugate heat transfer problems by simultaneously coupling thermal conduction in solids with thermal convection in fluids.
Gabauer et al. [37] present a methodology for analyzing the thermal field of an induction motor with asymmetric geometry and air-cooled fins. Their approach combines CFD (for fluid convection) and FEM (for solid conduction), while aiming to reduce computational cost through an improved FEM model.
Pons et al. [38] performed a coupled fluid–thermal CFD analysis of induction motors to study heat distribution and the effects of rotor asymmetry, demonstrating the model’s effectiveness in predicting thermal stresses and detecting broken-bar faults.
This paper presents the methodology and analysis of demagnetization effects in a low-power interior PMSG under rated steady-state load conditions, accounting for coupled thermal effects. The 2D electromagnetic simulation using FEM is bidirectionally coupled with the 3D CFD model. Owing to the machine’s periodic characteristics, both the 2D electromagnetic and the 3D fluid–thermal models are reduced to one-eighth of the PMSG. Furthermore, the CFD model setup and the proper discretization of both models are detailed, enhancing the accuracy of temperature feedback in the PM for demagnetization evaluation. Two simulation cases are considered: Case 1 analyzes the electromagnetic model in steady state at a constant temperature of 70 °C connected to the grid; Case 2 analyzes the model in steady state connected to the grid with bidirectional FEM–CFD coupling. The strategy integrates different Ansys tools: Ansys RMxprt for design, the FEM simulation package Ansys Maxwell, the CFD package Ansys Fluent, the workflow integration package Ansys Workbench, and the CAD design package SpaceClaim.

2. Electromagnetic Model

This section introduces the fundamental electromagnetic formulation based on FEM, as well as the formulation for calculating the electromagnetic losses in the PMSG. It describes the temperature-dependent demagnetization model implemented in this work. The following sections present, in detail, the geometry, material properties, boundary-condition application, and meshing strategy used for the electromagnetic analysis of the PMSG.

2.1. Electromagnetic Problem Formulation

In electromagnetic devices, the relationships among electromagnetic quantities in the temporal and spatial analysis, particularly for electrical machines such as the PMSG, are governed by the following Maxwell’s equations [39,40]:
× E = B t
× H = J
where E is the electric field intensity [V/m], B is the magnetic flux density [T], H is the magnetic field intensity [A/m], and J is the current density [A/m2]. In addition, Equations (3) and (4) correspond to constitutive relations supplementary to Maxwell’s equations, which describe the relationship between the electric and magnetic field quantities as a function of the electrical and magnetic properties of the materials:
J = σ E
B = μ H
where σ is the electrical conductivity [S/m] and μ stands for magnetic permeability [H/m].
Within the FEM context, Maxwell’s equations are reformulated using scalar or vector potentials, the selection of which depends on the type of field involved [39]. For magnetodynamic problems, involving time-varying magnetic fields and induced currents, the magnetic vector potential A is used. It is defined in relation to the magnetic flux density B by:
B = × A
Using Ampere’s law (2) together with the constitutive relation (4) and (5), the diffusion equation for a 2D problem is obtained:
× ν × A = J
where the current density J can be divided into three components. The first is due to the applied source, the second is due to the electric field induced by the variation in the magnetic flux, and the third is due to the effects of the PM in the model:
J = σ V b l σ A t + × H c
where A represents the z-component ( 0,0 , A z ), ν is the reluctivity ( 1 / μ ), V b is the voltage applied to the finite element region, l is the length of the problem in the z -direction (i.e., the length of the PMSG), and H c is the coercivity of the PM. Substituting Equations (6) and (7), we obtain the time-dependent magnetic diffusion equation as:
× ν × A = σ V b l σ A t + × H c
Equation (8) is also referred to as the strong form, since it represents the exact form of the differential equation, which must be satisfied pointwise over the entire problem domain. To apply FEM, Equation (8) is transformed into a weak formulation. At this stage, boundary conditions for the partial differential equations are defined, and a weak formulation is derived by applying the inner product with test functions, thereby allowing the problem to be expressed as an energy functional associated with the electromagnetic system [39].
Subsequently, the geometric domain is discretized into a 2D triangular finite element mesh, and fields such as A are approximated using locally defined shape functions in each element. This results in a time-dependent algebraic system of equations, consisting of matrices that represent magnetic stiffness, conductivity losses, and excitation sources. The system is solved step by step using time integration schemes (such as Backward Euler or Runge–Kutta), enabling accurate capture of the system dynamics [40,41]. This methodology provides high-accuracy predictions of the dynamic behavior of key electromagnetic quantities, including induced voltages, electromagnetic torque, electromagnetic losses, and the spatial and temporal distributions of magnetic fields in the PMSG.

2.2. Electromagnetic Losses

2.2.1. Core Losses

The prediction of core losses in electrical machines with non-oriented ferromagnetic laminations under transient conditions can be carried out using the empirical Steinmetz model or the Bertotti model [42,43,44,45]. The total core loss ( P v ) , can be decomposed into three main components: static hysteresis loss ( P h ) , eddy current loss ( P e d d y ) , and excess loss ( P e x ) :
P v = P h + P e d d y + P e x = k h f B m 2 + k c ( f B m ) 2 + k e x ( f B m ) 1.5
where k h , k c and k e x are the hysteresis, eddy current, and excess loss coefficients, respectively; f is the operating frequency and B m is the maximum flux density amplitude.

2.2.2. PM Losses

Eddy current losses in PMs are usually negligible in PMSGs, since the rotating magnetic field is synchronous with the rotor speed. However, they may be induced by harmonics generated by the geometry of the stator teeth or the rotor pole face. Furthermore, the high electrical conductivity of NdFeB PMs increases the presence of eddy currents.
These induced currents can be reduced by segmenting the PM along the axial length of the pole or by modifying the position of the PM within the rotor. At low operating speeds, their effects are generally negligible [46,47,48].
Eddy currents can be estimated by applying Ampere’s law and the magnetic vector potential (8). The current density per unit area can be obtained as [48]:
j = 1 S × A μ d L
where the current density exhibits an inverse relationship with the cross-sectional area S . Using Equation (10), the eddy current losses in the PM can be computed as:
P M e d d y = L P M σ P M J P M 2 d A
where L P M is the PM axial length, σ P M is the PM electrical conductivity, J P M denotes the PM eddy current density, and A represents the PM surface.

2.2.3. Winding Losses

In the PMSG, winding losses constitute the primary heat source, resulting from resistive heating caused by current conduction in the windings. For 2D models, they can be calculated as:
P C o p p e r = 1 σ C u J 2 d V
where J is the current density and σ C u represents the copper conductivity. The length corresponds to the model depth, excluding resistive losses in the end windings. As the winding temperature increases, the conductivity also varies. Thus, the thermal dependence of copper conductivity is defined as:
σ C u ( T ) = 1 ρ 0 [ 1 + α T T 0 ]
where ρ 0 is the copper resistivity at a reference temperature T 0 = 20   ° C , and α is the copper temperature coefficient, equal to 0.0039 ° C 1 .

2.3. Demagnetization Phenomenon

The temperature rise leads to a reduction in the remanent flux density ( B r ) and a decrease in the intrinsic coercivity ( H c ) of the PMs. Consequently, a demagnetization process may occur, which can be either partial (reversible) or permanent (irreversible) if the temperature exceeds the Curie temperature of the PM material. Permanent magnets can be characterized by their hysteresis loop, where the most relevant part is the second quadrant of the B–H plane, known as the demagnetization curve [6,12]. The normal curve represents the combined contribution of the applied magnetic field and the PM, whereas the intrinsic curve shows only the contribution of the PM. Figure 1a illustrates the normal demagnetization curve with the load line and operating points. The demagnetization curve can be considered nearly linear with an abrupt drop at the inflection point, known as the knee of demagnetization. For proper machine performance, it is essential to maintain the operating point above the knee of the normal demagnetization curve when exposed to demagnetizing fields and temperature increases. Figure 1a shows the reversible demagnetization process caused by demagnetizing fields. As the demagnetizing field increases, the operating point remains in the linear region above the knee of the demagnetization curve, between points P a and P a . Therefore, the PM retains its initial remanent flux density B r when the magnetic field intensity H equals 0. However, under short-circuit faults, overloads, or other disturbances, the operating point may shift below the knee toward P a . Once the fault is cleared, new operating points appear at P b and P b , while the PM follows the recoil line between P a and B r , with a reduced residual flux density B r . Figure 1b shows the behavior of the PM under normal conditions when the temperature increases from T 1 to T 2 . As the temperature rises, the operating point shifts below the knee toward P c , leading to irreversible demagnetization with a reduced flux density B r . The PM then follows a new recoil line between P c and B r . If the temperature decreases back to T 1 , a new operating point appears at P a , with the corresponding recoil line between P a and B r . However, if the temperature exceeds the Curie temperature, the PM completely loses its residual magnetic flux density.
To represent the behavior of the PMs as a function of temperature, linear expressions [41,49] allow the evaluation of the PM properties under temperature variations, given by:
B r ( T ) = B r 0 · ( 1 + α · T T 0 )
H c ( T ) = H c 0 · ( 1 + β · T T 0 )
where B r 0 is the remanent flux density, H c 0 is the intrinsic coercivity at room temperature ( T 0 ), α is the temperature coefficient for B r , β is the temperature coefficient for H c and T denotes the temperature. The thermal coefficients α and β are typically provided by the manufacturer.
This loss of magnetic properties in the PM directly translates into a reduction in the induced voltages in the stator windings and, consequently, a decrease in the generated electrical power. In extreme cases, irreversible demagnetization permanently compromises the operational capability of the machine, making the inclusion of coupled electromagnetic–fluid-thermal models essential in PMSG design.
In contrast, the properties of ferromagnetic steel remain practically stable even across a wide range of operating temperatures; therefore, no thermal dependence of its properties is considered in this work.

2.4. Electromagnetic Model of the PMSG

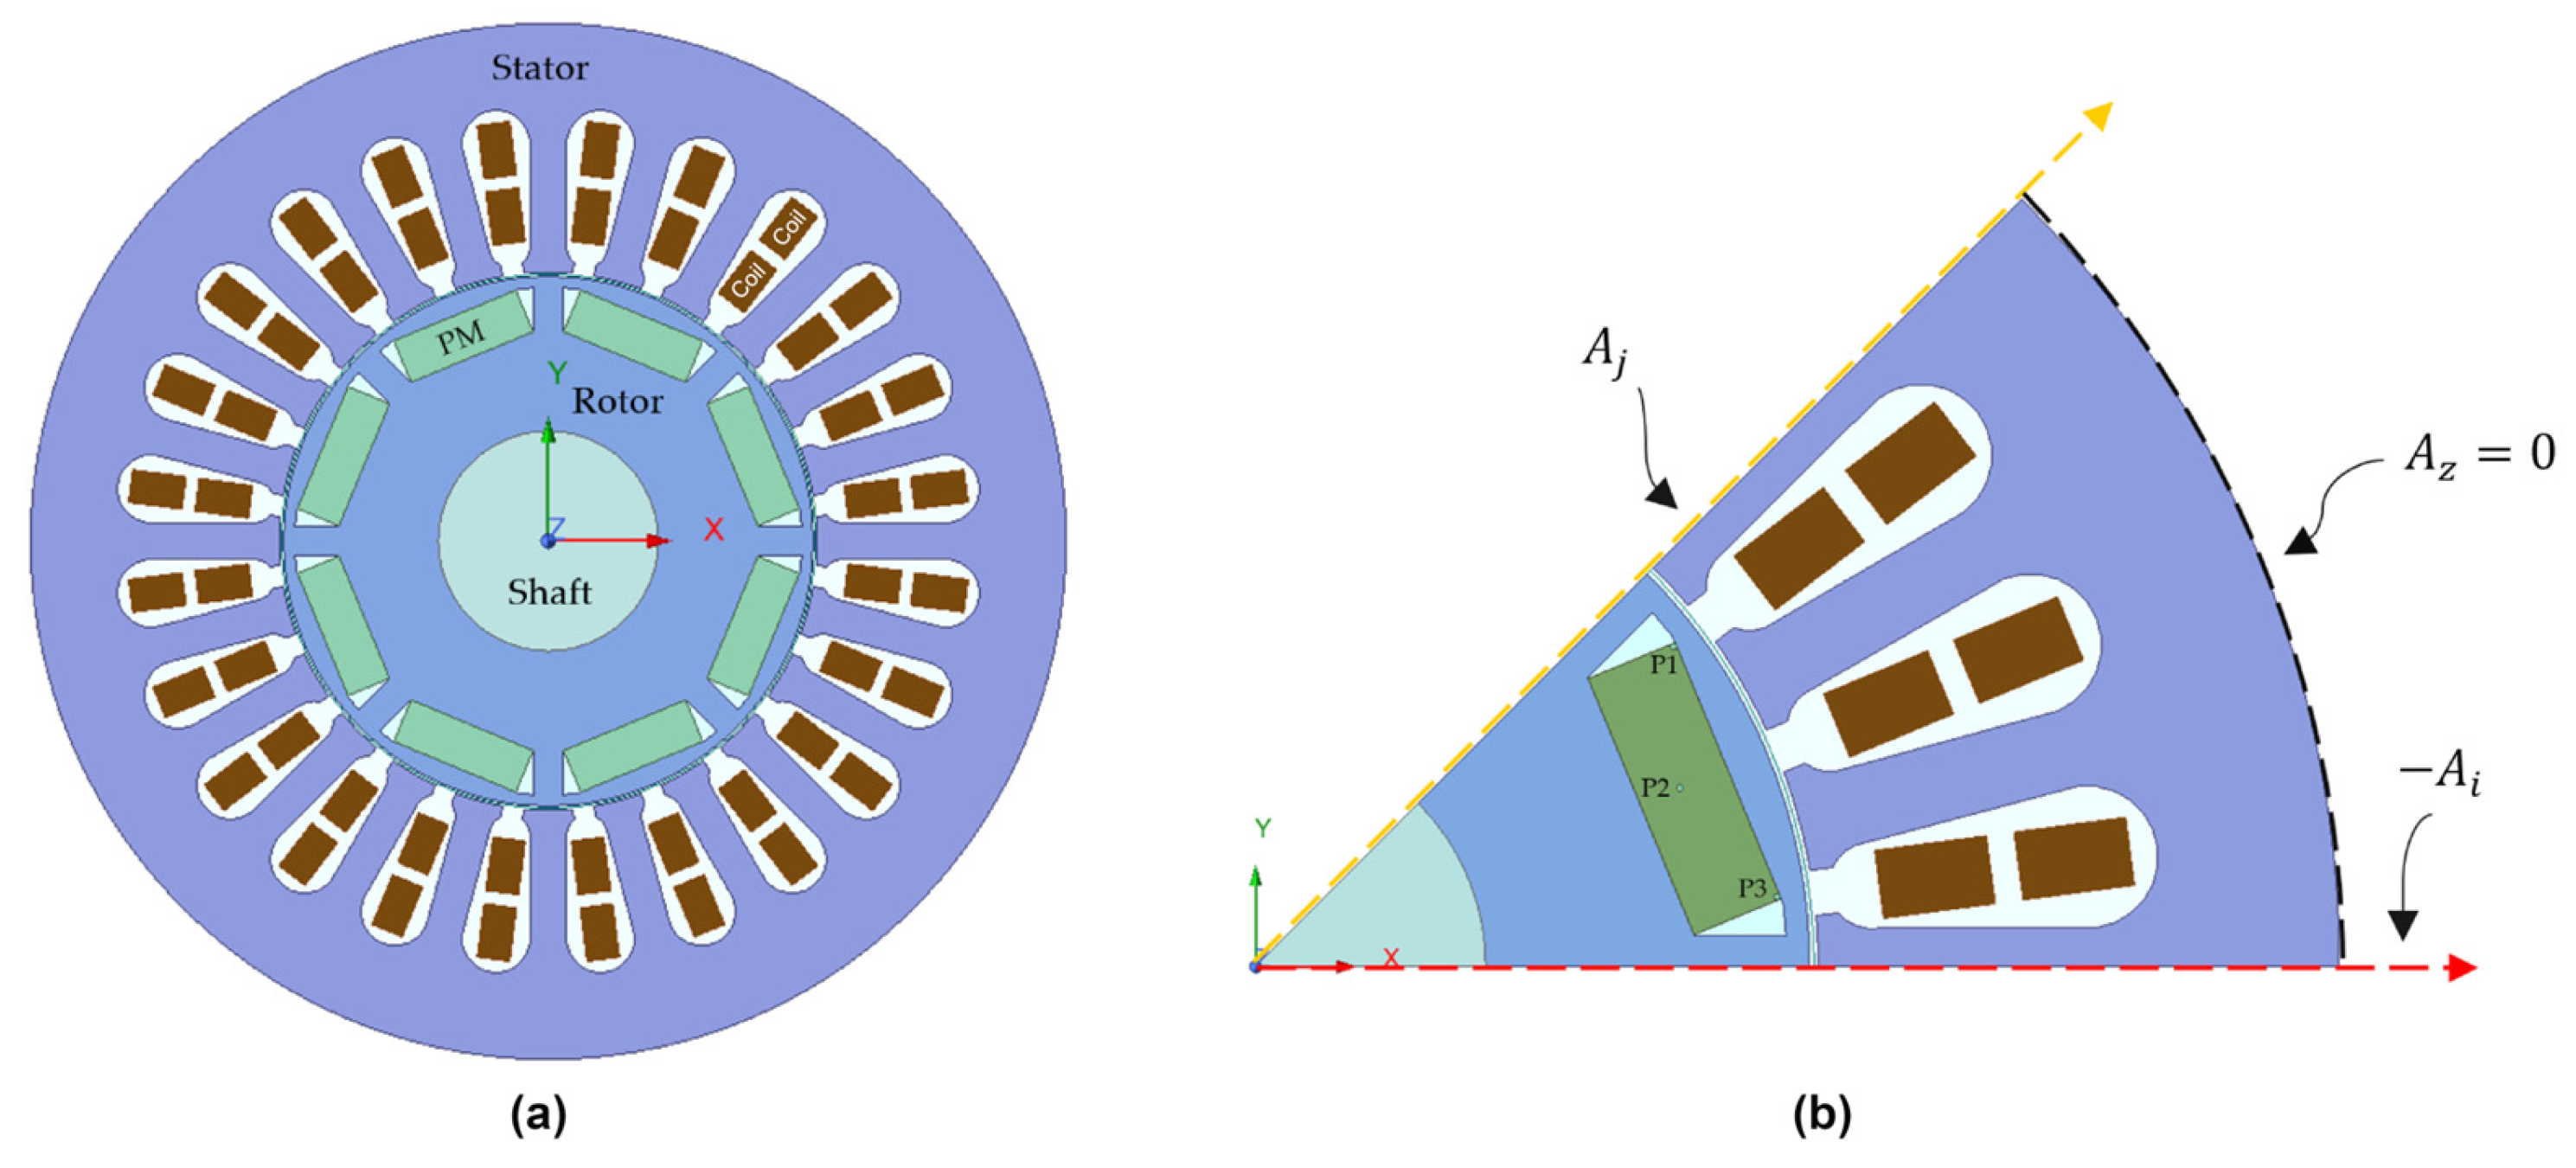
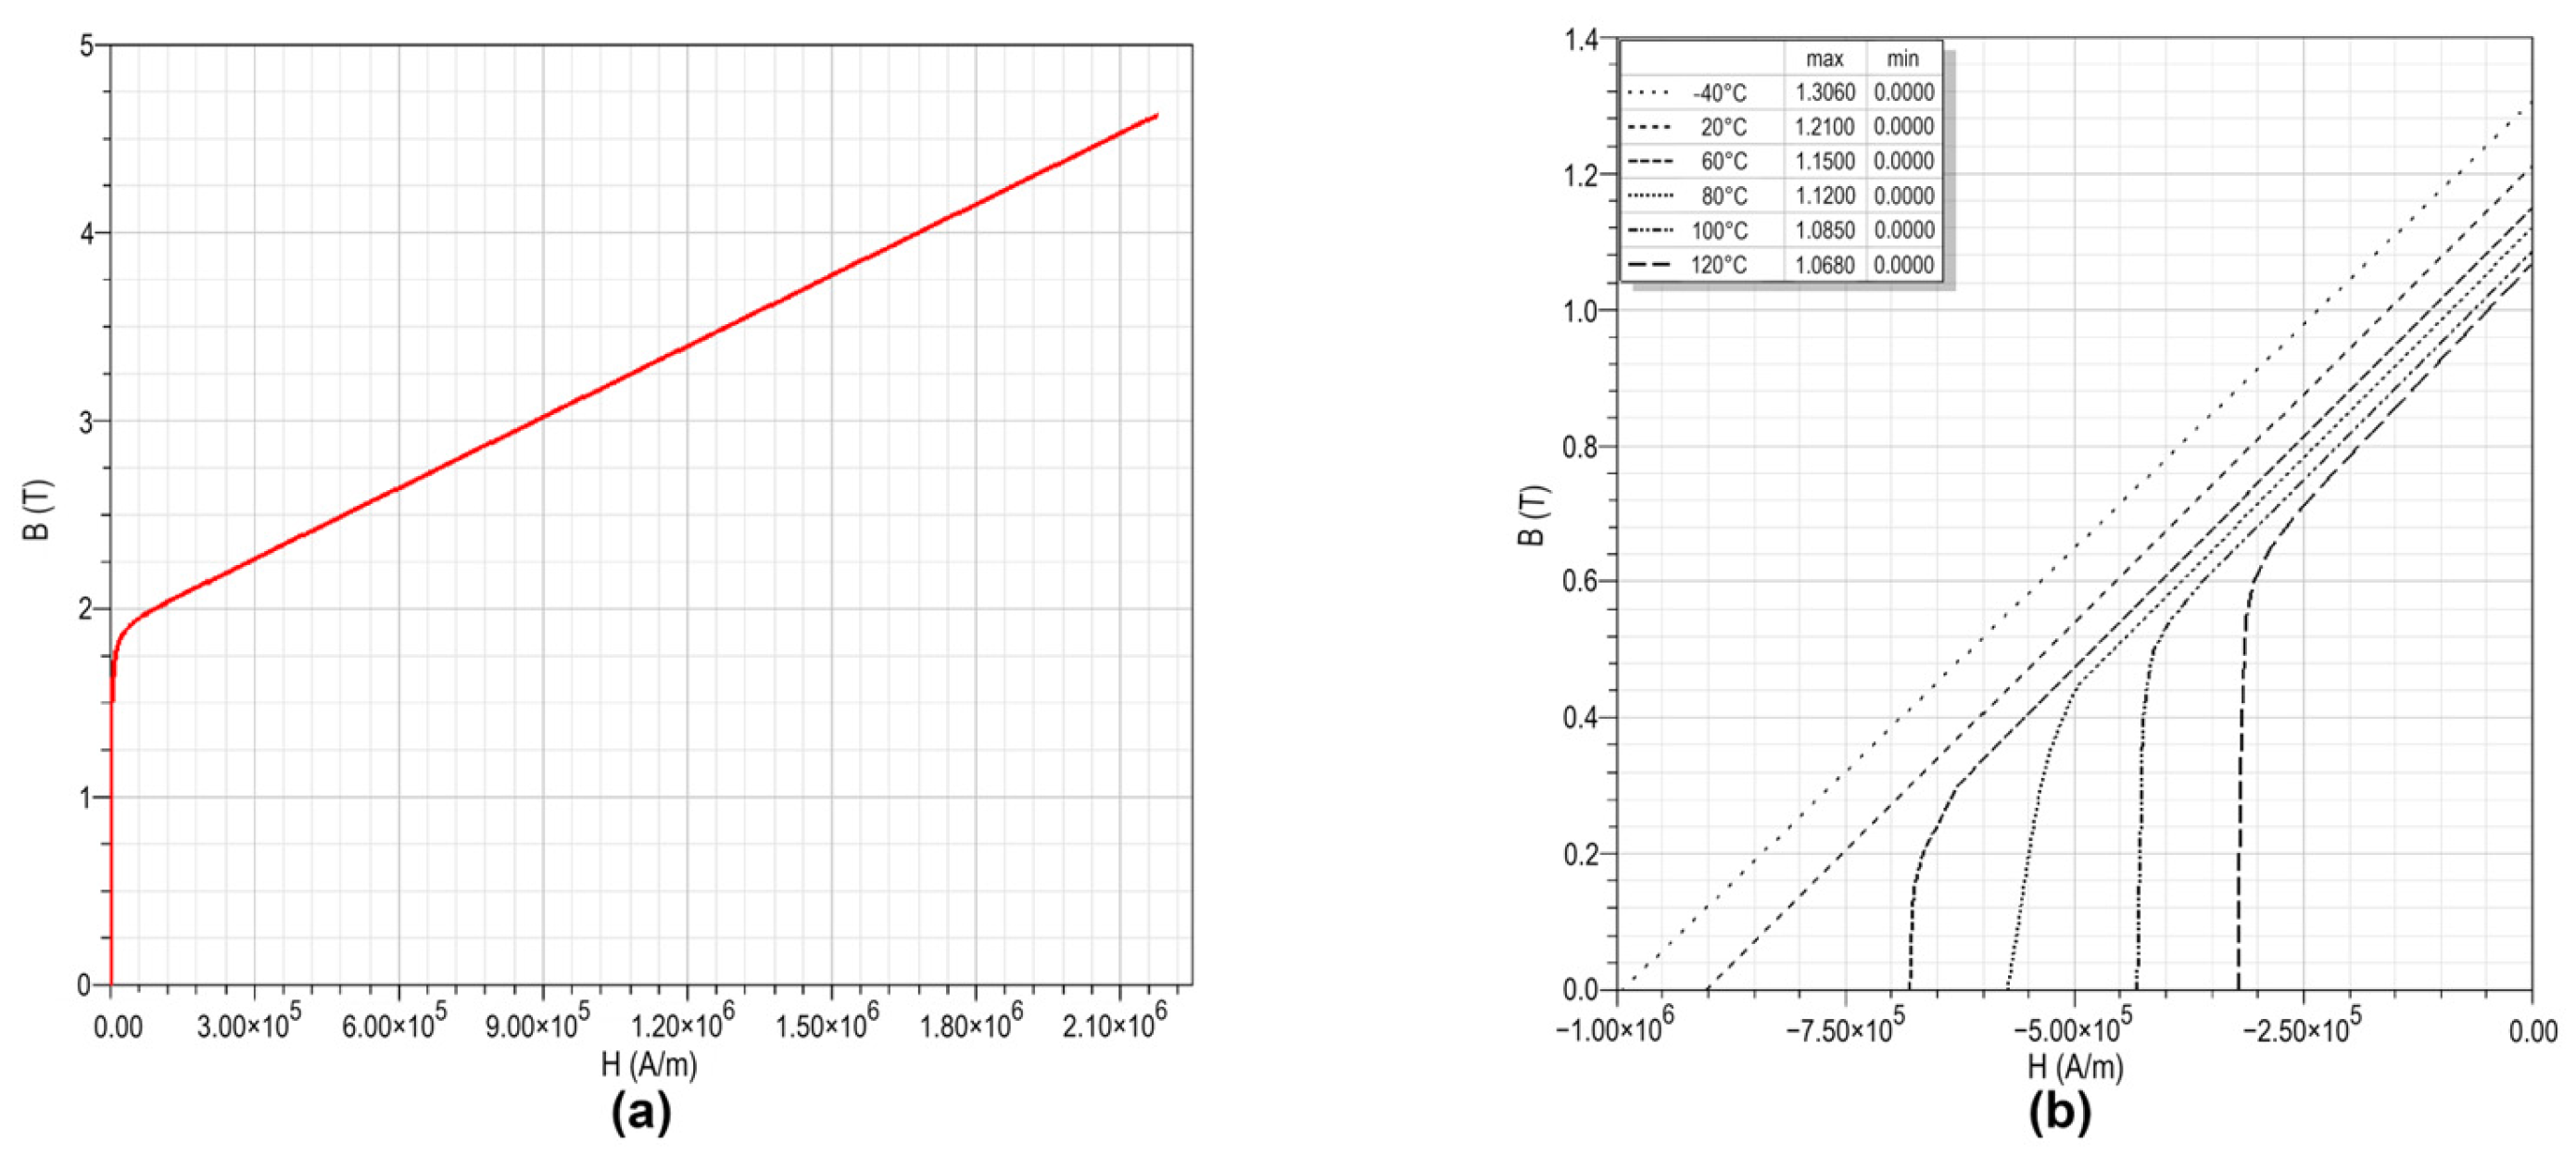
The proposed 2D electromagnetic model geometry is shown in Figure 2a, including the stator, rotor, PMs, and winding domains. Additionally, the boundary conditions and critical demagnetization points for the analysis are illustrated in Figure 2b. Table 1 presents the electrical properties, Table 2 summarizes the main geometric parameters of the PMSG, and Table 3 provides the properties of the N35 PM from Arnold Magnetic Technologies. Furthermore, Figure 3 shows the B–H curve of the ferromagnetic material and the demagnetization curves of the selected N35 PM.
Since both geometry and the magnetic field exhibit periodic symmetry, the model can be reduced to a single-pole pitch. Dirichlet boundary conditions ( A z = 0 ) are imposed at the outer stator boundary, which is equivalent to considering an external material with null magnetic permeability. This forces the flux lines to be tangent to the boundary, preventing any line from crossing it.
The periodic (binary) boundary conditions applied on both sides of the PMSG are shown in Figure 2b. These conditions are enforced at two opposite boundaries, ensuring that the fields at both limits are either equal ( A i = A j , even periodicity) or opposite ( A i = A j , odd periodicity). The periodicity condition is more general than Dirichlet or Neumann conditions, as it does not require the field to be symmetric (no normal component) or antisymmetric (no tangential component) at the boundary. Both components may exist, but they must be equal or opposite [50].

2.5. Electromagnetic Meshing

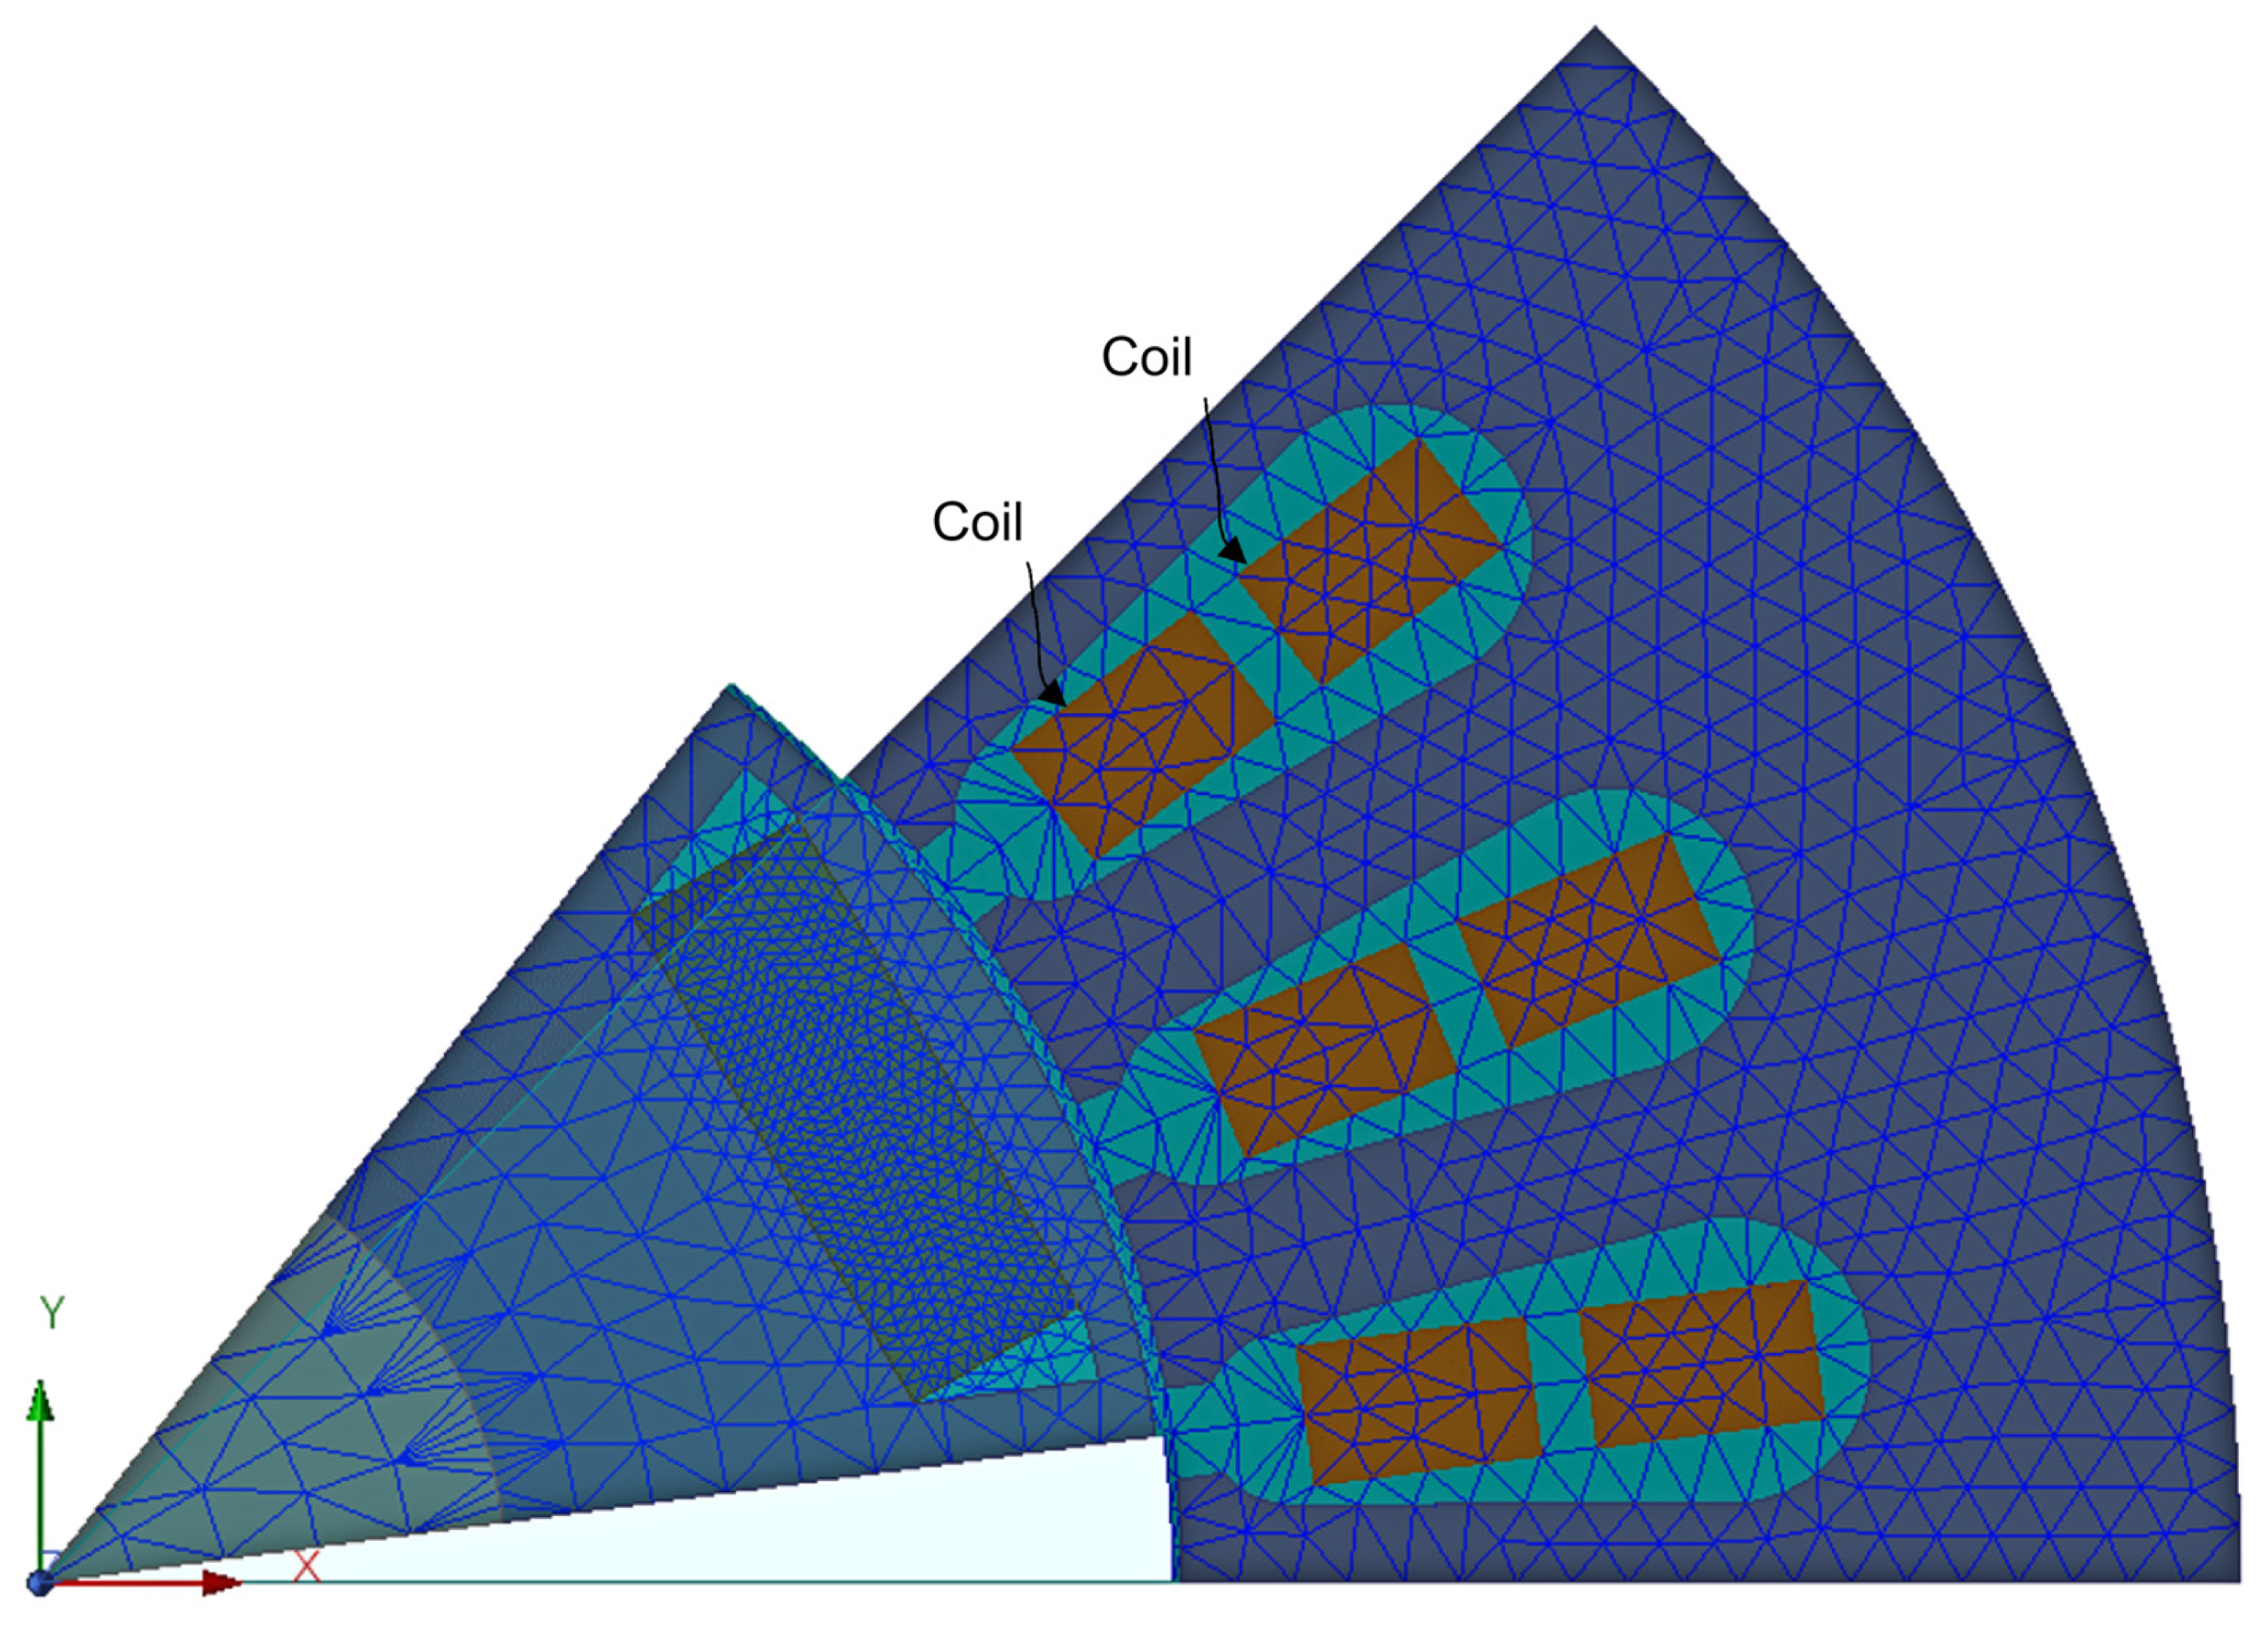
Since the model involves different physics and spatial discretization (triangular meshing for FEM and polyhedral meshing for CFD), a fine mesh was used in the PM region to enhance the fidelity of the electromagnetic–fluid–thermal coupling. A depth of 0.065 mm between finite-element layers in the PM radial direction was used to accurately represent the PM field penetration due to the slotting frequency. The temperature transfer process from the CFD model to the FEM domain is based on interpolation, which requires sufficient resolution in the PM area.
The total number of elements in the electromagnetic model is 2344, distributed as follows: 734 in the PM, 732 in the stator, 331 in the rotor, 251 in the external region, 46 in the internal region, 47 in the band, 47 in the shaft, and 24–28 elements per coil. The proposed meshing for the electromagnetic simulation is shown in Figure 4.

2.6. External Circuit

After parameterizing the electromagnetic model, the external circuit block shown in Figure 5 is implemented to establish a grid connection for steady-state simulation. For the steady-state analysis of Cases 1 and 2, the simulation is carried out over the interval t = 0–80 ms.

3. CFD Model of the PMSG

CFD is one of the most complex numerical approaches for thermal analysis in electrical machines. The computational load and simulation time strongly depend on the problem dimensions and complexity. This approach can accurately capture the distribution of the surrounding fluid velocity or the coolant flow inside the machines. Ansys Fluent 2023 R2 is employed for the thermo-fluid analysis of the PMSG. Fluent uses the Finite Volume Method (FVM) to predict laminar or turbulent flow, mass transfer, chemical reactions, and heat transfer between solids and fluids [51].
The CFD thermal simulation is based on the following assumptions: three-dimensional steady-state model, radiation phenomena neglected, Newtonian fluid, incompressible ideal fluid, no-slip wall condition, gravitational force enabled, and turbulent flow.

3.1. Governing Equations

The governing equations in CFD are expressed in differential form. They are derived from the laws of conservation of mass (continuity equation), conservation of momentum (Navier–Stokes equations), and conservation of energy (energy equation).
The CFD analysis begins by discretizing the computational domain into small control volumes with cells and nodes using a mesh. Once the mesh is generated, the governing equations are discretized using the FVM into a system of linear or nonlinear algebraic equations, which are then solved to obtain variables of interest, such as pressure, velocity, and temperature [51].
The momentum and continuity equations determine the velocity and pressure fields of the fluid. When the energy equation is included, fluid density variations due to temperature changes can also be considered. In transient studies, all three equations can vary with time. By solving Equations (16)–(18) simultaneously, the heat transfer mechanisms in the PMSG can be analyzed [51,52,53,54].
The mass conservation equation is expressed as:
ρ t + · ρ v = 0
where ρ is the fluid density [kg/m3] and v is the velocity vector [m/s]. For steady-state analysis, the transient term is neglected.
The momentum conservation equation in an inertial reference frame is:
( ρ v ) t + · ρ v v = p + · τ ̿ + ρ g + F
where p is the static pressure [kg/m·s2], g   is the gravitational acceleration vector [m/s2], F includes additional model-dependent source terms, and τ ̿ is the stress tensor [N/m2]. In steady-state analysis, the transient terms in (18) and (19) are also neglected.
The three fundamental mechanisms of heat transfer are: conduction, convection, and radiation. Radiation effects are not considered in this work. Heat transfer among PMSG components, such as windings, rotor, stator, PMs, housing, and air, is governed by the energy conservation equation:
t ρ e + v 2 2 + · ρ v h + v 2 2 = · k e f f T + · ( τ ̿ e f f · v ) + S h
where e is the internal energy [J], v is the velocity magnitude [m/s], h is the enthalpy [J/kg], k e f f = k + k t is the effective thermal conductivity, k t is the turbulent thermal conductivity (depending on the turbulence model), k es the laminar thermal conductivity [W/m·°K], τ ̿ e f f is the effective viscous stress tensor, and S h accounts for additional volumetric heat sources defined by the user.
To capture natural convection effects caused by density variations in air due to temperature rise in the PMSG, the incompressible ideal gas law is applied:
ρ = p o p R M w T
where R is the universal gas constant (8.314 J/mol·°K), M w is the molecular weight of the gas [kg/mol], and T is the temperature [°K].

3.2. k-w SST Turbulence Model

To represent heat transfer between fluids and solids, the k ω Shear Stress Transport (SST) turbulence model is implemented. The advantage of the k ω SST model lies in correcting the overprediction issues of the standard k ω and k ε models. It can resolve flow over a wide range of Reynolds numbers and in near-wall regions without the need for wall functions [55].
t ρ k + x i ρ k u i = x j μ + μ t σ k k x j + G k Y k + S k + G b
t ρ ω + x i ρ ω u i = x j μ + μ t σ ω ω x j + G ω Y ω + S ω + G ω b
where k is the turbulent kinetic energy, ω is the specific dissipation rate, G k is the generation of k due to mean velocity gradients, G w is the generation of ω . Y k and Y ω represent the dissipation of k y ω due to turbulence, respectively. S k and S ω are user-defined source terms, G b and G ω b are the terms that take into account the buoyancy effects.

3.3. Geometry and Thermophysical Properties

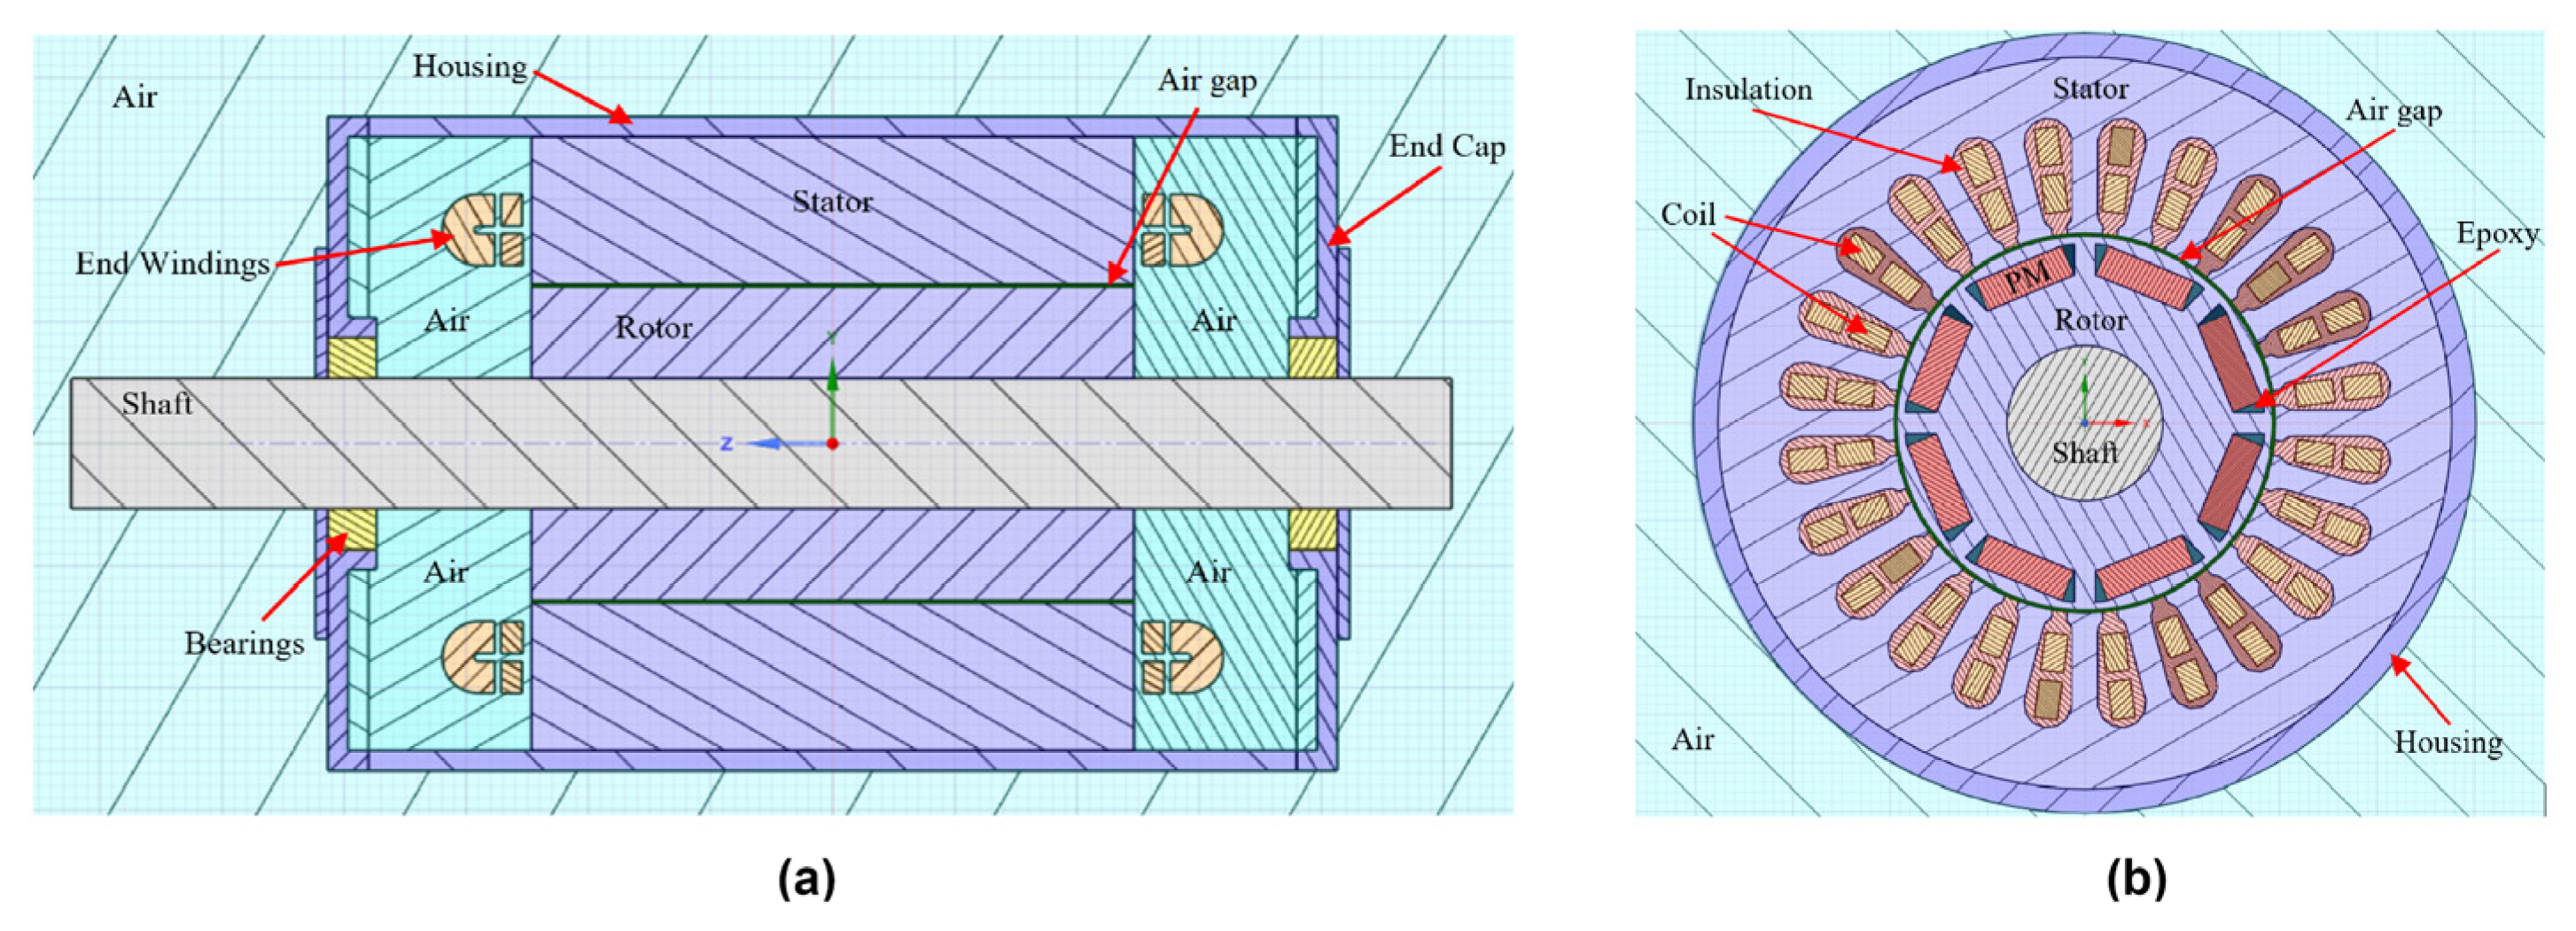
This section describes the PMSG components modeled in Ansys SpaceClaim. The main electromechanical elements are included, while secondary components such as the electrical terminal box and screws are omitted to maintain a clean and simplified geometry, retaining only the relevant elements for thermal analysis, as shown in Figure 6.
Figure 7 shows longitudinal and cross-sectional views of the PMSG, including the surrounding air domain and the end winding air regions in the CFD thermal model. Once the geometry is completed, the PMSG is reduced to one-eighth due to its periodicity, enabling mesh generation, boundary condition application in Ansys Fluent, and the assignment of solid and fluid regions and boundary layers.
The materials employed in the CFD simulation of the PMSG are listed in Table 4. The model considers air in the end windings, the air gap, and the external surroundings of the PMSG. The insulating material fills the stator slots and the coils. To properly account for the thermal effects of the laminated core in the stator and rotor, Ansys Fluent allows the thermal conductivity to be defined along specific directions, reflecting the anisotropy of the material. In laminated stacks, the thermal conductivity is typically much lower in the axial direction compared to the radial and tangential directions.

3.4. Boundary Conditions and Mesh

Rotational periodicity conditions are applied to a single pole of the PMSG. To satisfy these conditions, the PMSG geometry must be perfectly periodic and have matching periodic surfaces with coincident meshes. This approach reduces the computational domain by exploiting the geometric and flow symmetries of the machine, thereby reducing the simulation time without sacrificing accuracy.
Figure 8 illustrates the thermal model of the PMSG enclosed in air, used to study heat dissipation into the atmosphere, along with the applied boundary conditions. The inlet and outlet boundary pressures are set to 0 Pa, and the outer wall of the air enclosure is stationary, adiabatic, and subject to a no-slip condition. To simulate rotor rotation and accurately capture heat transfer in the air gap, moving wall conditions are applied to the outer surface of the rotor adjacent to the air gap, at a synchronous speed of 900 rpm.
The polyhedral mesh is generated semi-automatically using the watertight geometry meshing workflow in Ansys Fluent. The resulting polyhedral mesh, shown in Figure 9a, includes all solid and fluid domains inside the end windings and outside the PMSG housing.
Four boundary layers are applied in the fluid regions interfacing with solid domains, as illustrated in the end windings and fluid regions in Figure 9b. To improve discretization and flow prediction in the air gap, this region is divided into two subdomains, as shown in Figure 10b.
Table 5 summarizes the number of cells generated in each region and the minimum value of the orthogonal quality index obtained. The total number of cells in the model is 13,745,898, ensuring sufficient spatial resolution to accurately capture the temperature and velocity gradients in critical areas of the PMSG.
The minimum orthogonal quality value is 0.3017, corresponding to the air regions located in the end windings. According to the mesh quality criteria established in Ansys Fluent, this value falls within the acceptable-to-good range, indicating that the mesh does not compromise numerical stability or convergence in the CFD simulation.
Additionally, local refinements were applied in the air gap and in geometrically critical areas. Prism layers were also included in the fluid regions at the fluid–solid interface to adequately capture both thermal and dynamic boundary layers.

4. Multi-Physic Coupling Analysis Methodology

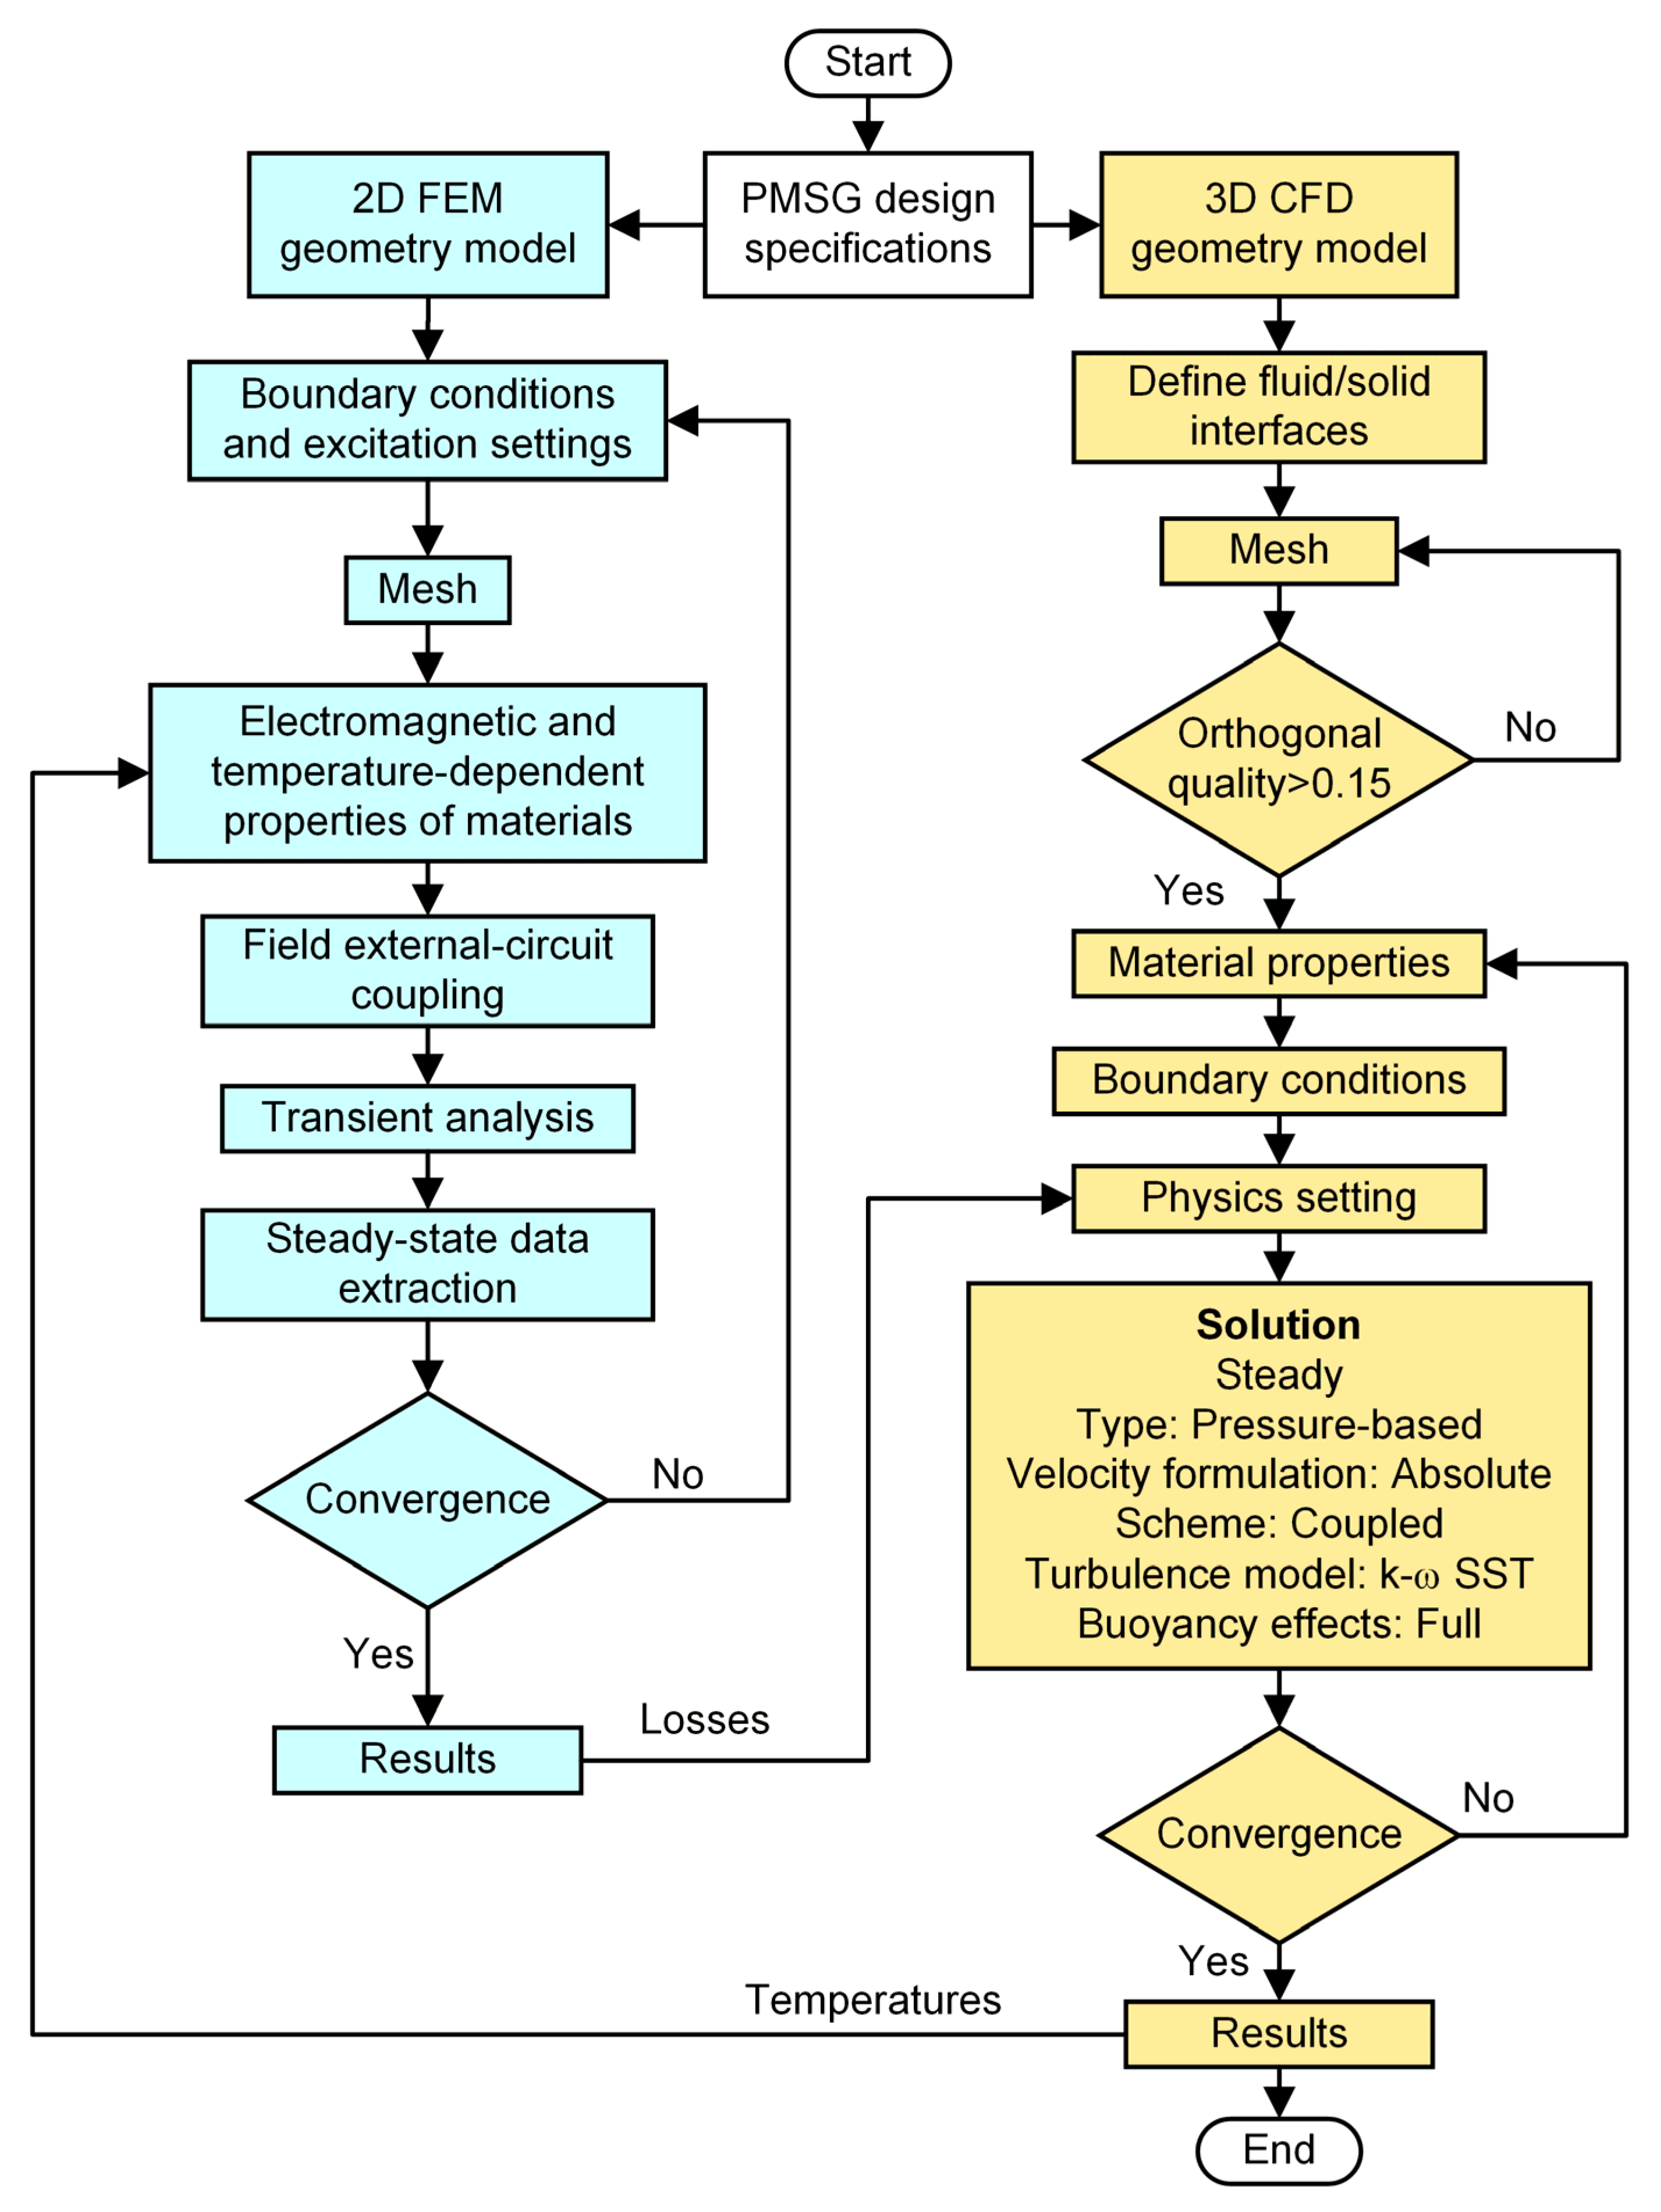
In this work, a bidirectionally coupled analysis method is proposed to evaluate the thermal demagnetization of a PMSG. The overall flowchart is illustrated in Figure 11. The PMSG design is performed in Ansys RMxprt, while 3D CAD modeling and preprocessing are carried out in Ansys SpaceClaim.
The electromagnetic analysis is conducted in 2D using the finite element software Ansys Maxwell (version 2023R2), while the CFD-based thermal analysis is performed in Ansys Fluent. The integration between both physics domains is achieved through Ansys Workbench. The 3D geometry of the PMSG is generated and cleaned, including all solid and fluid components, for the CFD thermal analysis. This model enables an accurate representation of heat transfer mechanisms under the applied boundary conditions.
In parallel, the 2D electromagnetic model based on FEM is developed. This model provides the electromagnetic losses in the windings, core, and PM, where both the windings and PM are temperature dependent. The averaged losses are then incorporated into the CFD model as distributed heat sources. The resulting thermal simulation updates the temperature distribution in each region of the PMSG, which is then fed back to the electromagnetic model with updated temperature-dependent material properties.
The entire simulation workflow is implemented and managed in Ansys Workbench, utilizing the Feedback Iterator module, which allows the integration of multiple physics domains and the automated exchange of data between FEM and CFD models. The outcome is a bidirectionally coupled model capable of accurately predicting the interaction between thermal and electromagnetic phenomena in the PMSG under steady-state conditions.

4.1. Loss Calculation for Case 1 and Case 2

The electromagnetic model of the PMSG is analyzed under two cases. Case 1 evaluates the electromagnetic model by fixing a constant temperature of 70 °C in the PMs under steady-state operation. Case 2 obtains the losses under steady-state conditions with bidirectional thermal coupling with the CFD model. The losses in the stator, rotor, windings, and PM for the two cases are averaged over a time window from 39.60 ms to 64.60 ms.
The averaged losses are transferred to the CFD model of the PMSG as distributed heat sources. Table 6 summarizes the time-averaged losses.
In Case 1, with the PM temperature fixed at 70 °C and without thermal feedback, the stator total losses were 15.5219 W and the rotor total losses were 0.6288 W. In Case 2, with thermal feedback from the CFD model, the stator total losses were 15.4446 W, and the rotor total losses increased to 0.6480 W. Compared to Case 1, the stator losses slightly decreased by 0.5%. In contrast, the rotor losses increased moderately by 3.05%. This means they have a greater impact on rotor losses than on stator losses.
The PM losses exhibit a clear and explicit dependence on both the operating regime and the thermo-electromagnetic interaction. In Case 1, the PM losses were 0.4014 W, while in Case 2, they dropped to 0.3 W, representing a 25.3% reduction due to slight variations in magnetic properties and a more realistic thermal behavior. The winding losses in Case 1 were 71.2103 W, whereas in Case 2, they decreased to 68.3012 W, representing a 4.09% reduction.
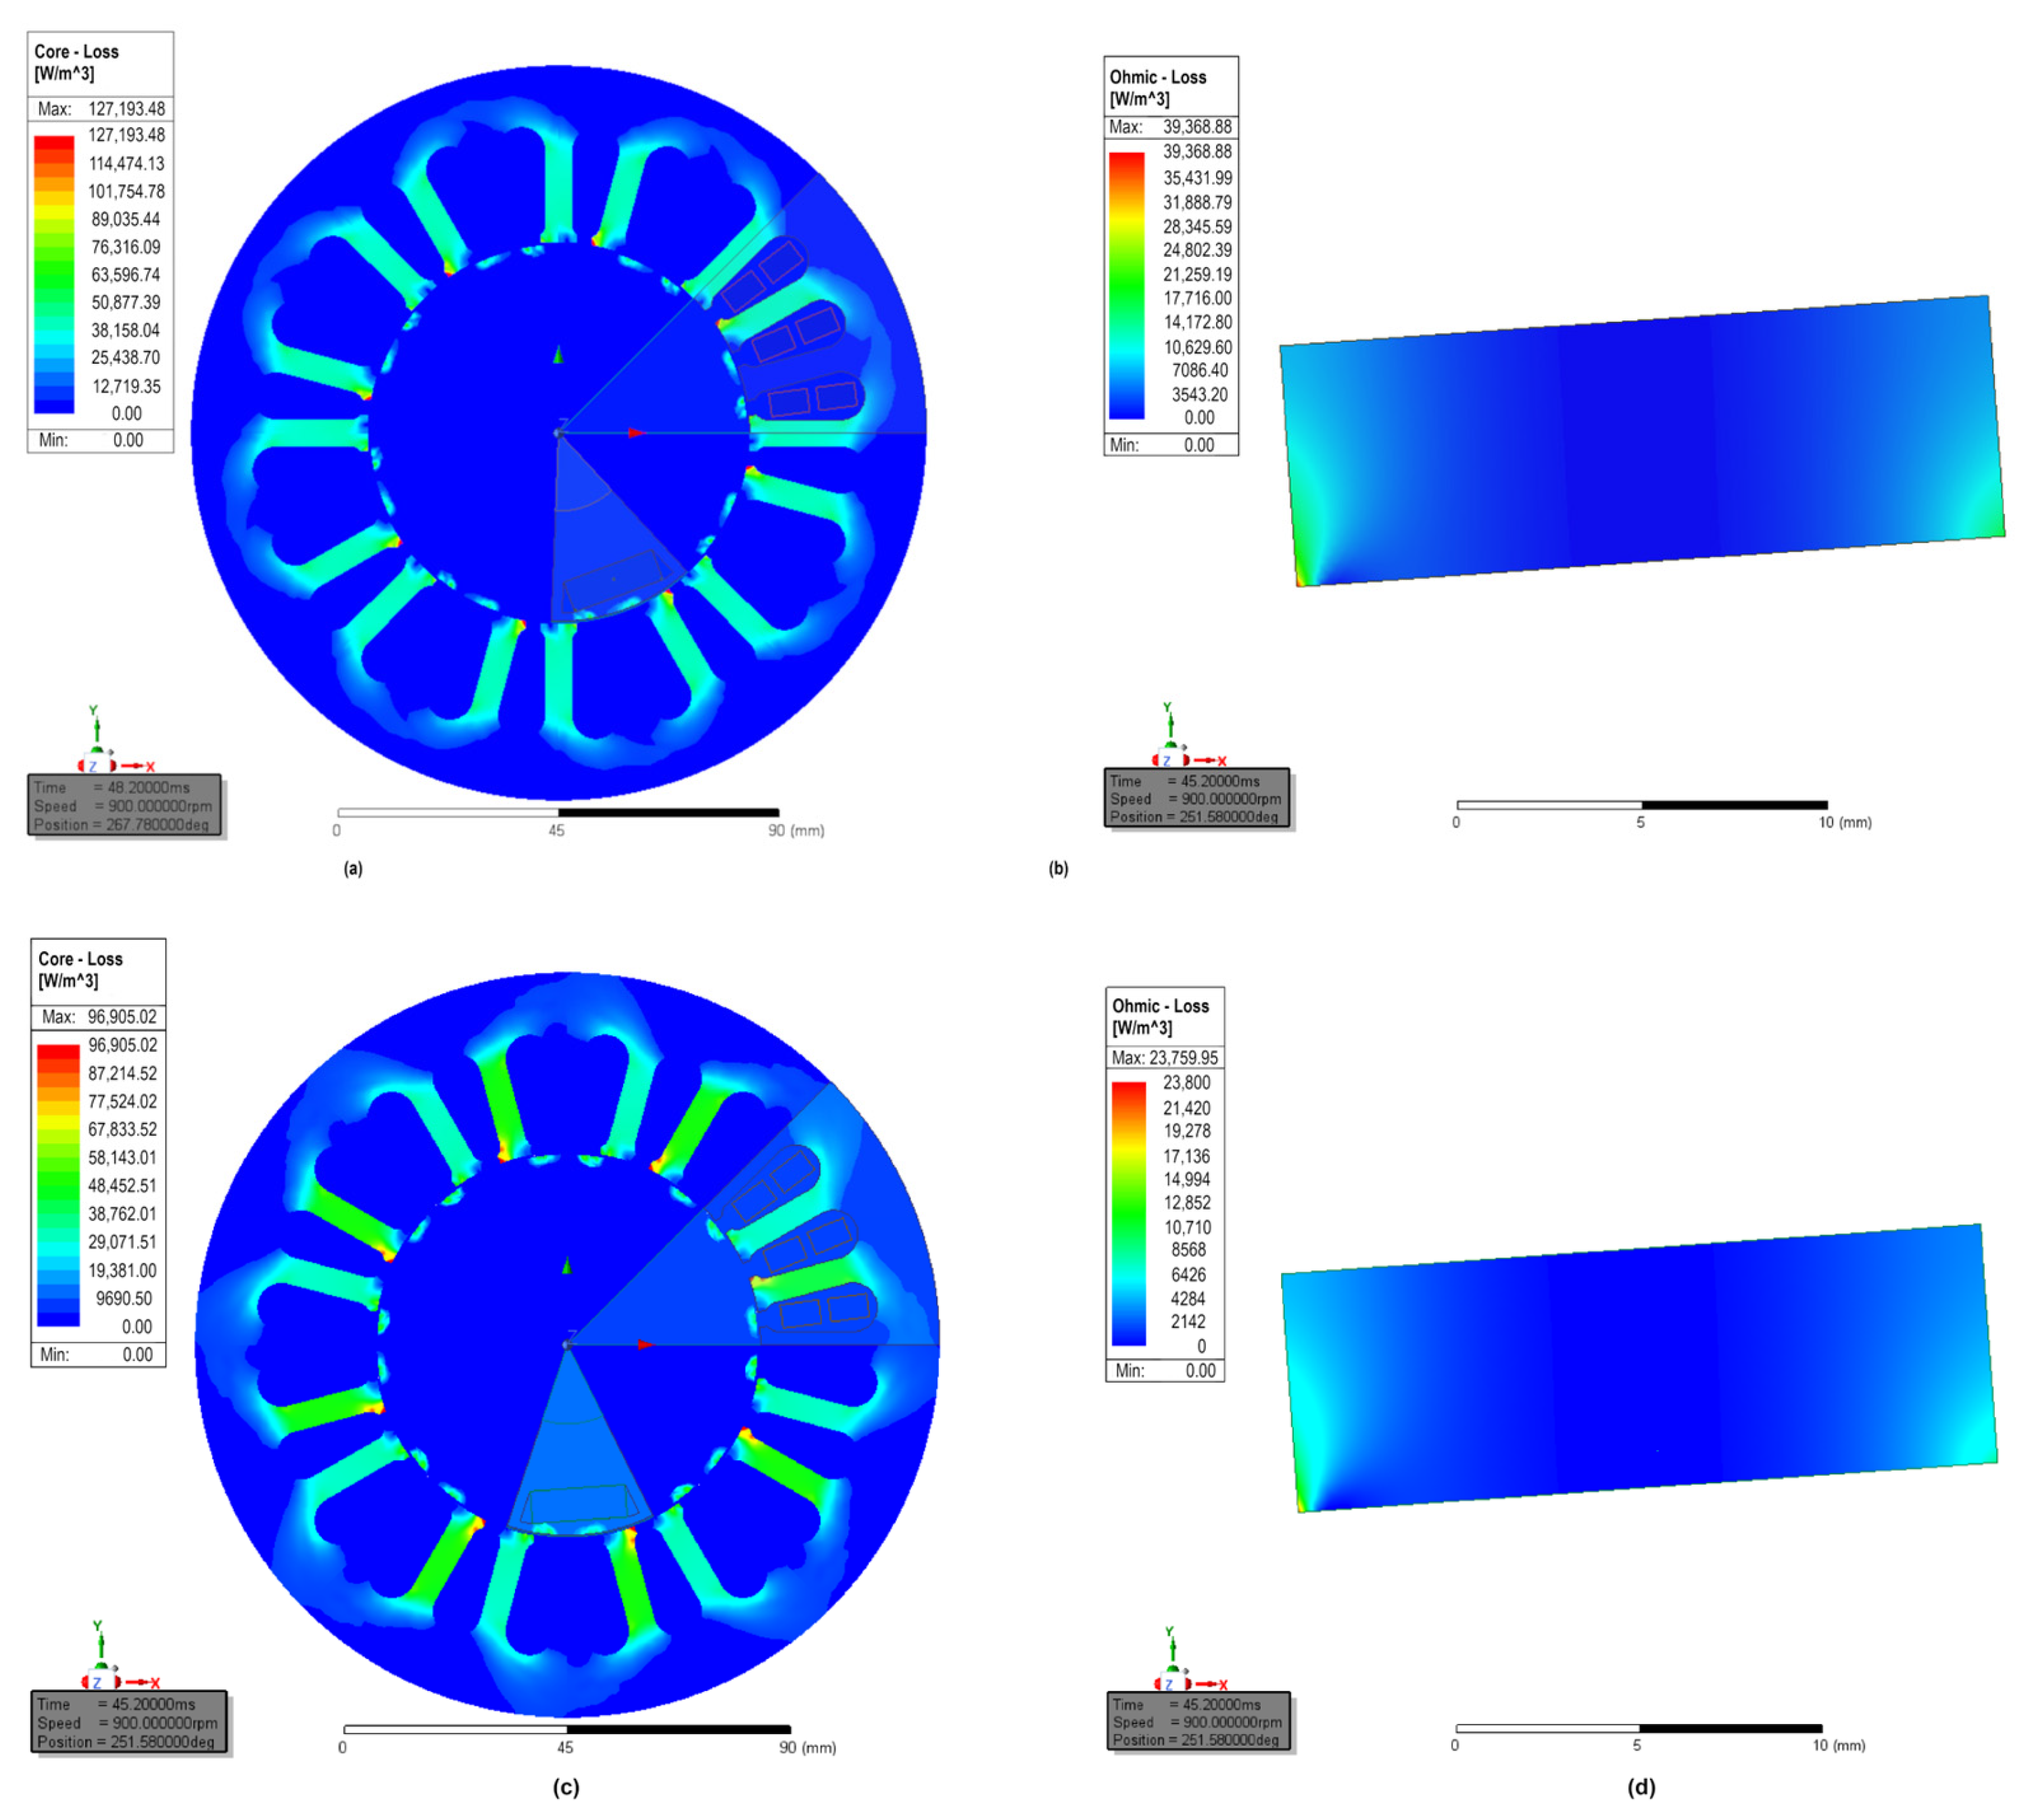
Figure 12a,c show the instantaneous loss distributions in the rotor, stator, and PMs for the two analyzed cases. The evaluation instant was taken at the positive peak of the current signal in each case. In Case 1, the maximum value reached 127,193.48 W/m3, and in Case 2, it was 96,905.02 W/m3. These maxima are mainly located in the stator teeth, near the air gap, and at the outer diameter of the rotor.
Figure 12b,d present the eddy current losses in the PMs for the two cases. In Case 1, the maximum value was 39,368.88 W/m3, while in Case 2 it was 23,800 W/m3, representing a 39.54% reduction. This decrease is attributed to the temperature rise in the FEM-CFD coupling of Case 2, which attenuates the flux variations and harmonics that induce currents in the PMs. The most vulnerable regions to eddy currents are the PM corners located near the outer rotor diameter.

4.2. Reversible Demagnetization for Case 1 and Case 2

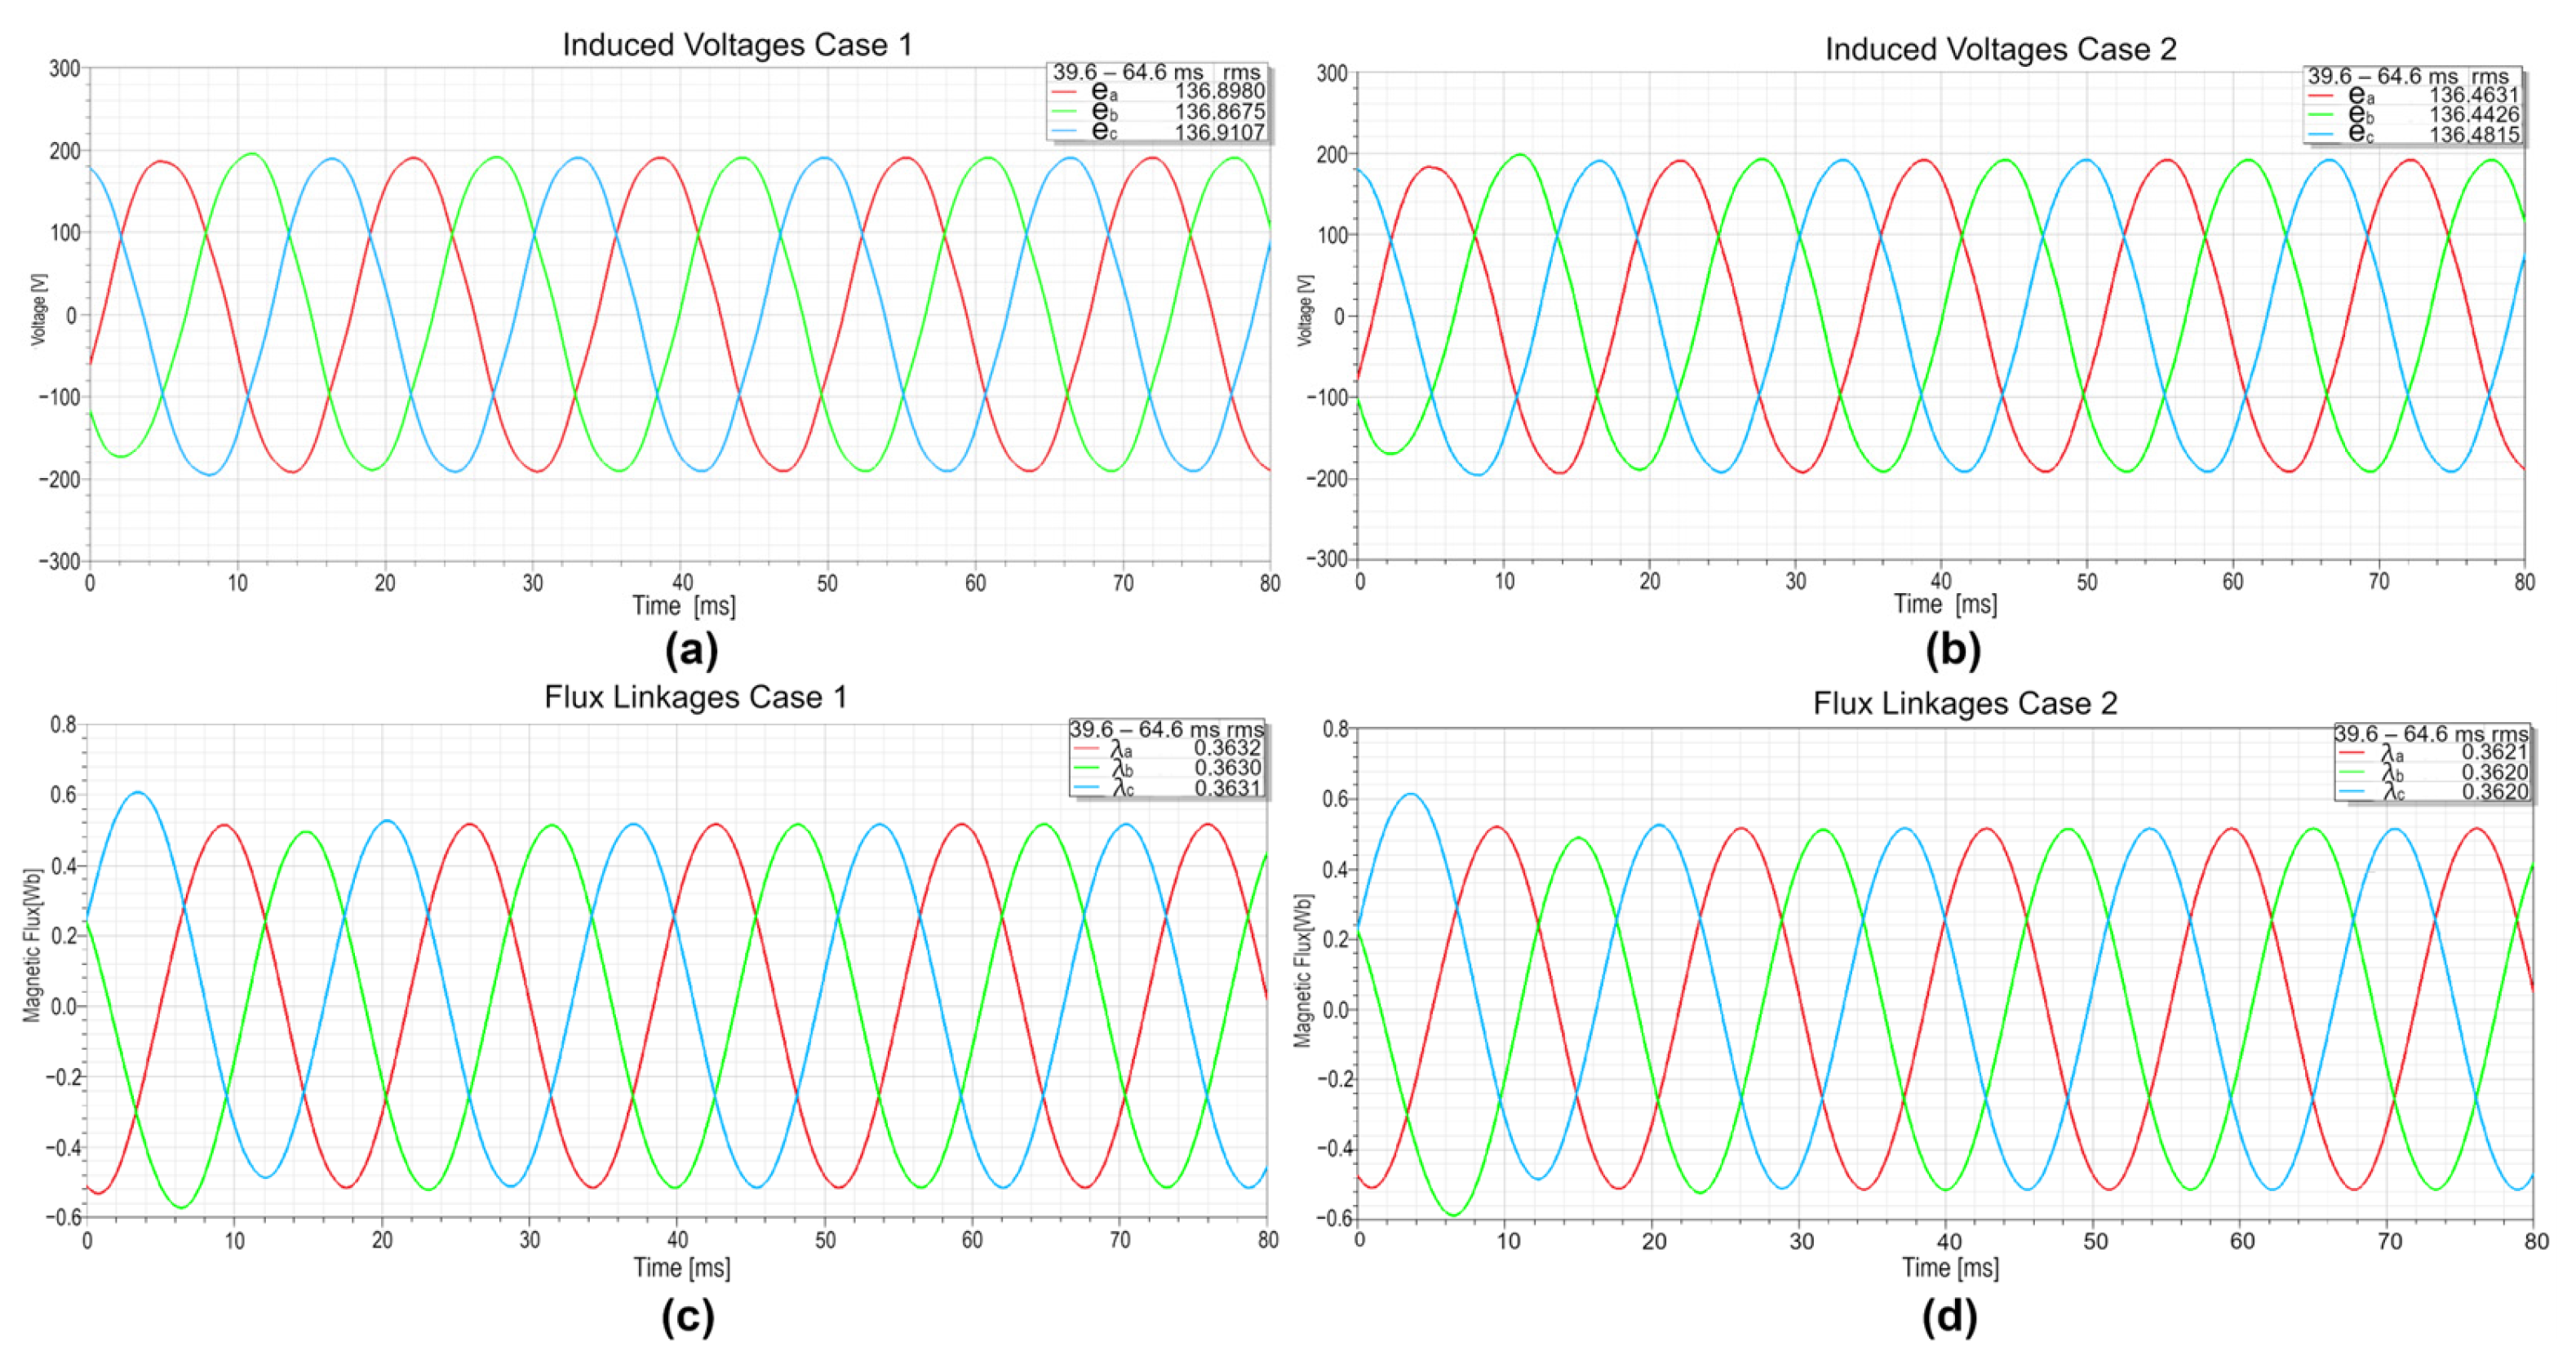
Figure 13a,b show the induced voltages for Case 1 and Case 2, respectively. A slight average decrease of ~0.31% (~0.43 V) is observed in Case 2, attributed to the moderate temperature rise. Figure 13c,d present the flux linkages for Cases 1 and 2, respectively, showing a uniform reduction across the three phases, equivalent to ~1.07 mWb (~0.29% of the RMS value). This behavior indicates that the thermal effect impacts the PMSG globally and symmetrically, without introducing significant imbalances.
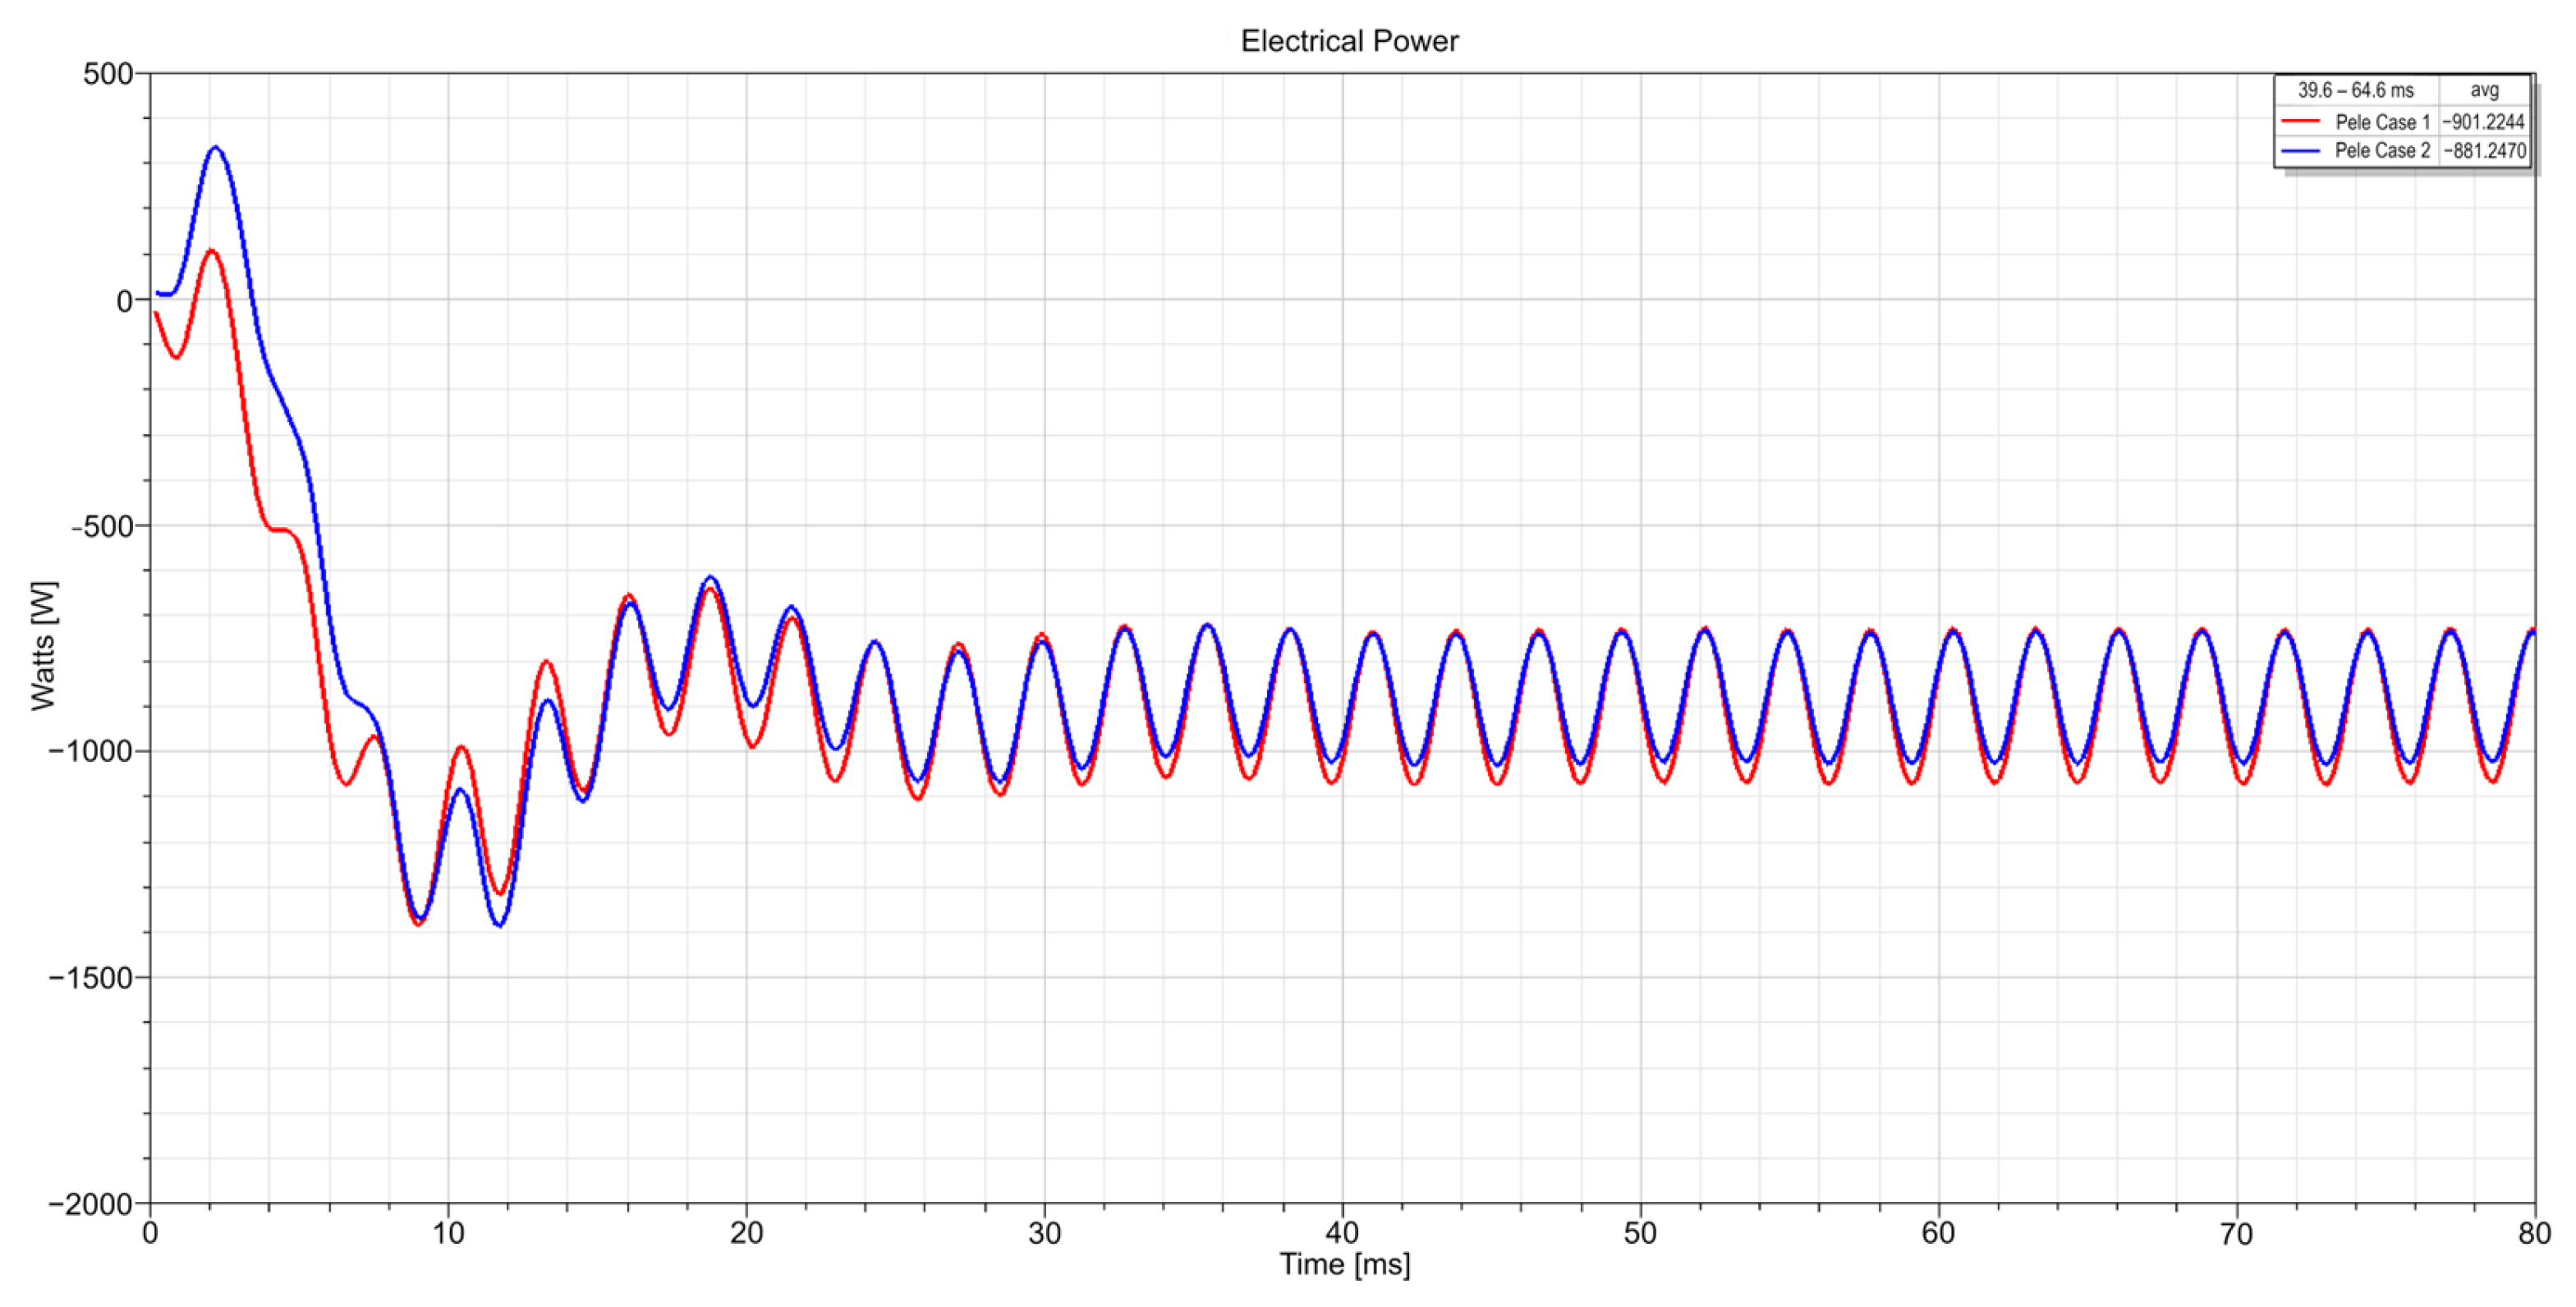
Figure 14 shows the generated electrical power. In Case 1, the PMSG delivered 901.22 W, while in Case 2 it produced 881.24 W, resulting in a 19.98 W reduction, or 2.22%, compared to Case 1.
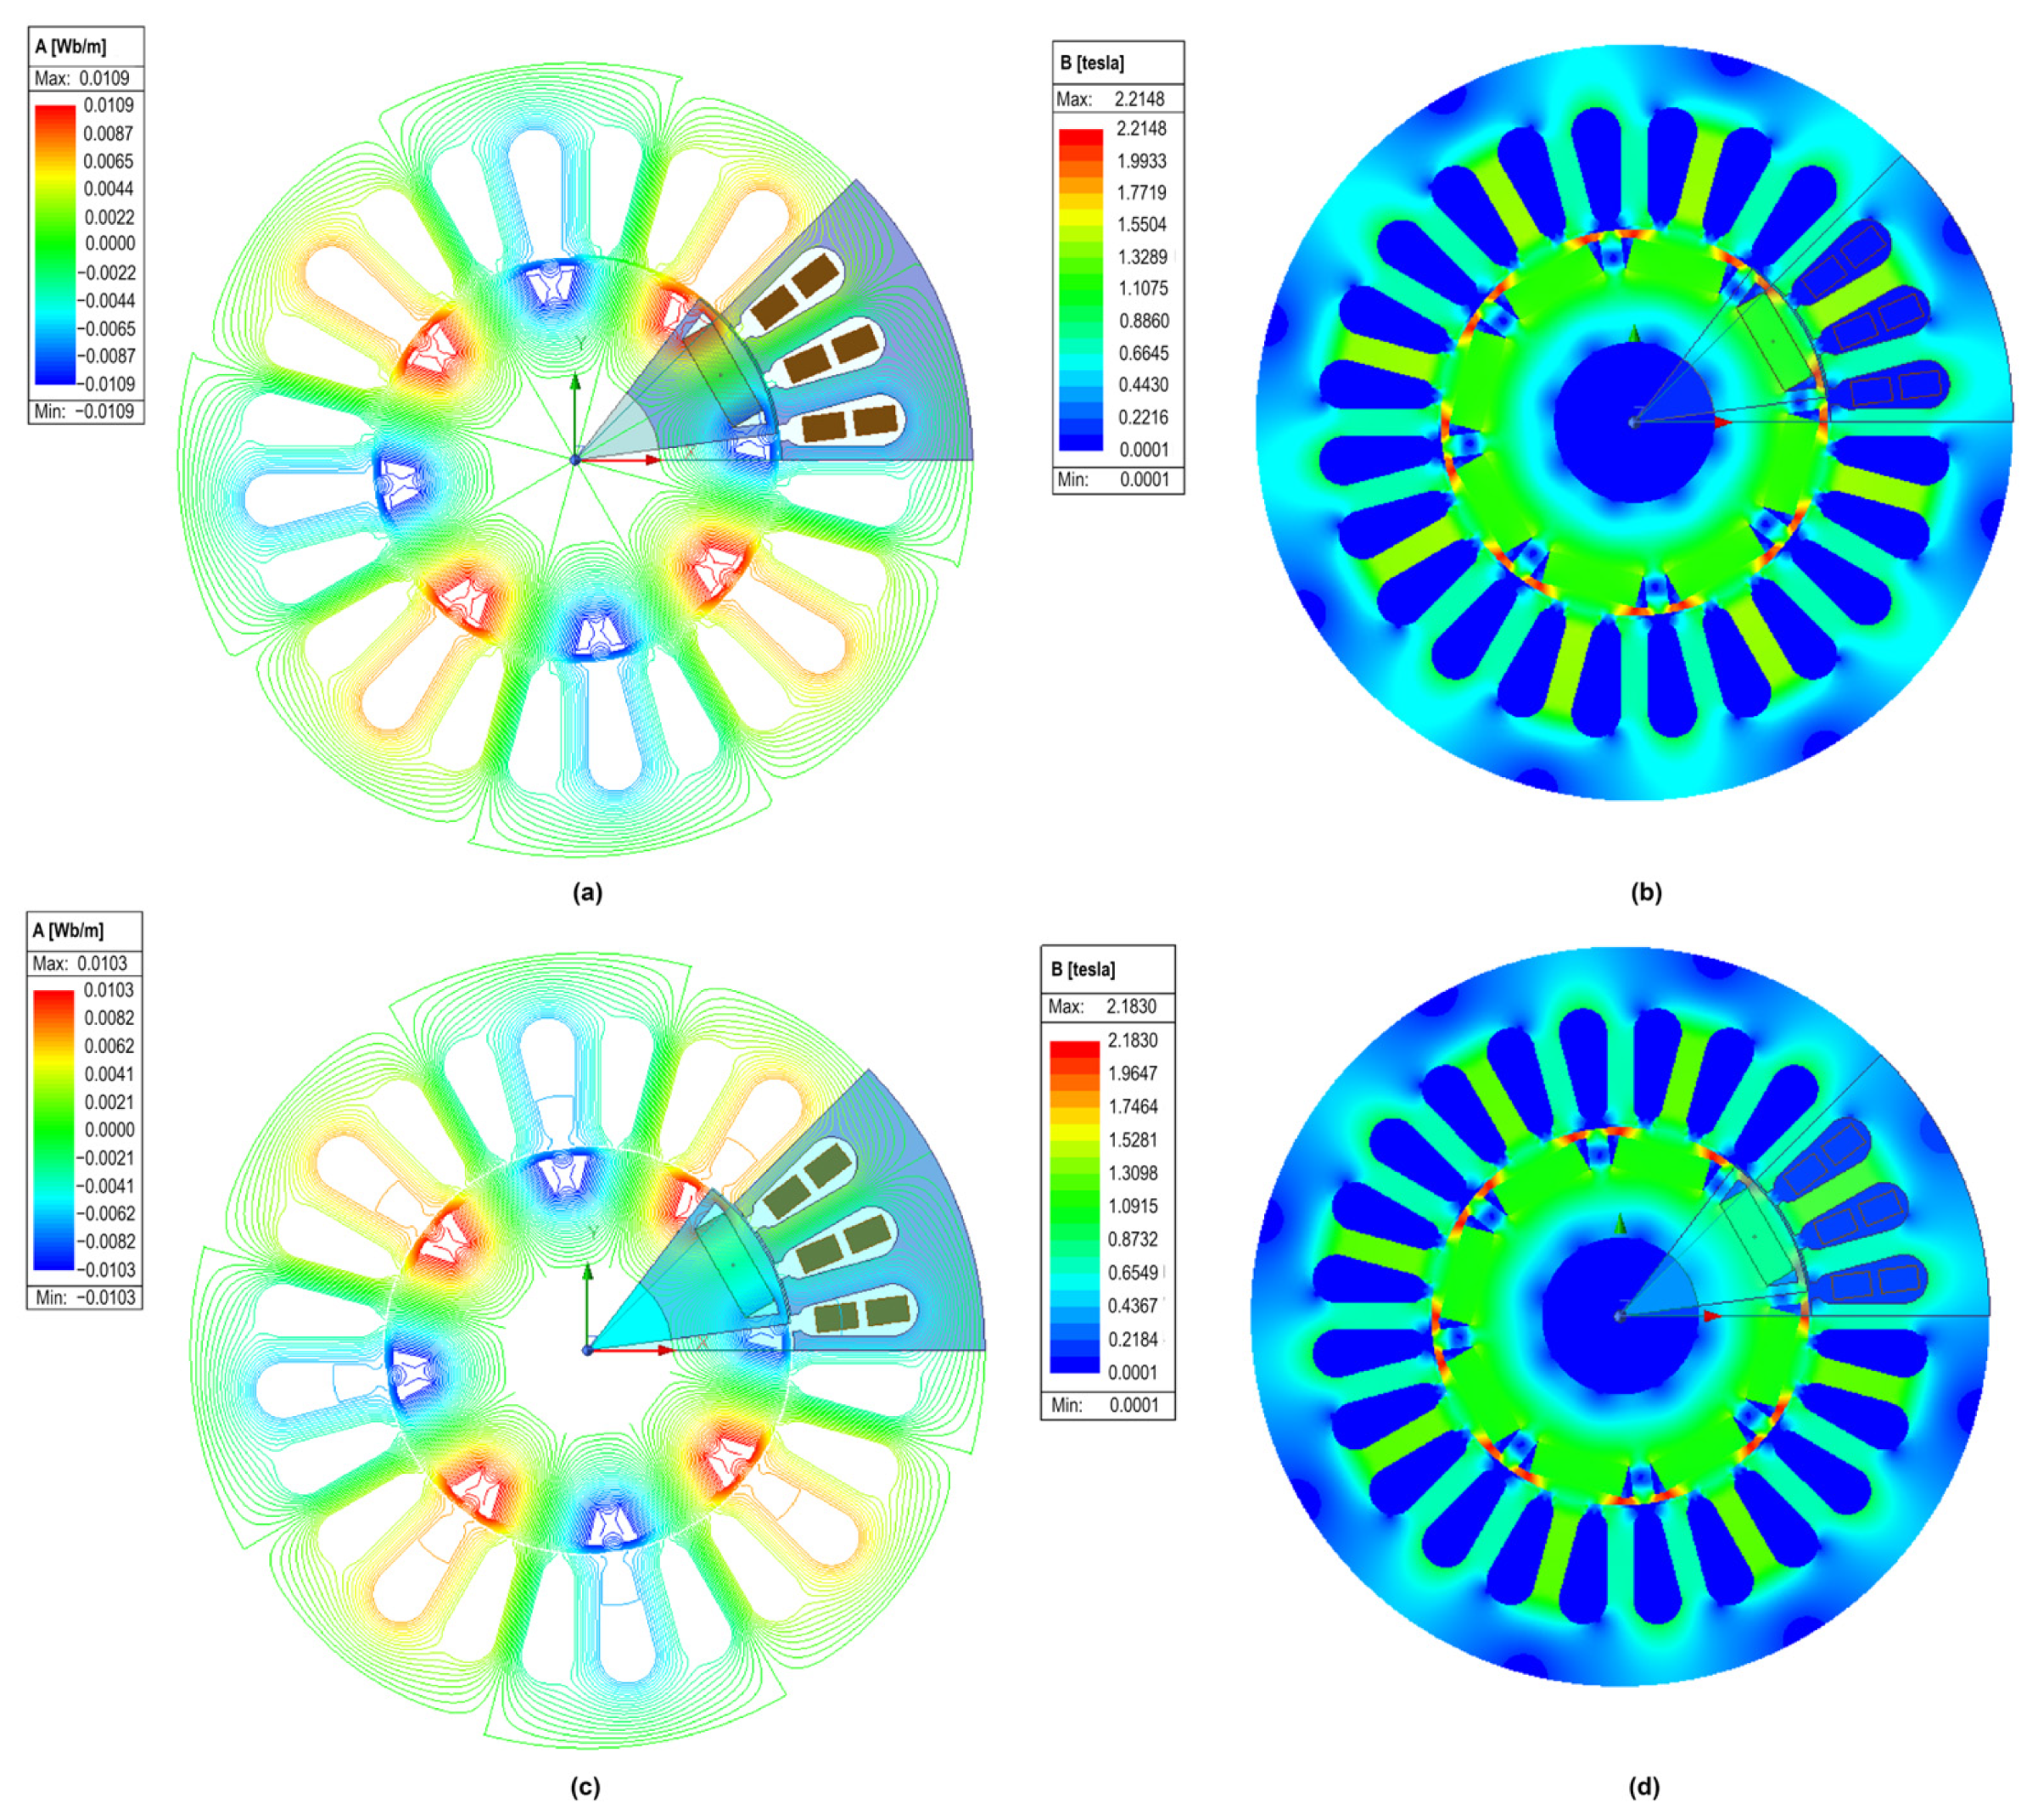
Finally, Figure 15 presents the magnetic flux lines and the magnetic flux density distribution at t = 0 s. The thermal coupling in Case 2 produces a slight attenuation of the flux compared to Case 1: the vector magnetic potential A decreases from 0.0109 Wb/m to 0.0103 Wb/m (~5.5%), while the maximum magnetic flux density B m a x drops from 2.2148 T to 2.1830 T (~1.43%). This moderate reduction in A and B is consistent with the slight decrease in losses observed in Case 2, as thermal effects mitigate magnetic field-dependent losses such as hysteresis and eddy currents.
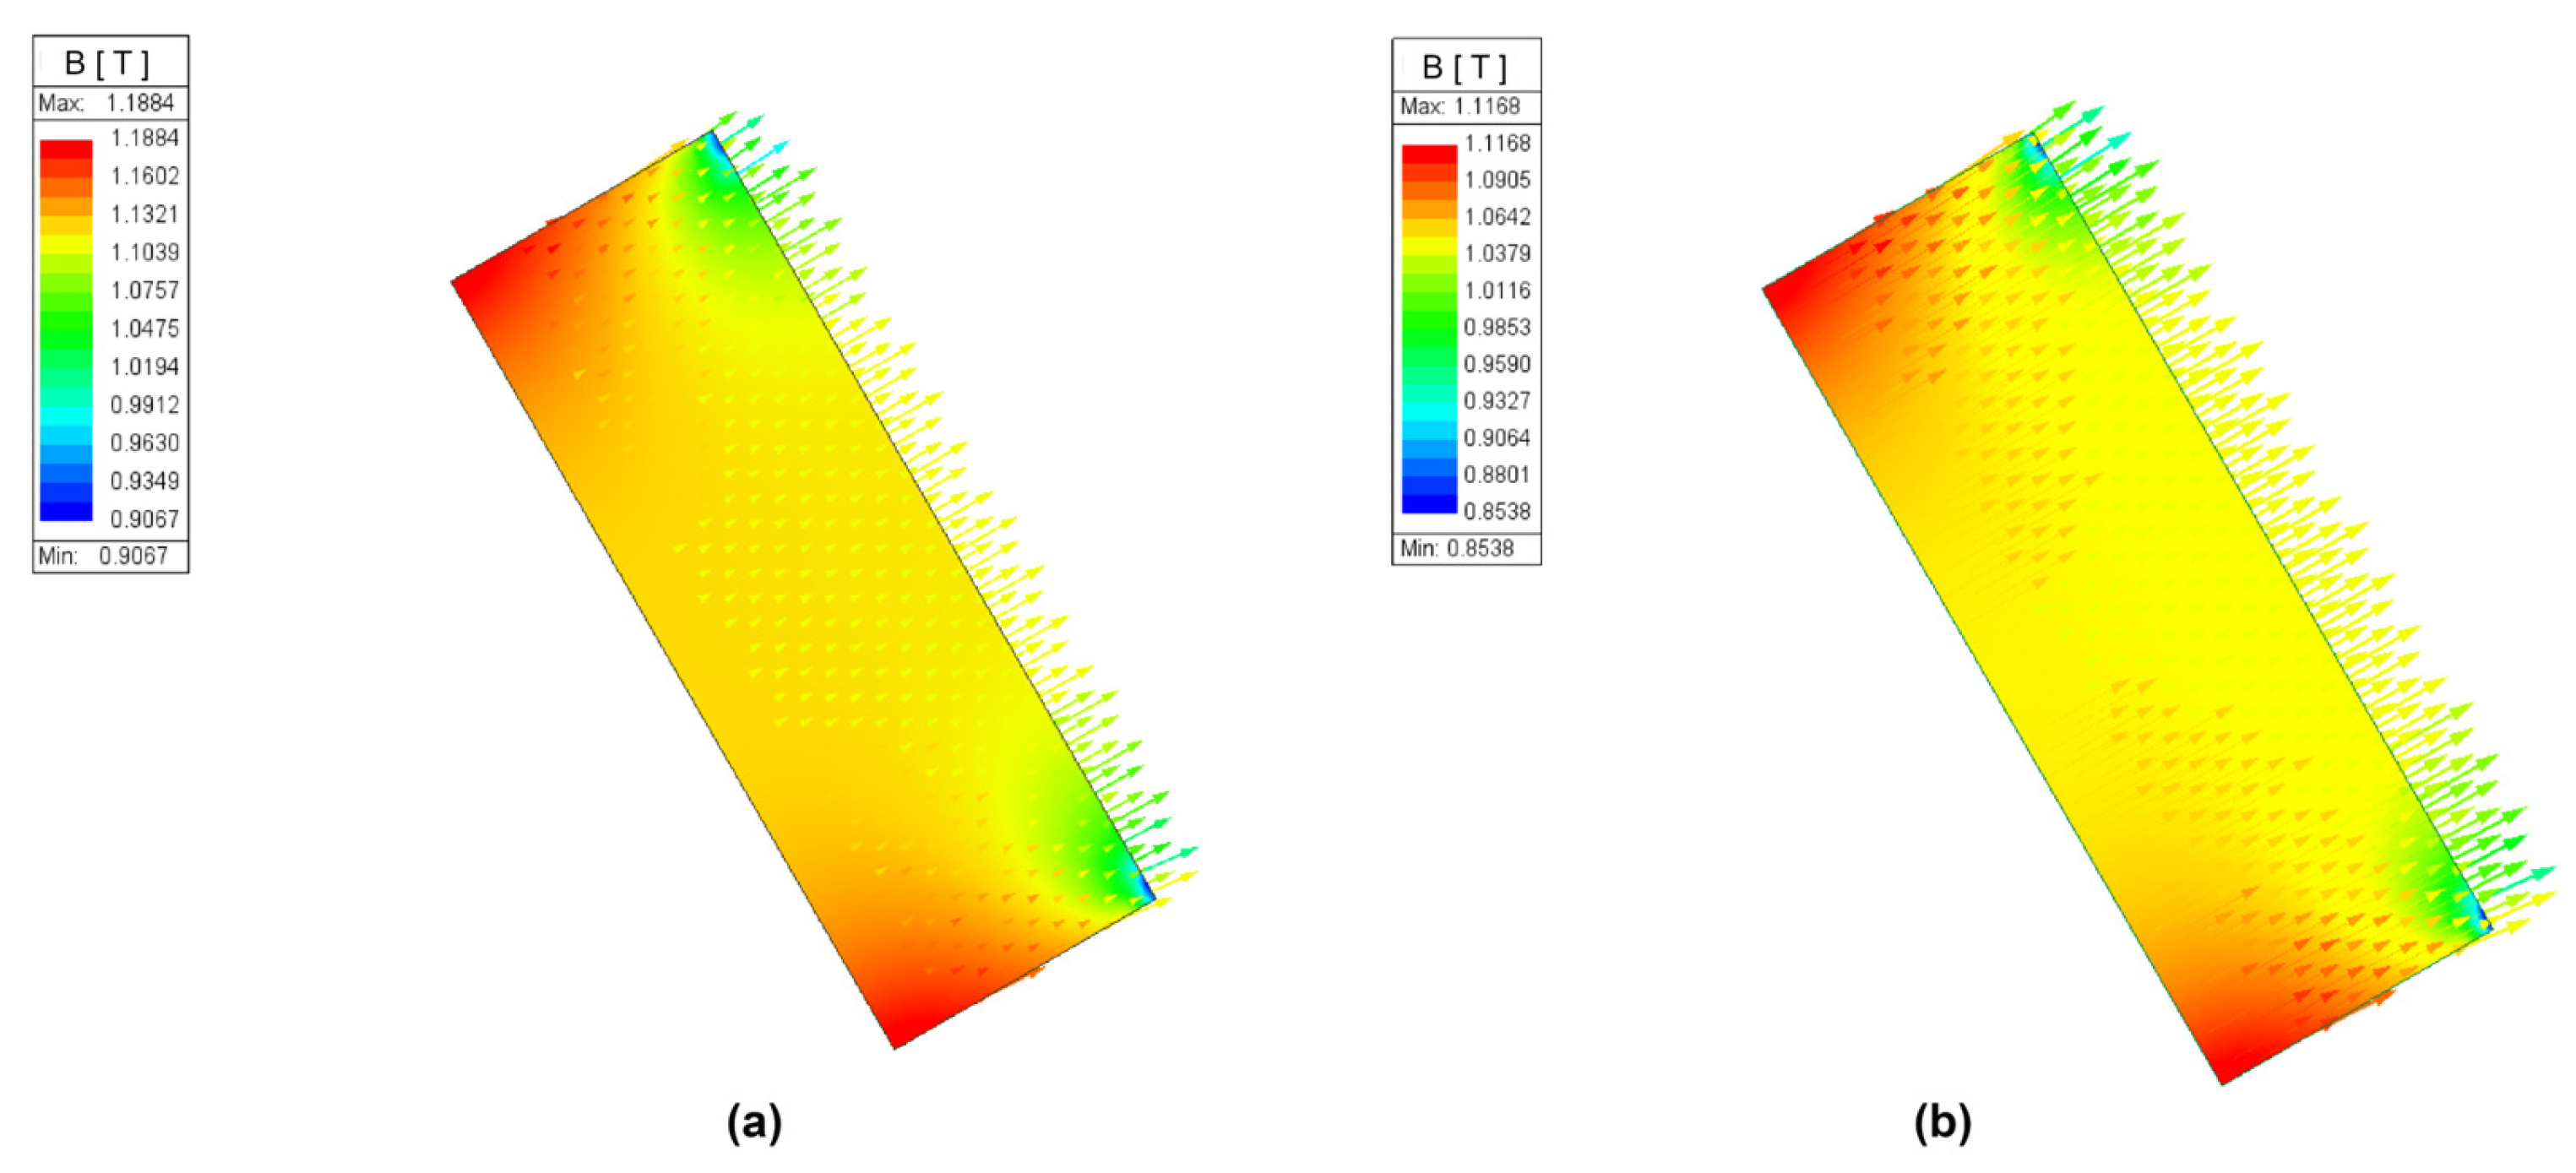
Figure 16 shows the instantaneous magnetic field distribution in the PM for Cases 1 and 2. The maximum magnetic flux density decreases from 1.1884 T to 1.1168 T (~6% reduction), and the minimum value from 0.9067 T to 0.8538 T (~5.83% reduction) when thermal feedback is incorporated in Case 2. These reductions indicate a loss of effective flux in the PMSG when the actual PM temperature increases, a phenomenon explained by the combined physical effects analyzed. The temperature rise reduces both the remanent flux density and the coercivity of the PMs, increasing the effective reluctance and decreasing B .
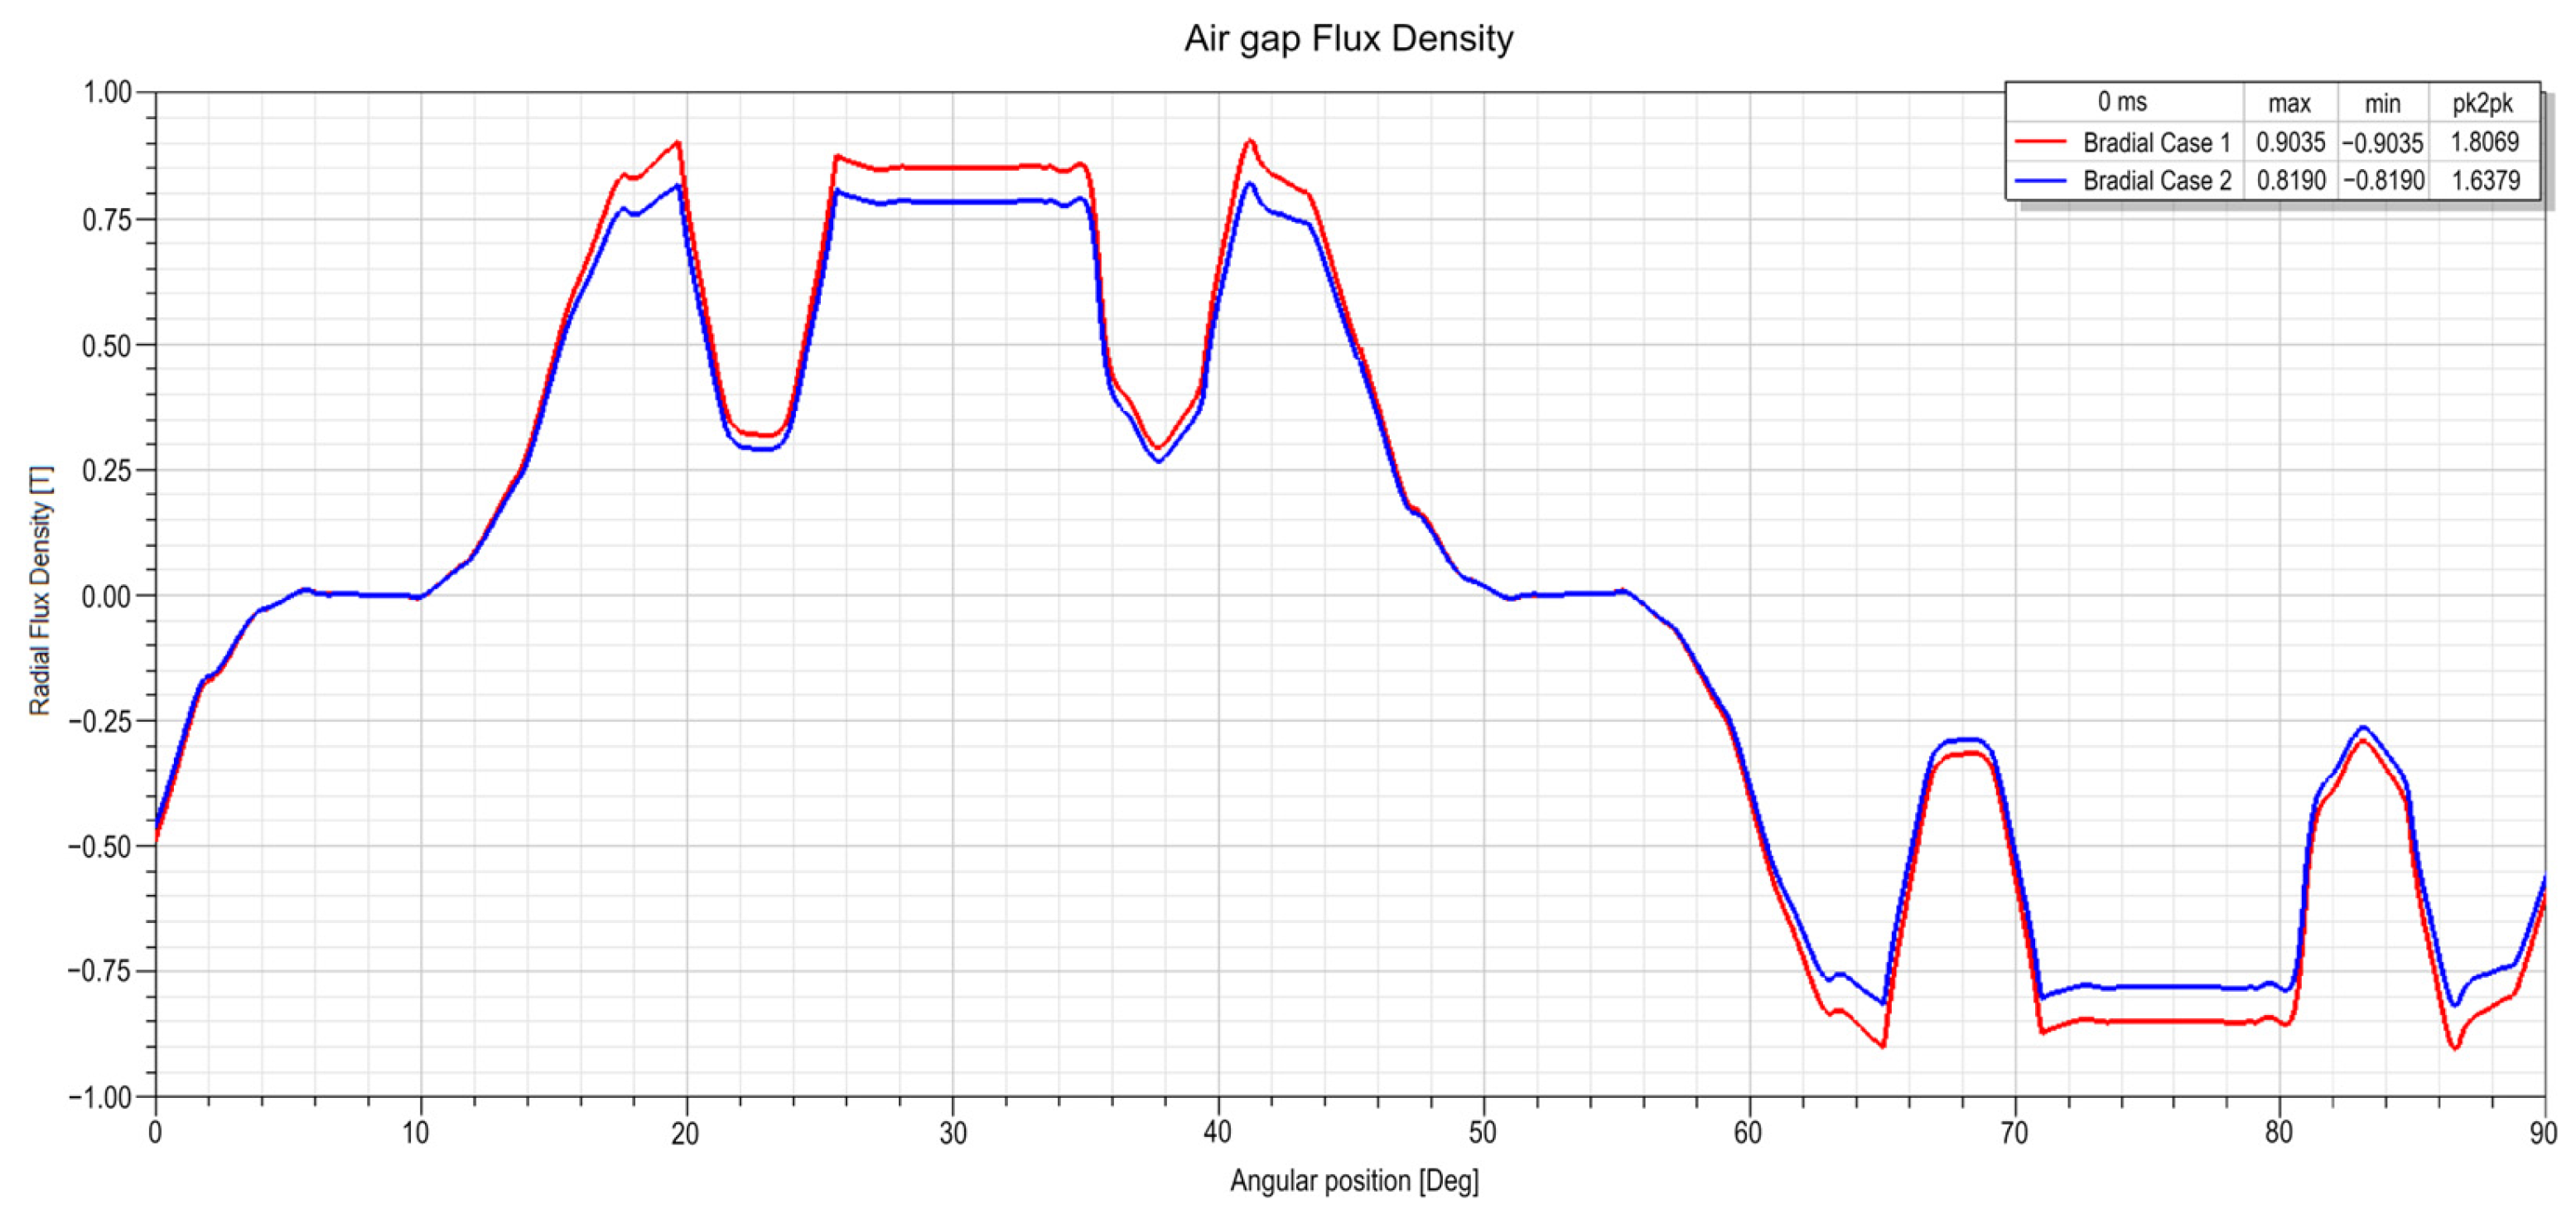
Figure 17 presents the radial flux density for Case 1 and Case 2. At t = 0, the radial flux density ( B r a d i a l ) in the air gap shows a significant reduction under thermal coupling, B r , m a x decreases from 0.9035 T in Case 1 to 0.8190 T in Case 2 (~9.35% reduction). This drop is consistent with the decrease in the vector potential A and the flux density distribution observed in Figure 15 and Figure 16.
From a practical standpoint, a ~ 9.35% reduction in B r a d i a l results in lower induced voltages (Figure 13a,b), decreased electrical power generation (Figure 14), and slight variations in B dependent losses (Table 6). This behavior highlights the importance of ensuring that the B r ( T ) curves and magnetic properties of the PM are properly updated in the coupling, verifying the iterative convergence of the electromagnetic-fluid-thermal interaction (discussed in Section 5.1) together with adequate meshing of the PMSG, and evaluating the overall impact on machine performance to confirm that the observed reductions correspond to actual physical effects rather than numerical error.
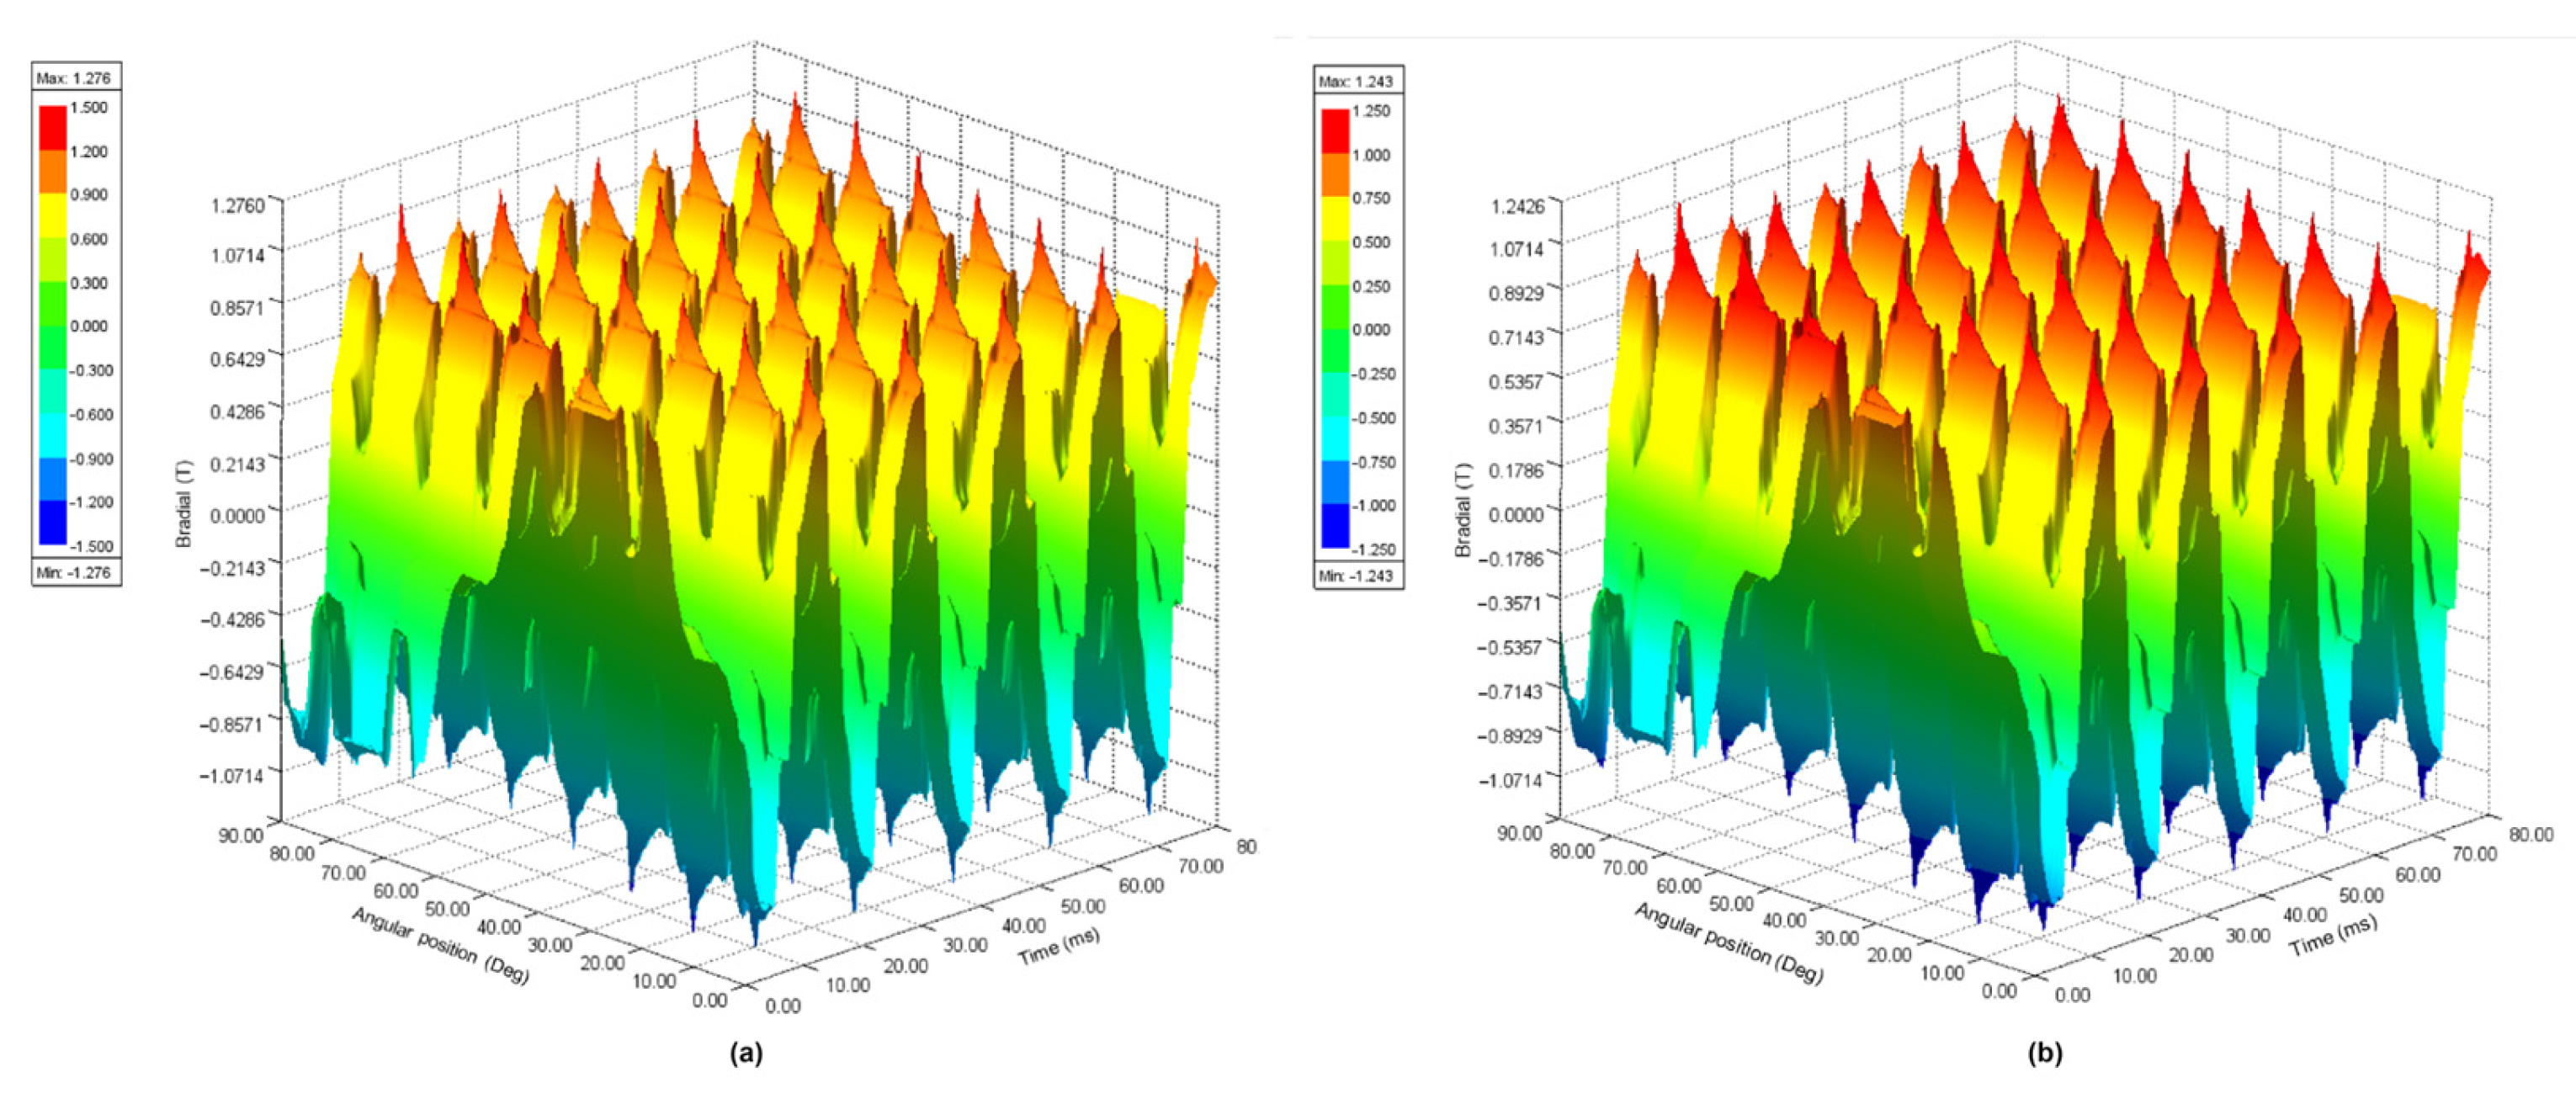
Figure 18 shows the time-dependent behavior of B r a d i a l under steady-state conditions for Cases 1 and 2. Case 1 reached a maximum value of 1.276 T, while Case 2 reached 1.243 T (~2.60% reduction).
Figure 19 presents the demagnetization curves and recoil lines of the PM in four specific regions during the steady-state transient simulation for both cases. In Case 1 (see Figure 19a), all evaluated points remain away from the knee region of the demagnetization curve, ensuring a safety margin against irreversible losses. Point 2 (central PM region) exhibited the highest B values (1.1373 T to 1.0790 T), followed by the global PM average (1.1240 T to 1.0685 T), while corner points (1 and 3) registered lower values. In Case 2, reduction of B is observed (see Figure 19b). Point 2 lies between the 60 °C and 80 °C characteristic curves, while the average B in the full PM approaches the 80 °C curve. Points 1 and 3 reach levels of B near the 120 °C curve, indicating higher thermal sensitivity at the PM corners. In no case was the critical knee region reached, confirming that the design preserves the PM integrity under steady-state operating conditions.

5. FEM-CFD Analysis

5.1. Convergence for Case 2

In CFD problems, careful attention must be paid to the solution convergence. In Ansys Fluent, convergence monitoring involves verifying that the governing Equations (continuity, momentum, energy, k , and ω ) are satisfactorily solved. For Case 2, two approaches were used to monitor convergence: residuals and flow variable monitors. Residuals are defined as the imbalance between the left- and right-hand sides of the discretized governing equations for all domain cells. If residuals decrease below the specified convergence criteria, the equations are considered sufficiently solved. In practice, residuals cannot reach an absolute value of zero; therefore, convergence thresholds must be defined and met.
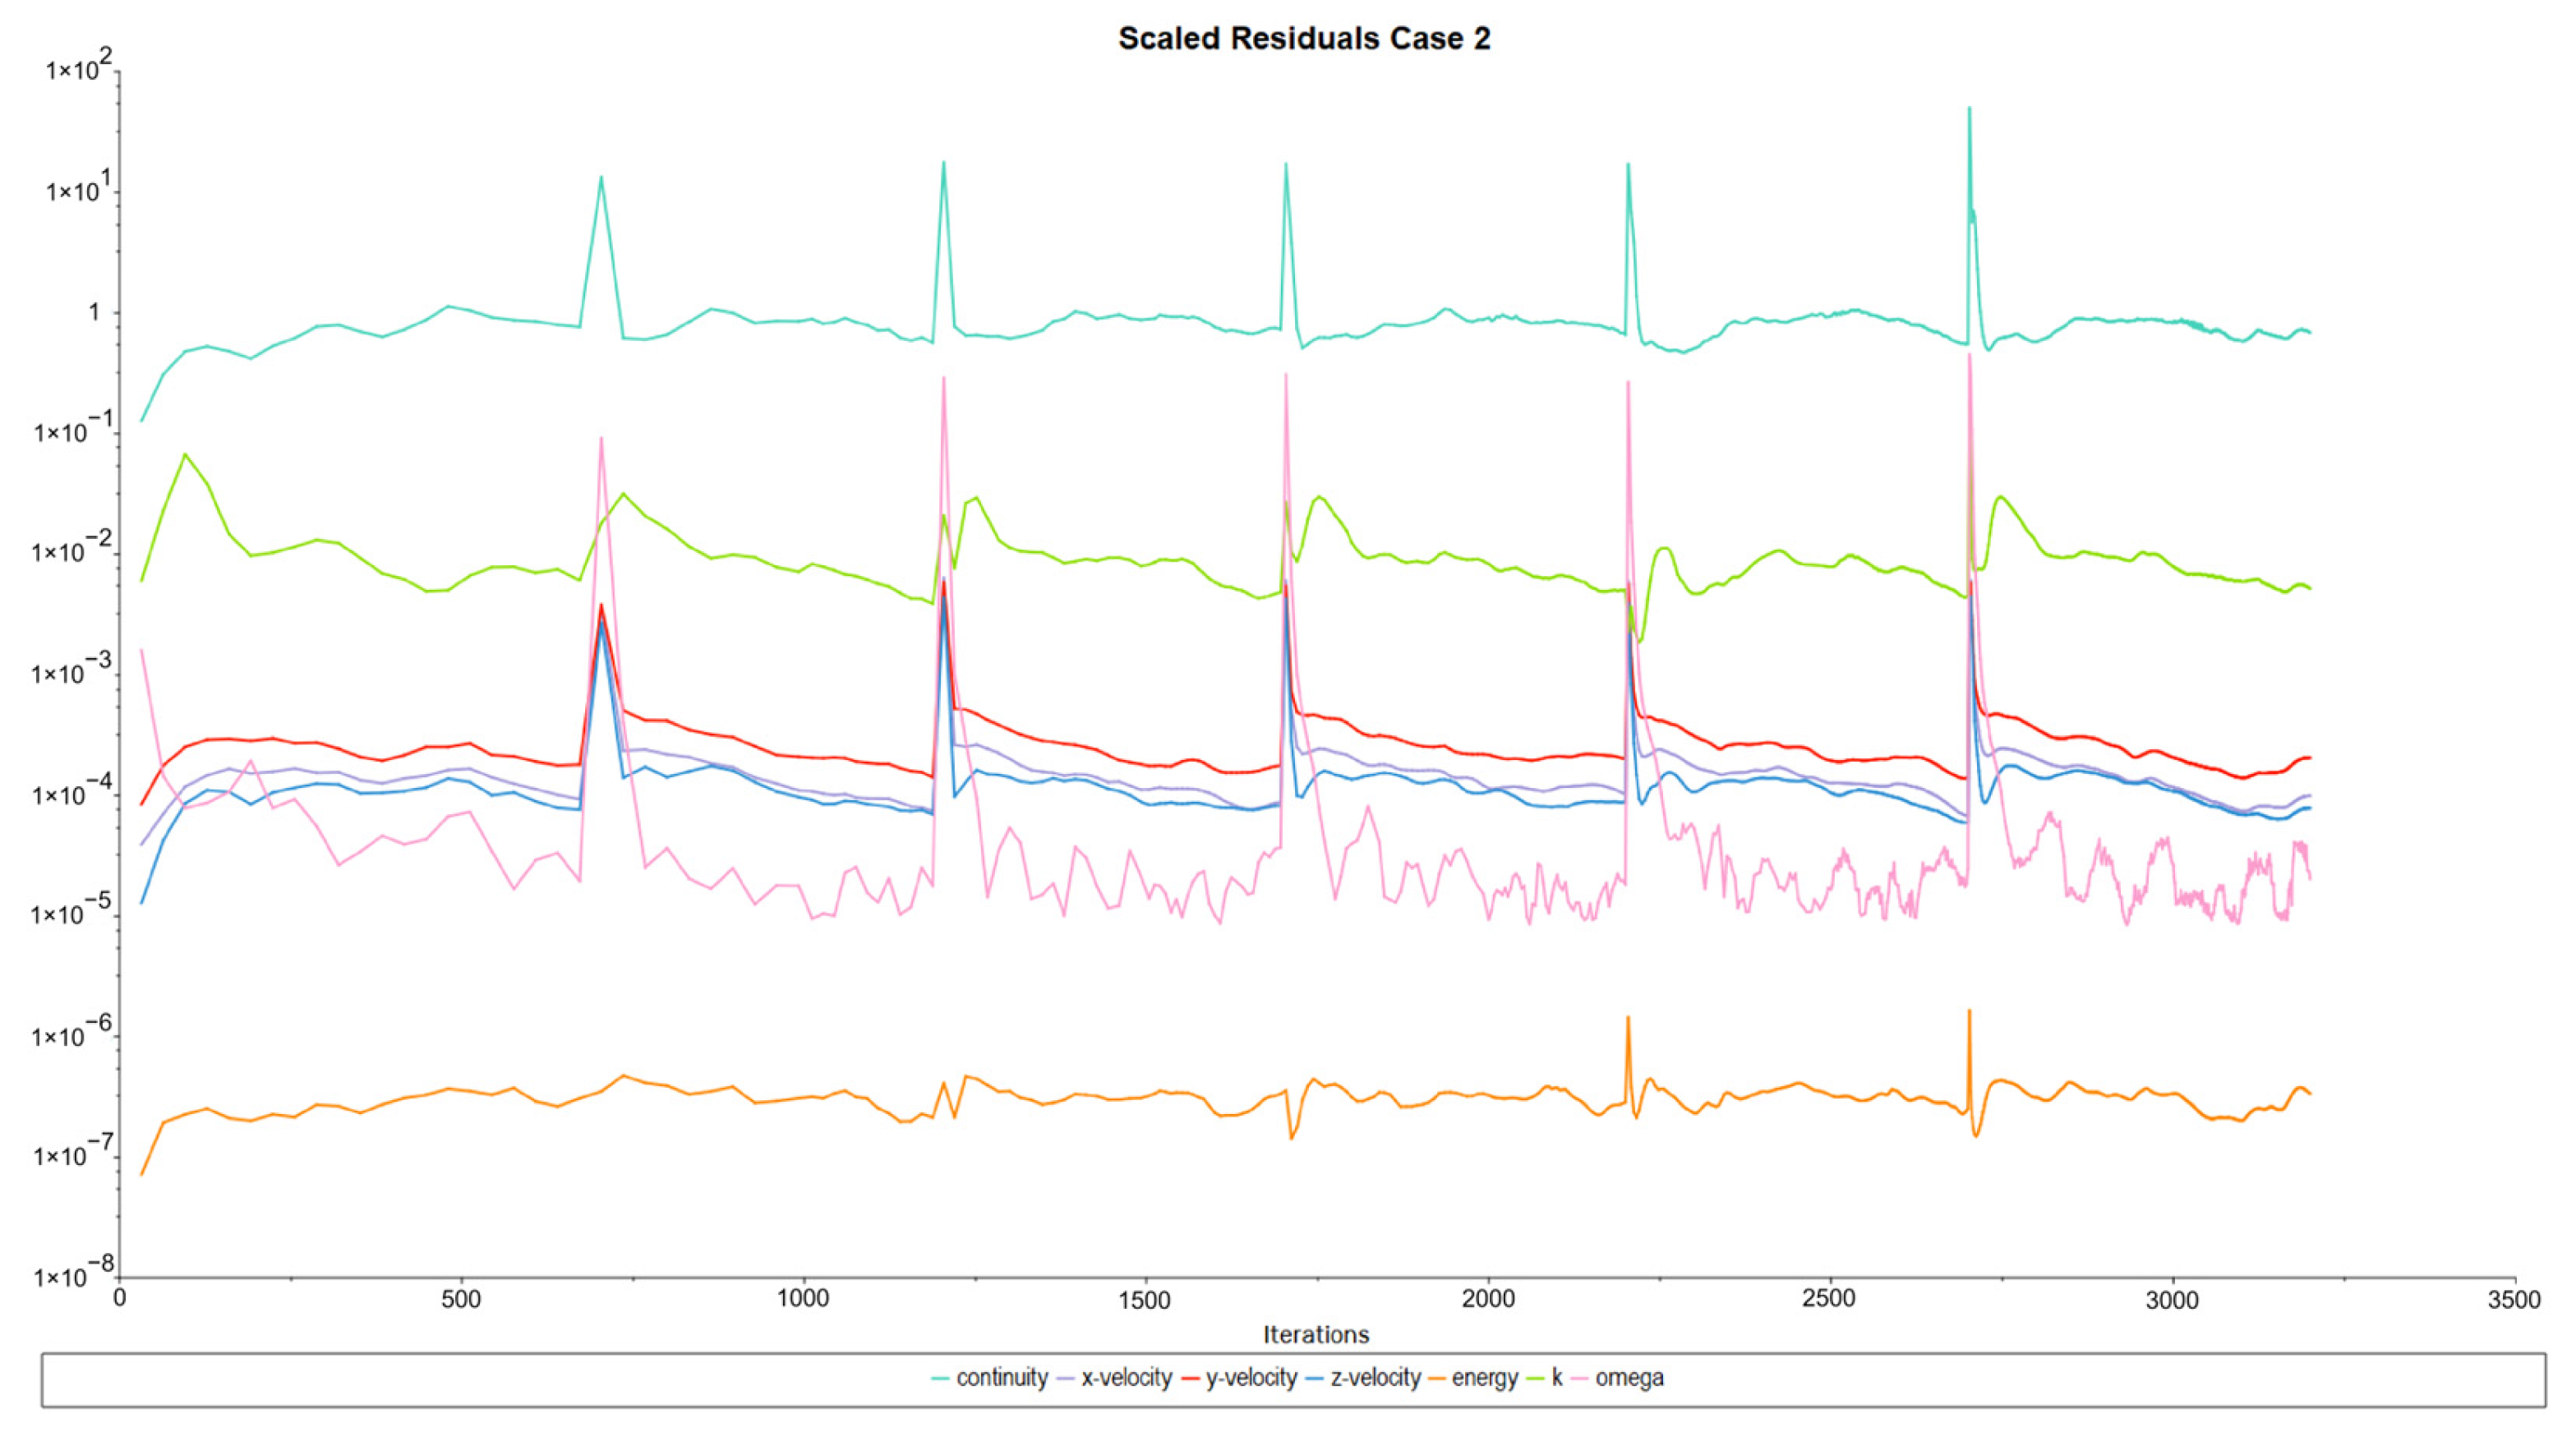
Figure 20 presents the residual histories for Case 2, where convergence criteria were set to 1 × 10⁻⁶ for all governing equations. In the FEM–CFD coupled simulation of Case 2, 700 iterations were performed, followed by five iterations of the feedback iterator, each with 500 additional iterations, resulting in a reduction of 200 from the initial CFD setup due to the improved numerical stability at steady-state conditions. Resulting in a total of 3200 iterations, as shown in Figure 20.
The residuals exhibited peaks at the start of each feedback initialization cycle. While the energy residual successfully reached the convergence threshold, the continuity, momentum, k , and ω residuals did not. This does not indicate a lack of convergence; rather, it reflects the detailed resolution of convective phenomena in the end winding and external air regions of the PMSG, as well as turbulence induced by rotor rotation in the air gap and convective effects associated with temperature rise.
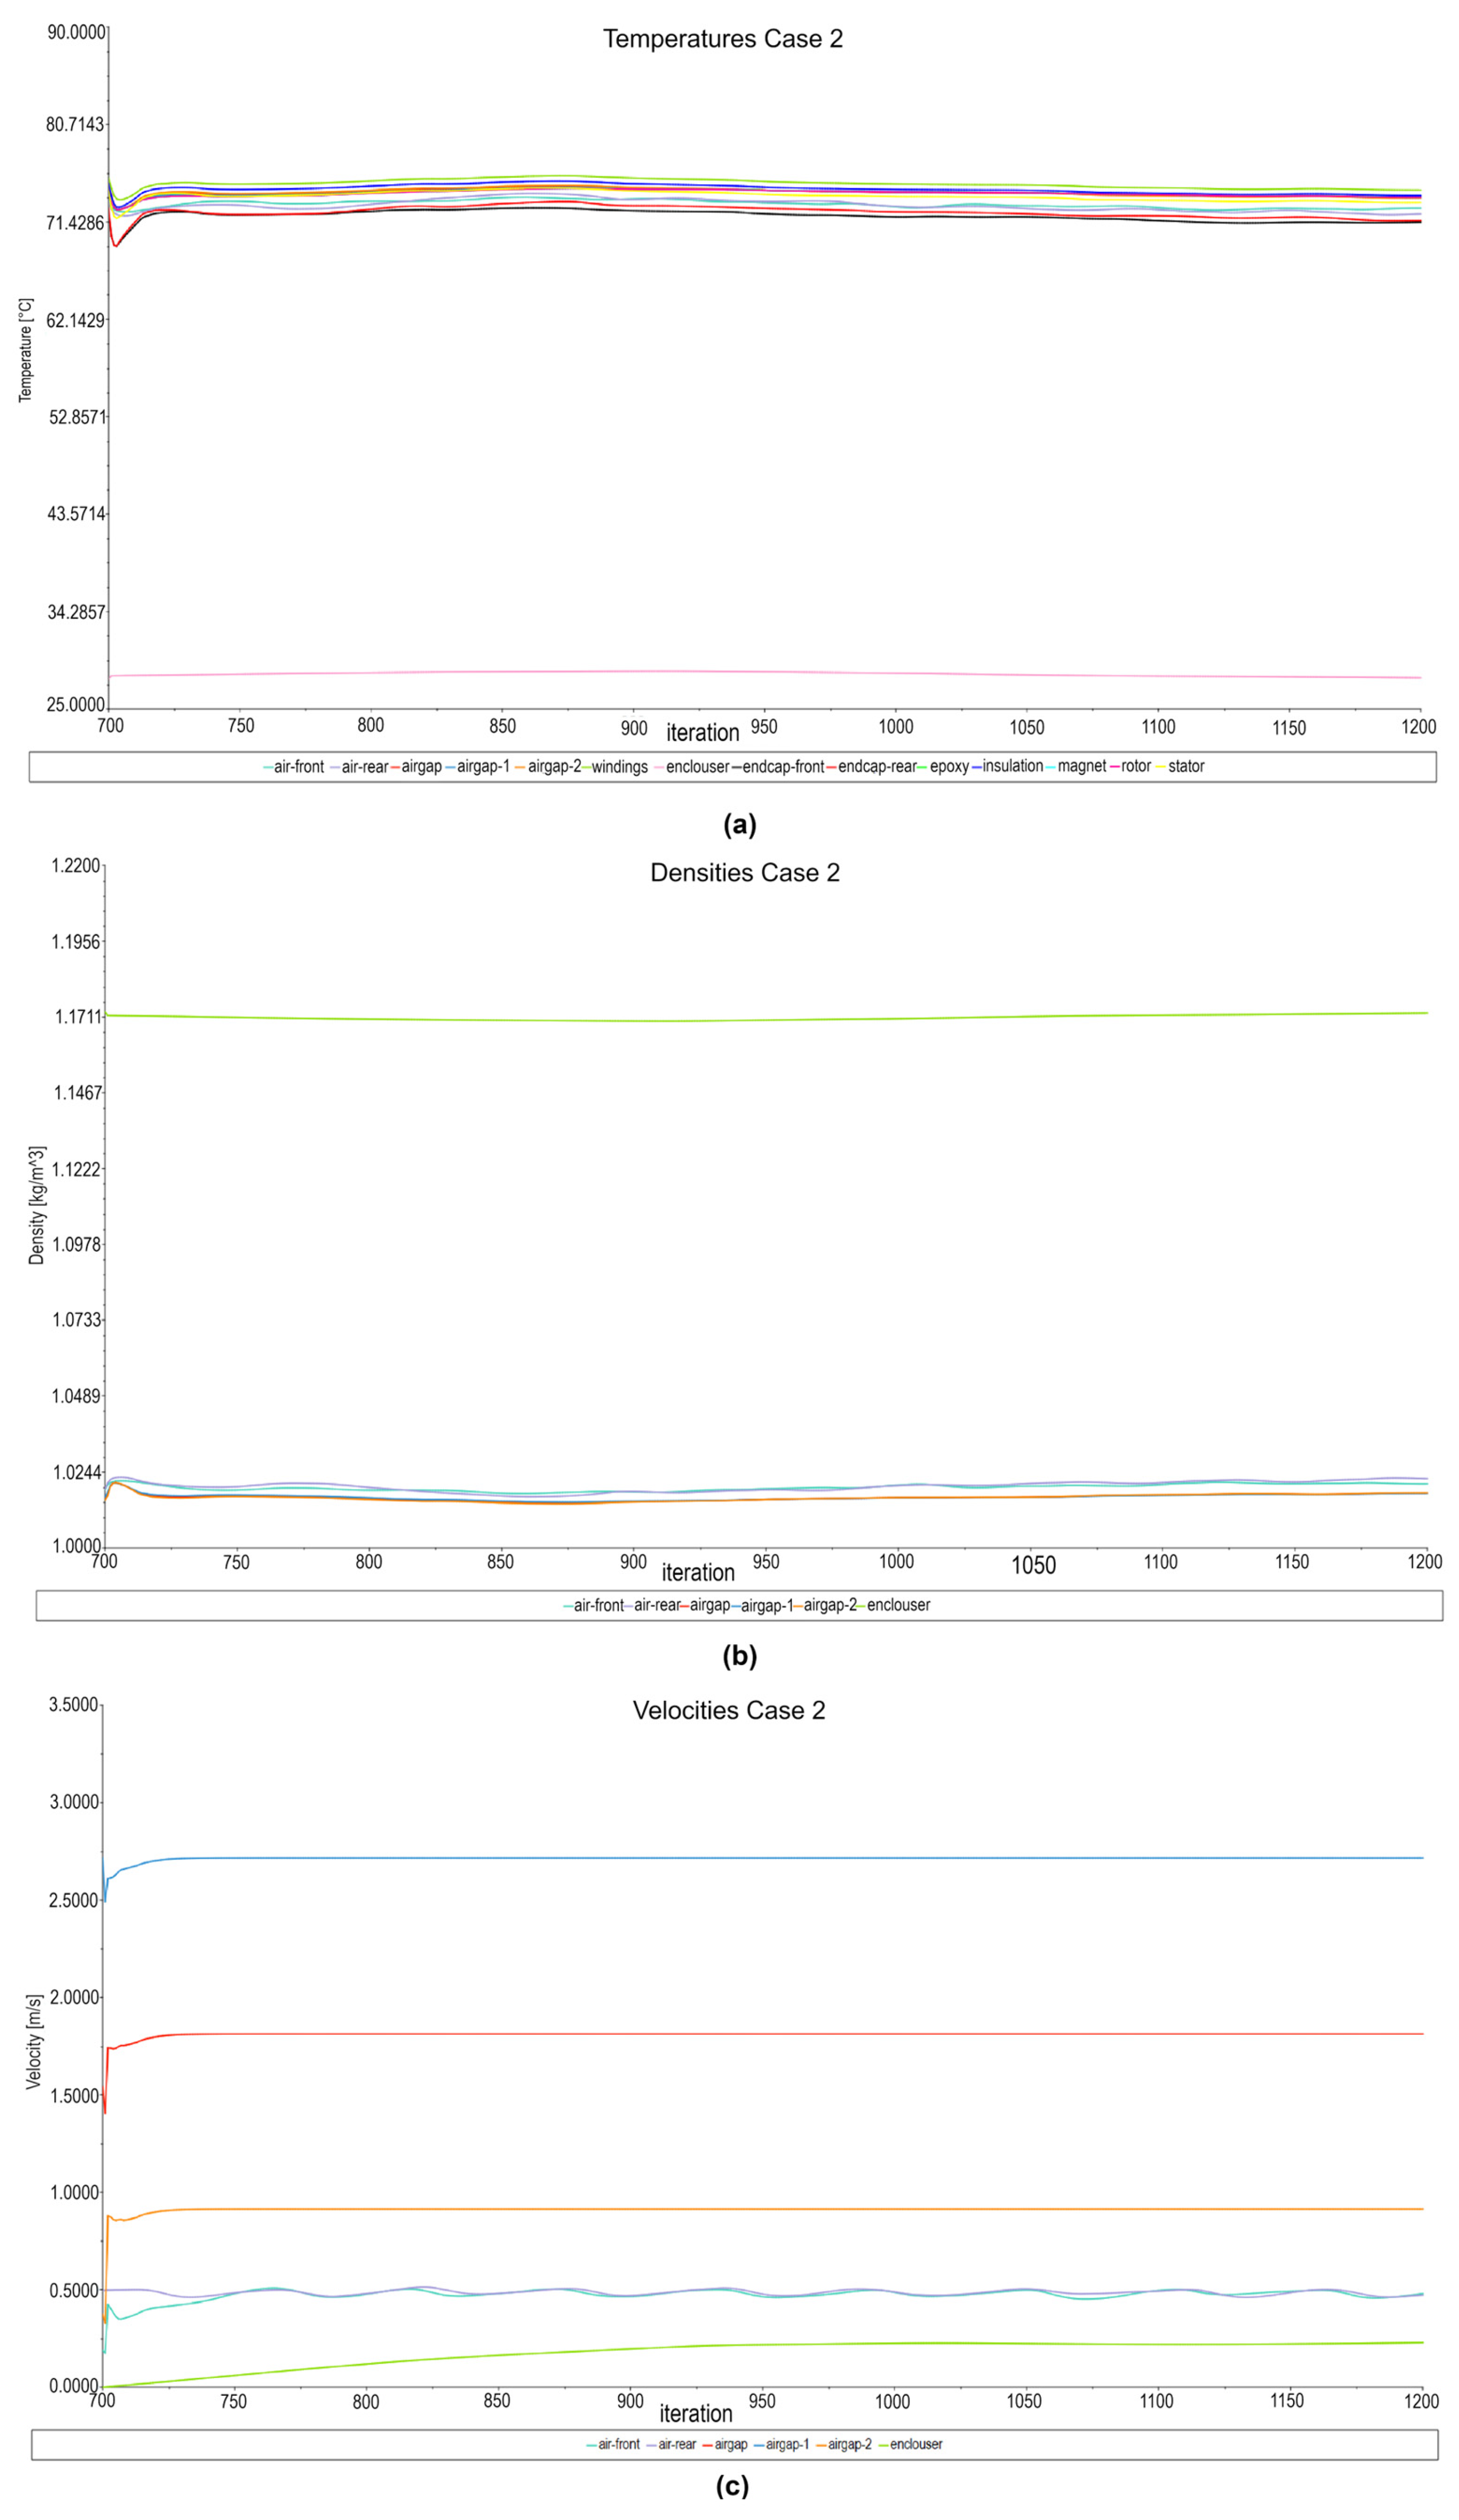
Residual monitoring alone is insufficient to guarantee convergence, numerical stability, and physically consistent solutions. Therefore, flow monitors were also employed in different domains of the PMSG model, as shown in Figure 21. These monitors tracked the volume-averaged temperature in both the solid and fluid regions, as well as fluid density and velocity, reporting results only for the final feedback iterator. The fluid regions include the fluid domains around the front and rear end windings (air-front and air-rear), the total air gap, the rotor-side half of the air gap (air gap-1), the stator-side half of the air gap (air gap-2), and the air enclosure. Figure 21a confirms stable average temperature profiles in all regions for Case 2, while Figure 21b shows density variations. In Case 2, air density decreased from ~1.1711 kg/m3 to ~1.0244 kg/m3 due to heating under steady-state operation. Velocity monitors (see Figure 21c) revealed small oscillations in the end winding regions (air-front and air-rear) caused by turbulence and convection, while the remaining fluid regions exhibited linear and stable behavior.

5.2. Thermal Field Results for Case 2

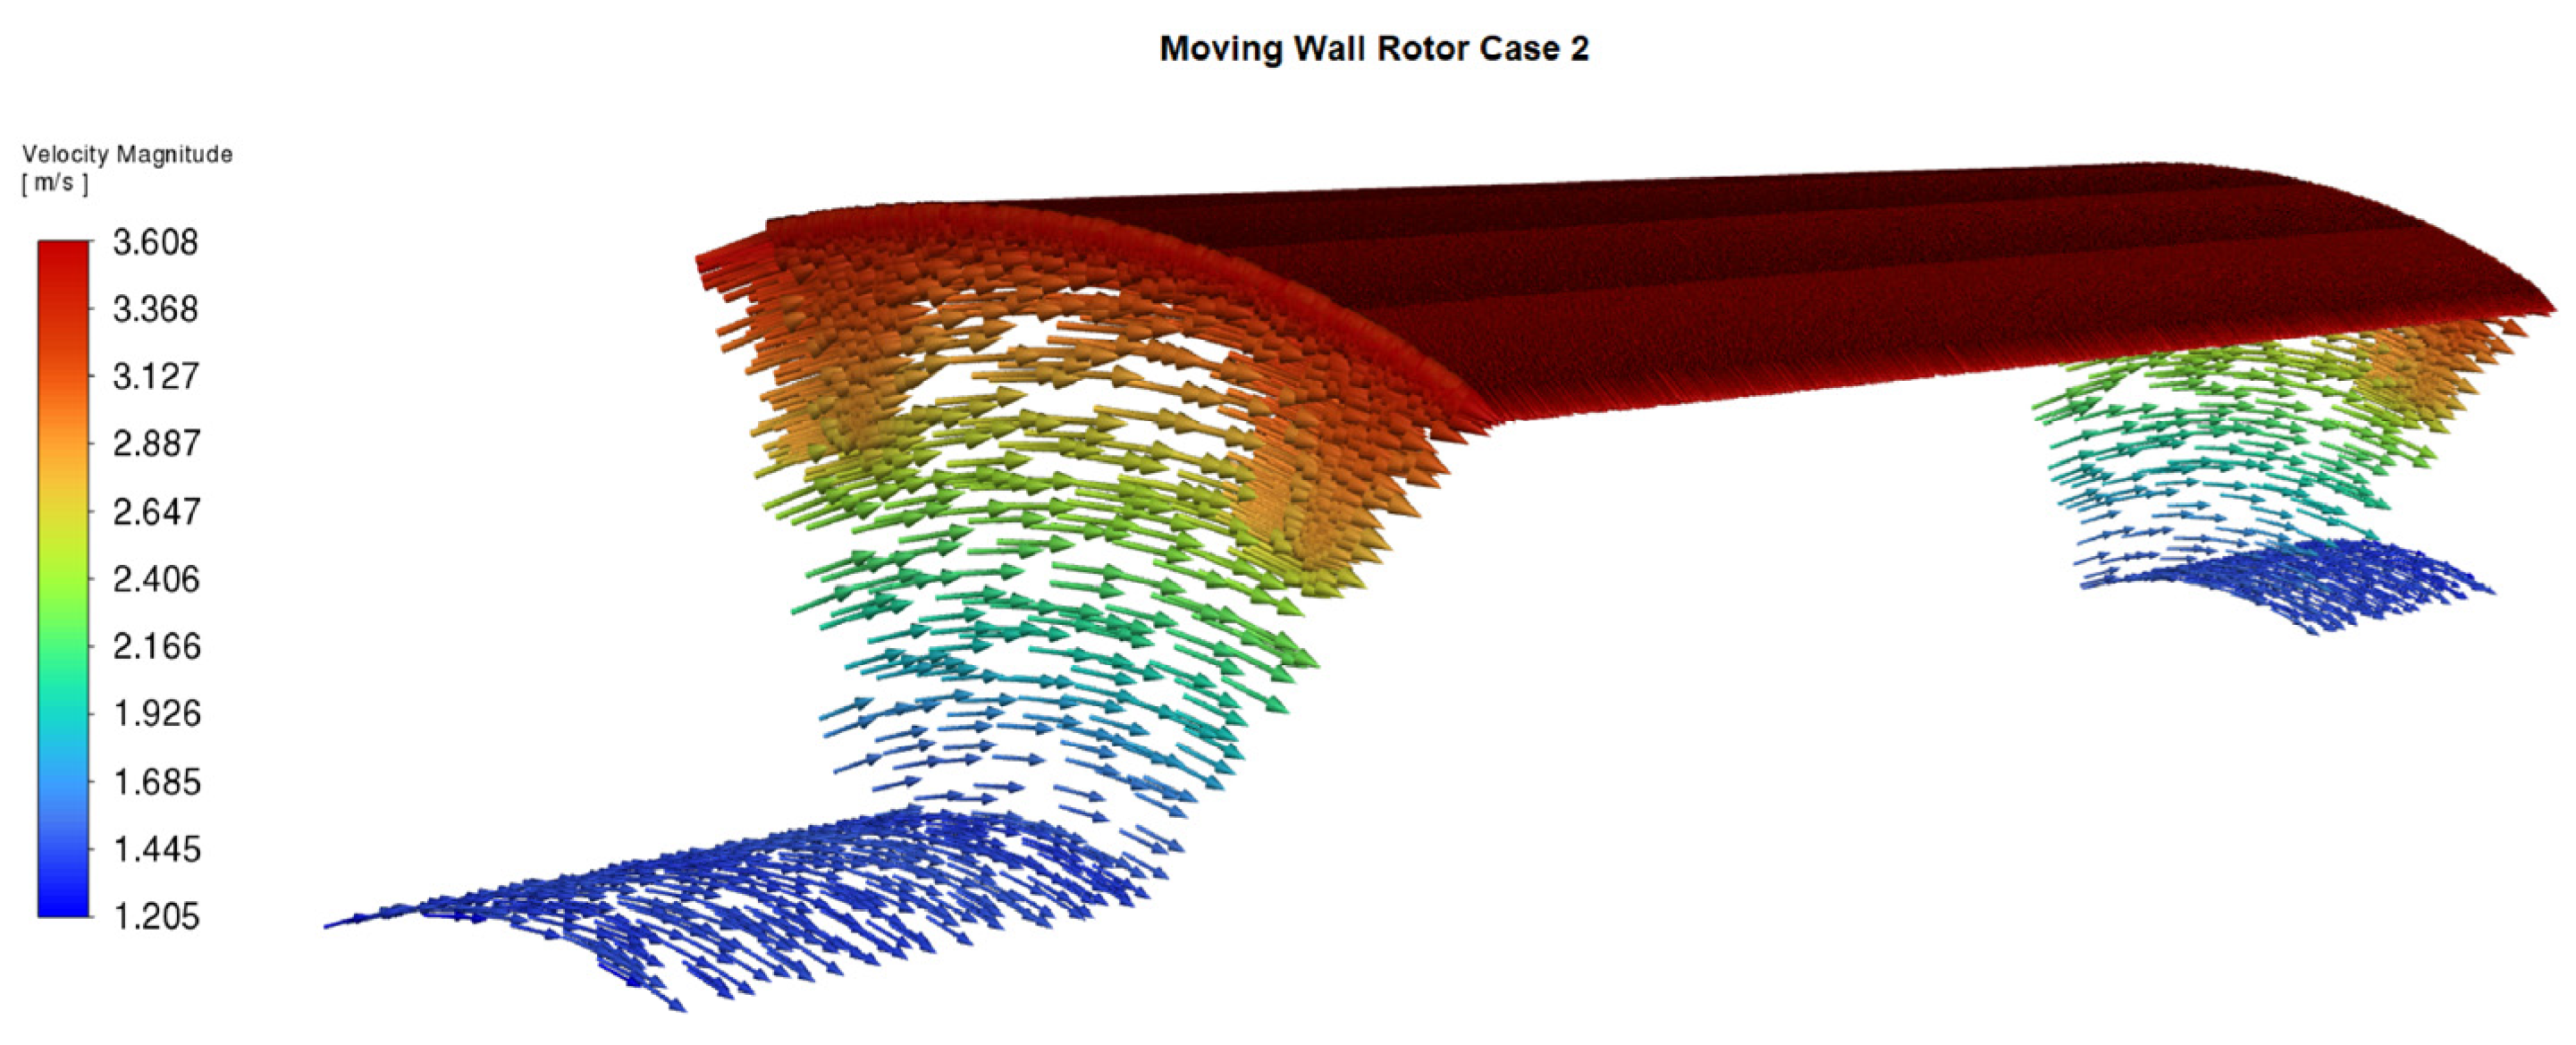
Figure 22 presents the velocity vectors for Case 2 under the boundary conditions of moving walls applied only to the rotor surface and the shaft walls inside the PMSG. The velocity field is distributed consistently with the rotational regime of 900 rpm, reaching a maximum magnitude of 3.608 m/s in Case 2.
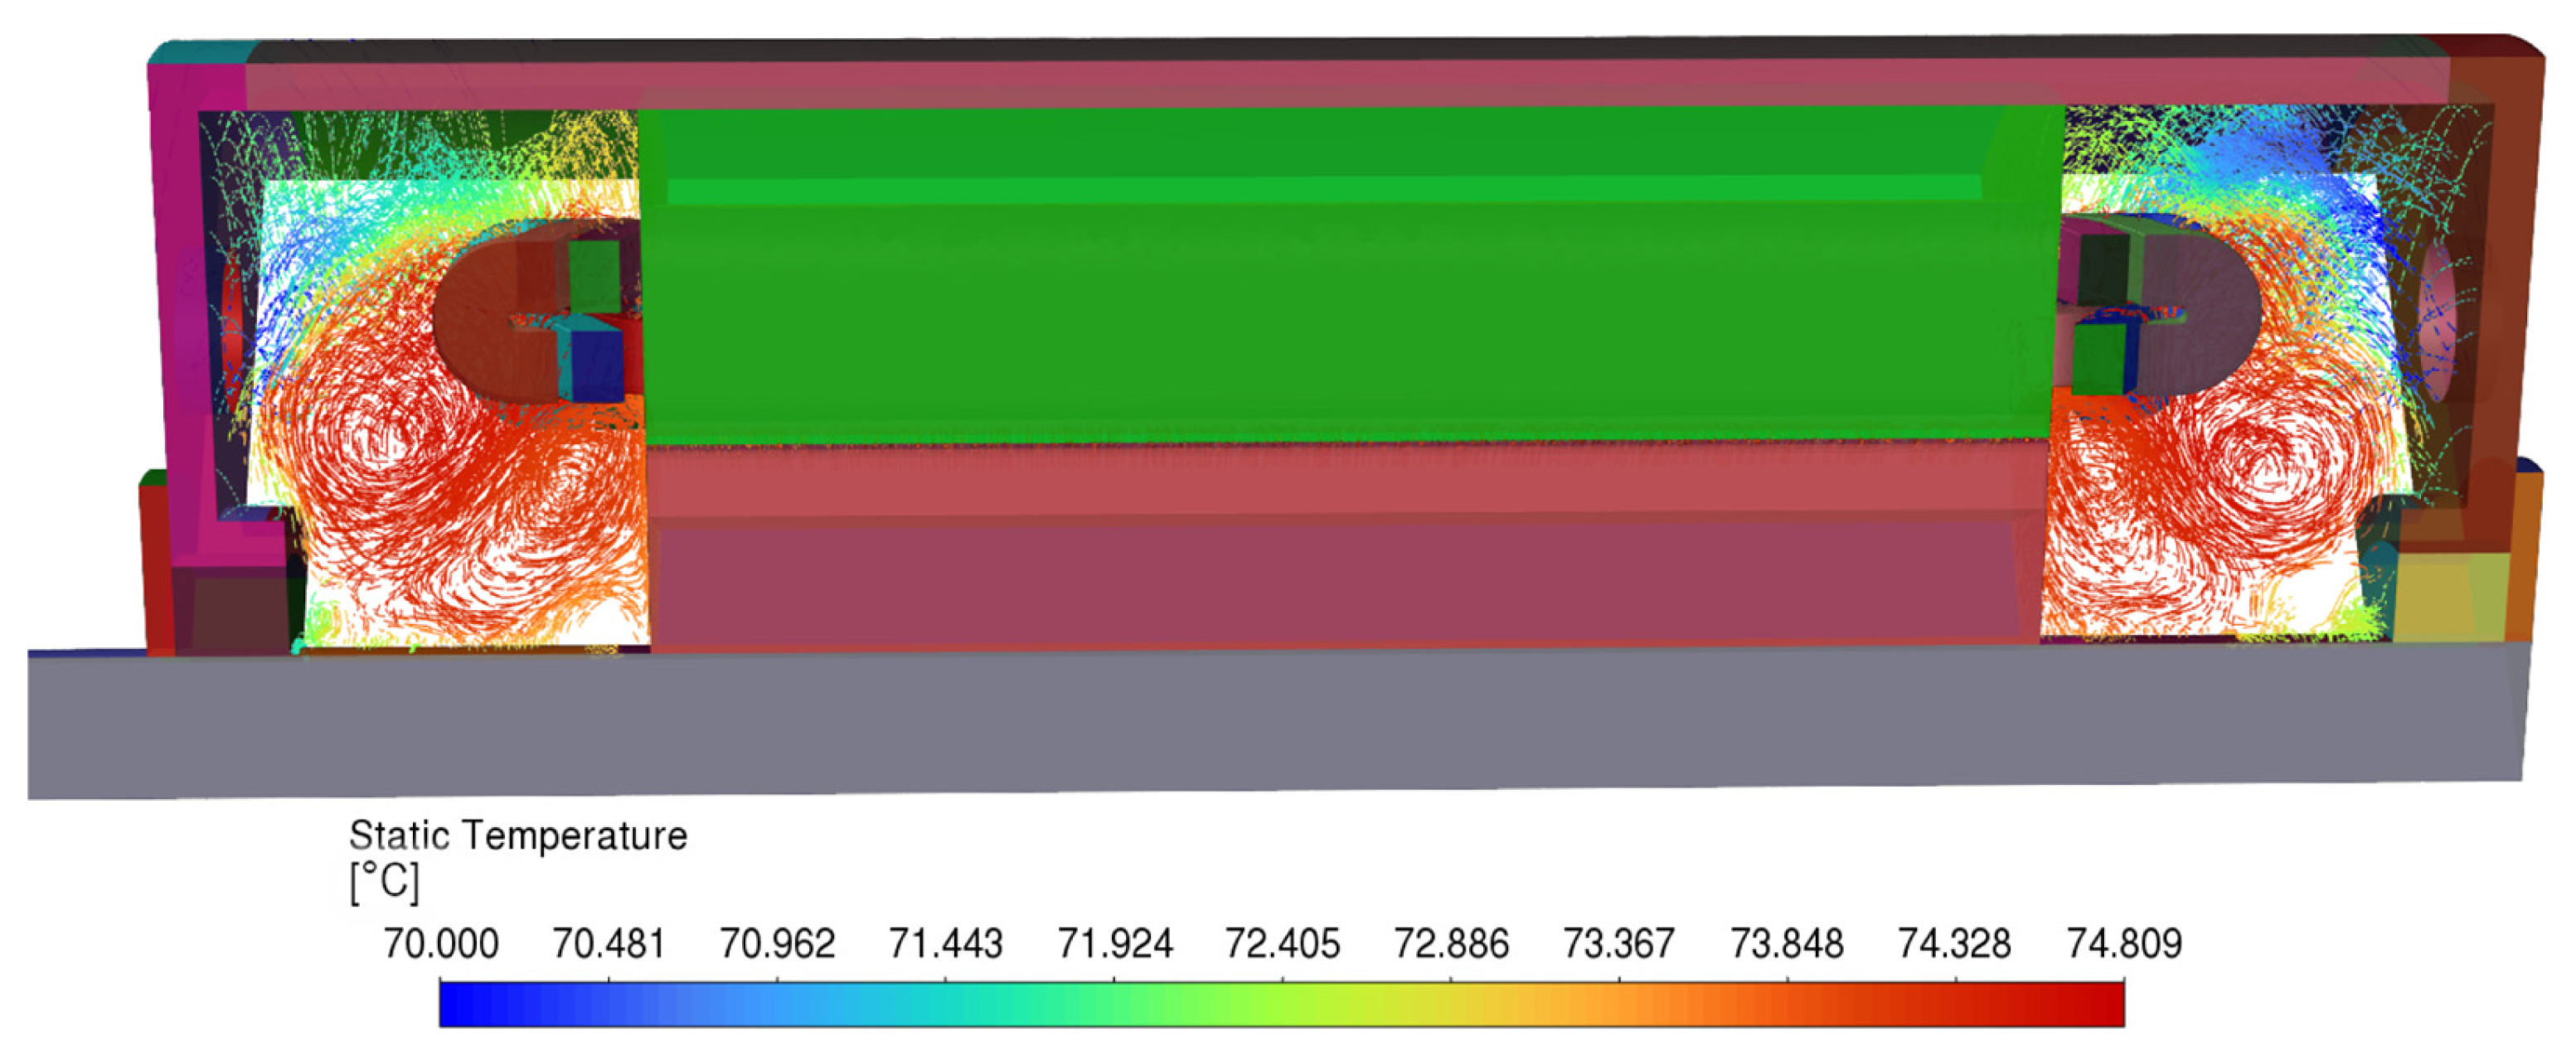
These results reflect proper coupling between the kinematic condition of the walls and the surrounding fluid, ensuring an accurate representation of rotor-induced drag effects. Rotor rotation and convection phenomena in the end windings generate turbulent flow and an increase in temperature in the end winding regions, as shown in Figure 23. The presence of unsteady flow in the end windings enhances heat transfer toward the exterior of the PMSG.
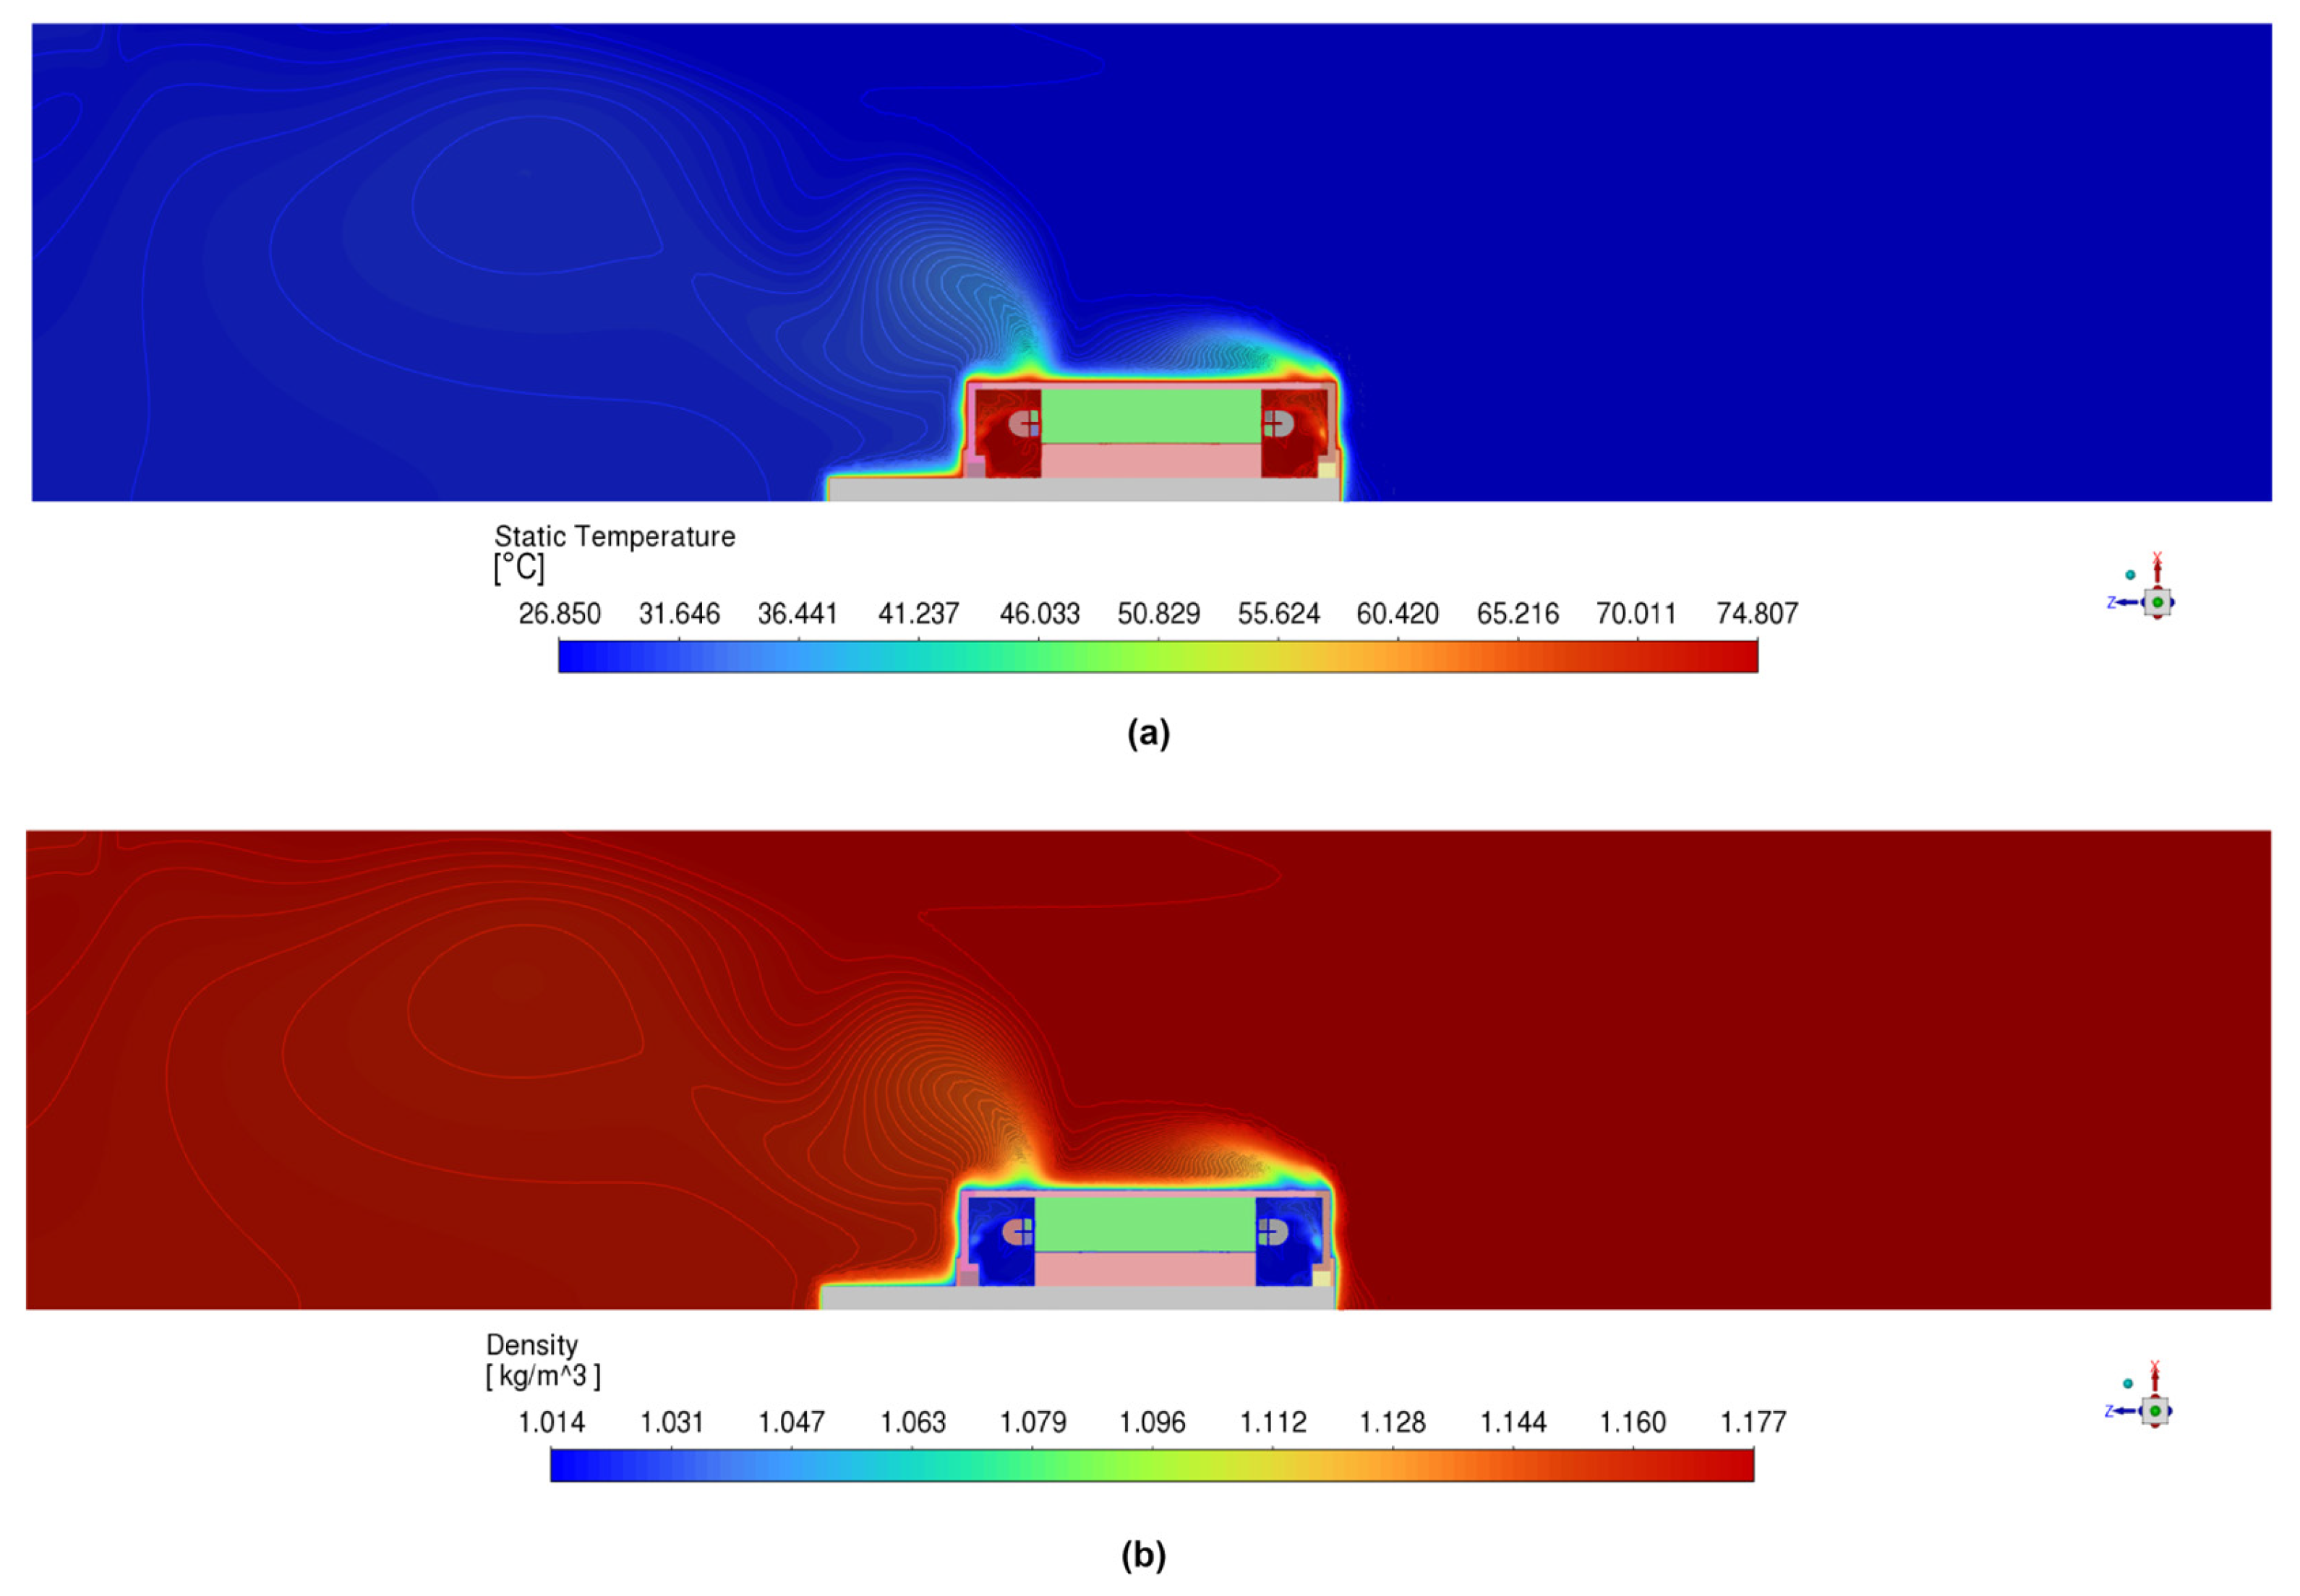
The temperature distribution within the air enclosure is shown in Figure 24a for Case 2, while the air density distribution is presented in Figure 24b. Flow separation near the housing walls is captured due to convective effects caused by the temperature rise toward the exterior of the PMSG.
The distributions of temperature, density, velocity, turbulent kinetic energy, and turbulence intensity in the air regions around the end windings and air gap for Case 2 are shown in Figure 25. In the air regions, the maximum temperature reached 74.8 °C (see Figure 25a) and the minimum air density was 1.014 kg/m3 (see Figure 25b). The air velocities in the end windings reach 3.632 m/s for Case 2 (see Figure 25c). The turbulent kinetic energy reached 1.953 × 10⁻³ (see Figure 25d), while the turbulence intensity reached 3.608% (see Figure 25e).
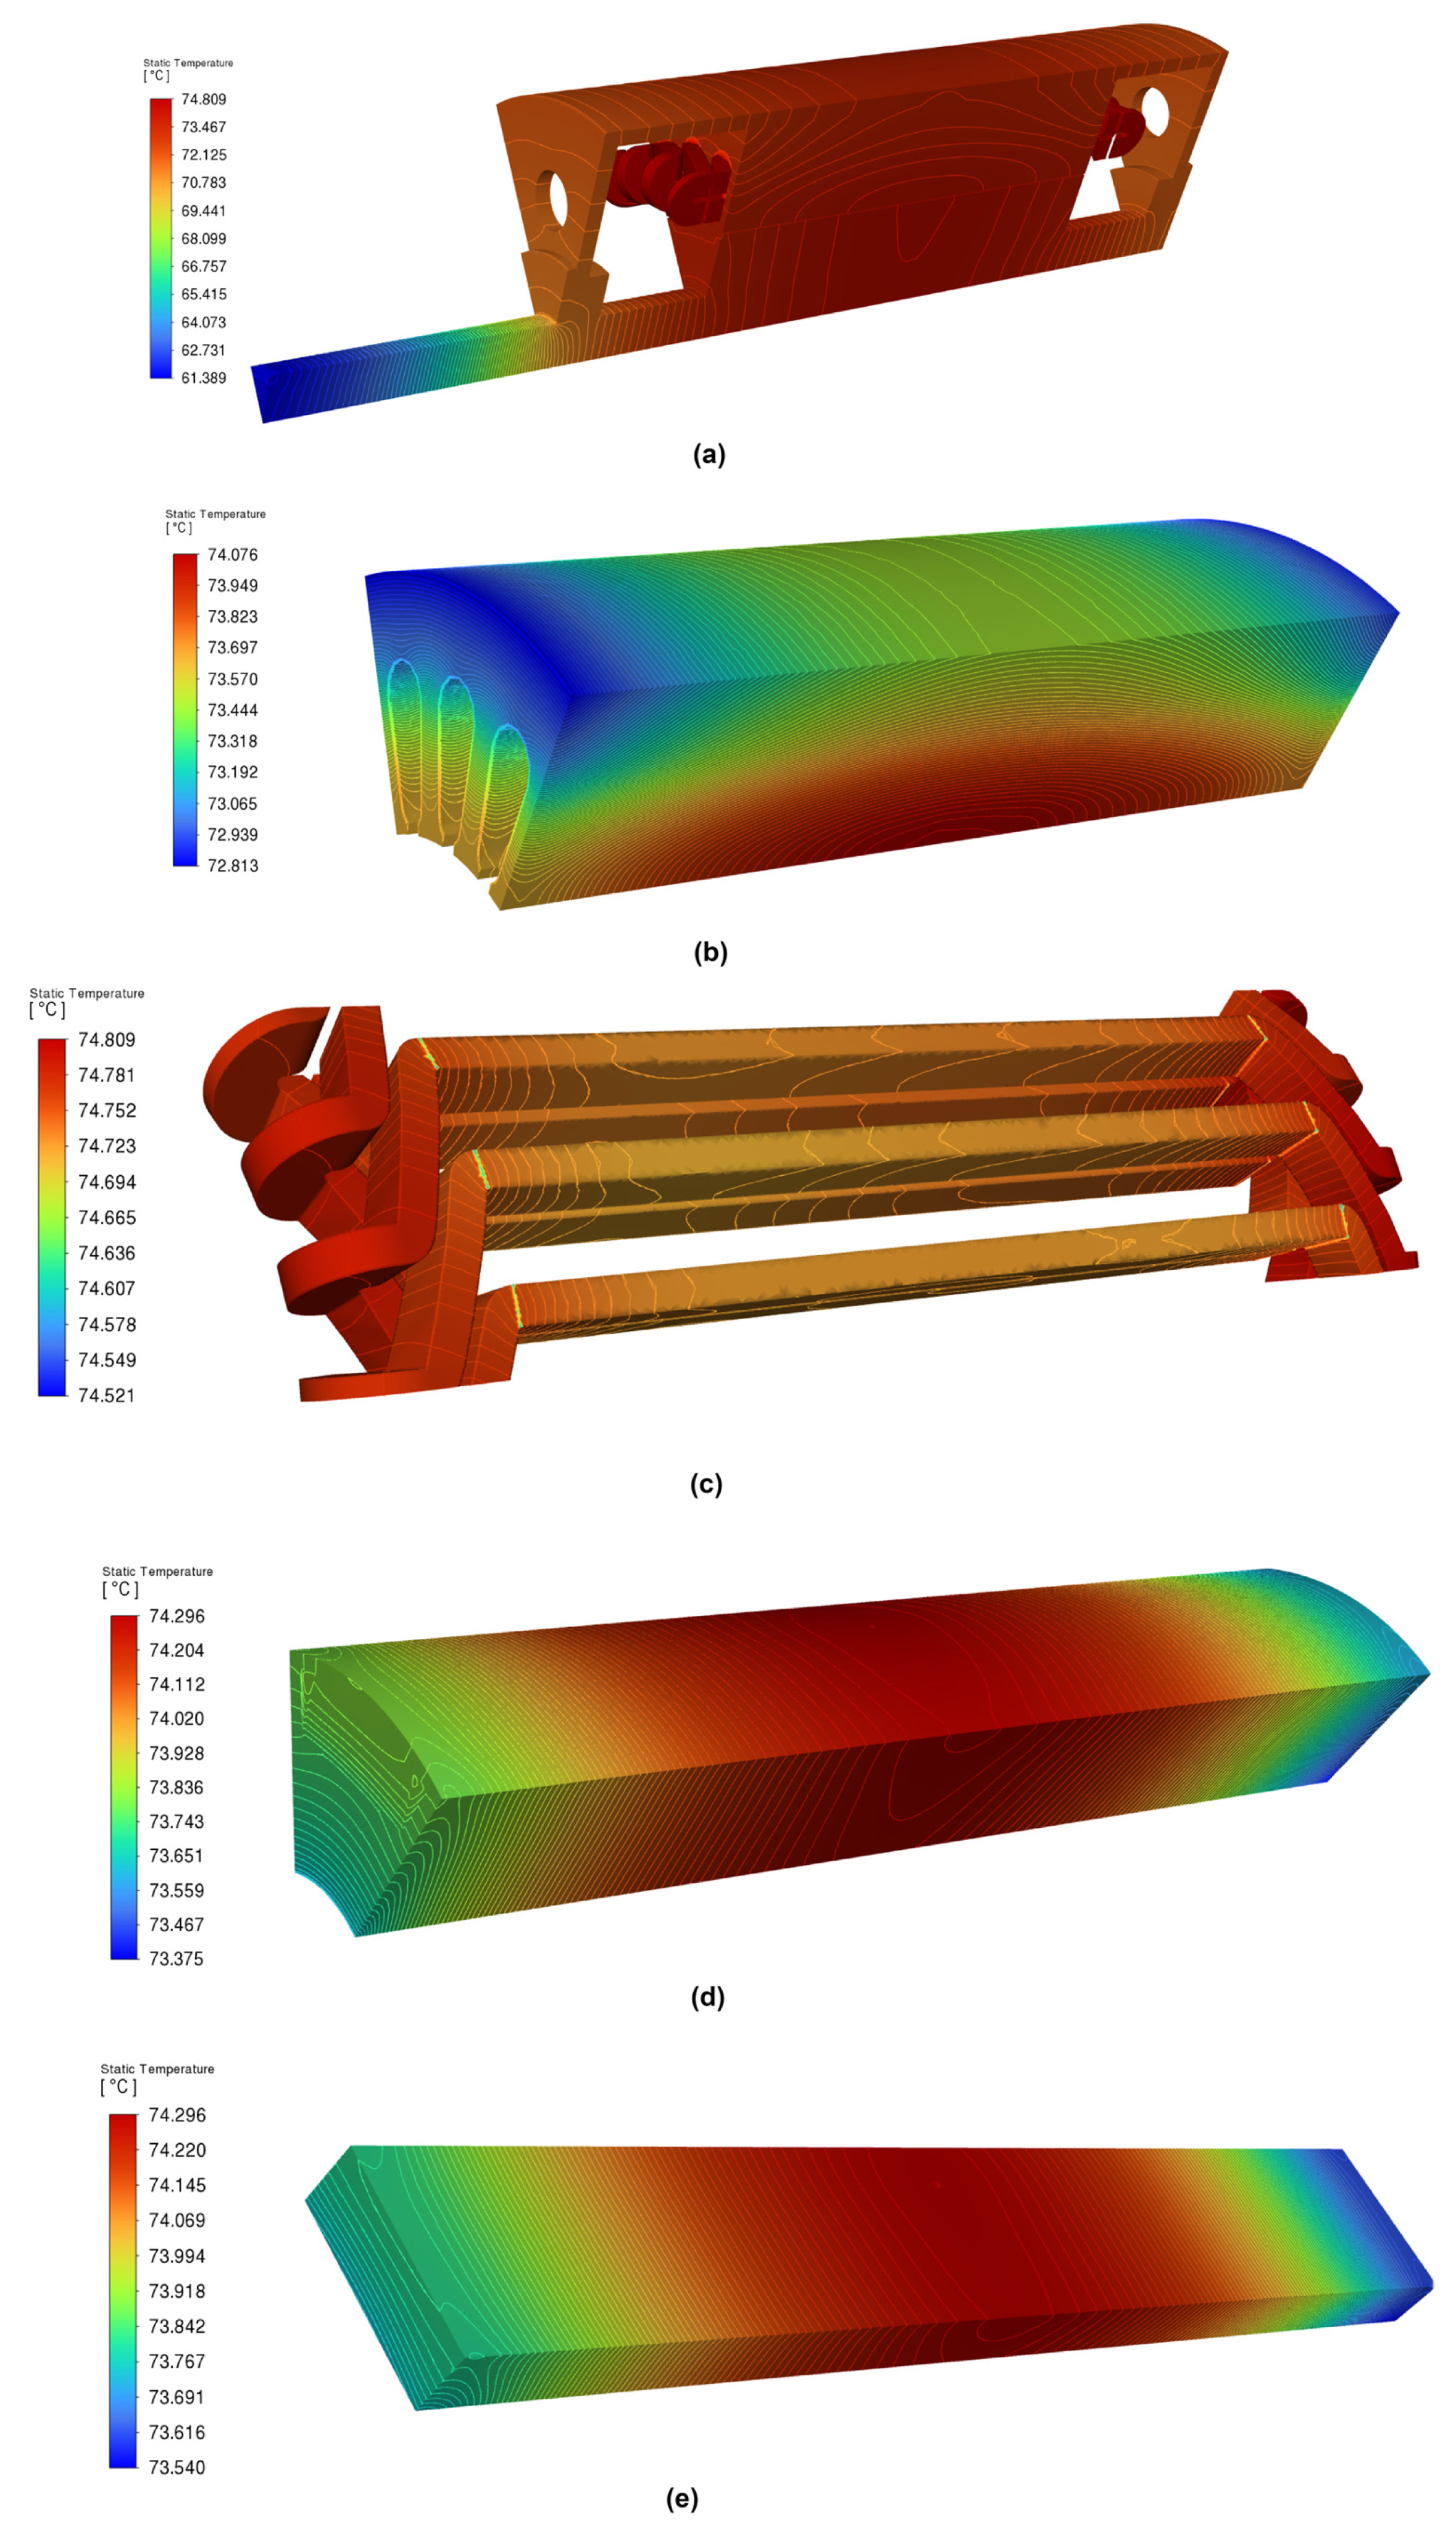
The temperature distribution in the PMSG for Case 2 is shown in Figure 26. Contour plots of the entire PMSG geometry reveal that the shaft tip naturally exhibits the lowest temperature, as it is the farthest region from the primary heat sources. The primary source of heating is attributed to resistive heating in the windings, which directly affects the performance of the permanent magnets. Maximum temperatures in the windings reached 74.80 °C (see Figure 26c). The maximum temperature in the stator was 74.07 °C (see Figure 26b). Hot spots are concentrated along the central axial region of the rotor (Figure 26d), primarily due to heating in the windings and limited heat dissipation, as the PMSG is a compact machine operating at low rotational speeds without forced ventilation cooling. The temperatures in the permanent magnets (PMs) shown in Figure 26e correspond to the results obtained from the CFD model. These temperatures were then transferred to the FEM model through the Feedback Iterator scheme in Ansys Workbench for simulation in Ansys Maxwell. This procedure allows recalculating electromagnetic losses while accounting for temperature effects on the PMs and windings.
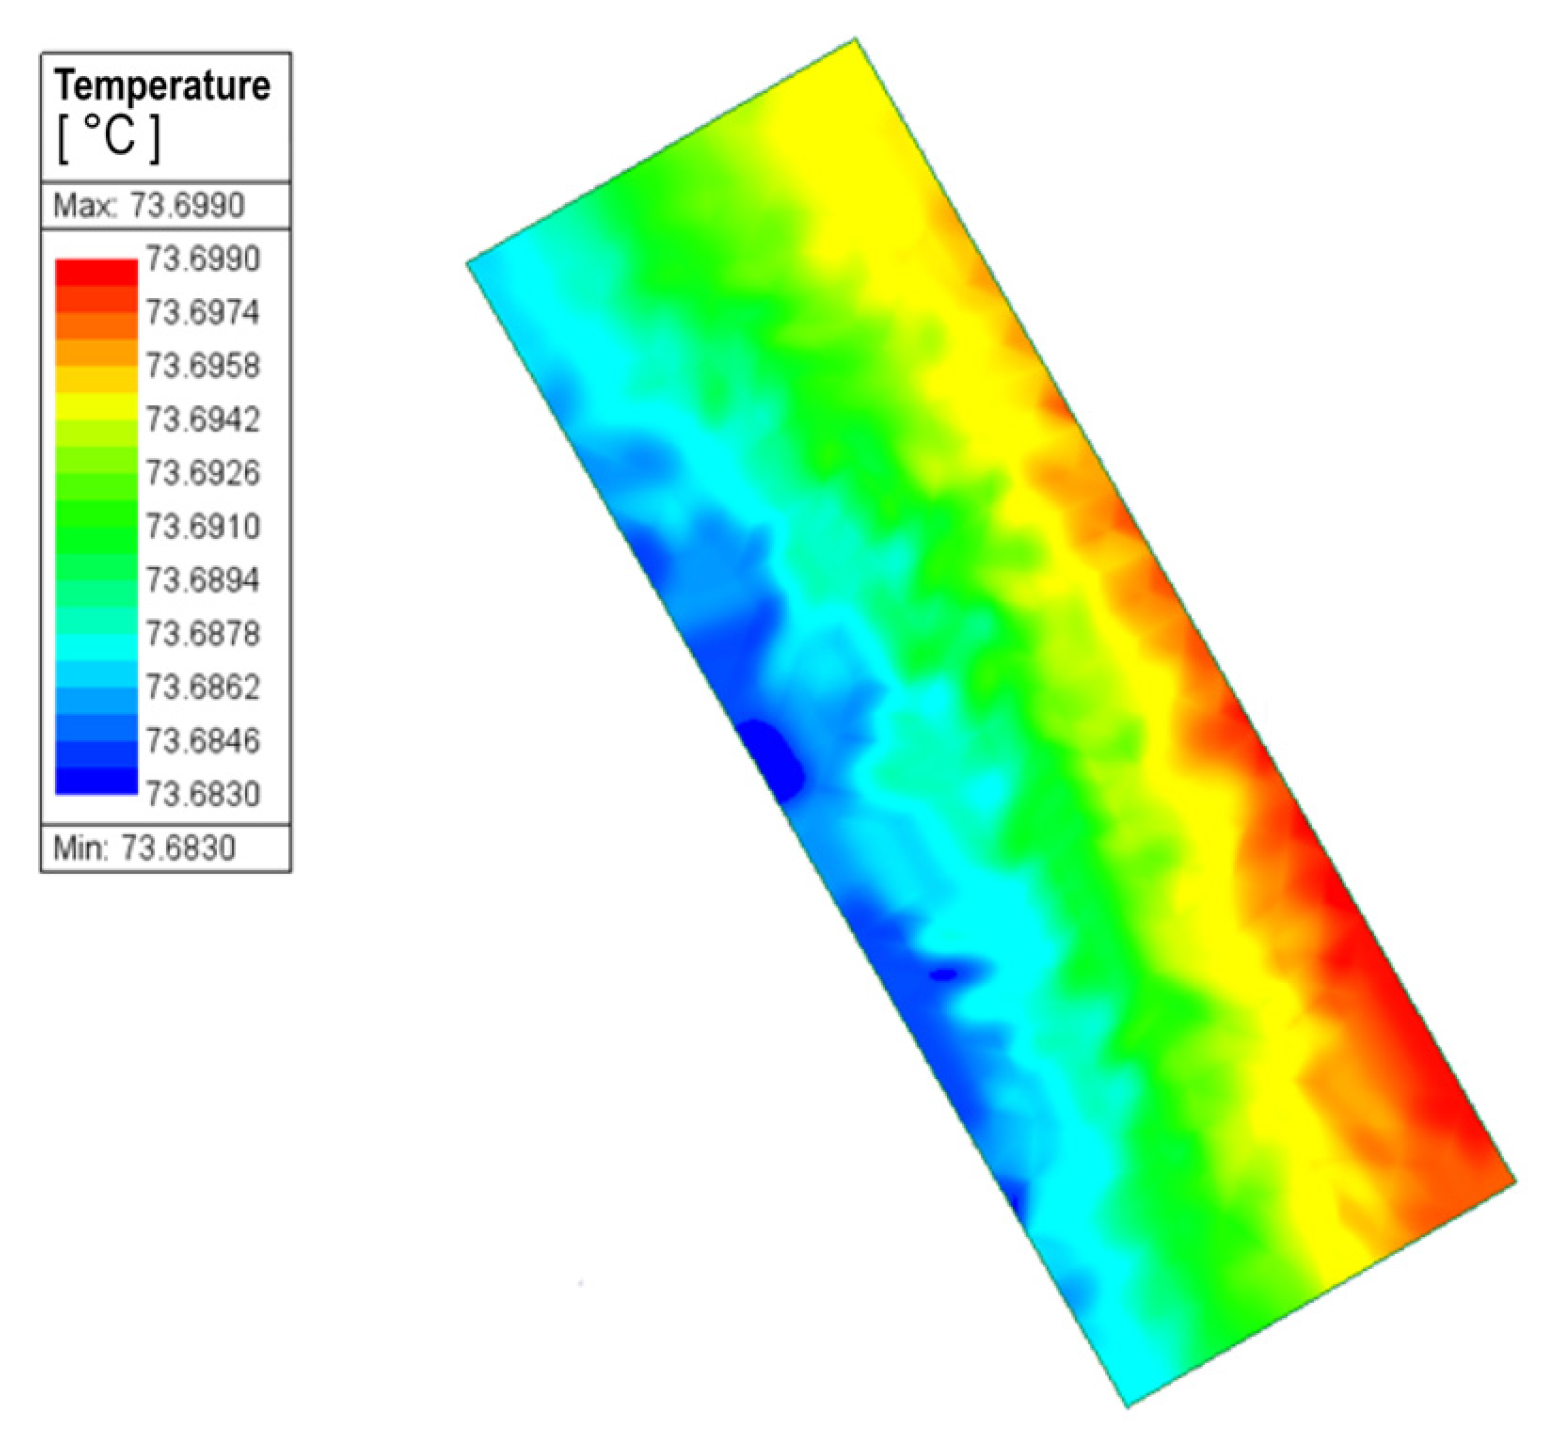
In this scenario, the permanent magnets reached minimum and maximum temperatures of 73.54 °C and 74.29 °C (see Figure 26e). When these results were fed back into the FEM model, the maximum and minimum temperatures were 73.69 °C and 73.68 °C (see Figure 27). The maximum difference between the two models was approximately 0.81%, indicating high consistency between the FEM and CFD models for Case 2 under steady-state conditions. Finally, Table 7 provides a quantitative summary of the PMSG temperatures for Case 2.

6. Conclusions

This paper presents a methodology for predicting the temperature demagnetization phenomenon in a 900 W PMSG using the commercial software Ansys version 2023R2 packages; Electromagnetics (Maxwell), CFD (Fluent), rapid design machines (RMxprt), CAD modeling (SpaceClaim), and the multiphysics integration and workflow platform (Workbench).
A 2D electromagnetic model of the PMSG was developed to compute the distribution of electromagnetic losses under steady-state rated load, incorporating a temperature-dependent PM demagnetization model. The thermal analysis was performed on a 3D model using CFD, considering rotor rotation, polyhedral meshing, the k ω SST turbulence model, and bidirectional FEM-CFD coupling.
Two cases were comprehensively studied to determine the quantitative distribution of electromagnetic losses in the PMSG. Case 1 analyzed the loss distribution of the electromagnetic model at a constant temperature under steady-state conditions without FEM-CFD coupling. Case 2 considered a bidirectional FEM-CFD coupling under steady-state conditions. Subsequently, the electromagnetic performance of Cases 1 and 2 was quantitatively compared. The proposed methodology for temperature-induced demagnetization analysis, as well as the convergence and accuracy of the electromagnetic–fluid–thermal calculations, was verified, leading to the following conclusions:
  • The total electromagnetic losses for Case 1 without thermal coupling showed a slight increase of ~3.5% compared to the coupled Case 2, while parasitic losses in the PM differed by only ~25%.
  • Induced voltages decreased by ~0.43 V in Case 2 compared to Case 1.
  • Case 1 met the design requirements for nominal electrical power generation of 900 W at a constant temperature of 70 °C, whereas Case 2 experienced a slight reduction of ~2.22% (881.24 W).
  • Air gap magnetic flux decreased in Case 2 due to the PM temperature rise, reducing losses, induced voltages, and generated electrical power compared to Case 1.
  • For Case 1 and Case 2, evaluation of the PM critical points on the demagnetization curve showed no risk of irreversible demagnetization due to temperature rise, indicating satisfactory PMSG design and PM selection.
  • Natural convection, velocity, density, turbulence, and heat transfer effects between solid and fluid regions in the end windings, air gap, and exterior of the PMSG were accurately captured.
  • Residuals and flow monitors were used as convergence criteria, showing satisfactory behavior for numerical stability and convergence in the CFD model for Case 2.
  • PM temperature increase in Case 2, according to the CFD model, was approximately 4 °C in the bidirectional coupling, compared to the design temperature in Case 1 of 70 °C using the FEM model without thermal coupling, allowing for a more precise electrothermal analysis.
  • When interpolating temperatures from the CFD domain to the FEM domain for Case 2, the difference was 0.81%, demonstrating satisfactory discretization levels of the PM in both domains (Electromagnetic and CFD).

Author Contributions

Conceptualization, J.E.M.-M. and M.A.A.; methodology, J.E.M.-M.; software, J.E.M.-M.; validation, C.H., F.J.M.-R. and M.A.A.; formal analysis, J.E.M.-M. and M.A.A.; investigation, J.E.M.-M.; writing—original draft preparation, J.E.M.-M.; writing—review and editing, F.J.M.-R., C.H., M.A.A. and J.E.M.-M.; visualization, J.E.M.-M.; supervision, M.A.A. and C.H. All authors have read and agreed to the published version of the manuscript.

Funding

This research was funded by the La Laguna Institute of Technology, TNM, through the research project 23164.25-P and by the Mexican Secretariat of Science, Humanities, and Technology (SECIHTI) with the doctoral scholarship 86115. The authors acknowledge the financial support that enabled them to carry out this research.

Data Availability Statement

The original contributions presented in this study are included in the article. Further inquiries can be directed to the corresponding author.

Conflicts of Interest

The authors declare no conflicts of interest.

Abbreviations

The following abbreviations are used in this manuscript:
PMSGPermanent Magnet Synchronous Generator
WECSWind Energy Conversion Systems
GWECGlobal Wind Energy Council
DFIGDouble Field Induction Generator
PMPermanent Magnet
NdFeBNeodymium-Iron-Boron
FEMFinite Element Method
FEAFinite Element Analysis
CFDComputational Fluid Dynamics
FVMFinite Volume Method
2DTwo-Dimensional
3DThree-Dimensional
EMCEquivalent Magnetic Circuit
PNMPermeance Network Model
LPTNLumped Thermal Network
THDTotal Harmonic Distortion
IPMSGMInternal Permanent Magnet Synchronous Motor
SPMSGSurface Permanent Magnet Synchronous Generator
HSPMMHigh-Speed Permanent Magnet Machines
LSPMSMLine Start Permanent Magnet Synchronous Motor
STTShear Stress Transport

References

  1. Abo-Khalil, A.G.; Alobaid, M. Optimized Control for PMSG Wind Turbine Systems under Unbalanced and Distorted Grid Voltage Scenarios. Sustainability 2023, 15, 9552. [Google Scholar] [CrossRef]
  2. Yaramasu, V.; Wu, B.; Sen, P.C.; Kouro, S.; Narimani, M. High-Power Wind Energy Conversion Systems: State-of-the-Art and Emerging Technologies. Proc. IEEE 2015, 103, 740–788. [Google Scholar] [CrossRef]
  3. Fang, H.; Wang, D. A Novel Design Method of Permanent Magnet Synchronous Generator from Perspective of Permanent Magnet Material Saving. IEEE Trans. Energy Convers. 2017, 32, 48–54. [Google Scholar] [CrossRef]
  4. Wu, D.; Seo, G.-S.; Xu, L.; Su, C.; Kocewiak, L.; Sun, Y.; Qin, Z. Grid Integration of Offshore Wind Power: Standards, Control, Power Quality and Transmission. IEEE Open J. Power Electron. 2024, 5, 583–604. [Google Scholar] [CrossRef]
  5. Faiz, J.; Mazaheri-Tehrani, E. Demagnetization Modeling and Fault Diagnosing Techniques in Permanent Magnet Machines Under Stationary and Nonstationary Conditions: An Overview. IEEE Trans. Ind. Appl. 2017, 53, 2772–2785. [Google Scholar] [CrossRef]
  6. Hernandez, C.; Lara, J.; Arjona, M.A.; Martinez, F.J.; Moron, J.E.; Escarela-Perez, R.; Sykulski, J. Electromagnetic Optimal Design of a PMSG Considering Three Objectives and Using NSGA-III. IEEE Trans. Magn. 2022, 58, 1–4. [Google Scholar] [CrossRef]
  7. Chen, J.; Nayar, C.V.; Xu, L. Design and Finite-Element Analysis of an Outer-Rotor Permanent-Magnet Generator for Directly Coupled Wind Turbines. IEEE Trans. Magn. 2000, 36, 3802–3809. [Google Scholar] [CrossRef]
  8. Duan, G.; Wang, H.; Guo, H.; Gu, G. Direct Drive Permanent Magnet Wind Generator Design and Electromagnetic Field Finite Element Analysis. IEEE Trans. Appl. Supercond. 2010, 20, 1883–1887. [Google Scholar] [CrossRef]
  9. Ibrayeva, A.; Eriksson, S. Dynamic Modeling of a Generator with Anisotropic Nonlinear Permanent Magnets in Finite Element Method Software. IEEE Trans. Magn. 2023, 59, 1–8. [Google Scholar] [CrossRef]
  10. Chan, T.-F.; Wang, W.; Lai, L.-L. Permanent-Magnet Synchronous Generator Supplying an Isolated Load. IEEE Trans. Magn. 2010, 46, 3353–3356. [Google Scholar] [CrossRef]
  11. Mahmouditabar, F.; Vahedi, A.; Marignetti, F. The Demagnetization Phenomenon in PM Machines: Principles, Modeling, and Design Considerations. IEEE Access 2023, 11, 47750–47773. [Google Scholar] [CrossRef]
  12. Choi, G. Analysis and Experimental Verification of the Demagnetization Vulnerability in Various PM Synchronous Machine Configurations for an EV Application. Energies 2021, 14, 5447. [Google Scholar] [CrossRef]
  13. Lin, D.; Zhou, P.; Bracken, E. Generalized Algorithm to Deal with Temperature-Dependent Demagnetization Curves of Permanent Magnets for FEA. IEEE Trans. Magn. 2021, 57, 1–6. [Google Scholar] [CrossRef]
  14. Zhou, P.; Lin, D.; Xiao, Y.; Lambert, N.; Rahman, M.A. Temperature-Dependent Demagnetization Model of Permanent Magnets for Finite Element Analysis. IEEE Trans. Magn. 2012, 48, 1031–1034. [Google Scholar] [CrossRef]
  15. Ruoho, S.; Dlala, E.; Arkkio, A. Comparison of Demagnetization Models for Finite-Element Analysis of Permanent-Magnet Synchronous Machines. IEEE Trans. Magn. 2007, 43, 3964–3968. [Google Scholar] [CrossRef]
  16. Hamidizadeh, S.; Alatawneh, N.; Chromik, R.R.; Lowther, D.A. Comparison of Different Demagnetization Models of Permanent Magnet in Machines for Electric Vehicle Application. IEEE Trans. Magn. 2016, 52, 1–4. [Google Scholar] [CrossRef]
  17. Wang, W.; Zheng, P.; Wang, M.; Liu, Y.; Fu, Z.; Sui, Y. Demagnetization and Permanent-Magnet Minimization Analyses of Less-Rare-Earth Interior Permanent-Magnet Synchronous Machines Used for Electric Vehicles. IEEE Trans. Magn. 2018, 54, 1–5. [Google Scholar] [CrossRef]
  18. Attestog, S.; Van Khang, H.; Robbersmyr, K.G. Modelling Demagnetized Permanent Magnet Synchronous Generators Using Permeance Network Model with Variable Flux Sources. In Proceedings of the 2019 22nd International Conference on the Computation of Electromagnetic Fields (COMPUMAG), Paris, France, 15–19 July 2019; pp. 1–4. [Google Scholar]
  19. Zhang, Y.; McLoone, S.; Cao, W. Electromagnetic Loss Modeling and Demagnetization Analysis for High Speed Permanent Magnet Machine. IEEE Trans. Magn. 2018, 54, 1–5. [Google Scholar] [CrossRef]
  20. Wu, S.; Wu, S.; Zhao, W.; Cui, S. Demagnetization Research on PMs in the Halbach Magnetized Pulsed Alternator. CES Trans. Electr. Mach. Syst. 2019, 3, 170–177. [Google Scholar] [CrossRef]
  21. Baranski, M.; Szelag, W.; Lyskawinski, W. Experimental and Simulation Studies of Partial Demagnetization Process of Permanent Magnets in Electric Motors. IEEE Trans. Energy Convers. 2021, 36, 3137–3145. [Google Scholar] [CrossRef]
  22. Boglietti, A.; Cavagnino, A.; Staton, D.; Shanel, M.; Mueller, M.; Mejuto, C. Evolution and Modern Approaches for Thermal Analysis of Electrical Machines. IEEE Trans. Ind. Electron. 2009, 56, 871–882. [Google Scholar] [CrossRef]
  23. Zhu, Z.-Q.; Liang, D. Perspective of Thermal Analysis and Management for Permanent Magnet Machines, with Particular Reference to Hotspot Temperatures. Energies 2022, 15, 8189. [Google Scholar] [CrossRef]
  24. Staton, D.A.; Cavagnino, A. Convection Heat Transfer and Flow Calculations Suitable for Electric Machines Thermal Models. IEEE Trans. Ind. Electron. 2008, 55, 3509–3516. [Google Scholar] [CrossRef]
  25. Boglietti, A.; Carpaneto, E.; Cossale, M.; Vaschetto, S. Stator-Winding Thermal Models for Short-Time Thermal Transients: Definition and Validation. IEEE Trans. Ind. Electron. 2016, 63, 2713–2721. [Google Scholar] [CrossRef]
  26. Feng, J.; Liang, D.; Zhu, Z.Q.; Guo, S.; Li, Y.; Zhao, A. Improved Low-Order Thermal Model for Critical Temperature Estimation of PMSM. IEEE Trans. Energy Convers. 2022, 37, 413–423. [Google Scholar] [CrossRef]
  27. Mezani, S.; Takorabet, N.; Laporte, B. A Combined Electromagnetic and Thermal Analysis of Induction Motors. IEEE Trans. Magn. 2005, 41, 1572–1575. [Google Scholar] [CrossRef]
  28. Yeo, H.-K.; Park, H.-J.; Seo, J.-M.; Ro, J.-S.; Jung, H.-K. Coupled Electromagnetic-Thermal Analysis of a Surface-Mounted Permanent-Magnet Motor with Overhang Structure. In Proceedings of the 2016 IEEE Conference on Electromagnetic Field Computation (CEFC), Miami, FL, USA, 13–16 November 2016. [Google Scholar]
  29. Kasprzak, M.; Jiang, J.W.; Bilgin, B.; Emadi, A. Thermal Analysis of a Three-Phase 24/16 Switched Reluctance Machine Used in HEVs. In Proceedings of the 2016 IEEE Energy Conversion Congress and Exposition (ECCE), Milwaukee, WI, USA, 18–22 September 2016; pp. 1–7. [Google Scholar]
  30. Shi, Y.; Wang, J.; Wang, B. Transient 3-D Lumped Parameter and 3-D FE Thermal Models of a PMASynRM Under Fault Conditions with Asymmetric Temperature Distribution. IEEE Trans. Ind. Electron. 2021, 68, 4623–4633. [Google Scholar] [CrossRef]
  31. Fan, X.; Zhang, B.; Qu, R.; Li, D.; Li, J.; Huo, Y. Comparative Thermal Analysis of IPMSMs with Integral-Slot Distributed-Winding (ISDW) and Fractional-Slot Concentrated-Winding (FSCW) for Electric Vehicle Application. IEEE Trans. Ind. Appl. 2019, 55, 3577–3588. [Google Scholar] [CrossRef]
  32. Qi, J.; Hua, W.; Zhang, H. Thermal Analysis of Modular-Spoke-Type Permanent-Magnet Machines Based on Thermal Network and FEA Method. IEEE Trans. Magn. 2019, 55, 1–5. [Google Scholar] [CrossRef]
  33. Bastos, J.P.; Cabreira, M.F.R.R.; Sadowski, N.; Arruda, S.R.; Nau, S.L. A Thermal Analysis of Induction Motors Using a Weak Coupled Modeling. IEEE Trans. Magn. 1997, 33, 1714–1717. [Google Scholar] [CrossRef]
  34. Lundmark, S.T.; Grunditz, E.A.; Thiringer, T.; Andreasson, A.; Bergqvist, A.; Orbay, R.; Jansson, E. Heat Transfer Coefficients in a Coupled 3-D Model of a Liquid-Cooled IPM Traction Motor Compared with Measurements. IEEE Trans. Ind. Appl. 2021, 57, 4805–4814. [Google Scholar] [CrossRef]
  35. Gai, Y.; Kimiabeigi, M.; Chuan Chong, Y.; Widmer, J.D.; Deng, X.; Popescu, M.; Goss, J.; Staton, D.A.; Steven, A. Cooling of Automotive Traction Motors: Schemes, Examples, and Computation Methods. IEEE Trans. Ind. Electron. 2019, 66, 1681–1692. [Google Scholar] [CrossRef]
  36. Huang, C.; Xiong, L.; Hu, L.; Gong, Y. Thermal Design and Analysis of Oil-Spray-Cooled In-Wheel Motor Using a Two-Phase Computational Fluid Dynamics Method. World Electr. Veh. J. 2023, 14, 184. [Google Scholar] [CrossRef]
  37. Gebauer, M.; Blejchař, T.; Brzobohatý, T.; Nevřela, M. Conjugate Heat Transfer Model for an Induction Motor and Its Adequate FEM Model. Symmetry 2023, 15, 1294. [Google Scholar] [CrossRef]
  38. Xie, Y.; Guo, J.; Chen, P.; Li, Z. Coupled Fluid-Thermal Analysis for Induction Motors with Broken Bars Operating under the Rated Load. Energies 2018, 11, 2024. [Google Scholar] [CrossRef]
  39. Chari, M.V.K.; Salon, S.J. Numerical Methods in Electromagnetism; Academic Press: San Diego, CA, USA, 2000. [Google Scholar]
  40. Hameyer, K.; Belmans, R. Numerical Modelling and Design of Electrical Machines and Devices; WIT Press: Southampton, UK, 1999. [Google Scholar]
  41. Ansys Inc. Ansys Maxwell User’s Guide 2023 R2; Ansys: Canonsburg, PA, USA, 2023. [Google Scholar]
  42. Lin, D.; Zhou, P.; Fu, W.N.; Badics, Z.; Cendes, Z.J. A Dynamic Core Loss Model for Soft Ferromagnetic and Power Ferrite Materials in Transient Finite Element Analysis. IEEE Trans. Magn. 2004, 40, 1318–1321. [Google Scholar] [CrossRef]
  43. Fu, X.; Lin, M.; Yu, H.; Hao, L.; Xu, D.; Jin, P.; Zou, J. Calculation and Analysis of Iron Loss in Homopolar Inductor Alternator. IEEE Trans. Magn. 2012, 48, 3466–3469. [Google Scholar] [CrossRef]
  44. Xu, K.; Guo, Y.; Lei, G.; Zhu, J. Estimation of Iron Loss in Permanent Magnet Synchronous Motors Based on Particle Swarm Optimization and a Recurrent Neural Network. Magnetism 2023, 3, 327–342. [Google Scholar] [CrossRef]
  45. Su, W.-M.; Mao, S.-H.; Wang, P.-J. Estimation of the Core Losses of Induction Machines Based on the Corrected Epstein Test Method. IEEE Trans. Magn. 2019, 55, 1–8. [Google Scholar] [CrossRef]
  46. Li, Z.; Wang, P.; Liu, L.; Xu, Q.; Che, S.; Zhang, L.; Du, S.; Zhang, H.; Sun, H. Loss Calculation and Thermal Analysis of Ultra-High Speed Permanent Magnet Motor. Heliyon 2022, 8, e11350. [Google Scholar] [CrossRef]
  47. Oh, S.Y.; Cho, S.-Y.; Han, J.-H.; Lee, H.J.; Ryu, G.-H.; Kang, D.; Lee, J. Design of IPMSM Rotor Shape for Magnet Eddy-Current Loss Reduction. IEEE Trans. Magn. 2014, 50, 841–844. [Google Scholar] [CrossRef]
  48. Kim, B.-C.; Lee, J.-H.; Kang, D.-W. A Study on the Effect of Eddy Current Loss and Demagnetization Characteristics of Magnet Division. IEEE Trans. Appl. Supercond. 2020, 30, 1–5. [Google Scholar] [CrossRef]
  49. Kral, C.; Sprangers, R.; Waarma, J.; Haumer, A.; Winter, O.; Lomonova, E. Modeling Demagnetization Effects in Permanent Magnet Synchronous Machines. In Proceedings of the XIX International Conference on Electrical Machines—ICEM 2010, Rome, Italy, 6–8 September 2010; pp. 1–6. [Google Scholar]
  50. Bianchi, N. Electrical Machine Analysis Using Finite Elements; CRC Press: Boca Raton, FL, USA, 2017; ISBN 978-1-315-21929-5. [Google Scholar]
  51. Ansys Inc. Ansys Fluent Theory Guide, Release 2023 R2; Ansys: Canonsburg, PA, USA, 2023. [Google Scholar]
  52. Guo, C.; Long, L.; Wu, Y.; Xu, K.; Ye, H. Electromagnetic-Thermal Coupling Analysis of a Permanent-Magnet in-Wheel Motor with Cooling Channels in the Deepened Stator Slots. Case Stud. Therm. Eng. 2022, 35, 102158. [Google Scholar] [CrossRef]
  53. Melka, B.; Smolka, J.; Hetmanczyk, J.; Bulinski, Z.; Makiela, D.; Ryfa, A. Experimentally Validated Numerical Model of Thermal and Flow Processes within the Permanent Magnet Brushless Direct Current Motor. Int. J. Therm. Sci. 2018, 130, 406–415. [Google Scholar] [CrossRef]
  54. Arbab, N.; Wang, W.; Lin, C.; Hearron, J.; Fahimi, B. Thermal Modeling and Analysis of a Double-Stator Switched Reluctance Motor. IEEE Trans. Energy Convers. 2015, 30, 1209–1217. [Google Scholar] [CrossRef]
  55. Ahmed Abdelrahman, S.; Bilgin, B. Computationally Efficient Surrogate-Based Magneto-Fluid-Thermal Numerical Coupling Approach for a Water-Cooled IPM Traction Motor. IEEE Access 2022, 10, 83692–83704. [Google Scholar] [CrossRef]
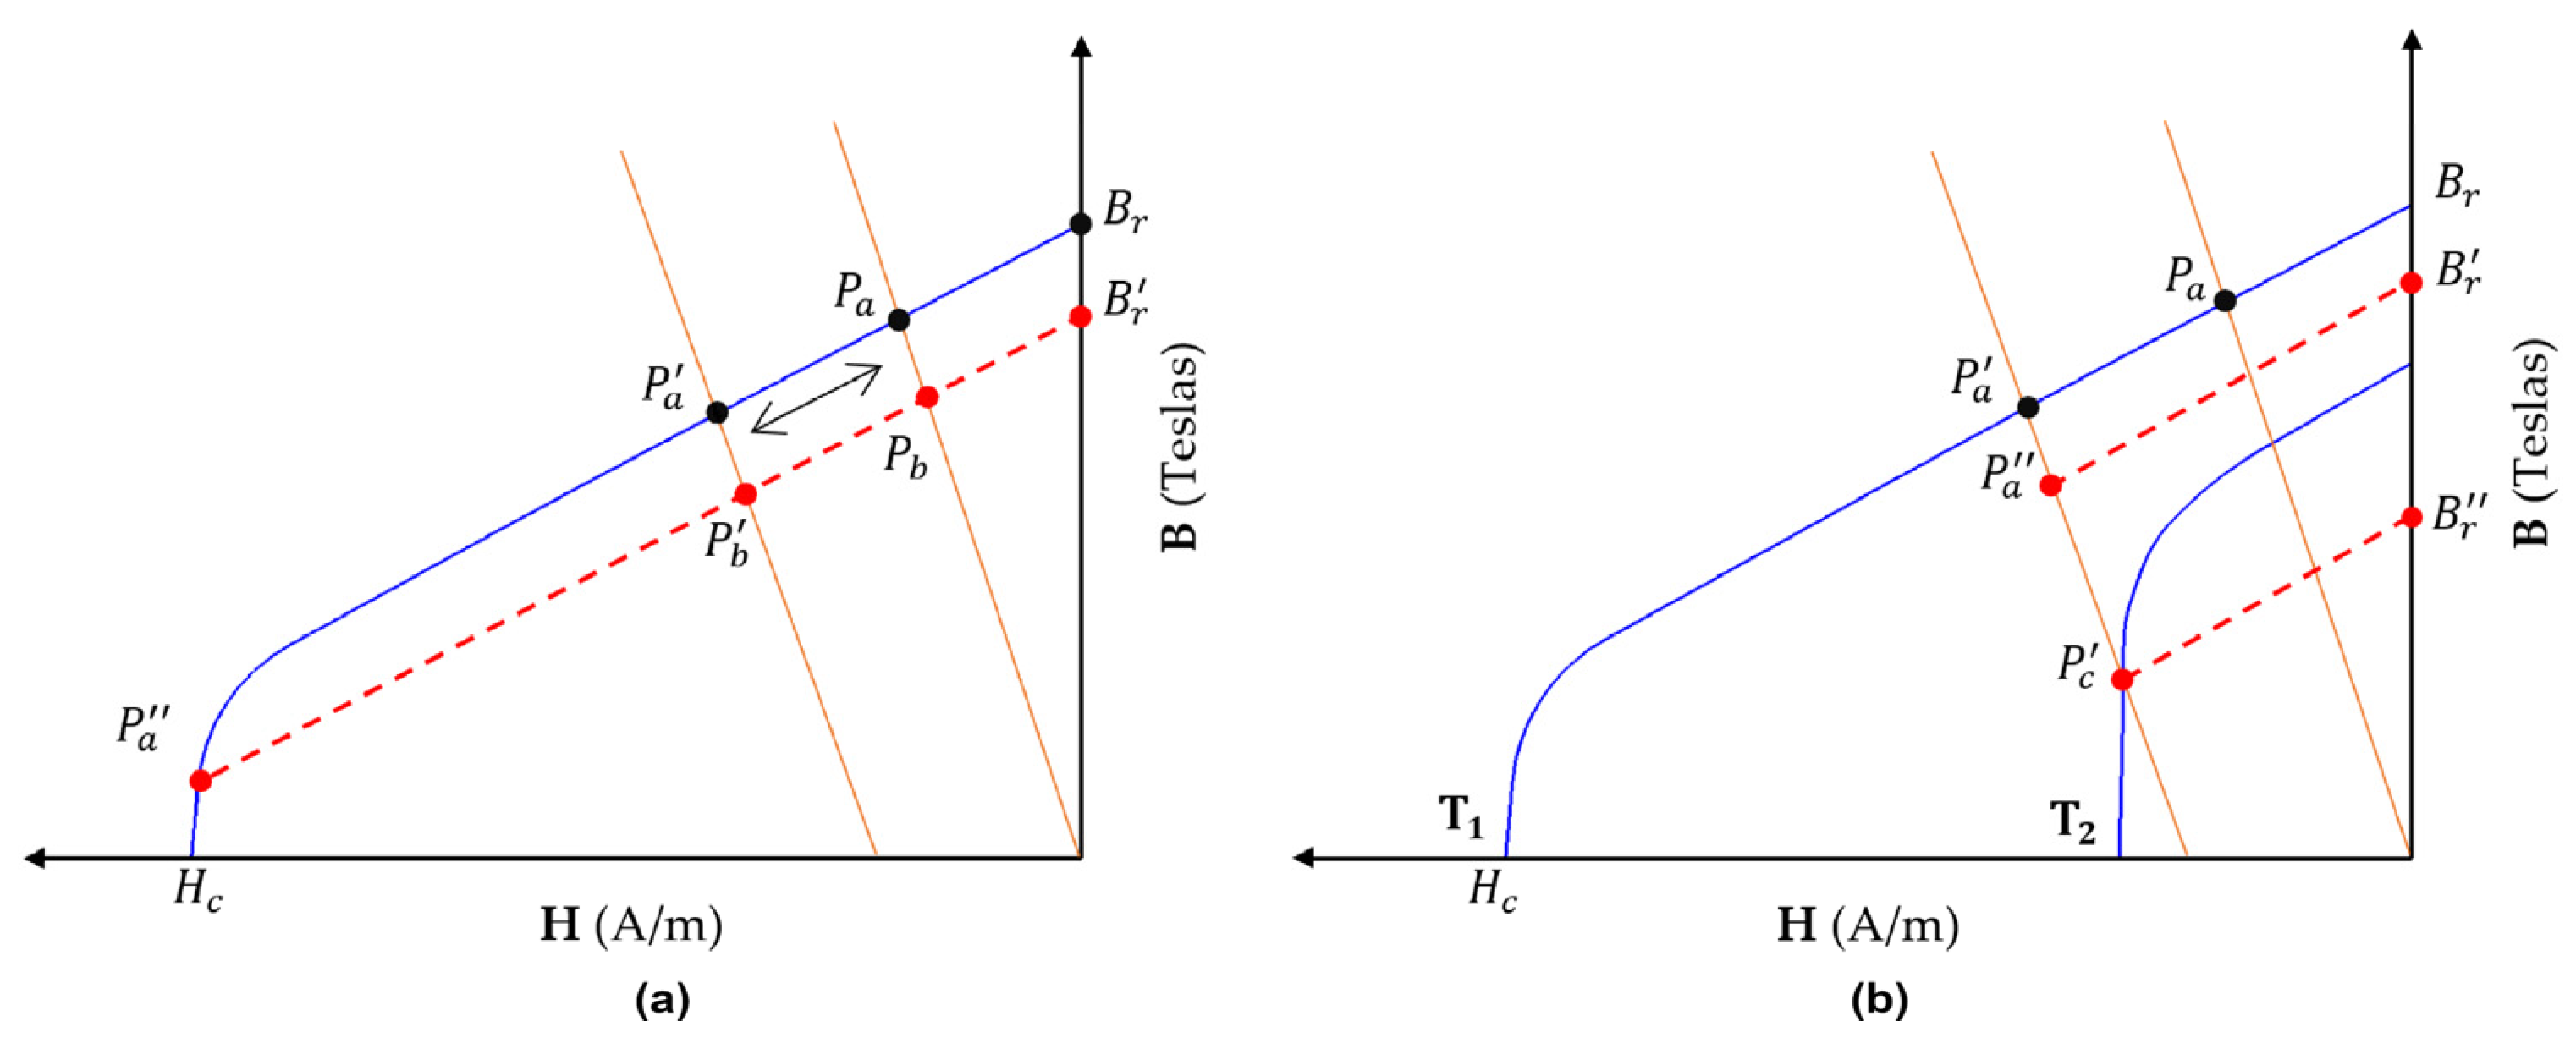
Figure 1. Demagnetization process in PM: (a) effect due to demagnetizing field only; (b) combined effects of the demagnetizing field and temperature.
Energies 18 06149 g001
Figure 2. Two-dimensional PMSG geometry design: (a) full geometry; (b) application of periodic boundary conditions and critical demagnetization points in the PM.
Energies 18 06149 g002
Figure 3. Magnetic properties of core and PM: (a) B-H curve of the ferromagnetic material M22-26G; (b) Normal demagnetization curves of N35 PM.
Energies 18 06149 g003
Figure 4. FEM mesh generation in the PMSG with the rotor position at 7.5 degrees.
Energies 18 06149 g004
Figure 5. External circuit connected to the PMSG model.
Energies 18 06149 g005
Figure 6. Three-dimensional CFD model of the PMSG.
Energies 18 06149 g006
Figure 7. Thermal model of the PMSG: (a) Axial view; (b) Cross-sectional view.
Energies 18 06149 g007
Figure 8. Boundary conditions of the CFD model of the PMSG.
Energies 18 06149 g008
Figure 9. Surface mesh of the PMSG: (a) Axial view of fluid and solid regions; (b) Zoomed-in view of end winding and fluid prism layers.
Energies 18 06149 g009
Figure 10. Volume mesh of the PMSG: (a) Cross-sectional view; (b) Zoomed-in view of polyhedral mesh and prism layer in air gap.
Energies 18 06149 g010
Figure 11. Flowchart of multi-physics coupling simulation methodology.
Energies 18 06149 g011
Figure 12. Instantaneous loss distribution: (a) Stator and rotor loss for case 1; (b) PM loss for case 1; (c) Stator and rotor loss for case 2; (d) PM loss for case 2.
Energies 18 06149 g012
Figure 13. Induced voltages (ea, eb, and ec) and flux linkages (λa, λb, and λc): (a) Induced voltages for case 1; (b) Induced voltages for case 2; (c) Flux linkages for case 1; (d) Flux linkages for case 2.
Energies 18 06149 g013
Figure 14. Electrical power generation in the PMSG.
Energies 18 06149 g014
Figure 15. Magnetic flux lines and flux density distribution in PMSG: (a) Flux lines for case 1; (b) Flux density distribution for case 1; (c) Flux lines for case 2; (d) Flux density distribution for case 2.
Energies 18 06149 g015
Figure 16. Magnetic flux density distribution: (a) PM for case 1; (b) PM for case 2.
Energies 18 06149 g016
Figure 17. Instantaneous air gap radial flux density distribution.
Energies 18 06149 g017
Figure 18. Time-varying radial flux density air gap distribution: (a) Case 1; (b) Case 2.
Energies 18 06149 g018
Figure 19. Demagnetization curves and recoil line in PM: (a) Case 1; (b) Case 2.
Energies 18 06149 g019
Figure 20. Scaled residuals for case 2.
Energies 18 06149 g020
Figure 21. Flux average monitors for case 2: (a) Temperatures; (b) Densities; (c) Velocities.
Energies 18 06149 g021
Figure 22. Rotor vector velocity rotation for Case 2.
Energies 18 06149 g022
Figure 23. Temperature streamline distribution in the end-winding regions for Case 2.
Energies 18 06149 g023
Figure 24. Contour maps on an axial view of the PMSG for case 2: (a) Static temperature; (b) Density.
Energies 18 06149 g024
Figure 25. End windings contour maps on an axial view of the PMSG for case 2: (a) Static temperature; (b) Density; (c) Velocity magnitude; (d) Turbulent kinetic energy; (e) Turbulent intensity.
Energies 18 06149 g025
Figure 26. Temperature contour maps of the PMSG for case 2: (a) PMSG; (b) Stator; (c) Windings; (d) Rotor and magnet; (e) Magnet.
Energies 18 06149 g026
Figure 27. Temperature distribution in the PM from the FEM model for Case 2.
Energies 18 06149 g027
Table 1. Electrical parameters and operating mode of the PMSG.
Part NameValue
Rated output power900 W
Rated voltage 220 V
Number of phases 3
Rated frequency60 Hz
Rated speed900 rpm
Load typeInfinite Bus
Table 2. Parameters of the stator, rotor, and winding of the PMSG.
ParameterValueParameterValue
Axial length148 mmStacking factor0.97
Air gap0.6 mmConductors per slot58
Number of slots24Internal diameter rotor32 mm
Number of poles8External diameter rotor77.08 mm
Internal diameter stator78.2 mmMagnet width19.25 mm
External diameter stator150.7 mmMagnet thickness6.55 mm
Table 3. Specifications of the N35 PM.
ParameterValue
Residual induction ( B r )1.21 T
Coercivity ( H c ) −907 kA/m
BHmax283 kJ/m3
Temp. coeff. α of B r   (20–80 °C)−0.12%/°C
Temp. coeff. β of H c i   (20–80 °C)−0.62%/°C
Curie temperature ( T c )310 °C
Conductivity555,556 S/m
Table 4. Material properties of the PMSG used in the CFD simulation.
ComponentsMaterialDensity
[kg/m3]
Specific Heat
[J/kg/°C]
Thermal Conductivity
[W/m∙°C]
Housing and end capsAluminum alloy2719871202.4
Stator and rotorM22-26G8030502.48 σ t h x , y = 43 ,   σ t h z = 1.6
WindingCopper8978381387.6
Slot insulationInsulation70023100.22
PMsNdFeB-N357449.8460.5486.7409
Air gap, end windings, and enclosureAirIncompressible ideal law1006.430.0242
ShaftSteel8030502.4816.27
Rotor nonmagnetic fillerEpoxy120015000.22
Table 5. Number of cells and minimum orthogonal quality.
RegionNumber of CellsMin. Orthogonal Quality
Stator1,492,9040.5000
Rotor2,292,5030.5000
Windings99,0730.5071
PM196,9990.5042
Air gap 13,833,2640.5008
Air gap 23,936,3120.3848
Air end windings70,93070.3017
Air ventilation holes17,0440.5688
Shaft15,5680.5111
End caps and bearings 51,7010.5000
Housing46,8020.5484
Insulation slots740,3350.4922
Enclosure159,6410.4769
Rotor nonmagnetic filler 154,4450.5000
Table 6. Losses in PMSG.
Losses (W)Case 1Case 2
Stator Hysteresis12.20012.1863
Stator Eddy Current3.10103.0396
Stator Excess0.22090.2187
Rotor Hysteresis0.21750.2268
Rotor Eddy Current0.38780.3962
Rotor Excess0.02380.0250
Winding71.210368.3012
PM Eddy Current0.40140.3000
Total PMSG Loss87.762384.6938
Table 7. Temperatures in the PMSG.
ComponentsCase 2
Min (°C)Max (°C)Avg (°C)
Winding74.711574.809374.7474
Stator72.822074.073173.5120
Rotor73.399774.296374.0520
PM73.543574.295574.0635
Shaft61.420174.272571.1520
Air gap73.600574.293074.0013
Epoxy73.557374.293974.0647
Slot insulation73.118874.775974.2116
Enclosure26.849972.289927.9229
Air-front59.399074.790173.0421
Air-rear45.281574.807572.6266
Disclaimer/Publisher’s Note: The statements, opinions and data contained in all publications are solely those of the individual author(s) and contributor(s) and not of MDPI and/or the editor(s). MDPI and/or the editor(s) disclaim responsibility for any injury to people or property resulting from any ideas, methods, instructions or products referred to in the content.