1. Introduction
Driven by global commitments to sustainability and decarbonization, power systems worldwide are accelerating their transition toward novel architectures integrating high shares of variable renewable energy [
1]. With the large-scale deployment of renewable energy sources and energy storage systems, predominantly interfaced through power electronic devices, the modern power system is evolving into a coordinated framework encompassing various sources, grids, loads, and storage [
2,
3]. This evolution introduces profound differences in dynamic characteristics compared to traditional systems dominated by synchronous generators [
4]. In this context, technologies that effectively balance modeling accuracy and simulation efficiency are crucial for ensuring the secure and stable operation of modern power systems.
Dynamic equivalencing serves as an effective approach to addressing these challenges [
5]. Its core principle involves partitioning the system into a study area, which is modeled in detail, and an external area, which is simplified while preserving the static and dynamic behaviors of the overall system. Over the years, extensive research has been conducted on power system dynamic equivalencing, yielding mature methodologies [
6,
7,
8,
9,
10,
11,
12]. The primary methods include coherency-based equivalencing relying on synchronous generator coherency [
6,
7], modal equivalencing based on linearized models and eigenvalue properties of external areas [
8], and estimation-based equivalencing using measurement or simulation data from boundary nodes [
9,
10,
11]. Among these, coherency-based methods are widely adopted due to their solid theoretical foundation and clear physical interpretation. Recent advancements in data analysis have further enhanced traditional equivalencing techniques; for instance, Ref. [
12] employs piecewise Prony analysis on synchronous generator rotor angle curves to extract features for coherency grouping. Additionally, the intersection of artificial intelligence and dynamic equivalencing has led to novel approaches, such as time-series clustering for rotor angle coherency analysis [
13], correlation coefficient identification [
14], and fuzzy clustering recognition [
15].
Existing studies on dynamic equivalencing predominantly focus on parameter optimization, with limited in-depth analysis of the structural features and dynamic characteristics of equivalenced systems [
16]. Although optimizations and enhancements can improve equivalencing accuracy, insufficient consideration of system-specific constraints and the spatiotemporal variability of operational conditions often limit their practical applicability. Recently, increasing attention has been given to these constraints and obtain favorable outcomes. For instance, Ref. [
16] explicitly identifies three categories of constraints influencing equivalencing—AC system support capability, asynchronous operation modes, and high-penetration renewable energy integration—and applies them to the main grid of the China Southern Power Grid, achieving favorable results. In recent years, with the rapid integration of renewable energy sources and inverter-based resources into power systems, research has increasingly focused on adapting dynamic equivalence methods to handle the unique dynamics of these systems, such as reduced inertia and fast-acting controls [
17]. For example, studies have proposed dynamic equivalents for heterogeneous wind farms to maintain accuracy in high-penetration scenarios [
18]. Moreover, neural network-based scalable equivalence approaches have emerged to address computational challenges in large-scale systems with power electronics [
19]. Recent reviews have also emphasized the need for equivalencing in AC-DC hybrid systems, highlighting challenges in preserving transient stability and dynamic responses under faults [
20]. However, existing methods often overlook multi-feature constraints like topology, frequency response, and voltage dynamics in regional grids, highlighting the need for more comprehensive schemes as proposed in this study.
Notably, as the new power system continues to evolve, profound changes in the system architecture lead to evident shifts in system attributes and dynamic behaviors [
21]. The large-scale integration of power electronic devices, such as renewables, energy storage, and flexible DC transmission, fundamentally alters the composition of the source and grid sides. While this enhances energy utilization diversity and short-term energy storage capabilities, it also reduces the equivalent inertia of the power system, thereby weakening support in frequency and voltage domains [
22]. These structural transformations, attribute changes, and dynamic variations pose adaptability challenges to traditional equivalencing methods, particularly those relying on coherency grouping based on electrical distance and generator aggregation strategies.
Regional power grids represent subsets of the power system divided based on spatial layouts. Unlike the main grid, which primarily encompasses 500 kV and higher voltage levels, regional power grids operate primarily between 110 kV and 500 kV, with 220 kV as the backbone network. Within these regional power grids, renewable energy sources are commonly connected via 110 kV or 220 kV substations, while loads are aggregated at 110 kV stations. Inter-regional connections may occur through AC lines or VSC-HVDC links, often featuring distinct tie-lines. However, research on equivalencing for regional power grids remains relatively sparse; early studies focused on main grids, while recent efforts have emphasized renewable energy stations or renewable-integrated systems [
23,
24,
25,
26,
27,
28]. Consequently, regional power grids remain a critical research gap in dynamic equivalencing for emerging power systems, underscoring the need for targeted investigation.
The main contributions of this paper are summarized as follows:
- (i).
Based on the structural characteristics and dynamic attribute changes in new-type regional power grids with lower inertia and diversified interconnections, this study identifies three critical constraints for dynamic equivalence, including network topology, spatial characteristics of frequency response, and nodal residual voltage levels. This work addresses limitations of traditional methods by accounting for structural and dynamic attributes unique to regional grids.
- (ii).
A comprehensive equivalencing scheme is designed that incorporates the identified constraints. This scheme includes delineating the retained region via multi-objective optimization, optimizing the internal system via coherent generator aggregation and CSR-based load/branch reduction, and constructing a gray-box external system model. The objective is to preserve critical dynamic behaviors while achieving substantial model-order reduction.
- (iii).
The proposed scheme is validated on a real-world regional power grid in eastern Guangdong, China, which includes multiple IBRs and HVDC links. Comprehensive results show that the equivalent system maintains high consistency with the original system in power-flow results, short-circuit capacity, and dynamic response under transient conditions.
Based on the aforementioned analysis, this paper proposes a dynamic equivalencing scheme for regional power grids that incorporates multiple feature constraints. First, key object features are extracted from the organizational architecture and characteristics of the new power system, identifying three constraint conditions influencing regional power grid equivalencing: network topology, spatial characteristics of frequency response, and nodal residual voltage levels. Then, considering these constraints, a dynamic equivalencing scheme is designed to guide the delineation of retention scopes in regional power grids and the optimization of internal retained systems, while constructing an external system equivalent model primarily comprising synchronous generators and composite loads. Finally, the proposed scheme is validated on a Back-to-Back VSC-HVDC-connected regional power grid in Guangdong Province, China. Simulation results demonstrate the effectiveness of the theoretical approach.
2. Constraints on Dynamic Equivalents for Regional Power Grids
The dynamic equivalent modeling of regional power grids requires a primary focus on their architectural compositions and the resulting changes in system characteristics. Within the regional power grid, attention should be directed toward the network topology and the hierarchical stratification of the grid framework, while considering the composition of power sources, particularly examining the low-inertia characteristics and frequency responses introduced by renewable energy integration. In inter-regional contexts, emphasis should be placed on tie-line sections, especially where flexible direct current transmission serves as the inter-regional interconnections, necessitating analysis of power flow variations and voltage characteristics. In alignment with the developmental trends of the modern power system, this paper focuses on three key aspects, network topology, frequency response, and dynamic characteristic variations, to analyze the constraints associated with dynamic equivalencing.
2.1. Network Topology Constraints
The typical voltage hierarchy of regional power grids encompasses a multi-level architecture spanning from 500 kV to 110 kV. Although the number of 500 kV stations is exceedingly limited, the alternating current lines interconnecting 500 kV nodes form the primary conduits between regional power grids. Furthermore, VSC-HVDC, serving as a novel power electronics-based interconnection pathway, enables flexible integration with regional power grids via modular multilevel converters (MMCs). These elements contribute to the formation of electrical sections at the boundaries of regional power grids, characterized by distinct power transmission properties and exhibiting pronounced topological separability features. Consequently, in the dynamic equivalent modeling of regional power grids, nodes at the 500 kV level and flexible DC components warrant priority for retention.
The 220 kV network serves as the topological core of the regional power grid, while load centers typically emerge from the spatial aggregation of 110 kV nodes. Synchronous generators and renewable energy farms are commonly integrated through 110 kV or 220 kV substations. Consequently, simplifying the networks at these two voltage levels constitutes a primary task in dynamic equivalencing for regional grids.
Given that power networks exhibit inherent sparsity, their admittance matrices contain a high proportion of zero elements, forming typical sparse matrix structures. During the process of network reduction, node elimination should not aim solely to minimize node count but must also preserve the physical integrity of the system topology. Eliminating key hub nodes may reduce the number of nodes but increase node degrees, thereby causing the equivalent system to lose the intrinsic sparse attributes of the power network and produce a dense matrix configuration. Such conditions can lead to unrealistic representations, such as dense interconnections among all power source nodes, which deviate from the actual topological structure of power systems.
To address this issue, the node-centrality metric
is introduced to identify pivotal nodes responsible for power delivery within the system. Specifically,
quantifies the number of shortest paths traversing node
whose origin is any non-slack generator and whose terminus is uniquely the slack generator:
where
denotes the count of shortest paths between generator node
s and the slack node
w that pass through node
i, and
N is the total number of generator nodes excluding the slack. A larger
signifies that node
i mediates an increased number of shortest paths, thereby designating it as a critical hub interconnecting multiple generators. Consequently, such nodes must be retained during the equivalencing process. This node-centrality metric is thus distilled into a topological constraint and serves as a key indicator for node retention in the subsequent development of the dynamic-equivalence scheme.
2.2. Spatial-Frequency-Response Constraint
Large-scale integration of renewable energy resources reduces system inertia and consequently degrades frequency stability. To rigorously assess the frequency-domain consistency before and after equivalencing, this paper proposes the employment of the Rate of Change of Frequency (RoCoF) as the metric to evaluate the frequency-response characteristics of a regional power grid under abrupt power imbalances.
Given that RoCoF is pertinent only to the incipient stage of a disturbance, the following simplifying assumptions are introduced:
The disturbance does not trigger either rotor-angle or voltage instability.
In the high-voltage transmission network, inductive reactance markedly exceeds resistance; hence, active-power flow is dictated primarily by nodal phase angles. During the initial interval of the disturbance, nodal-voltage variations are negligible, permitting a linearized power-flow formulation.
Generators are represented by the classical second-order model—an equivalent series branch composed of transient voltage and transient reactance. Because magnetic flux is a state variable, the transient voltage is regarded as constant in the first instants of the disturbance. Internal generator nodes are retained and their equivalent circuits are embedded into the network equations.
The inertial response is confined to the initial post-disturbance period (typically the first 0.1 s after disturbance inception), during which system dynamics are predominantly governed by the intrinsic physical inertia of rotating masses and the instantaneous active power imbalance. All automatic control devices—including the outer-loop controls of VSCs and the governors/automatic voltage regulators (AVRs) of synchronous generators—have not yet had sufficient time to engage (with their response times on the order of tens to hundreds of milliseconds), so their influence is neglected when capturing the immediate inertial response indicator (RoCoF).
Accounting for the network topology, the system power characteristics are described by a linearized DC power-flow model in which the generators’ internal EMF nodes are explicitly incorporated. This yields
wherein
is the vector of active-power variations at the generator internal nodes,
collects the active-power variations at load and tie-line buses,
and
denote the rotor-angle and nodal-voltage phase-angle deviations, respectively, and
,
,
,
constitute the corresponding partitions of the reduced nodal susceptance matrix.
From (2), the vector of nodal active-power deviations is extracted as follows:
Simultaneously, the second-order electromechanical dynamics of each generator are linearized:
where
n denotes the number of generators,
denotes the inertia time constant,
denotes the rated rotor speed,
notes the mechanical power deviation,
notes the electromagnetic power deviation, and
denotes the damping coefficient.
Differentiating (3) and invoking the premise that, during the inertial-response phase, nodal power variations remain effectively constant (i.e., the time derivative of
is zero), yields
Upon the occurrence of a disturbance, the mechanical power of each generator is assumed to remain invariant over the short term, i.e.,
. Coupling this assumption with the classical second-order swing equation and neglecting the damping term
D, one obtains the following compact expression for the RoCoF at every network node during the inertial response:
When a nodal power disturbance occurs, the injected power is redistributed among generators in inverse proportion to their electrical distance from the point of disturbance [
29]. In accordance with Assumption (2), this redistribution is compactly expressed through the impulse-power-allocation matrix
D that maps nodal power variations to generator electromagnetic-power deviations:
where each entry
is defined as
with
denoting the mutual susceptance between the disturbance node
j and the internal node of generator
i, and
n denoting the total number of generators. Substituting this relationship into the preceding equations yields the aggregate RoCoF vector:
Introducing
allows the matrix to be partitioned as illustrated in
Figure 1.
Here, denotes the sensitivity coefficient that quantifies the influence exerted on the RoCoF at node j by a power perturbation at node i. The column vector , constituted by the set of coefficients , encapsulates the RoCoF impact across the entire system attributable to a disturbance at node i. A larger signifies a stronger causal linkage from node i to node j under identical power deviations. Consequently, the column vector provides a rigorous quantitative metric for assessing the nodal RoCoF response induced by a power disturbance at node i, thereby enabling a systematic evaluation of frequency-domain consistency between the original and equivalenced regional power systems.
2.3. Dynamic-Behavior Constraint
The dynamic behavior of a regional power grid is predominantly governed by the interaction between generation sources and network components. In conventional power systems, synchronous generators constitute the primary locus of system dynamics; however, the massive integration of power-electronic converters in the emerging paradigm imposes dynamics that are dictated almost entirely by their controllers. Consequently, an explicit examination of the operational conditions of these converters is indispensable for elucidating the factors that condition their performance.
Within a regional power grid, the converters originate mainly from renewable energy plants, energy-storage installations, and HVDC links. All such converters are essentially grid-following voltage-source converters (GFL-VSCs) governed by dual-loop control schemes, thereby exhibiting a high degree of similarity in their controlled characteristics. For conciseness, this study employs the grid-following VSC as the representative unit to analyze the determinants of converter dynamics and to distill the constraints that must be embedded in the dynamic-equivalence formulation.
2.3.1. Phase-Locked Loop (PLL) Control
A grid-following converter achieves synchronization with the host network via a phase-locked loop whose input is the voltage measured at the point of common coupling (PCC) and whose outputs are the tracked frequency and phase-angle references. The converter thereby aligns its operation with the grid by continuously processing these voltage measurements. A representative PLL control structure is depicted in
Figure 2.
The dynamics of the PLL are governed by
where
and
denote the proportional and integral gains of the PLL’s PI controller, respectively.
2.3.2. Outer-Loop Control Characteristics
Under the outer-loop control regime, the converter’s current references are dynamically adjusted in response to prevailing grid conditions. Customarily, the d-axis outer loop regulates the DC-link voltage, while the q-axis outer loop governs the AC-side voltage, yielding
where
,
,
, and
denote the proportional–integral gains of the respective outer-loop controllers,
is the measured voltage at the PCC, and
represents the converter’s DC-side voltage.
Equations (9) and (10) reveal that converter dynamics are intimately coupled with voltage conditions. On the one hand, the PLL acts as the synchronization unit of the VSC-HVDC link, embodying both grid-connection prerequisites and intrinsic control characteristics. With controller parameters fixed, the grid voltage directly modulates and, through , perturbs the rotor-angle δ, thereby shaping the transient synchronization behavior of the HVDC system. On the other hand, the AC-side voltage exerts a decisive influence on VSC dynamics via the outer-loop controllers. Furthermore, voltage magnitude is pivotal for fault-ride-through (FRT) operation: prevailing FRT strategies dynamically adjust the active- and reactive-current references in real time in accordance with the PCC voltage profile to avert unwanted disconnection.
It is therefore evident that voltage constitutes a dominant variable in the dynamic characterization of converters. In this work, the nodal residual-voltage index is adopted to delineate those regions of the regional power grid that are electrically tightly coupled to converter-dominated assets. Residual voltage is defined as the post-fault voltage drop at any node when a three-phase short-circuit is applied at a specified location; a lower residual value signifies closer electrical proximity and stronger coupling to the faulted bus.
By systematically scanning residual voltages across a comprehensive set of fault scenarios within the regional power grid, the critical nodes that are strongly associated with VSC-HVDC links, renewable power plant, and energy-storage stations can be systematically identified, thereby guiding the retention boundary for the dynamic-equivalence process.
3. Design of the Dynamic Equivalencing Scheme
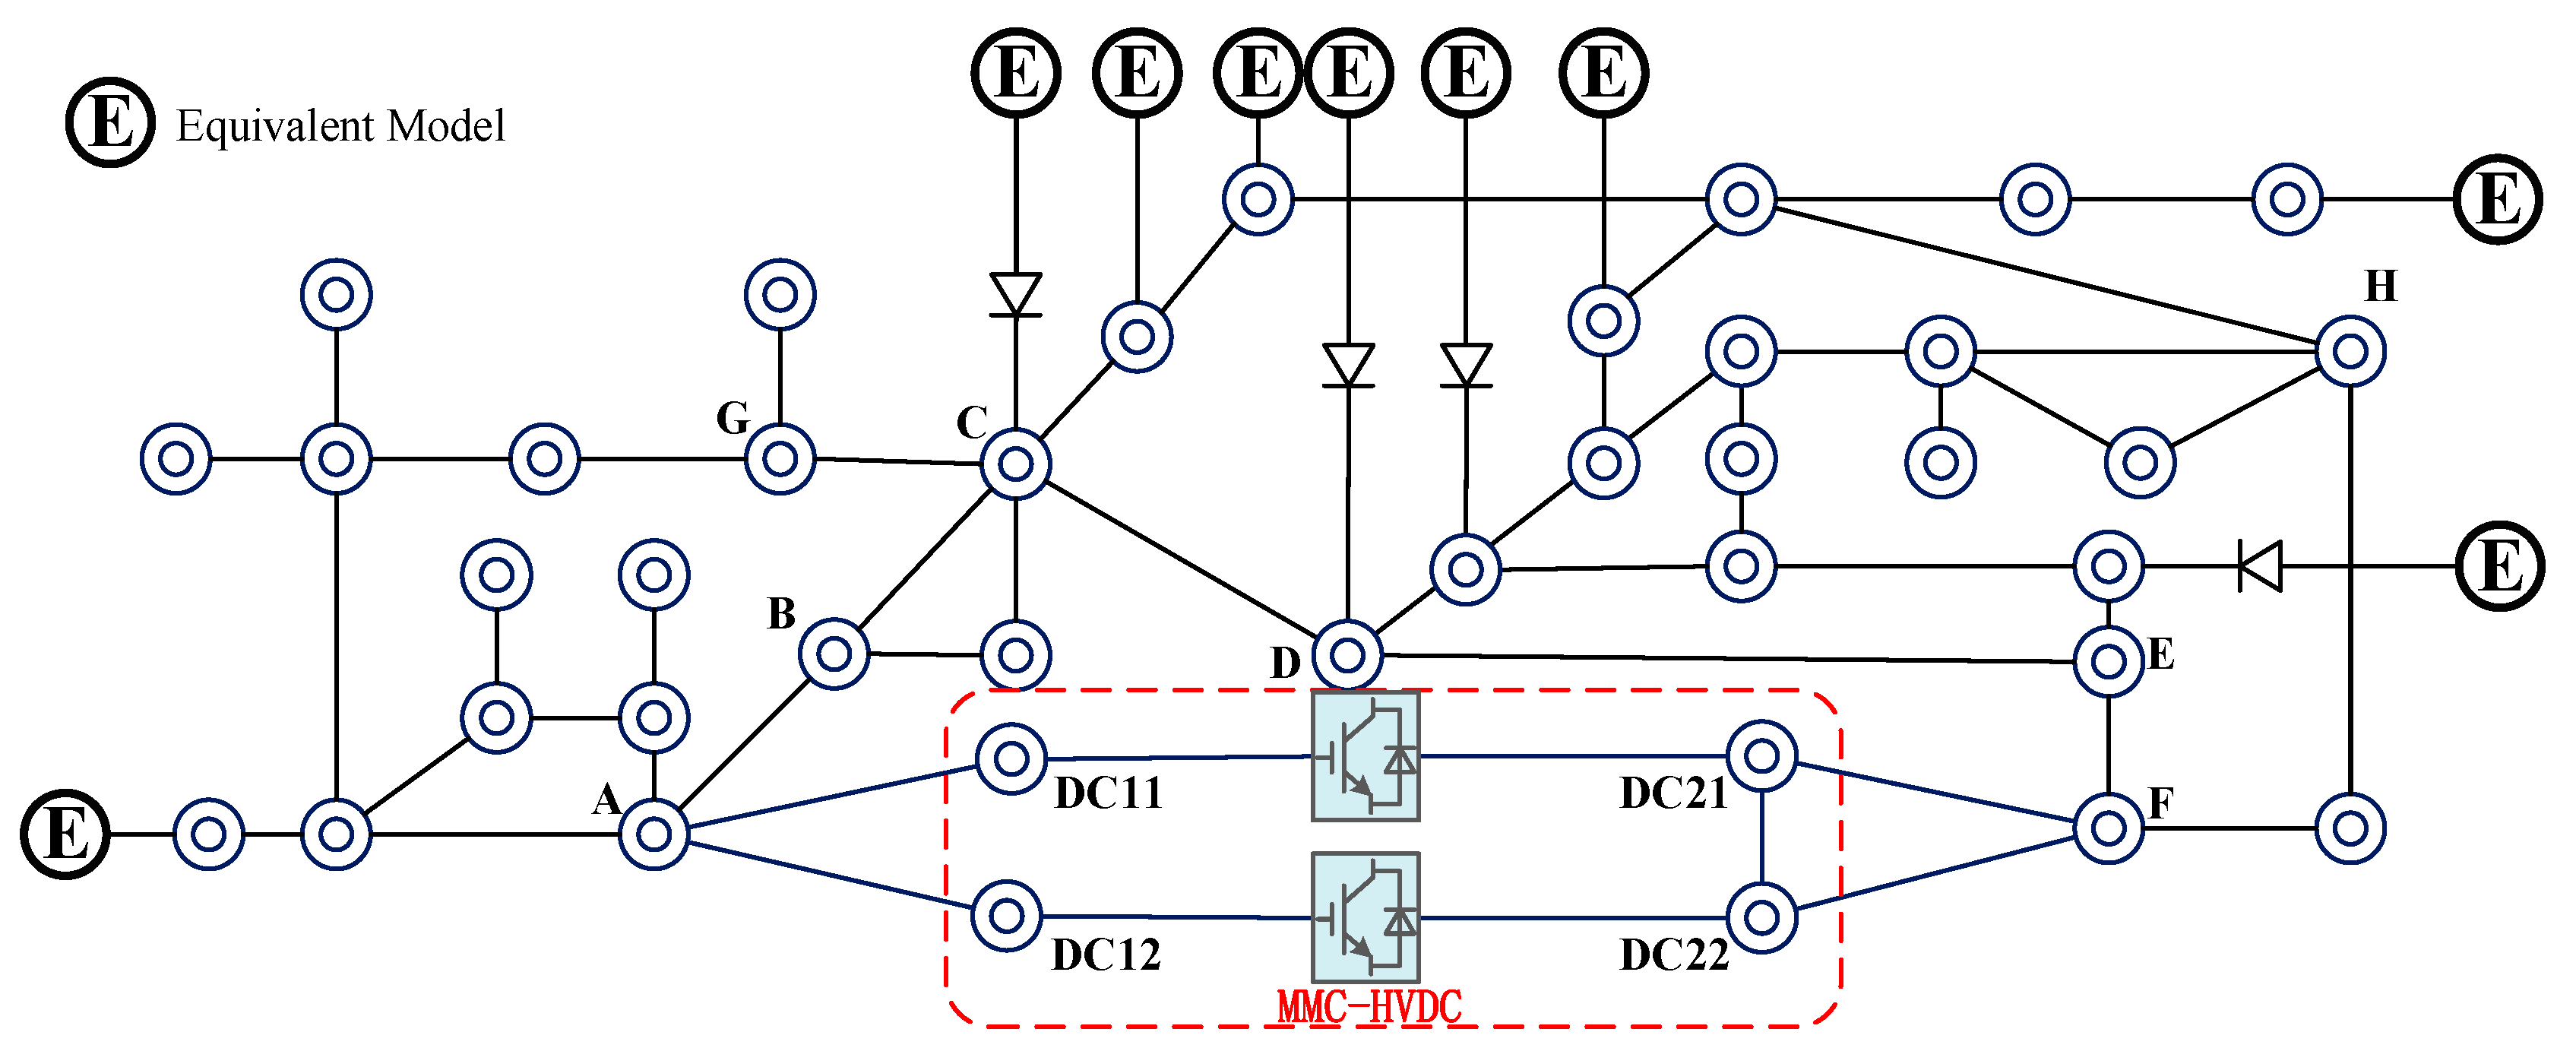
This section integrates the multi-dimensional constraints elaborated above and, using the MMC-HVDC-integrated regional power grid in eastern Guangdong as a case study, systematically presents the procedural workflow for establishing the dynamic equivalent. The workflow encompasses three principal tasks: (i) delineation of the retained region, (ii) optimization and adjustment of the internal system, and (iii) construction of the external equivalent model.
3.1. Delineation of the Retained Region
By synthesizing topological, frequency response, and residual-voltage constraints, the boundary selection for the regional power grid equivalence is reformulated as a multi-objective optimization problem. Appropriate thresholds are selected to achieve an optimal balance between the compactness of the reduced model and the fidelity of its dynamic characteristics.
Notably, these three constraints exhibit inherent universality across power systems with different structures (e.g., radial, meshed, synchronous generator-dominated, or converter-dominated grids), as they capture fundamental physical attributes of power system dynamics rather than scenario-specific features:
- (i).
Topological constraints: Identify hub nodes via the node centrality metric (
Section 2.1), which preserves the structural skeleton of the regional grid. This is universally applicable because the topological structure determines disturbance propagation paths and power flow distribution, regardless of whether the system is dominated by synchronous generators or IBRs.
- (ii).
Residual-voltage constraints: Remain critical for converter-dominated systems, as converter dynamics (e.g., PLL synchronization, outer-loop control) and fault-ride-through (FRT) strategies are inherently voltage-dependent. The residual voltage quantifies the electrical coupling between nodes and IBRs, ensuring that nodes closely associated with converter operation are retained to preserve key dynamic interactions.
- (iii).
Frequency-response constraints: Based on the RoCoF, this constraint adapts flexibly to different system types. For converter-dominated grids with low inherent inertia, the RoCoF threshold range is adjusted from 0.1 to 0.6 to reflect the influence of converter control mechanisms (e.g., virtual inertia control in GFM converters or PLL dynamics in GFL converters). The core logic of frequency constraint—ensuring consistency of inertia-related transient responses—remains unchanged.
In the preliminary stage, the retention boundary is seeded by exploiting the low-voltage ride-through (LVRT) criterion of the MMC-HVDC link. Regions of the original system exhibiting a post-fault voltage below 0.9 p.u.—the LVRT threshold prescribed by the control strategy under investigation—are retained, while the remainder of the regional power grid and the overlaying backbone are aggressively reduced. This expediently isolates the sub-network that is electrically tightly coupled to the MMC-HVDC, thereby defining the initial retention envelope for subsequent refinement.
Subsequently, the nodal residual-voltage index α and the frequency-response index β are introduced. A node i is designated as retained if its residual voltage vi < α or if the corresponding entry kw,i in the frequency-response matrix Kw of the MMC-HVDC point of common coupling w satisfies kw,i > β.
The indices
α and
β are then treated as optimization variables. An objective function is formulated to minimize the scale of the equivalent system while ensuring that the retained network continues to satisfy the residual-voltage and frequency-response constraints. The overall procedure for delineating the equivalence boundary is summarized in
Figure 3.
As shown in
Figure 3, we need to implement the following process:
- (i).
Initialization: Set the search ranges of α and β, as well as algorithm parameters (number of particles, iterations, etc.);
- (ii).
Fitness calculation: Compute the fitness value of each particle with the objective function;
- (iii).
Iterative update: Adjust the values of α and β according to the individual optimal solution and global optimal solution of the particles;
- (iv).
Convergence judgment: Stop iteration when the convergence criterion is met, and output the optimal thresholds α and β;
- (v).
Node screening: Determine the set of retained nodes based on the optimal thresholds to complete the delineation of the equivalence boundary.
After conducting preliminary screening on the original system, the Particle Swarm Optimization (PSO) algorithm is then adopted to optimize the indicators. Nodes whose residual voltage or frequency-response index falls below the respective threshold are retained. The quality of the equivalencing scheme is then evaluated by jointly considering the cardinality of the retained set and the associated fidelity loss. If the current solution is not Pareto-optimal, the thresholds are iteratively adjusted and the evaluation repeated until convergence. This iterative optimization is compactly expressed by the following objective function:
Let A(v) denote the set of nodes satisfying the residual-voltage threshold α, and B(v) denote the set satisfying the frequency-response threshold β. Let G represent the original network and VG its node set; signifies the cardinality of any node subset T. The penalty terms and quantify the dynamic-feature losses associated with residual voltage and frequency response, respectively, thereby mediating the trade-off between model compactness and fidelity. and are the penalty coefficients for node residual voltage and frequency response characteristic loss, respectively, and they generally take values from 100 to 1000. vresm,i is the residual voltage at node m (PCC of MMC-HVDC) when a three-phase short-circuit fault is set at the reserved node i, and RoCoFi,m is the frequency response value of node i when a power disturbance is set at m.
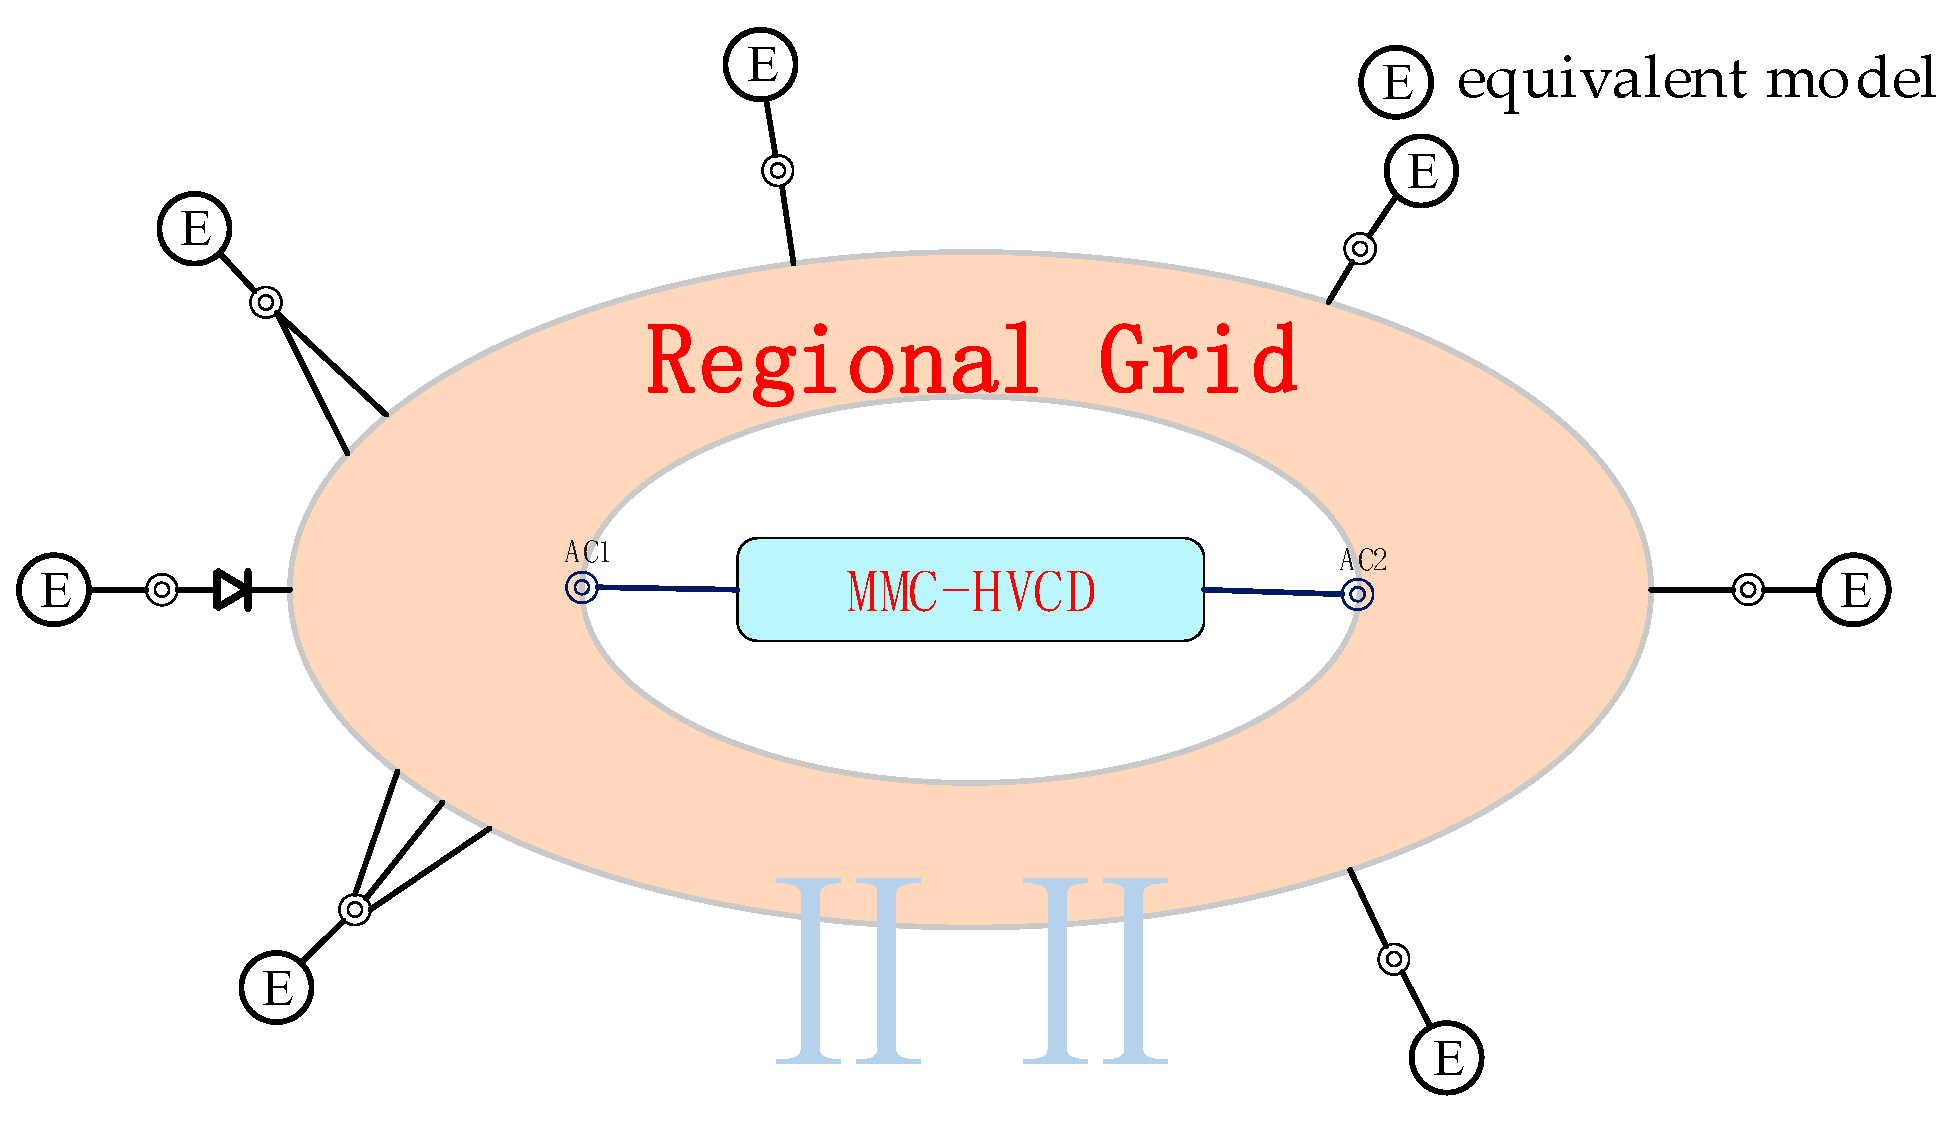
Upon determination of the retention thresholds, the nodes that meet the above criteria are identified and, together with the pre-retained MMC-HVDC terminals and 500 kV buses, delineate the retained and external regions. Subsequently, the retained region undergoes internal optimization, while the external region is reduced to an equivalent representation; the corresponding equivalent models are then interfaced at the boundary nodes of the retained network, as illustrated in
Figure 4.
3.2. Adjustment of the Internal System
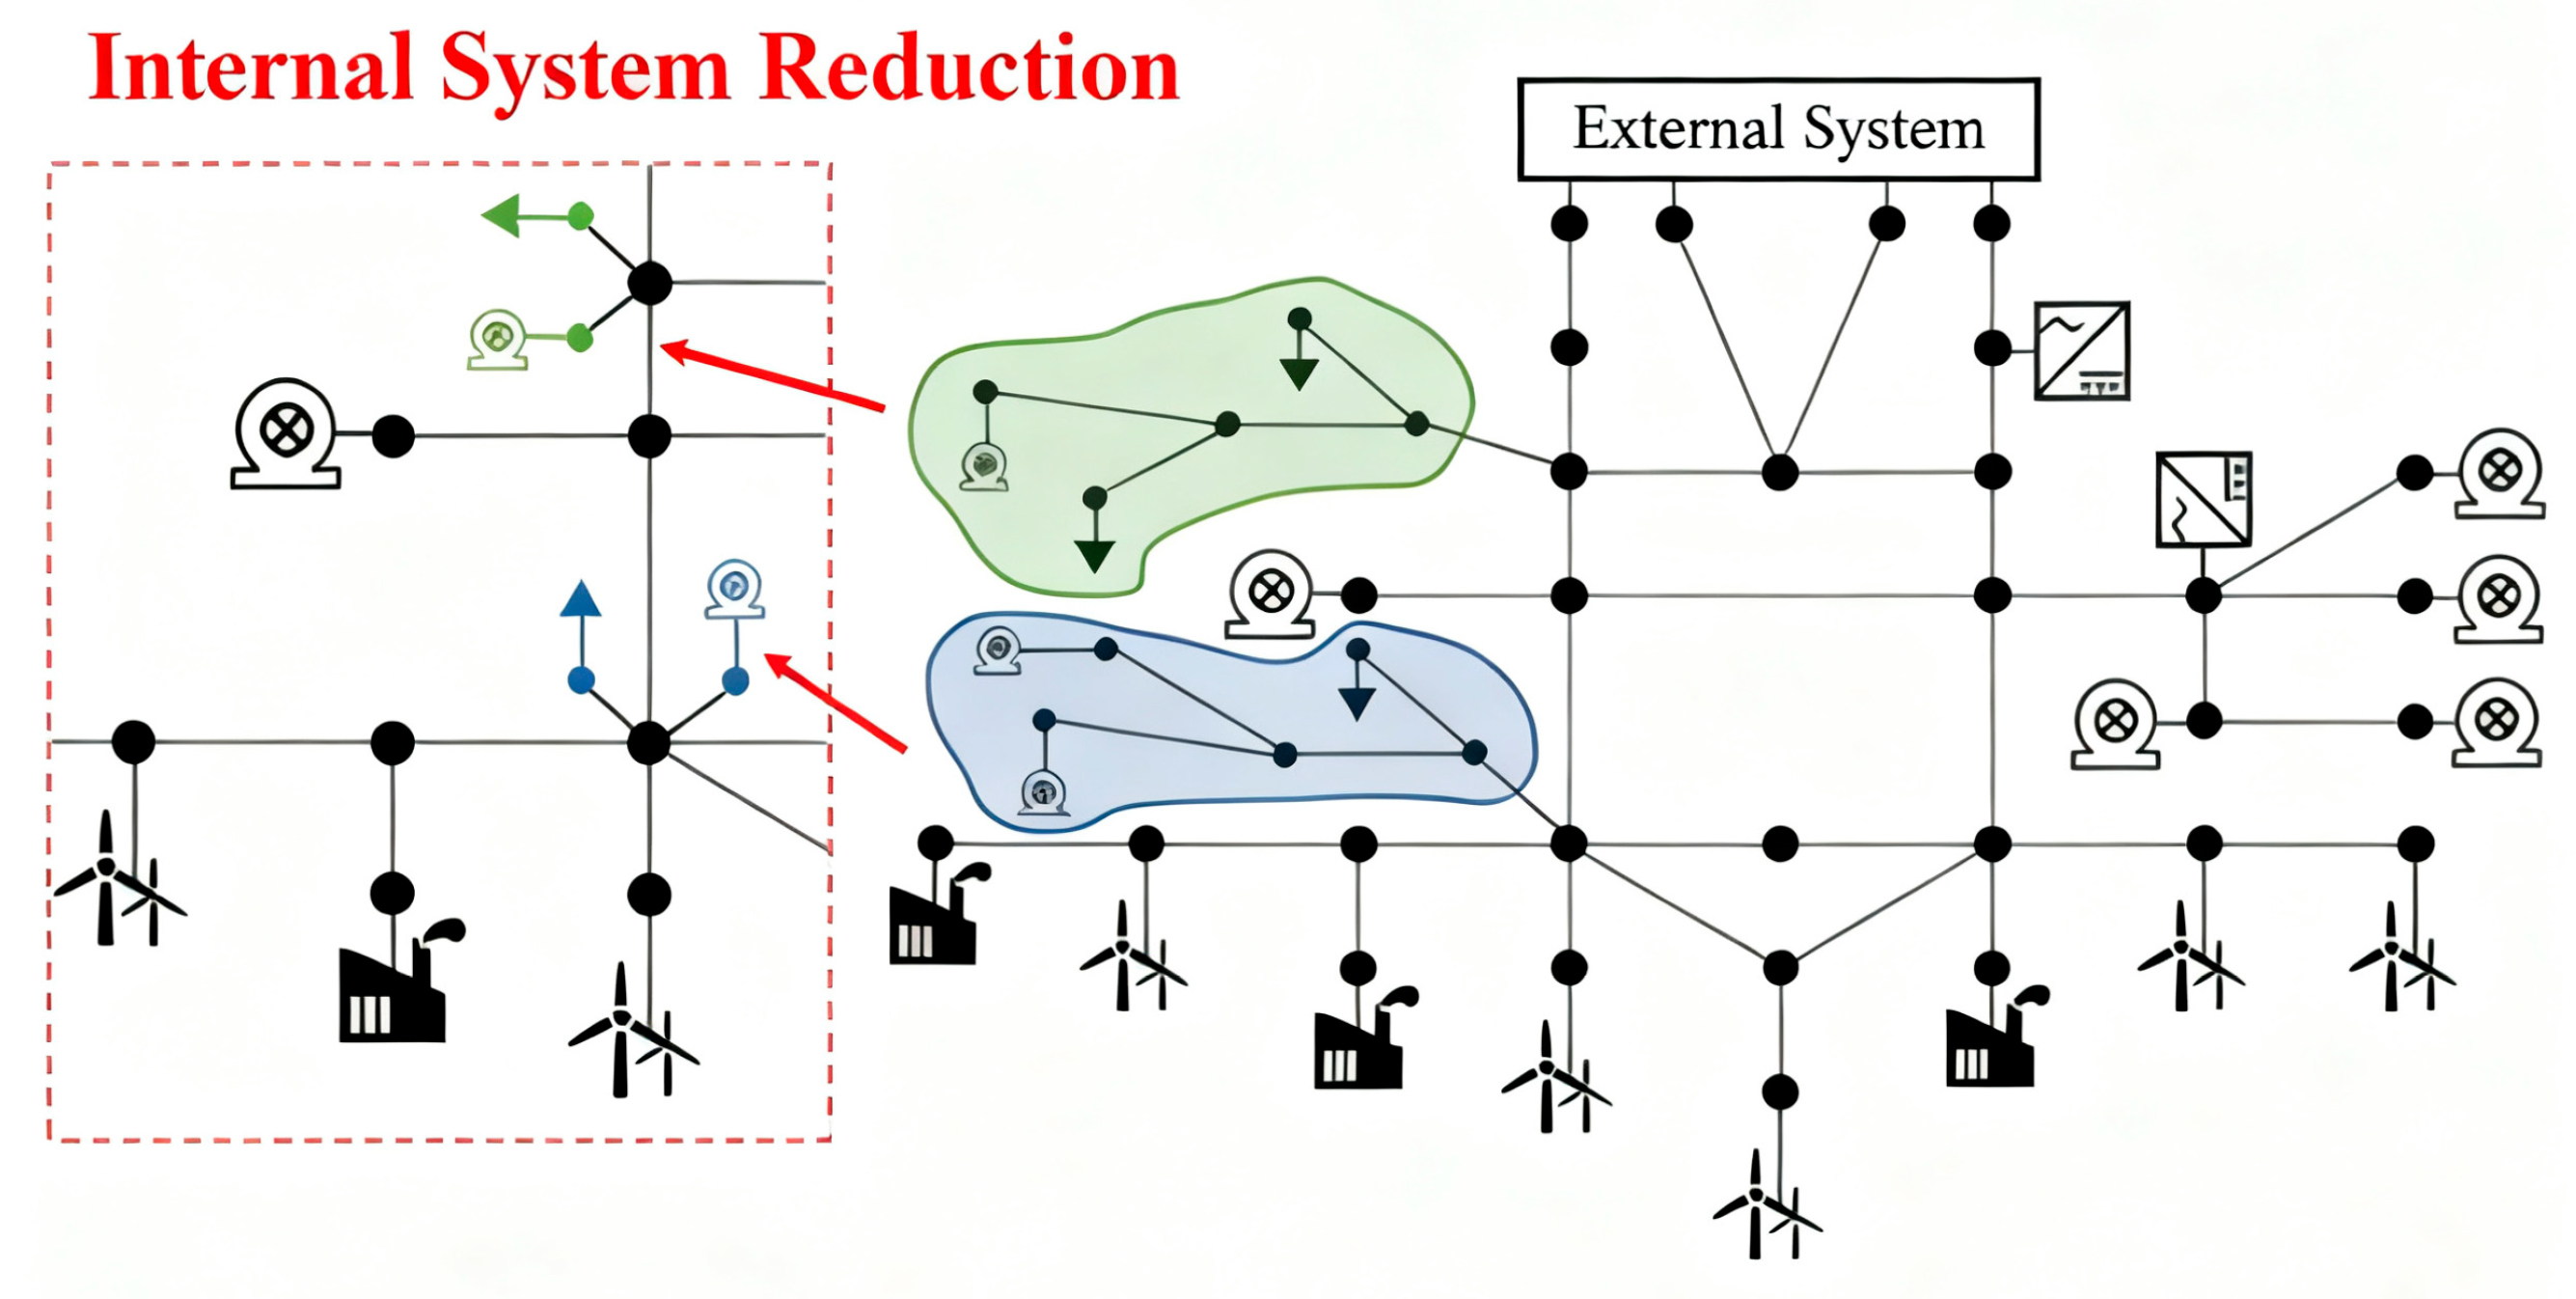
Owing to structural constraints of the meshed topology, a residual set of generator and load nodes situated at medium- and low-voltage levels—or located at the extremities of the regional power grid—remains eligible for elimination (
Figure 5). These nodes are characterized by small rated powers and lie within sub-areas fed by pivotal interconnection buses; consequently, they are weakly coupled to neighboring regions and to the overlaying backbone. Exploiting this weak coupling, the embedded small-scale generators and loads can be further aggregated or relocated, yielding a concise representation that accentuates the dominant trunk network.
Synchronous generators within the same geographical zone, exhibiting short electrical distances and virtually identical rotor-angle responses, are coherently aggregated into a single equivalent unit. Loads and branches are reduced via the classical CSR method [
30]. During this network reduction, any node whose generator-centrality index satisfies
Ci > 2 is explicitly retained to preserve the sparsity of the admittance matrix and to preclude direct interconnection between lumped generators and equivalent branches.
3.3. Construction of the External-System Equivalent Model
Traditional external-system equivalencing presumes exhaustive knowledge of network topology and equipment parameters; however, stringent data-security protocols and proprietary restrictions often render such information inaccessible. To circumvent this limitation, a gray-box model founded on a generic physical framework is adopted. This paradigm retains interpretable physical structure while enabling parameter identification through data-driven techniques.
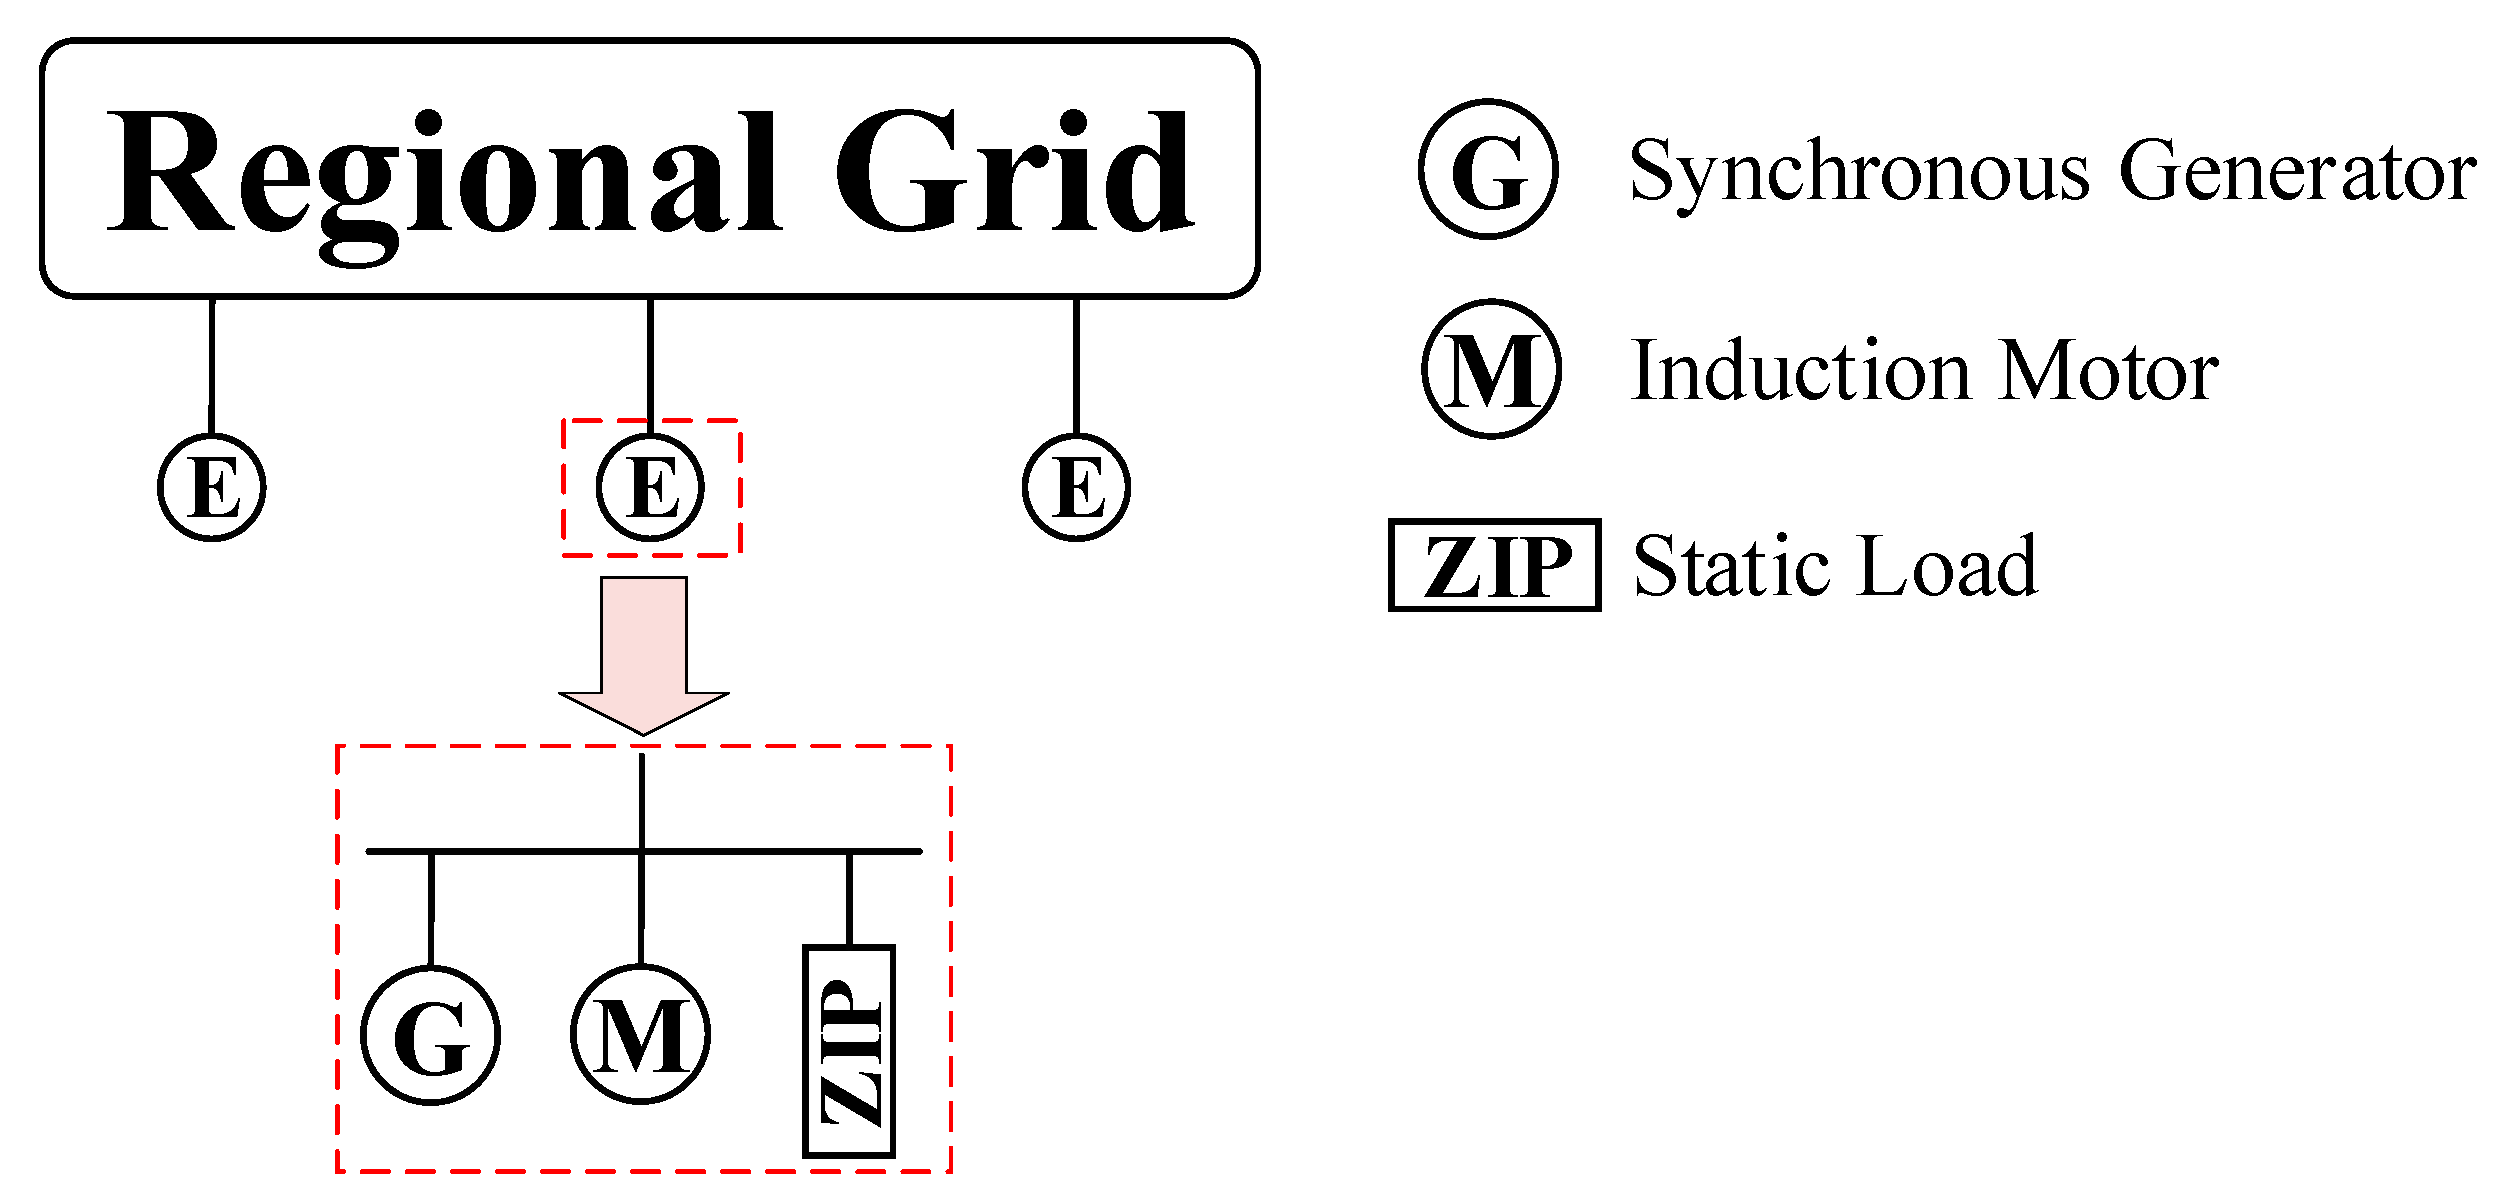
For the external region, a universal model comprising aggregated synchronous generators and composite loads is formulated, as illustrated in
Figure 6. The structure preserves the salient physical attributes of the original components and is directly compatible with industry-standard simulation platforms such as PSD-BPA.
3.3.1. Synchronous Generator Model
As the backbone of contemporary power systems and a pivotal determinant of their electromechanical dynamics, the equivalent synchronous generators are represented by sixth-order machine models to accurately reproduce the transient support that the external system provides to the retained regional power grid. Each equivalent unit is fully equipped with the requisite controllers—namely the prime-mover and governor, automatic voltage regulator (AVR), and power-system stabilizer (PSS). The constituent sub-models and their principal parameters are detailed in
Table 1.
The parameters , , , and denote the d- and q-axis transient and sub-transient reactances, while , , , and are the corresponding open-circuit time constants. and represent the proportional gain and time constant of AVR, respectively. and are the proportional gain and time constant of the PSS. signifies the maximum mechanical power output of the prime mover, R is the speed-droop characteristic, and denotes the governor time constant.
3.3.2. Load Model
The aggregate load within the external area is represented by a composite model that encompasses both static and dynamic components. The static portion is characterized by the ZIP (constant-impedance, constant-current, constant-power) load model, whereas the dynamic contribution is captured by an induction-motor equivalent. The principal parameters are summarized in
Table 2.
In the composite load model, , , and denote the per-unit percentages of constant-impedance, constant-current, and constant-power components, respectively. and quantify the per-cent variations in active and reactive power for a 1% change in system frequency. The induction-motor parameters include rotor reactance and resistance , magnetizing reactance , stator reactance and resistance , inertia time constant T, torque coefficient A, and initial slip . The ratio between static and dynamic load components is maintained identical to that of the origin system.
3.3.3. Parameter Identification of the Equivalent Model
Once the generic equivalent structure of the external area has been fixed, its parameters must be rigorously identified and refined. Adopting a data-driven gray-box approach, the proposed model utilizes fault recordings from the boundary nodes. The identification objective is to minimize the deviation between the disturbance responses of the reduced-order equivalent and the original system. Voltage and active power trajectories at these boundary nodes are selected as the observable quantities, leading to the following parameter-identification object function:
where
and
denote the active power and voltage trajectories predicted by the equivalent model with parameter vector
θ, while
and
are the corresponding measurements from the original system at the boundary nodes, and k indexes the discrete observation points. To reconcile implementation complexity with computational efficiency, it is recommended that a sensitivity analysis first be performed to isolate the parameters of dominant influence, after which an appropriate estimation technique such as nonlinear least squares or evolutionary optimization, can be employed for final parameter identification.
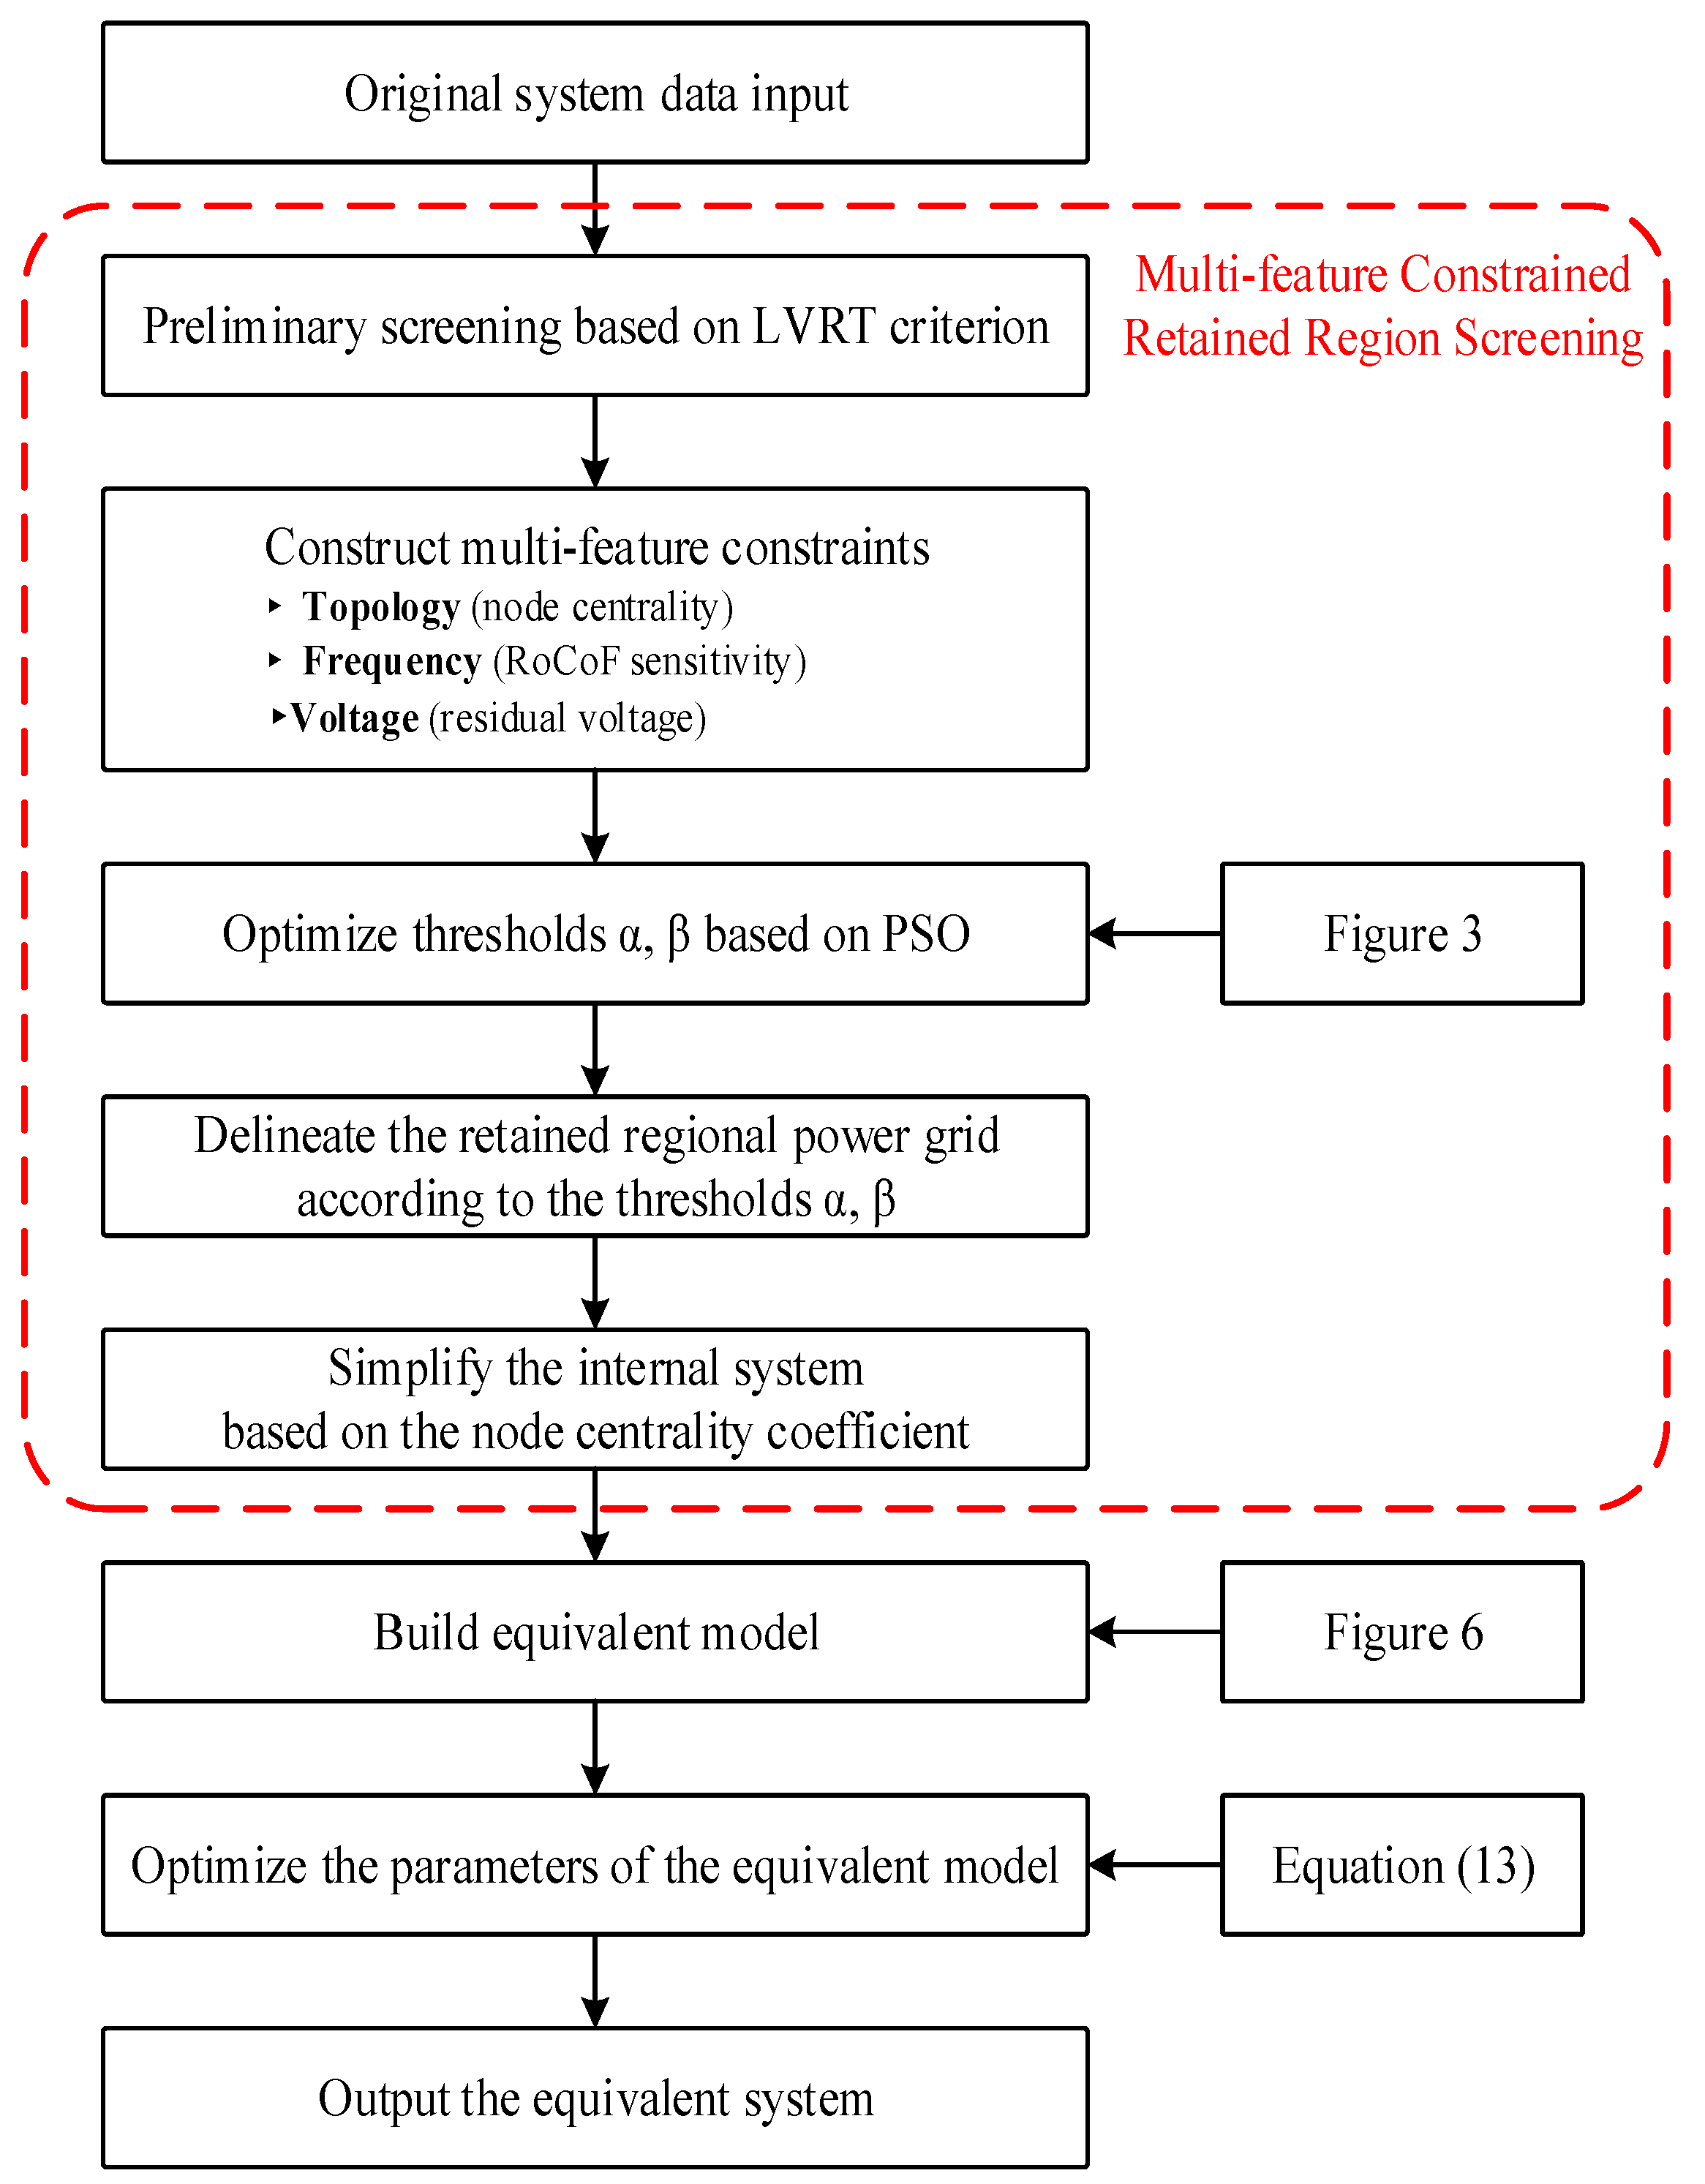
To further clarify the implementation process of the multi-feature constraint dynamic equivalencing method and the integration of control loops, the overall workflow is summarized in
Figure 7.
As shown in the diagram, the method starts with the input of original system data. After preliminary screening based on the LVRT criterion, the PSO algorithm is adopted to optimize the residual voltage threshold and frequency response threshold under the constraints of topological centrality, RoCoF sensitivity, and nodal residual voltage—this link incorporates parameter optimization control to ensure the balance between system scale reduction and dynamic fidelity. Subsequently, the retained nodes are determined according to the optimized thresholds, and the external system is dynamically equivalenced while the internal medium-low voltage subsystem is simplified. During the equivalencing process, the control loops of key components are fully retained and integrated into the equivalent model. Finally, an equivalent system will be output.
4. Simulation Study
4.1. Equivalencing Scheme
The proposed dynamic equivalencing methodology is validated on the Eastern Guangdong power grid, a large-scale and complex regional power system characterized by a hierarchical voltage structure, diverse power source composition, and intensive interconnections. Specifically, this grid encompasses over 100 nodes at the 500 kV voltage level, more than 1000 nodes at the 220 kV level, and a total of over 5000 nodes across all voltage hierarchies, forming an intricate meshed-topology network with extensive transmission branches. In terms of power source configuration, it incorporates over 50 renewable energy installations (including wind and photovoltaic plants), 90 synchronous generators with diverse capacity ratings, and multiple externally fed DC links serving as external power supply inputs. For interconnection infrastructure, the grid features a Back-to-Back VSC-HVDC link that adopting MMC topology, which functions as a dedicated energy transmission channel. As a key hub within the China Southern Power Grid, this system undertakes critical tasks such as cross-regional power transmission, renewable energy consumption, and reliable power supply for local loads, making it an ideal testbed for verifying the effectiveness and engineering applicability of the proposed dynamic equivalencing method.
The equivalencing process first employs nodal residual voltage as a metric to quantify the electrical coupling among dynamic components within the regional power grid. The severity of voltage depression during faults, captured by the residual-voltage magnitude, serves as an indicator of inter-bus coupling strength and thereby guides the selection of buses to be retained. The resulting residual-voltage distribution is depicted in
Figure 8a.
Subsequently, the frequency-response matrix
Kw at the MMC-HVDC’s PPC is systematically scanned; its entries quantify the nodal impact within the regional power grid following a power perturbation of the DC link, as illustrated in
Figure 8b.
The admissible search space is prescribed as [0.6, 0.9] p.u. for the residual-voltage threshold and [0.1, 0.6] for the frequency-response index. Optimization within these bounds yields a residual-voltage threshold of 0.72 p.u. and a frequency-response index threshold of 0.26. The resulting retention boundary, delineated by these optimized criteria, is depicted in
Figure 9.
Applying the proposed methodology, the external portion of the regional power grid is dynamically equivalenced while the internal medium- and low-voltage subsystems are aggressively reduced. The resulting equivalent comprises 96 AC buses and 109 branches—less than 10% of the original network size—rendering it amenable to detailed electromagnetic-transient studies in PSCAD/EMTDC or RTDS. In the following section, the validity of the approach is rigorously assessed through comparative analyses of power-flow profiles, short-circuit capacities, and transient responses.
4.2. Power-Flow Comparison
The power-flow profiles of the equivalenced regional power grid are benchmarked against those of the original system.
Table 3 and
Table 4 present the comparative results for selected bus voltages and branch active-power flows, respectively.
The above comparisons reveal that the maximum nodal-voltage discrepancy between the original and equivalent systems is 0.037%, while the largest active-power deviation on any transmission branch is 0.17 MW. Consequently, the power-flow profiles of the two systems are deemed to be in excellent agreement.
4.3. Comparison of Short-Circuit Capacity
As summarized in
Table 5, the short-circuit capacities at corresponding nodes before and after equivalencing are closely aligned. It can be observed that the maximum deviation at the retained nodes is approximately 2.7%. This confirms that the short-circuit capacities of the system remain highly consistent following equivalence.
4.4. Comparative Transient Performance Analysis
To rigorously assess the dynamic performance of the equivalent system under disturbances, two distinct fault scenarios, covering both AC and DC contingencies, are designed. Comparative analyses of the original and equivalent system’s transient responses under these disturbances provide a comprehensive validation of the proposed equivalence scheme.
4.4.1. Scenario 1
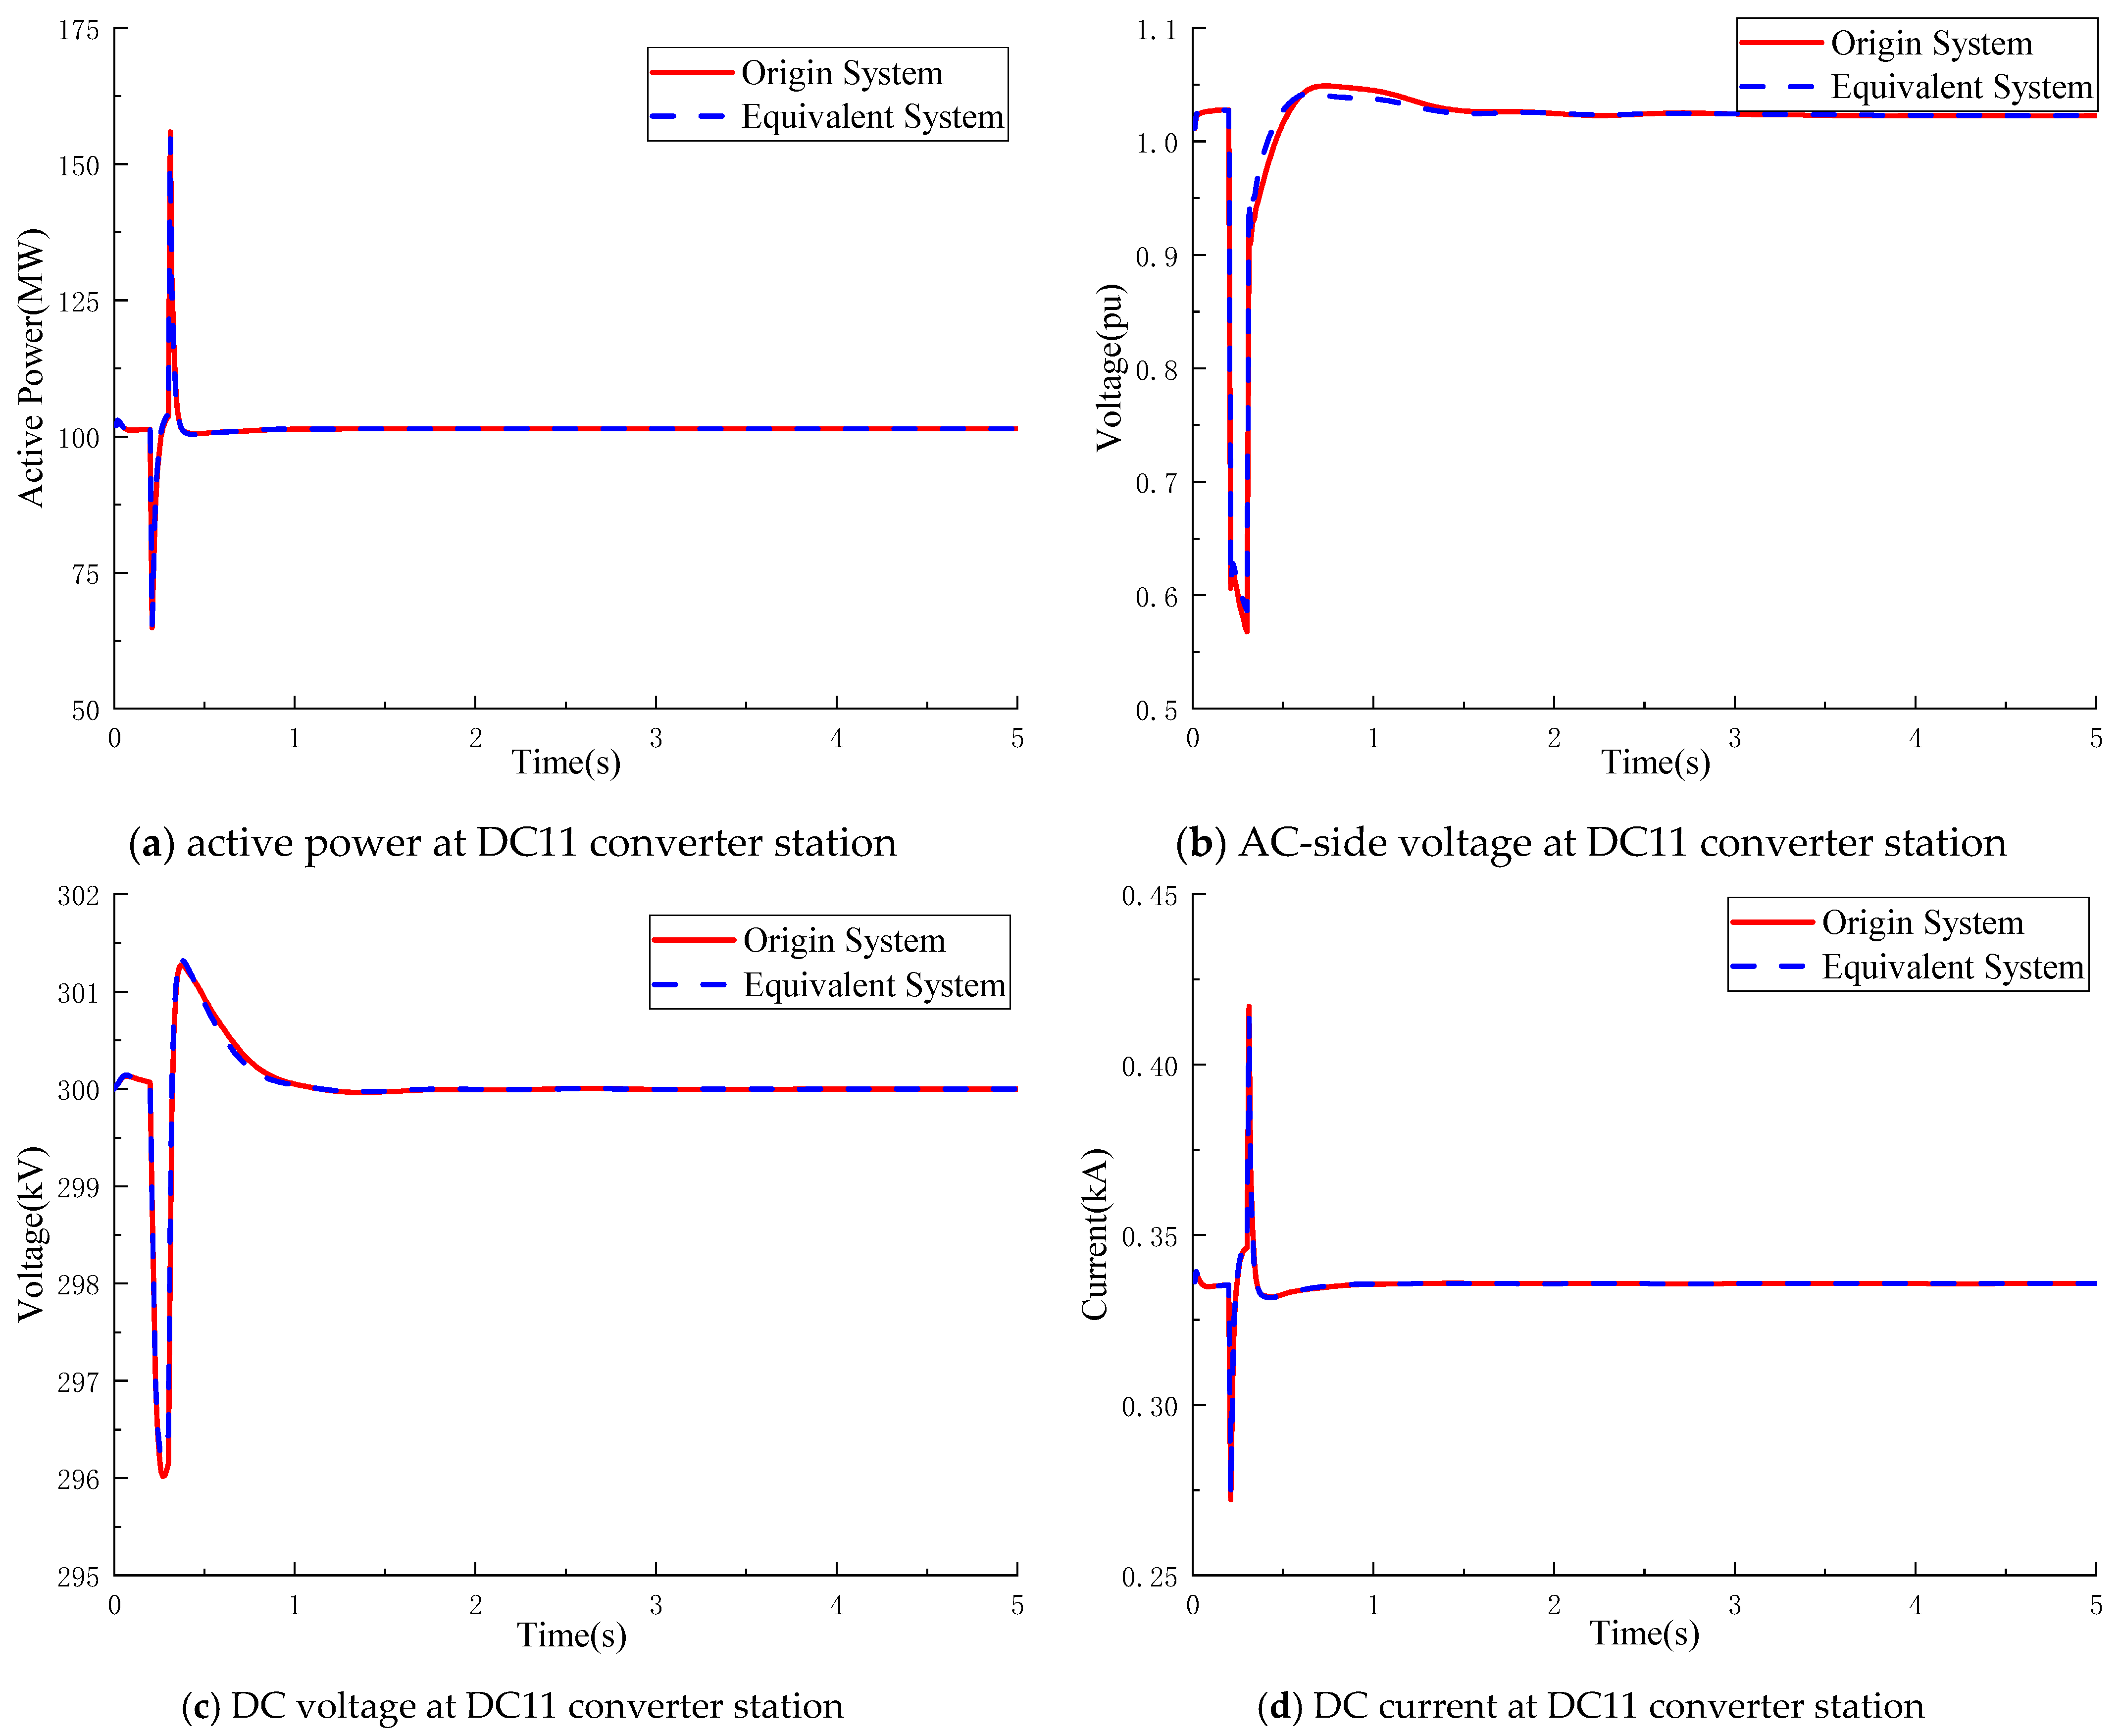
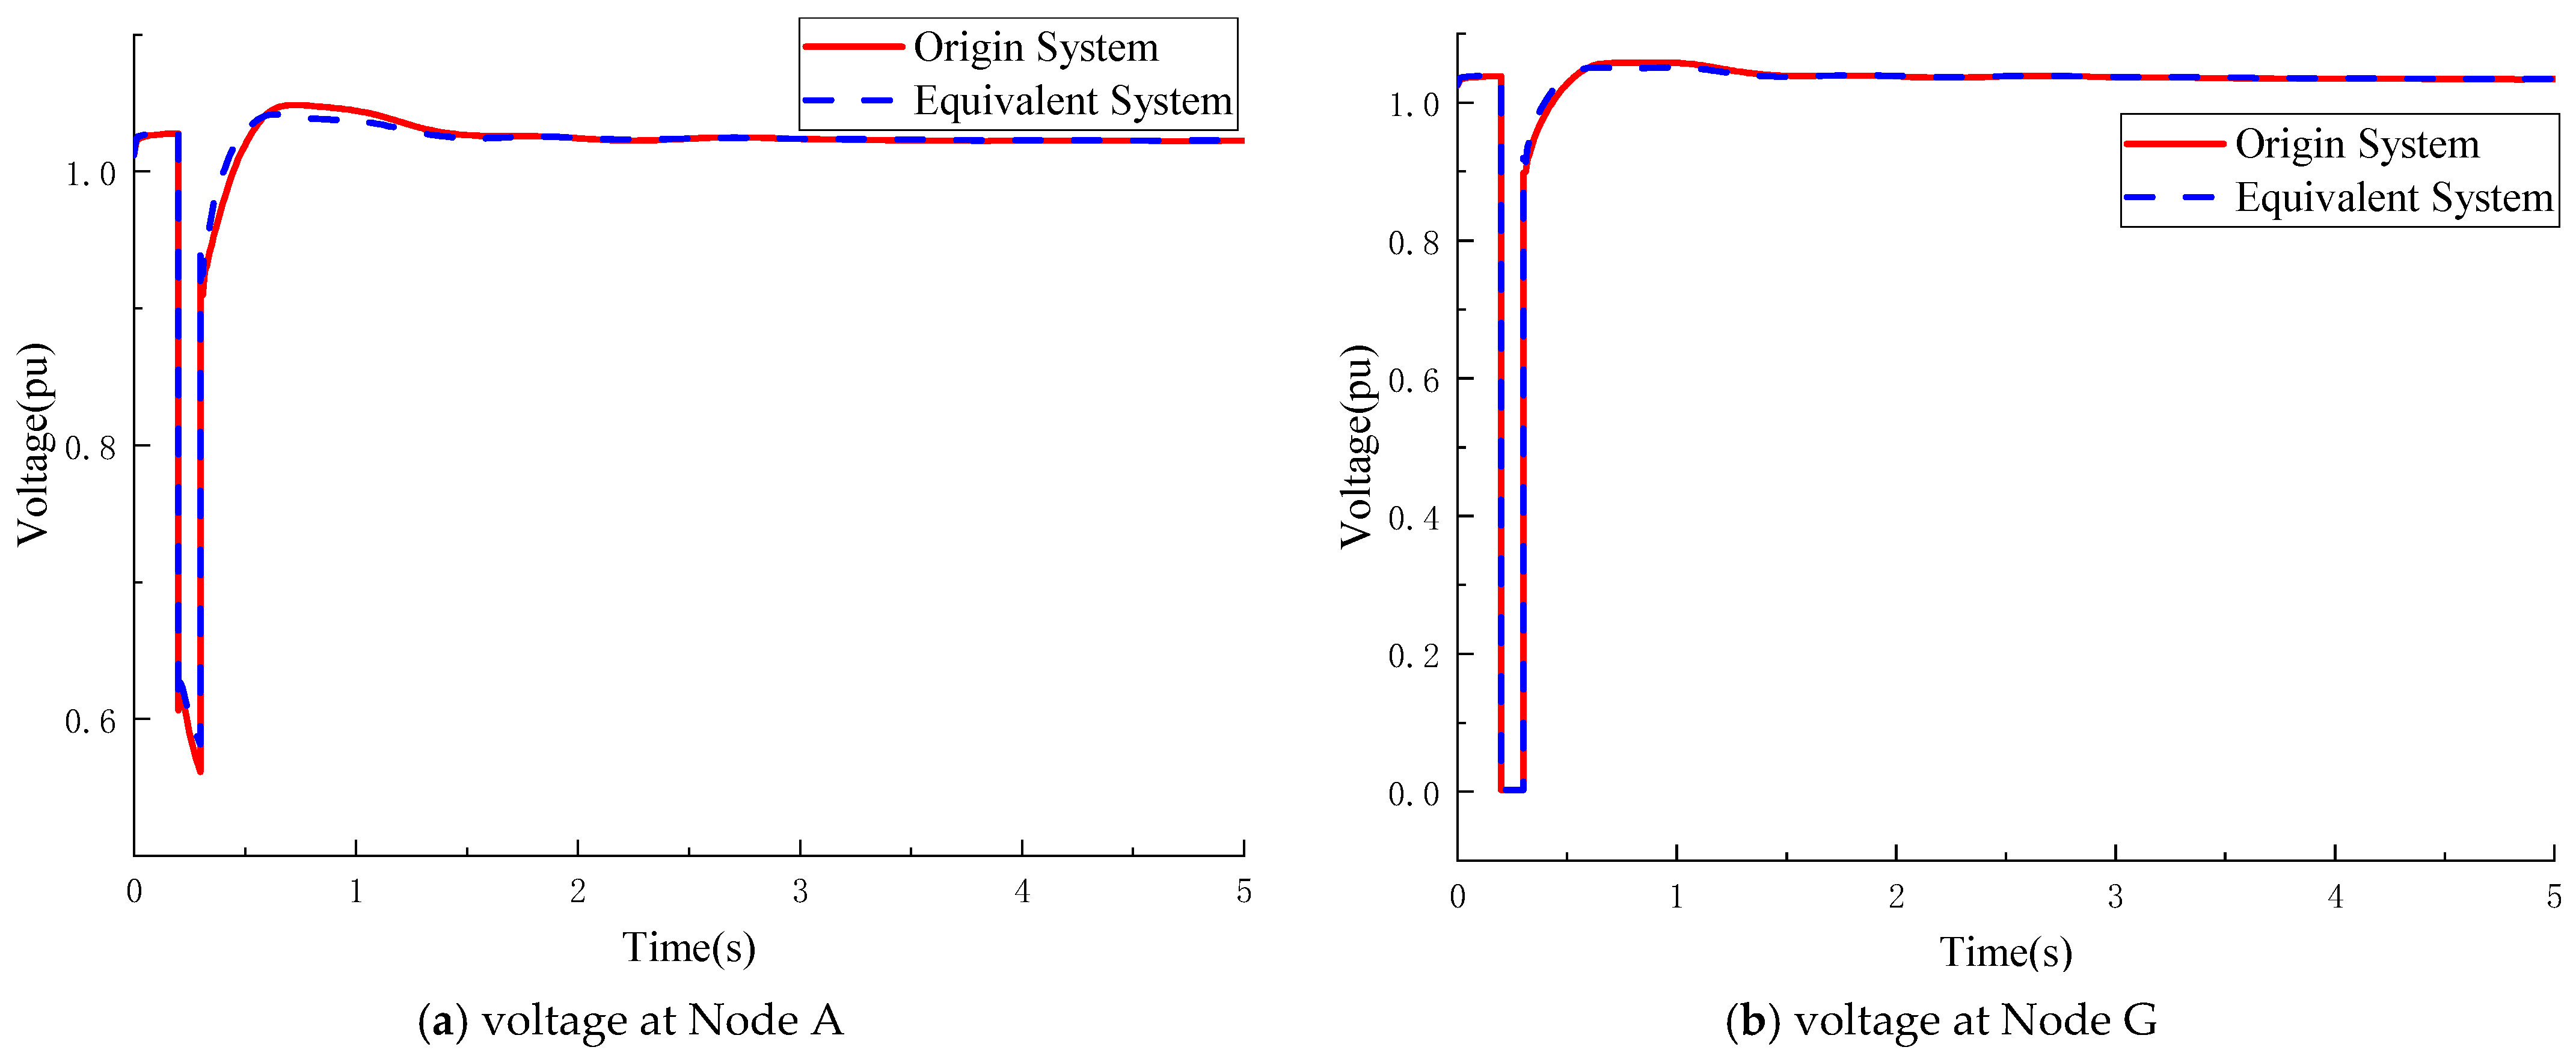
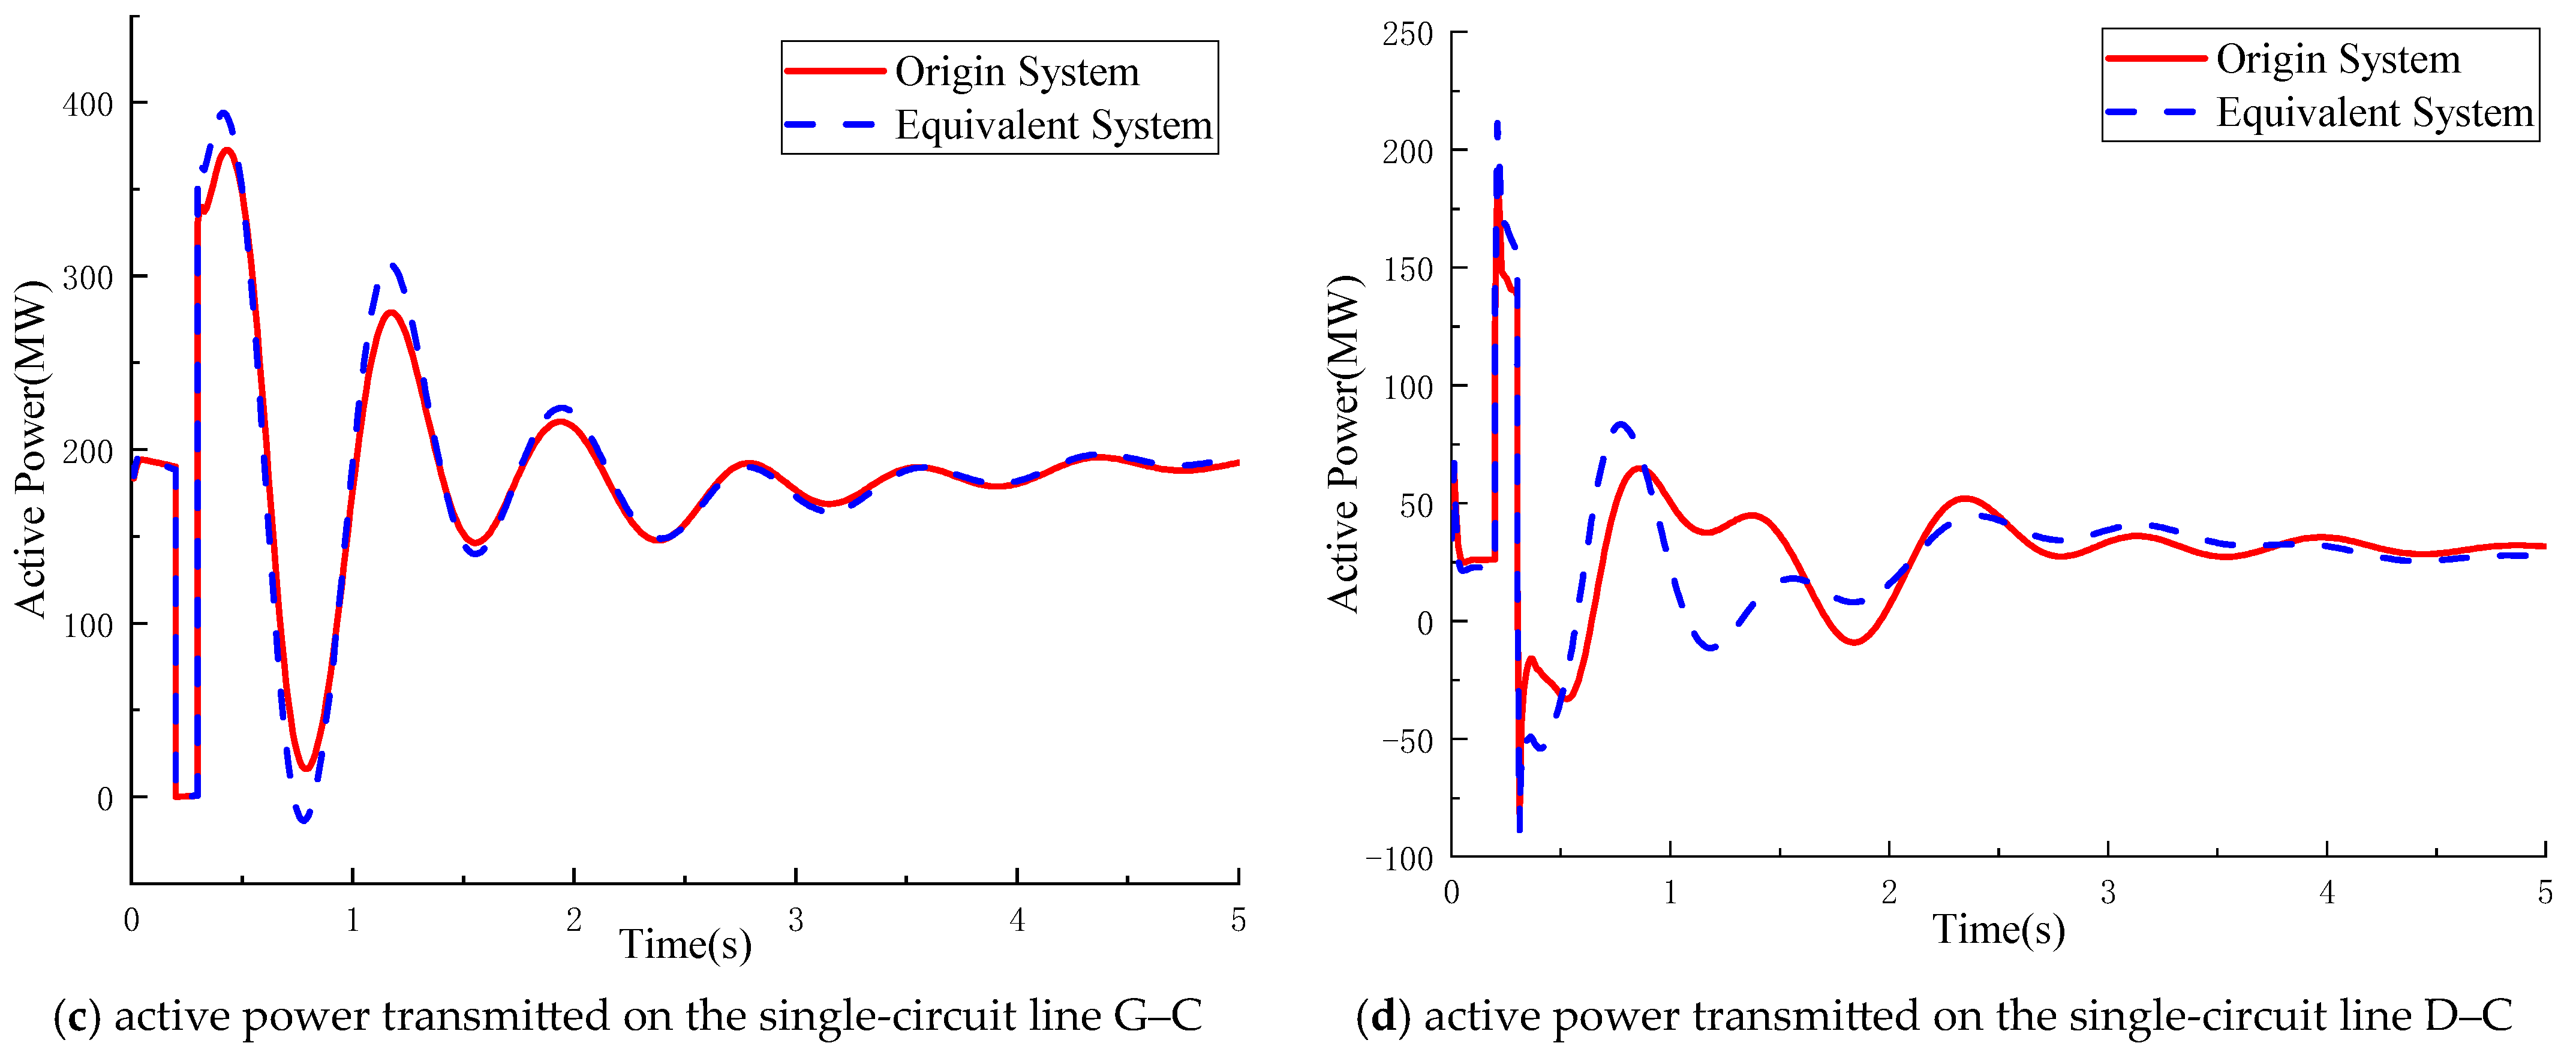
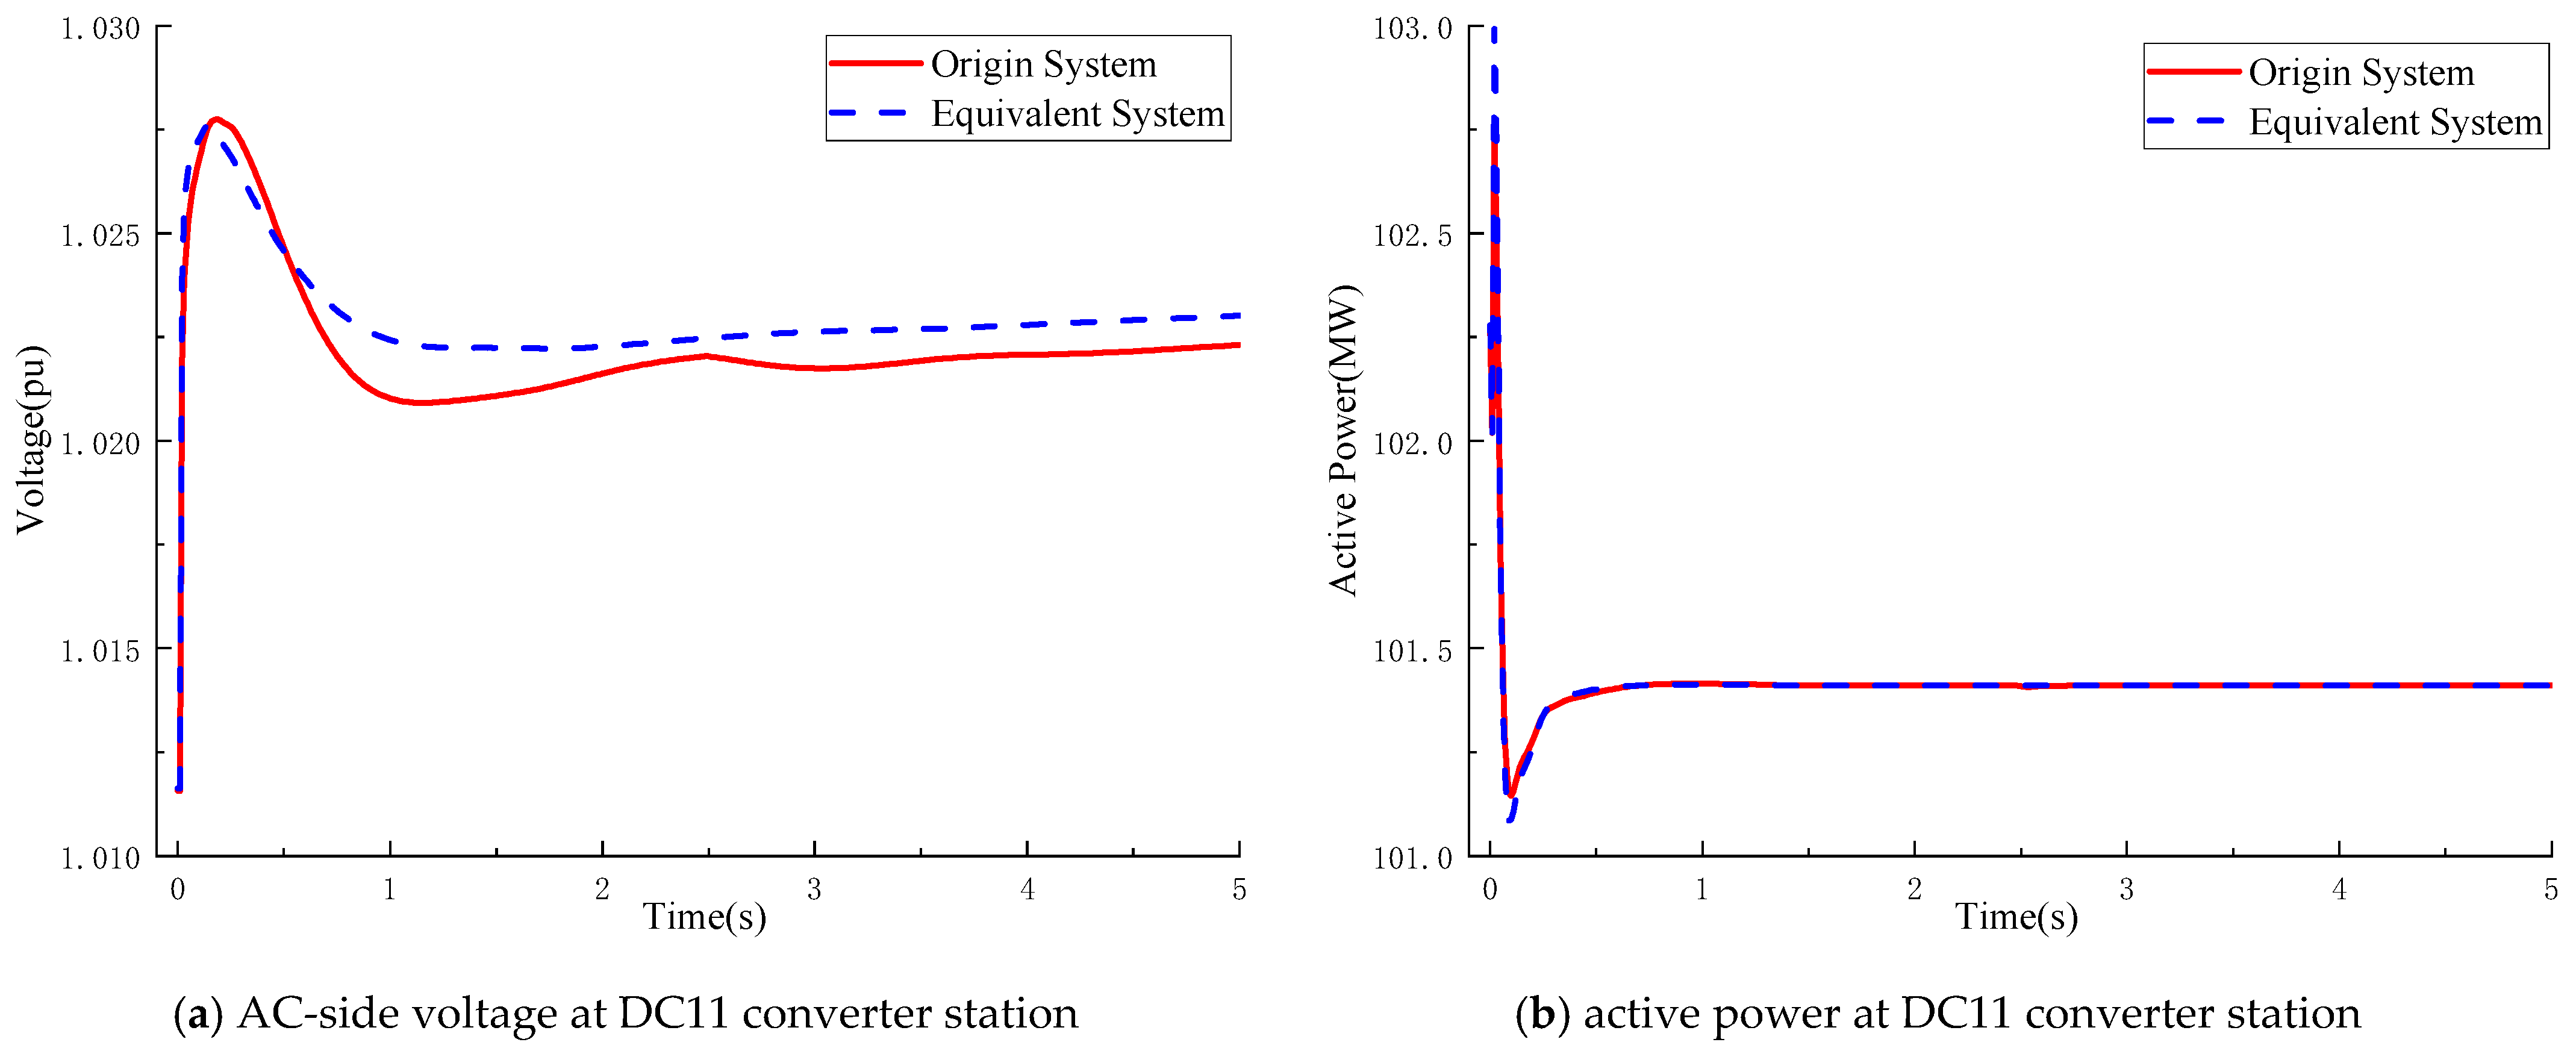
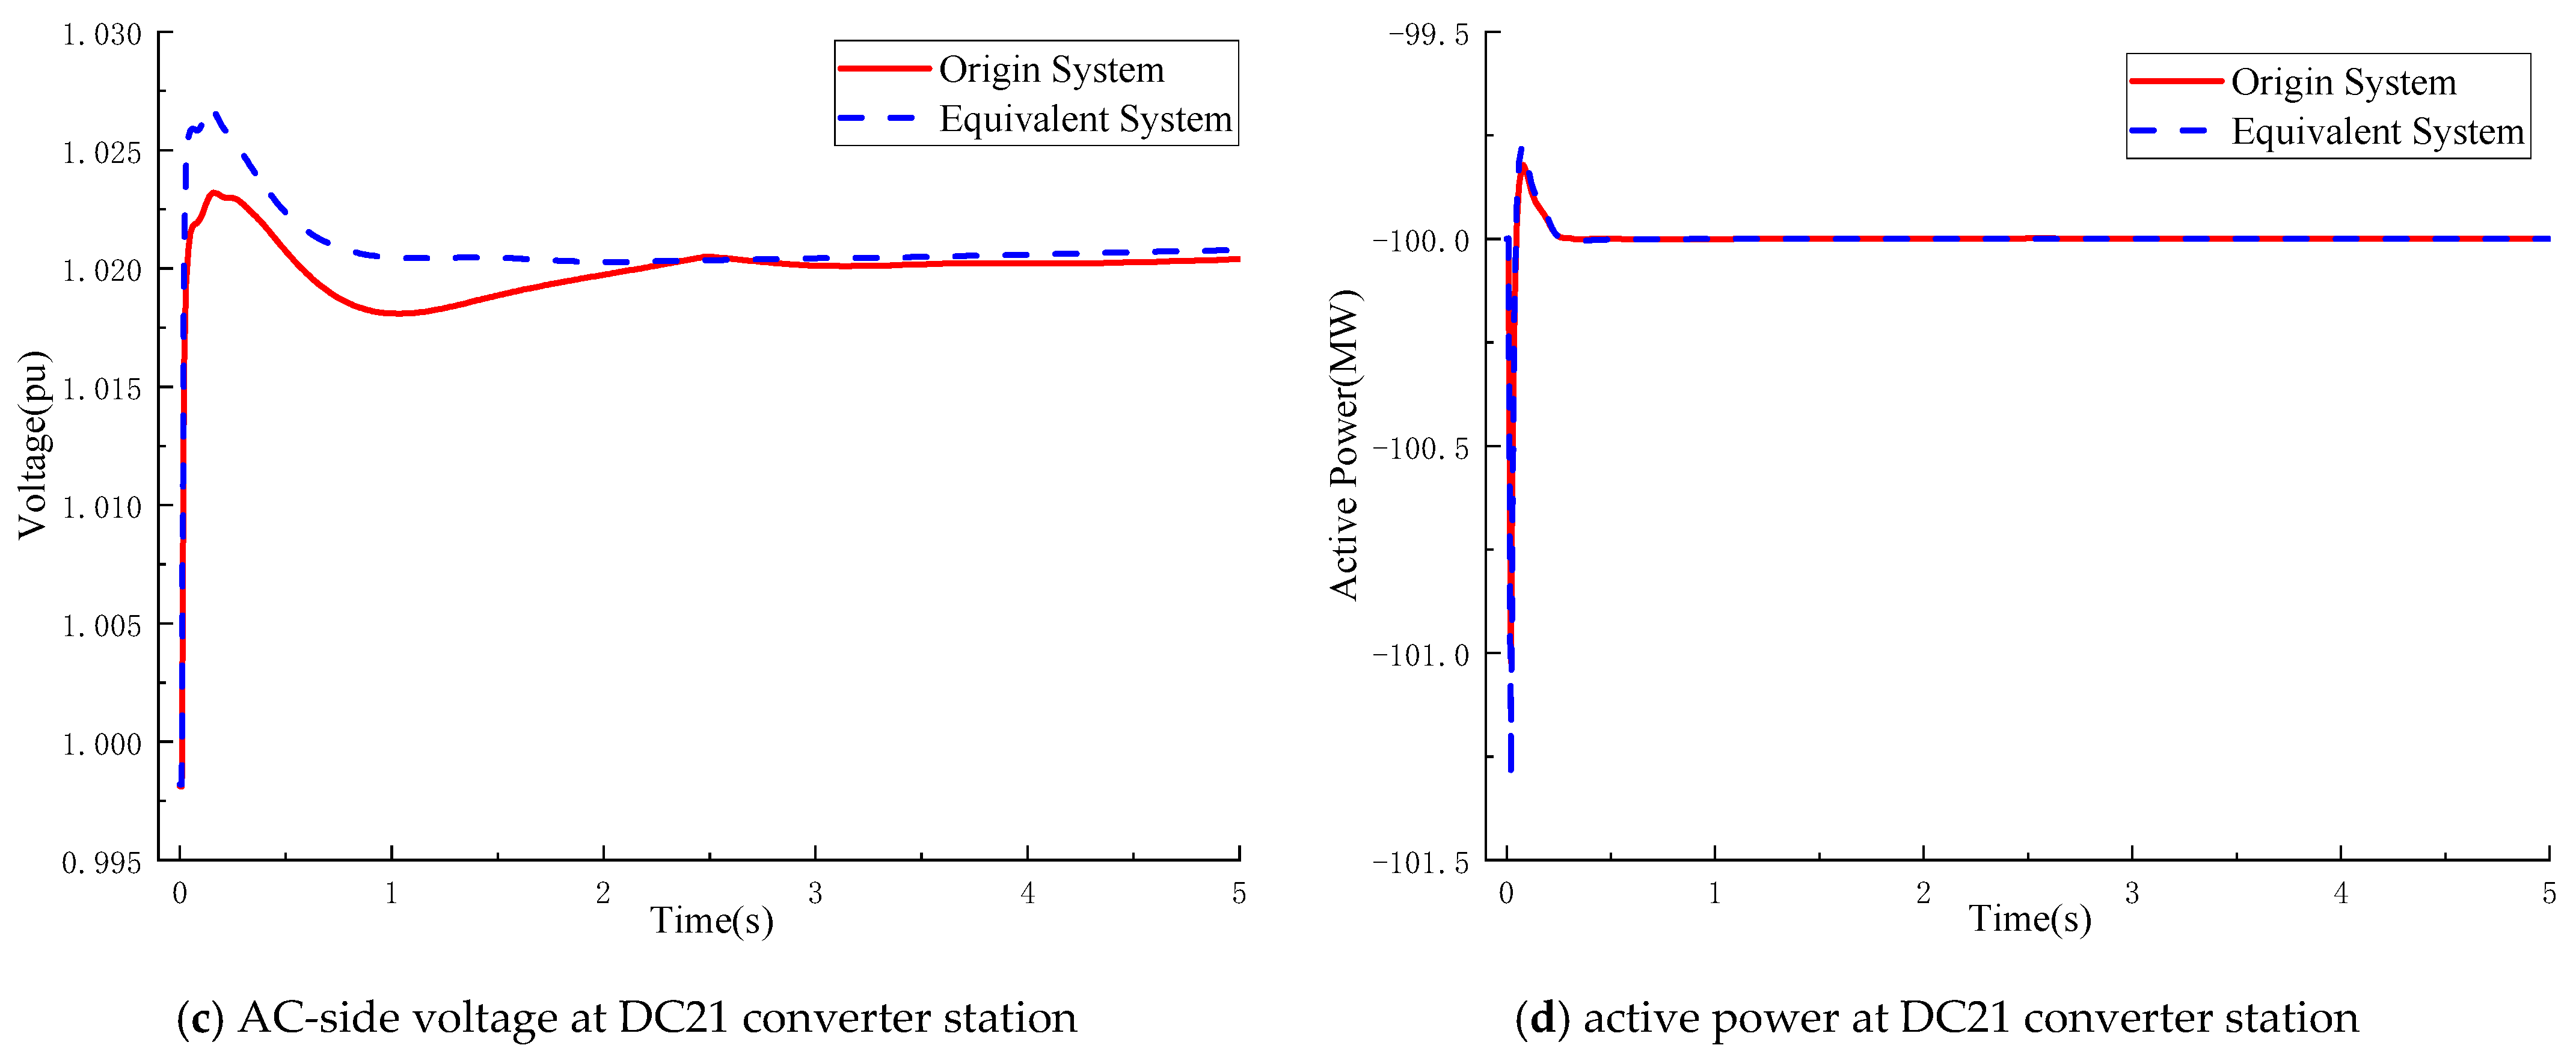
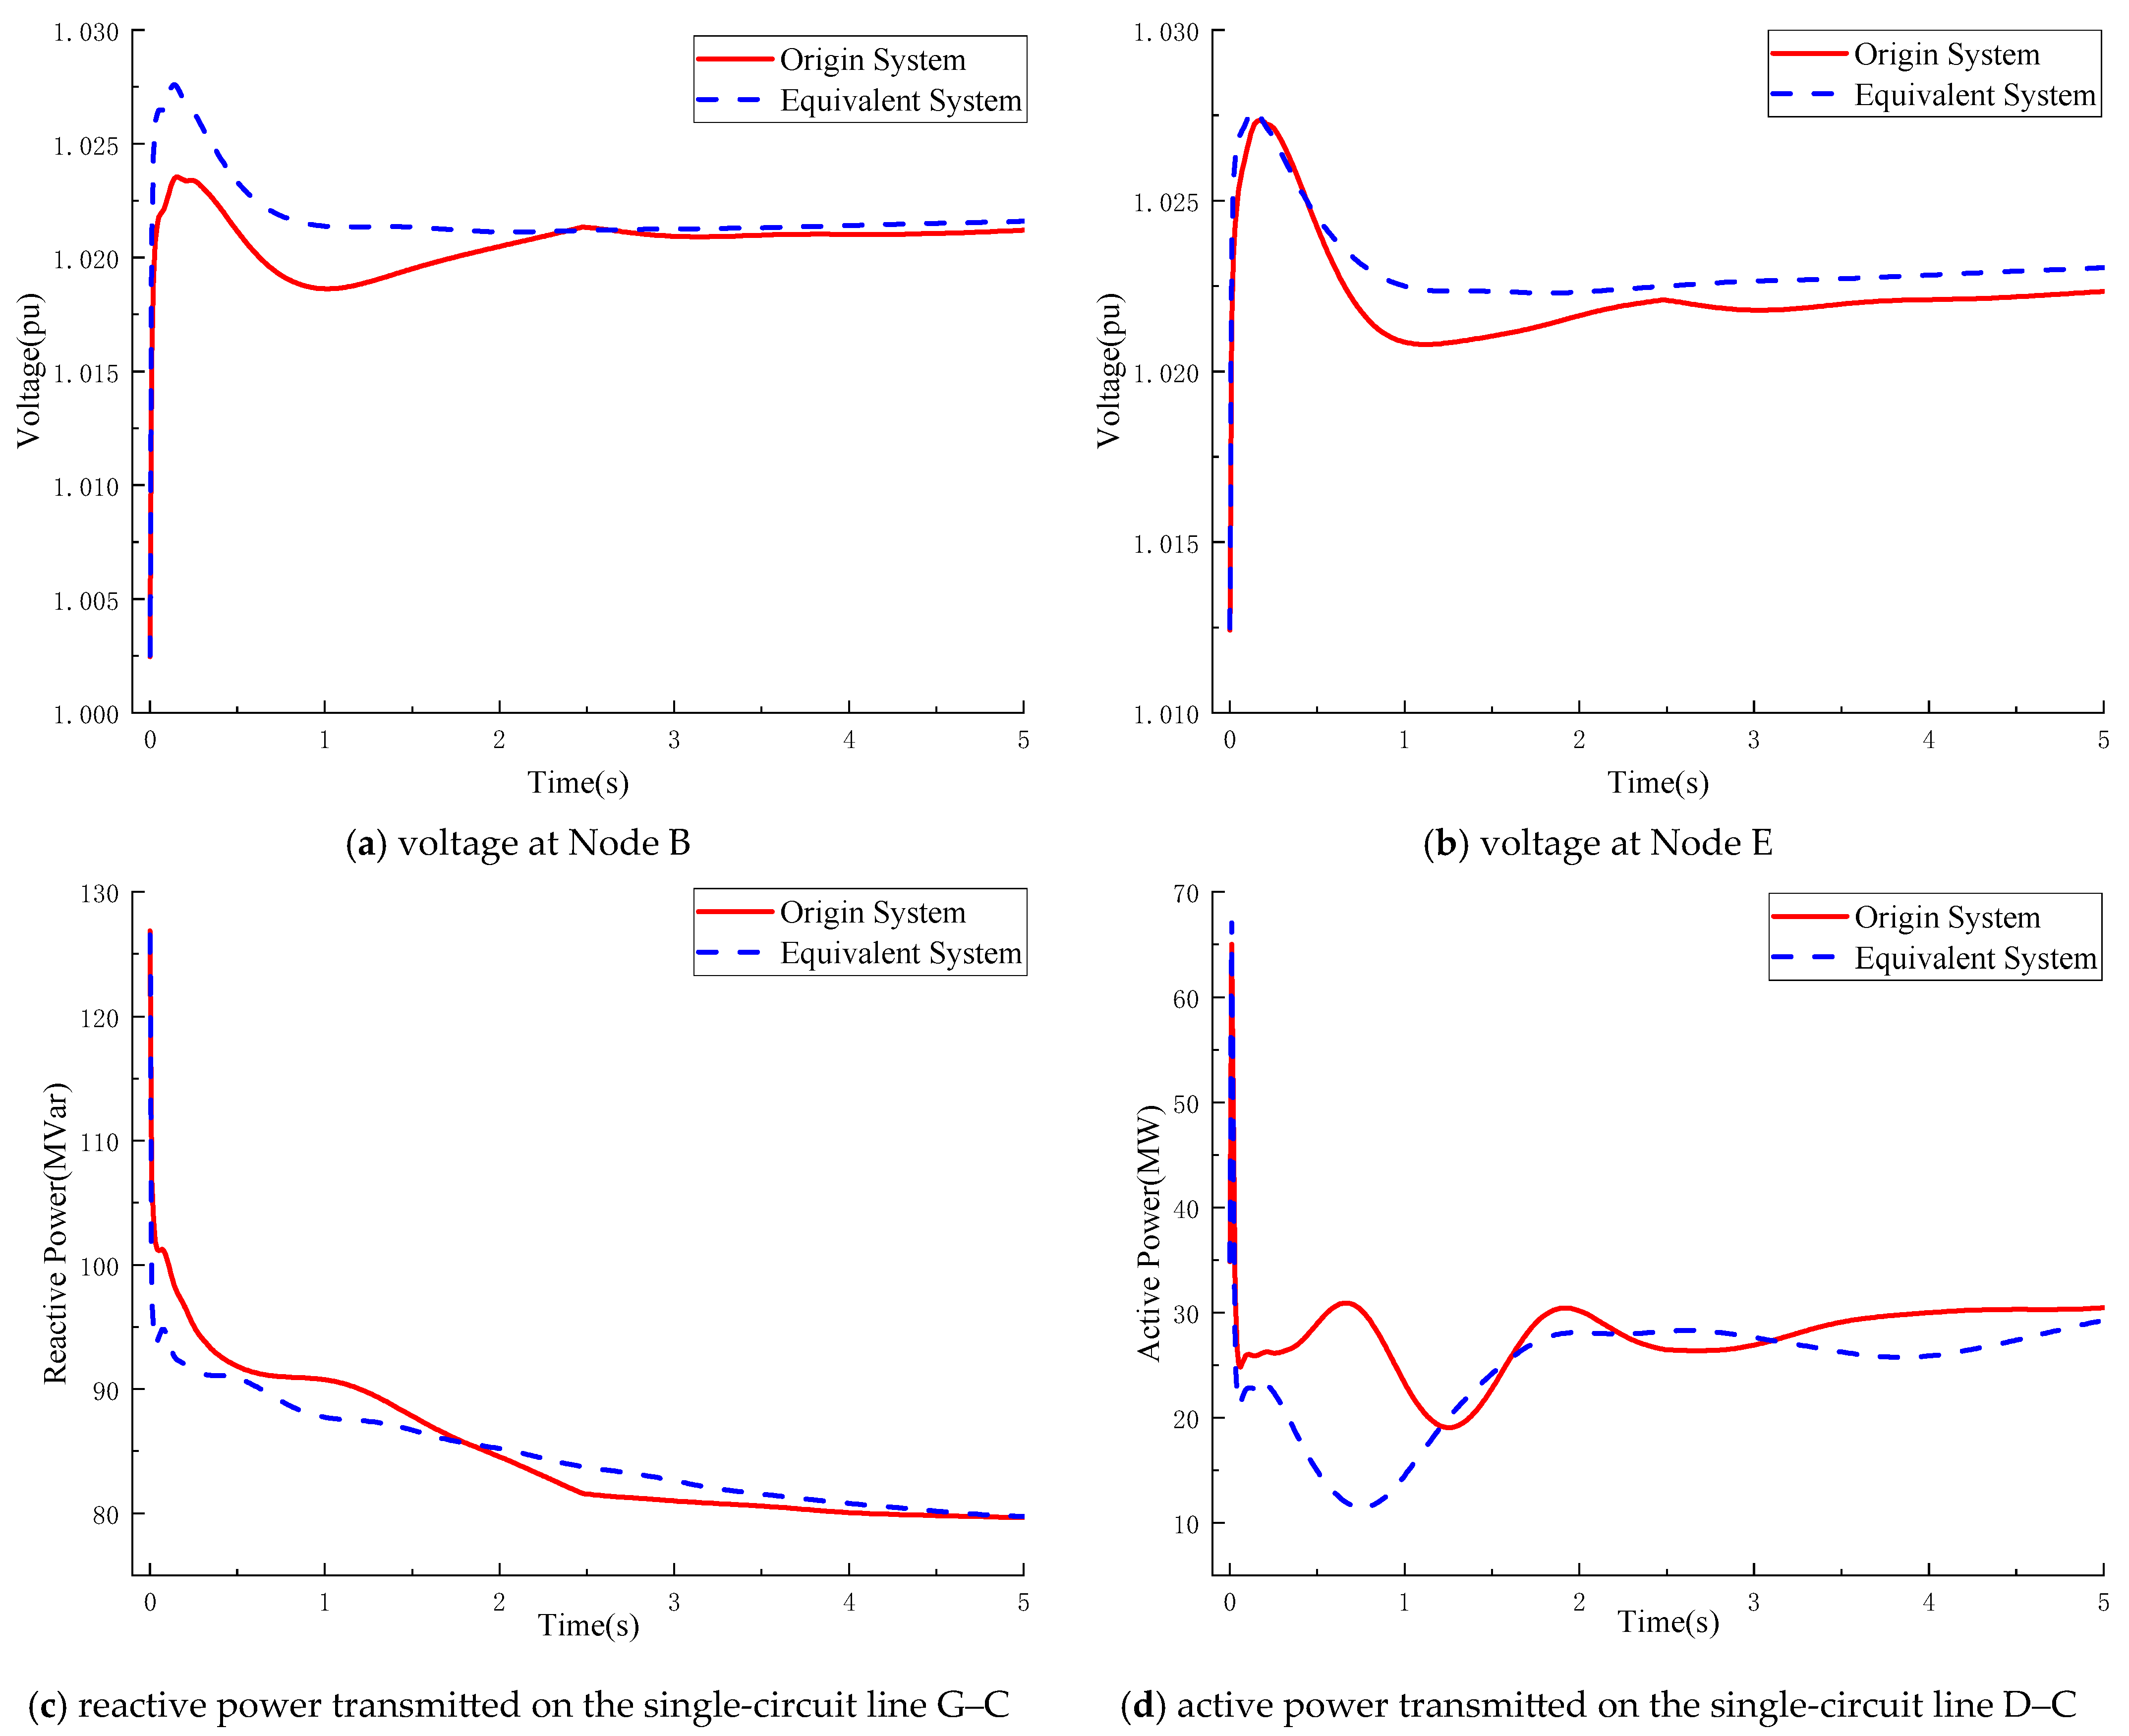
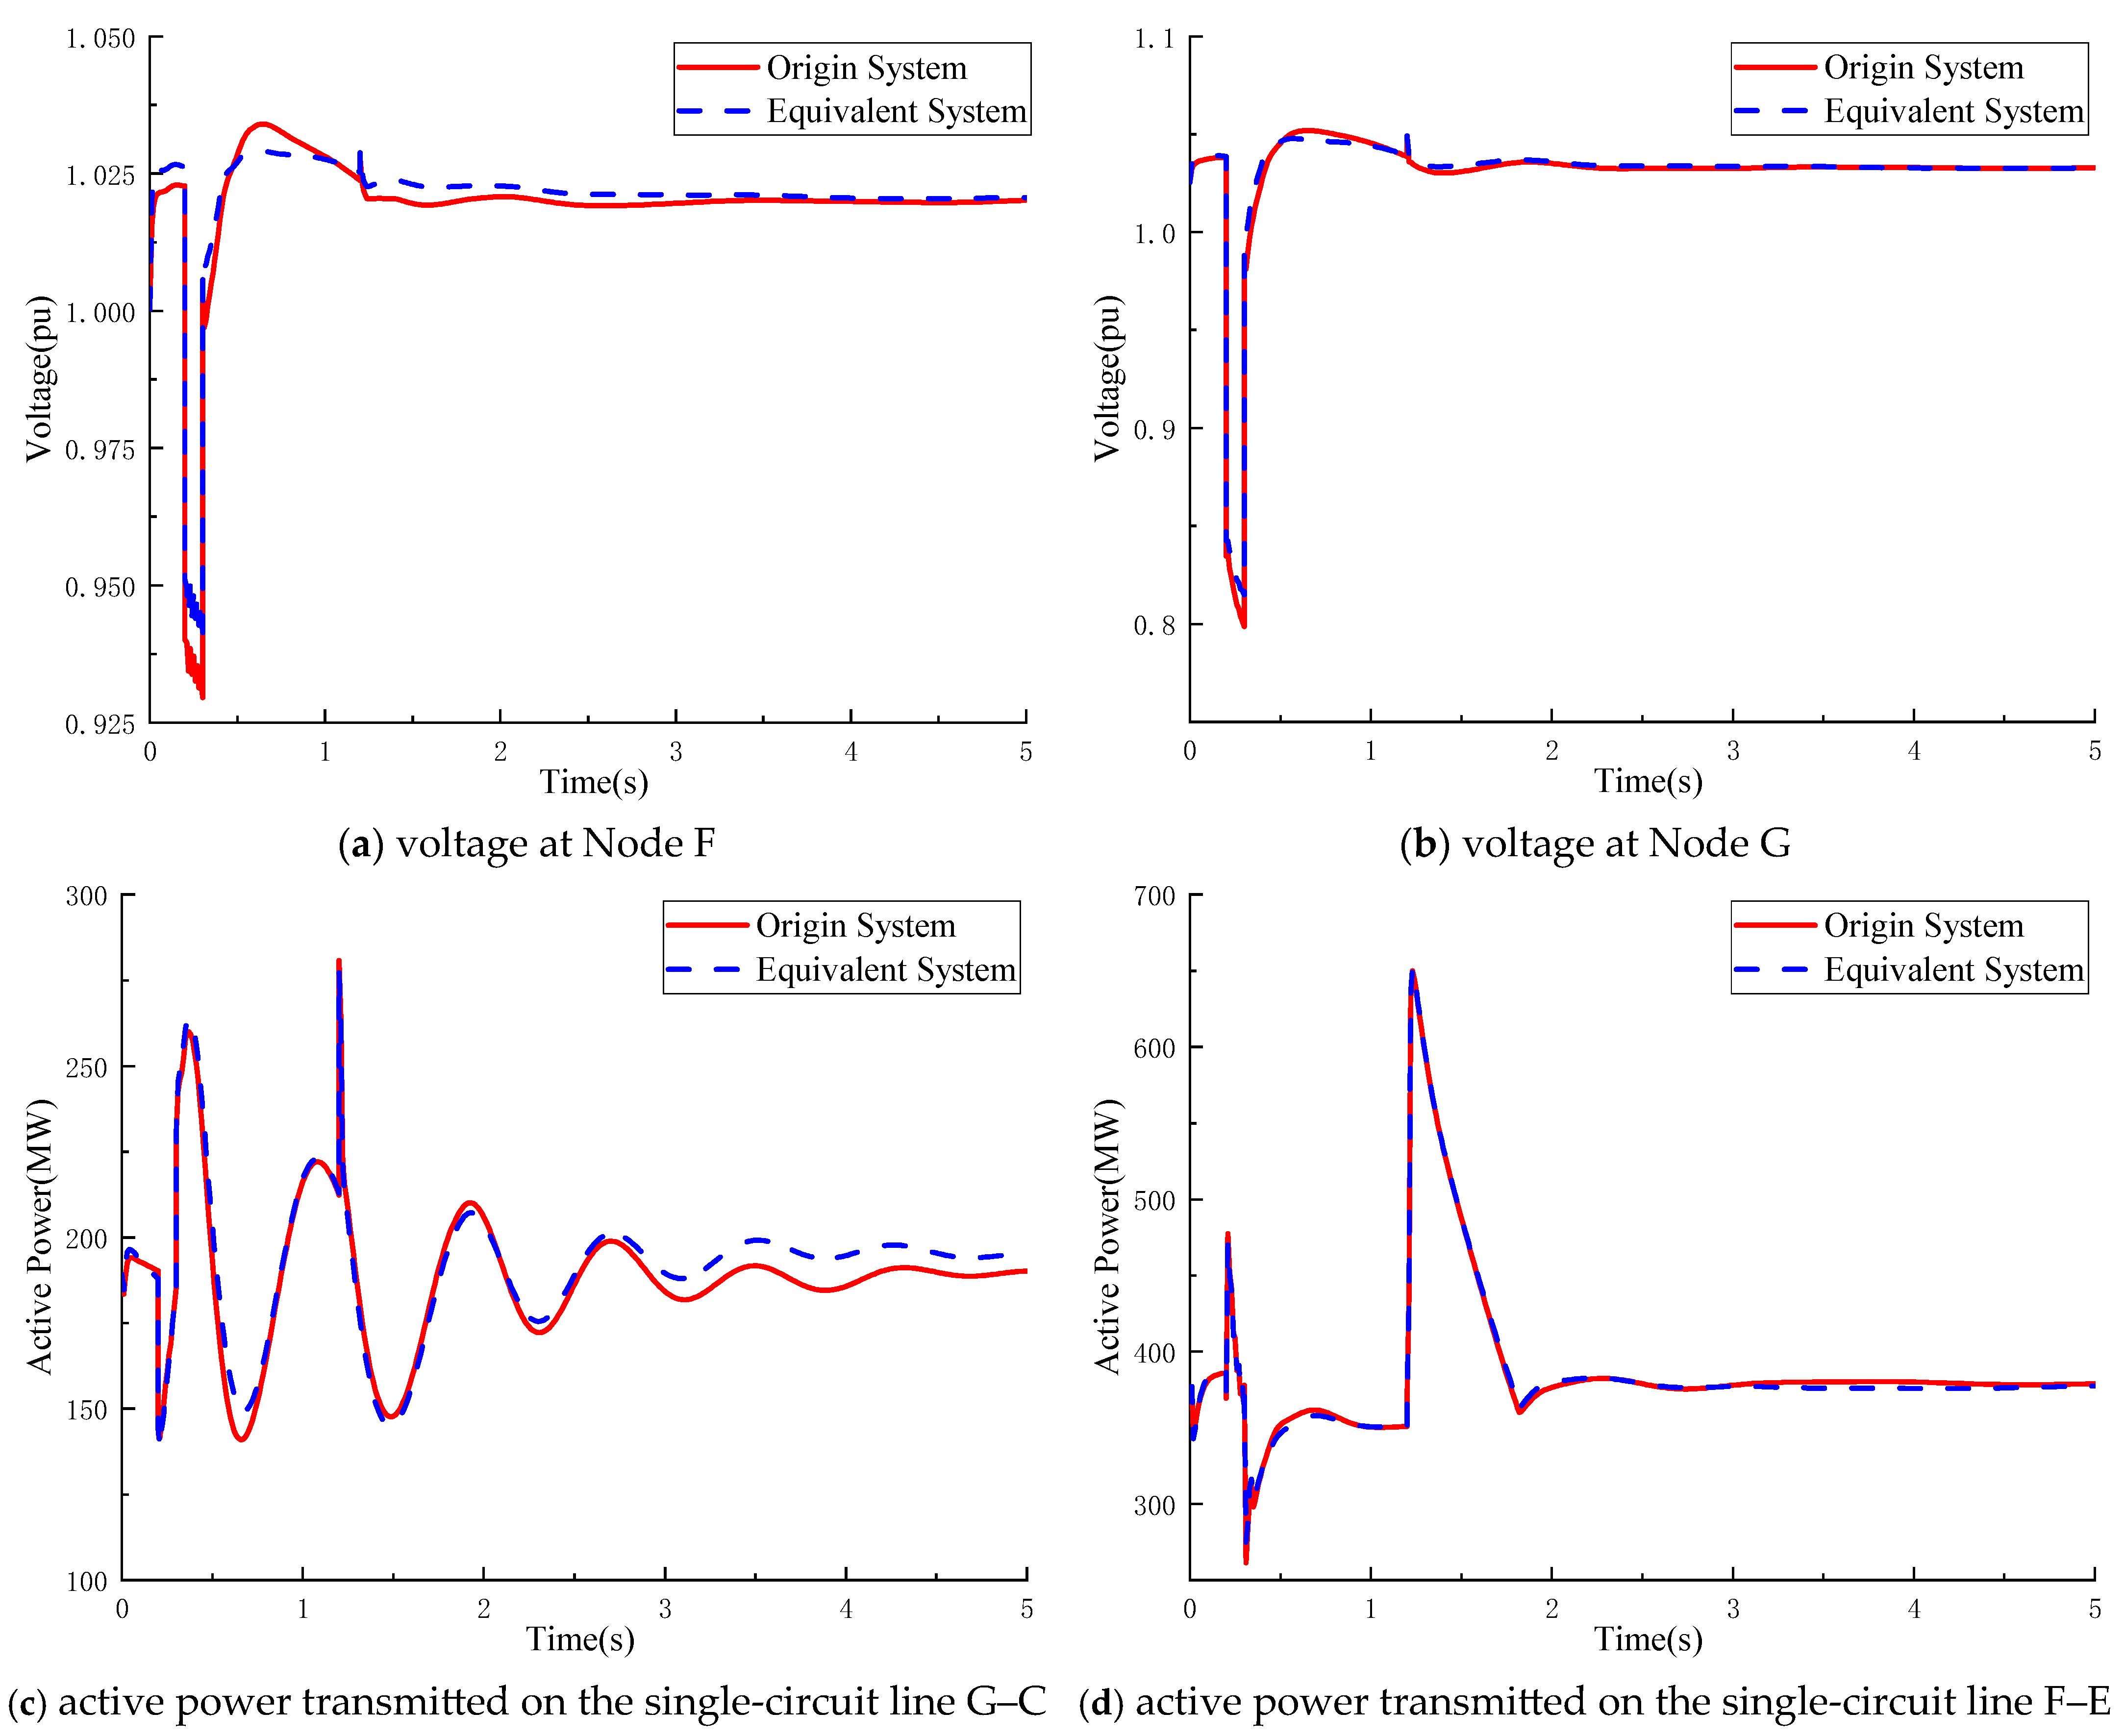
A balanced three-phase short-circuit fault is applied at Node G at t = 0.2 s and cleared after 0.1 s. Representative simulation results are presented in
Figure 10 and
Figure 11.
As illustrated in
Figure 10, the DC subsystem retained by the proposed method accurately reproduces the active power, DC voltage, DC current, and AC-side voltage responses of the original full-order system.
Figure 11 further demonstrates that, under the same fault condition, the transient evolutions of both remote and local node voltages and the active power flows of the key transmission lines closely match those of the original system, thereby confirming the transient consistency of the developed equivalence scheme.
4.4.2. Scenario 2
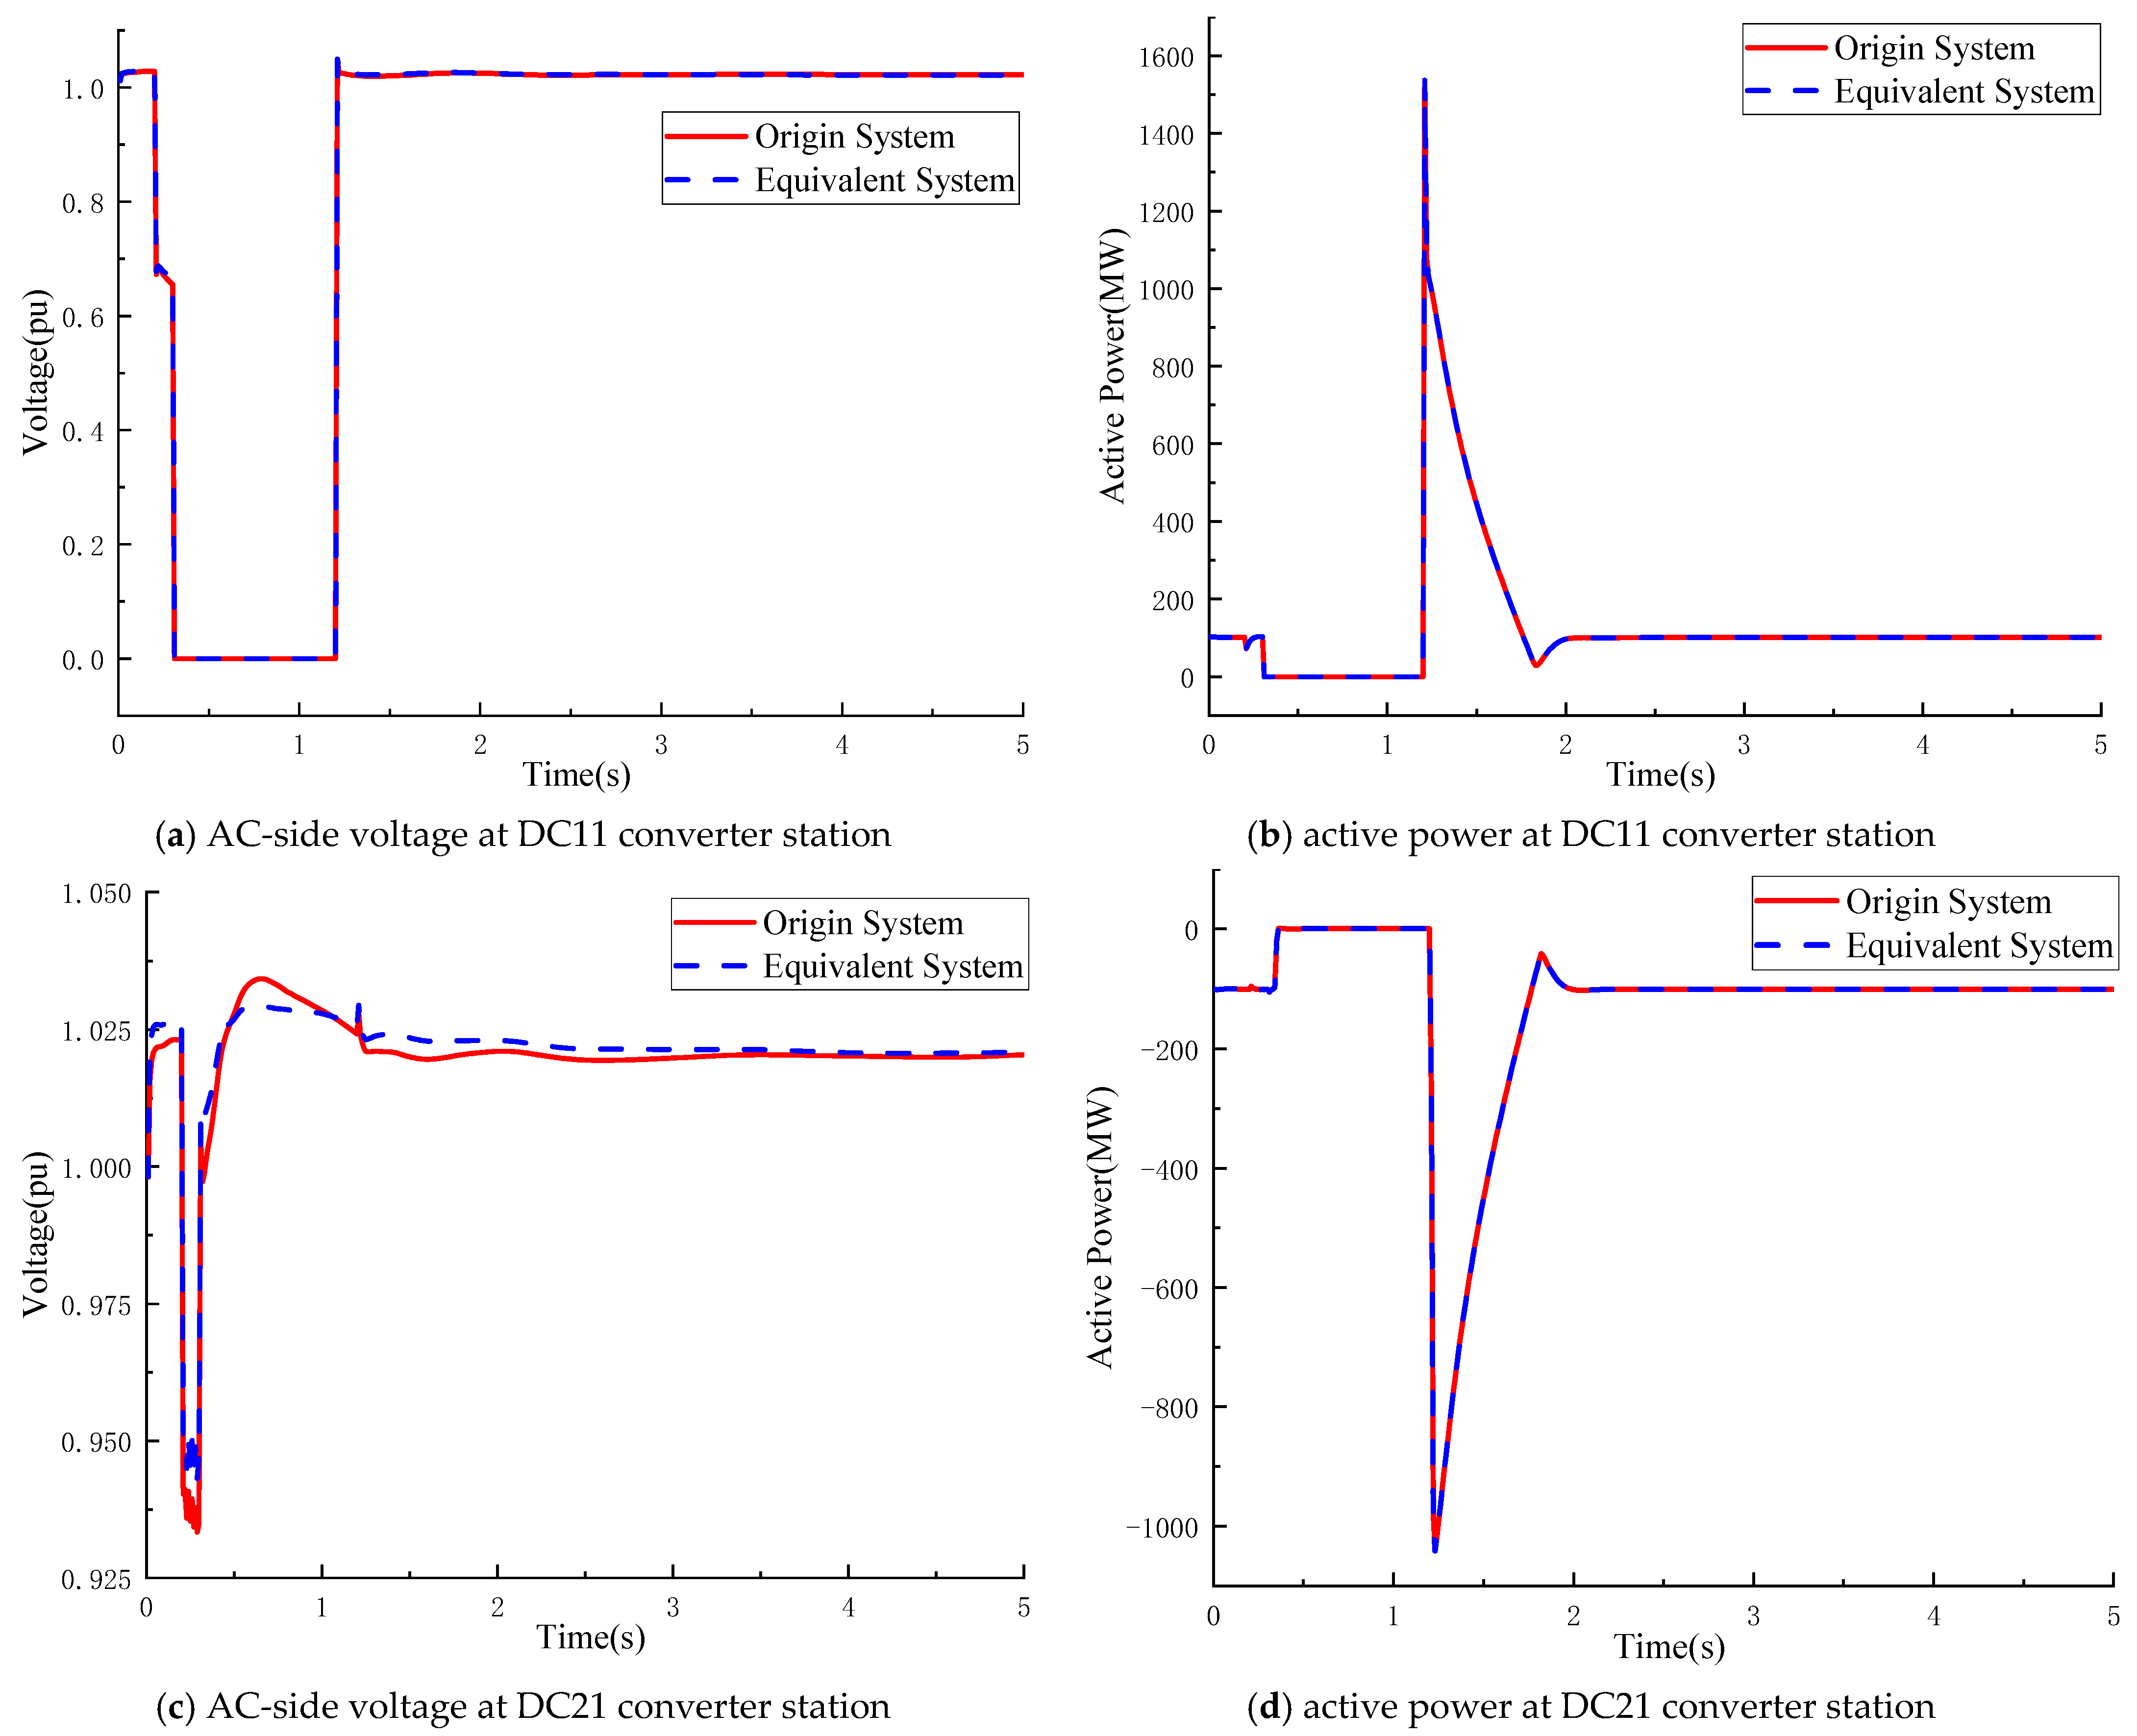
A monopole-blocking fault is imposed to DC11–DC21 at t = 0.2 s. The corresponding transient responses of the HVDC and AC systems are depicted in
Figure 12 and
Figure 13, respectively.
Scenario 2 considers a DC-side fault within the regional power grid. As shown in
Figure 12, the voltages and DC power flows of the MMC-HVDC closely match those of the original system.
Figure 13 further reveals that the nodal voltages and active power flows of the AC subsystem also track the original responses. These results collectively verify the excellent agreement between the equivalent and original systems in their transient behavior.
4.4.3. Scenario 3
A single-phase short-circuit fault occurs at Node A at 0.2 s. The fault lasts for 0.1 s, and then the fault phase is disconnected. Reclosing is carried out 1s after the disconnection. Representative simulation results are presented in
Figure 14 and
Figure 15, respectively.
Scenario 3 simulates the recovery process after an unbalanced fault occurs at a node within the regional power grid. As shown in
Figure 14, under this disturbance, the variation trends of the AC voltage and power waveform at the converter bus of the VSC-HVDC closely match those of the original system.
Figure 15 further reveals that the variation trends of the nodal voltages and line active power in the AC system also match those of the original system. These results collectively verify the excellent consistency in transient characteristics between the original system and equivalent system under unbalanced faults.


