Article

Research on the Optimal Economic Proportion of Medium- and Long-Term Contracts and Spot Trading Under the Market-Oriented Renewable Energy Context

by
Yushi Wu
1,
Xia Zhao
1,
Libin Yang
1,
Mengting Wu
2,* and
Hongwei Yu
3
1
Central China Branch of State Grid Corporation of China, Wuhan 430070, China
2
Institute of Quality Development Strategy, Wuhan University, Wuhan 430072, China
3
Institute for Carbon Neutrality, Wuhan University, Wuhan 430072, China
*
Author to whom correspondence should be addressed.
Energies 2025, 18(23), 6085; https://doi.org/10.3390/en18236085
Submission received: 21 September 2025 / Revised: 20 October 2025 / Accepted: 28 October 2025 / Published: 21 November 2025

Abstract

Against the backdrop of the full market integration of renewable energy, determining a reasonable proportion between medium- and long-term (MLT) contracts and spot trading has become a core issue in power market reform. Current Chinese policy requires that the share of MLT contracts should not be less than 90%, which helps ensure system security but may suppress the price discovery function of the spot market and limit renewable energy integration. This paper constructs a three-layer model: the first layer describes spot market clearing through Direct Current Optimal Power Flow (DC-OPF), yielding system energy prices and nodal prices; the second layer models bilateral contract decisions between generators and users based on Nash bargaining, incorporating risk preferences via a mean–variance framework; and the third layer introduces two evaluation indicators—contract penetration rate and economic proportion—and applies outer-layer optimization to search for the optimal contract ratio. Parameters are calibrated using coal prices, wind speed, solar irradiance, and load data, with numerical solutions obtained through Monte Carlo simulation and convex optimization. Results show that increasing the share of spot trading enhances overall system efficiency, primarily because renewable energy has low marginal costs and high supply potential, thereby reducing average market prices and mitigating volatility. Simulations indicate that the optimal contract coverage rate may exceed the current policy lower bound, which would expand spot market space and promote renewable energy integration. Sensitivity analysis further reveals that fuel price fluctuations, renewable output, load structure, and risk preferences all affect the optimal proportion, though the overall conclusions remain robust. Policy implications suggest moderately relaxing the constraints on MLT contract proportions, improving contract design, and combining this with transmission expansion and demand response, in order to establish a more efficient and flexible market structure.

1. Introduction

Driven by the global energy transition and carbon neutrality targets, electricity markets have become a key mechanism for promoting renewable energy integration and improving the efficiency of resource allocation [1,2]. Market-based approaches to renewable energy integration not only provide a more accurate reflection of the marginal cost structure of power systems but also enhance renewable energy utilization through competition [3]. Globally, countries and regions such as Europe and the United States have generally established market systems where MLT contracts and spot trading coexist [4]. In such systems, MLT contracts are primarily used to secure future supply-demand balance and price expectations, while spot trading serves to match supply and demand in real time and to discover electricity prices. Within this framework, determining a reasonable proportion between MLT and spot trading is essential to ensure secure system operation and improve market efficiency [5,6].
In recent years, China has made significant progress in promoting the marketization of renewable energy. Notably, in 2024, the National Development and Reform Commission (NDRC) and the National Energy Administration (NEA) jointly issued the Notice on Deepening the Market-Oriented Reform of Renewable Energy Grid Prices to Promote High-Quality Development of Renewable Energy (Document No. 136 [2025]). This policy explicitly requires that renewable energy fully participate in electricity markets. Its implementation implies that an increasing share of wind and solar power will directly engage in spot market trading, thereby reshaping the current transaction structure dominated by MLT contracts. However, under China’s existing institutional arrangements, the government has long adhered to the principle of “MLT as the mainstay and spot as a supplement,” requiring that the annual proportion of MLT transactions in each province must not fall below 90% in order to safeguard system security and market stability. While this framework was reasonable when the share of renewable energy was relatively low, in the context of large-scale renewable integration and profound changes in the supply-demand structure of the power system, such high MLT share requirements may restrict the role of the spot market in price discovery and renewable energy absorption, thereby leading to efficiency losses [7].
Regarding the relationship between MLT contracts and spot trading, both domestic and international academia and policy communities have produced a rich body of research. Broadly speaking, these studies can be categorized into four main areas.
First, from the perspective of market equilibrium and price formation mechanisms, a large number of studies have analyzed the role of MLT contracts in stabilizing spot market price fluctuations [8,9,10]. Existing research generally argues that MLT contracts provide price guarantees for both generators and consumers, reducing the revenue uncertainty caused by extreme spot price volatility and thus limiting opportunities for market manipulation [11,12]. For example, empirical evidence from mature electricity markets in Europe and the United States shows that when the coverage of long-term contracts is relatively high, spot price volatility is significantly reduced and market equilibrium becomes more stable [13]. However, some studies also caution that an excessively high share of MLT contracts may weaken the price discovery function of the spot market, reduce the participation incentives for flexible resources (such as storage and demand response), and thereby generate new efficiency losses under high renewable penetration [14,15].
Second, from the perspective of power system security and investment incentives, existing research highlights the critical role of MLT contracts in ensuring system reliability and promoting generator investment [16,17,18]. Long-term contracts not only help conventional power plants secure stable cash flows and lower financing costs, but also serve as a primary mechanism to drive new capacity investment in developing countries where capacity markets remain underdeveloped [19,20]. Some studies further suggest that MLT contracts can partially substitute for capacity market functions, ensuring sufficient reserve capacity in the face of renewable output uncertainty [21]. Nonetheless, most existing work has focused on their “security-oriented” function, while offering limited quantitative discussion on how the share of MLT contracts should be dynamically adjusted to balance both security and economic efficiency [22].
Third, from the perspective of policy instruments and institutional design, re-searchers have examined the role of Contracts for Difference (CfDs), capacity remuneration mechanisms, and green certificate schemes in facilitating renewable energy integration and improving market efficiency [23,24,25]. For instance, in the UK and Nordic markets, CfDs have proven effective in reducing investment risks for renewables and promoting grid integration, while green certificates and quota systems increase the market value of renewable electricity and guide consumption structure optimization [26]. In the Chinese context, some scholars have studied the coupling mechanisms between green certificates, carbon markets, and MLT contracts, suggesting that these policy tools can help enhance renewable energy integration [27]. However, the existing literature is often fragmented, focusing on isolated aspects without providing a com-prehensive framework that captures the interactions among different policy tools, trading forms, and the spot market [28].
Fourth, from the perspective of uncertainty modeling and stochastic optimization, recent research increasingly emphasizes that in electricity markets with high renewable energy penetration, it is essential to establish analytical frameworks capable of characterizing multi-source uncertainties, simultaneously reflecting fuel price volatility, renewable generation intermittency, and load fluctuations [29,30,31]. Traditional deterministic or mean–variance models often underestimate the effects of extreme events and tail risks on market structure and contract proportions [32,33]. To address this issue, scholars have developed a variety of optimization approaches—such as stochastic programming, robust optimization, and distributionally robust optimization—to better handle uncertainties at different levels [34,35,36,37]. Among them, stochastic programming evaluates the expected benefits of contract decisions across probabilistic scenarios [38,39], robust optimization focuses on ensuring decision robustness under worst-case realizations [40], and distributionally robust optimization introduces ambiguity sets to mitigate model misspecification risks [41]. These methods provide powerful tools for analyzing the influence of uncertainty on the balance between MLT contracts and spot trading. Embedding these optimization approaches into multi-layer market models can thus help systematically capture the optimal contract proportion and its dynamic impacts on market efficiency and renewable energy integration under deep uncertainty.
Despite these valuable contributions, several distinct research gaps remain.
(1)
Most existing studies treat the proportion between MLT contracts and spot trading as an exogenously fixed policy parameter, lacking a systematic and quantitative analysis of its optimal endogenous level under different market conditions.
(2)
The modeling of key uncertainties—such as renewable generation, fuel prices, and load fluctuations—is often oversimplified, relying on deterministic or constant-volatility assumptions that fail to reflect the effects of extreme events and sudden shocks on contract structures.
(3)
Comparative analyses of different contract forms, such as financial Contracts for Difference (CfDs) and physical delivery contracts, remain limited, leaving unclear their relative advantages, efficiency, and suitability in high-renewable electricity markets.
(4)
Few studies incorporate advanced uncertainty-optimization perspectives, including stochastic, robust, or distributionally robust optimization, into electricity market modeling, leading to an incomplete understanding of how deep uncertainty and risk aversion jointly influence the optimal balance between MLT and spot trading.
Therefore, the existing literature has yet to address a fundamental question: under conditions of full marketization of renewable energy and heightened uncertainty, what is the optimal proportion of MLT contracts and spot trading? What are the key deter-minants? And how do different contract designs affect market efficiency and renewable energy integration?
To address the above research gaps, this paper proposes a three-layer modeling framework. The first layer characterizes the spot market clearing process using DC-OPF, yielding electricity prices and generator dis-patch. The second layer models bilateral MLT contract decisions between generators and consumers based on Nash bargaining, incorporating mean–variance utility and risk aversion. The third layer introduces two indica-tors—“volume proportion” (contract penetration rate) and “economic proportion” (effective contract penetration rate)—and employs a dual maximization (max–max) structure to search for the optimal coverage of MLT contracts. By fitting key uncertainties such as coal prices, wind speed, solar irradiance, and multi-node power load using time-series data and Monte Carlo simulation, the proposed framework dynamically solves the three-layer model under stochastic environments. The main findings indicate that moderately increasing the share of spot market trading improves system efficiency. This is primarily because renewable energy accounts for a higher share of spot market output, featuring lower marginal costs and thus significantly reducing total generation costs. Moreover, relaxing the “90% MLT contract ratio” policy constraint proves feasible and has a positive effect on renewable energy integration. These results provide quantitative evidence to support future electricity market design and renewable energy policies.
The remainder of this paper is structured as follows: Section 2 presents the three-layer model framework, describing in turn the spot market clearing mechanism, the MLT contract bargaining model, and the dual optimization problem of the optimal economic proportion. Section 3 details the data simulation and algorithmic implementation. Section 4 conducts sensitivity analysis to examine the impacts of coal price fluctuations, average wind and solar output, load peak-valley differences, transmission constraints, and risk aversion parameters on the optimal contract ratio and stakeholder utilities. Section 5 concludes the study and discusses policy implications and future research directions.

2. The Model

To systematically characterize the interaction mechanism between MLT trading and spot trading under the market-oriented integration of renewable energy, this paper establishes a three-layer modeling framework. The first layer is the electricity spot market clearing mechanism. The Independent System Operator (ISO) determines generator dispatch and nodal prices through a cost-minimizing DC-OPF model, which incorporates physical constraints such as load balance, transmission line flows, and capacity limits. Unified energy prices and nodal marginal prices are obtained through Lagrangian duality. The second layer models MLT trading. In each period, generators and consumers engage in Nash bargaining to determine bilateral contract quantities and contract prices. Contracts can take the form of financial CfDs or physical delivery agreements. This layer not only accounts for the sharing of spot market revenues through contracts but also explicitly introduces risk aversion parameters. Using a mean–variance approach, it captures different stakeholders’ preferences for mitigating price volatility. The third layer focuses on the optimal economic proportion between MLT and spot trading. By introducing two indicators—“volume proportion” (contract penetration rate) and “economic proportion” (effective contract penetration rate)—this layer jointly evaluates both the scale and quality of contracting. These indicators are embedded into a dual maximization problem: the outer layer controls the overall coverage of MLT contracts, while the inner layer optimizes contract allocation and pricing through bargaining. The result is an optimal proportion that simultaneously stabilizes prices and enhances economic efficiency.

2.1. Spot Market Clearing Mechanism

In each settlement period t T , the spot market of the power system is cleared by the ISO. The fundamental objective of dispatch is to minimize the total generation cost while satisfying the physical constraints of the power grid and meeting load demand. Different from welfare-maximization models, this study adopts a cost-minimizing DC-OPF model, which better reflects the actual dispatch logic in China’s electricity market that is based on the supply-side generation cost.

2.1.1. Cost Function and Generator Classification

The set of generators is divided into two groups: conventional generators G 1 and renewable generators G 2 . For a conventional generator i G 1 , the bid cost function is usually expressed in a linear marginal form, where the marginal cost is a i t + b i t q i t . The total bid cost is
C i t q i t = a i t q i t + 1 2 b i t q i t 2
For a renewable generator i G 2 , the operating marginal cost is approximately zero, because renewable units such as wind and solar require no fuel input and only incur minimal variable operation and maintenance expenses. Therefore, their supply curve remains flat at nearly zero cost until they reach the available capacity limit, which is determined by stochastic weather conditions (wind speed, irradiance, temperature, etc.).
Formally, the feasible generation of unit i satisfies 0 q i t q ¯ i t R E S , where q i t R E S represents the stochastic upper bound of available capacity. Once this bound is reached, further output becomes infeasible, implying an effectively infinite marginal cost beyond q i t R E S . Hence, in dispatch optimization, renewable generators are scheduled at (or close to) zero marginal cost up to their stochastic availability limit [42,43].

2.1.2. Physical Constraints

The system consists of a set of buses B and transmission lines L . Decision variables include generator output q i t , bus voltage angles θ b t , and line flows f l t . The following constraints must be satisfied:
Nodal power balance:
i : b i = b q i t d b t = l L A l b f l t ,   b B
where d b t is the demand at node b , and A l b is the element of the incidence matrix: A l b = +1 if bus b is the sending end of line l ; A l b = −1 if receiving end; A l b = 0 otherwise.
DC power flow equation:
f l t = B l θ o l t θ r l t
where o l ,   r l are the sending and receiving buses of line l .
Line capacity limits:
F ¯ l f l t F ¯ l
Generator output bounds:
q _ i t q i t q ¯ i t

2.1.3. Clearing Model

Thus, the objective function of the spot market cost-minimization problem is
min q , θ , f   i G 1 a i t q i t + 1 2 b i t q i t 2

2.1.4. Price Formation Mechanism

From the Lagrangian dual and KKT conditions:
The dual variable λ t of system-wide energy balance is interpreted as the uniform energy price:
λ t = b B d b t i G 2 q ¯ i t R E S + i G 1 a i t b i t 1 i G 1 b i t 1
The dual variables μ l t ± associated with line limits reflect the marginal value of congestion. The nodal price (LMP) is given by
π b t = λ t + l L μ l t + μ l t H l b
where H l b is the Power Transfer Distribution Factor (PTDF), representing the incremental flow on line l when 1 MW is injected at node b and withdrawn at the reference bus. Thus, nodal prices consist of the energy price plus congestion price components.
For a conventional generator, the cleared quantity is
q i t = λ t a i t b i t

2.1.5. Stochastic Environment Modeling and Randomization of the Price Process

In the electricity market, spot prices are jointly determined by load demand, renewable output, and the marginal cost of conventional generators. Since all these drivers are uncertain and dynamic, the price process naturally exhibits stochasticity. To better reflect real market conditions, we model these key drivers as jump–diffusion processes. This approach captures both regular fluctuations (diffusion part) and sudden shocks (jump part), such as abrupt weather changes reducing renewable output or sharp fuel price surges [44,45,46,47,48].
Load demand: Influenced by seasonal factors (summer cooling, winter heating), weather (temperature, humidity), and socio-economic activity (weekdays vs. weekends, industrial production). We model load dynamics via a mean-reverting diffusion process:
d d b t = κ D b μ D b t , z t d b t d t + σ D b t d W t D b
where μ D b t , z t is the time- and factor-dependent mean (e.g., temperature, humidity, weekday dummy). The parameter κ D b governs the speed of mean reversion, and σ D b t controls day-to-day volatility. This captures regional correlations in demand through covariance of Brownian motions across nodes.
Renewable generation output: Wind and solar are highly volatile and subject to sudden jumps (e.g., cloud cover, wind shear). We model available renewable capacity with mean reversion and jumps:
d q ¯ i t R E S = κ R i μ R i t q ¯ i t R E S d t + σ R i t d W t R i + d J t R i
where μ R i t reflects seasonal trends in irradiance or wind speed, σ R i t governs normal fluctuations, and J t R i is a compound Poisson jump process capturing sudden transitions (e.g., a 50% drop in PV output due to cloud cover).
Conventional generator bidding uncertainty: The marginal cost function is M C i t = a i t + b i t q i t , where a i t is tied to fuel price levels, and b i t reflects slope (heat rate, flexibility). Since coal and gas prices behave like financial commodities, they exhibit mean reversion with jumps:
d a i t = κ a i a ¯ i a i t d t + σ a i t d W t a i d b i t = κ b i b ¯ i b i t d t + σ b i t d W t b i
where a ¯ i ,   b ¯ i denote long-run trends, σ a i t ,   σ b i t control volatility, and κ a i ,   κ b i determine the speed of mean reversion after shocks.

2.2. Medium- and Long-Term Electricity Trading: A Bilateral Contract Mechanism Based on Nash Bargaining

2.2.1. Trading Structure and Variable Definition

This section examines bilateral contracts between generators and consumers. Let the set of generators be G = G 1 G 2 ( G 1 : conventional generators; G 2 : renewable generators), the set of consumers be U , and the time horizon T = { 1 , , T } (which may represent hours, days, weeks, or months). In each period t , a generator i G and a consumer u U negotiate and sign a bilateral constant-price contract for future electricity delivery. The contract quantity is denoted Q i u , t i G ,   u U ,   t T , while the contract price F i u remains fixed for each pair i u across the contract horizon.
For convenience, we define aggregated quantities:
Total contracted sales of generator i : K i t = u Q i u , t .
Total contracted purchases of consumer u : L u t = i Q i u , t .
Total market contract volume per period: i G K i t = u U L u t = X t .

2.2.2. Payoff Decomposition and Disagreement Point

Let the locational marginal price (LMP) at node b be π b t , where b ( i ) and b ( u ) denote the bus locations of generator i and consumer u . Spot market clearing follows the DC-OPF defined in Section 2.1.
  • Spot Market Payoffs
Generator i ’s spot market profit:
Π i t s p o t = π b ( i ) t q i t C i t q i t
where q i t is the real-time generation output and C i t · the cost function.
Consumer u ’s spot “net utility”:
W u t s p o t = U i t d u t π b ( u ) t d u t
where d u t is actual consumption and U i t d u t = k u t ln 1 + d u t represents consumption utility (it may be treated as constant if only payments are of interest).
2.
Contract Cash Flows
Two common bilateral contract structures are considered:
Financial CfD (reference price λ t ):
Π i t c o n = u F i u λ t Q i u , t
W u t c o n = i λ t F i u Q i u , t
CfDs do not affect physical clearing; settlement depends only on “price difference × contract quantity.” Risk hedging depends on contract volume, while the fixed price F i u redistributes expected returns without directly changing risk exposure.
Physical Delivery Contract (fixed delivery at F i u , deviations settled in the spot market):
Π i t c o n = u F i u Q i u , t + π b ( i ) t q i t u Q i u , t
W u t c o n = i F i u Q i u , t π b ( u ) t d u t i Q i u , t
Here, contracted quantities are settled at F i u , while deviations (excess or shortage) are settled at nodal prices π b t . Unlike CfDs, physical delivery requires network feasibility.
3.
Intertemporal Payoffs with Mean–Variance Risk Adjustment
Discounted cumulative payoffs are adjusted for risk aversion using the mean–variance framework:
Generator payoff:
U i = E t = 1 T β t 1 Π i t s p o t + Π i t c o n γ i 2 t = 1 T V a r Π i t s p o t + Π i t c o n
Consumer payoff:
V u = E t = 1 T β t 1 W u t s p o t + W u t c o n η u 2 t = 1 T V a r W u t s p o t + W u t c o n
where γ i , η u are risk aversion parameters.
4.
Disagreement Point (No-Contract Baseline)
If no contracts are signed, the intertemporal baseline utilities are
U i 0 = E t = 1 T β t 1 Π i t s p o t γ i 2 t = 1 T V a r Π i t s p o t
V u 0 = E t = 1 T β t 1 W u t s p o t η u 2 t = 1 T V a r W u t s p o t
5.
Nash Bargaining Model
The bargaining objective is to maximize joint gains relative to the disagreement point, formulated as a weighted Nash product:
m a x Q i u , t ,   F i u i G U i U i 0 ω i u U V u V u 0 ν u
where ω i , ν u denote bargaining weights.
6.
Constraints
Contract balance (per period):
i G K i t = u U L u t = X t
ensuring that total contracted sales equal total contracted purchases each period, avoiding systemic imbalance.
Capacity and demand bounds:
0 K i t q ¯ i t ,   0 L u t d u t
Generators cannot sell more than their available capacity; consumers cannot contract beyond reliable demand, reducing delivery risk.
Network feasibility (only for physical delivery):
Define net contracted injection at node b :
y b t c = i : b i = b K i t u : b u = b L u t
The contract must be physically transmittable:
b y b t c = 0 ,   F ¯ l c b H l b y b t c F ¯ l c
where H l b is the PTDF (mapping node injections to line flows), and F ¯ l c is the derated line capacity with safety margin ( ρ F ¯ l ). This constraint is irrelevant for CfDs (purely financial) but critical for physical delivery, ensuring that “paper contracts” are physically deliverable without shifting congestion risk onto the real-time market.

2.3. Optimization Model for the Optimal Economic Proportion of Medium- and Long-Term vs. Spot Trading

In the preceding sections, we established a cost-minimizing spot market clearing model and a Nash bargaining model for medium- and long-term (MLT) contracts. However, these two models alone cannot answer a key question: In a typical electricity market, what proportion should be allocated to MLT contracts versus spot trading in order to simultaneously ensure market stability and economic efficiency?
To capture the optimal level of this “contract penetration,” we introduce two core indicators:

2.3.1. Volume Proportion (Contract Penetration Rate)

ϑ = t X t D t ,   X t = i G u U Q i u , t ,   D t = u U d u t
Here, X t denotes the total contracted volume in period t , and D t represents the benchmark demand (e.g., expected load or total electricity consumption). The volume proportion ϑ reflects the share of MLT contracts in overall demand. Intuitively, a higher ϑ locks in more market risk, thereby reducing price volatility but lowering flexibility; a lower ϑ exposes participants to greater spot market risk.

2.3.2. Economic Proportion (Effective Contract Penetration Rate)

Simply maximizing contract volume is not sufficient, since some contracts may be poorly priced or ineffective in hedging risk, yielding limited real economic value. Therefore, we further define:
ϑ ¯ = i U i U i 0 + u V u V u 0 i m a x U i U i 0 + u m a x V u V u 0
This measures the proportion of effective contribution of contracts to improving overall system welfare. The numerator captures the aggregate payoff improvement relative to the no-contract baseline, while the denominator represents the theoretical maximum potential improvement (e.g., the gap between “full contracting” and “all-spot” scenarios). If a large number of contracts are signed but fail to meaningfully enhance economic efficiency, then ϑ ¯ will fall below ϑ . Hence, ϑ ¯ better captures the quality of contracting.
We formulate the optimal economic proportion as a nested maximization problem: the outer layer controls the overall level of contract coverage, while the inner layer determines contract allocation and pricing. The model is
m a x Y max Q iu , t ,   F iu i G U i U i 0 ω i u U V u V u 0 ν u
subject to the constraints defined in Section 2.2, as well as the economic proportion condition
min ϑ , ϑ ¯ Y ,   Y 0,1
This structure ensures that the optimal solution not only maximizes joint bargaining outcomes but also guarantees a minimum threshold of both contract volume and economic effectiveness.

3. Data and Algorithm

3.1. Data Sources and Characteristics

The core research question of this study is: Under high renewable penetration, how can an appropriate configuration between medium- and long-term contracts and the spot market achieve the optimal economic proportion in the electricity market? To answer this, it is necessary to capture the key uncertainties in the market, including fuel prices, renewable energy output, and consumer demand.
We use daily coal price data from 2011–2025, together with hourly meteorological and load data for the representative Central China (HZ) regional power system in 2024. The test system is based on the provincial-level grid topology of the Central China Power Grid, which includes 32 nodes representing major generation units, substations, and load centers. Transmission line parameters—including reactance, capacity limits, and susceptance—are obtained from internal technical documents of the Central China Power Grid Corporation, which provide detailed network characteristics consistent with real-world operations but are not publicly available. The meteorological dataset includes wind speed, solar irradiance, and temperature observations from regional meteorological stations, while load curves are derived from hourly dispatch and operation records of the Central China grid. Together, these datasets form a realistic and comprehensive basis for representing the stochastic environment of electricity supply, demand, and transmission constraints in the HZ system for model validation.
Coal price is a critical driver of bidding functions for conventional generators, characterized by strong mean reversion and sudden jumps. Wind speed and irradiance determine the upper bounds of wind and solar generation, respectively, directly influencing renewable output. Temperature affects both photovoltaic efficiency and load demand (e.g., summer cooling and winter heating). Load data exhibit clear diurnal and seasonal patterns as well as spatial correlations across nodes, serving as fundamental system constraints.
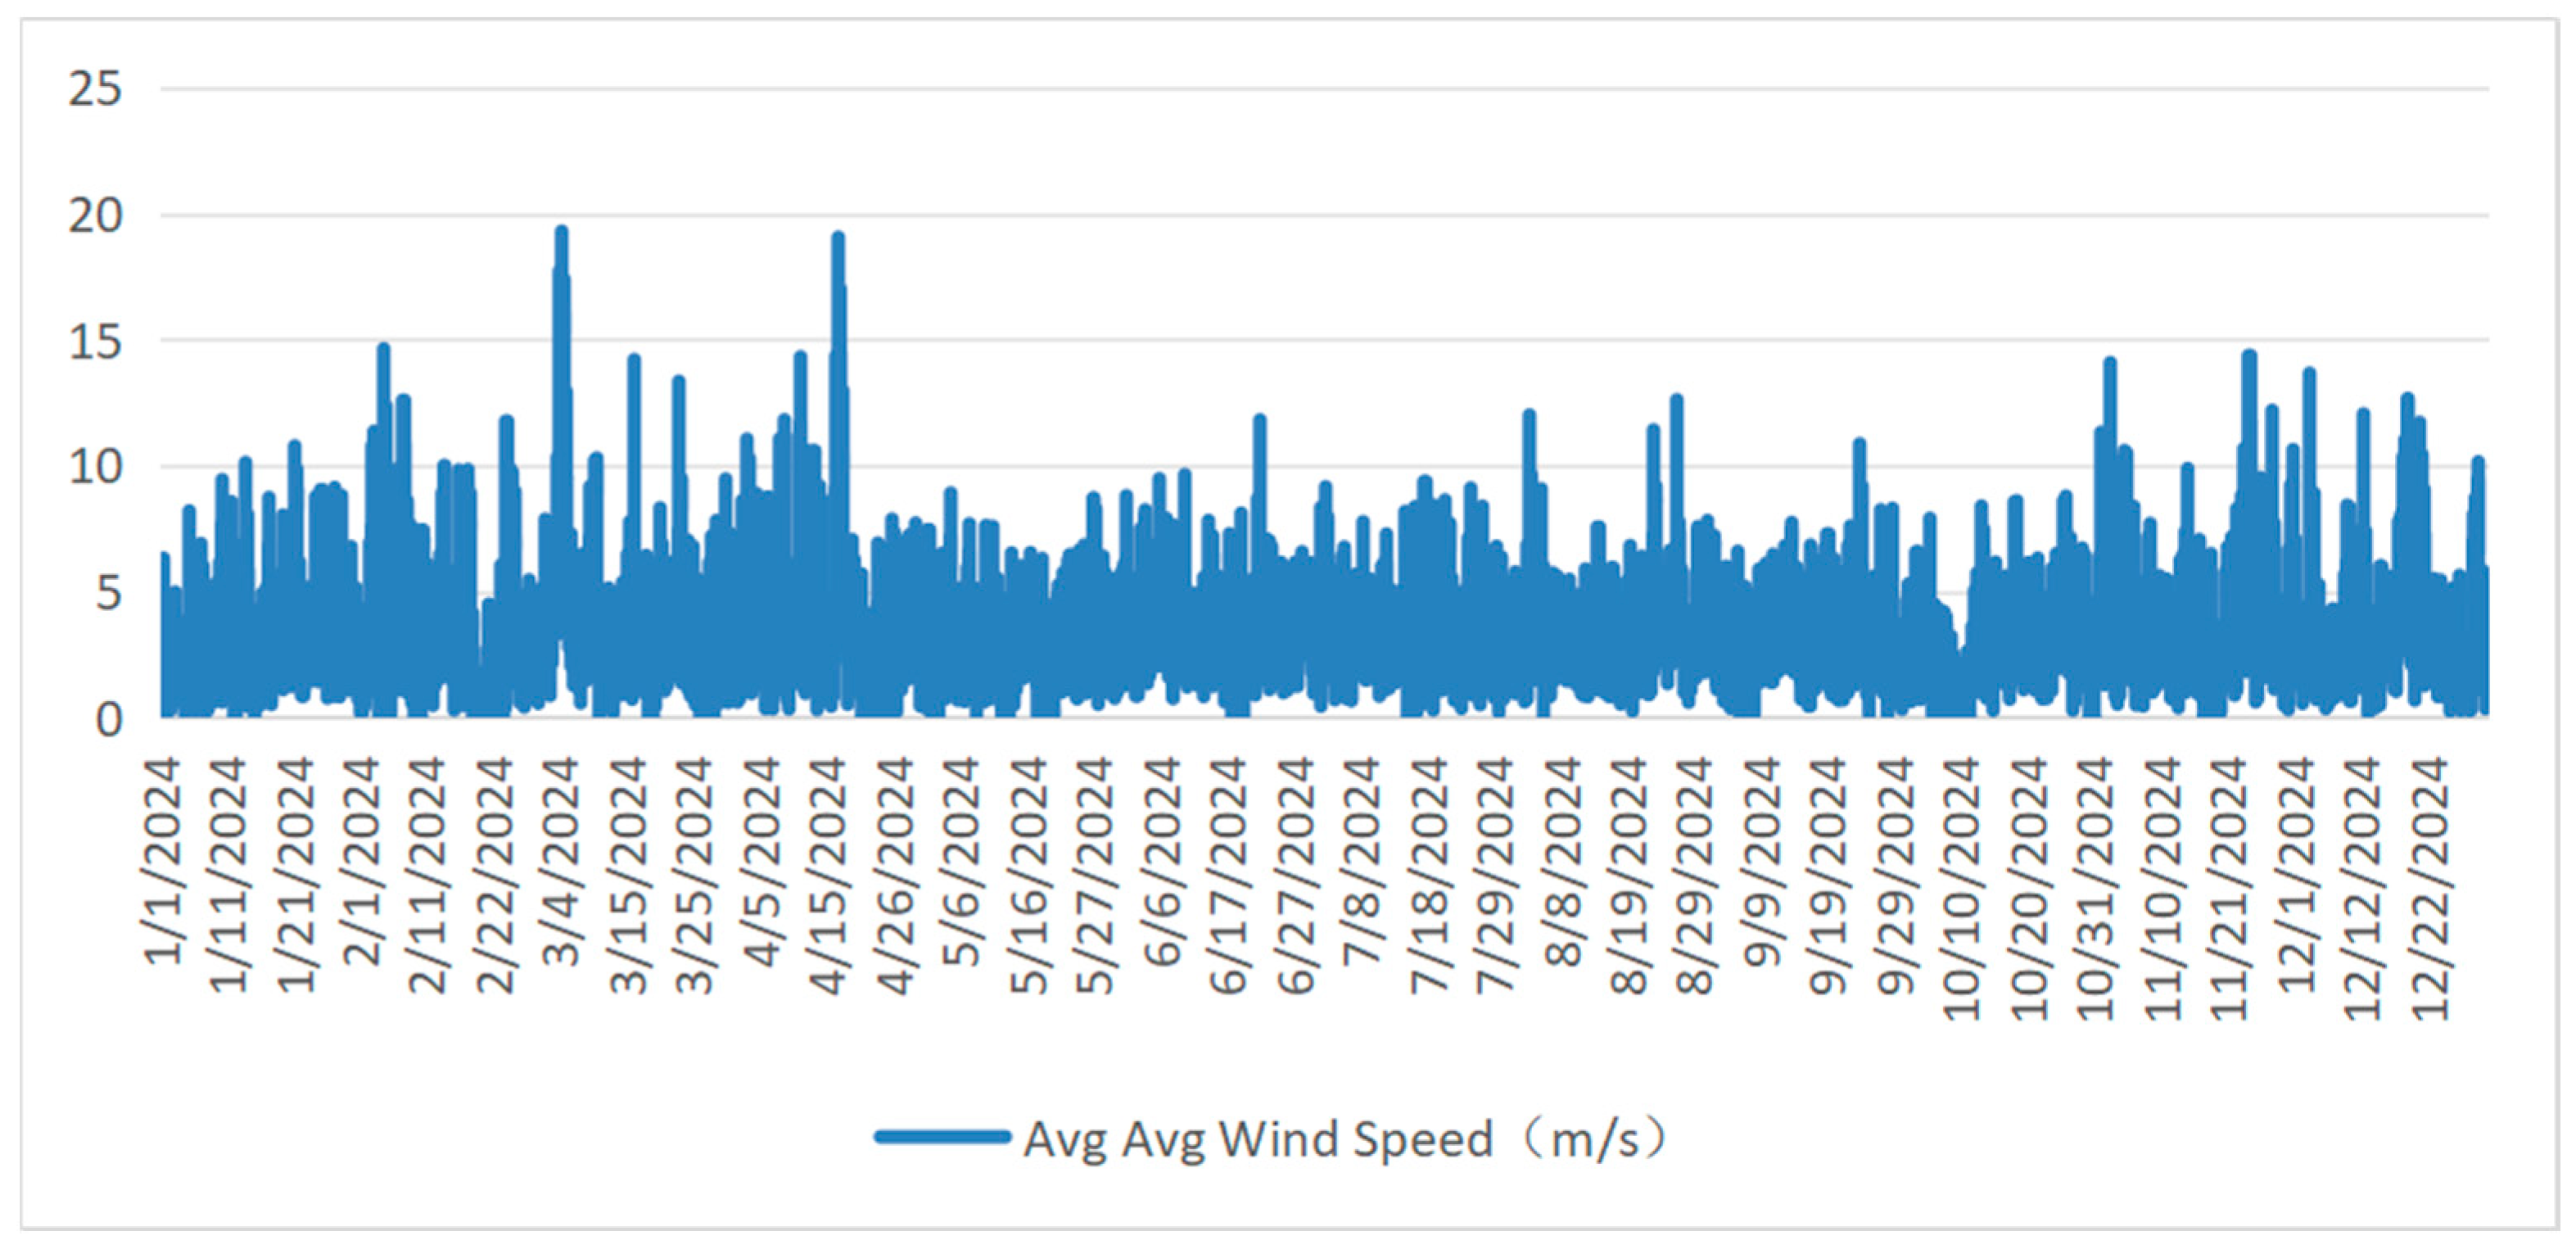
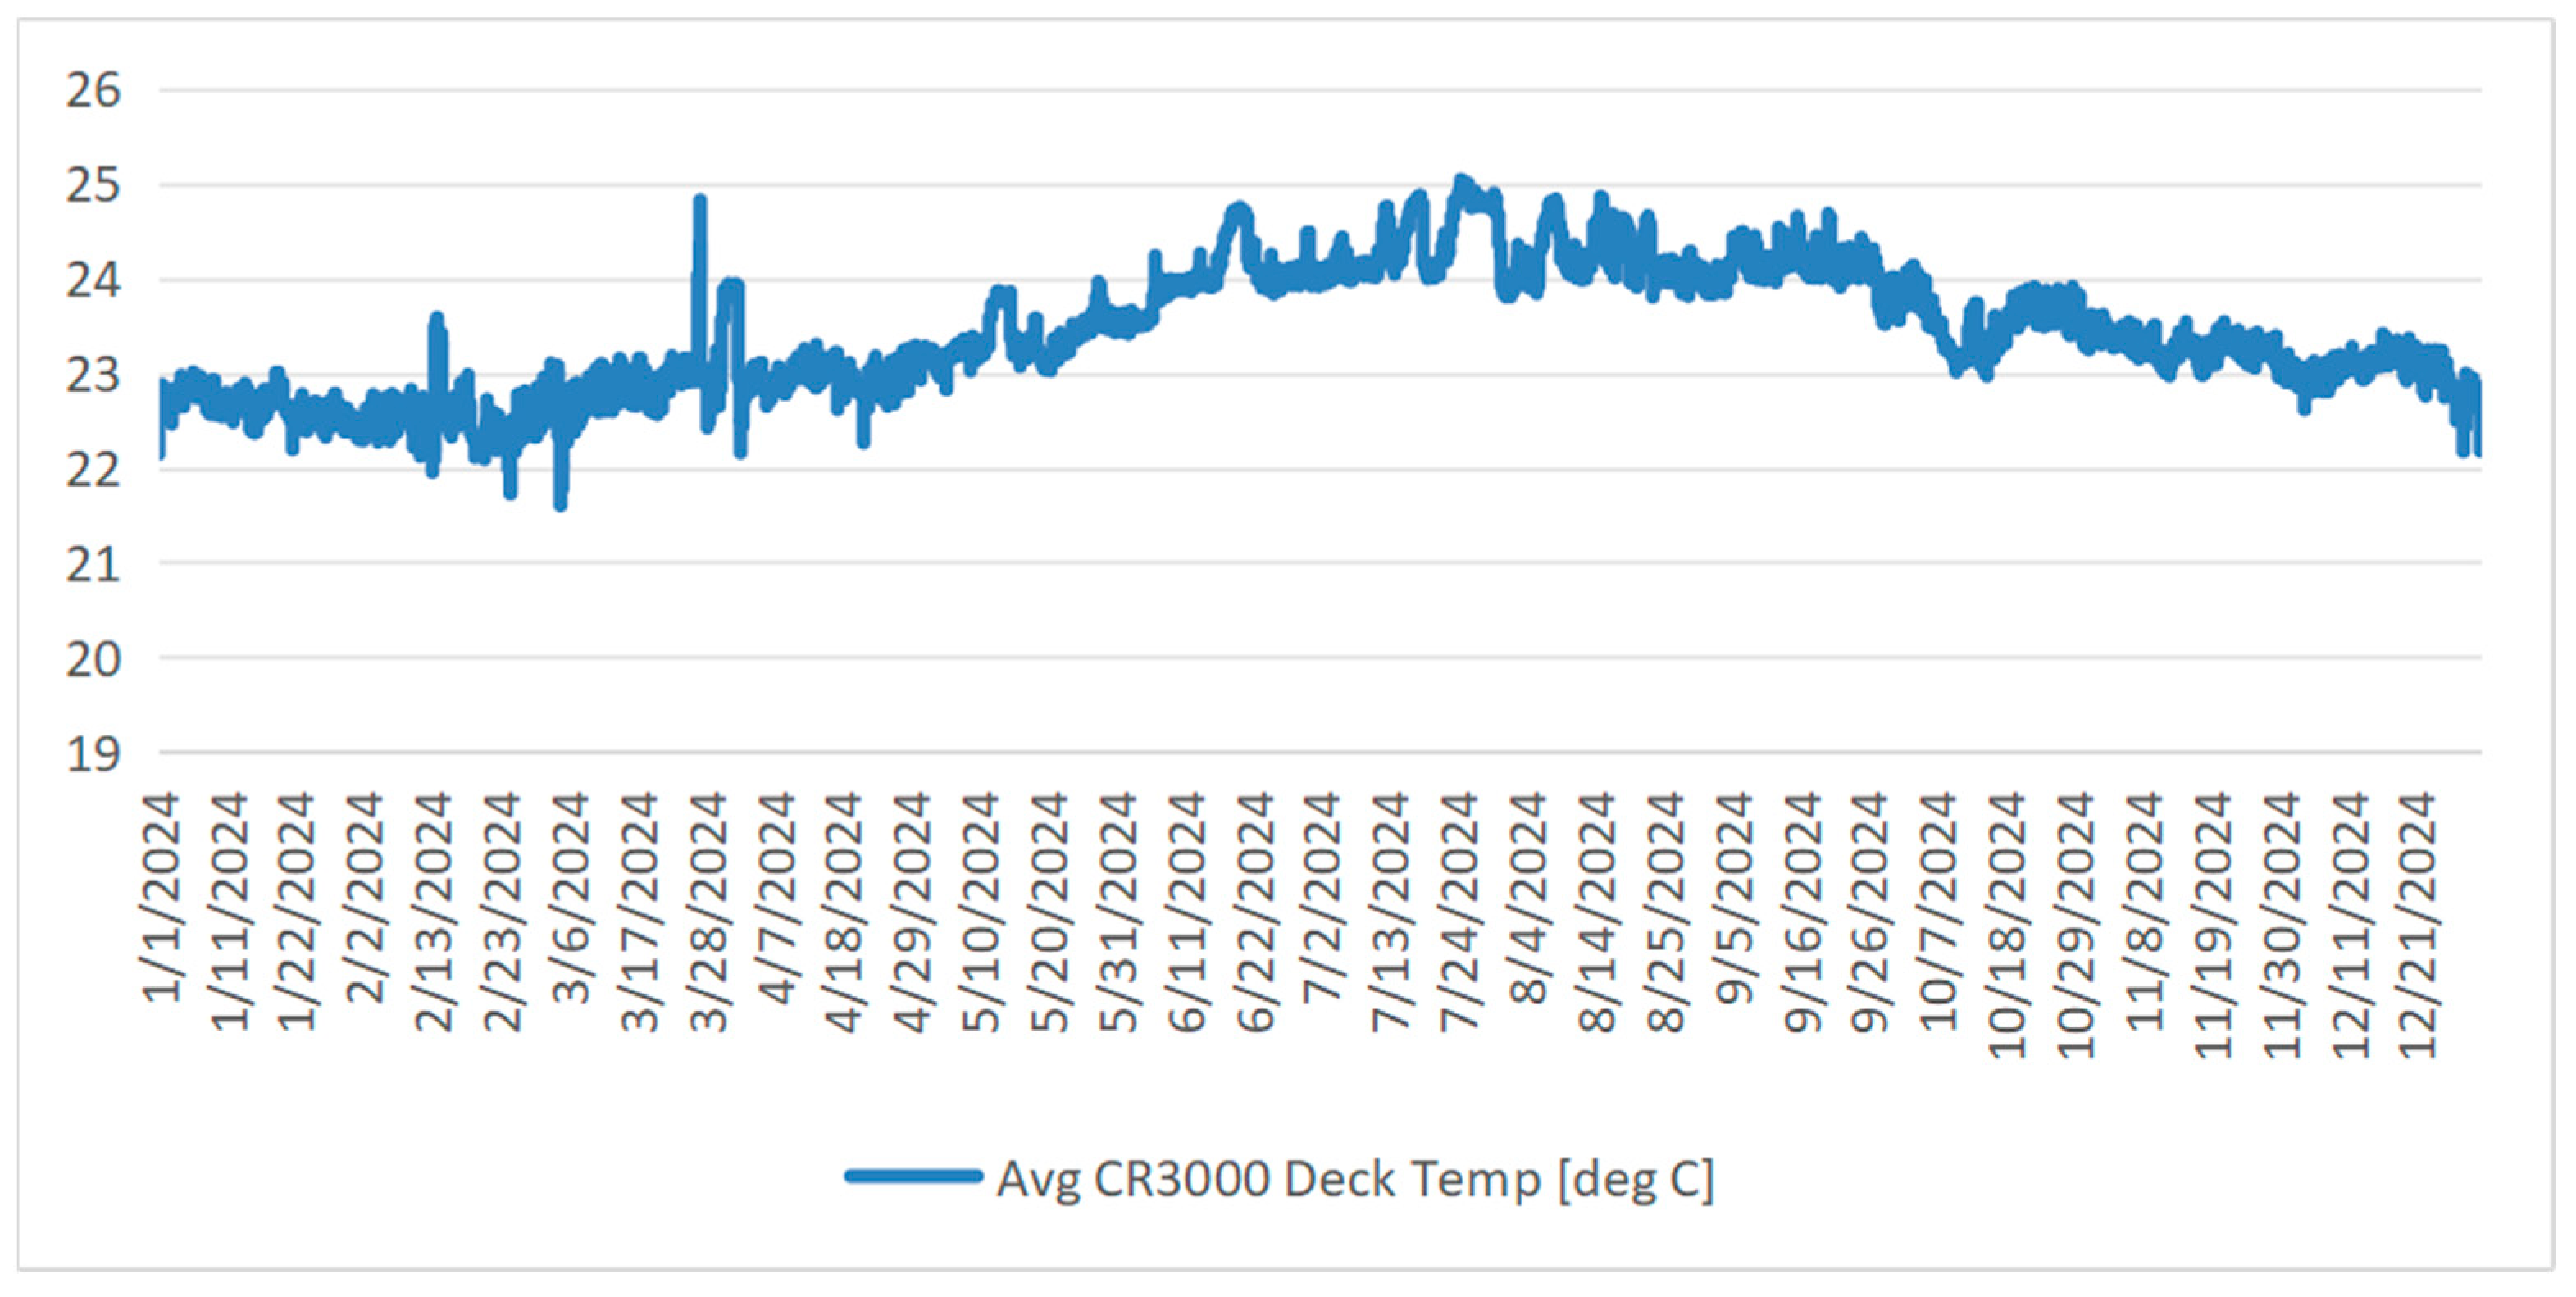
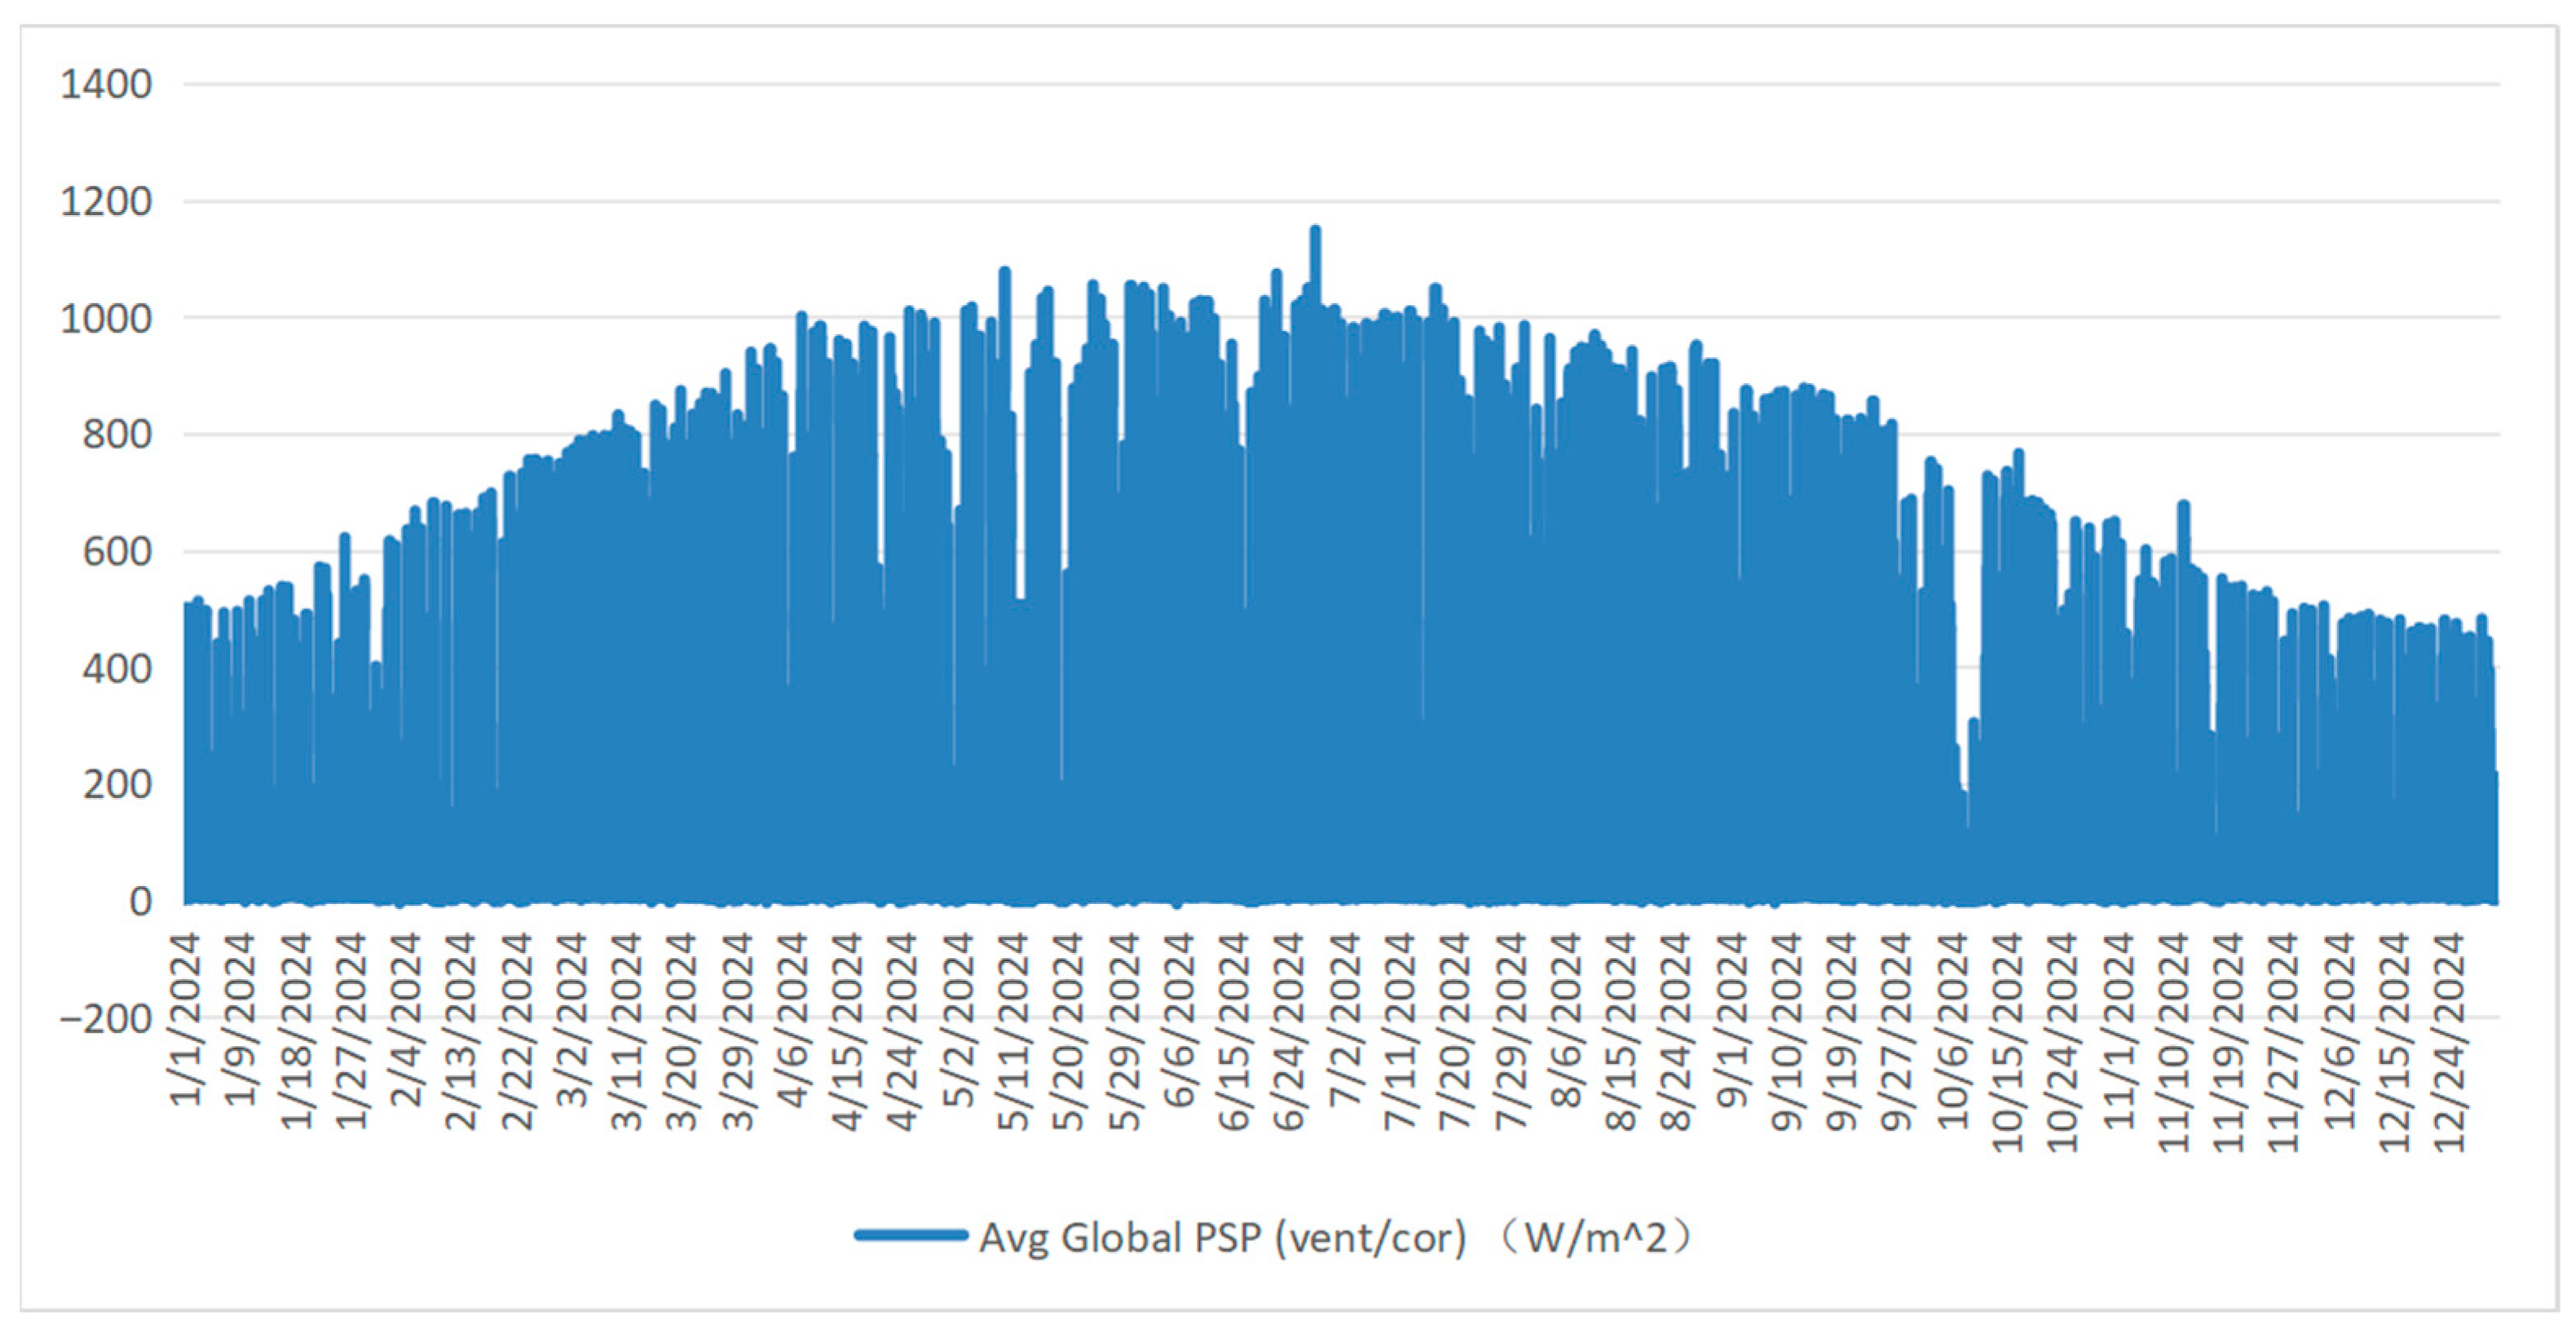
For illustration, Figure 1, Figure 2, Figure 3, Figure 4 and Figure 5 show the time series of coal price, wind speed, temperature, representative node load, and solar irradiance.
From 2011 to 2025, coal prices followed a “stable–decline–rapid surge–correction” trajectory. In particular, during 2021–2022, international energy tensions drove prices above 2000 RMB/ton before stabilizing in the 800–1000 RMB/ton range. This confirms coal prices exhibit both mean reversion and jump volatility.
In 2024, wind speed fluctuated mostly between 2–10 m/s, with occasional extremes above 15–20 m/s. The process is highly volatile, seasonal, and prone to sudden shocks, underscoring the variability of wind output.
Daily mean temperature in 2024 showed a “low in winter, high in summer” annual cycle, with smaller short-term fluctuations. Temperature not only drives seasonal electricity demand but also affects PV efficiency.
Figure 4 illustrates the representative daily load curves for the five typical user groups in the simulation system. Load 1 represents residential users, whose demand shows clear seasonal and daily cycles, driven mainly by temperature and household electricity use. Load 2 corresponds to public and commercial buildings such as offices and retail facilities, characterized by relatively stable weekday demand and low weekend consumption. Load 3 denotes industrial users with high base load and moderate fluctuation, accounting for the largest share of total demand. Load 4 represents agricultural or rural loads, which exhibit seasonality due to irrigation and agricultural processing activities. Load 5 refers to transportation and other emerging loads (e.g., EV charging), which show gradual growth over the year. Together, these five categories reflect the ownership and composition of total system load used in the model.
Node-level loads range between 300–1800 MW, exhibiting strong spatial correlation. Loads feature daily peaks and troughs, weekly cycles, and seasonal trends.
Hourly irradiance data display a clear day–night alternation: zero at night, and bell-shaped curves during the day, with higher summer peaks (>1000 W/m2) and lower winter peaks. This reflects the regularity and seasonal variation in PV output.
To incorporate these exogenous variables into the market model, we employ stochastic process modeling and parameter estimation. Specifically:
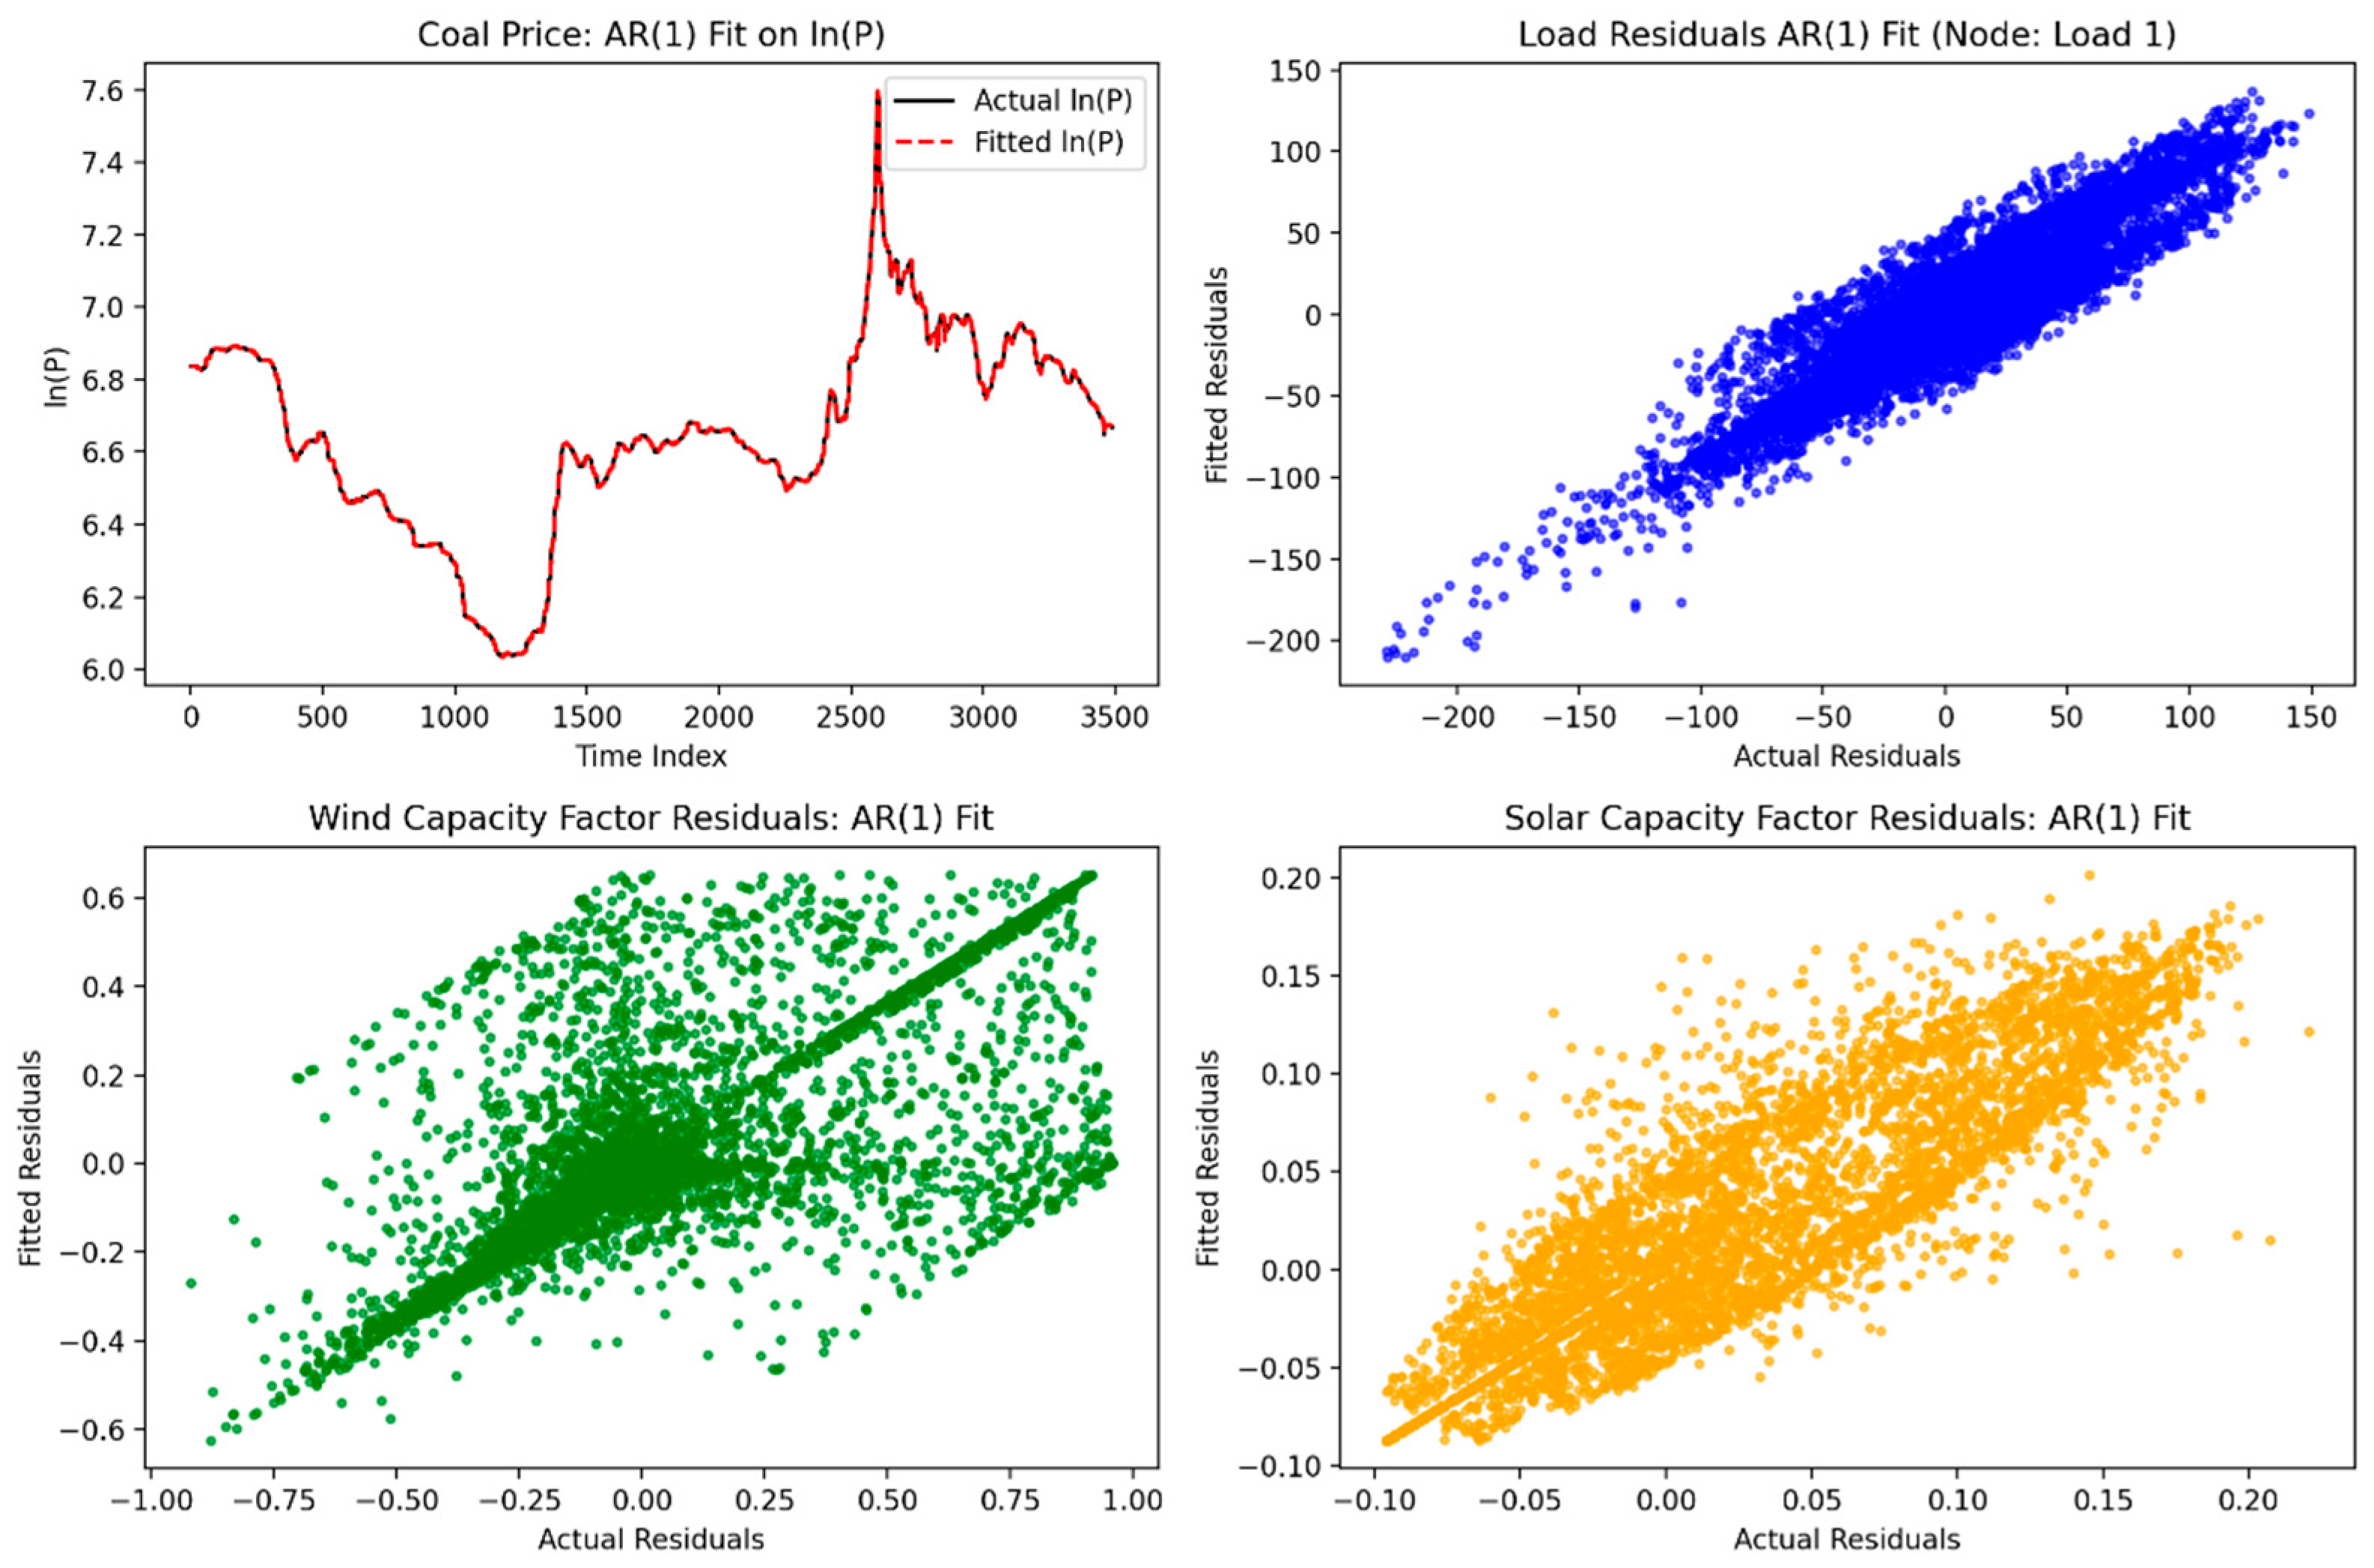
Coal price: log-coal price l n ( P ) is fitted with an AR(1) process, yielding Ornstein–Uhlenbeck (OU) parameters ( κ ,   θ ,   σ ) , capturing long-run mean and short-term volatility. Wind power: wind speed is converted into capacity factors; residuals are fitted with AR(1) to capture mean reversion and volatility. Solar PV: irradiance and temperature-adjusted capacity factors are modeled, with AR(1) fitted to residuals. Load: seasonality and temperature dependence are first regressed out, and residuals are fitted with AR(1) to capture short-term stochastic disturbances.
Parameter estimation uses Ordinary Least Squares (OLS), and R 2 values are reported to assess model fit (as shown in Table 1).
Figure 6 shows diagnostic plots for coal price, representative node load, wind, and PV residuals, confirming high model fidelity—especially for coal and PV residuals.
Figure 6 aims to verify the fitting performance and validity of the stochastic process models applied to key market variables, including coal price, system load, wind, and solar generation. The upper-left panel shows that the log coal price fitted with an AR(1) process accurately reproduces both long-term mean reversion and short-term volatility, demonstrating a very high R 2 . The upper-right panel presents the residual fitting for load after removing seasonal and temperature effects, confirming that the AR(1) model effectively captures short-term autocorrelation. The lower panels show the wind and solar capacity factor residuals, whose strong linear correlation between fitted and actual residuals indicates significant mean reversion and stable stochastic behavior. Overall, the figure demonstrates that the AR(1)–based Ornstein–Uhlenbeck parameter estimation ( κ ,   θ ,   σ ) reliably characterizes the dynamics of these variables, supporting the empirical validity of the stochastic modeling framework and ensuring that the parameters reported in Table 1 are suitable for subsequent Monte Carlo simulations of electricity market uncertainty.
In addition to these empirically estimated parameters, we also specify representative generator characteristics based on industry benchmarks: 300 MW coal plant (heat rate 9.5 GJ/MWh, efficiency 0.20). 600 MW coal plant (heat rate 9.0 GJ/MWh, efficiency 0.25). 1000 MW coal plant (heat rate 8.8 GJ/MWh, efficiency 0.30). These parameters ensure the model remains realistic and interpretable for practical power system applications.

3.2. Algorithmic Procedure

The core challenge of this study is to solve the proposed three-layer model under stochastic environments. The overall workflow can be summarized as: stochastic scenario generation → spot market clearing → intertemporal payoff calculation → Nash bargaining optimization → contract coverage search.
First, based on the parameters estimated in Section 4.1 for coal prices, wind speed, solar irradiance, and multi-node load, we conduct Monte Carlo simulations to generate a large number of time-series paths that exhibit mean-reverting diffusion with jump characteristics (see Appendix A, Algorithm A2). Along each path: Coal prices determine the bidding parameters a i t ,   b i t of conventional units, Wind speed and irradiance determine the upper output limits of renewable units q ¯ i t R E S , Temperature and other meteorological factors affect node demand d b t . The constructed input data are then fed into the DC-OPF model, which solves a cost-minimization problem subject to system power balance and transmission constraints (Appendix A, Algorithm A3). From the Lagrangian dual conditions, we obtain the uniform energy price λ t , the nodal marginal prices π b t , and the optimal dispatch for both conventional and renewable units. Because we rely on scenario simulations, these prices and outputs vary across paths, generating the sample means and variances needed for the subsequent optimization.
Building on the spot market clearing results, we compute each participant’s baseline payoff under the “spot-only” scenario—referred to as the disagreement point (Appendix A, Algorithm A1, Steps 2–3). For generators, this consists of revenue from nodal prices and output minus costs, adjusted for risk via a mean–variance approach. For consumers, it is their consumption utility net of spot payments, minus a risk-aversion penalty. This disagreement point represents the fallback payoff without any medium- or long-term contracts.
When contracts are introduced, the cash flows are added on top of the spot payoffs. For financial CfDs, settlement is based solely on “(reference price − fixed contract price) × contract volume.” CfDs do not alter physical dispatch but hedge against price volatility. For physical delivery contracts, contracted quantities are settled at fixed prices, while deviations are settled in the spot market, subject to network feasibility constraints (Appendix A, Algorithm A4). In both cases, intertemporal total payoff is defined as the sum of spot payoffs and contract cash flows, minus risk penalties based on sample variance.
Given this payoff definition, we model the bargaining between generators and consumers using a Nash bargaining framework (Appendix A, Algorithms A4 and A5). Specifically, we maximize the weighted product of participants’ net improvements over their disagreement points. Numerically, this reduces to a quadratic programming problem with mean–variance utilities. Because contract quantities and prices affect payoffs differently, we adopt a two-step approach to improve computational stability: Fix contract prices and solve for the optimal allocation of contract volumes at a given coverage level, maximizing system-wide risk-adjusted surplus (Appendix A, Algorithm A4).
Given these volumes, adjust bilateral contract prices so that marginal improvements in surplus align with each party’s bargaining weights, ensuring fair surplus allocation (Appendix A, Algorithm A5).
Alternatively, one may iterate contract quantities and prices jointly until the weighted Nash product converges. In either case, the inner optimization yields an equilibrium set of contract volumes and prices.
Finally, to determine the overall coverage level of MLT contracts, we introduce two outer-layer indicators: contract penetration ( ϑ ) and effective economic penetration ( ϑ ¯ ). The former measures the share of demand covered by contracts, while the latter measures the contribution of contracts to overall system welfare. In the outer optimization, we search over the coverage level Y subject to min ϑ , ϑ ¯ Y Intuitively, a coverage level is feasible only if both contract quantity and quality exceed a given threshold. Computationally, we adopt a bisection method to iteratively adjust Y , invoking the inner Nash bargaining model at each step to solve for optimal contract allocation (Appendix A, Algorithm A6). The process converges to the optimal coverage rate Y * , which balances quantity and quality. Through this procedure, the model not only simulates the interaction between the spot market and MLT contracts under uncertainty, but also yields a contract structure that achieves the optimal trade-off between economic efficiency and market stability (Appendix A, Algorithm A1).

4. Simulation Analysis

4.1. Sensitivity Analysis of Coal Price Volatility

Coal prices are one of the most critical cost drivers in China’s electricity market. They not only directly determine the marginal cost and bidding curves of coal-fired units but also influence the risk-sharing mechanism between the contract market and the spot market through their volatility. Under the “dual carbon” policy framework, sharp fluctuations in coal prices have become a key factor in both market risk management and policy design.
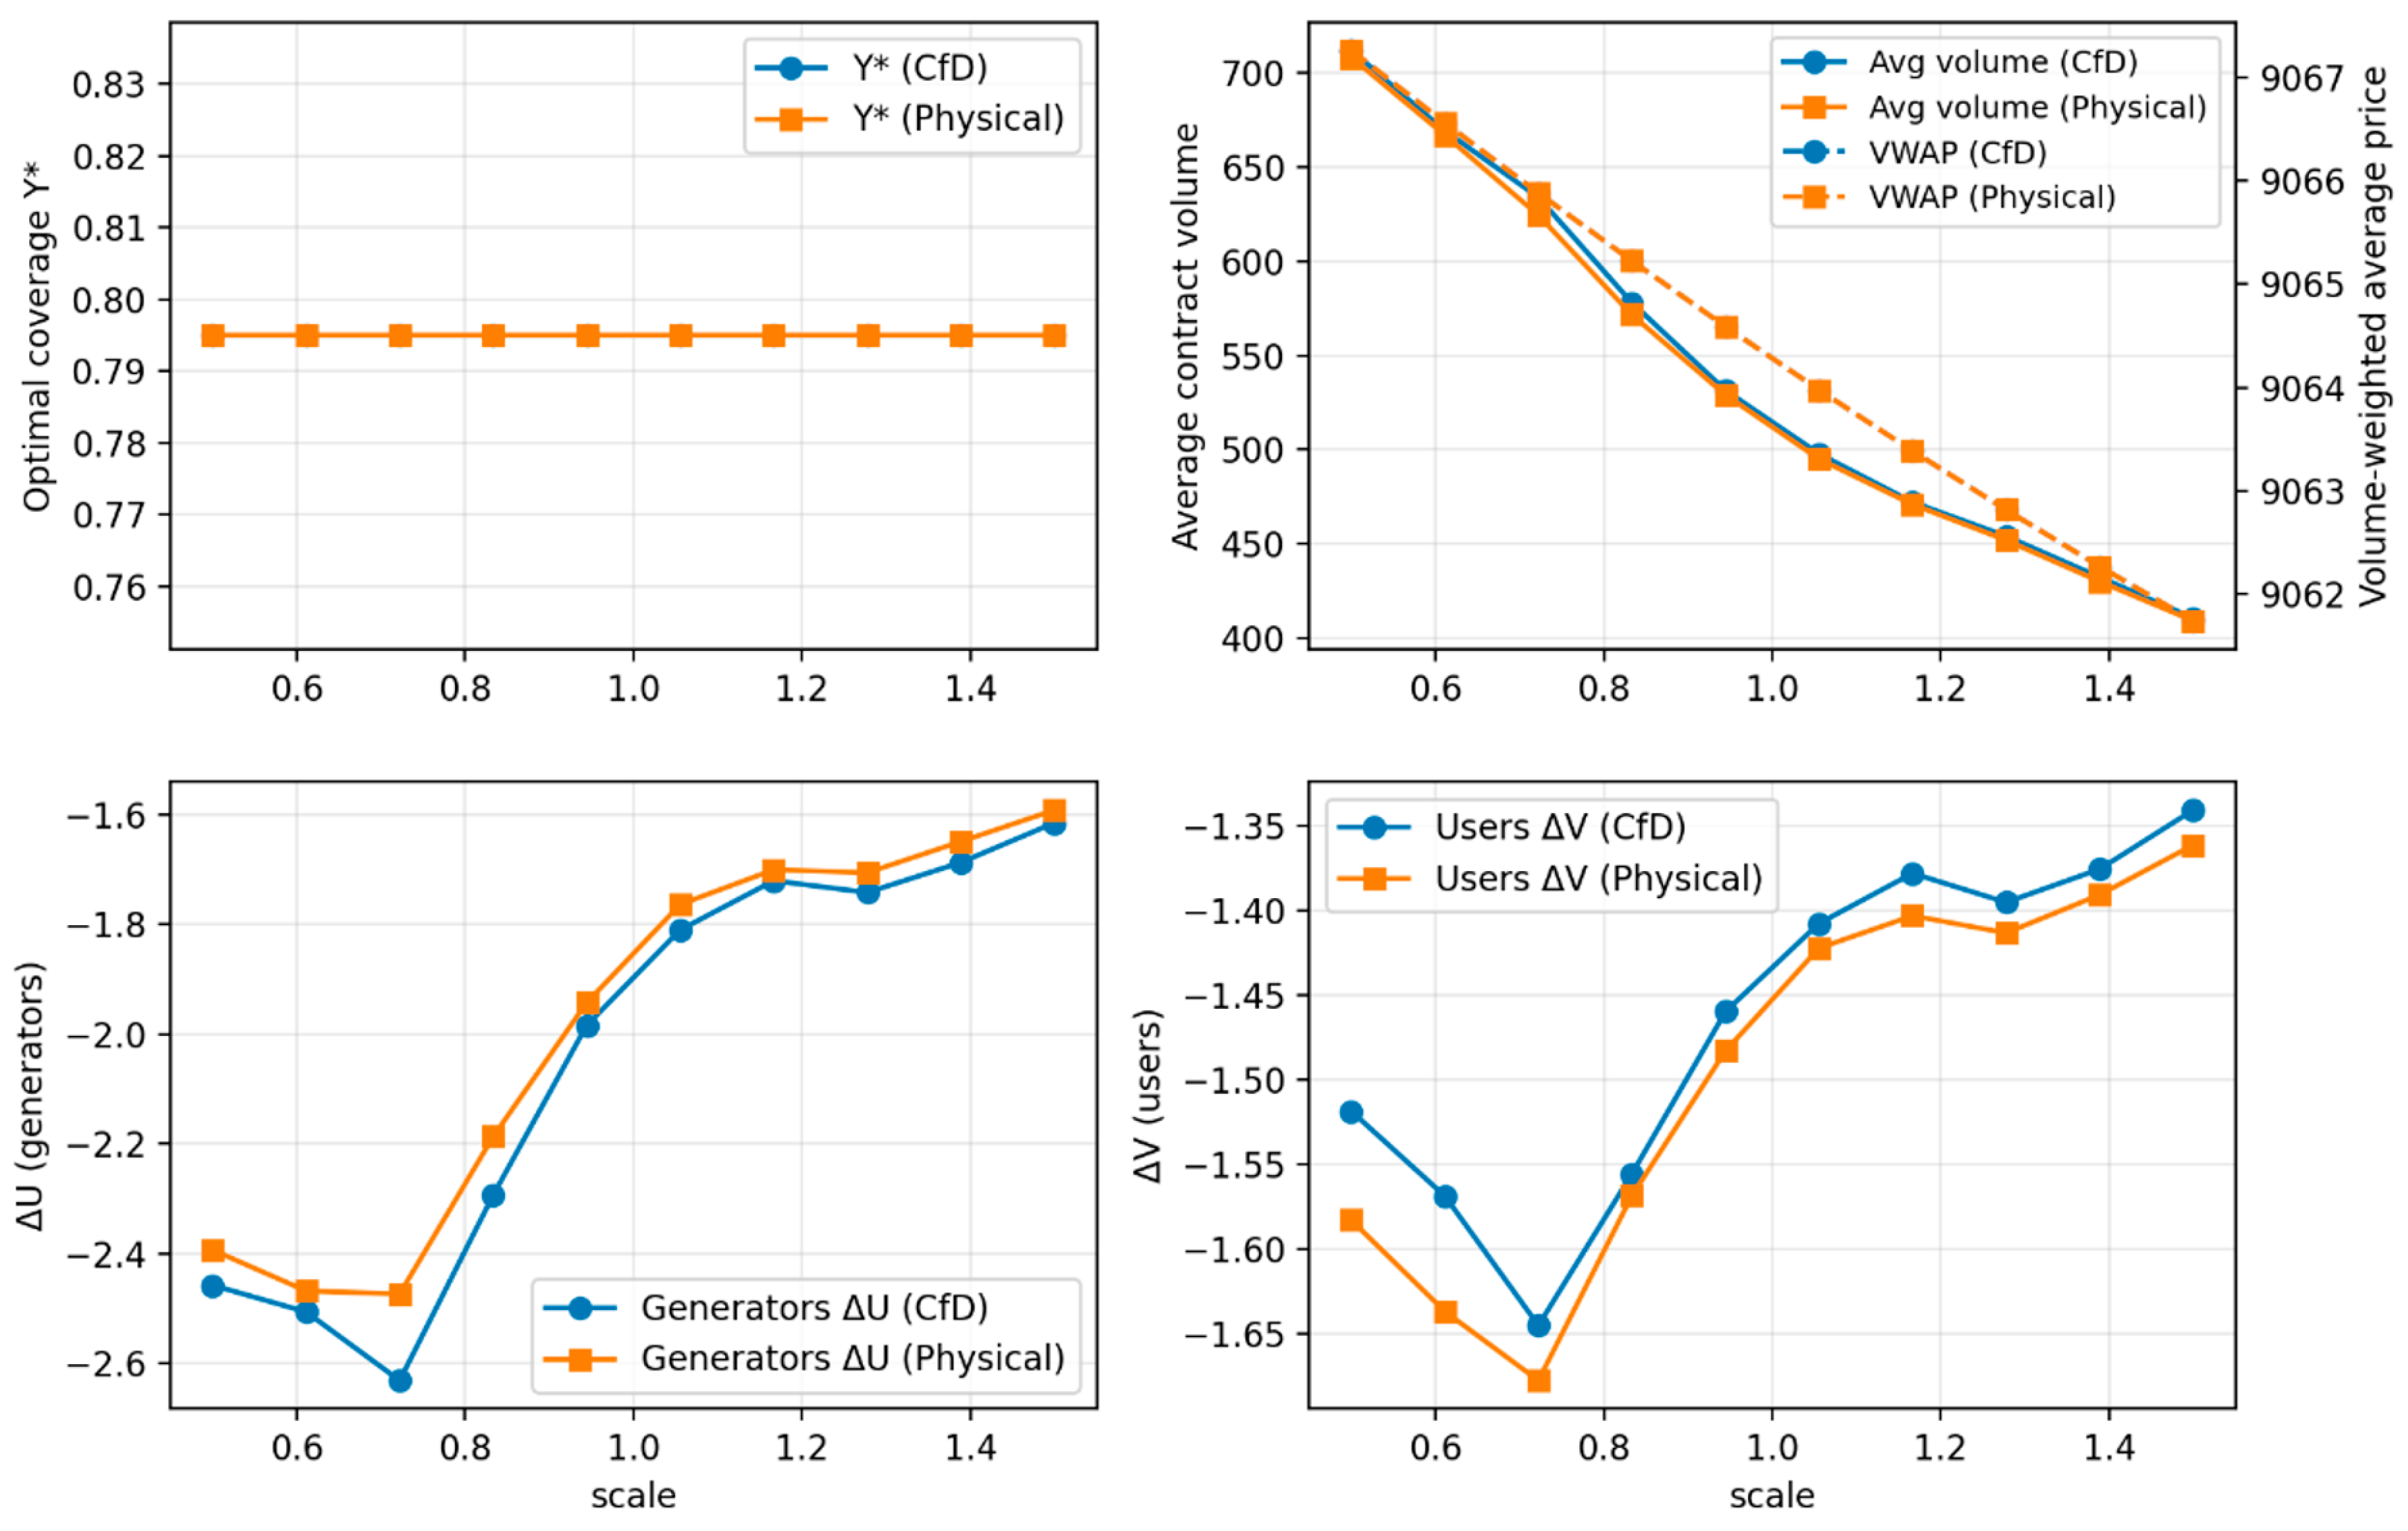
Therefore, this study first conducts a sensitivity analysis on the coal price volatility coefficient σ F , examining its impacts under different scaling factors (0.5–1.5 times). We compare results under financial CfDs and physical delivery contracts in terms of the optimal contract coverage rate Y * , average contracted volume, weighted contract prices, changes in generator payoffs Δ U , and changes in consumer utilities Δ V . The results are illustrated in Figure 7.
From the top-left panel, we observe that regardless of coal price volatility, the optimal contract coverage rate Y * remains relatively stable—consistently close to 0.80 under both CfD and Physical mechanisms. This indicates that, under the current parameter settings, the market primarily hedges coal price risk through contract volumes, while the optimal coverage level itself is not highly sensitive to coal price volatility. This finding provides an important managerial implication: regulators do not need to frequently adjust overall contract ratios in response to coal price fluctuations; rather, they can rely more on risk premia and market mechanisms for fine-tuning.
The top-right panel shows the trends in average contract volume and weighted transaction prices as volatility changes. As volatility increases, average contracted volumes decline noticeably, while transaction prices rise slightly. This suggests that when uncertainty intensifies, the market prefers to reduce contract commitments in order to maintain flexibility, while simultaneously demanding higher prices to compensate for risk. This implies that electricity companies should exercise greater caution in locking into long-term contracts during periods of coal price turbulence, to avoid over-committing in high-risk conditions. Consumers, in contrast, may face higher contract prices during such periods.
The bottom-left and bottom-right panels show the payoff improvements for generators and consumers, respectively. Overall, as coal price volatility rises, the net improvements for both sides narrow, with generators benefiting somewhat more under Physical contracts. This indicates that contracts can indeed serve as a stabilizer under rising coal price risks, but the effect is asymmetric: generators tend to gain relatively more risk-hedging benefits under physical delivery contracts, while consumer improvements are more limited. From a managerial perspective, this highlights an imbalance in risk-sharing and signals the need for regulators to ensure fair benefit allocation among market participants, in order to prevent long-term distortions in the contract market or potential consumer withdrawal.
Taken together, Figure 7 demonstrates that greater coal price volatility leads to reduced contract volumes, higher contract prices, and asymmetric improvements in risk-hedging benefits for generators and consumers. Economically, this reveals a pattern of “cautious contraction” in contracting behavior under heightened risk. From a regulatory standpoint, it underscores the need for complementary mechanisms—such as enhanced price discovery, risk mitigation instruments, and policy reserves—to cushion the impact of coal price volatility on market stability.

4.2. Sensitivity Analysis of Wind and Solar Output Uncertainty

With the rising penetration of renewable energy, wind and solar output levels have become central determinants of electricity market operations and the structure of medium- and long-term contracts. Unlike conventional units such as coal plants, renewables have near-zero marginal costs, and their mean output level (i.e., average capacity factor, CF) directly defines the potential space for contract allocation. When the average wind/solar output increases, the supply capacity of renewables in the contract market expands, potentially reshaping the equilibrium between the contract and spot markets.
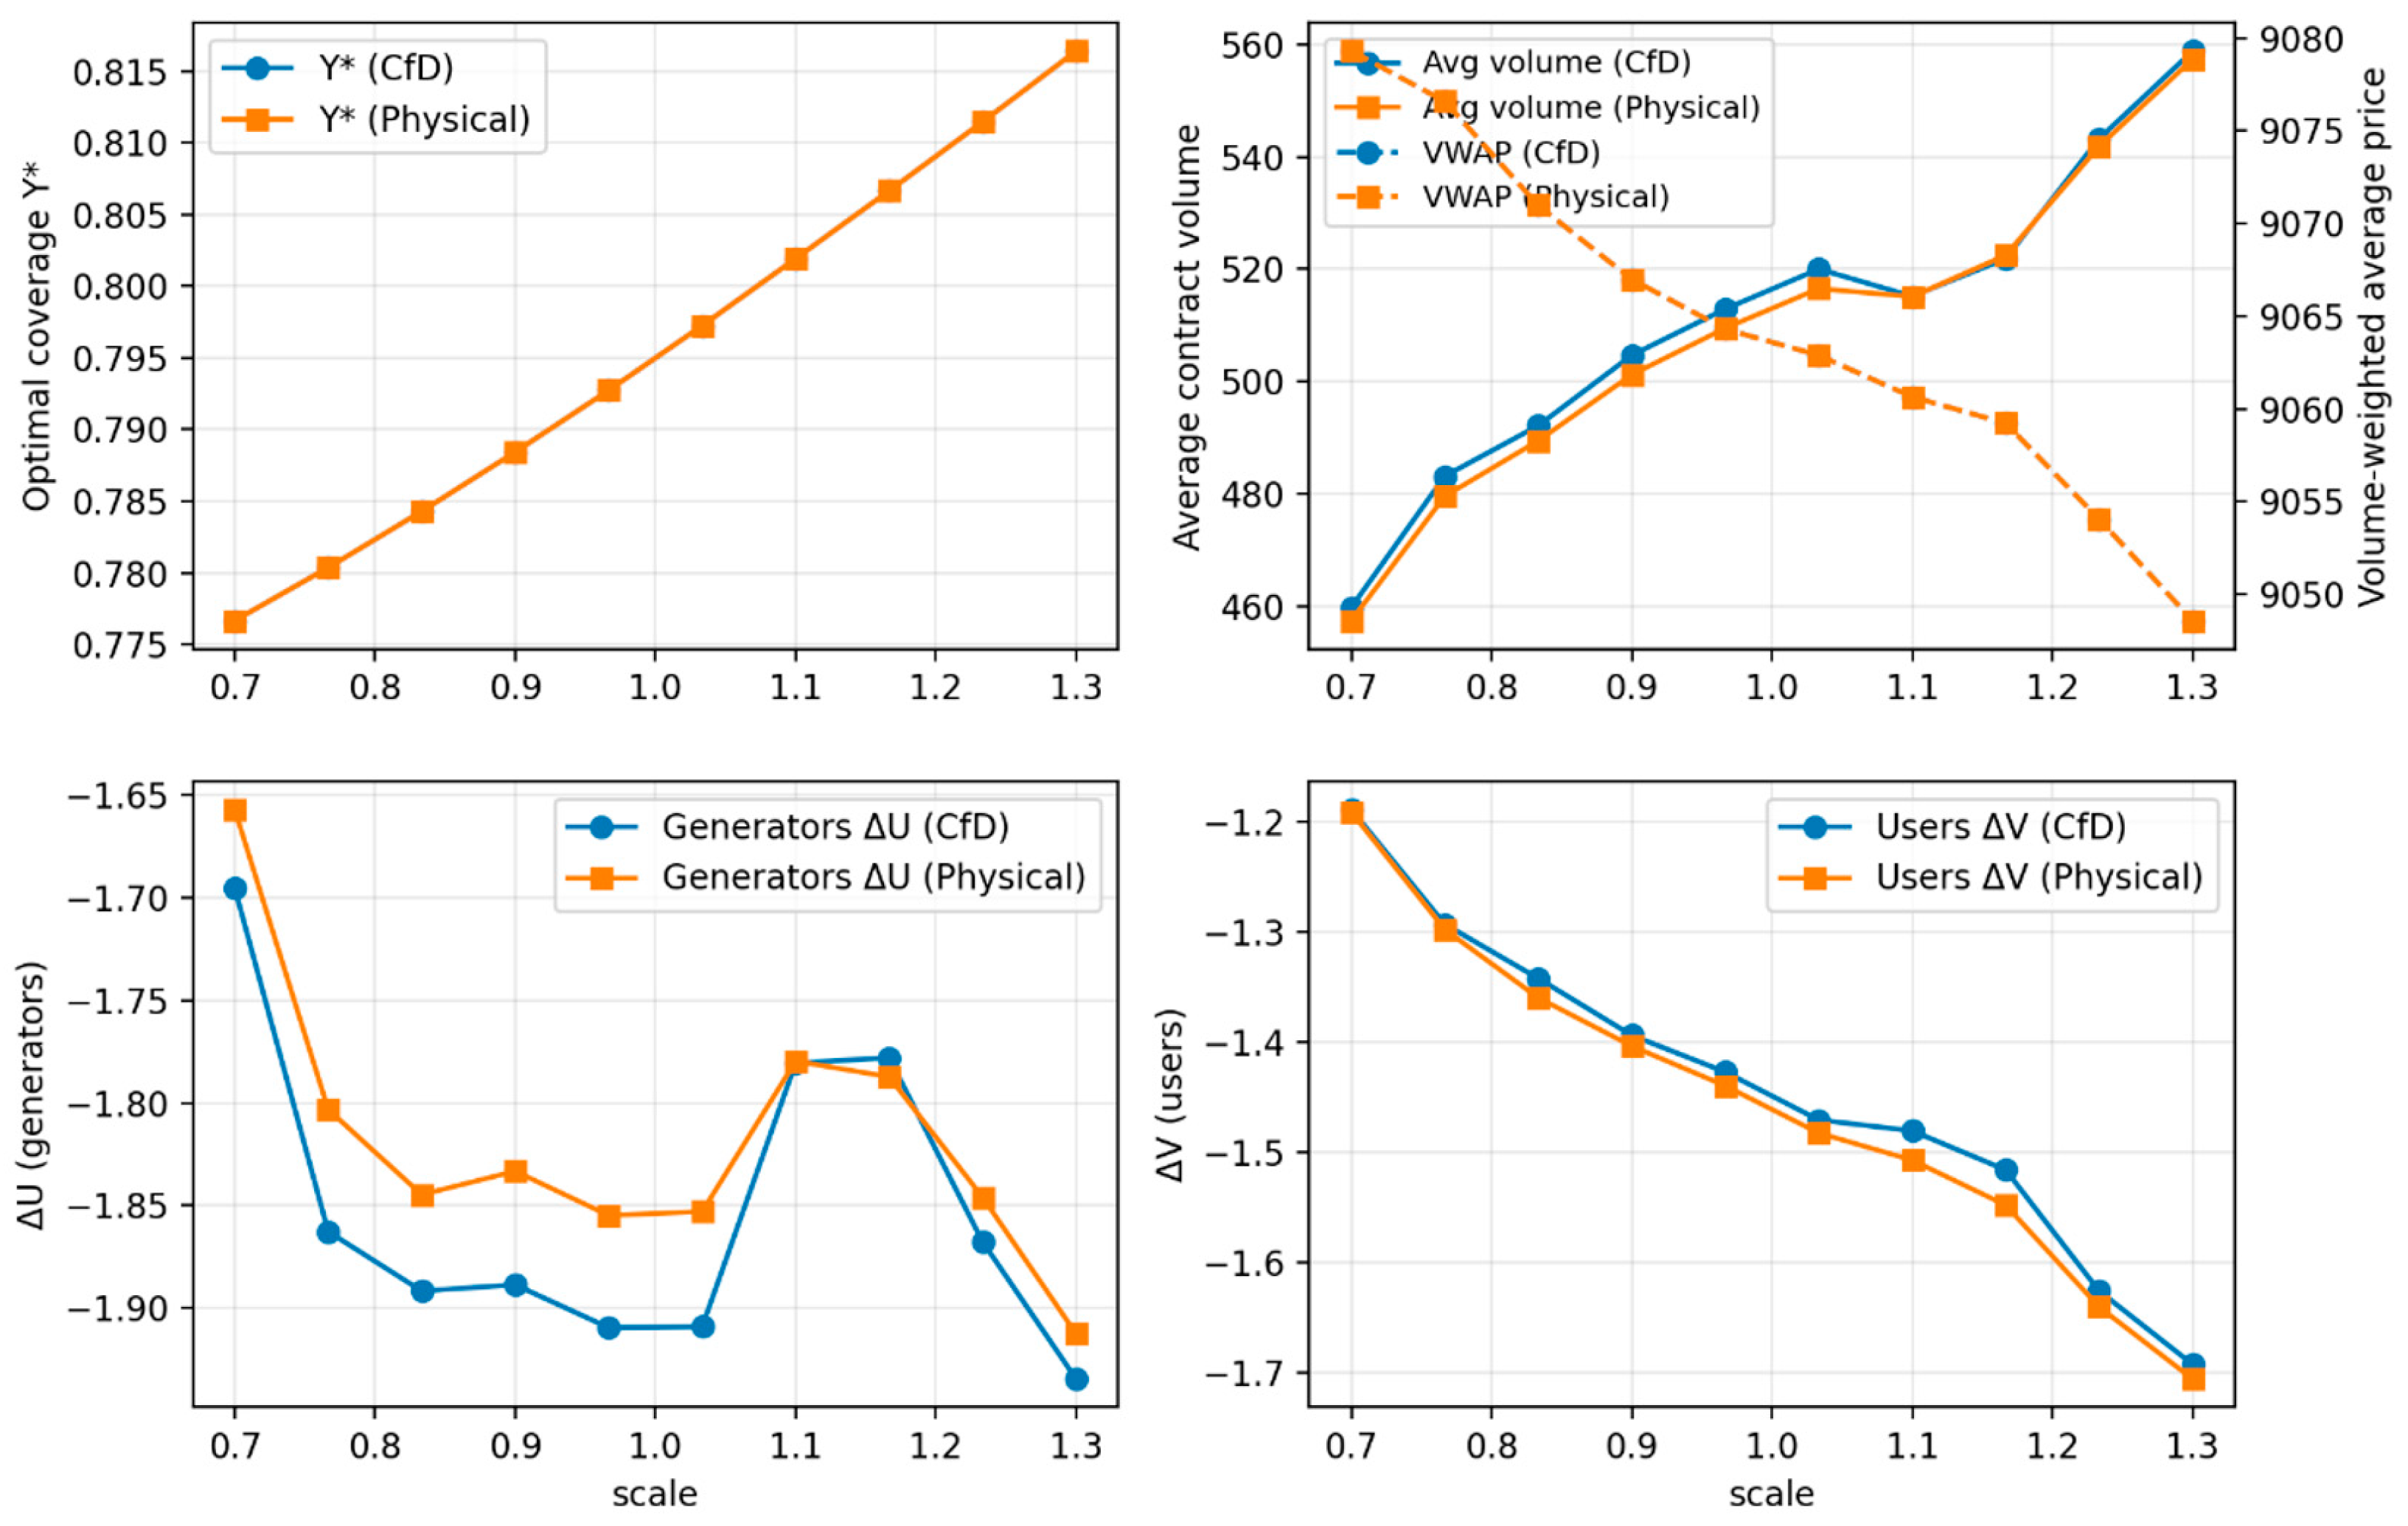
To explore this effect, we conduct a sensitivity analysis on the average capacity factor of wind and solar. Specifically, we scale their mean levels between 0.7 and 1.3 times the baseline and examine the impacts on the optimal contract coverage rate Y * , average contracted volumes and prices, as well as payoff improvements for generators and consumers. The results are illustrated in Figure 8.
From the top-left panel, we see that as average wind/solar output increases, the optimal contract coverage rate Y * rises steadily—from about 0.775 to 0.815 under both CfD and Physical mechanisms. This indicates that the higher the renewable output mean, the stronger the system’s tolerance and demand for long-term contracts, as market participants become more willing to use contracting to stabilize returns. Economically, this suggests that enhancing renewable output not only directly contributes to a cleaner energy transition but also strengthens the stability of the contract market while reducing excessive reliance on spot trading.
The top-right panel depicts the trends of contract volumes and weighted average prices. As renewable output increases, average contracted volumes grow significantly. However, price behavior diverges: under CfDs, prices remain nearly flat or even rise slightly, while under Physical contracts, prices fall. This divergence reflects the different pricing mechanisms: in CfDs, risk premia dominate price formation, whereas in Physical contracts, the falling marginal cost of renewable electricity is more directly reflected. The policy implication here is that with higher renewable penetration, financial contracts help stabilize market prices, while physical contracts highlight the low-cost advantage of clean electricity—thus suggesting differentiated regulatory support for the two mechanisms.
The bottom-left and bottom-right panels show payoff improvements for generators and consumers, respectively. Overall, as renewable output increases, generator gains first decline and then rebound, while consumer utility consistently decreases. This means that although consumers benefit from lower electricity prices, contract price adjustments and systemic risk reallocation reduce their overall utility. Generators, meanwhile, may capture additional revenues from increased output, but these gains are neither linear nor fully stable. From a governance perspective, this highlights the distributional effects of renewable expansion: if consumer utilities remain on a downward trajectory, their willingness to participate in contracting may erode, undermining the effectiveness of the MLT contract market.
In summary, Figure 8 shows that higher renewable means significantly raise the optimal contract coverage rate and contract volumes, but also create divergence in pricing structures and imbalances in welfare distribution. Economically, this underscores that renewable expansion reshapes not only cost curves but also contract market equilibria. From a policy standpoint, it calls for complementary mechanisms—such as contract price discovery rules and risk-compensation schemes—to ensure a fair balance among stakeholders and the long-term sustainability of the contract market.

4.3. Sensitivity Analysis of Load Peak–Valley Variations

Electricity demand is characterized not only by overall uncertainty but also by pronounced peak–valley patterns. With the evolution of socio-economic activity and changes in consumption structure, peak–valley differences are widening: for instance, concentrated air-conditioning load in summer or heating load in winter can cause steep increases in peak demand and sharp drops during off-peak periods. Variations in the peak–valley ratio directly affect grid congestion risk, generator dispatch, and market price volatility, thereby influencing the optimal coverage of MLT contracts as well as the distribution of payoffs.
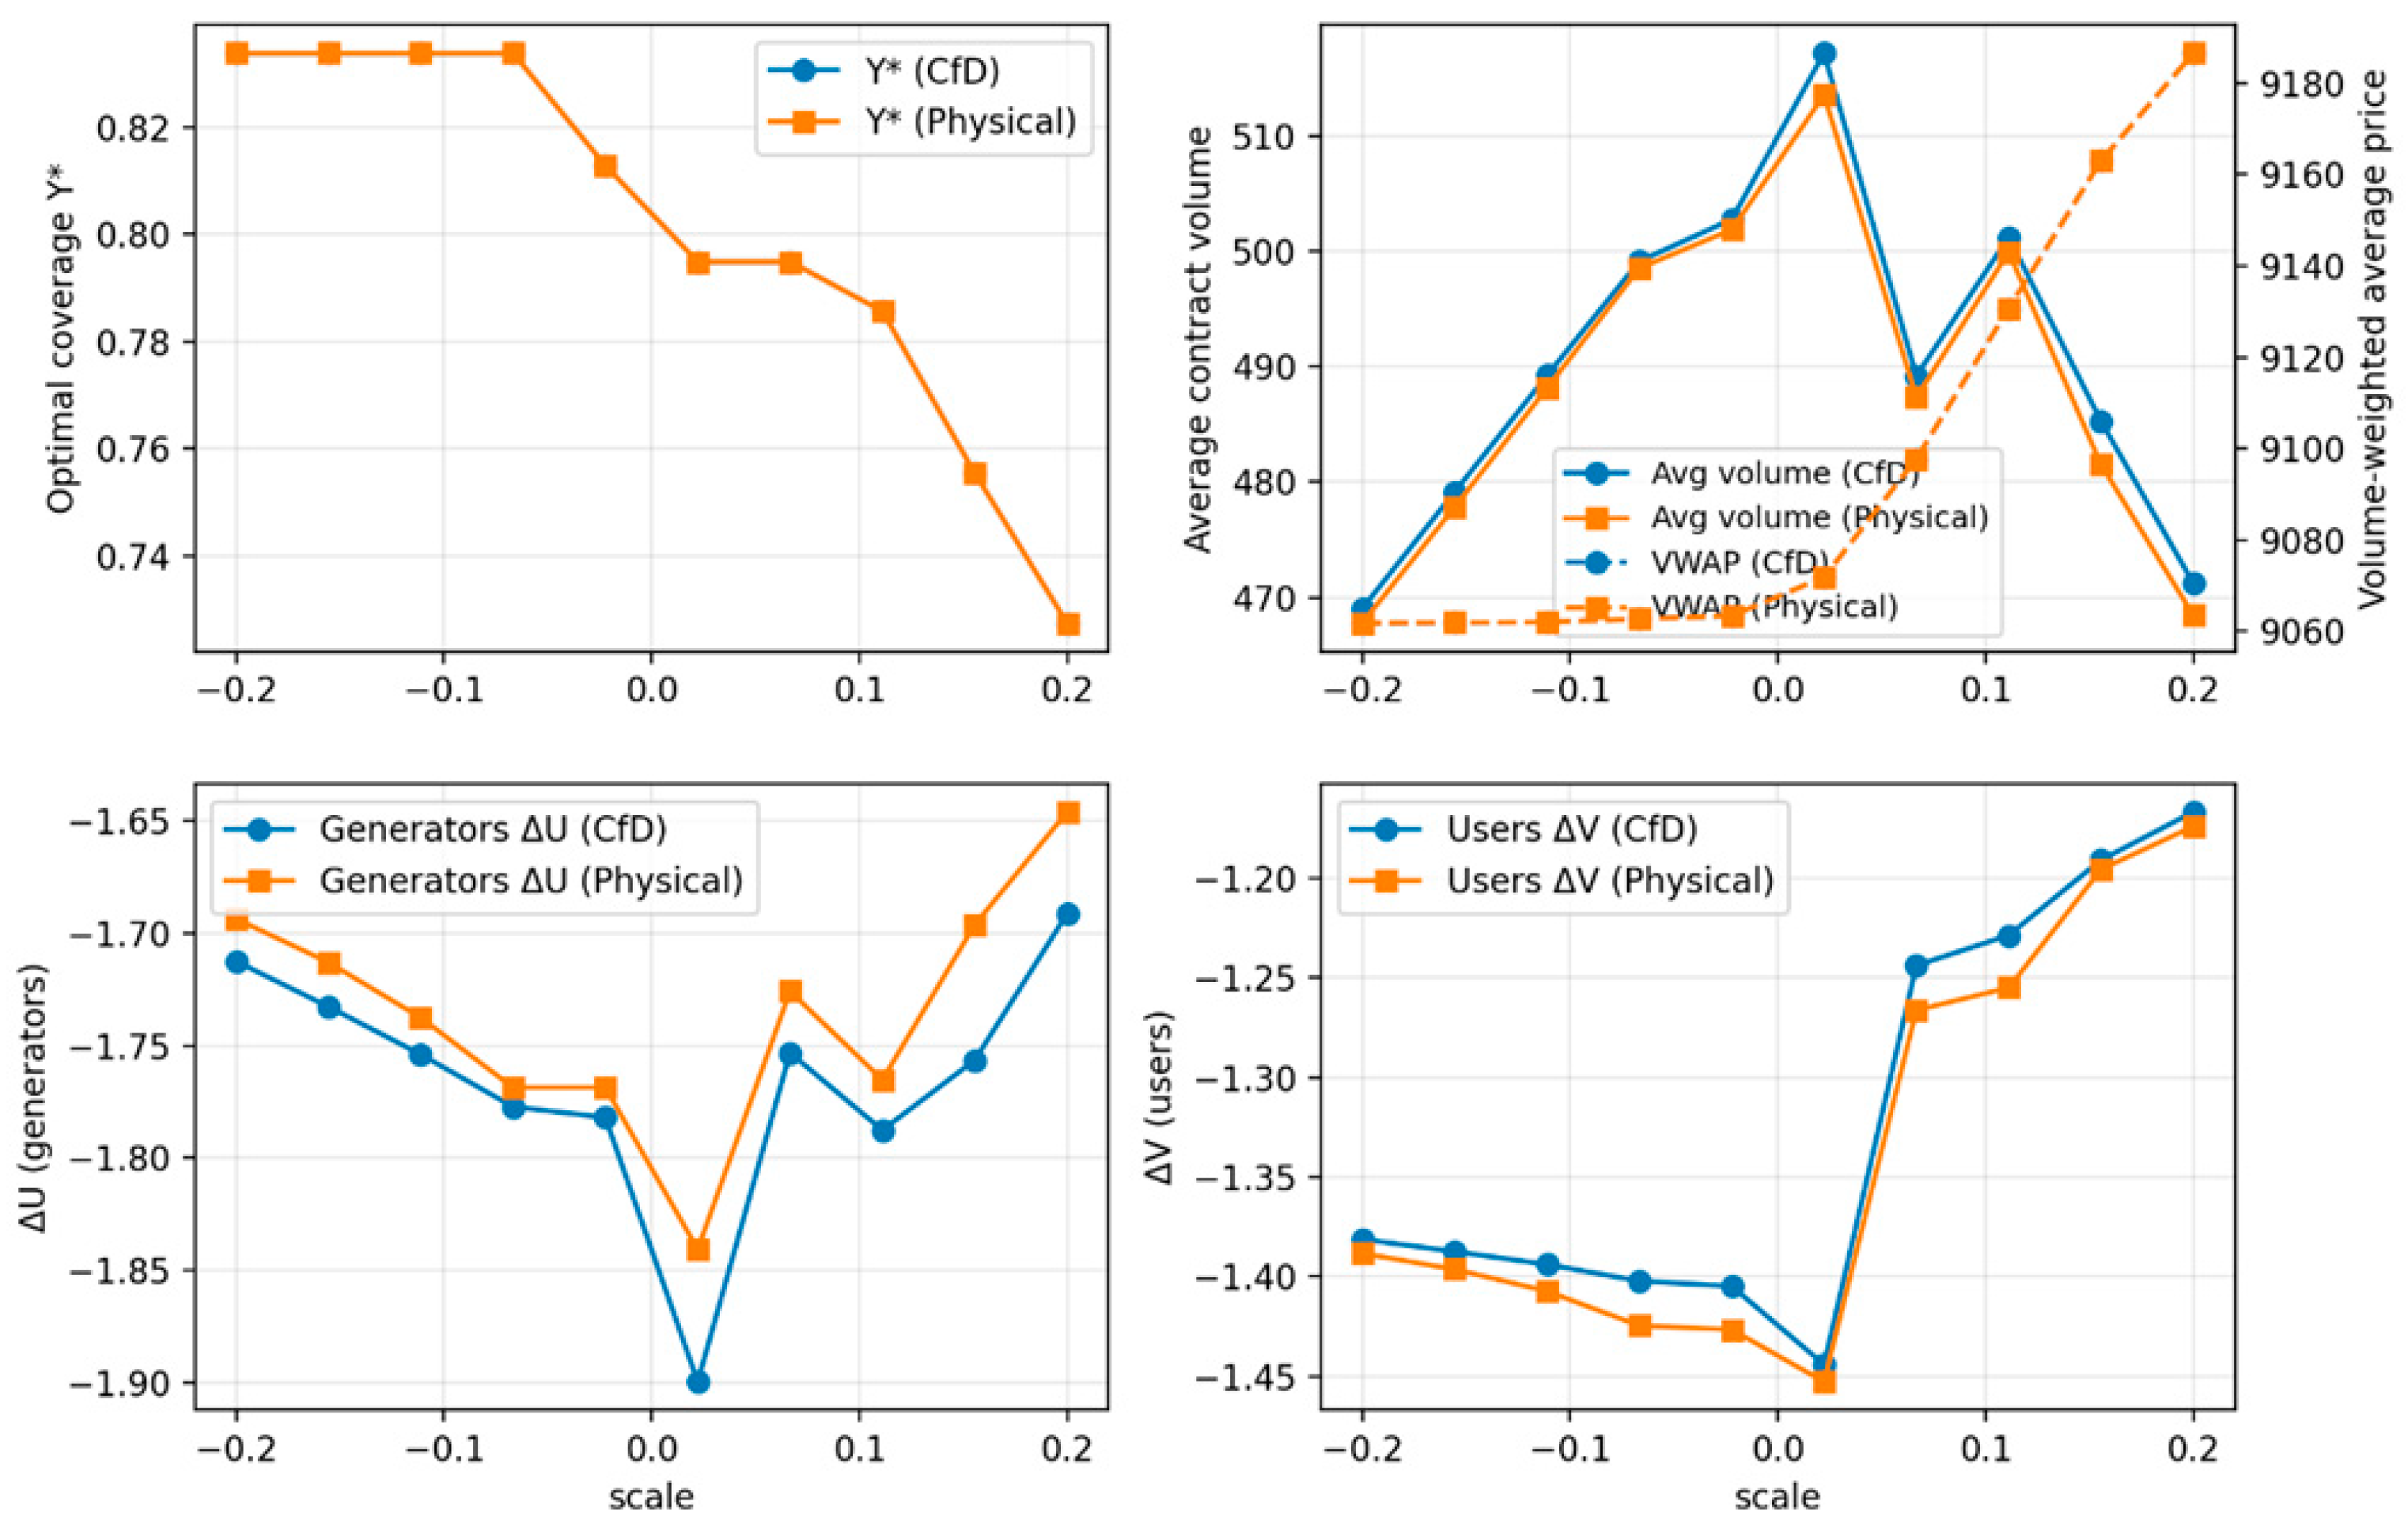
In this study, we adjust load profiles by increasing peak demand by 10% and decreasing valley demand by 10%, simulating market outcomes under different peak–valley amplitudes. We then examine contract coverage, contracted volumes and prices, and payoff improvements for both generators and consumers. Simulation results are shown in Figure 9.
From the top-left panel, it is evident that as the peak–valley difference widens, the optimal contract coverage rate Y * declines significantly—from about 0.83 to 0.74. This indicates that under more extreme load fluctuations, market participants prefer to reduce long-term contract coverage and preserve flexibility to cope with spot market uncertainty. Economically, this suggests that in highly volatile demand systems, over-reliance on long-term contracts may reduce adaptability and risk tolerance, making it necessary to maintain a balanced mix of contracts and spot trading.
The top-right panel shows that average contracted volume first increases and then decreases as peak–valley differences expand, while the volume-weighted average price (VWAP) fluctuates sharply. In particular, under Physical contracts, prices rise steeply during peak periods. This implies that when load profiles are stretched, contract prices become highly sensitive to peak power value, with Physical contracts more directly transmitting peak risks, while CfDs remain relatively stable. From a regulatory perspective, this highlights that in systems with increasingly pronounced peak–valley characteristics, CfDs may play a greater role in stabilizing prices, while Physical contracts require stricter network security constraints and peak–valley pricing designs.
The bottom-left and bottom-right panels depict payoff improvements for generators and consumers. Generator net utility ( Δ U ) fluctuates strongly as the peak–valley difference grows, with “troughs” of utility losses emerging in some cases. By contrast, consumer net utility ( Δ V ) increases steadily. This indicates that when peak demand intensifies, consumers benefit from stable contract prices that shield them from extreme spot prices, while generators face mismatches between contracts and spot revenues, combined with insufficient risk premiums, limiting or even reducing their gains. Economically, this reflects a redistribution effect: consumers emerge as relative beneficiaries, while generators bear greater risks. From a policy perspective, this calls for the incorporation of risk-compensation mechanisms into contract and pricing frameworks—such as differentiated capacity payments or peak–valley spread adjustments—to prevent excessive burdens on generators that could undermine their willingness to contract.
In summary, Figure 9 shows that load peak–valley characteristics have a decisive impact on the optimal coverage and price structure of the MLT contract market. Economically, this demonstrates the need for dynamic complementarity between contracts and spot trading to prevent systemic vulnerabilities during peak demand periods. From a managerial standpoint, it highlights the importance of strengthening demand-side response mechanisms and peak–valley pricing management, in order to maintain market stability while achieving balanced development between supply- and demand-side participants.

4.4. Sensitivity Analysis of Transmission Capacity Constraints

In power system operations, transmission line capacity limits are a critical physical factor affecting both market efficiency and contract execution. When the capacity of key lines decreases, local congestion is more likely to occur, pushing up marginal prices and undermining the deliverability of contracts. Conversely, capacity expansion can ease transmission bottlenecks and enhance overall system flexibility. Thus, variations in transmission capacity not only influence spot market price formation but also alter the effectiveness and economic value of MLT contracts.
In this study, we scale the upper and lower bounds of all transmission line capacities (from 0.5 to 1.2 times the baseline) to simulate market equilibria under different transmission conditions. We then compare financial CfDs and Physical delivery contracts with respect to optimal coverage rates, contracted volumes and prices, and payoff improvements. Results are shown in Figure 10.
From the top-left panel, it can be seen that whether capacity is tightened or relaxed, the optimal contract coverage rate Y * remains stable between 0.79 and 0.80, with almost no significant change. This suggests that, under the system configuration used in this study, adjustments in line capacity have only a limited effect on overall contract coverage. Two factors may explain this: first, contract bargaining is primarily driven by the risk-sharing logic embedded in the mean–variance framework, rather than single-period congestion conditions; second, moderate capacity changes do not alter the system’s fundamental “bottleneck nodes,” and thus do not substantially shift the boundary between the contract and spot markets. Economically, this implies that simply expanding transmission capacity cannot by itself significantly raise the optimal penetration of MLT contracts; improvements in contract design and risk allocation mechanisms are also required.
The top-right panel reveals trends in average contracted volumes and transaction prices. When line capacity is tightened to 0.5–0.7 times the baseline, average contract volumes fall while price volatility increases. Conversely, when capacity expands to 1.1–1.2 times, contract volumes rise markedly and prices decline somewhat. This indicates that transmission expansion facilitates more trading opportunities, boosting contract volumes and helping to stabilize prices. Physical contracts are particularly sensitive to transmission constraints, since their settlement depends on actual deliverability. In practice, this suggests that grid companies and regulators, by expanding transmission capacity, can not only enhance system security but also improve the stability and liquidity of the contract market.
The bottom-left and bottom-right panels show the utility improvements for generators and consumers. As transmission capacity expands, generator net utility ( Δ U ) rises significantly, and consumer net utility ( Δ V ) improves in parallel. This demonstrates that expansion enables electricity resources to be allocated more efficiently across the system, reducing congestion losses for generators and lowering the disutility consumers face from purchasing at higher prices. Economically, this highlights the crucial role of the transmission network in shaping market efficiency; managerially, it emphasizes the positive feedback loop between “network investment and market efficiency”: appropriate transmission expansion is not only an engineering goal for grid operators but also an institutional safeguard for healthy electricity market development.
In summary, Figure 10 shows that while transmission capacity has a notable impact on market prices and utility distribution, its effect on overall contract coverage is relatively limited. This implies that electricity market design should integrate transmission planning with contract market development: capacity expansion can improve overall resource allocation efficiency, while contract mechanisms distribute risk and returns—together achieving the dual goals of market stability and efficiency enhancement.

4.5. Sensitivity Analysis of Risk Aversion Parameters

In electricity market negotiations, participants’ risk preferences are a key factor shaping contract structures and transaction outcomes. Higher risk aversion means that both generators and consumers are more inclined to use medium- and long-term (MLT) contracts to hedge against price volatility, whereas higher risk tolerance increases their willingness to participate in spot market competition.
In this study, we scale the risk aversion coefficients γ ,   η between 0.5 and 3 times their baseline values, examining how different risk preferences affect contract coverage, transaction volumes and prices, as well as payoff improvements for generators and consumers. We also compare outcomes under financial CfD and Physical delivery contracts. The simulation results are shown in Figure 11.
From the top-left panel, we observe that regardless of how risk aversion parameters change, the optimal contract coverage rate Y * remains stable around 0.79–0.80. This indicates that within the framework of this study, risk preferences do not significantly alter overall contract penetration. Instead, contract coverage is determined more by fundamental supply–demand conditions and network constraints than by subjective attitudes toward risk. For regulators, this suggests that simply “educating” market participants to become more risk-aware may not be sufficient to shift the share of the contract market; institutional design to improve market fundamentals is also necessary.
The top-right panel shows how average contract volumes and transaction prices evolve with risk aversion. As risk aversion increases, contract volumes decline while prices gradually fall, with Physical contracts showing more pronounced volatility. This reflects that when both sides overemphasize risk hedging, their willingness to contract may rise, but because both demand additional risk premia in bargaining, the equilibrium results in fewer contracts and more conservative prices. This reveals a “risk premium paradox” observed in practice: excessive risk aversion can reduce both the depth and liquidity of the contract market.
The bottom-left and bottom-right panels illustrate payoff improvements ( Δ U ,   Δ V ) for generators and consumers. As γ ,   η increase, both parties’ utilities improve significantly, especially between 0.5 and 2 times the baseline. This shows that risk-averse participants derive greater benefits from contracts, and the contract mechanism indeed provides substantial hedging value. Economically, this confirms that the contract market functions effectively as a risk management tool, creating additional welfare for risk-averse participants. From a governance perspective, it suggests that policymakers can promote market stability by introducing more flexible contract forms and risk-sharing mechanisms that encourage participants to engage in long-term contracting.
In summary, Figure 11 shows that while the degree of risk aversion has little effect on overall contract coverage, it significantly influences contract volumes, price levels, and welfare distribution. Economically, this underscores the role of the contract market as a risk management instrument; managerially, it highlights the importance of institutional design and incentive mechanisms. With well-designed market rules, participants with diverse risk preferences can find appropriate positions in the contract market, thereby enhancing both efficiency and stability in the electricity market.

5. Conclusions

With the steady progress toward China’s dual-carbon goals of “carbon peaking and carbon neutrality,” electricity market reform has been deepening, and the coordination between MLT contracts and the spot market has become a critical factor for both system efficiency and renewable energy integration. At present, MLT contracts dominate China’s electricity trading structure, while the spot market remains in a pilot stage. Policy regulations typically require that MLT contracts account for around 90% of traded electricity, in order to ensure system security and market stability. However, as renewable energy capacity expands rapidly and marginal generation costs decline sharply, the traditional structure of “long-term as the mainstay, spot as a supplement” faces challenges: an excessively high share of MLT contracts may constrain price discovery and limit renewable integration, while an overly low share may amplify price volatility risks in the spot market. Determining the optimal proportion between MLT and spot trading—and its economic and policy implications—has therefore become a pressing issue.
To address this, this study develops a three-layer optimization model to examine MLT–spot interactions under renewable market integration. The first layer simulates spot market clearing using DC-OPF, capturing generator dispatch and nodal price formation. The second layer applies a Nash bargaining framework to model bilateral contract negotiations between generators and consumers, incorporating mean–variance utility, risk aversion, and disagreement payoffs. The third layer introduces two indicators—volume proportion (contract penetration rate) and economic proportion (effective penetration rate)—and formulates a nested optimization structure, where the outer layer searches for the optimal contract coverage and the inner layer optimizes contract allocation and pricing. By combining parameter estimation with Monte Carlo simulation, the model evaluates market structure, risk-sharing, and economic efficiency under stochastic environments, providing a quantitative tool for electricity market design.
The results show that, with rising renewable penetration, a moderate increase in the share of spot trading can significantly improve system efficiency. This is because renewable energy, with near-zero marginal costs, plays a larger role in the spot market as its proportion rises, thereby lowering overall generation costs and enhancing economic performance. Further simulations demonstrate that relaxing the conventional “90% MLT contract” requirement is both feasible and beneficial. In regions with high renewable penetration, artificially restricting spot trading to just 10% of total transactions may reduce renewables’ marginal competitiveness, inflate contract prices, and lower system efficiency. By contrast, increasing the share of spot trading not only reduces overall electricity costs but also provides greater space for renewable integration, alleviating curtailment of wind and solar. Looking ahead, as flexible resources and market mechanisms mature, the spot market will play an increasingly central role in both renewable integration and system cost optimization.
Based on these findings, several policy recommendations are proposed: (1) Gradually relax rigid requirements on MLT contract proportions and explore more flexible market structures, allowing the balance between MLT and spot trading to be determined endogenously through competition and risk management. (2) Strengthen spot market development by improving price mechanisms and ancillary service markets, thereby increasing renewable participation in spot trading and fully realizing its cost advantages. (3) Encourage diversified contract designs—such as CfDs, physical delivery contracts, and green certificate-linked contracts—to meet heterogeneous risk management needs among market participants. (4) Reinforce transmission and flexibility investments to ensure that higher spot market shares do not compromise grid security and system stability. (5) Establish a more transparent and flexible regulatory framework to provide stable expectations for participants, thereby promoting the coordinated development of MLT and spot markets.
Despite offering a systematic modeling framework and several insightful conclusions, this study has limitations. First, risk modeling relies primarily on mean–variance utility functions, which, while intuitive and tractable, do not adequately capture tail risks. Future work could incorporate Conditional Value-at-Risk or dynamic risk measures. Second, the simulation scope remains limited, without covering larger-scale interregional or multi-market coupling scenarios. Future research may leverage broader real-world grid data and adopt multi-agent simulations or reinforcement learning-based dynamic game approaches to further enhance applicability and policy relevance.

Author Contributions

Conceptualization, Y.W.; Methodology, X.Z.; Software, H.Y.; Validation, L.Y.; Formal analysis, M.W.; Investigation, Y.W.; Resources, X.Z.; Data curation, L.Y.; Writing—original draft, M.W.; Writing—review & editing, H.Y.; Visualization, Y.W.; Supervision, X.Z.; Project administration, L.Y.; Funding acquisition, Y.W. All authors have read and agreed to the published version of the manuscript.

Funding

This research received no external funding.

Data Availability Statement

The data presented in this study are available on request from the corresponding author. The data are not publicly available due to the data sources already being indicated in Table 1 and the compiled data being extensive.

Conflicts of Interest

Authors Yushi Wu, Xia Zhao and Libin Yang were employed by the Central China Branch of State Grid Corporation of China. The remaining authors declare that the research was conducted in the absence of any commercial or financial relationships that could be construed as a potential conflict of interest.

Appendix A

Algorithm A1: End-to-End Solver (Spot–Contract Co-Optimization)
Inputs:
S ,   T ,   s e e d / / number   of   scenarios ,   periods ,   RNG   seed (Enter the number of scenarios, time periods, and random number seed for the simulation.)
FuelParams κ F ,   θ F ,   σ F ,   ln P 0 (Mean-reverting parameter for fuel prices.)
RESParams κ w , σ w ; κ p , σ p ; { c w , t ¯ } , { c p , t ¯ } (Mean reversion and fluctuation parameters of wind power and photovoltaic power.)
DemandParams { μ b , t } , κ D , b , σ D , b , b (Dynamic mean and fluctuation parameters of load demand.)
GridData B ,   L ,   H ,   F ¯ (Grid topology data, including busbar set, line set, PTDF coefficient, and transmission capacity upper limit.)
U n i t s ( g e n s ,   u s e r s ,   b u s   m a p p i n g ,   P m a x ,   H R ,   V O M ,   b q u a d ) (Parameter information of the unit and the user, including capacity limit, heat rate, variable cost, etc.)
RiskPref { γ i } ,   { η u } ,   { ω i } ,   { ν u } ,   β (The risk aversion coefficient and negotiation weight of power generators and users.)
Outputs:
       Y CfD * ,   Q CfD * ,   F CfD * ,   Y Phy * ,   Q Phy * ,   F Phy * ,   λ s , t ,   π b , s , t ,   q g , s , t s p o t
Output the optimal contract ratio, contract volume and price, as well as spot energy price, node electricity price and unit output.
Steps:
1. Generate Monte Carlo scenario paths for fuel prices, wind speed, irradiance, and loads based on input parameters
2. The DC optimal power flow (DC-OPF) is run in all scenarios and time periods to obtain the energy price, node electricity price and maximum power generation.
3. Calculate the benchmark load demand as a reference path for the contract market.
4. Setting reference price: CfD uses the unified energy price of the entire network, and Physical uses the average of node electricity prices as the hub.
5. Searches for the optimal contract coverage ratio for financial contracts for difference (CfDs) and outputs the contract volume and price.
6. Searches for the optimal contract coverage ratio for physically delivered contracts (Physical) and outputs the contract volume and price.
7. Returns all results, including optimal contract solutions for CfDs and Physicals, as well as spot market clearing results.
Algorithm A2: Generate Scenarios (Fuel, RES, Demand)
Inputs: as in Algorithm A1
Outputs:  ln P s , t ;   P s , t ;   c f w i n d ;   c f p v ;   d e m a n d b s , t
1 : for   s = 1 , , S   do
2 :         ln P s , 1 ln P 0
3 :         for   t = 2 , , T   do
4 :               ln P s , t ln P s , t 1 + κ F θ F ln P s , t 1 + σ F ξ t , ξ t N 0,1
5 :         P s , t exp ln P s , t
6 :         ε s , 1 w 0 ; ε s , 1 p 0
7 :         for   t = 2 , , T   d o
8 :               ε s , t w ε s , t 1 w + κ w 0 ε s , t 1 w + σ w ζ t , ζ t N 0,1
9 :               ε s , t p ε s , t 1 p + κ p 0 ε s , t 1 p + σ p η t , η t N 0,1
10 :         c f s , t w i n d c l i p c w , t ¯ + ε s , t w , 0 , 1
11 :         c f s , t p v c l i p c p , t ¯ + ε s , t p , 0 , 1
12 : for   each   bus   b B   do
13 :         for   s = 1 , , S   do
14 :                 ε b , s , 1 D 0
15 :                 for   t = 2 , , T   do
16 :                          ε b , s , t D ε b , s , t 1 D + κ D , b 0 ε b , s , t 1 D + σ D , b χ t , χ t N 0,1
17 :                  d e m a n d b s , t μ b , t + ε b , s , t D
18 :   return   all   simulated   paths
Algorithm A3: DCOPF_One Period (Cost-Minimizing, DC-flow)
Inputs:  a i t , b i t (thermal); q ¯ i t R E S (RES); demand d b t ; GridData; Units
Outputs:  λ t , π b t , q i t
1: Variables:
         q i t   0 for all gens i
         y b t c (net injection at bus b)
         f (line flows), l s b ≥0 (load shed), s p b ≥0 (spillage)
2: Objective:
                           min i t h e r m a l a t i q i + 0.5 b i q i 2 + V O L L b l s b + ρ s p b s p b
3: Constraints:
                               y b = i : a t b q i d b , t + l s b s p b | , b
                                                      b y b = 0
                                                f = H y , F ¯ f F ¯
                                        0 q i P m a x i , i t h e r m
                                        0 q i q t R E S ¯ i , i R E S
4: Solve   QP ,   read   duals   of   ( nodal   balance ) π b , t
5: λ t average b π b , t , ( or   select   reference - bus   LMP )
6: return   λ t , { π b , t } , { q i , t * }
Algorithm A4: Inner Nash_Quantities (Step-1 Quantities, Convex QP)
Inputs: coverage Y , demand path D t
Outputs: Q i u , t * , K i , t * , L u , t *
1 : X t Y   D t
2 : Σ r a w C o v s   R E F p r i c e s
3 : Σ NearestPSD 1 2 Σ raw + Σ raw T
4 : Q i , u , t 0 ; K i , t = u Q i , u , t , L u , t = i Q i , u , t
5 : i K i , t = u L u , t X t , t
      0 K i , t K i , t m a x , i
      if   c o n t r a c t _ t y p e = P h y s i c a l :
             y b , t c = i : a t b K i , t u : a t b L u , t , b y b , t c = 0
             f t c = H y , t c , F c ¯ f t c F c ¯
6 : R I S K = 0.5 i γ i K i T Σ K i + 0.5 u η u L u T Σ L u |
7 : P E N = ρ t m a x 0 , X t i K i , t
8 : min R I S K + P E N
9 : Solve   QP   Q * , K * , L * ; return   Q * , K * , L * , Σ
Algorithm A5: Inner Nash_Price Split (Step-2 Constant Price Splitting)
Inputs:  Q i u , t * , R E F p r i c e s s , t , Units, RiskPref
Outputs:  F i u * (constant bilateral prices)
1 : E t ^ mean s R E F p r i c e s s , t
2 :   for   each   generator - user   pair   i , u :
3 :          S i , u t Q i , u , t *
4 :          if   S i , u 0    then   continue
5 :         Δ U i , Δ V u   taken   as   baseline   surplus   shares   ( from   Step - 1   or   normalized   values )
6 :          F i , u * mean t E t ^ + ω i Δ V u ν u Δ U i S i , u ω i + ν u
7 :   return   { F i , u * }
Algorithm A6: Outer Search Y
Inputs:  D t , R E F p r i c e s , contract_type, GridData, Units, RiskPref
Outputs: (Y*, Q*, F*)
1 :   if   Y c a p 0   then   report   infeasible
2 : Y L 0 , Y H max 0 , Y c a p ε
3 :   while   Y H Y L > 0    do
4 :            Y m i d 0.5 Y L + Y H
5 :           Q mid , K mid , L mid , Σ mid InnerNas h _ Quantities Y mid , D t , K m a x , R E F , c o n t r a c t _ t y p e ,
6 :           F m i d I n n e r N a s h _ P r i c e S p l i t Q m i d , R E F , U n i t s , R i s k P r e f
7 :            if   F e a s i b l e A n d E c o n o m i c a l Q m i d , F m i d   t h en
8 :                      Y L , B e s t Y m i d , Q m i d , F m i d
9 :             else  
10 :                    Y H Y m i d
11 :   return   Y L , B e s t . Q , B e s t . F

References

  1. Yang, Y.; Lo, K. China’s renewable energy and energy efficiency policies toward carbon neutrality: A systematic cross-sectoral review. Energy Environ. 2024, 35, 491–509. [Google Scholar] [CrossRef]
  2. De La Peña, L.; Guo, R.; Cao, X.; Ni, X.; Zhang, W. Accelerating the energy transition to achieve carbon neutrality. Resour. Conserv. Recycl. 2022, 177, 105957. [Google Scholar] [CrossRef]
  3. Li, S.; Zhang, S.; Andrews-Speed, P. Using diverse market-based approaches to integrate renewable energy: Experiences from China. Energy Policy 2019, 125, 330–337. [Google Scholar] [CrossRef]
  4. an, S.; Wang, W.; Li, X.; He, H.; Zhao, X. Research on cross-provincial power trading strategy considering the medium and long-term trading plan. Sci. Rep. 2024, 14, 30137. [Google Scholar]
  5. Khorasany, M.; Mishra, Y.; Ledwich, G. Market framework for local energy trading: A review of potential designs and market clearing approaches. IET Gener. Transm. Distrib. 2018, 12, 5899–5908. [Google Scholar] [CrossRef]
  6. Li, Y.; Xue, W.; Zhang, Y.; Zheng, X.; Yang, L. Promoting the sustainable development of the provincial electricity spot market: Supervision obstacle identification, analysis, and solutions based on the ISM-DEMATEL model. Front. Energy Res. 2025, 13, 1544722. [Google Scholar] [CrossRef]
  7. Powers, D. Fighting the Wrong Fight: Why the MLP Parity Act Is a Misguided Attempt at Achieving Renewable Energy Capital Raising Parity. Sustain. Dev. Law Policy 2017, 17, 5. [Google Scholar]
  8. Wang, M.; Song, Y.; Sui, B.; Wu, H.; Zhu, J.; Jing, Z.; Rong, Y. Comparative study of pricing mechanisms and settlement methods in electricity spot energy market based on multi-agent simulation. Energy Rep. 2022, 8, 1172–1182. [Google Scholar] [CrossRef]
  9. Li, X.; Wei, X.; Zhou, H.; Ding, Y.; Yang, B.; Wang, C. Study on Medium-and Long-term Market Trading Curve Adapted to Spot Market. In Proceedings of the 2024 7th International Conference on Energy, Electrical and Power Engineering (CEEPE), Yangzhou, China, 26–28 April 2024; pp. 1688–1693. [Google Scholar]
  10. Jing, Z.; Pan, J.; Ji, T. Medium and Long-Term Markets in a Hybrid Electricity Market: Definition, Challenges, and Recommendations to Guangdong Electricity Market. Chall. Recomm. Guangdong Electr. Market. 2024. [Google Scholar]
  11. Fu, X.; Wang, Z.; Guo, Y.; Li, W.; Tang, Z. Intra-provincial Medium-and Long-term Bidding Model Incorporating Inter-provincial Markets and Available Transmission Capacity. IEEE Trans. Energy Mark. Policy Regul. 2024, 3, 109–120. [Google Scholar] [CrossRef]
  12. Zhai, Z.; Zhang, L.; Wang, Y.; Hou, X.; Yang, Q. Optimization of Power Generation Structure and Electricity Transmission Pattern in China Based on the Electricity-Carbon Coordinated Market. Renew. Energy 2025, 252, 123359. [Google Scholar] [CrossRef]
  13. Liu, S.; Cai, B.; Gao, M.; Wu, Y.; Chen, K.; Zhu, X.; He, S. Empirical evidence for the edge of a centralized regional market over a cross-province balancing market in allocating electricity resources: A case study of Yunnan in China. Energy Rep. 2023, 9, 911–921. [Google Scholar] [CrossRef]
  14. Wang, M.; Xin, L.; Jin, Y.; Xu, J.; Chen, Y.; Wang, W.; Yang, B.; Wang, P. Two-Stage Bi-Level Multi-Objective Optimization Model for Equilibrium Analysis of Electricity and Carbon Markets. In Proceedings of the 2025 2nd International Conference on Smart Grid and Artificial Intelligence (SGAI), Changsha, China, 21–23 March 2025; pp. 452–457. [Google Scholar]
  15. Wang, P.; Wang, W.; Jiang, K.; Cheng, Y.; Zhang, T.; Li, X. Modeling the coupling of China’s multi-timescale electricity markets during the transition towards decarbonization and marketization. Energy 2025, 319, 134938. [Google Scholar] [CrossRef]
  16. Alishahi, E.; Moghaddam, M.P.; Sheikh-El-Eslami, M.K. A system dynamics approach for investigating impacts of incentive mechanisms on wind power investment. Renew. Energy 2012, 37, 310–317. [Google Scholar] [CrossRef]
  17. Ozcan, M. Assessment of renewable energy incentive system from investors’ perspective. Renew. Energy 2014, 71, 425–432. [Google Scholar] [CrossRef]
  18. Kim, Y.S.; Park, G.H.; Kim, S.W.; Kim, D. Incentive design for hybrid energy storage system investment to PV owners considering value of grid services. Appl. Energy 2024, 373, 123772. [Google Scholar] [CrossRef]
  19. Keppler, J.H. Rationales for capacity remuneration mechanisms: Security of supply externalities and asymmetric investment incentives. Energy Policy 2017, 105, 562–570. [Google Scholar] [CrossRef]
  20. Aquila, G.; de Oliveira Pamplona, E.; de Queiroz, A.R.; Junior, P.R.; Fonseca, M.N. An overview of incentive policies for the expansion of renewable energy generation in electricity power systems and the Brazilian experience. Renew. Sustain. Energy Rev. 2017, 70, 1090–1098. [Google Scholar] [CrossRef]
  21. Tarashandeh, N.; Karimi, A. Utilization of energy storage systems in congestion management of transmission networks with incentive-based approach for investors. J. Energy Storage 2021, 33, 102034. [Google Scholar] [CrossRef]
  22. Onofri, L. Contracts, investment incentives and efficiency in the restructured electricity market. Eur. J. Law Econ. 2003, 16, 23–28. [Google Scholar] [CrossRef]
  23. Onifade, T.T. Hybrid renewable energy support policy in the power sector: The contracts for difference and capacity market case study. Energy Policy 2016, 95, 390–401. [Google Scholar] [CrossRef]
  24. Kitzing, L.; Held, A.; Gephart, M.; Fabian, W.; Vasilios, A.; Corinna, K. Contracts-for-Difference to Support Renewable Energy Technologies: Considerations for Design and Implementation; European University Institute: Florence, Italy, 2024. [Google Scholar]
  25. Bunn, D.; Yusupov, T. The progressive inefficiency of replacing renewable obligation certificates with contracts-for-differences in the UK electricity market. Energy Policy 2015, 82, 298–309. [Google Scholar] [CrossRef]
  26. Beiter, P.; Guillet, J.; Jansen, M.; Wilson, E.; Kitzing, L. The enduring role of contracts for difference in risk management and market creation for renewables. Nat. Energy 2024, 9, 20–26. [Google Scholar] [CrossRef]
  27. Wild, P. Determining commercially viable two-way and one-way ‘Contract-for-Difference’ strike prices and revenue receipts. Energy Policy 2017, 110, 191–201. [Google Scholar] [CrossRef]
  28. Simshauser, P. On the stability of energy-only markets with government-initiated contracts-for-differences. Energies 2019, 12, 2566. [Google Scholar] [CrossRef]
  29. Liang, Z.; Yin, X.; Chung, C.Y.; Rayeem, S.K.; Chen, X.; Yang, H. Managing Massive RES Integration in Hybrid Microgrids: A Data-Driven Quad-Level Approach With Adjustable Conservativeness. IEEE Trans. Ind. Inform. 2025, 21, 7698–7709. [Google Scholar] [CrossRef]
  30. Liang, Z.; Chen, H.; Wang, X.; Chen, S.; Zhang, C. Risk-based uncertainty set optimization method for energy management of hybrid AC/DC microgrids with uncertain renewable generation. IEEE Trans. Smart Grid 2019, 11, 1526–1542. [Google Scholar] [CrossRef]
  31. Zhang, C.; Chen, H.; Shi, K.; Liang, Z.; Mo, W.; Hua, D. A multi-time reactive power optimization under interval uncertainty of renewable power generation by an interval sequential quadratic programming method. IEEE Trans. Sustain. Energy 2018, 10, 1086–1097. [Google Scholar] [CrossRef]
  32. Chakraborty, G.; Chandrashekhar, G.R.; Balasubramanian, G. Measurement of extreme market risk: Insights from a comprehensive literature review. Cogent Econ. Financ. 2021, 9, 1920150. [Google Scholar] [CrossRef]
  33. Liang, Z.; Chen, H.; Chen, S.; Wang, Y.; Zhang, C.; Kang, C. Robust transmission expansion planning based on adaptive uncertainty set optimization under high-penetration wind power generation. IEEE Trans. Power Syst. 2020, 36, 2798–2814. [Google Scholar] [CrossRef]
  34. Yu, H.; Chung, C.Y.; Wong, K.P.; Zhang, J.H. A chance constrained transmission network expansion planning method with consideration of load and wind farm uncertainties. IEEE Trans. Power Syst. 2009, 24, 1568–1576. [Google Scholar] [CrossRef]
  35. Liu, J.; Chen, Y.; Duan, C.; Lin, J.; Lyu, J. Distributionally robust optimal reactive power dispatch with Wasserstein distance in active distribution network. J. Mod. Power Syst. Clean Energy 2020, 8, 426–436. [Google Scholar] [CrossRef]
  36. Cao, X.; Sun, X.; Xu, Z.; Zeng, B.; Guan, X. Hydrogen-based networked microgrids planning through two-stage stochastic programming with mixed-integer conic recourse. IEEE Trans. Autom. Sci. Eng. 2021, 19, 3672–3685. [Google Scholar] [CrossRef]
  37. Zhao, N.; You, F. Sustainable power systems operations under renewable energy induced disjunctive uncertainties via machine learning-based robust optimization. Renew. Sustain. Energy Rev. 2022, 161, 112428. [Google Scholar] [CrossRef]
  38. Li, B.; Tan, Y.; Wu, A.-G.; Duan, G.-R. A distributionally robust optimization based method for stochastic model predictive control. IEEE Trans. Autom. Control 2021, 67, 5762–5776. [Google Scholar] [CrossRef]
  39. Aranha, A.S.; Street, A.; Fernandes, C.; Granville, S. Risk-constrained optimal dynamic trading strategies under short-and long-term uncertainties. IEEE Trans. Power Syst. 2022, 38, 1474–1486. [Google Scholar] [CrossRef]
  40. Poursoltani, M.; Delage, E. Adjustable robust optimization reformulations of two-stage worst-case regret minimization problems. Oper. Res. 2022, 70, 2906–2930. [Google Scholar] [CrossRef]
  41. Luo, F.; Mehrotra, S. Distributionally robust optimization with decision dependent ambiguity sets. Optim. Lett. 2020, 14, 2565–2594. [Google Scholar] [CrossRef]
  42. Wang, Y.; Wu, L.; Wang, S. A fully-decentralized consensus-based ADMM approach for DC-OPF with demand response. IEEE Trans. Smart Grid 2016, 8, 2637–2647. [Google Scholar] [CrossRef]
  43. Haar, L. Design flaws in united kingdom renewable energy support scheme. Energies 2021, 14, 1657. [Google Scholar] [CrossRef]
  44. Meyer-Brandis, T.; Tankov, P. Multi-factor jump-diffusion models of electricity prices. Int. J. Theor. Appl. Financ. 2008, 11, 503–528. [Google Scholar] [CrossRef]
  45. Mari, C.; Baldassari, C. Ensemble methods for jump-diffusion models of power prices. Energies 2021, 14, 2084. [Google Scholar] [CrossRef]
  46. Andersen, L.; Andreasen, J. Jump-diffusion processes: Volatility smile fitting and numerical methods for option pricing. Rev. Deriv. Res. 2000, 4, 231–262. [Google Scholar] [CrossRef]
  47. Maqbool, A.S.; Baetens, J.; Lotfi, S.; Vandevelde, L.; Van Eetvelde, G. Assessing financial and flexibility incentives for integrating wind energy in the grid via agent-based modeling. Energies 2019, 12, 4314. [Google Scholar] [CrossRef]
  48. Hussain, M.S.; Cho, K.; Park, S. Resource Adequacy and Integration of Renewables in Light of US, EU, and Pakistan’s Evolving Power Sector. Energies 2024, 17, 5051. [Google Scholar] [CrossRef]
Figure 1. Coal price trends.
Energies 18 06085 g001
Figure 2. Average wind speed.
Energies 18 06085 g002
Figure 3. Average temperature.
Energies 18 06085 g003
Figure 4. Typical load curves.
Energies 18 06085 g004
Figure 5. Irradiance.
Energies 18 06085 g005
Figure 6. Fitting results.
Energies 18 06085 g006
Figure 7. Sensitivity Analysis of Coal Price Volatility.
Energies 18 06085 g007
Figure 8. Sensitivity Analysis of Wind and Solar Output Uncertainty.
Energies 18 06085 g008
Figure 9. Sensitivity Analysis of Load Peak–Valley Variations.
Energies 18 06085 g009
Figure 10. Sensitivity Analysis of Transmission Capacity Constraints.
Energies 18 06085 g010
Figure 11. Sensitivity Analysis of Risk Aversion Parameters.
Energies 18 06085 g011
Table 1. Empirical parameter estimates for stochastic processes and representative generator characteristics.
Process κ θ σ AR(1) R 2
Coal price0.00106.49330.00600.91930.9995
wind0.38420.0010.26420.68090.8637
pv0.08990.0010.02870.91390.8353
load0.0841 23.50980.91930.8941
Disclaimer/Publisher’s Note: The statements, opinions and data contained in all publications are solely those of the individual author(s) and contributor(s) and not of MDPI and/or the editor(s). MDPI and/or the editor(s) disclaim responsibility for any injury to people or property resulting from any ideas, methods, instructions or products referred to in the content.