


Abstract
Rising global population, socioeconomic development, industrialisation, lifestyle changes, mobility, and transportation all depend on fossil fuels. This reliance creates environmental pollution, CO2 emissions, depletion of fossil fuel resources, energy insecurity, and increased financial and environmental costs. Renewable energy sources, especially wind, provide a viable alternative to fossil fuels, decreasing reliance on them and mitigating environmental impacts. Despite considerable advances in the use of renewable wind energy for power generation, significant challenges persist in realising the full potential of this promising energy source. Therefore, the purpose of this study is to thoroughly examine global wind power generation, its distribution by region, and the challenges associated with using wind energy, such as issues with the global supply chain, equipment manufacturers, rare earth materials required for wind turbines, and a lack of skilled workforces in the wind energy sector. The major finding and novelty of the study includes a national action plan for wind power generation that encompasses diverse tasks and activities, which can be tailored to the specific requirements of a country. Additionally, the study proposed a classification of countries into six groups based on the availability of specific energy types within their national jurisdictions, aiming for an optimal energy mix to achieve energy security, sustainability, and climate impact mitigation. The other contribution of the study is outlining present difficulties, their origins, and potential solutions that governments, legislators, and other wind power stakeholders encounter while formulating strategies for wind power generation.
1. Introduction
The shift in the global energy system towards cost-effective, reliable, and green sources is a significant objective of the United Nations Framework Convention on Climate Change (UNFCCC) and its Conferences of Parties (COP), the Kyoto Protocol, the Paris Agreement, and the UN Sustainable Development Goals (SDGs). Wind energy is crucial to the transformation of global energy systems to reduce greenhouse gas emissions and mitigate climate change. Harnessing wind energy for commercial power generation has rapidly become more common and has become a more competitive and substantial source of electricity, especially in areas with abundant wind resources. The increasing demand for green energy, advancements in technology, and reduced costs are considered the main reasons for this rapid expansion of wind power generation [1]. Following four decades of research and technological advancement, the worldwide commercial wind industry has exceeded the notable threshold of over 1202 gigawatts (GW) in 2024 and is projected to cross 2000 GW by 2030 [2]. Global cumulative installed wind power increased from a mere 17 GW in 2000 to an extraordinary 1202 GW by the end of 2024, as illustrated in Figure 1. The figure illustrates that, compared to the year 2000, installed wind power generation capacity rose by a factor of 10.6 in 2010, 34 in 2020, and 70.7 in 2024. Wind power has grown so quickly that it is now the most important source of renewable energy in the world. It has even grown faster than hydropower [3].
Figure 1.
World’s cumulative installed wind power from 2000 to 2024, data source [2,3,4,5,6].
While offshore wind power generation is still relatively small compared to onshore wind power generation, it has grown substantially in the last decade. As offshore wind provides significantly higher potential for power generation compared to onshore wind energy, it can facilitate achieving carbon neutrality by 2050—a commitment shared by most countries. In this scenario, a fast and massive expansion in offshore installed wind power generation capacity is widely expected over the coming decades. According to the International Energy Agency (IEA) [7,8] and the International Renewable Energy Agency (IRENA) [9], to fulfil the total need for offshore wind power generation, the installed capacity had to be 80 GW in 2022 and will need to be 500 GW by 2050. The global installed offshore wind power generation reached 62 GW in 2022, indicating a shortfall of 18 GW as shown in Figure 2 [2,3]. Despite the data demonstrating a significant increase over the decade (the installed offshore wind power capacity expanded 11.3 times in 2020 and 27.7 times in 2024 compared to 2010), this value still represents only 6.9% of the onshore installed wind power capacity.
Figure 2.
World’s cumulative installed offshore wind power from 2009 to 2024, data source [4,5,10].
Global wind turbine technology has experienced tremendous sophistication and technological advancement, with larger turbines becoming more powerful and more efficient, leading to increased wind power generation [1]. In 2023, the average capacity of newly erected wind turbines in the US was 3.4 MW and in Australia 3 MW, up 5% from 2022 and 375% since 1998. Wind turbines installed in China, Europe, and India have an average capacity of 3 MW, similar to global trends. The average rotor diameter of installed turbines was 133.8 m in 2023—up 2% from 2022 and 178% from 1998. The average hub height was 103.4 m, up 5% from 2022 and 83% since 1998. Figure 3 illustrates progressive advancement of wind turbines’ size and capacity from 1995 to 2024.
Figure 3.
Evolution of commercial wind turbine size and capacity from 1995 to 2024, adapted from [11,12].
There are two main types of wind turbines used commercially worldwide: horizontal axis wind turbines, HAWTs (Figure 4a), and vertical axis wind turbines, VAWTs (Figure 4b). Most large-scale commercial wind turbines are HAWTs due to their increased efficiency and suitability for wind power generation, especially for onshore land-based windfarms. Locations with reliable wind resources (steady and strong winds) or coastal regions are most suitable for HAWTs. In commercial wind power generation, HAWTs account for a far bigger percentage than VAWTs. For example, in 2023, HAWTs captured more than 95% of the market [13]. The HAWT works based on lift theory [14] compared to drag theory, which is employed by the VAWT [15,16]. Most commercial VAWTs are Savonius-shape-type turbines.
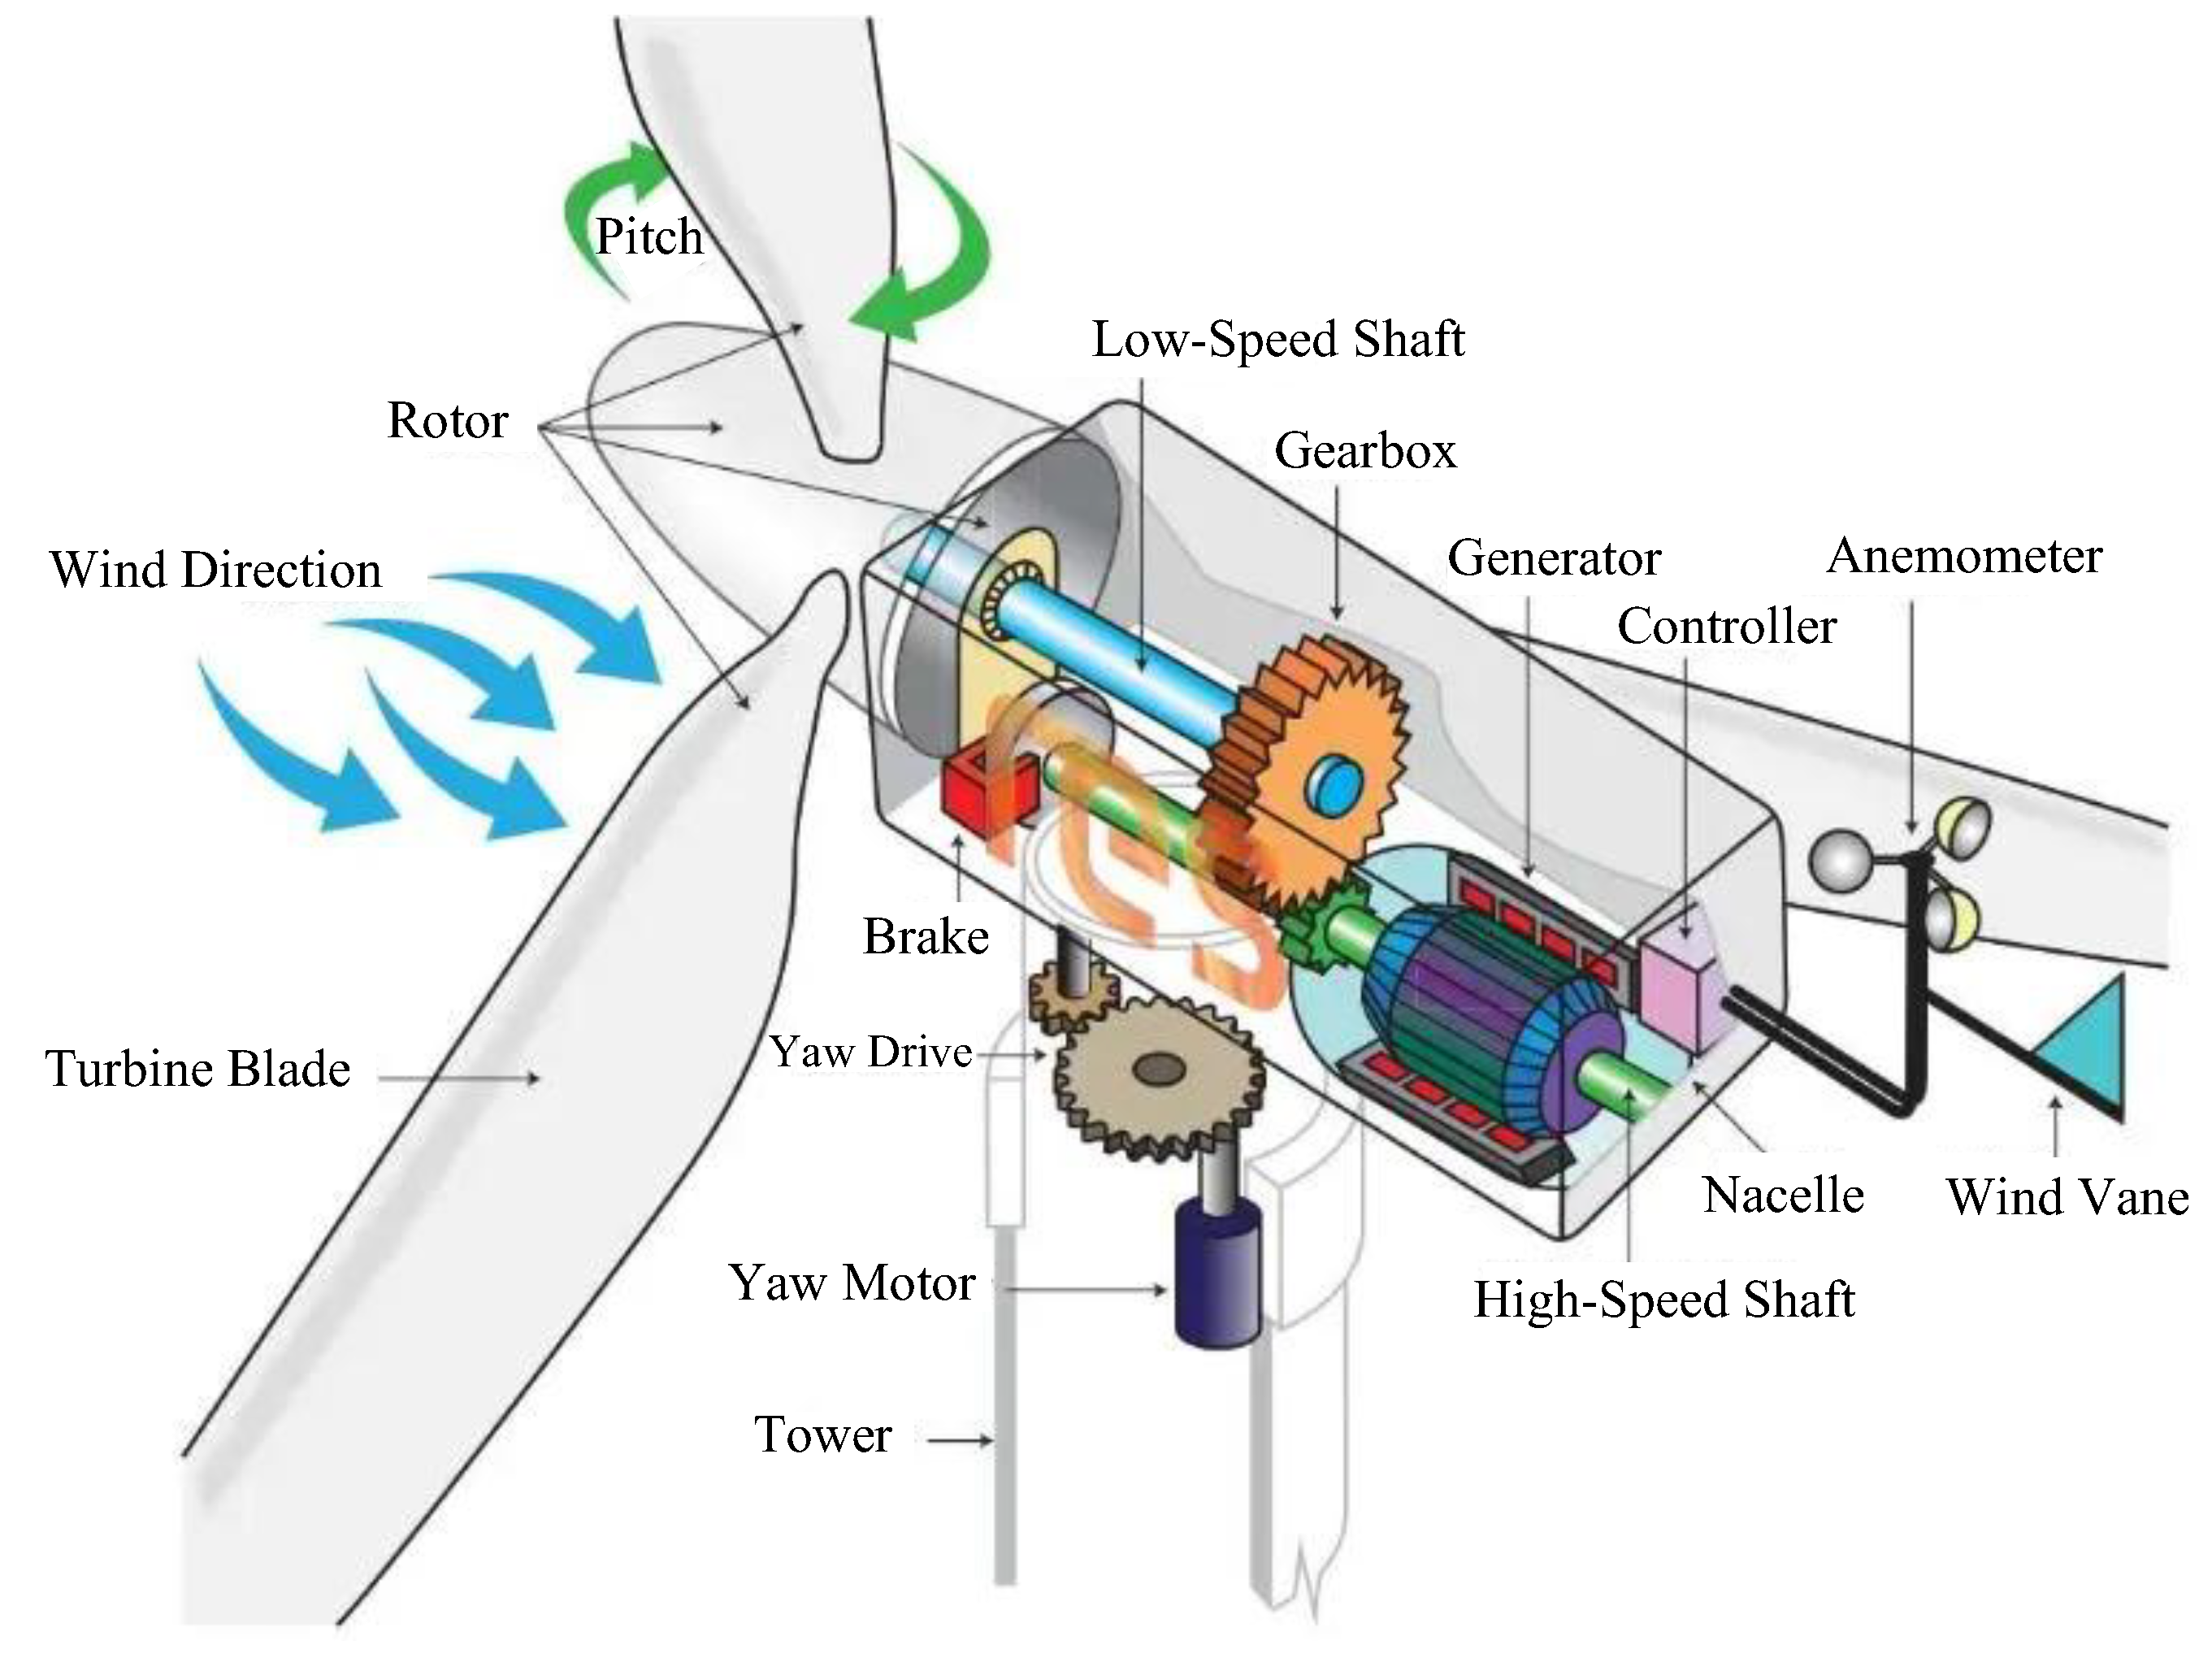
As shown in Figure 5, the key components of a wind turbine include the rotor, hub, drive train, generator, nacelle, yaw system, tower, and power electronics. The HAWT and the VAWT possess analogous sub-systems; however, VAWTs lack a yaw system due to their insensitivity to wind direction. The subsystems of the wind turbine include the rotor (blades and hub), the drive train (low-speed shaft, bearings, couplings, gear-box, high-speed shaft, and brakes), the electrical system (generator and power electronics), the control system (pitch motor and gears, yaw motor, gears and brakes, and sensors for wind and direction), and the support structures (tower, nacelle, and rotor). The blades and the hub are collectively called the rotor. The low-speed shaft, commonly referred to as the primary shaft, operates at a low rotational speed (about 30–60 rpm) and generates significant torque. The gearbox links the low-speed shaft to the high-speed shaft. The low-speed shaft is linked to the gearbox, which contains a series of gears that elevate the shaft’s output speed to roughly 1800 rpm for an output frequency of 60 Hz (or 1500 rpm for a frequency of 50 Hz). The shaft originating from the gearbox is termed the high-speed shaft. The gearbox constitutes an expensive and substantial component of the wind turbine. Some wind turbine manufacturers utilise ‘direct drive’ generators which function at reduced rotational speeds and eliminate the necessity for gearboxes, thereby reducing the weight of the nacelle and decreasing maintenance and other costs [17].
Figure 4.
Types of commercial wind turbines, adapted from [1,18,19].
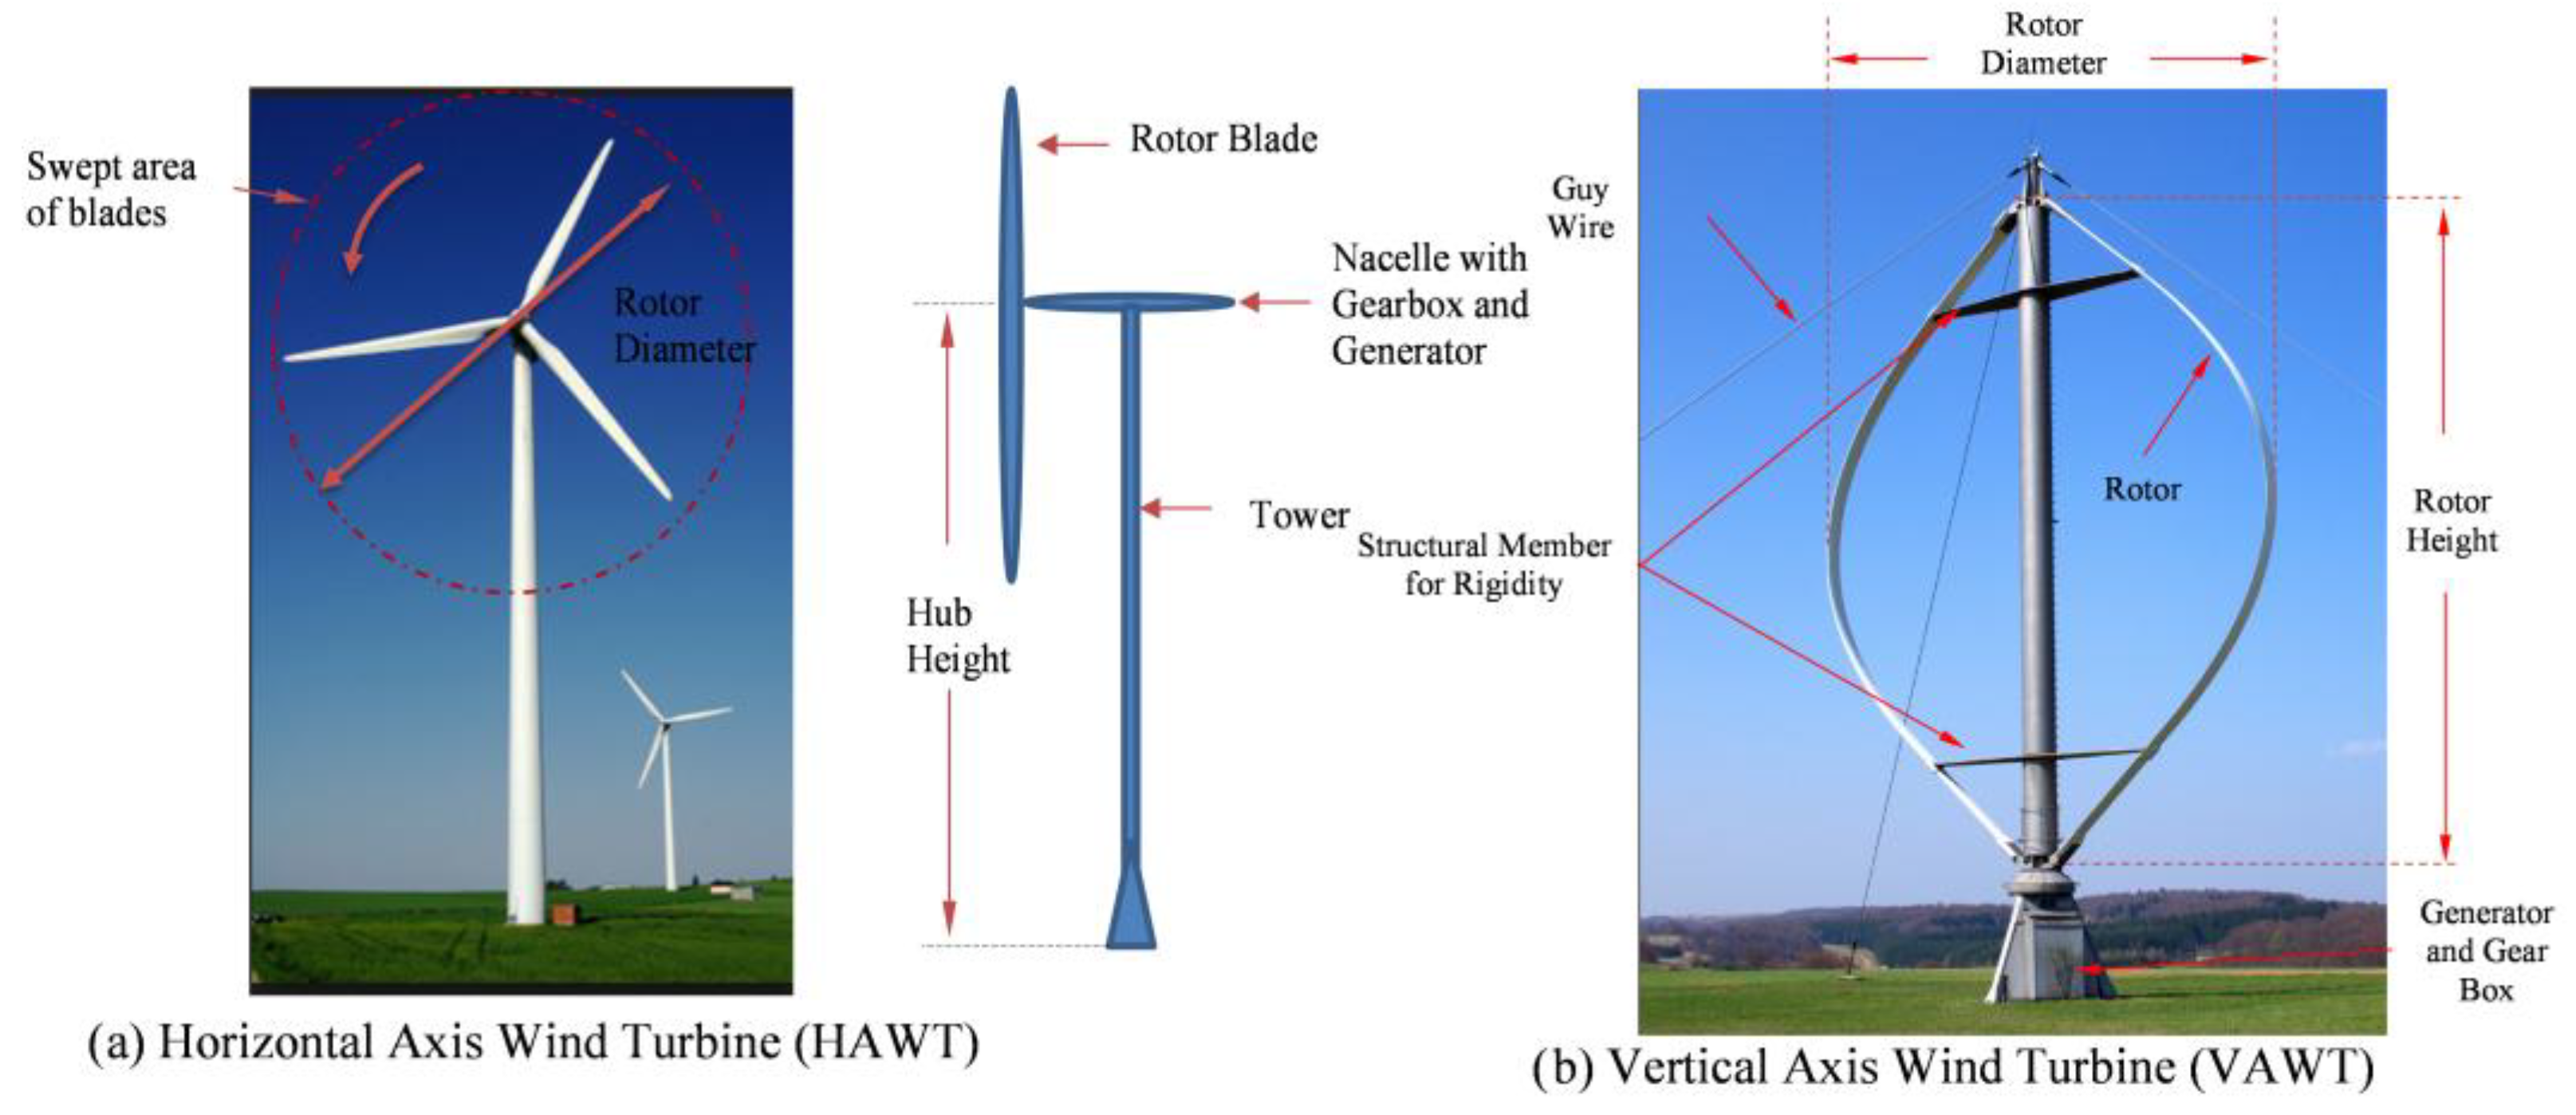
Figure 5.
Commercial wind turbines major features, adapted from [17].
In terms of reliability, wind power ranks second only to hydropower when it comes to generating power from renewable sources [20]. In 2024, wind power generation was second at 2494 TWh, with hydropower leading at 4416 TWh and solar power in third place at 2131 TWh [20]. This increase occurred even though the installed capacity for solar power generation has significantly exceeded that of wind power generation since 2022. The supply of wind energy has received considerable attention for its effectiveness in achieving net-zero targets and its reliance on technological advancements [21]. Various original equipment manufacturers within the supply chain produce wind turbines, which they then integrate and install both onshore and offshore worldwide.
A large number of articles published in the last two decades demonstrate interest in wind turbine research and development. A thematic search of the Web of Science (WoS) database using the keyword “wind turbine” results in 45,559 published articles over the past decade, while the Scopus database contains 61,321 [22]. In contrast, there is a lack of precise and universally tracked data on the number of articles published globally about wind energy policy, critical minerals (e.g., rare earth materials) that are needed for wind turbine technology, supply chain issues, and workforce development during the same period. Wind energy policy, sustainable rare earth materials, reliable and uninterrupted global supply chains for wind power technology, and workforce development are essential for the continued advancement of wind power generation and are significant subjects for research and discourse. Most research works available in the open literature have primarily focused on wind turbine efficiency (effectively harnessing wind energy for power generation) [23,24] and turbine technology and scales [25,26]. Despite there being an immense potential for wind energy to help reach net-zero carbon emissions by 2050, not much studies were undertaken about the risks that come with the global supply chain and rising costs, the mining and processing of rare-earth materials needed to make wind turbine systems, the skills needed to install, operate, repair, and maintain them, or the recycling of wind turbines at the end of their life.
Therefore, the goals of this study are as follows:
- (a)
- Investigate current status of wind power generation worldwide and its regional distribution.
- (b)
- Explore difficulties associated with using wind energy, including problems with the global supply chain and a lack of a skilled workforce in the field.
- (c)
- Encompass the value chain for the global wind power system, original equipment manufacturers, rare earth materials for manufacturing wind turbine systems, and future perspectives on commercial wind energy harnessing for power generation.
- (d)
- Formulate a national wind power generation roadmap action plan for wind power generation and skills development in emerging and developing countries.
The study’s findings are expected to assist stakeholders involved in wind power in creating better policies and allocating resources optimally for effectively using wind energy to generate power in all areas where it prevails, regardless of a country’s socioeconomic conditions.
Apart from the general overview of wind power generation in the Introduction Section (Section 1), the layout of the article is structured as follows: Section 2 elaborates the research approach and methodology. Section 3 explores global wind power generation across regions and World Bank-classified-income-group nations; Section 4 presents the essential parameters measuring the effectiveness of wind power generation and Section 5 discusses the market share of major wind power original equipment manufacturers and the levelised cost of wind power, while Section 6 explores the challenges that the wind power industry currently faces, including the mining and processing of critical minerals and risks associated with it, supply chain and logistics issues, workforce shortages, and wind turbine end-of-life recycling; Section 7 includes discussion of wind power and its industrial implications; and finally, Section 8 lists the major conclusions of this study and its recommendations.
2. Methodology and Approach
This study employs a quantitative research methodology. Primary data was gathered internally, while secondary data was sourced from a variety of multidisciplinary and subject-specific databases and research libraries, including (a) multidisciplinary (Scopus, Web of Science, Google Scholar); (b) engineering and technology (ScienceDirect, Springer, Wiley, IEEE Xplore, INSPEC, ASCE Library); (c) energy and environment (Energy & Power Source, GreenFILE, Environment Complete); (d) government and intergovernmental organisation reports (International Energy Agency—IEA, International Renewable Energy Agency—IRENA, U.S. Department of Energy—DOE, National Renewable Energy Laboratory—NREL, European Commission); (e) industry reports (Global Wind Energy Council—GWEC, BloombergNEF, McKinsey Energy Insights); (f) preprint servers (arXiv for engineering and forecasting models, SSRN for policy and economics); (g) theses and dissertations (ProQuest Dissertations and Theses Global); (h) global organisation reports (World Bank, International Monetary Fund—IMF, Asian Development Bank—ADB, African Development Bank Group, United Nations Development Programme—UNDP); (i) peer-reviewed conference proceedings and papers; and (j) government reports.
These sources provided the specific data, the literature, and challenges of the global wind power sector. Furthermore, supplementary data and expert opinions were obtained through two methodologies: citation tracking, which included examining reference lists of significant articles and foundational review papers (backwards chaining) and utilising Scopus/Web of Science to determine subsequent citations (forward chaining), and contacting experts, which involved engaging with prominent authors or research institutions for data on unpublished or ongoing studies.
This study used a modified PICO framework, encompassing population (P), intervention/exposure/phenomenon of interest (I), context (C), and outcomes (O) for data inclusion. The population (P) included systems for wind power generation, projects, or infrastructure, such as onshore and offshore wind farms, fixed-bottom and floating turbines, specific turbine models, and national or regional wind power grids. It excluded studies that focused exclusively on small-scale, residential wind turbines not connected to the main grid, unless these were part of a larger aggregation study. The intervention/exposure/phenomenon of interest (I) encompassed multiple dimensions concerning the performance, feasibility, and impact of wind power generation. The scope included the measurement of capacity factors, forecasting energy output, resource assessment, exploration of technological advancements in larger turbines and floating platforms, evaluation of economic feasibility such as Levelised Cost of Energy (LCOE), addressing grid integration challenges, examination of environmental impacts, and consideration of carbon emission displacement. However, it excluded studies that concentrated exclusively on social acceptance without quantitative generation or performance data, as well as those focused solely on manufacturing wind turbines.
The context (C) encompassed the setting or comparator, including comparisons among various geographical regions, historical versus projected generation data, different turbine technologies, other power generation sources, and studies detailing the capacity factor of a specific region. The results included both quantitative and qualitative measures of interest. Primary outcomes included capacity factor, total energy generated (TWh), levelised cost of energy (LCOE), and generation potential (TWh/year). Secondary outcomes included reductions in greenhouse gas emissions, job creation, land/sea use efficiency, grid integration costs, technology learning rates, and skills development.
Data validation was performed by comparing and benchmarking independently sourced data from various research, including journal publications, IRENA and IEA reports, peer-reviewed conference papers, and theses. The data was analysed and integrated for refinement. Managing conflicting data presented a significant difficulty, particularly within the renewable energy sector. Diverse sources presented varying values for the same parameter (e.g., global installed capacity in a specific year) owing to disparate methodology or reporting deadlines. The validation procedure involved documenting inconsistencies and, when feasible, contacting the original authors or cross-referencing with a reputable source (such as IRENA, IEA, or GWEC) to choose the most credible number to utilise.
3. Wind Power Generation Capacity by Regions
The total wind power generated capacity globally reached 1202 GW in 2024, with most of that power coming from just forty (40) countries. Figure 6 illustrates the cumulative installed wind power capacity across top twenty-three countries from 2000 to 2023. The significant disparity between the highest and lowest cumulative installed wind power across countries complicates the differentiation of installed power generation capacity, particularly for capacities under 20 GW. This complexity is more noticeable in recent years’ data; for example, in 2023, the cumulative installed capacity for wind power generation across twenty-three countries was as follows: China (442 GW), the United States (148 GW), Germany (69 GW), India (45 GW), Spain (31 GW), the United Kingdom (30 GW), Brazil (29 GW), France (22 GW), Canada (17 GW), Sweden (16 GW), Italy (12 GW), Turkey (12 GW), Australia (11 GW), the Netherlands (11 GW), Poland (9 GW), Denmark (7 GW), Mexico (7 GW), Finland (7 GW), Portugal (6 GW), Belgium (6 GW), Japan (5 GW), Norway (5 GW), and Greece (5 GW).
Figure 6.
Top 20 countries’ cumulative installed wind power from 2000 to 2023.
As shown in Figure 6, China accounts for over 43%, followed by the USA at 15%, Germany at 6%, India at 4%, Spain at 3%, the UK at 2.7%, Brazil at 2.7%, France at 2%, Canada at 1.7%, Sweden at 1.6%, Italy at 1.2%, Turkey at 1.1%, the Netherlands at 1.1%, and Australia at 1.1%, with the remainder of the world at 13.8%. No other country (apart from the countries named above) has installed generation capacity for more than 1% of the world total. In the early 2000s, the USA and Germany were leaders in wind power generation; however, by 2010, China’s installed wind power capacity exceeded that of Germany in 2008 and the USA in 2010. By 2020, China’s wind power installed capacity was 2.4 times greater than that of the USA, 4.6 times greater than Germany, and 7.2 times greater than India. By 2023, China’s capacity surpassed the USA by a factor of 3, Germany by 6.4, and India by 10, as illustrated in Figure 6 [2,3,4,5,6,7,8].
Analysis of the installed power generation capacity by region reveals that Asia leads with 51.3% of the global installed wind power, followed by Europe at 25.5%, North America at 17.2%, South America at 3.9%, Oceania (mainly Australia) at 1.2%, and Africa at the lowest at 0.9%, as illustrated in Figure 7. Since 2008, Asia has experienced the most rapid expansion in the capacity for generating wind power. It matched North America in 2010 and Europe in 2014, surpassing Europe by 1.6 times and North America by 2.4 times in 2020. By 2023, Asia exceeded Europe by 2.5 times and North America by 3 times. The data for 2024 indicates a further increase in Asia’s installed capacity margin.
Figure 7.
Continent-wise cumulative installed wind power from 2000 to 2023.
More in-depth analysis indicates that the majority of installed wind power generation capacity has been concentrated in high-income countries, as classified by the World Bank, from 1996 to 2022. The World Bank country classifications by income level for 2024–2025 are shown in Table 1 [27]. The per capita nominal GDP for selected countries from all four income groups for 2024 is shown in Table 2.
Table 1.
World Bank country classifications by income level for 2024–2025.
Table 2.
Nominal per capita GDP in 2024, data source [28].
The upper-middle-income countries exhibited the most rapid growth in installed capacity starting in 2010, surpassing the high-income countries by 1.1 times in 2023, as shown in Figure 8. Compared to lower-middle-income countries, upper-middle-income countries’ installed capacities were 8.6 times higher in 2023. When examining the data, it is evident that most of the capacity for generating wind power was clustered within upper-middle- and high-income countries, as these two groups combined possessed 94.2% of the global total (Figure 8). The remaining installed wind power capacity (5.8%) was possessed by lower-middle-income countries. There was no appreciable wind power generation capacity in low-income countries. It may be noted that high-income nations (entire Europe and North America) possessed less installed wind power capacity than upper-middle-income countries (49.8%). As depicted in Figure 8, in progress in renewable wind power, the leader was the collective of the upper and lower-middle-income groups, which together possessed 55.6% of the global total installed wind power capacity.
Figure 8.
Cumulative installed wind power from 2000 to 2023 for World Bank country classification based on income level.
In 2024, China led the global capacity for offshore wind power generation, holding 54% of the total among 18 countries. The United Kingdom (UK) followed with 18%, Germany with 10%, and the Netherlands with 6%. Other contributors included Chinese Taipei (Taiwan) at 3%, Denmark at 3%, Belgium at 3%, and Vietnam, France, the USA, Japan, Sweden, South Korea, Finland, and Norway each at 1% or less. The combined share of Spain, Italy, and Portugal was also 0.1%, as illustrated in Figure 9 (adapted from [2,3,4,5,6,7,8,11]). Asian nations led by China possessed 58% of the global total, Europe 41%, and other countries 1%.
Figure 9.
Offshore cumulative installed wind power by country in 2024.
The global interest in harnessing offshore wind energy for power generation has progressively been increasing. Offshore wind energy offers some distinctive advantages in generating electric power, some of which are (a) higher wind speeds and consistent wind direction allowing fewer turbines to make the same amount of energy as onshore wind farms; (b) ease of building wind farms, as they do not need to fit into as much space as onshore farms; and (c) the boundary layer of wind flow over the water surface, which allows the same hub height to be used to make more power than with an onshore turbine.
4. Wind Power Measurement Indicator and Generation Effectiveness
The wind power measurement indicator and generation effectiveness are assessed through several important parameters, such as the capacity factor (actual energy produced versus potential output), availability (percentage of time the turbine is operational), and energy density (energy captured per unit area). The capacity factor is defined as the ratio of net electricity generated over a specific time frame to the energy that might have been produced at continuous full power during that same period [2]. The mathematical expression of the yearly capacity factor of a wind turbine or wind farm is shown in Equation (1).
where
Et is the total electrical power generated by a turbine or group of turbines over a time period (generally a year) in kilowatt-hours (kWh) or megawatt-hour(s) (MWh).
Pn is the nameplate or installed power generation capacity of a turbine or group of turbines over the same time period as Et in kWh or MWh.
T is the total time period in hours or year.
A higher capacity factor indicates a more effective wind power generation system, as it shows the turbine is generating more electric power than it could have generated in a given period. Factors affecting capacity include wind availability, swept area of the turbine, size of the generator, power transmission line capacity, and power demand. Current wind farms or turbines typically have capacity factors between 20% and 40%. However, the average capacity factor is below 30%. Figure 10 depicts the global total installed wind power capacity and capacity factor from 1996 to 2024. The figure shows that the global average wind turbine capacity factor was approximately 28%.
Figure 10.
Global total wind power generation installed capacity and capacity factor, data source [2,3].
The second parameter, “availability”, refers to the percentage of time a wind turbine or wind farm is operational and generating electricity. High availability means the system is reliable and can consistently produce power, which is crucial for a stable and effective power supply. Factors affecting availability include regular maintenance, efficient design, and ability to withstand extreme weather conditions. Table 3 shows the historical trend in availability (i.e., capacity factor) in North America and some European countries.
Table 3.
Historical trend in availability (capacity factor).
The third parameter, “energy density”, of wind resources refers to the amount of energy captured by a wind turbine per unit area (i.e., the amount of power available per unit of area swept by the turbine blades in watts per square metre, W/m2). It is a function of the wind speed cubed. A small increase in wind speed leads to a large increase in available energy. Therefore, a higher energy density indicates a more efficient wind resource, meaning more energy can be extracted from a given area. Factors affecting energy density include wind speed, wind direction, and turbine location. A historical comparison of energy density of wind resources and technology is shown below:
- (a)
- Turbine in 1990s: 500 kW rating, 40 m rotor diameter. Swept area ≈1250 m2. Power per swept area: ~400 W/m2.
- (b)
- Turbine in 2020s: 4.5 MW rating, 150 m rotor diameter. Swept area ≈ 17,700 m2. Power per swept area: ~254 W/m2.
It may be noted that a modern turbine is optimised for energy costs rather than power density alone. A larger-diameter turbine enables efficient energy capture from lower wind velocities, resulting in considerable power generation over extended periods annually, thus achieving a significantly elevated capacity factor.
Continuous capacity enhancement, increasing from 20% in 1996 to 28% in 2024, is facilitated by technological advancements in wind turbines, which optimise wind energy extraction along with improvements in quality, reliability, and efficiency derived from mass industrial manufacturing, research, and development [2,3].
5. Wind Turbine Manufacturers and Levelised Cost of Energy (LCOE)
5.1. Wind Turbine Manufacturers
The history of large wind turbines for power generation goes back to the 1940s, when the world’s first megawatt (MW)-scale turbine was designed by Palmer Putnam and manufactured in Vermont, USA, by the S. Morgan Smith Company. One of the two blades on this 1.25 MW wind turbine broke after 1100 h of operation. Wartime material shortages caused delays in repairs, and the turbine’s potential to produce commercially competitive energy led to the discontinuation of subsequent operation [29]. After more than three decades, research in the US and Denmark was prompted by the 1973 oil crisis to develop larger, utility-scale wind turbines that could be connected to electrical power grids for remote area power supply. Global concerns about energy security, climate change impact, and the potential exhaustion of fossil fuels led to a renewed interest in wind power and other renewable energy sources in the early 21st century. Commercial wind turbine manufacturers, which were just beginning their operations, experienced rapid growth.
In 1990–2000, there were several dozen wind turbine original equipment manufacturers (OEMs), mainly in the Western countries (Europe and the USA). Among these Western OEMs were Denmark’s Vesta, Spain’s Gamesa, Germany’s Siemens, Finland’s Lagerwey, and the USA’s General Electric (GE) and Enron Energy [30,31,32]. The OEMs from the rest of the world were India’s Suzlon and China’s Goldwind. Later, General Electric acquired Enron Energy after its bankruptcy. Spain’s Gamesa merged with Germany’s Siemens, forming Siemens Gamesa. In 1996, Finland’s Lagerwey Wind first introduced direct-drive technology, replacing gearboxes with permanent magnets in its 0.75 MW turbines to enhance efficiency by reducing moving parts.
Since 2000, Asia, mainly China, has seen significant technological advancements and a rise in highly competitive wind OEMs. In 2010, China passed the US to become the country with the most cumulative installed wind power capacity in the world. In 2024, four Chinese wind turbine original equipment manufacturers (OEMs) secured places in the top five global OEM rankings, a first for the industry, as China accounted for 65% of the world’s wind OEM capacity. According to the Wood Mackenzie report [33,34], Goldwind is the world’s number one wind OEM with 19.3 GW of installed capacity, followed by fellow Chinese companies Envision with 14.5 GW, Windey with 12.5 GW, and MingYang with 12.2 GW, securing the second, third and fourth places, respectively, in 2024, as illustrated in Figure 11. Each of the top 10 original equipment manufacturers’ global installed share of the wind power market in percentage is also shown in the figure.
Figure 11.
Top 10 global original equipment manufacturers (OEMs) for wind industry-based wind power installed capacity in 2024, data source [31,32].
Vestas, the only Western OEM in the top five, secured fifth place with 8.7 GW, followed closely by SANY and Dongfang, two other Chinese OEMs, which had installed capacities of 8.0 GW and 7.2 GW, positioning these two companies in sixth and seventh places, respectively. The top global OEMs in 2023 are shown in Table 4. As indicated in the table, the top five OEMs held 54% of the worldwide wind markets. With a robust domestic market, reduced production costs, and an emphasis on emerging countries, Chinese wind OEMs were able to expand their market share globally, surpassing the well-established Western OEMs.
Table 4.
World’s top 10 original equipment manufacturers (OEMs) for wind industry-based wind power installed capacity in 2023 [31,35].
The global top 10 wind turbine original equipment manufacturers (OEMs) in 2016 are depicted in Figure 12. Out of the top five OEMs, four were Western manufacturers, led by Vestas (Denmark), followed by General Electric (USA), Goldwind (China), Gamesa (Spain), and Enercon (USA). Regarding installed global share, European OEMs held 33.7%, followed by China (24.5%), the USA (19.6%), and the rest of the world (22.2%). OEMs from China held one quarter of the global market share in 2016 compared to over 65% in 2024. The data indicates that OEMs from China are overtaking most of the Western OEMs’ market share thanks to their superior technological prowess, economy of scale, and cost-effectiveness.
Figure 12.
Top 10 global original equipment manufacturers (OEMs) for wind industry-based wind power installed capacity in 2016, data source [31,32,33].
5.2. Cost of Wind Turbines and Levelised Cost of Energy
Determining actual costs, precisely calculating profits and losses, and comparing power costs across countries is a challenging task. While some countries subsidise no or minimal renewable power generation progress, others, such as the United States, have a long history of programmes that provide incentives and subsidies [36,37]. Even seemingly simple yet significant expenses, such as blade and nacelle structures, can undergo changes due to the anticipated influence of state policies on future prices. Wind power generation, particularly the turbines, necessitates a substantial financial commitment, leading to an anticipated lengthy return on investment [36,37].
Each commercial wind turbine of average size costs between USD 2.6 and USD 4 million. One megawatt (MW) of electricity-producing capacity typically costs USD 1.3 million. Even though offshore turbines’ capacities can be as large as 16–18 MW, most commercial wind turbines have a capacity between 2 and 3 MW. Although the cost of employing turbines grows with the size of the turbine, there are advantages to using fewer turbines that are larger. Using a small number of larger turbines significantly reduces the complexity and construction of the farm site. As mentioned earlier, onshore commercial wind turbines’ nameplate or rated capacity is around 2.5–3 MW with a diameter of 50 m, while the average offshore wind turbine’s rating power is 3.6 MW [1,36,37,38].
The levelised cost of energy (LCOE), a crucial indicator, was employed to assess the economic viability of an energy project, including a wind farm. The formula for the levelised cost of energy (LCOE) is the total energy production during the lifetime of an energy system divided by its total lifecycle cost. Over the lifetime of a wind farm, the levelised cost of energy is the amount of money that needs to be invested so that the investment yield can be equal to the weighted average cost of capital (WACC) or so-called discount rate. Most LCOE estimations do not account for tax and inflation, despite their crucial role in providing more accurate cost predictions [37,38]. The LCOE was employed to assess and compare the cost associated with power generation across various technologies and locales. The mathematical expression for LCOE estimation is illustrated in Equation (2). The numerator calculates the present value of all costs over the wind farm’s lifetime while denominator calculates the present value of the total power production over the wind farm’s lifetime.
where
LCOE is the levelised cost of electricity in USD/kWh;
Io is investment expenditure in USD;
At is annual total cost in USD per year t;
Mt,el is produced amount of electricity in kWh per year;
i is real interest rate in %;
n is economic lifetime in years;
t is year of lifetime (1, 2, …, n).
There is a full breakdown of typical costs of a floating offshore wind farm in Table 5, Table 6, Table 7, Table 8 and Table 9 with some assumptions. As of 2021, all prices are generally accurate; however, the totals may not match the sum of the individual terms due to their approximate nature [29]. To summarise, the following components make up a floating offshore wind farm’s total cost: development and project management at 2.5%, turbine nacelle at 13.1%, turbine rotor at 6.3%, turbine tower at 3.6%, cables at 5.4%, floating substructure at 16.6%, mooring systems at 3.1%, offshore substation at 2.6%, onshore substation at 1.4%, cable installation at 2.5%, mooring and anchoring pre-installation at 1.2%, floating substructure-turbine assembly at 1.2%, floating substructure-turbine installation at 0.9%, offshore substation installation at 0.4%, other installation at 0.2%, operations and maintenance at 36.6%, and decommissioning at 2.5% [37,38,39].
Table 5.
Tentative costs for project development and management as of 2021, data source [37,38,39].
Table 6.
Tentative costs for wind turbine as of 2021, data source [37,38,39].
Table 7.
Balance of plant as of 2021, data source [37,38,39].
Table 8.
Installation and commissioning costs as of 2021, data source [37,38,39].
Table 9.
Tentative costs for O&M, decommissioning, contingency, and insurance as of 2021, data source [37,38,39].
The demand for wind power development and deployment is growing as many countries are progressively increasing the amount of renewable power to the electrical grid. Concerning the design, development, and deployment of land-based and offshore wind energy, there are many issues that need to be addressed in order to meet that demand [40,41].
Table 10, Table 11, Table 12, Table 13 and Table 14 show the breakdown of typical costs for an onshore wind farm compared to the cost of a floating offshore wind farm (illustrated in Table 5, Table 6, Table 7, Table 8 and Table 9) with some assumptions. As of 2021, all prices are typically accurate; however, discrepancies may arise between the totals and the sum of the individual terms due to their approximate nature [20]. In conclusion, the total cost of an onshore wind farm comprises several components: development and project management account for 7.3%; wind turbines, which include the turbine nacelle, rotor, and tower, represent 50.97%; balance of plant is at 16.7%; installation and commissioning is 8.0%; operation and maintenance stand at 3.6%; decommissioning is 4.8%; and contingency and insurance make up 8.7% [37,38,39].
Table 10.
Tentative costs for project development and management as of 2021, data source [37,38,39].
Table 11.
Tentative costs for wind turbine as of 2021, data source [37,38,39].
Table 12.
Balance of plant as of 2021, data source [37,38,39].
Table 13.
Installation and commissioning costs as of 2021, data source [37,38,39].
Table 14.
Tentative costs for O&M, decommissioning, contingency, and insurance as of 2021, data source [37,38,39].
Figure 13 shows the percentage distribution of costs for onshore and offshore wind projects. In contrast to offshore wind turbines, which account for just 33% of the overall cost, onshore wind turbines account for close to 50%. The figure illustrates this disparity. Offshore wind farms have a much higher balance of plant cost (almost 40% of total cost) than onshore wind farms (17% of total cost). The main reasons for this exorbitant price tag are the following: offshore substations, mooring systems, array cables, export cables, and cable accessories. In Figure 13a,b, it is evident that the installation and commissioning expenses for offshore wind farms constitute a larger portion of the total cost compared to onshore wind farms. When expressed as a proportion of total costs, other expenses are about the same between offshore and onshore wind farms.
Figure 13.
A typical offshore (a) and onshore (b) wind farm cost breakdown in percentage.
5.3. Trends in Wind Power Efficiency Versus Cost and Sensitivity Analysis of Levelised Cost
The relationship between efficiency, cost, and the levelised cost of wind power is complex and challenging. Their breakdowns are as follows.
- I.
- Trends in efficiency versus cost in wind power
Wind power efficiency is more than simply the conversion efficiency of the turbine; it is also about maximum energy collection per unit cost. Key trends include the following:
Turbine Scaling and Rotor Diameter: This is the most significant trend. Larger rotors extract more energy from the wind, particularly at low wind speeds. Turbines’ “Specific Rating” (kW/m2 of swept area) is dropping, indicating larger rotors for the same generator size. This leads to increased power generation over longer periods of time.
Hub Height: Taller towers have access to stronger, more consistent winds, which increases the capacity factor.
Advanced Aerodynamics: Improved blade design, such as serrations, winglets, and complicated airfoils, reduces drag while increasing lift, allowing for more energy extraction.
Drivetrain Efficiency: There has been a shift from geared doubly fed induction generators (DFIG) to medium-speed geared and, more recently, direct-drive permanent magnet synchronous generators (PMSGs). A direct drive minimises gearbox losses and maintenance, which increases availability and efficiency.
Smart Operation and Control: In wind farms, advanced yaw and pitch systems, as well as wake steering, optimise each turbine’s alignment and performance, decreasing turbulence losses.
- II.
- The Cost Drivers
The cost drivers are upfront capital costs (CAPEX), balance of plants (BOP), and operational expenditures (OPEX).
Upfront Capital Costs (CAPEX): The cost per MW of a turbine has remained essentially consistent, albeit with a slight increase, due to the complexity of larger components, improved materials, and direct-drive systems.
Balance of Plants (BOP): The cost of foundations and electrical infrastructure increases with project size, although economies of scale in project development have helped keep these costs under control.
Operational Expenditure (OPEX): Larger, more reliable turbines have lower operating costs per MWh. Predictive maintenance with digital twins and SCADA (Supervisory Control and Data Acquisition) reduces downtime and unplanned repairs. However, keeping larger turbines at sea (offshore) introduces significant cost issues.
- III.
- The LCOE
The rise in wind power output (the numerator) has been much faster than the rise in cost (the denominator); refer to Equation (2). Although a larger, more efficient turbine may cost 10% more per MW, its bigger rotor and higher tower allow it to produce 20–30% more power. This factor has caused the worldwide LCOE to decline since 2010.
Overall, the trend is positive due to the separation of the cost of turbines from the cost of power. To lower the LCOE, the goal is not to minimise the cost of the turbine itself but to maximise power production, even if that means buying a more expensive turbine and other associated machines.
5.3.1. Sensitivity Analysis of Levelised Cost of Energy (LCOE) in Wind Power
The simplified LCOE formula for wind power can be expressed as follows:
where
LCOE = (Total Lifetime Cost)/(Total Lifetime Power Production)
Total Lifetime Cost = CAPEX + NPV (OPEX) + NPV (Decommissioning Cost);
Total Lifetime Energy Production = (Capacity × Capacity Factor × Hours in a Year × Project Lifetime).
Sensitivity analysis examines how sensitive the LCOE is to changes in its underlying input variables. It identifies the “levers” that have the greatest impact on project profitability. Details about the critical parameters and their typical sensitivity rankings are elaborated below:
- (a)
- Capacity factor (highly sensitive) is often the most sensitive parameter. A small change has a massive impact, as it directly scales the power output in the LCOE denominator.
- ‑
- Impact: A 10% relative increase in capacity factor (e.g., from 40% to 44%) typically leads to an ~9% decrease in LCOE.
- ‑
- Drivers: Wind resource quality, turbine efficiency, hub height, and losses.
- (b)
- Capital expenditure (CAPEX) (highly sensitive): Initial investment cost is a direct driver of the numerator.
- ‑
- Impact: A 10% increase in CAPEX typically leads to a ~7–9% increase in LCOE.
- ‑
- Drivers: Turbine price, foundation costs, grid connection fees, and soft costs (development, permitting).
- (c)
- Operating expenditure (OPEX) (moderately sensitive) is the ongoing cost of maintenance, insurance, and leases.
- ‑
- Impact: A 10% increase in OPEX typically leads to a ~3–5% increase in LCOE, depending on the project’s OPEX/CAPEX ratio (higher for offshore; refer to Figure 13).
- ‑
- Drivers: Turbine reliability, service contracts, and remoteness of the site.
- (d)
- Project lifetime (moderately sensitive) is the number of years for which the project generates revenue.
- ‑
- Impact: Extending a project’s lifetime from 20 to 25 years can reduce LCOE by 10–15%, as the high CAPEX is amortised over increased energy production. This variable is a major driver for lifetime extension (repowering).
- (e)
- Cost of capital/discount rate (highly sensitive for financed projects) reflects the cost of debt and equity and the risk profile of the project.
- ‑
- Impact: A one percentage point increase in the discount rate can increase LCOE by 5–8%. It significantly affects the Net Present Value (NPV) of all costs.
- ‑
- Drivers: Interest rates, country risk, and investor confidence.
- (f)
- Wind resource (fundamentally linked to capacity factor), which indicates the quality of the wind speed distribution at the site, is the primary determinant of the capacity factor.
5.3.2. Synthesis and Future Outlook
The interplay between trends and sensitivities defines the strategy for the wind power sector, which includes the following.
Chasing the Best Wind: The high sensitivity of LCOE to capacity factors justifies investing in better sites, taller towers, and larger rotors to maximise energy yield.
Technology for OPEX Reduction: The moderate sensitivity of OPEX, combined with its recurring nature, drives the adoption of predictive maintenance and more reliable turbines to lock in long-term savings.
Financing: The high sensitivity to the cost of capital means that policy stability and de-risking mechanisms are as important as technological advances for reducing LCOE.
Future efficiency gains are expected to come from the following:
- ○
- Digitisation and AI: For better predictive maintenance and real-time optimisation.
- ○
- Hybrid projects: Co-locating with solar and storage to maximise grid utilisation and value.
- ○
- Advanced Materials: Using lighter, stronger materials to enable even larger rotors without a proportional cost increase.
- ○
- Repowering: Replacing old turbines with new, highly efficient ones on existing sites with proven wind resources.
In short, the wind power trend is closely linked to advancements in technology and engineering, which result in a reduced LCOE but not the cheapest turbine. Sensitivity analysis provides a crucial roadmap, showing that the path to a cheaper, cleaner grid is paved by maximising power production from the wind while strategically managing capital and operational costs.
6. Challenges in Wind Power Industry
6.1. Mining and Processing of Critical Minerals for Wind Power Generation System
A small number of countries mine most essential metals and minerals for wind power, such as copper, zinc, and iron. For example, Latin America, Africa, and South-East Asia are the primary locations for mining the essential minerals required for energy transition. Copper is mostly located and mined in Chile and Peru, lithium in Argentina and Chile, nickel in Indonesia and the Philippines, cobalt in the Democratic Republic of Congo (formerly Zaire), and platinum in South Africa [7,8]. Countries with the largest capacity are developing the most renewable energy supply chain projects, as shown in Figure 14. The figure illustrates that a handful of countries are dominating in the processing of strategic materials that are vital for the advancement of renewable energy technology. China holds a dominant position, accounting for over 65% of all rare earth material processing. China and Indonesia, the main producers of refined copper, lithium, nickel, and cobalt, are expected to account for 50–95% of the supply increase between 2023 and 2035.
Figure 14.
Share of dominance in specific critical minerals and clean technologies from 2023 to the projected year 2030, data source [8,42,43].
In Figure 14, the following country ISO codes are used: CHL—Chile; AUS—Australia; IDN—Indonesia; PHL—the Philippines; DRC—Democratic Republic of Congo; RUS—Russian Federation; MDG—Madagascar; MOZ—Mozambique; VNM—Vietnam; MYS—Malaysia; USA—the United States of America; EU—European Union; and DEU—Germany.
Critical mineral including rare earth elements (REEs) is a major issue. For some important minerals, the growth of supply from announced and confirmed projects will be slower than the growth of demand. The most vulnerable minerals are copper and lithium, raising new concerns about supply security and sustainable wind power. Furthermore, new mining projects have extensive lead times [8,42,43]. Table 15, Table 16 and Table 17 show the global top 10 countries and the rest of the world’s production of copper, zinc, and rare earth elements (REEs) in 2024. These elements are vital for renewable power generation.
Table 15.
Global copper (Cu) production in 2024, data source [44,45].
Table 16.
Global zinc (Zn) production in 2024, data source [46,47].
Table 17.
Global rare earth elements (REEs) production in 2024, data source [48,49].
The challenges associated with rare earth elements (REEs) are more serious. Although REEs are not truly rare in the earth’s crust, they are termed “rare” because it is difficult to isolate them from other elements, which are thinly scattered over the Earth’s large crust, and remove them from their natural sources. Despite these elements being quite prevalent in the crust of the Earth, they are rarely discovered in high enough concentrations in any one location to be mined commercially.
Rare earth elements have relatively similar chemical characteristics, making separation difficult during extraction. The separation procedure is extremely technology-intensive and energy-intensive and needs highly skilled human resources. There are 17 rare earth elements listed in Mendeleev’s periodic table. These elements consist of the transition materials yttrium, scandium, and the 15 lanthanides (lanthanum to lutetium). All 17 rare earth elements (REEs) are metals in the lanthanide series: lanthanum (La), cerium (Ce), praseodymium (Pr), neodymium (Nd), promethium (Pm), samarium (Sm), europium (Eu), gadolinium (Gd), terbium (Tb), dysprosium (Dy), holmium (Ho), erbium (Er), thulium (Tm), ytterbium (Yb), and lutetium (Lu). In addition, yttrium (Y) and scandium (Sc) are often grouped with the lanthanides and referred to as REEs [48,49,50].
Wind turbines use multiple rare earth metals, primarily neodymium (Nd), praseodymium (Pr), dysprosium (Dy), and terbium (Tb), to build powerful permanent magnets required for operation. These magnets are used in wind turbine generators to effectively transform the mechanical energy of the turbine extracted from wind energy through the blades into electricity. Here are some specifics about these rare earth materials.
6.1.1. Neodymium and Praseodymium
Neodymium and praseodymium are essential for the manufacturing of neodymium-iron-boron (NdFeB) magnets for wind turbine generator to enhance the generator’s efficiency.
6.1.2. Dysprosium and Terbium
Dysprosium and terbium are used in NdFeB magnets to improve their magnetic properties, particularly their resistance to demagnetisation at high temperatures.
Most wind turbines use neodymium–iron–boron magnets. Neodymium and praseodymium reinforce these magnets, whereas dysprosium and terbium prevent demagnetisation at high temperatures. While the precise REE concentrations can vary, an average permanent magnet weighing around 4000 kg used in a wind turbine may contain approximately 28.5% neodymium, 4.4% dysprosium, 1% boron, and 66% iron. The World Bank anticipates that energy technology will utilise 37% of 2018’s neodymium output by 2050. Worldwide neodymium use in wind turbines is expected to rise by 48% by 2050. Rare earth elements are the key “critical metals” in wind turbines and vital to renewable energy. Social and environmental supply chain issues arise when sourcing them [49,51].
The efficiency and general performance of modern wind turbines rely primarily on rare earth magnets. Without them, wind turbine technology would be far less advanced and cost-effective than it is at present. Larger offshore wind turbines employ permanent magnets to generate power and reduce maintenance. Nearly 76% of offshore and 32% of land-based wind turbines use rare earth permanent magnets [49,51].
Regarding refining and processing, China almost exclusively handles the refining and processing of key materials, including rare earth elements needed for wind turbine permanent magnets. Over the centuries, Western countries have controlled natural resources and refining capacity for these materials. However, the current mining, refining, and manufacturing of these minerals are dominated by China, Indonesia, Chile, Malaysia, the Democratic Republic of Congo (DRC), the USA, and Australia.
As shown in Figure 15, it is evident that China is by far the most dominant nation for all key materials (copper, lithium, nickel, cobalt, graphite, battery-grade manganese sulphate, rare earth elements (REEs), manganese, and battery-grade purified phosphoric acid (FPA)). Over the years, China has built up an economy of scale-driven and backwards integrated industry through research and development, massive investment, and steady market expansion at home and abroad. China leads the global market for key material refining including rare earth elements and the manufacturing of major wind power components, such as gearboxes (80%), converters (82%), generators (73%), and castings (82%) [7]. China not only accounts for 64% of the value produced by the entire global wind power supply chain (mining, transportation, and installation), but it is also aiming to install 58% of new wind power projects within its own territory by 2025 [52,53].
Figure 15.
Geographical distribution of refined materials for key minerals in 2024.
6.2. Recycling of Wind Turbines and Conservation of Precious Materials
Waste disposal and recycling of wind turbine blades is relatively new, but their numbers are expected to grow rapidly. According to the Department of Energy (DOE), 90% of U.S. wind turbines were installed after 2012. The average wind turbine lasts 20 years; thus, between 2025 and 2040, 10,000 to 20,000 blades will be at the end of their operational life [54]. In 2022, the Energy Department’s National Renewable Energy Laboratory (NREL) warned of a large gap between existing blade recycling supplies and future blade recycling needs. NREL reported that transporting obsolete blades to a recycling plant is expensive due to their size and weight [54,55]. Disposal in the nearest landfill is cheaper but less sustainable [54]. According to NREL’s prediction, landfills will receive up to 78% of discarded blades under normal business operations.
A 2021 study found that turbine blades are projected to occupy 1% of landfill space by the year 2050 [54,55,56]. As there is a large number of wind turbines reaching the end of their operational lifespan and others poised for imminent retirement, the environmental risks and limited availability of rare earth elements present an opportunity to recycle decommissioned wind turbines. Generally, all components of a wind turbine, including steel and other metals, are recyclable. The materials used in the wind turbine blades present major challenges due to the difficulties of separation. The intricate composite structure of the blades complicates and increases the cost of their recycling process.
As a global leader of wind energy harnessing nations, China leads initiatives for recycling wind turbines. Over half a dozen Chinese companies are actively recycling wind turbines. For example, Ningxia Zhonghong New Materials Technology, a Chinese enterprise, was founded in Yinchuan in 2024 to recycle 30,000 metric tonnes of retired wind turbine blades and extract materials. The company employs a physical method that entails smashing turbine blades, subsequently compressing them into shipping pallets, and constructing formwork characterised by strong load-bearing capacity, waterproofing, and weather resistance. Turbine blades, measuring between 50 and over 100 m and possessing a design lifespan of approximately 20 to 25 years, are generally constructed from composite materials (fibreglass and carbon fibre), which are known for their strength and lightweight properties. The intricate composition of these materials renders their separation and recycling difficult.
Apart from Ningxia Zhonghong New Materials Technology, several other Chinese enterprises have initiated recycling processes for wind turbine systems, encompassing gearboxes and generators. In 2023, the installed capacity of decommissioned wind turbines in China was approximately 100 MW, with projections indicating an increase to 500 MW by the conclusion of 2025. By 2030, wind turbines with a total producing capacity of 44.7 GW will have completed their operational lifespan, leading to 0.95 million tonnes of potential solid waste.
Apart from the Chinese wind turbine recycling companies, several other companies in Europe, the United States, and Australia are pursuing wind turbine recycling programmes. Here are some major companies: (a) LM Wind Power, a subsidiary of GE Renewable Energy (US); (b) Siemens Gamesa Renewable Energy SA (Germany and Spain); (c) Vestas Wind Systems (Denmark); (d) Veolia Environnement S.A. (Spain); (e) Stena Metall AB (Sweden); and (f) Acciona Energy (Australia).
The predominant methods for blade disposal currently include landfilling, incineration, or prolonged storage, resulting in considerable adverse environmental impacts. The recycling of wind turbines, encompassing blades, towers, gearboxes, and generators, facilitates the recovery of precious materials and rare earth elements while simultaneously tackling global environmental issues, fostering a circular economy, and stimulating economic progress [57].
6.3. Supply Chain Issues
COVID-19, the conflict between Ukraine and Russia, and unilateral Western sanctions on Russia and countries trading with it have significantly impacted global trading and supply chains. The Ukraine–Russia conflict has a profound effect on supply chains and logistics for wind turbines in Europe and other parts of the world, leading to shortages of raw materials and disruptions in logistics vital for wind turbine components, such as steel and nickel. These shortages led to a higher cost of wind turbine manufacturing, development of wind farms, and generation of wind power [58]. This unpredictability complicates inventory, long-term planning, and business decisions. Production capacities are likely to fall short of demand as a global wind market develops, leading to expected tailbacks [59]. These tailbacks include some of the following:
(a) Industrial policy steering
With different strategies, the US and the EU are both enacting industrial policies to increase the production of wind turbines in their respective jurisdictions. While the EU stresses enhancing domestic production capacities through a combination of trade policies, financing, and regulatory frameworks, the US concentrates on tax credits and incentives for offshore wind projects [60]. The US Inflation Reduction Act uses government subsidies to support energy transition companies. The Green Deal Industrial Plan and Zero-Emission Industry Regulation, proposed by the European Commission in early 2023, call for 40% of wind turbine manufacture in Europe by 2030. These regulations aim to promote domestic wind turbine manufacturing; however, such reshoring may disrupt the global wind turbine supply chain in the short and medium term [59].
(b) Inflation and rising costs
The economics of wind power projects are being affected by rising commodity prices, interest rates, inflation, supply chain pressures, regulatory inertia, trade barriers, global trade fragmentation, and hard and mandatory local content requirements, causing wind power projects to stall, particularly offshore [31]. High risk perception in developing and emerging countries makes funding relatively expensive, leading to delays in wind power projects. Prices for raw materials and components have significantly increased due to supply issues and rising wind power demand. For instance, in the last three years, the price of steel, copper, and aluminium, which constitute 50% of wind turbines, has tripled [59]. Original equipment manufacturers (OEMs), bound by fixed-price contracts, are bearing the full brunt of this increase, making them vulnerable to sustaining it with the thin margin of profit.
(c) Shortages of technically skilled workforce in wind power sector
The wind power sector is experiencing a significant lack of technically competent professionals, with forecasts showing a global shortfall of engineers and technicians by 2028. The rapid increase in both onshore and offshore wind power is causing this shortfall, resulting in a need for over 532,000 new engineers and technicians. A large portion of these positions (40%) will need to be filled by newcomers, emphasising the importance of greater training and education in the wind power sector [59,60,61]. The growth of the wind sector has outpaced the training of specialised engineers and technicians, particularly in design and installation, operation, repair, and maintenance. Insufficient skilled manpower can delay wind turbine maintenance, extend non-operation periods, or cause large-scale equipment failures and damage. Offshore wind is a relatively new industry, making the transportation of technicians to the sea both costly and constrained [59].
In developing nations, where spending on wind-specific training is minimal, the shortage of specialist experts is significantly higher and more acute. Figure 16 illustrates the required workforce for wind power construction, installation, operations, and maintenance worldwide for both the onshore and offshore wind industries.
Figure 16.
Skilled workforce requirements for wind power construction, installation, operations, and maintenance worldwide, data source [2].
Governments, policymakers, educational institutions, and professional organisations must act by investing in engineering, technical, and vocational training, removing regulatory barriers, and supporting international standards for skill development and training in order to create resilient supply chains of engineers and technicians to construct and maintain wind power infrastructure both nationally and internationally. There is a considerable need for engineers and other technically competent professionals, according to research in the Global Wind Workforce Outlook 2024–2028 published by the Global Wind Organisation (GWO) and Global Wind Energy Council (GWEC) [61,62]. The report proposes nine recommendations to address the skills gap:
- i.
- National energy policy should include engineering and technical workforce targets.
- ii.
- Introduce STEM courses to prepare students for entry-level wind jobs.
- iii.
- Investment in workforce training, apprenticeships, and upskilling to equip workers.
- iv.
- Encourage industrial policies and tendering standards that boost wind installation and local jobs.
- v.
- Encourage a technically skilled workforce from carbon-intensive industries to switch to wind power-industry occupations through specific retraining and reskilling programmes.
- vi.
- Diversity, equity, and inclusion should be encouraged to help attract and retain wind power industry workforces.
- vii.
- Enhance wind power workforce import, export, and dislocation policies.
- viii.
- Set operational health and safety standards and penalties for onshore and offshore wind power workforces.
- ix.
- Blend global standards and engineering and technical workforces’ initiatives to suit local needs.
(d) Enhancement of wind turbine reliability
Improving turbine reliability necessitates a holistic approach that includes routine inspections, modernising wind turbine systems, and enhanced monitoring. Key strategies include proactive maintenance, predictive maintenance procedures, and constant monitoring of critical components such as bearings and gearboxes. During their 20-year-plus lifespan, wind turbines experience technical issues and require more maintenance. Older turbines are less technologically advanced. Therefore, ageing wind farms require greater attention to technical issues.
Newer wind turbines still have reliability issues. To remain competitive and obtain contracts with wind farm developers, Original Equipment Manufacturers (OEMs) develop new wind turbine models to increase the capacity/price ratio, particularly by expanding wind turbine size and capacity [50]. The increasing number of new models and the increase in turbine size are both contributing to the deterioration of reliability issues. The stock market value of Siemens Gamesa, for instance, plummeted after the company disclosed major defects in a number of newly installed turbines. The defects were linked to wrinkles in the rotor blades and particulates discovered in the bearing components of Siemens Gamesa’s onshore turbine platforms: 4.X and 5.X [63]. The defects of these two turbine platforms led to a market withdrawal in mid-2023. Later, the company redesigned and relaunched the 4.X platform in 2025 and planned to relaunch the 5.X platform in 2026. The defects and subsequent recall led to significant financial losses for Siemens Gamesa and its parent company, Siemens Energy, with estimated costs reaching €1.6 billion (US$1.9 billion) to resolve the issues and produce the new ‘2.0’ models.
Most Western original equipment manufacturers (OEMs) are facing negative or low profit margins, which can be attributed to supply chain disruptions, increasing raw material costs, elevated capital costs due to inflation, geopolitical tensions stemming from their home countries, and issues related to equipment reliability. Additionally, Western OEMs face formidable challenges due to insufficient production capacity to meet global demand for wind power and profitability concerns that impede investments in new capacity expansions.
Research on both onshore and offshore power generation reveals that OEMs from China are using the highly developed, sophisticated, and extensive scale of their domestic supply chain and their strong financial, technological, and manufacturing capacity to expand their wind power capacity and businesses overseas, particularly in emerging markets in Asia, Africa, and South America. By 2032, China’s original equipment manufacturers aim to increase their total overseas exports by more than 100 GW capacity. Goldwind and Envision, two of China’s leading original equipment manufacturers, have established footholds in Eastern Europe, Africa, and the Middle East, and they compete with Western OEMs throughout Latin America and the rest of Asia and Oceania.
Most wind power supply chain’s profitability has been on the decline for quite some time. The new product development has slowed due to concerns about reliability and quality [64]. At present, warranty provisions account for 10% of wind power OEMs’ global sales. China’s OEMs continue to generate profits and accelerate the introduction of new products. Chinese OEMs have provided both domestic and international markets with a large quantity of new turbines, securing the global lead in average turbine size. In 2023, average offshore turbine ratings in China exceeded those in Europe, achieving 9.5 MW compared to 9.4 MW. Meanwhile, onshore, Chinese OEMs outpaced their Western counterparts by installing turbines rated at 5.4 MW and 5.1 MW, respectively. While economies of scale are crucial for new turbine designs to deliver value, Western OEMs are hesitant to implement significant changes in turbine design.
Over the last five years, Western OEMs have introduced new and larger turbine designs, yet they have faced challenges in achieving manufacturing economies of scale in a highly competitive global market. Larger turbines promise substantial cost reductions through more efficient material use and reduced turbine numbers, but they also expose manufacturers to higher logistics expenses and require significant new supply chain investment for larger components. Additionally, the size and complexity of the components increase the possibility of quality problems. The fast innovation race in most Western nations has resulted in shorter product lifecycles, insufficient testing times, and complex product portfolios [65], which in turn diminish the willingness to implement significant design changes and introduce new wind turbine products.
As Western OEMs decelerate, Asian OEMs maintain their lead in the design and production of new turbines. Following the phase-out of the Chinese feed-in tariff (FIT) in 2020, more than 12 competing OEMs have launched over 426 newly designed turbines, while all other companies have introduced just 29 new turbines [66]. Nine Chinese wind OEMs have disclosed plans for 10 MW+ onshore wind turbine platforms, a turbine scale unprecedented in other markets. China has announced the first 20 MW+ platforms in the offshore sector. Intense competition in China is driving turbine growth, as the market is predicted to expand by 6.2% yearly over the next 10 years. Furthermore, the increased cost pressure in the post-subsidy era encourages the use of larger turbines to reduce capital expenditure.
6.4. Interlink with Supply Chain, Rare Earth Elements (REEs), and Sustainability
The connections among supply chains, rare earth elements, and sustainability are very complex and full of contradictions. This issue is central to the global shift towards a greener and high-tech economy. It is not possible to solve the green energy problem while ignoring the negative effects of hazardous mining. For a truly healthy future, rare earth supply chains need to be reliable, varied, and circular. The objective is to use these elements’ special features to create environmentally friendly technology while reducing the damage to the environment and people that are currently affected by their production. Currently, this issue stands as one of the most significant environmental challenges. As discussed earlier, rare earth elements are needed to make wind turbines, energy storage systems, and electric vehicles; however, rare earth element mining and refining processes have historically been very detrimental for both the environment and society. The supply chain for rare earth elements consists of the following stages:
- (a)
- Mining: Extracting raw ore from the earth. This ore contains low concentrations of REEs mixed with other elements, including radioactive thorium and uranium.
- (b)
- Separation and Refining: This is the most technically challenging and environmentally damaging step. The different rare earth elements are chemically similar and must be separated through a process involving massive amounts of acids, solvents, and water. This generates vast quantities of toxic and radioactive waste.
- (c)
- Manufacturing: The purified rare earth oxides are turned into metals, alloys, and then permanent magnets and other components.
- (d)
- End-Use Manufacturing: These components are integrated into final products like EVs, smartphones, and wind turbines.
- (e)
- End-of-Life and Recycling: Currently, this is a very underdeveloped part of the chain. Most rare earth elements are not recycled due to technical difficulties and cost.
The distribution of rare earth elements within the supply chain exhibits a significant degree of clustering. For many years, while the majority of Western industrialised nations moved away from processing rare earth elements to prioritise environmental conservation, the carbon-intensive and environmentally detrimental practices, including mining, were transferred to developing countries, particularly China. Moreover, the processes of mining and processing require significant investment in both capital and technology. China assumed control of this technology- and finance-intensive industry, made substantial investments, and developed innovative technologies for mining and refining, leading to its management of over 60% of global mining and nearly 90% of refining capacity.
The relationship with sustainability presents both advantages and disadvantages. Sustainability rests on three pillars: environmental, social, and economic. The rare earth supply chain impacts all three, both positively and negatively. The “pro-sustainability” side is vital for the global community. Rare earth elements are enablers of green technology. Without them, the transition away from fossil fuels would be much slower and less efficient.
The environmental pillar (good aspect) encompasses (a) electric vehicles (EVs), which require high-performance permanent magnets like neodymium (Nd) and dysprosium (Dy), crucial for producing powerful, lightweight, and efficient electric motors; (b) wind power—the most effective wind turbines, particularly direct-drive offshore turbines, utilise substantial rare earth permanent magnets in their generators; and (c) energy efficiency—rare earth elements (REEs) are employed in LEDs, advanced batteries, and catalytic converters, all of which enhance energy efficiency and mitigate emissions.
The environmental pillar (damage aspect) encompasses (a) toxic and radioactive waste: the separation process generates tailing ponds that may leak acids, heavy metals, and radioactive substances into soil and groundwater, thereby contaminating ecosystems; (b) substantial water consumption and pollution—refining is highly water-intensive and can taint local water sources; and (c) habitat destruction and air pollution—open-pit mining and the energy-demanding refining process lead to land degradation and air pollution.
The economic pillar (good aspect) includes (a) employment by setting up a domestic supply chain for REEs and magnets that will lead to high-tech manufacturing and (b) technological leadership, securing a stable supply of REEs, and allow a country to lead in the green economy of the 21st century.
The economic pillar (risk aspect) includes supply chain vulnerability caused by concentrating refining in a region or country, which may result in a singular point of failure. Trade disputes, export restrictions, unilateral sanctions, and political instability can disrupt global supply chains, leading to price surges and halting the production of essential green technologies. Additionally, the cost of inaction—specifically, environmental remediation from historical mining—is prohibitively expensive and imposes a long-term economic burden.
The social pillar (human cost) encompasses (a) health hazards: communities near mining and refining sites can suffer from higher rates of cancer, respiratory diseases, and birth defects due to exposure to toxic and radioactive materials; (b) poor labour practices: poor working conditions and inadequate safety protections for workers; and (c) land rights: mining operations can displace local communities and indigenous peoples from their land without proper rehabilitation and compensation.
The way forward requires tackling sustainable rare earth element supply chains and logistics through a multifaceted strategy, including the following:
- (a)
- Process innovation by investing in “green mining” technology that consumes less water and harmful chemicals and generates less waste.
- (b)
- The circular economy (recycling and reuse) is the best sustainable long-term option. Efficient and cost-effective technologies for recovering REEs from end-of-life devices (e-waste, used EV motors, and wind turbines) must be developed.
- (c)
- Designs for disassembly will facilitate in the removal and recycling of rare earth magnets from manufactured goods.
- (d)
- Material substitution and reduction: alternative materials that can perform similarly to rare earth magnets while using fewer REEs or designs that rely less on REEs.
7. Discussion and Implications
Global wind capacity factors exhibit considerable variation, spanning from under 20% in low-wind regions to exceeding 45% in the most wind-rich nations, with an overall global average of approximately 27%. Principal elements contributing to variation include location, local topography, onshore versus offshore conditions, turbine ageing, and maintenance and repair activities. Capacity factors are significantly elevated in areas characterised by persistently robust winds. Hills can enhance wind flow, whilst uneven surfaces such as forests can impede it, both of which influence a turbine’s efficiency and, consequently, its capacity factor. Onshore wind power generation remains at various levels of development, characterised by diverse technology and resource availability. Offshore wind is very nascent and present in fewer nations; however, it is anticipated to expand. Throughout its lifespan, a turbine’s capacity factor may diminish due to ageing and physical deterioration. Moreover, in the absence of preventive maintenance and repairs, the capacity factor may decline further due to recurrent turbine power generation failures. Power evacuation limitations at load centres or national grids may also diminish capacity factor.
Table 18 depicts the geographical disparities in capacity factor variations for the years 2023 and 2024. The table indicates that the Euro/Asia region has an average capacity of approximately 24%, while the American continent exhibits a significantly greater capacity factor. The capacity factor in the United States exceeds 32%, while in South America, spearheaded by Brazil, it surpasses 35%. India and Africa have capacity factors below 20%. Conversely, Australia’s wind capacity factor exceeds the global average, surpassing 28%. In Europe, the United Kingdom exhibits a superior capacity factor of approximately 32%. China and continental Europe exhibit nearly identical capacity factors, approximately 24%.
Table 18.
Regional variability of wind power capacity factors in 2023 and 2024.
While having a high-capacity factor is advantageous for the economics of a single wind farm, regulating regional variability is critical for the overall stability and reliability of the power system. The future of wind power is not in a few highly productive farms but in a well-connected, geographically varied portfolio of wind farms that work together to provide a consistent and steady supply of electric power throughout a country, region, or continent.
Wind and solar photovoltaic energy, excluding hydro energy, are currently the primary renewable energy sources that need substantial expansion to meet net-zero emissions targets, with their capacity having steadily increased over recent decades. Figure 17 illustrates the global total generated wind power compared to solar power and the associated capacity factors of wind and solar photovoltaic systems from 1996 to 2023 [2]. Although both capacities have increased, wind possesses a capacity factor that is more than double that of solar PVs. Based on capacity factors over several decades, it is obvious that wind power will play a pivotal role in renewable power generation in the foreseeable future. Based on capacity factors accumulated over the course of several decades, it is apparent that wind power stands as the world’s best renewable energy prospect. Furthermore, it has less intermittency than solar power generation.
Figure 17.
Global total yearly wind and solar power generation (TWh) and their capacity factors.
Despite achieving considerable advancements in wind turbine technology, wind power generation remains predominantly confined to Western nations, China, and India due to the comparatively slow rate of cost reductions and the deficiency of a skilled workforce in the sector compared to solar photovoltaic power generation. This necessitates a unified effort to attain substantial cost savings and improved efficiency. Collaborative efforts and cooperative engagement from all stakeholders are crucial for sustaining the current momentum and rapid expansion of the wind power sector, as well as realising Sustainable Development Goal 7 (SDG 7).
SDG 7 aims to ensure access to affordable, reliable, and sustainable energy and power for all, especially in low-income countries where significant economic barriers and skill shortages hinder the adoption of wind power. It is noteworthy that from 2010 to 2021, the levelised cost of wind power generation (both onshore and offshore) decreased by around 60%, and the levelised cost of solar PV electricity declined by over 90% during the same timeframe [67]. This comparative reduction provided an advantage over wind power, despite the latter’s capacity factor being less than half that of wind power.
Achieving net zero emissions by 2050 and promoting sustainable development, particularly in emerging and developing nations, necessitates the use of wind energy and other renewable energy sources. Nonetheless, access to renewable energy is not uniform across all countries. Table 19 presents six general classifications of countries according to the availability of a specific energy type within their national jurisdiction. The presence of renewable and conventional energy sources within a nation’s geographic boundaries indicates the potential of energy to facilitate sustainable socioeconomic development, prosperity, and mitigating global climate impact.
Table 19.
Classification of energy-type countries.
An appropriate energy mix is a critical factor for ensuring energy security and sustainability. The energy mix is influenced by a country’s available energy resources, encompassing both domestic resources and imports, alongside decisions related to resource exploitation and the population’s standard of living. Multiple factors influence a nation’s selection of energy sources. The factors encompass available energy resources, population size, level of industrialisation, financial capacity and per capita GDP, energy consumption patterns and quantities, requirements of energy-intensive industries, technological know-how, and political and economic objectives. As shown in Table 19, countries categorised as Energy Types I, II, III, and IV demonstrate enhanced energy security due to their complete self-sufficiency in indigenous fuels and/or their ability to attain self-sufficiency through a combination of indigenous fuels and renewable energy sources. Energy Type V nations face a considerable disadvantage due to their deficiency in both conventional fuels and renewable energy sources. The optimal approach involves using nuclear power, importing cost-effective energy, and supplementing it with any available renewable energy. Type VI countries can achieve self-sufficiency through hydro energy, but not with alternative energy sources.
Globally, countries with coastal frontiers generally have a higher potential to harness wind energy for power generation. Landlocked nations also have the potential to generate power from wind energy. Whether generated wind power can fully substitute for power produced by fossil fuels is a separate consideration. Figure 18 presents a national wind power generation model that requires comprehensive inputs and actions from the government, power system stakeholders, and the wind power industry and is applicable to all countries regardless of their socioeconomic status or the amount of wind resources available in their territory.
Figure 18.
National wind power generation roadmap action plan.
The national wind power generation action plan encompasses a comprehensive array of tasks, activities, and initiatives, including the national energy context, the current status and prospects of wind power, policy frameworks, the advancement and implementation of wind power technologies, a vision for wind power development and CO2 reduction, workforce development, and the integration of power networks. These tasks and subtasks are not obligatory for all nations. They can be customised and modified to align with the national wind power generation strategy based on country-specific circumstances.
As discussed earlier, the wind energy density in coastal and offshore regions is markedly superior to that found onshore. More robust, regular, and less turbulent winds over water facilitate the deployment of larger, more efficient turbines. Offshore wind farms require fewer turbines to provide equivalent power compared to onshore wind farms, thanks to higher wind speeds and more stable wind direction. In comparison to onshore turbines, the aforementioned variables result in elevated capacity factors, indicating they function nearer to their maximum capacity. Nevertheless, substantial obstacles must be addressed when utilising offshore wind energy for power generation, including high construction and maintenance costs, challenges in power evacuation, severe marine conditions, intricate infrastructure requirements, potential environmental repercussions, and supply chain complications. It is quite likely that future wind power development will take place offshore. Figure 19 illustrates selected countries’ targets for offshore installed wind power by 2030.
Figure 19.
Selected countries’ target for offshore installed wind power by 2030, adapted from [11,68].
It is predicted that there will be a total of 500 GW of offshore wind power generation by 2030 in Asia (266 GW), Europe (190 GW), North America (35 GW), and Australia (9 GW), which would be six times more than the installed capacity in 2024. For the next five years, achieving such a target is highly ambitious but doable if significant concerted efforts are undertaken globally by mobilising the required financing, enhancing supply chain efficiency, lowering the cost of installation and wind turbine systems, and increasing the massive engineering and technically skilled workforce. Wind power development can offer enormous benefits for the economy, employment, and the environment. Despite having a bright future, vast wind energy remains unused for power generation globally.
One of the major challenges for sustainable wind power development is critical mineral availability. For some important minerals, the growth of supply from announced and confirmed wind power projects will be slower than the growth of demand. The most vulnerable minerals are copper, lithium, and rare earth elements (required for generators), raising new concerns about supply security and sustainable wind power. Despite the long planning periods, the development of new mining and processing ventures should be encouraged and supported. Wind turbine, solar photovoltaics, electric vehicles, and energy storage technologies—all of which are crucial to clean energy—need critical minerals, as shown in Table 20. For wind power generation, the critical minerals are copper, rare earth elements, and aluminium. For new energy vehicles (EVs), almost all minerals listed in Table 20 except chromium and zinc are vital. The solar photovoltaic cells need a stable supply of copper and aluminium.
Table 20.
Vital minerals for clean energy technologies, data source [7].
All stakeholders (government, policymakers, and the wind power industry) must recognise the risks associated with clean energy, including threats to energy security, critical minerals, rare earth elements, supply chain logistics, and shortages of skilled workers; they should also develop and investigate strategies to mitigate these issues. Improving and prioritising the cost-efficient recycling of decommissioned wind turbines, backed by financial and policy initiatives, effectively addresses challenges related to critical minerals and rare earth elements. The governments of many countries have devised policies for the creation of low-greenhouse gas emission initiatives in response to the Paris Agreement and nationally determined contributions (NDCs) commitment. Over 35 countries, including Australia, Canada, Japan, New Zealand, South Korea, European Union member states, and Chile, have established the objective of achieving net-zero emissions by 2050. To achieve these goals, there is an increasing transition from fossil fuels to renewable energy sources, particularly in wind power generation [59]. Despite this positive trend and the promising future of renewable wind power worldwide, major challenges are anticipated to obstruct the growth of wind power generation globally, postponing the transition to sustainable and renewable power sources unless international corrective action is taken. Table 21 provides an overview of the issues, their root causes, and potential remedial measures that can be implemented.
Table 21.
Challenges faced by the wind power industry, their root causes, and remedial measures.
Wind power generation, akin to other renewable energy sources, is very susceptible to a range of factors, including but not limited to cost, location, meteorological conditions, turbine technology, a skilled workforce, and operational and maintenance capacity. Consequently, achieving cost-effective, sustainable, and enduring renewable energy, particularly in wind power generation, necessitates research and collaboration, long-term planning, early governmental support for incubation, the development of a comprehensive value chain and logistical support, economies of scale, a robust manufacturing base, and the cultivation of engineering and highly skilled technical workforces. Despite entering the renewable energy sector far later than many Western countries, China’s emergence as a global leader in cost-effective renewable power generation is commendable and serves as a model to emulate.
7.1. Policy and Technology Integration in Wind Energy Sector
Integrating policy and technology is paramount in the wind energy field. Such efforts can speed up deployment, make the grid more stable, and reap the most economic and environmental benefits. The main issue is that technology changes faster than policies can keep up with. Therefore, a framework is needed where policies encourage the right technological advances, and those technologies, in turn, make policies more ambitious and successful. For the future of the wind energy business, it is important to stop thinking in silos. To make rules that encourage innovation, governments and policymakers need to know how to use technology and its benefits. Engineers, technologists, and manufacturers need to possess policy knowledge to create cutting-edge solutions that benefit both business and society.
To effectively use wind energy, governments and policymakers should make it easier to obtain permits, ensure the market’s stability over time, modernise power grids, and develop skilled human resources. For better flexibility and system stability, engineers, technology experts, and researchers suggest developing advanced technologies, such as floating turbines, smart rotors, and smart grid hardware. By combining cutting-edge policy frameworks with game-changing technologies, wind energy can be fully leveraged as a crucial component of a clean, reliable, and affordable power grid, expediting the transition to a green and sustainable power generation system.
7.2. Exploration and Replication of China’s Wind Power and OEM Achievements Abroad
China has formulated a long-term strategy to attain net zero carbon emissions by 2060, leveraging all its resources to exploit renewable energy for electricity generation [69]. As of 2024, China possesses an installed power generation capacity of 521 GW from wind, 887 GW from solar, and 431 GW from hydro energy. Global renewable electricity generation would be at 50 percent of its current level without China’s substantial contributions. China has established its original equipment manufacturing base, comprising six of the top 10 worldwide wind turbine OEMs, including the leading three, along with a comprehensive supply chain, logistics, and research and development initiatives to satisfy both domestic and growing international demands.
Massive infrastructures such as highways and expressways, high-speed rails, ultra-modern ports, airports, airlines, and global shipping lines have significantly reduced logistics, manufacturing, and shipment costs. China’s high-tech manufacturing consists of semiconductors, quantum computing, robotics, artificial intelligence, 5G and 6G internet, and telecommunications developed by its own company, Huawei. Refining and processing critical minerals and metal steel industries are making industrial production cheaper.
Apart from the above-mentioned world-class infrastructure, a highly skilled, specialised workforce, and an integrated supply chain contribute to China’s astonishing success in every sector, including renewable power generation through wind and solar energy. China’s unmatched success stems from a complex interaction of political, social, and economic elements and is founded on significant R&D expenditures made in close coordination with universities, industry, and the government. One of the main reasons for the success of Chinese industrial development is the state-led economic development model, which includes i) strong industrial policies that guide economic growth, ii) public (state-owned) banks providing favourable loans to key industries, and iii) public (state-owned) enterprises managing important parts of the industry and economy. China upholds state-owned enterprises (SOEs) that embody public ownership of natural monopolies. The sectors of infrastructure, transportation, energy, metalworking, mining, and telecommunications—often regarded as the commanding heights of the economy—continue to be predominantly under public ownership. The state-owned enterprises have reduced the overall cost of production and enhanced economies of scale, thereby amplifying the competitive edge of exports across all manufacturing sectors, notably in wind power and photovoltaic systems.
In a nutshell, the wind power and OEM (original equipment manufacturer) successes in China can be traced back to the country’s well-planned industrial policies, innovative technologies, trained workforce, and intricate supply chain and logistics systems. These systems evolved in two interrelated stages: the first was the domestic foundation, which encouraged learning and scale to lower costs and improve technology; the second was the exploration of foreign markets. Depending on demographics, socioeconomic status, and technical capability, some of these aspects of success can be adapted and reproduced in other countries or regions to enhance wind power generation.
8. Concluding Remarks and Recommendations
The study analyses the current state of the art in global wind power generation and the challenges and issues faced by the wind power industry. Here are the key findings from the study.
- a.
- Wind power generation is currently restricted in high- or upper-middle-income countries. Countries with lower-middle incomes are falling far behind. At present, there is no appreciable wind power generation in low-income counties. Low- and lower-middle-income countries, which include most African countries and some Asian countries, require strong support with access to low-cost finance and price-competitive wind OEMs.
- b.
- A national action plan is proposed for wind power generation that encompasses diverse tasks and activities, emphasising the need for an assessment of the wind energy landscape, the present and future perspective of wind power, policy directives, the advancement and application of wind power technologies, objectives for wind power expansion and CO2 reduction, workforce preparation and training, and the integration of power networks, all of which can be tailored to the specific requirements of any country.
- c.
- To aid governments, legislators, and other wind power stakeholders in developing plans for wind power generation, this study presents the current challenges faced by wind power generation, their causes, and possible remedial actions.
- d.
- The study provides a classification of countries into six categories based on the availability of specific energy types within their national jurisdictions. The optimal energy mix for achieving energy security, sustainability, and climate impact mitigation should be determined by a nation’s accessible and affordable energy resources.
- e.
- Wind turbine systems are becoming more expensive and less profitable due to factors such as increased inflation, reduced financial assistance, supply chain and logistics issues, a scarcity of rare earth minerals, and their high cost. Cooperative initiatives are essential to tackle these difficulties and realise the full advantages of renewable wind energy throughout all regions, irrespective of a nation’s socioeconomic status.
- f.
- Wind OEMs from Asia, led by China, are more competitive compared to Western OEMs due to their ongoing investment in research and development, product variety, scale of economy, and experience gained from their local market competition. With competitive prices, the OEMs, especially those from China, are in a better position to offer wind turbine systems not only in their domestic markets but also in those in Europe, South America, and other parts of the world.
- g.
- Wind power presently encounters a deficit of engineering and technically proficient personnel worldwide. By 2030, well over one million technically proficient professionals will be necessary to design, manufacture, install, maintain, operate, and repair large-scale wind power installations worldwide. Global and country-specific initiatives are absolutely necessary for skills development programmes to tackle the deficiency of engineering and technically proficient personnel and fully realise the advantages of wind power for sustainable living and development.
- h.
- Emerging and developing nations must establish collaboration strategies with competitive wind turbine system OEM companies and countries that offer low-cost, favourable financing. This approach is essential for enhancing their wind power harnessing capabilities and for fostering necessary in-house skills development.
- i.
- Wind power grows roughly 5% annually. Wind power’s greater capacity factor makes it the world’s largest non-hydro renewable electricity source, generating more than solar despite its slower growth rate. In 2024, global wind power generation reached 2300 TWh, while solar power generation was 1600 TWh, despite solar having 400 GW more installed capacity than wind.
- j.
- Despite having a higher capacity for wind power generation compared to onshore wind, the high upfront cost and subsequent increased operating and maintenance expenses pose a significant challenge to the sustainable development of offshore wind power.
- k.
- A notable knowledge gap is emerging globally, particularly in emerging and developing countries, except China, due to insufficient fundamental and applied research in areas such as human skill development, operation, maintenance and repair, and plant balance. It is essential to mobilise research efforts and resources to address this knowledge gap.
Author Contributions
The authors’ contributions to this article are as follows: F.A.: Conceptualization, literature review, methodology, and writing—original draft preparation Y.J.: Writing—reviewing and editing, graphics. X.H.: Writing, graphics, and validation. All authors have read and agreed to the published version of the manuscript.
Funding
This research received no external funding.
Data Availability Statement
Data will be made available on request.
Conflicts of Interest
The authors declare no conflict of interest.
References
- Alam, F.; Jin, Y. The Utilisation of Small Wind Turbines in Built-Up Areas: Prospects and Challenges. Wind 2023, 3, 418–439. [Google Scholar] [CrossRef] [Scilit]
- Global Wind Energy Council (GWEC). Global Offshore Wind Report 2024. Available online: https://www.gwec.net/reports (accessed on 20 March 2025).
- International Energy Agency (IEA). Wind Has Significant Potential to Increase Countries’ Renewable Capacity Growth, Renewables 2024. Available online: https://www.iea.org/energy-system/renewables/wind (accessed on 27 February 2025).
- GWEC Global Offshore Wind Report 2025. Available online: https://tethys.pnnl.gov/sites/default/files/publications/Williams-et-al-2025.pdf (accessed on 6 November 2025).
- Renewable Energy Statistics 2025, IRENA. Available online: https://www.irena.org/Publications/2025/Jul/Renewable-energy-statistics-2025 (accessed on 5 November 2025).
- Renewable Energy Statistics 2024, IRENA. Available online: https://www.irena.org/Publications/2024/Jul/Renewable-energy-statistics-2024 (accessed on 25 June 2025).
- International Energy Agency (IEA). The Role of Critical Minerals in Clean Energy Transitions. 2022. Available online: https://www.iea.org/reports/the-role-of-critical-minerals-in-clean-energy-transitions (accessed on 12 November 2024).
- International Energy Agency (IEA). World Energy Outlook 2024. Available online: https://iea.blob.core.windows.net/assets/140a0470-5b90-4922-a0e9-838b3ac6918c/WorldEnergyOutlook2024.pdf (accessed on 23 February 2025).
- International Renewable Energy Agency (IRENA). Renewable Energy Statistics; International Renewable Energy Agency (IRENA): Abu Dhabi, United Arab Emirates, 2023; ISBN 978-92-9260-537-7. Available online: https://www.irena.org/Publications/2023/Jul/Renewable-energy-statistics-2023 (accessed on 14 January 2025).
- IEA Global Energy Review 2025. Available online: https://www.iea.org/reports/global-energy-review-2025 (accessed on 31 October 2025).
- Allianz Commercial. A Turning Point For Offshore Wind. 2024. pp. 1–37. Available online: https://www.allianz.com/content/dam/onemarketing/azcom/Allianz_com/press/document/Allianz-Commercial_A-turning-point-for-offshore-wind.pdf (accessed on 25 March 2025).
- Ghoshal, A. Colossal 20-MW Wind Turbine is The Largest on the Planet (For Now); New Atlas: Longmont, CO, USA, 2024; Available online: https://newatlas.com/energy/world-largest-offshore-wind-turbine-20-mw-mingyang/ (accessed on 9 January 2025).
- Wind Turbine Market 2024. Available online: https://market.us/report/wind-turbine-market/ (accessed on 27 May 2025).
- De Vries, O. On the Theory of the Horizontal-Axis Wind Turbine. Annu. Rev. Fluid Mech. 1983, 15, 77–96. [Google Scholar] [CrossRef] [Scilit]
- Dewan, A.; Tomar, S.S.; Bishnoi, A.K.; Singh, T.P. Computational fluid dynamics and turbulence modelling in various blades of Savonius turbines for wind and hydro energy: Progress and perspectives. Ocean. Eng. 2023, 283, 115168. [Google Scholar] [CrossRef] [Scilit]
- Damota, J.B.; García, J.d.D.R.; Casanova, A.C.; Miranda, J.T.; Caccia, C.G.; Galdo, M.I.L. Analysis of a Nature-Inspired Shape for a Vertical Axis Wind Turbine. Appl. Sci. 2022, 12, 7018. [Google Scholar] [CrossRef] [Scilit]
- Wind Turbine Components. Available online: https://windmillstech.com/wind-turbine-components/ (accessed on 22 May 2025).
- Loganathan, B.; Chowdhury, H.; Mustary, I.; Rana, M.M.; Alam, F. Design of a micro wind turbine and its economic feasibility study for residential power generation in built-up areas. Energy Procedia 2019, 160, 812–819. [Google Scholar] [CrossRef] [Scilit]
- Alam, F.; Ali, A.; Khan, I.; Mobin, S. Status of Power Generation by Domestic Scale Wind Turbines in Australia. Procedia Eng. 2012, 49, 205–212. [Google Scholar] [CrossRef] [Scilit]
- Global Electricity Review 2025 (Global Electricity Source Trends). Available online: https://ember-energy.org/latest-insights/global-electricity-review-2025/global-electricity-source-trends/ (accessed on 7 November 2025).
- Zhao, L.; Yang, Y.; Bai, X.; Chen, L.; Lu, A.; Zhang, X.; Chen, W.Q. Structure, robustness and supply risk in the global wind turbine trade network. Renew. Sustain. Energy Rev. 2023, 177, 113214. [Google Scholar] [CrossRef] [Scilit]
- Bošnjakovi, M.; Katini, M.; Santa, R.; Mari, D. Wind Turbine Technology Trends. Appl. Sci. 2022, 12, 8653. [Google Scholar] [CrossRef] [Scilit]
- Mostafaeipour, A. Productivity and development issues of global wind turbine industry. Renew. Sustain. Energy Rev. 2010, 14, 1048–1058. [Google Scholar] [CrossRef] [Scilit]
- Hansen, U.E.; Larsen, T.H.; Bhasin, S.; Burgers, R.; Larsen, H. Innovation capability building in subsidiaries of multinational companies in emerging economies: Insights from the wind turbine industry. J. Clean. Prod. 2020, 244, 118746. [Google Scholar] [CrossRef] [Scilit]
- Chong, W.-T.; Muzammil, W.K.; Wong, K.-H.; Wang, C.-T.; Gwani, M.; Chu, Y.-J.; Poh, S.-C. Cross axis wind turbine: Pushing the limit of wind turbine technology with complementary design. Appl. Energy 2017, 207, 78–95. [Google Scholar] [CrossRef] [Scilit]
- Rahman, M.; Ong, Z.C.; Chong, W.T.; Julai, S.; Khoo, S.Y. Performance enhancement of wind turbine systems with vibration control: A review. Renew. Sustain. Energy Rev. 2015, 51, 43–54. [Google Scholar] [CrossRef] [Scilit]
- Metreau, E.; Young, K.E.; Eapen, S.G. World Bank Country Classifications by Income Level for 2024–2025; The World Bank: Washington, DC, USA, 2024; Available online: https://blogs.worldbank.org/en/opendata/world-bank-country-classifications-by-income-level-for-2024-2025 (accessed on 19 February 2025).
- International Monetary Fund (IMF) Report on World Economic Outlook October 2025, GDP Per Capita, Current Prices. Available online: https://www.imf.org/external/datamapper/NGDPDPC@WEO/OEMDC/ADVEC/WEOWORLD (accessed on 8 November 2025).
- The US Department of Energy (DOE). From 1970s Pioneers to Today’s Wind Industry, Aerospace Researchers Championed Wind Energy. 2024. Available online: https://www.energy.gov/eere/wind/articles/1970s-pioneers-todays-wind-industry-aerospace-researchers-championed-wind-energy (accessed on 12 June 2025).
- Shahan, Z. History of Wind Turbines; Renewable Energy World: Arlington, VA, USA, 2014; Available online: https://www.renewableenergyworld.com/wind-power/turbines-equipment/history-of-wind-turbines/?related=headlines (accessed on 30 January 2025).
- GWEC Global Wind Report 2025. Available online: https://www.gwec.net/reports/globalwindreport (accessed on 16 May 2025).
- BloombergNEF (BNEF). Available online: https://about.bnef.com/blog/chinese-manufacturers-lead-global-wind-turbine-installations-bloombergnef-report-shows/ (accessed on 16 May 2025).
- Wood Mackenzie 2024. China Leads Global Wind Turbine Manufacturers’ Market Share in 2023. Available online: https://www.woodmac.com/press-releases/2024-press-releases/global-wind-oem-marketshare/ (accessed on 19 January 2025).
- Wood Mackenzie 2025. Available online: https://www.woodmac.com/press-releases/2024-press-releases/chinese-oems-sweep-the-global-wind-podium-for-the-first-time/ (accessed on 14 March 2025).
- Global Wind Energy Council (GWEC). Global Wind Workforce Outlook 2023–2027. 2024. Available online: https://www.gwec.net/reports/global-wind-workforce-outlook/2023-2027 (accessed on 10 April 2025).
- Blewett, D. Wind Turbine Cost: How Much? Are They Worth It in 2024? Available online: https://weatherguardwind.com/how-much-does-wind-turbine-cost-worth-it/ (accessed on 18 December 2024).
- Guide to a Floating Offshore Wind Farm, Wind Fram Costs. 2023. Available online: https://guidetofloatingoffshorewind.com/wind-farm-costs/ (accessed on 14 February 2025).
- National Renewable Energy Laboratory (NREL). Cost of Wind Energy Review: 2024 Edition. Available online: https://docs.nrel.gov/docs/fy25osti/91775.pdf (accessed on 14 February 2025).
- Wiser, R.; Bolinger, M.; Lantz, E. Assessing Wind Power Operating Costs in the United States: Results from a Survey of Wind Industry Experts, Department of Environment, USA. 2019. Available online: https://www.osti.gov/servlets/purl/1544993 (accessed on 26 May 2025).
- Veers, P. Grand Challenges in Wind Energy Science; National Renewable Energy Laboratory (NREL): Golden, CO, USA, 2024. Available online: https://www.nrel.gov/wind/grand-challenges.html (accessed on 13 December 2024).
- McCoy, M.; Musial, W.; Hammond, R.; Hernando, D.M.; Duffy, P.; Beiter, P.; Pérez, P.; Baranowski, R.; Reber, G.; Spitsen, P. Offshore Wind Market Report 2024; NREL: Golden, CO, USA, 2024. Available online: https://www.nrel.gov/docs/fy24osti/90525.pdf (accessed on 10 April 2025).
- Abeni, M. Where are Solar Panels Made? Available online: https://www.sunsave.energy/solar-panels-advice/solar-energy/where-are-solar-panels-made (accessed on 14 May 2025).
- Statista. Share of the Global Electric Vehicle Lithium-Ion Battery Manufacturing Capacity in 2021 with a Forecast for 2025, by Country. Available online: https://www.statista.com/statistics/1249871/share-of-the-global-lithium-ion-battery-manufacturing-capacity-by-country/ (accessed on 15 May 2025).
- Belder, D. Top 10 Copper Producers by Country. Available online: https://investingnews.com/daily/resource-investing/base-metals-investing/copper-investing/copper-production-country/ (accessed on 19 May 2025).
- Jaganmohan, M. Mine Production of Copper Worldwide from 2010 to 2024. 2025. Available online: https://www.statista.com/statistics/254839/copper-production-by-country/ (accessed on 8 June 2025).
- Pistilli, M. Top 10 Countries for Zinc Production. Available online: https://investingnews.com/daily/resource-investing/base-metals-investing/zinc-investing/top-zinc-producing-countries/ (accessed on 19 May 2025).
- Russian Supply to Boost Global Zinc Production Growth in 2024. Available online: https://mine.nridigital.com/mine_may24/global-zinc-production-forecast (accessed on 6 June 2025).
- Pistilli, M. Top 10 Countries by Rare Earth Metal Production. Available online: https://investingnews.com/daily/resource-investing/critical-metals-investing/rare-earth-investing/rare-earth-metal-production/ (accessed on 19 May 2025).
- Jaganmohan, M. Distribution of Rare Earths Production Worldwide as of 2024, by Country. Available online: https://www.statista.com/statistics/270277/mining-of-rare-earths-by-country/ (accessed on 5 May 2025).
- Geoscience Australia 2023. Rare Earth Elements. Available online: https://www.ga.gov.au/scientific-topics/minerals/mineral-resources-and-advice/australian-resource-reviews/rare-earth-elements (accessed on 27 May 2025).
- Hoffs, C. Just and Sustainable Solutions for the Mining and Recycling of Rare Earth Elements in Wind Turbines. Available online: https://blog.ucs.org/charlie-hoffs/just-and-sustainable-solutions-for-the-mining-and-recycling-of-rare-earth-elements-in-wind-turbines/ (accessed on 16 May 2025).
- GWEC Global Wind Report 2023. Available online: https://www.enertechnos.com/wp-content/uploads/2023/12/GWEC-2023-Report.pdf (accessed on 8 April 2025).
- IEA Global Critical Minerals Outlook 2025. Available online: https://www.iea.org/reports/global-critical-minerals-outlook-2025 (accessed on 24 May 2025).
- Casey, T. How Innovators Are Solving the Wind Industry’s Recycling Problem. 2024. Available online: https://www.triplepundit.com/story/2024/wind-industry-recycling/811771 (accessed on 15 May 2025).
- Hicks, W. NREL Researchers Point to Path for Improved Wind Blade Recycling Rates. 2022. Available online: https://www.nrel.gov/news/detail/program/2022/nrel-researchers-point-to-path-for-improved-wind-blade-recycling-rates (accessed on 6 June 2025).
- Cooperman, A.; Eberle, A.; Lantz, E. Wind turbine blade material in the United States: Quantities, costs, and end-of-life options. Resour. Conserv. Recycl. 2021, 168, 105439. [Google Scholar] [CrossRef] [Scilit]
- Liqiang, H.; Dongme, H. Old Turbines Remade as Robust Goods; China Daily: Beijing, China, 2025; Available online: https://www.chinadaily.com.cn/a/202502/21/WS67b7cdbaa310c240449d66f8.html (accessed on 18 May 2025).
- Richard, C. Analysis: How the Ukraine War Changed Wind Power in Europe Forever; Wind Power Monthly: London, UK, 2024; Available online: https://www.windpowermonthly.com/article/1862645/analysis-ukraine-war-changed-wind-power-europe-forever (accessed on 11 June 2025).
- Five Challenges to Ensure Wind Energy Development Through the Energy Transition. 2024. Available online: https://www.alcimed.com/en/insights/wind-energy-development/ (accessed on 5 December 2024).
- Janipour, Z. Winds of Change: Europe Strives to Shield Domestic Wind Turbine Industry as Chinese Rivals Breeze in; Rabobank: Utrecht, The Netherlands, 2024; Available online: https://www.rabobank.com/knowledge/d011459200-winds-of-change-europe-strives-to-shield-domestic-wind-turbine-industry-as-chinese-rivals-breeze-in (accessed on 11 June 2025).
- Global Wind Organisation (GWO). More Training Key to New Workforce in Latest Forecast, Global Wind Workforce Outlook 2024–2028. 2024. Available online: https://www.globalwindsafety.org/news/more-training-key-to-new-workforce-in-latest-forecast (accessed on 28 March 2025).
- GWEC Industrial Policy Paper 2025, Building Offshore Wind Economies in Asia Pacific. Available online: https://www.gwec.net/building-offshore-wind-economies-in-apac-strategic-pathways-for-industrial-growth (accessed on 1 November 2025).
- Tunnicliffe, A. Wind Turbine Flaws Put Siemens in a Headwind; Future Power Technology: Bengaluru, India, 2023; Available online: https://power.nridigital.com/future_power_technology_oct23/siemens-energy-wind-turbine-faults (accessed on 10 May 2025).
- Lico, E. Global Wind Supply Chain and Technology; Woodmac: Edinburgh, UK, 2023; Available online: https://www.woodmac.com/news/opinion/western-wind-turbine-manufacturers-are-prioritising-profit-over-volume-opening-the-door-for-chinese-market-share-growth/ (accessed on 28 December 2024).
- Lico, E. Wind Turbine Technology Evolution is Diverging Quickly Between China and the Rest of the World; Woodmac: Edinburgh, UK, 2024; Available online: https://www.woodmac.com/news/opinion/wind-turbine-technology-evolution-is-diverging-quickly-between-china-and-the-rest-of-the-world/ (accessed on 28 December 2024).
- Harley, A. Explainer: China’s Dominance in Wind Turbine Manufacturing; Reuters: London, UK, 2024; Available online: https://www.reuters.com/business/energy/chinas-dominance-wind-turbine-manufacturing-2024-04-10/ (accessed on 28 December 2024).
- Wang, Z.; Liu, S.; Tao, Z.; Cao, Q. The impact of industrial policy and its combinations on the innovation quality of wind power enterprises: A study from the perspective of financing modes. Renew. Energy 2022, 188, 945–956. [Google Scholar] [CrossRef] [Scilit]
- Map Chart. 2024. Available online: https://www.mapchart.net/world.html (accessed on 11 October 2024).
- Zhang, S.; Chen, W. China’s Energy Transition Pathway in a Carbon Neutral Vision. Engineering 2022, 14, 64–76. [Google Scholar] [CrossRef] [Scilit]
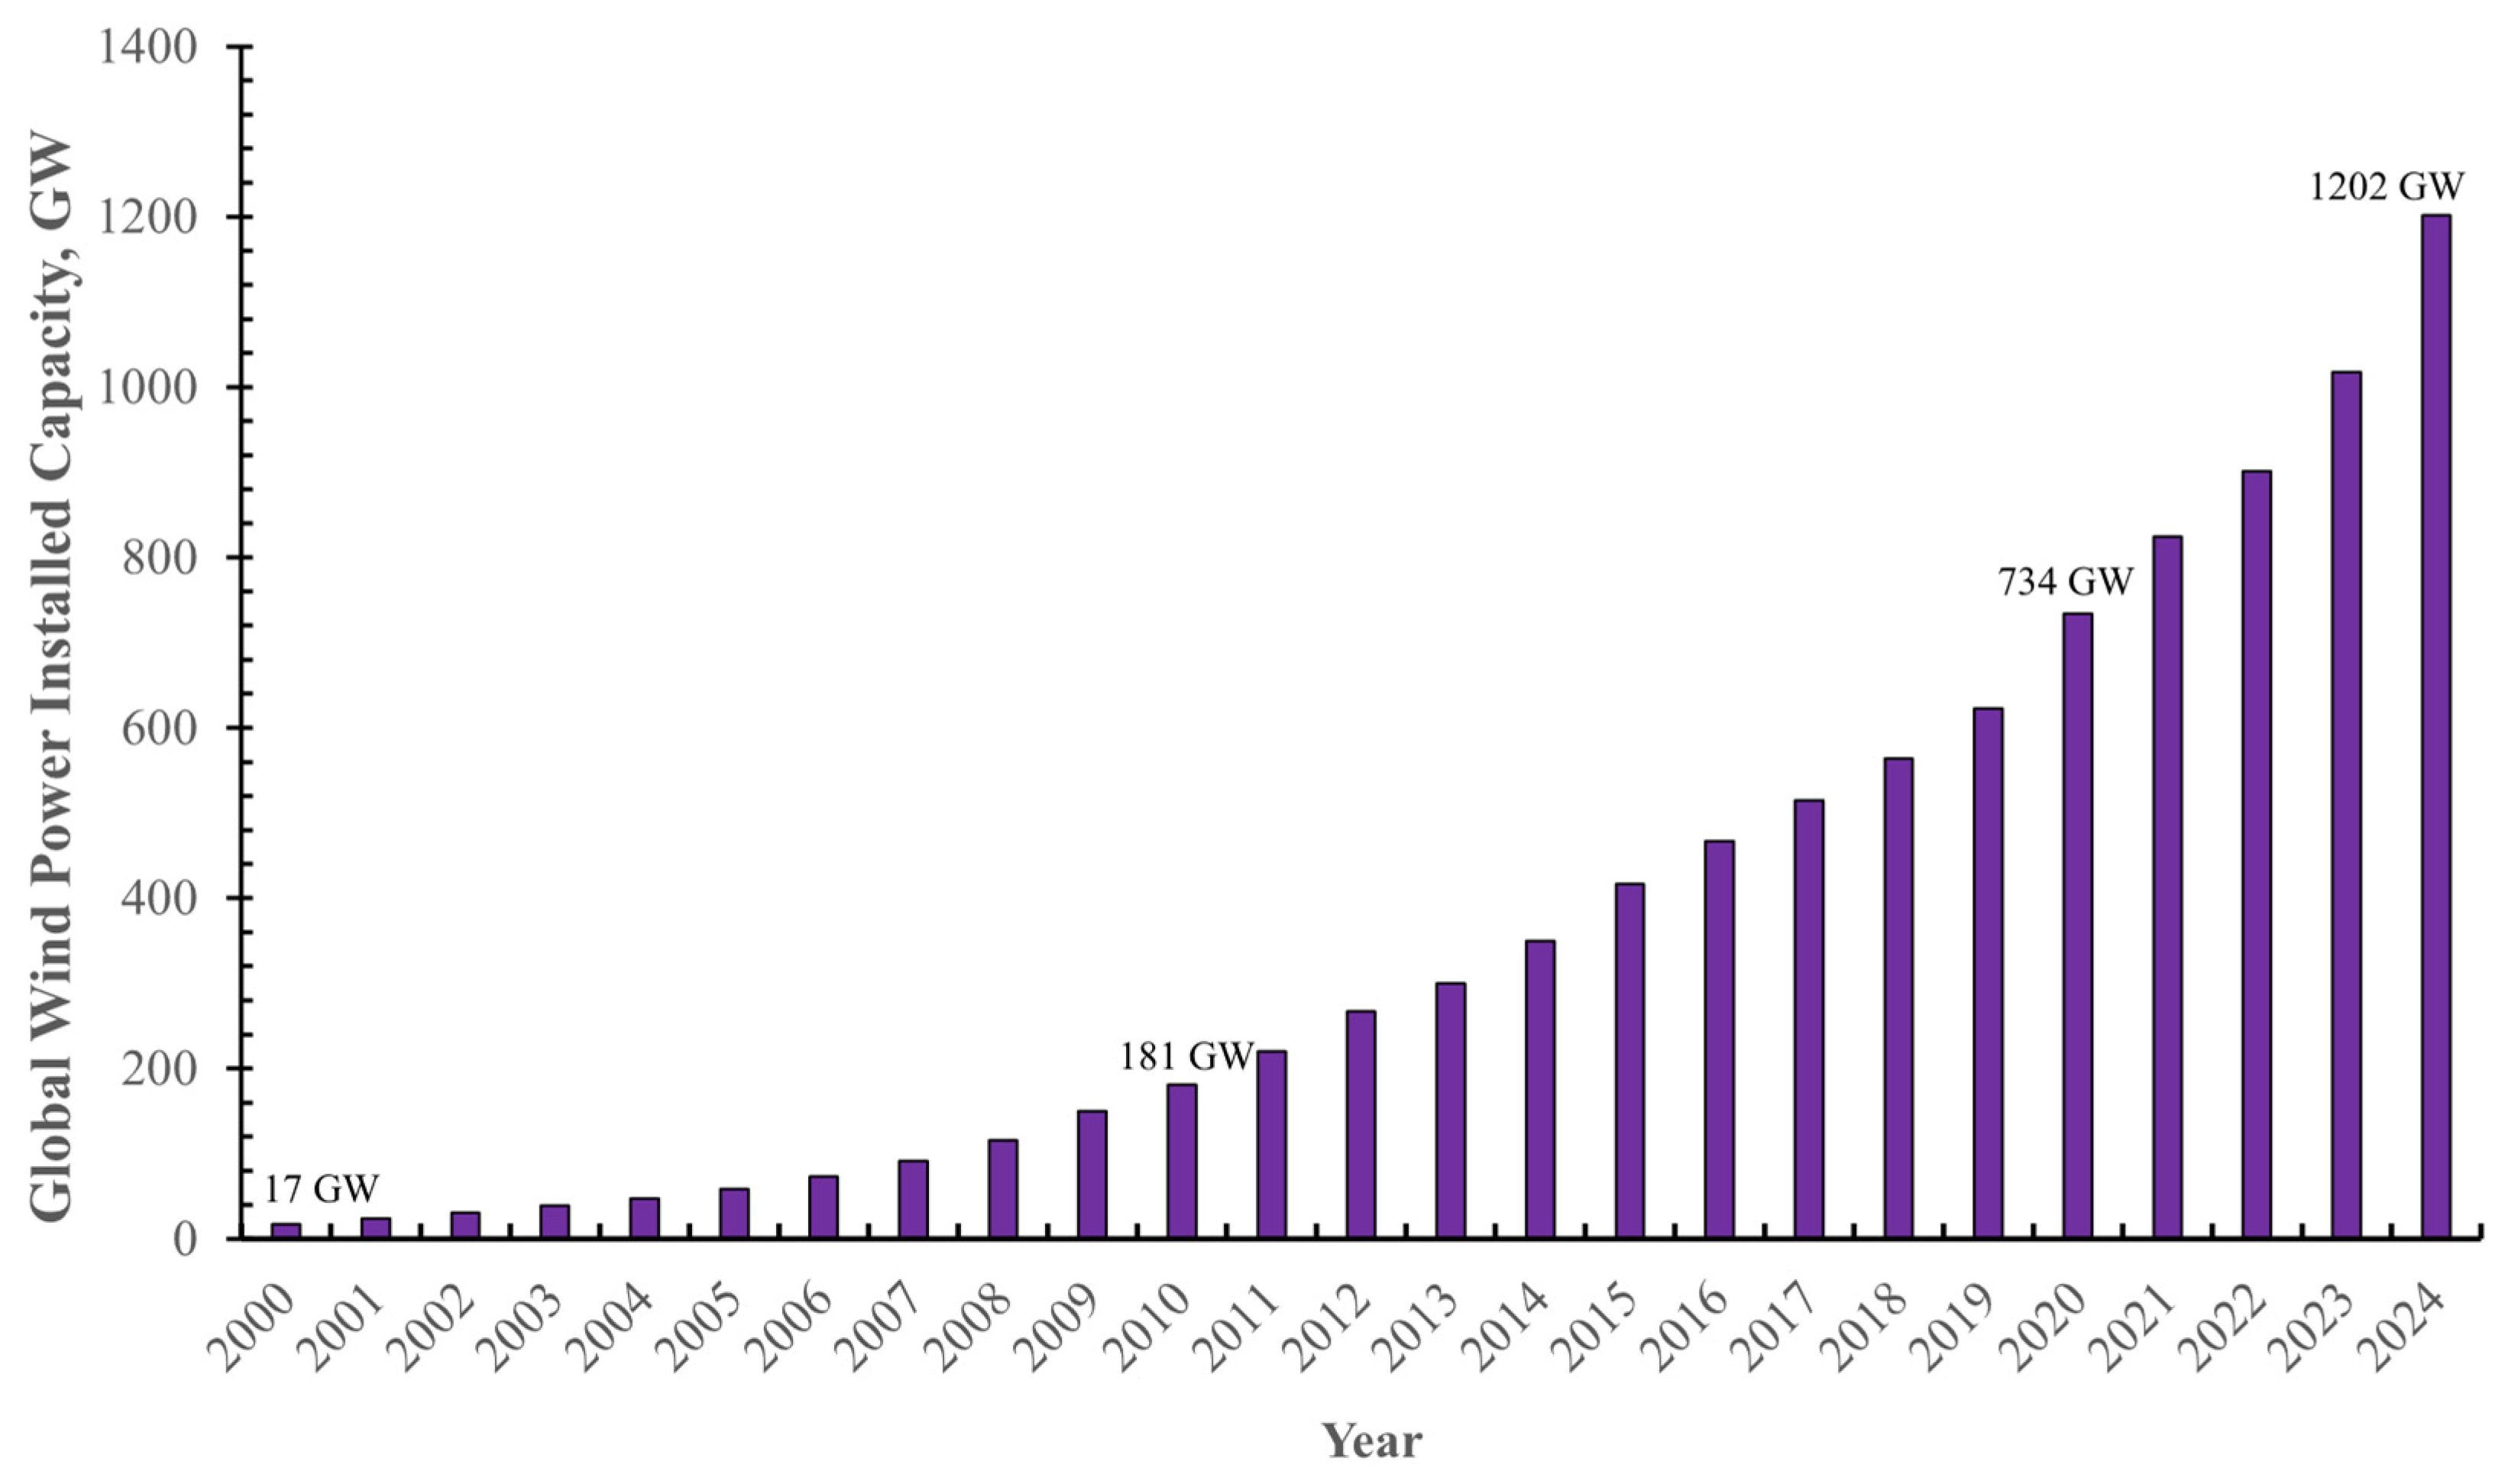
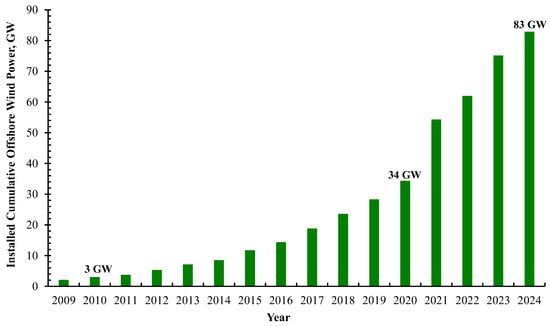
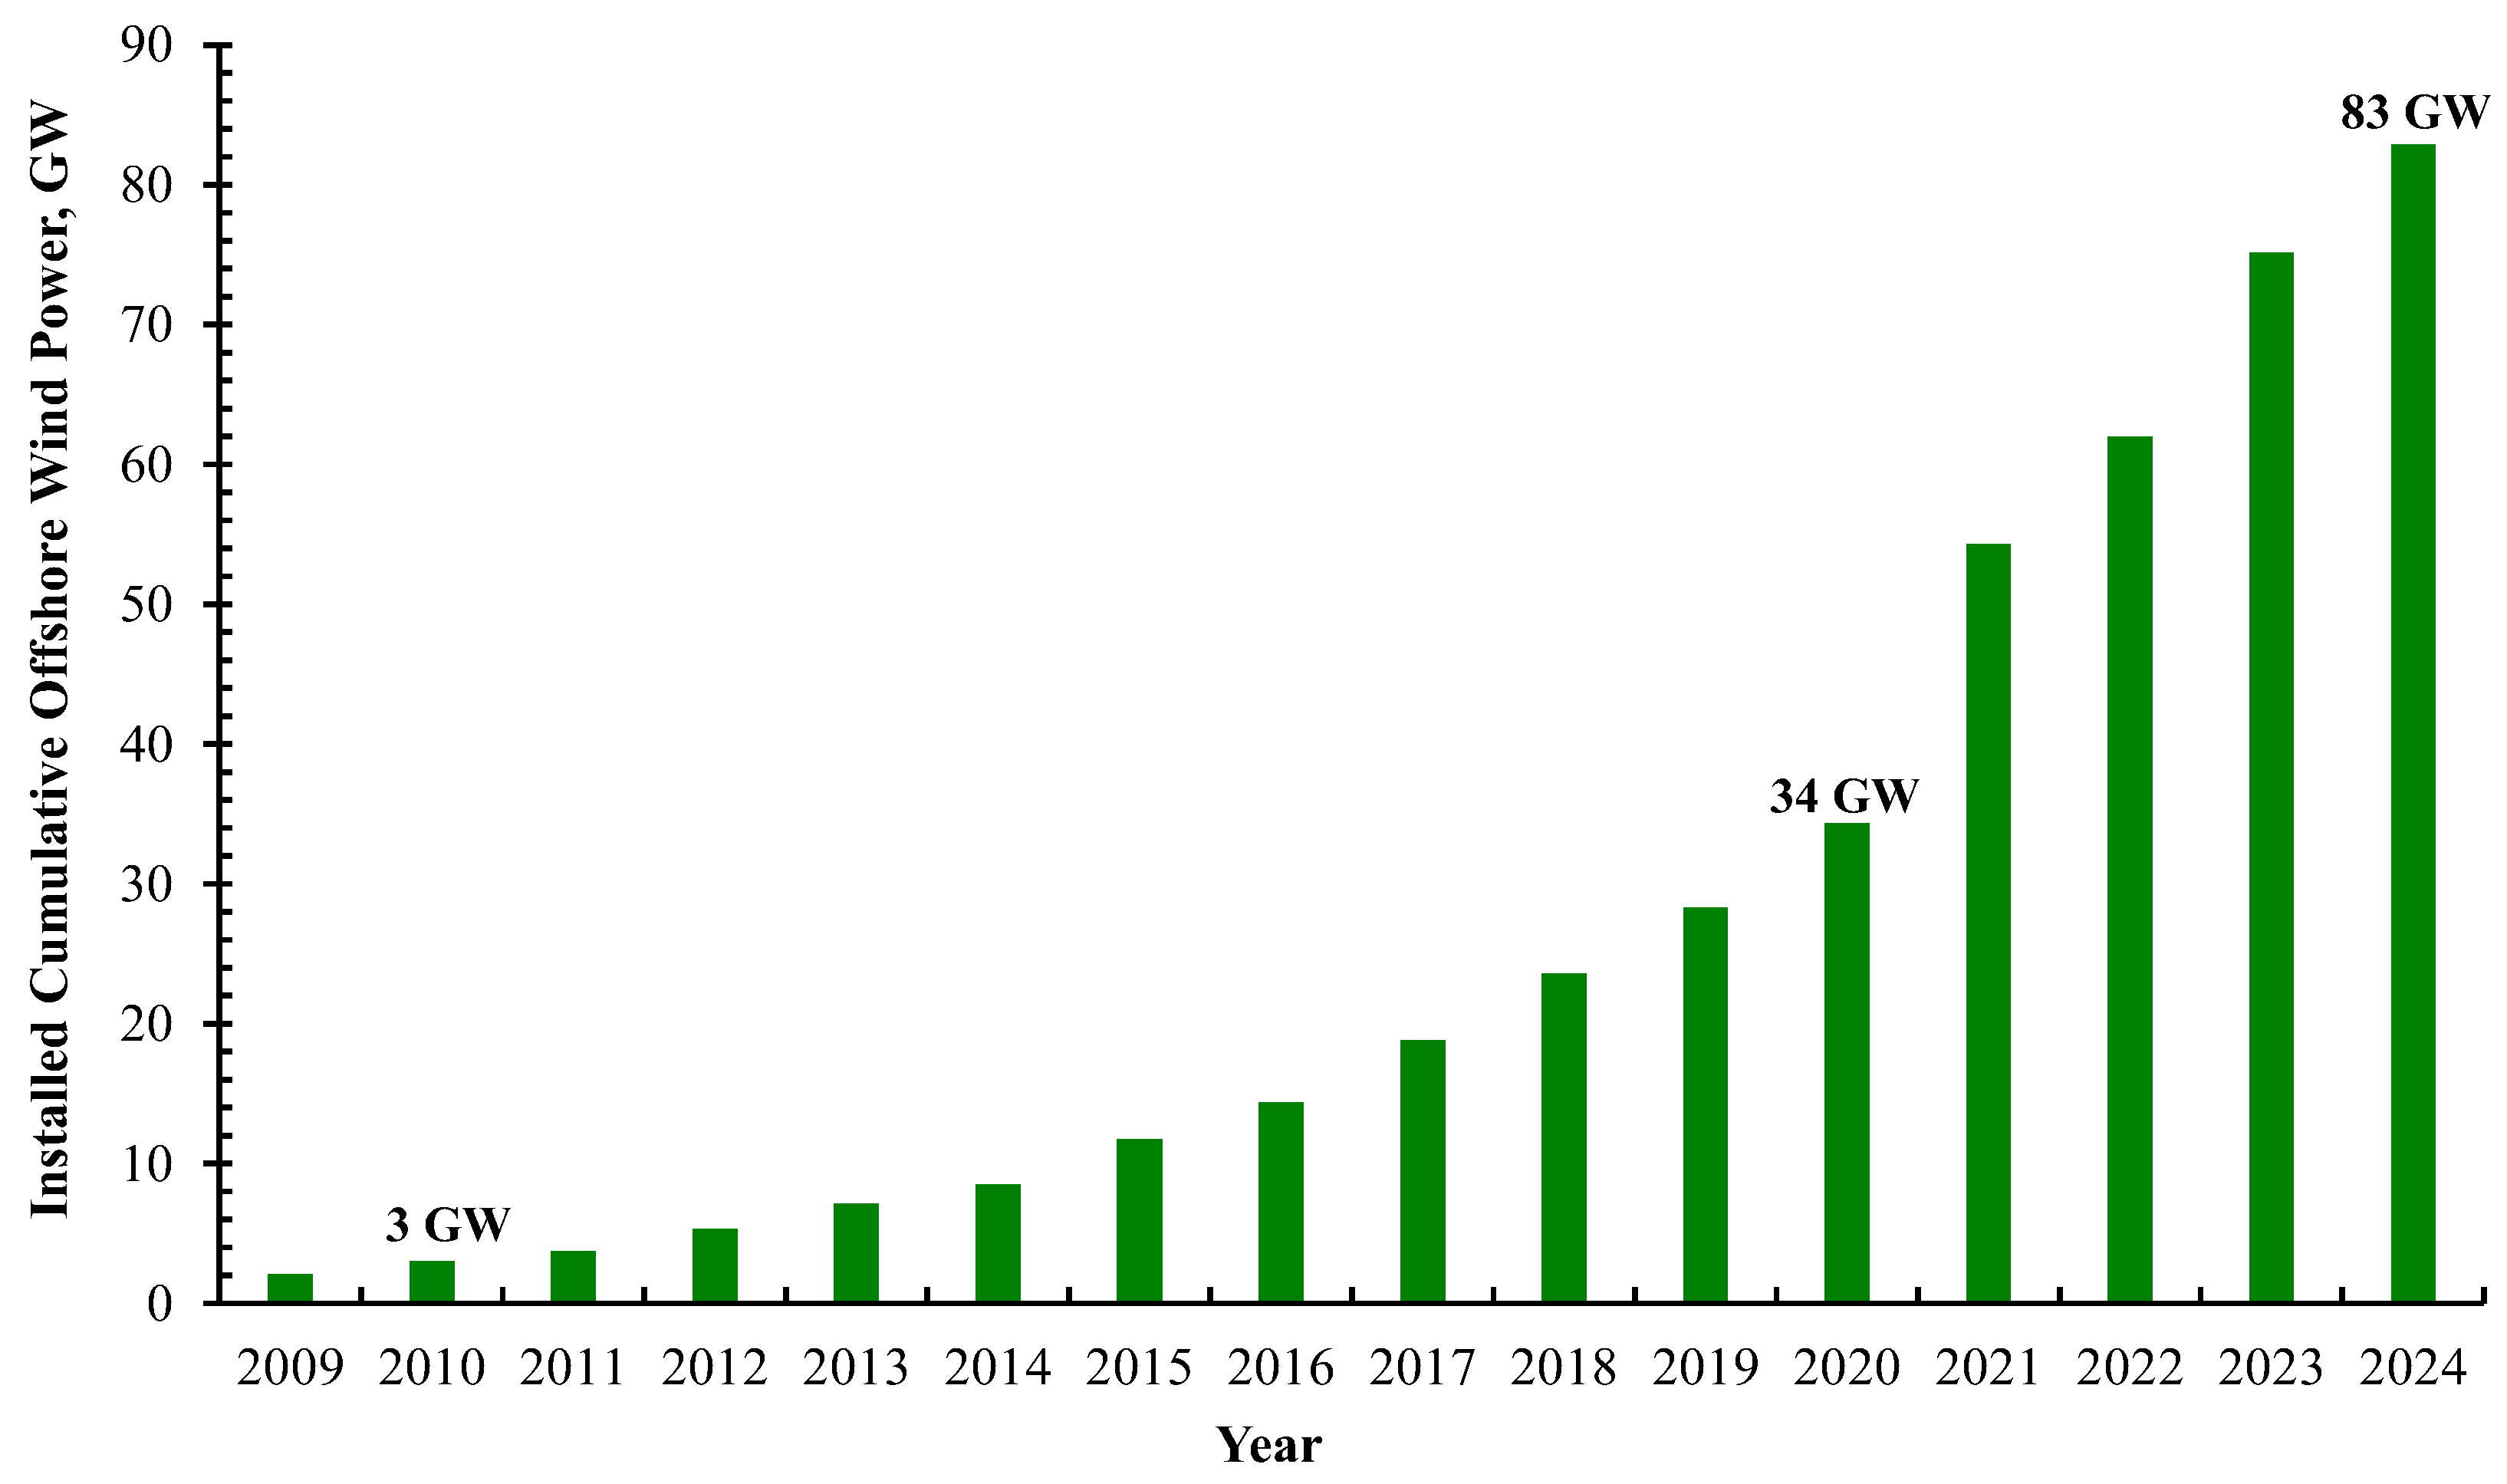
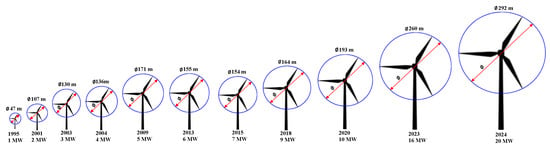
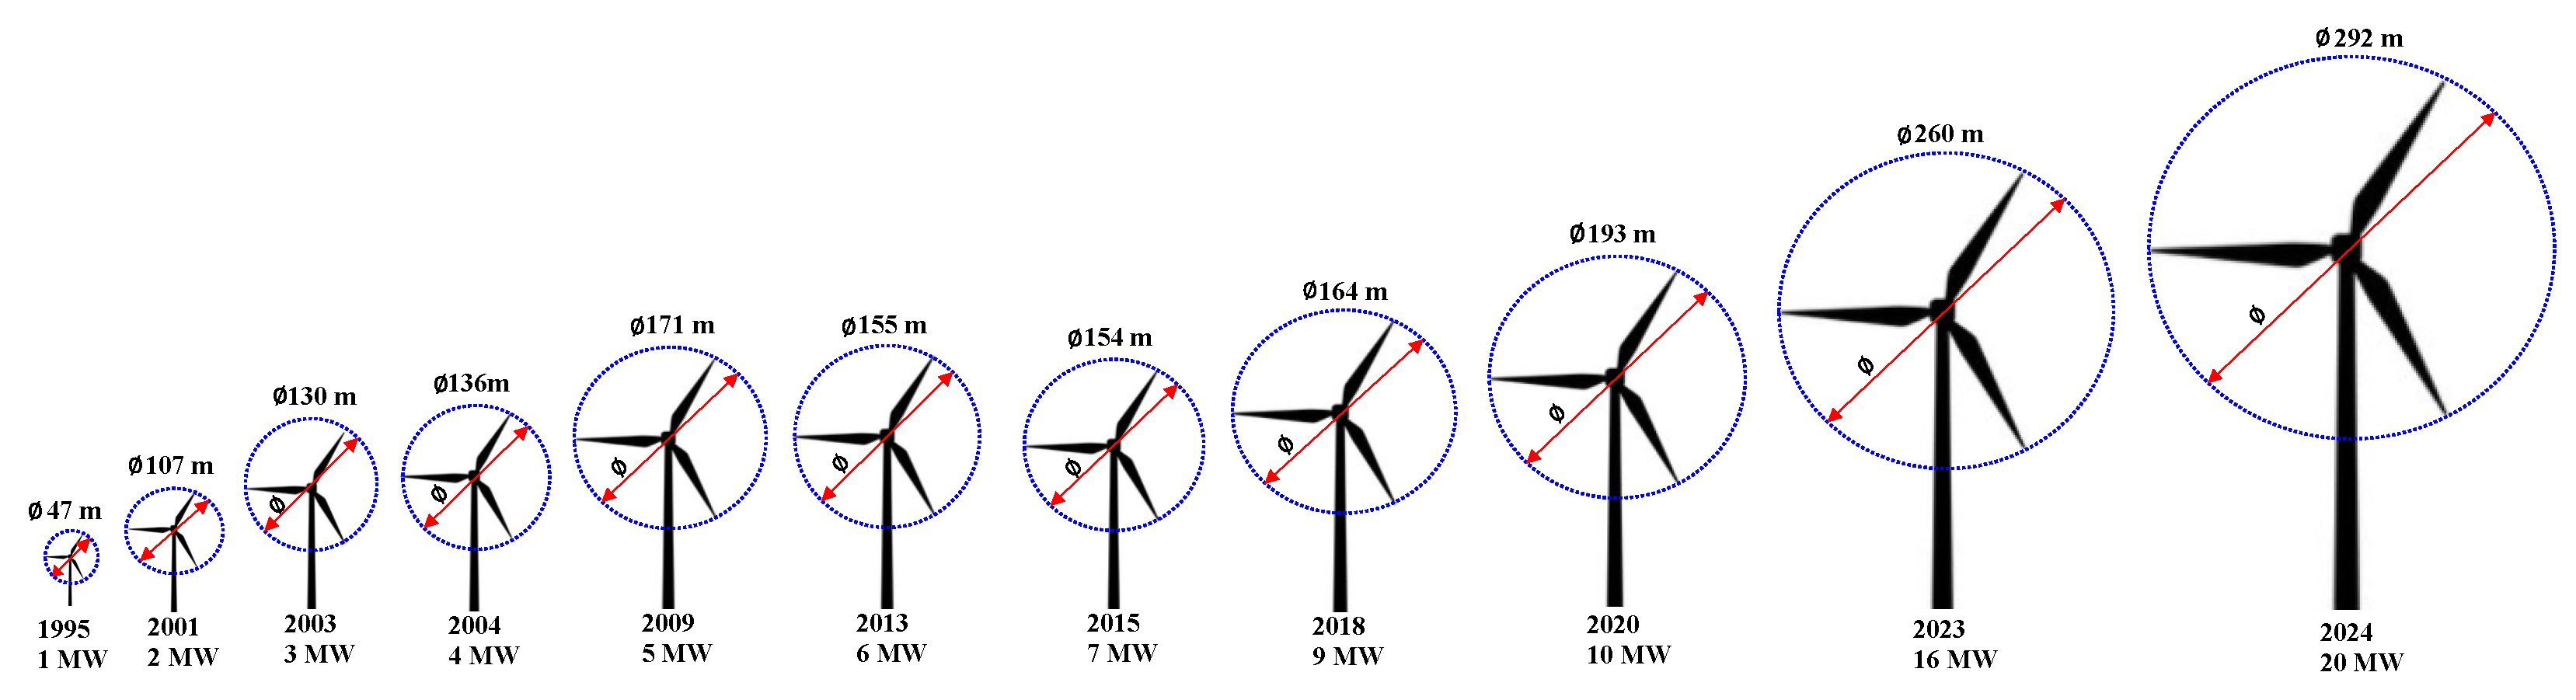
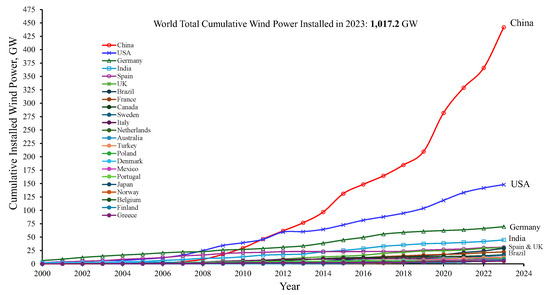
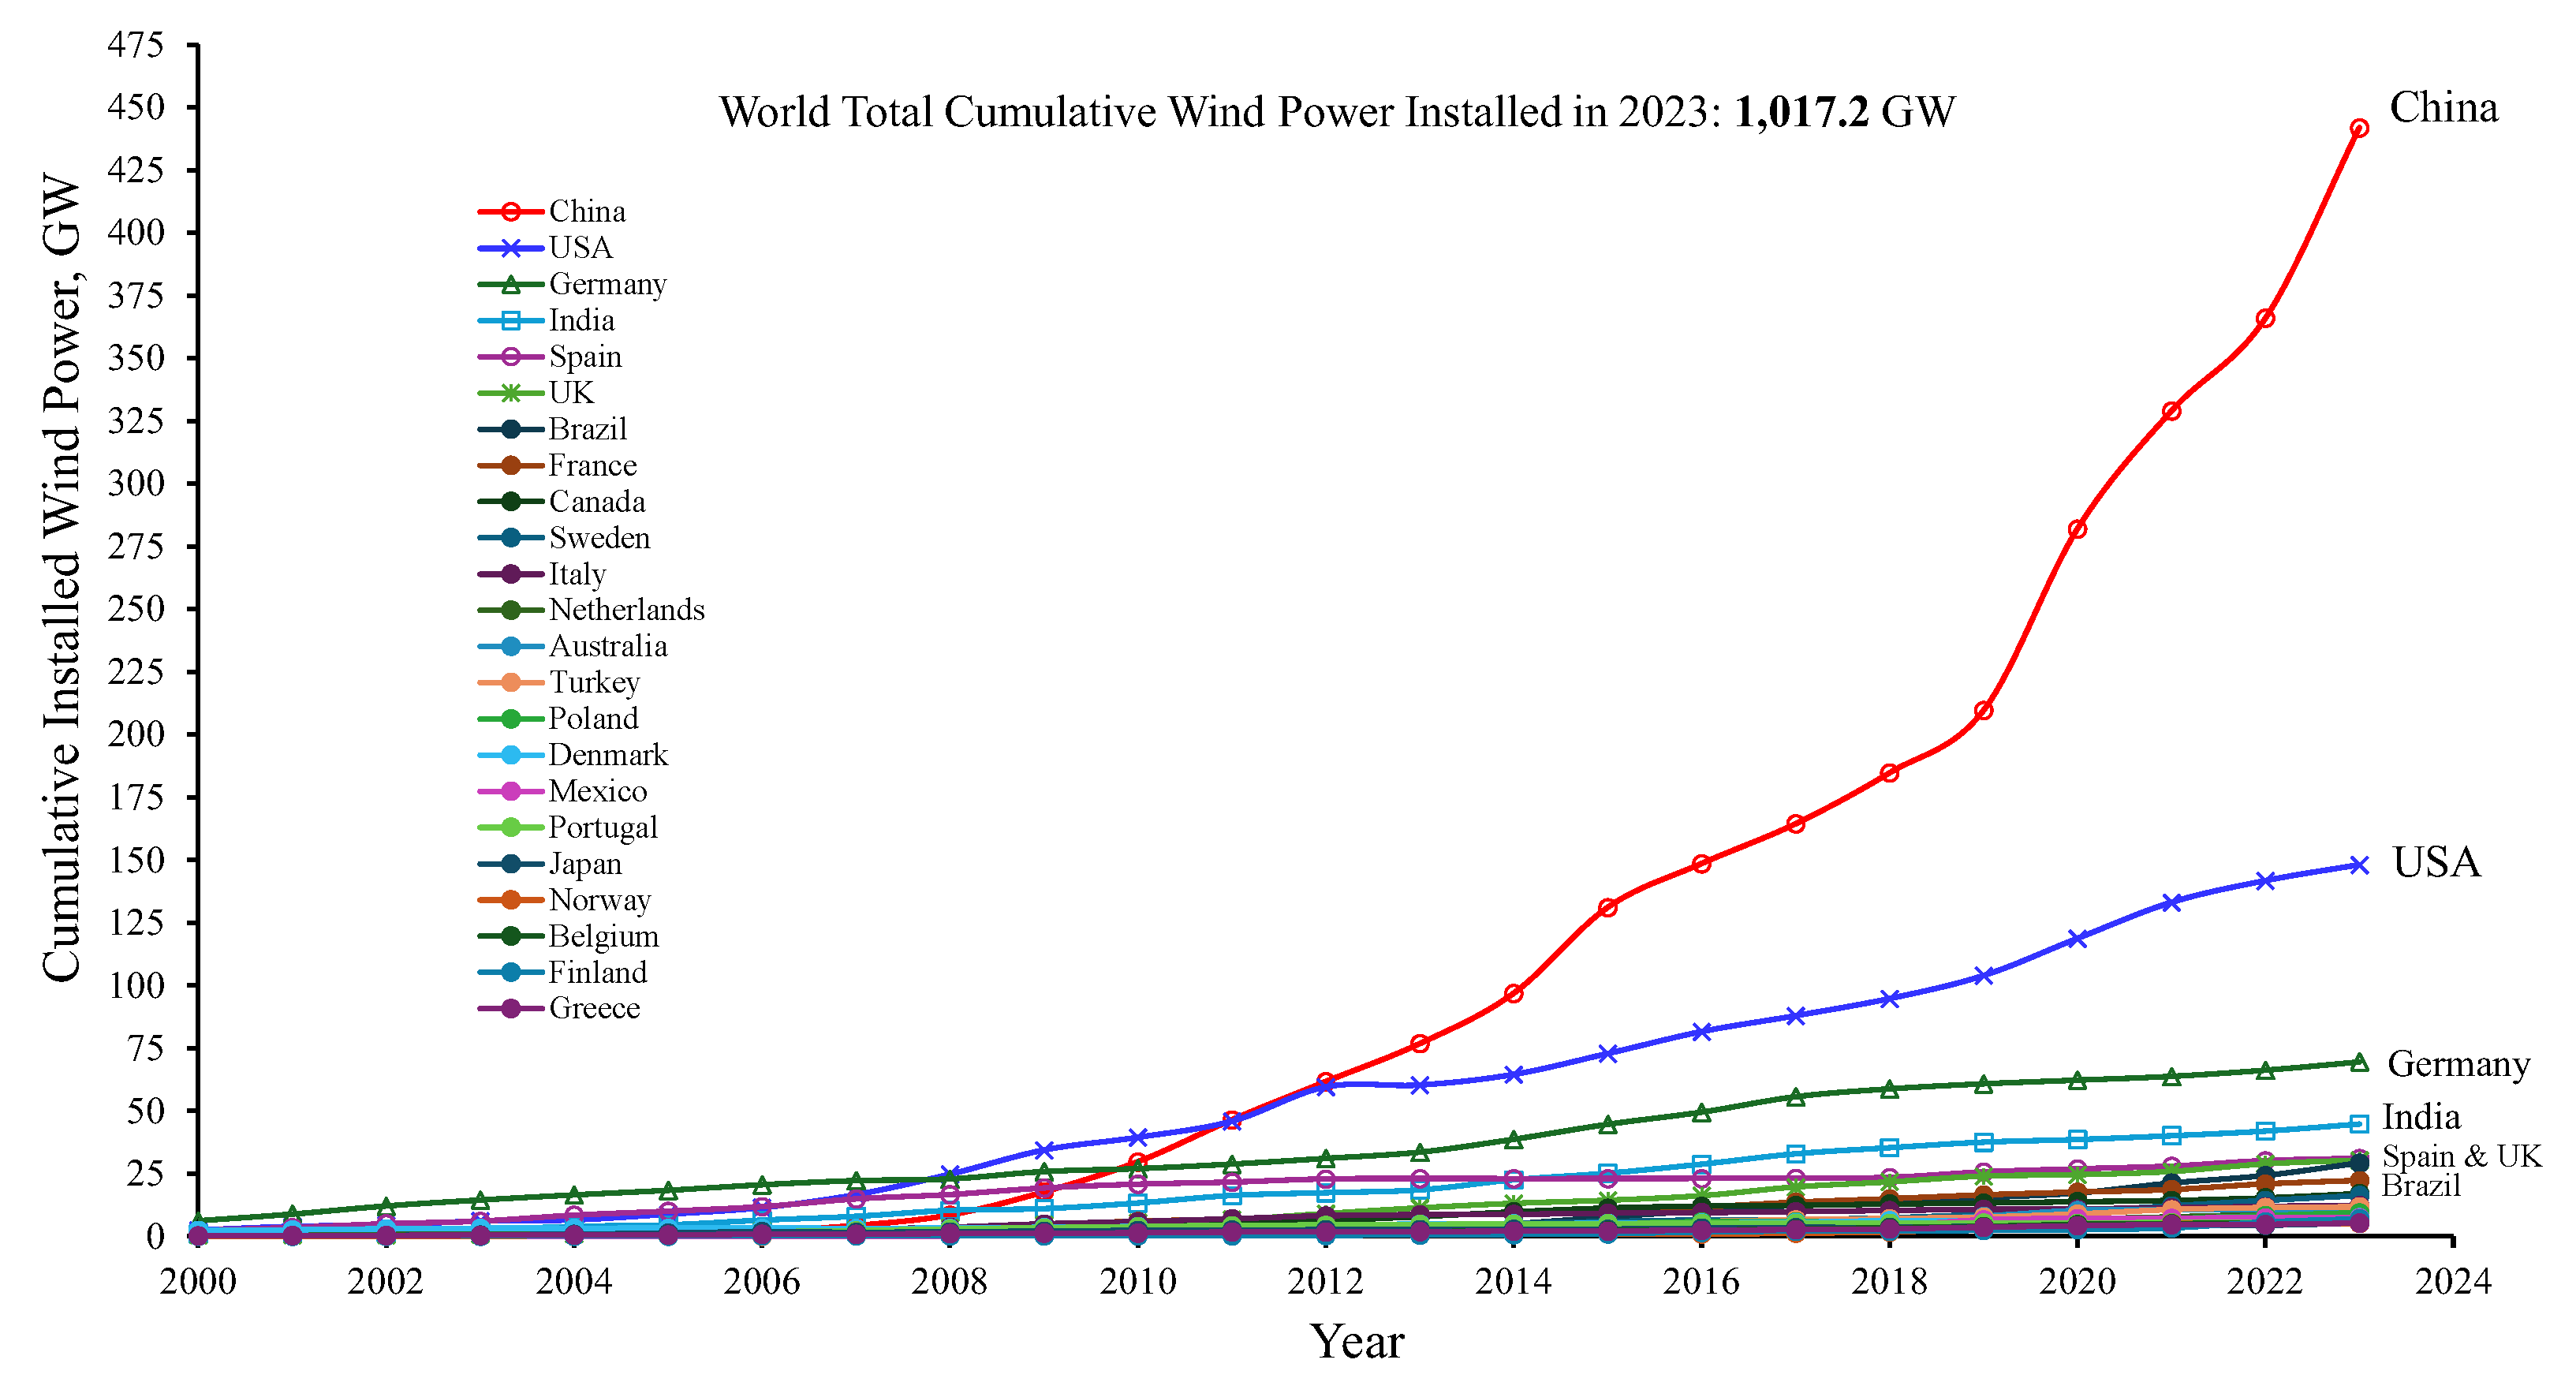
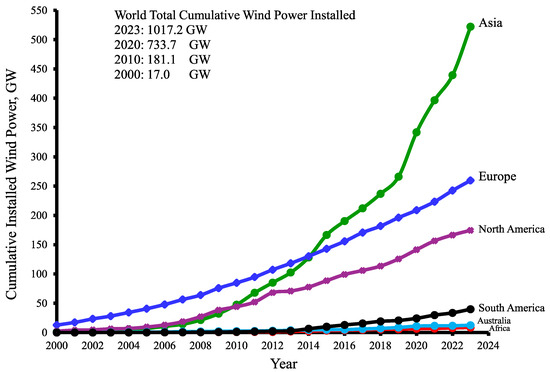
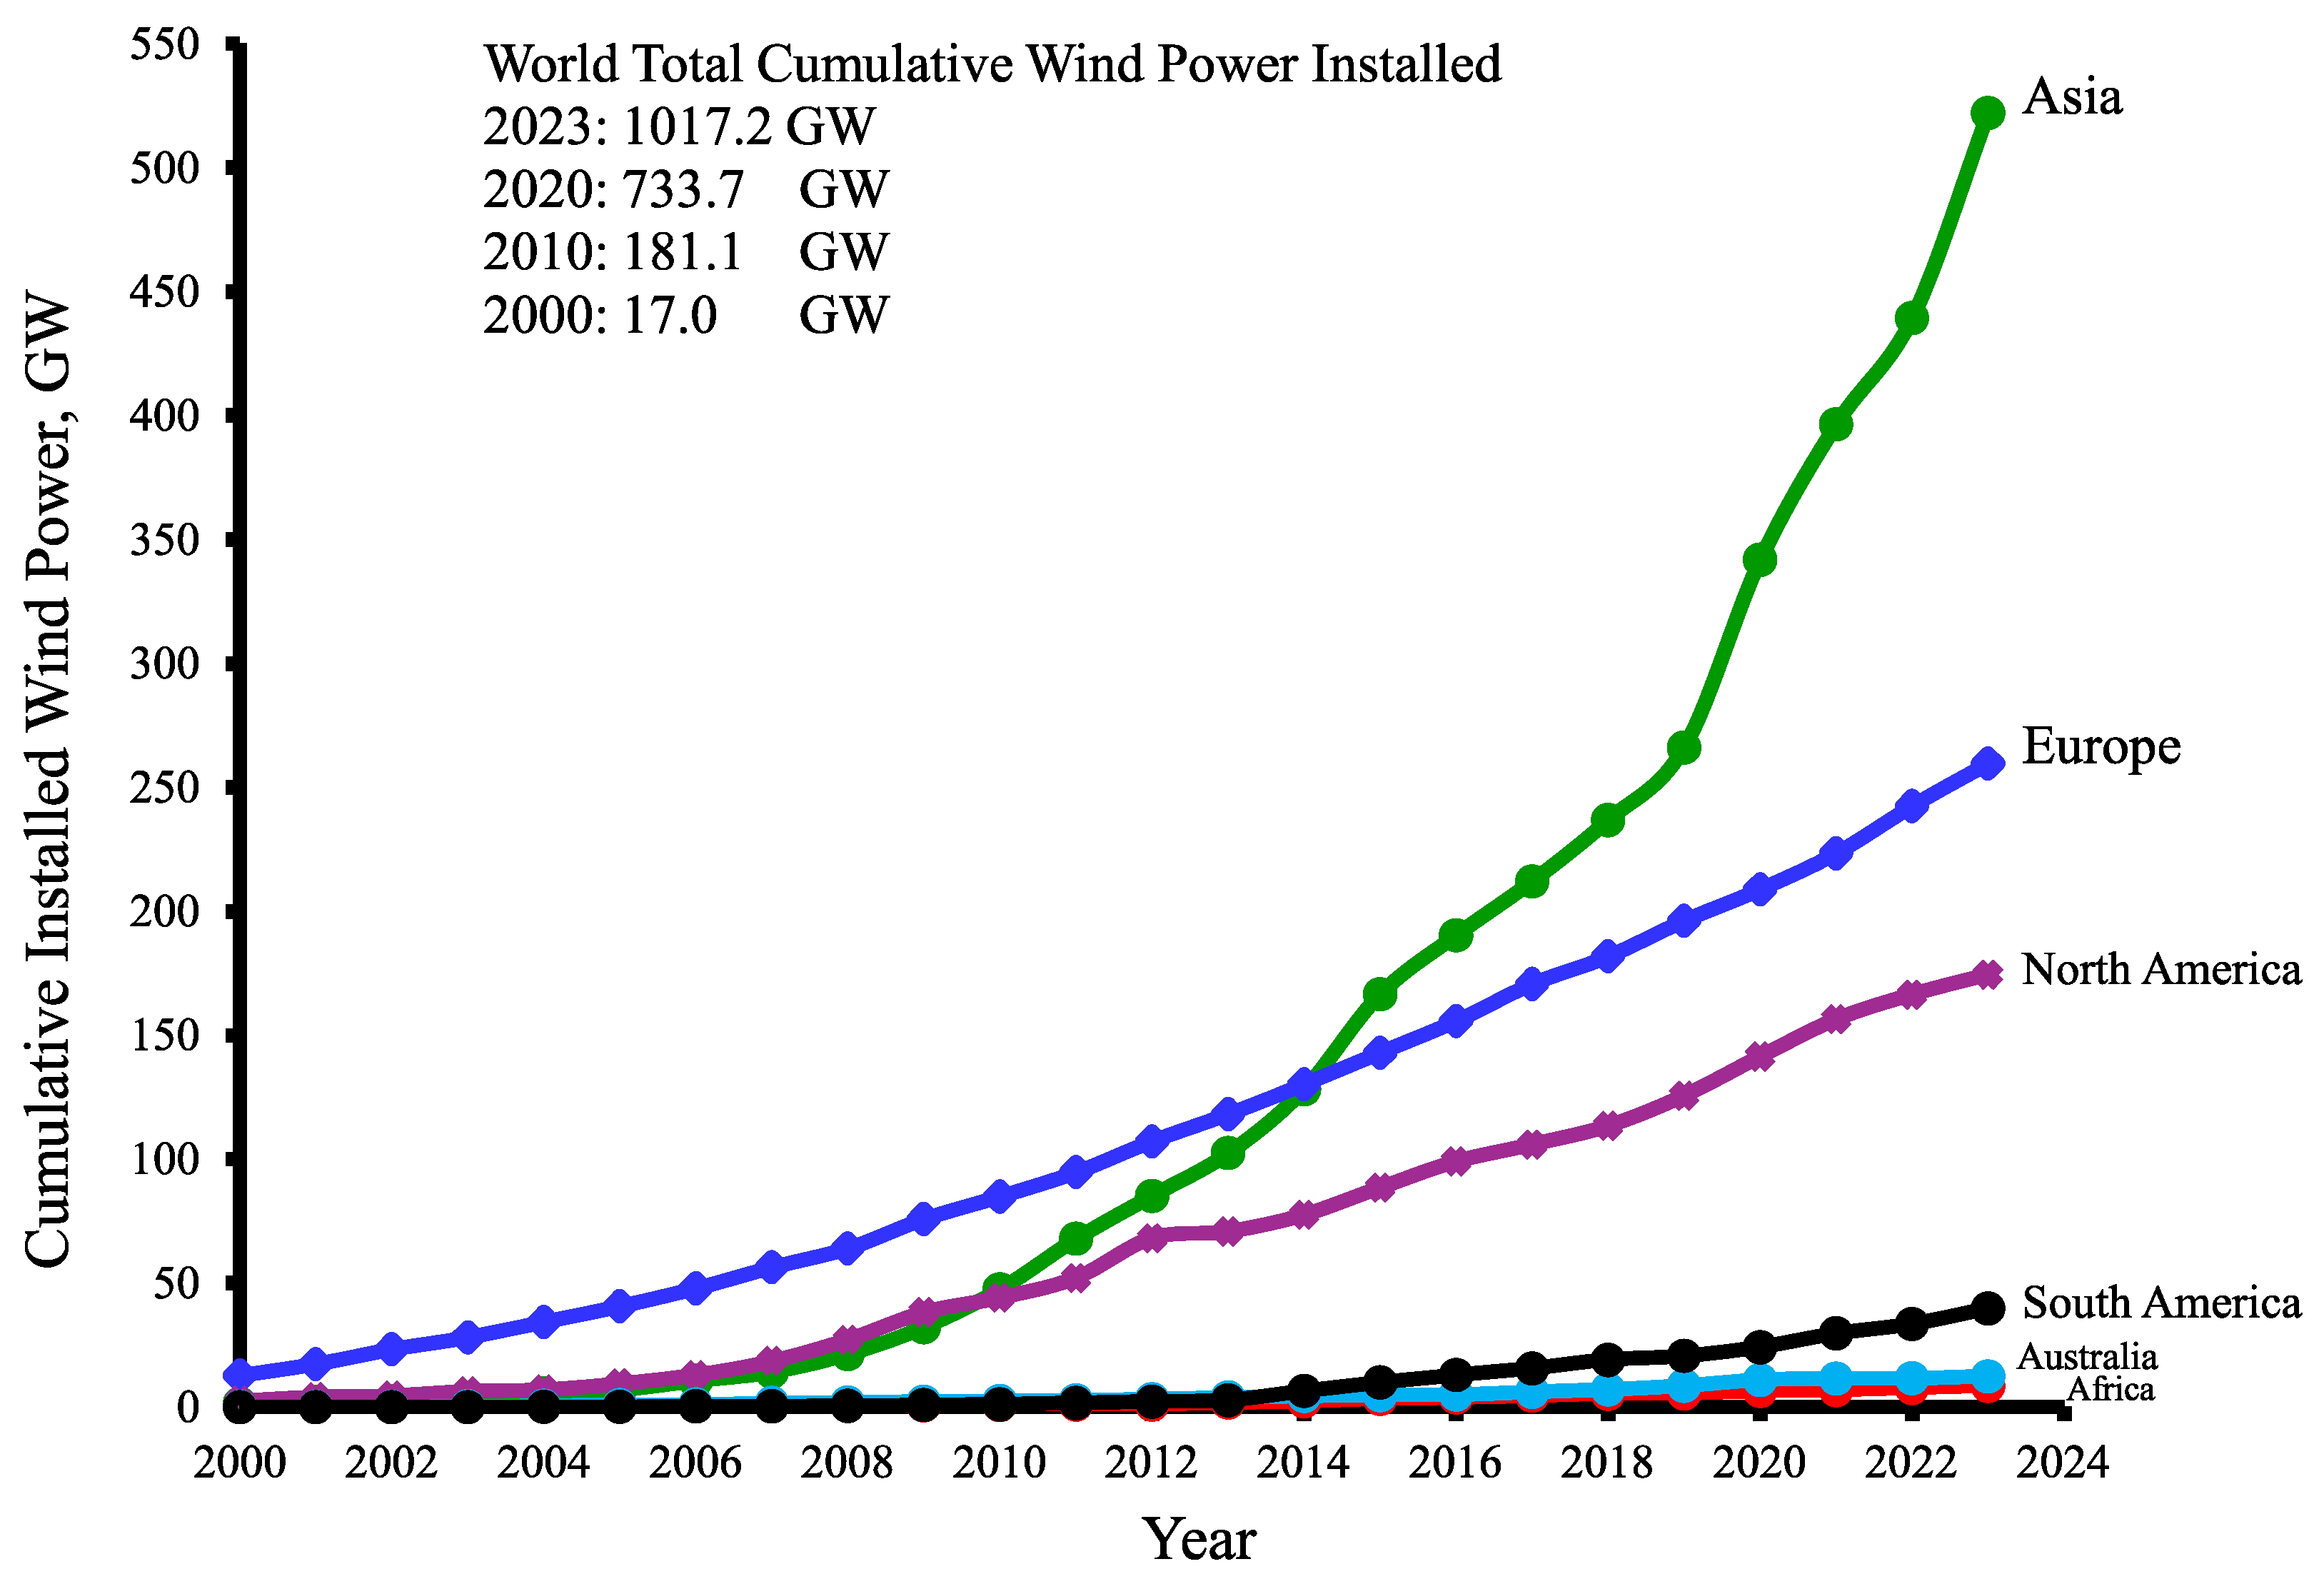
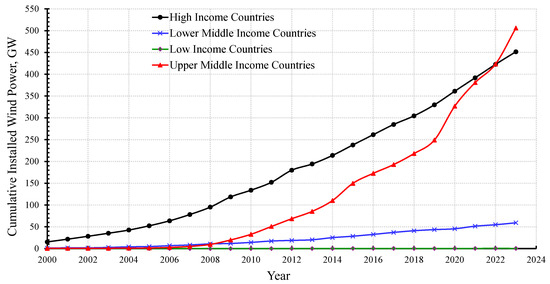
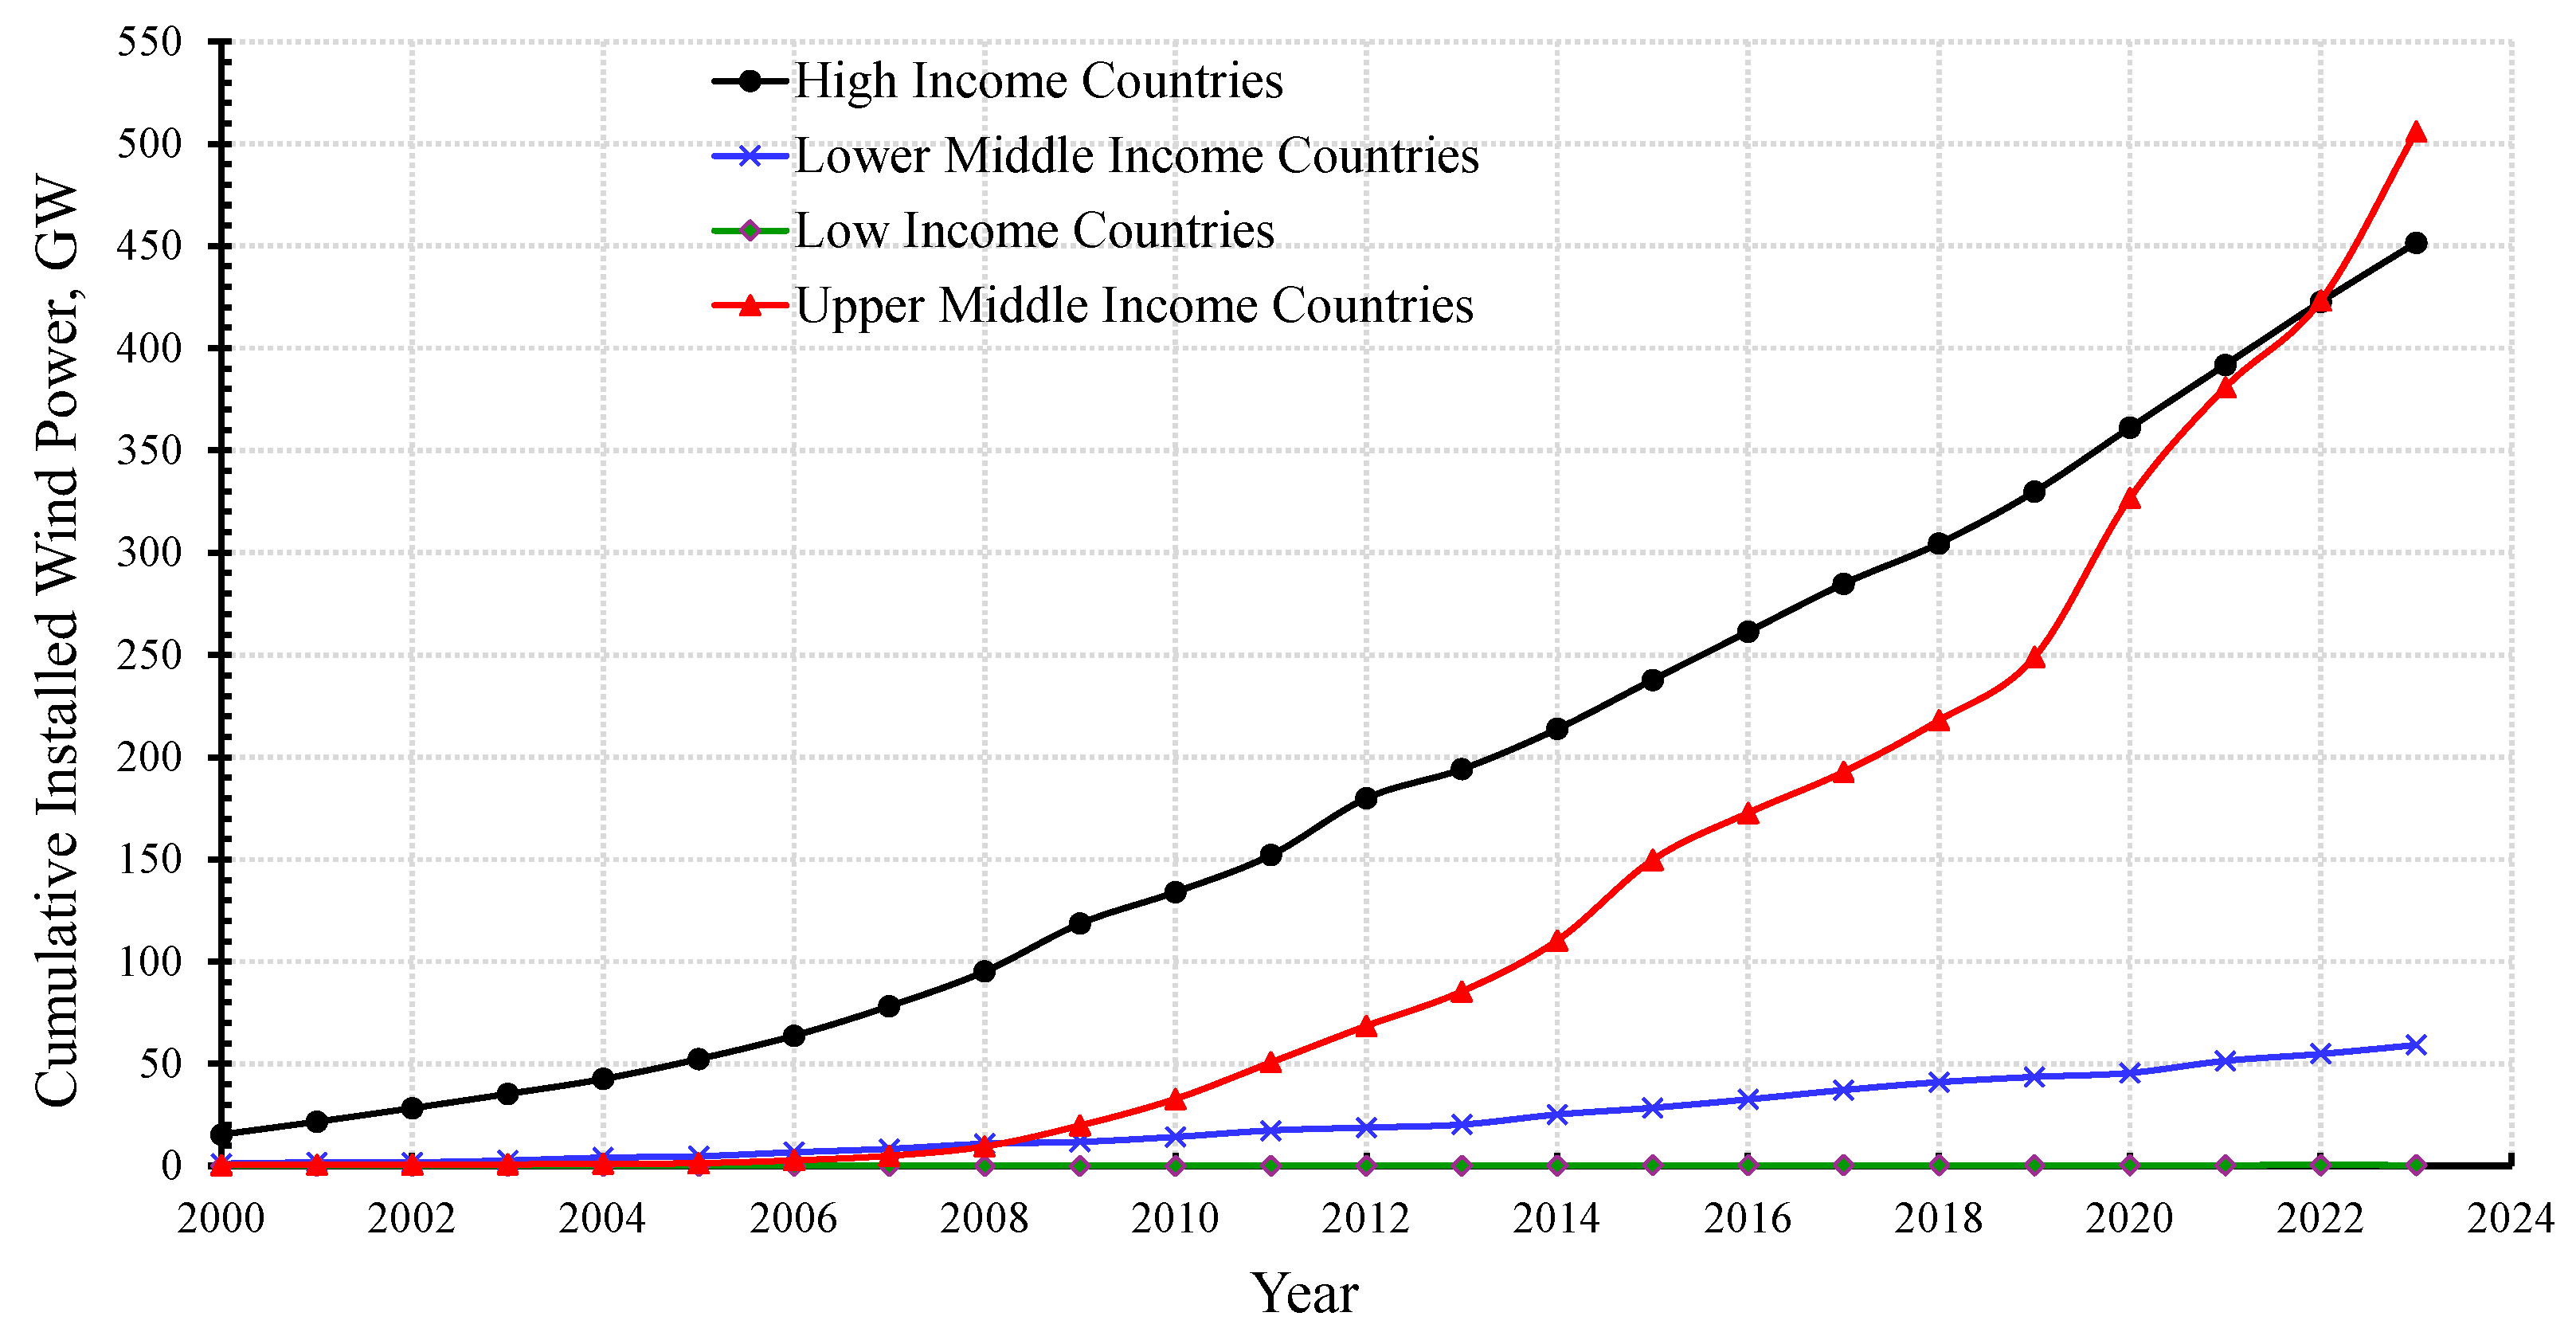
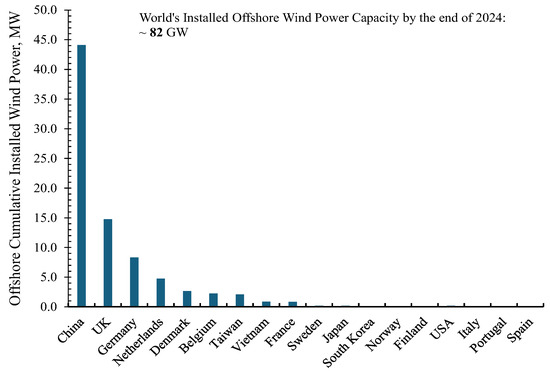
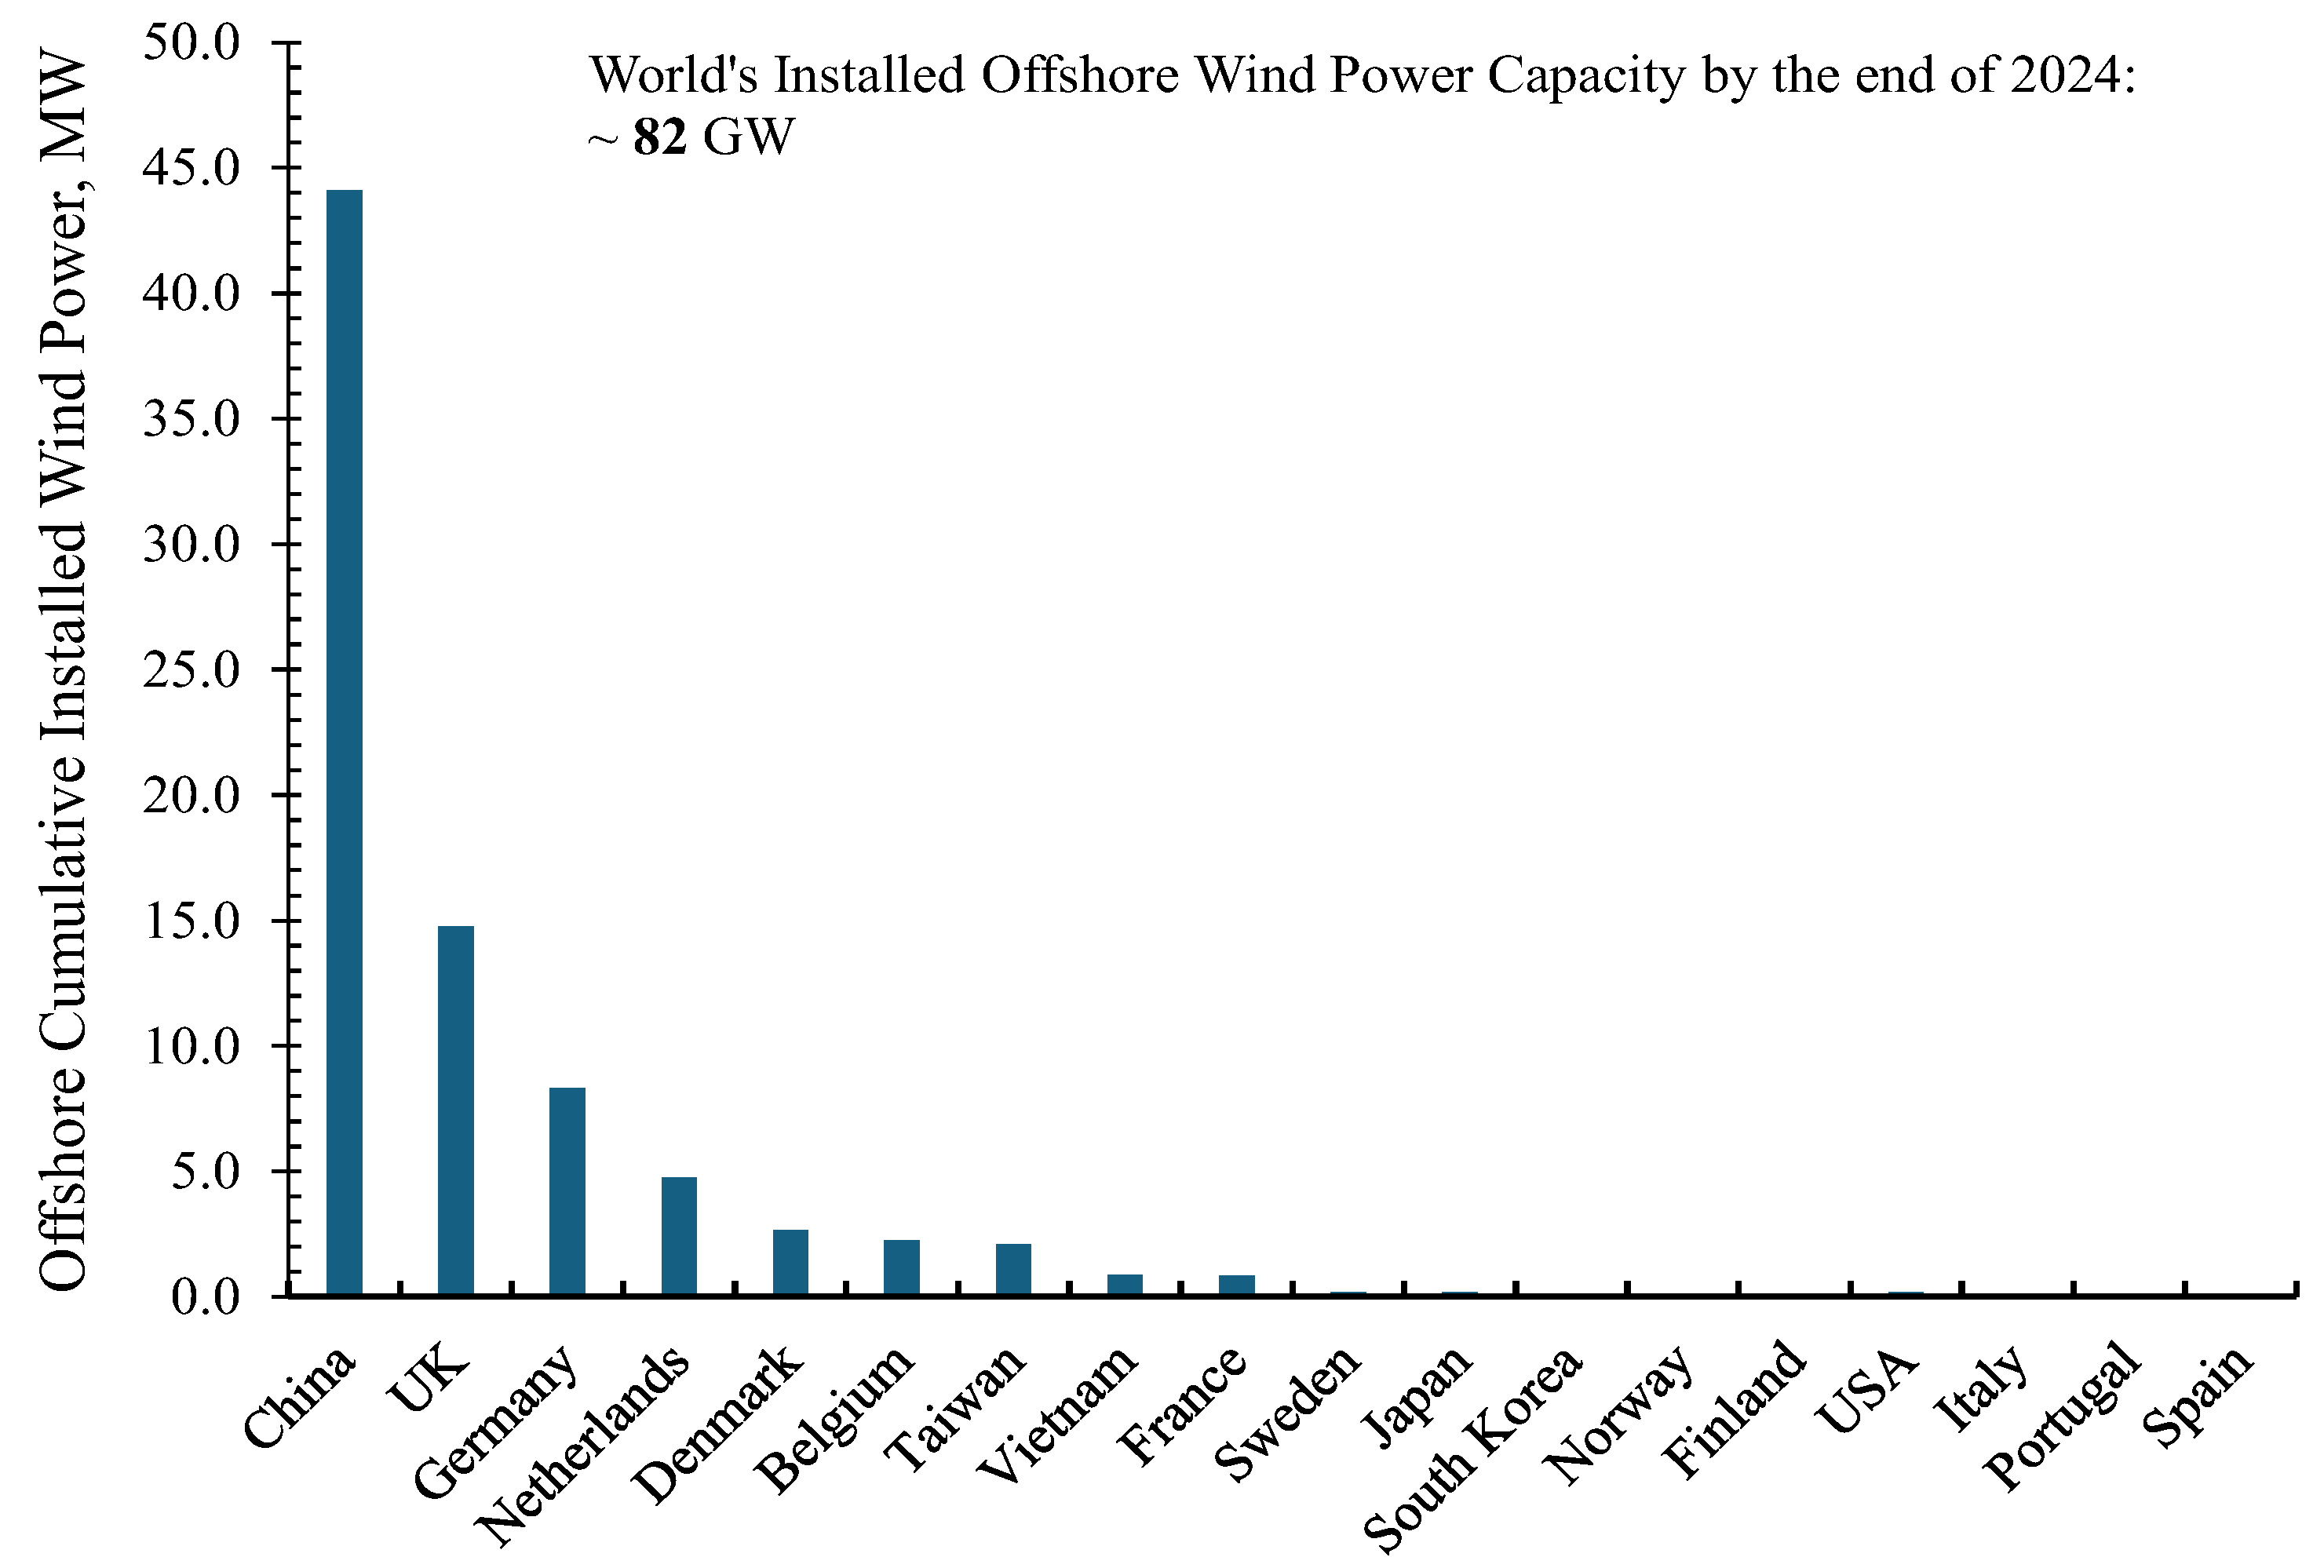
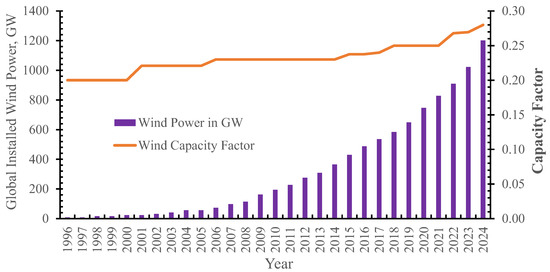
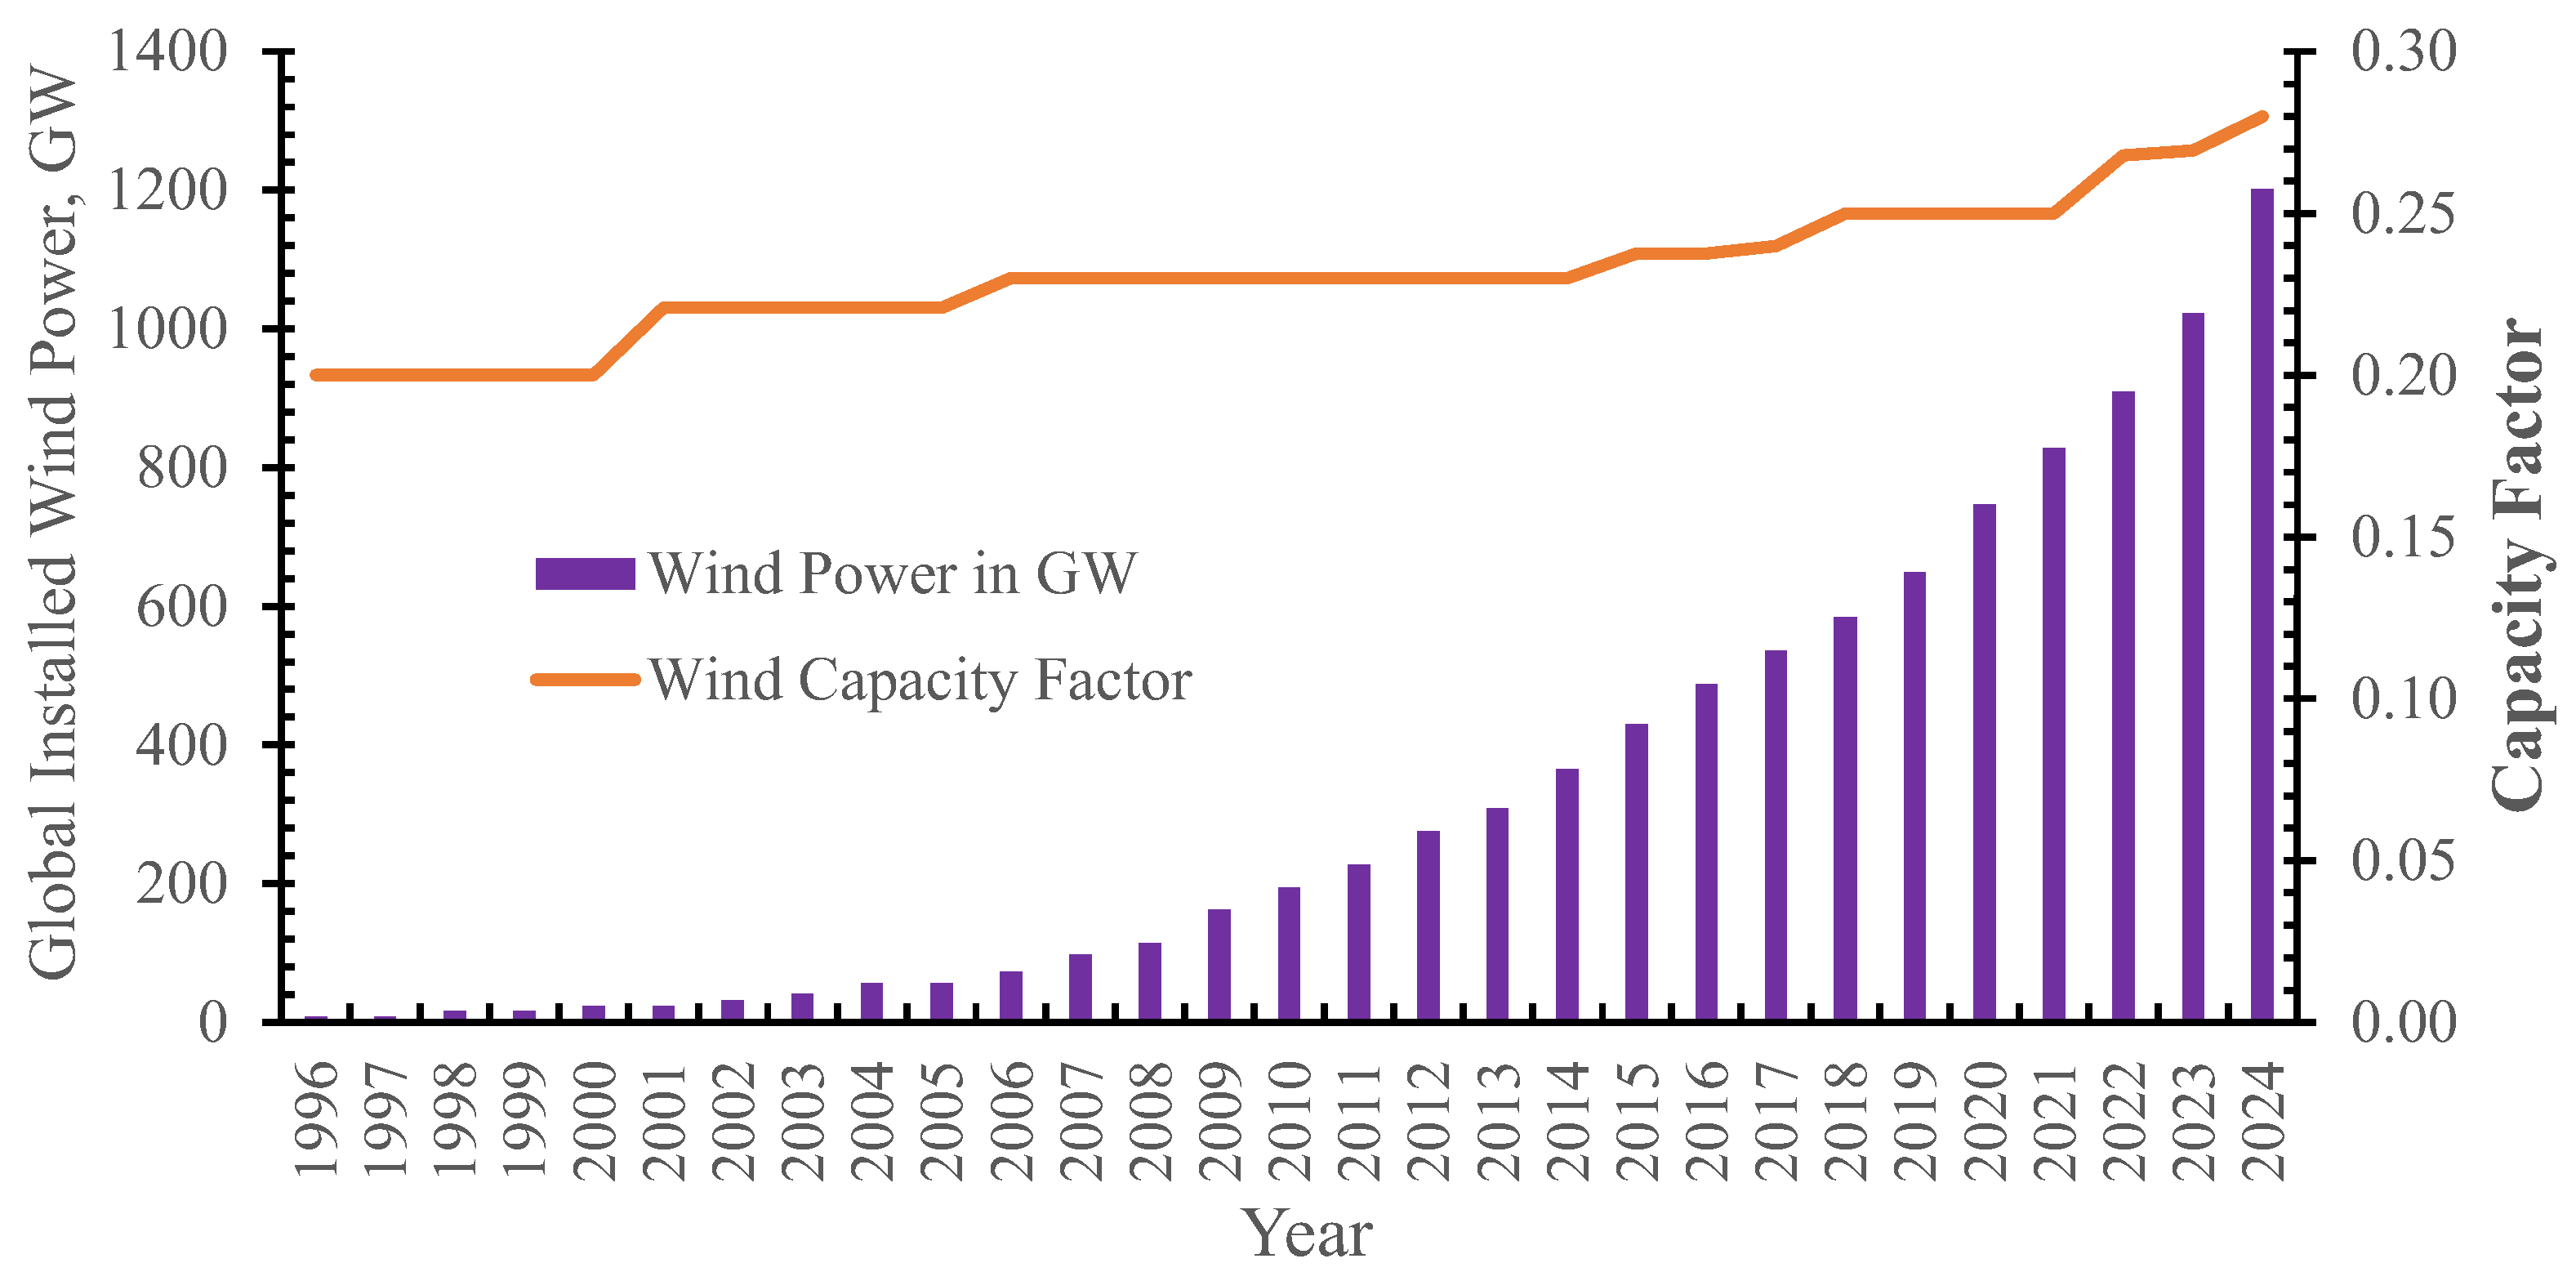
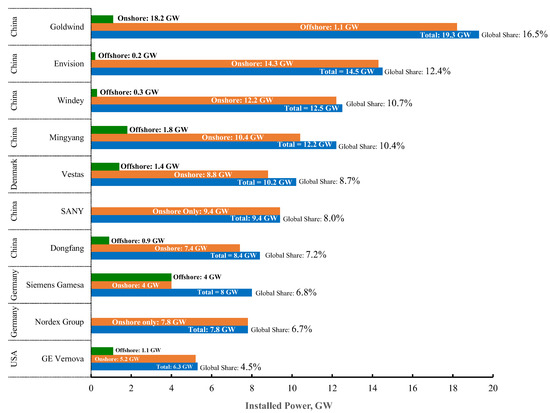
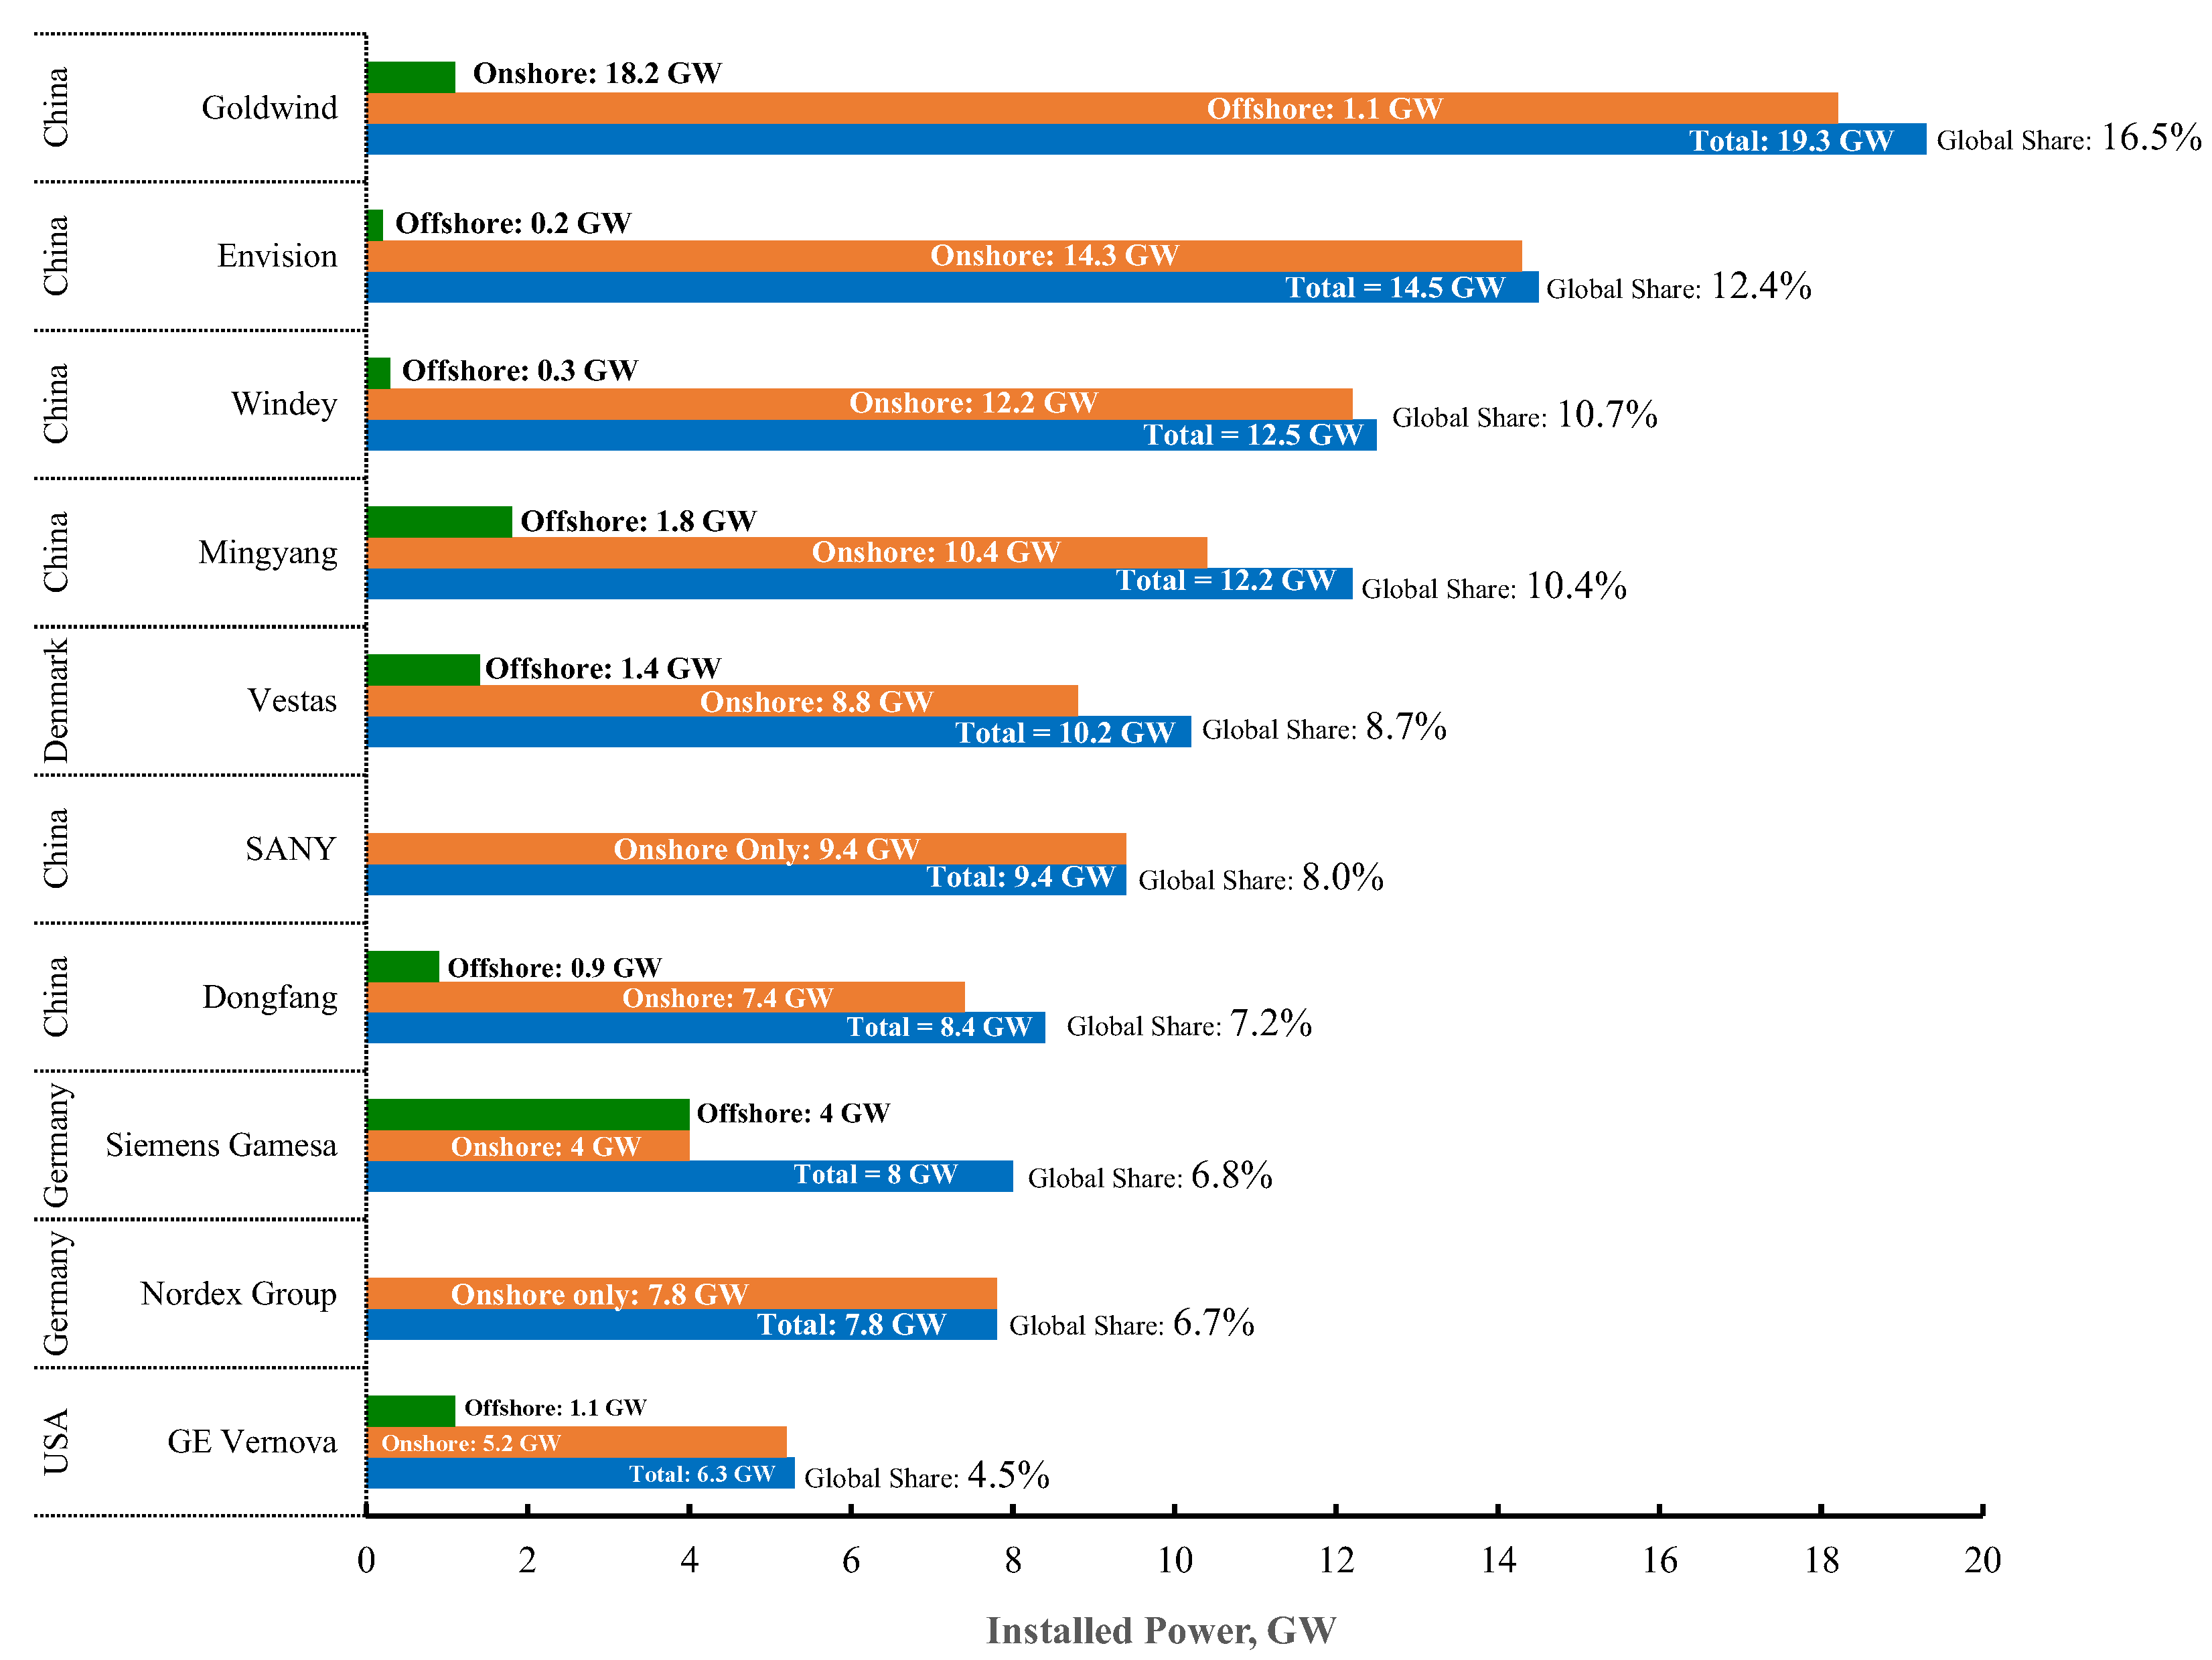
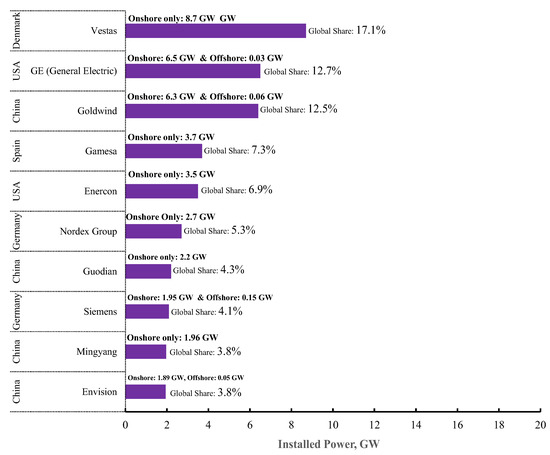
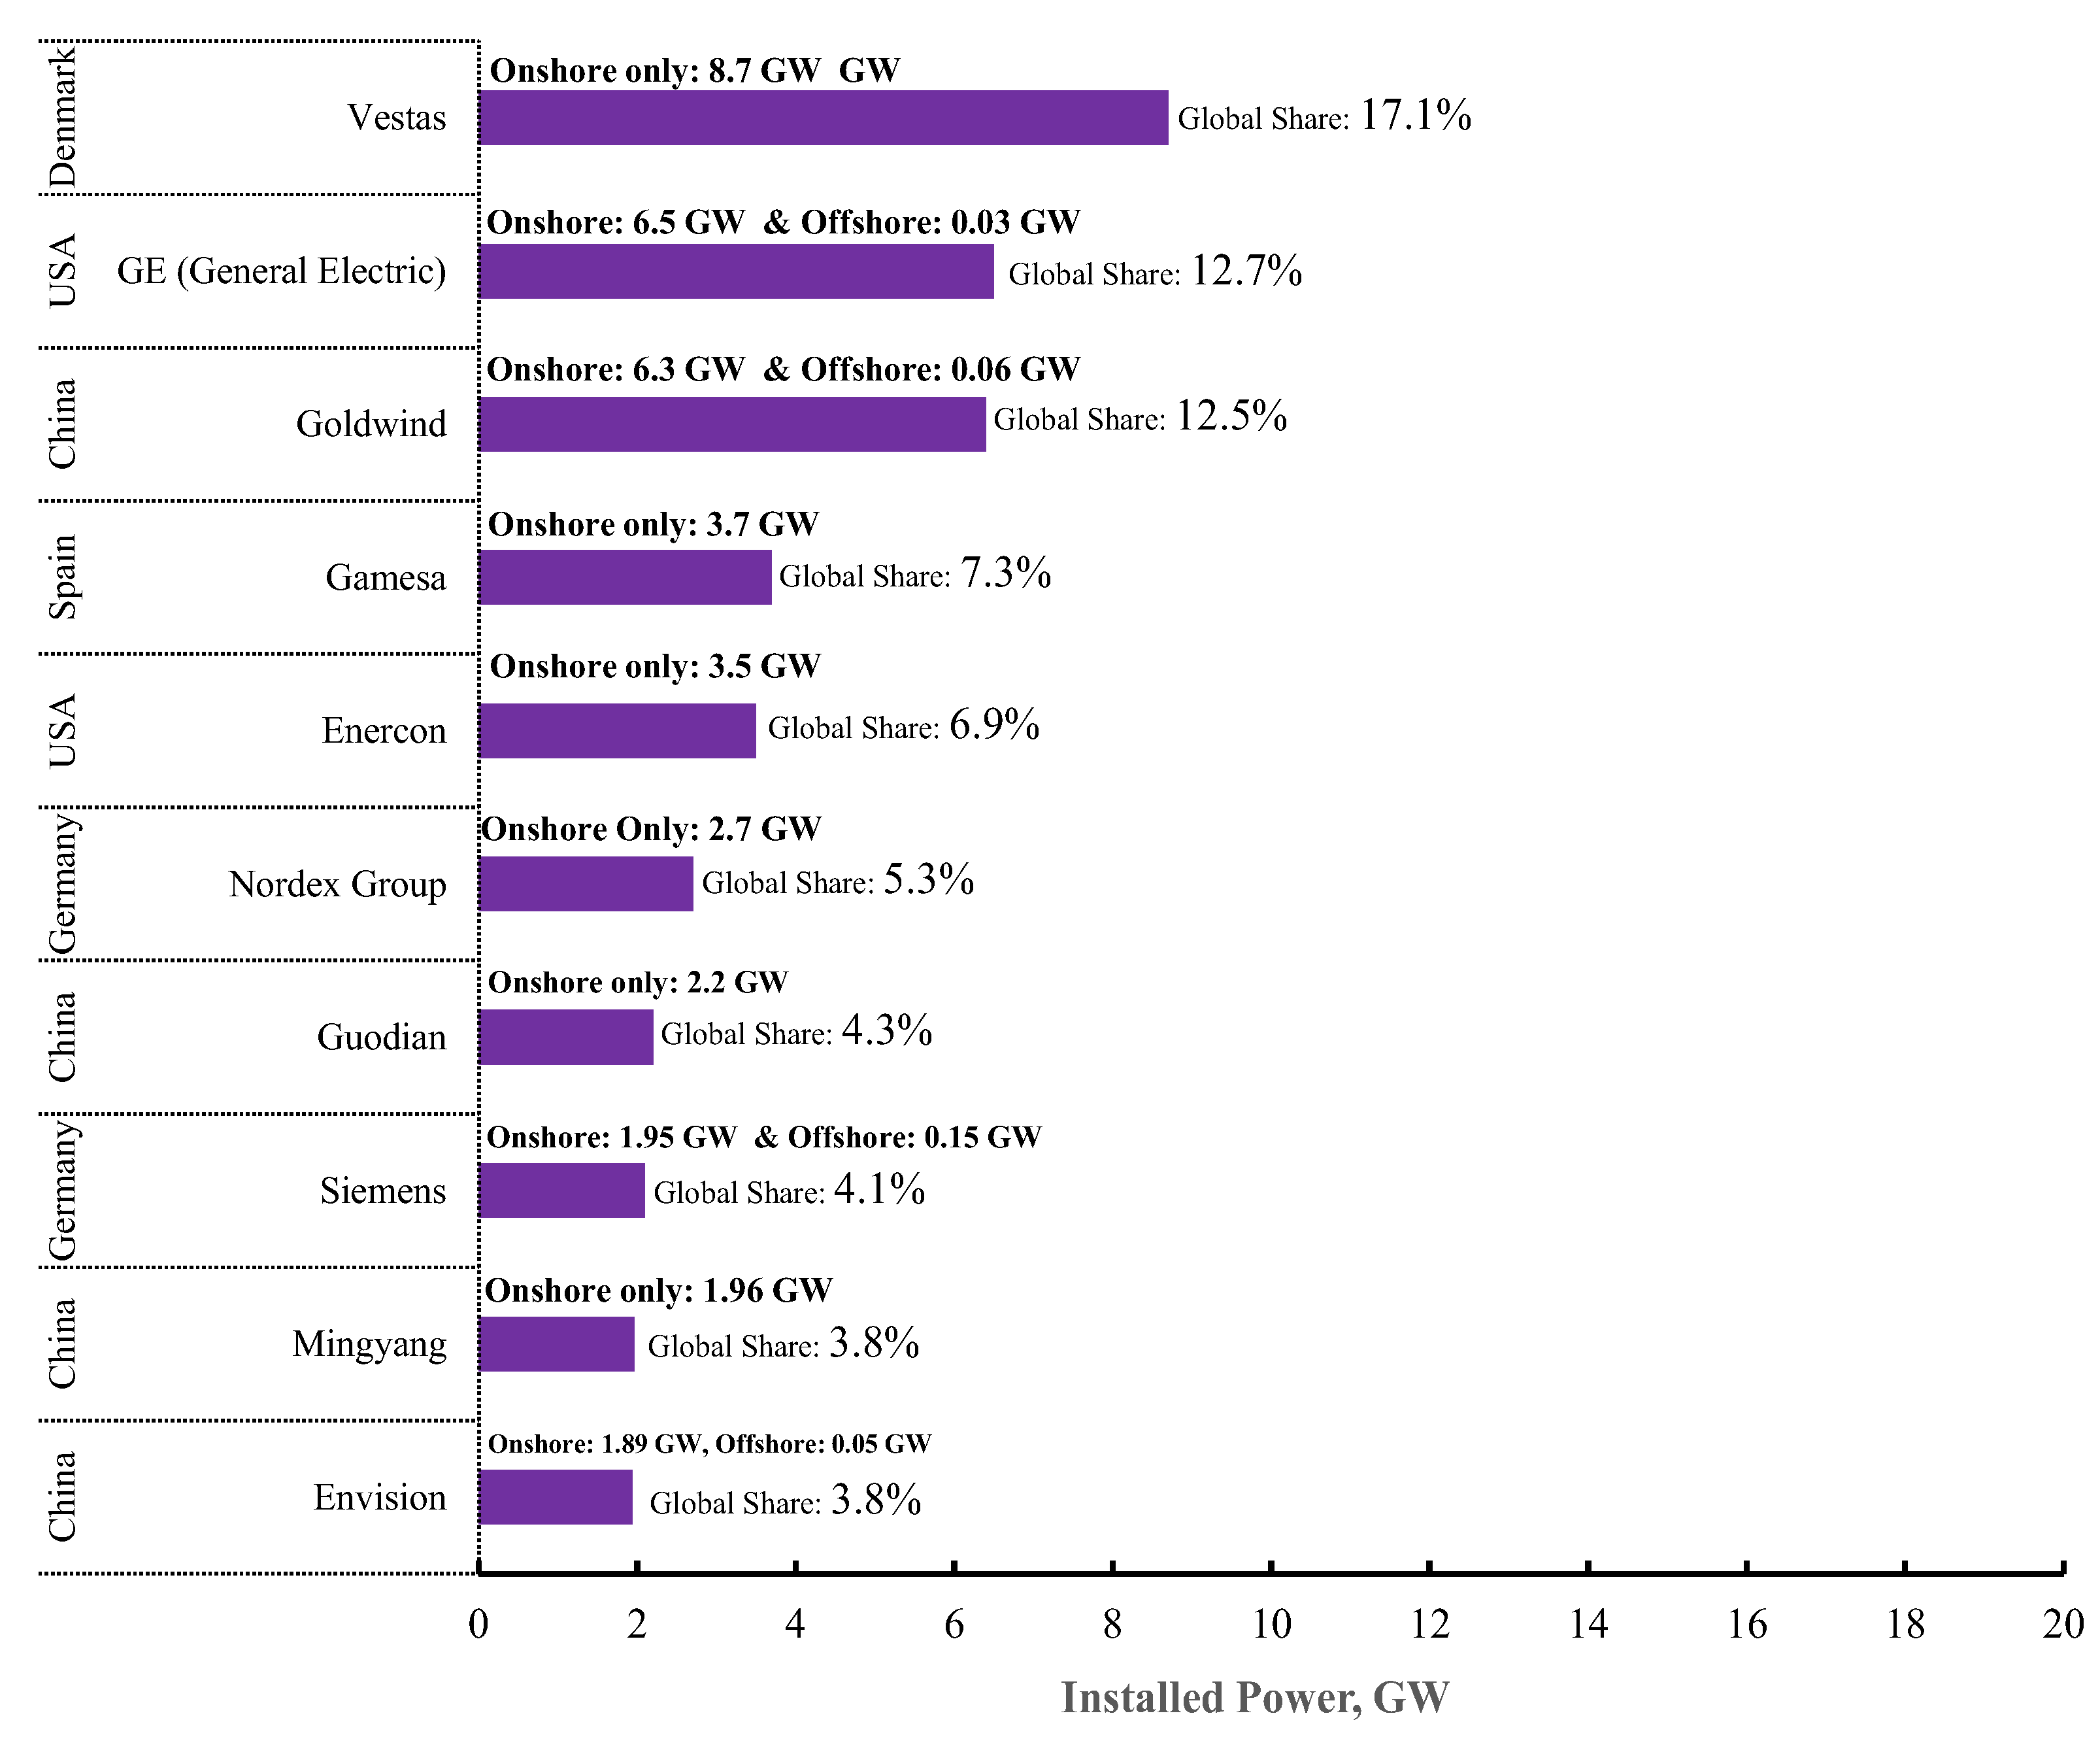
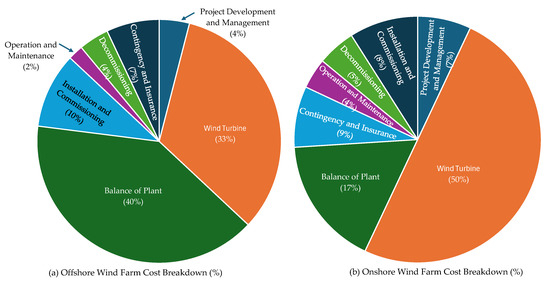
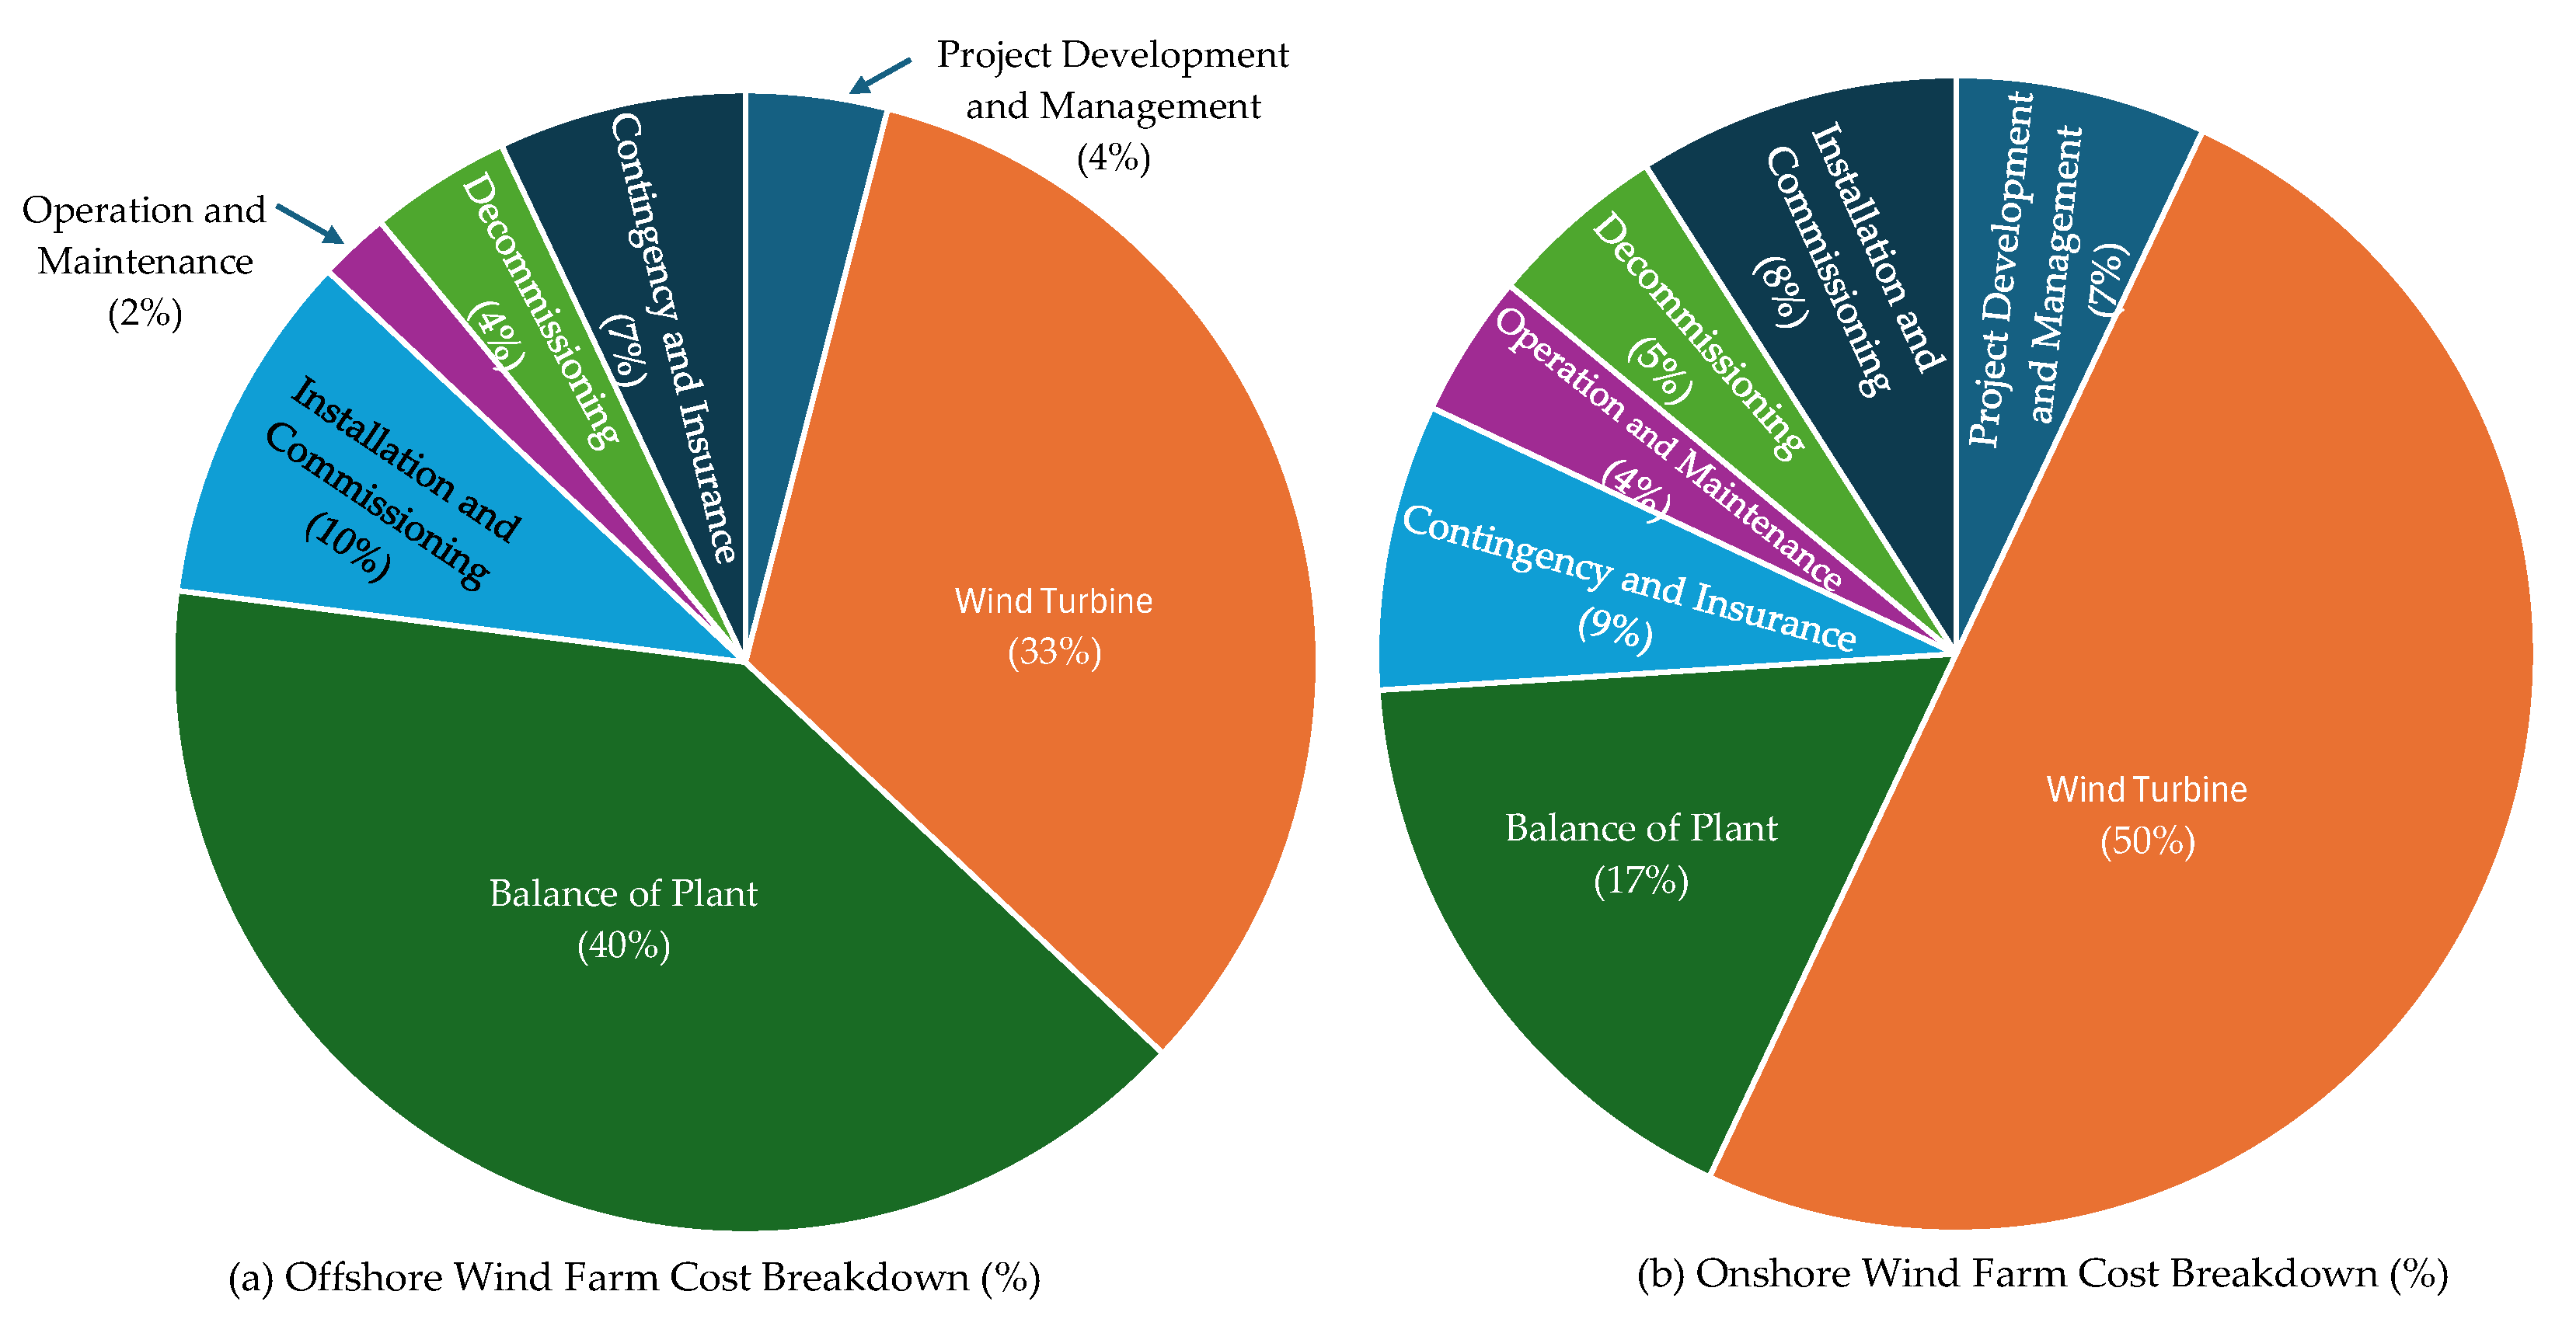
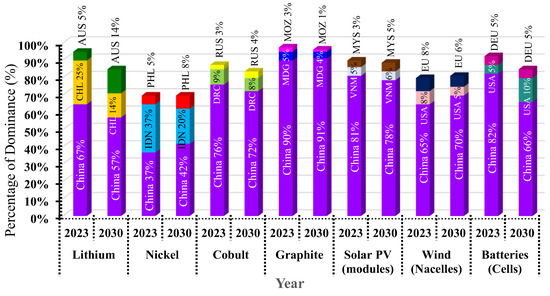
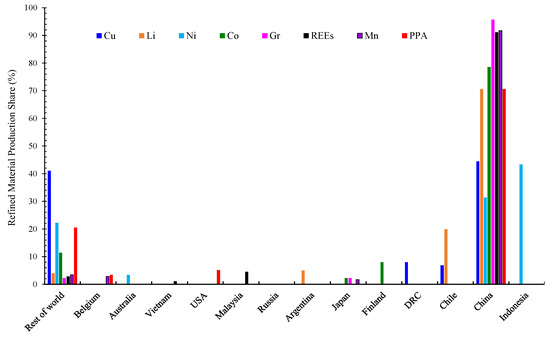
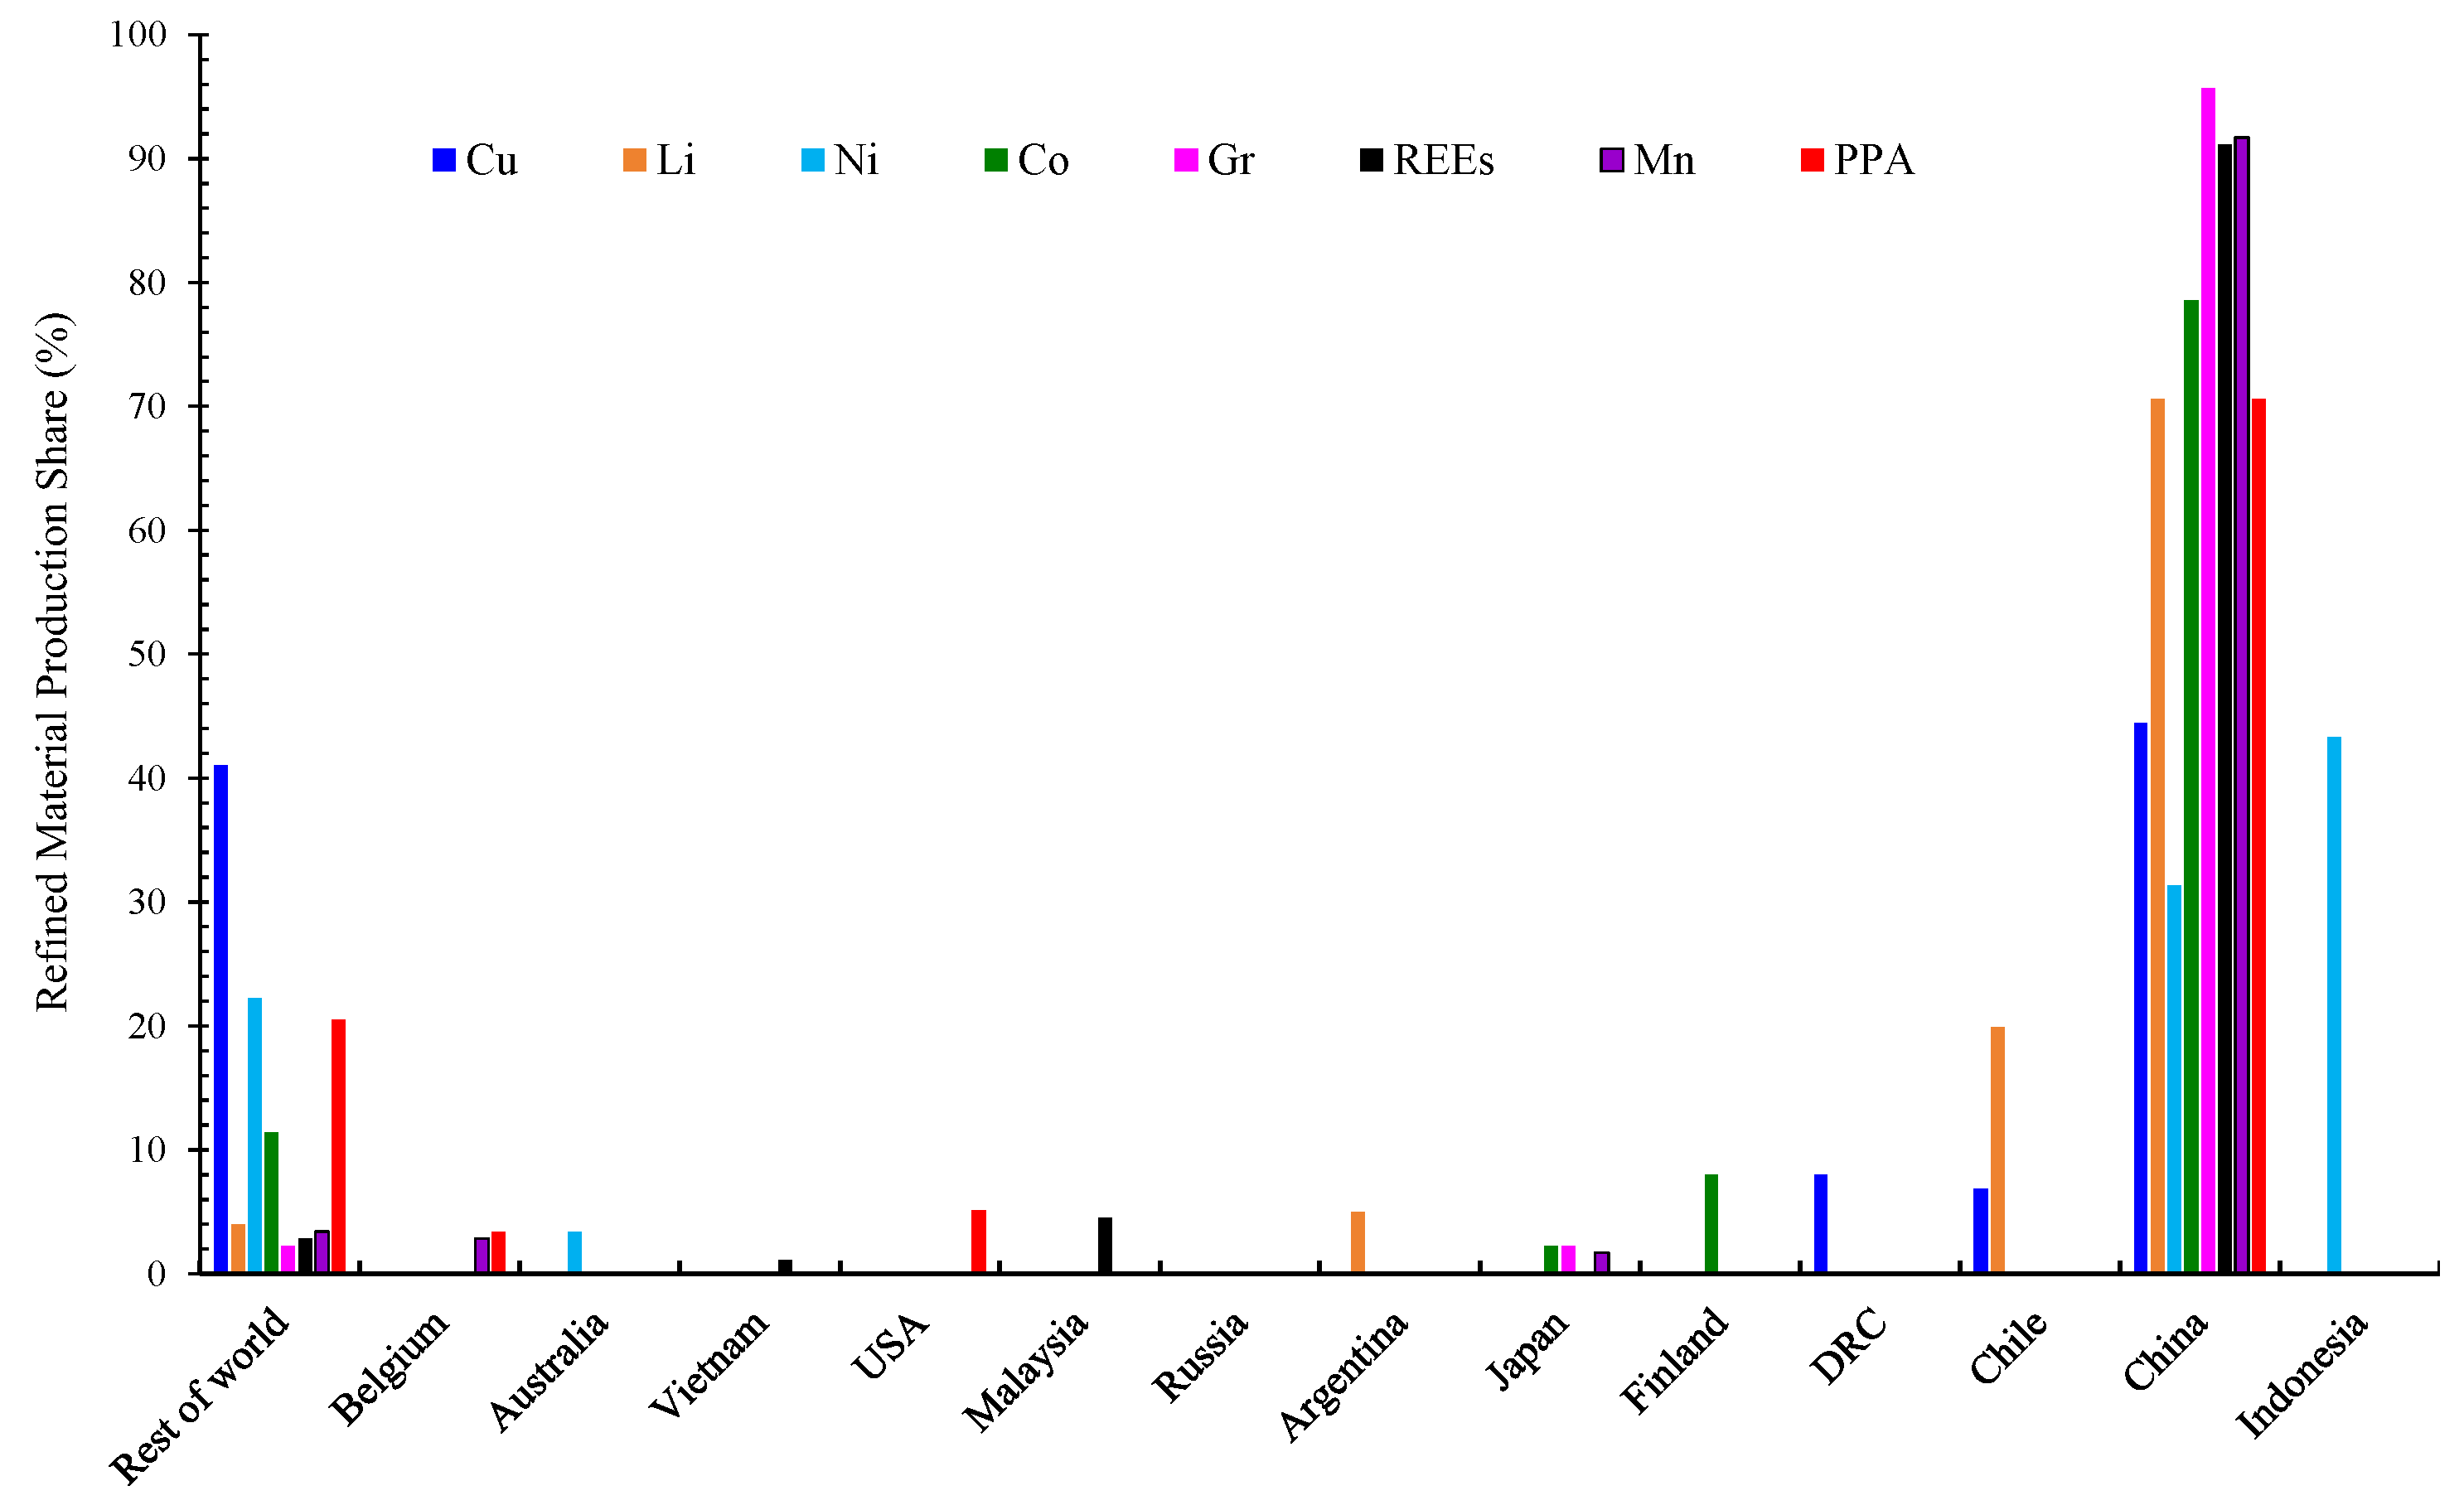
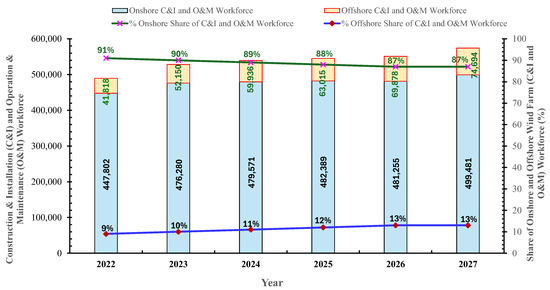
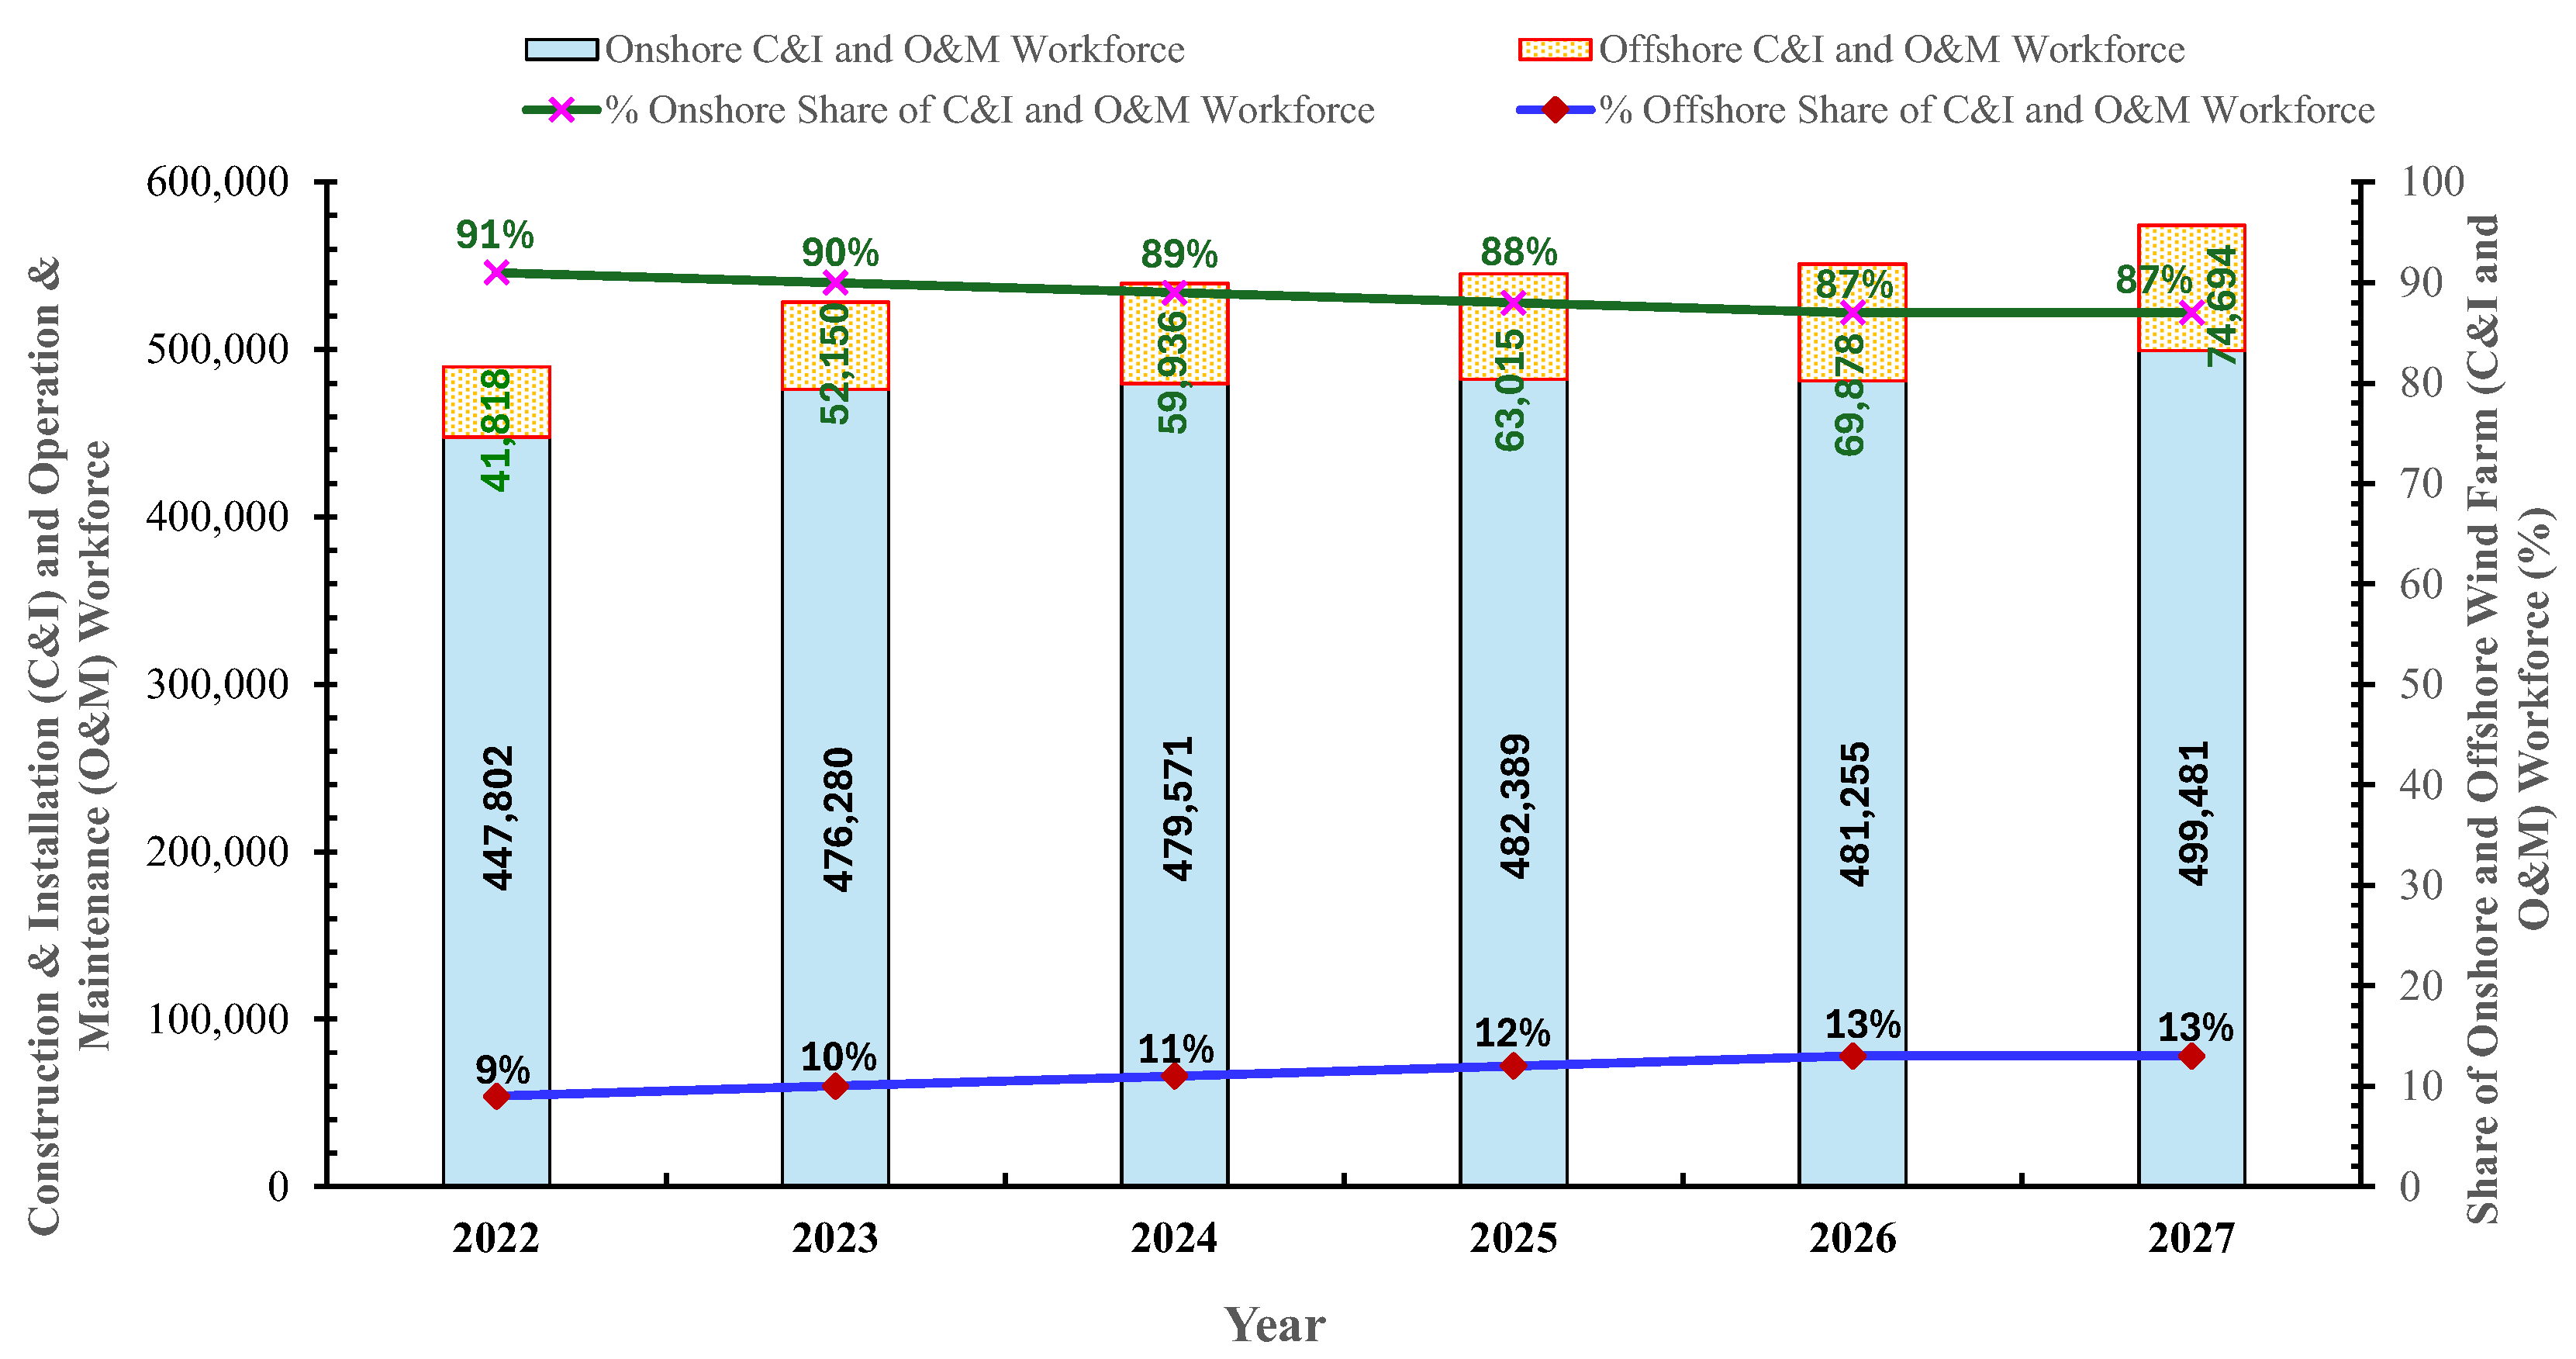
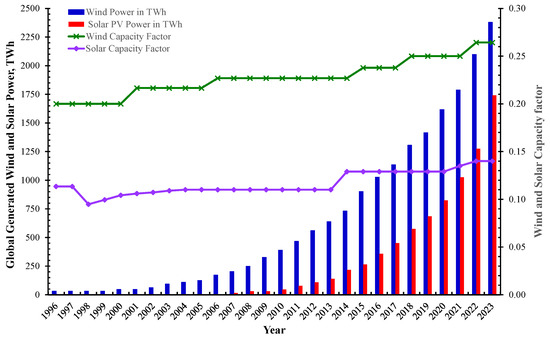
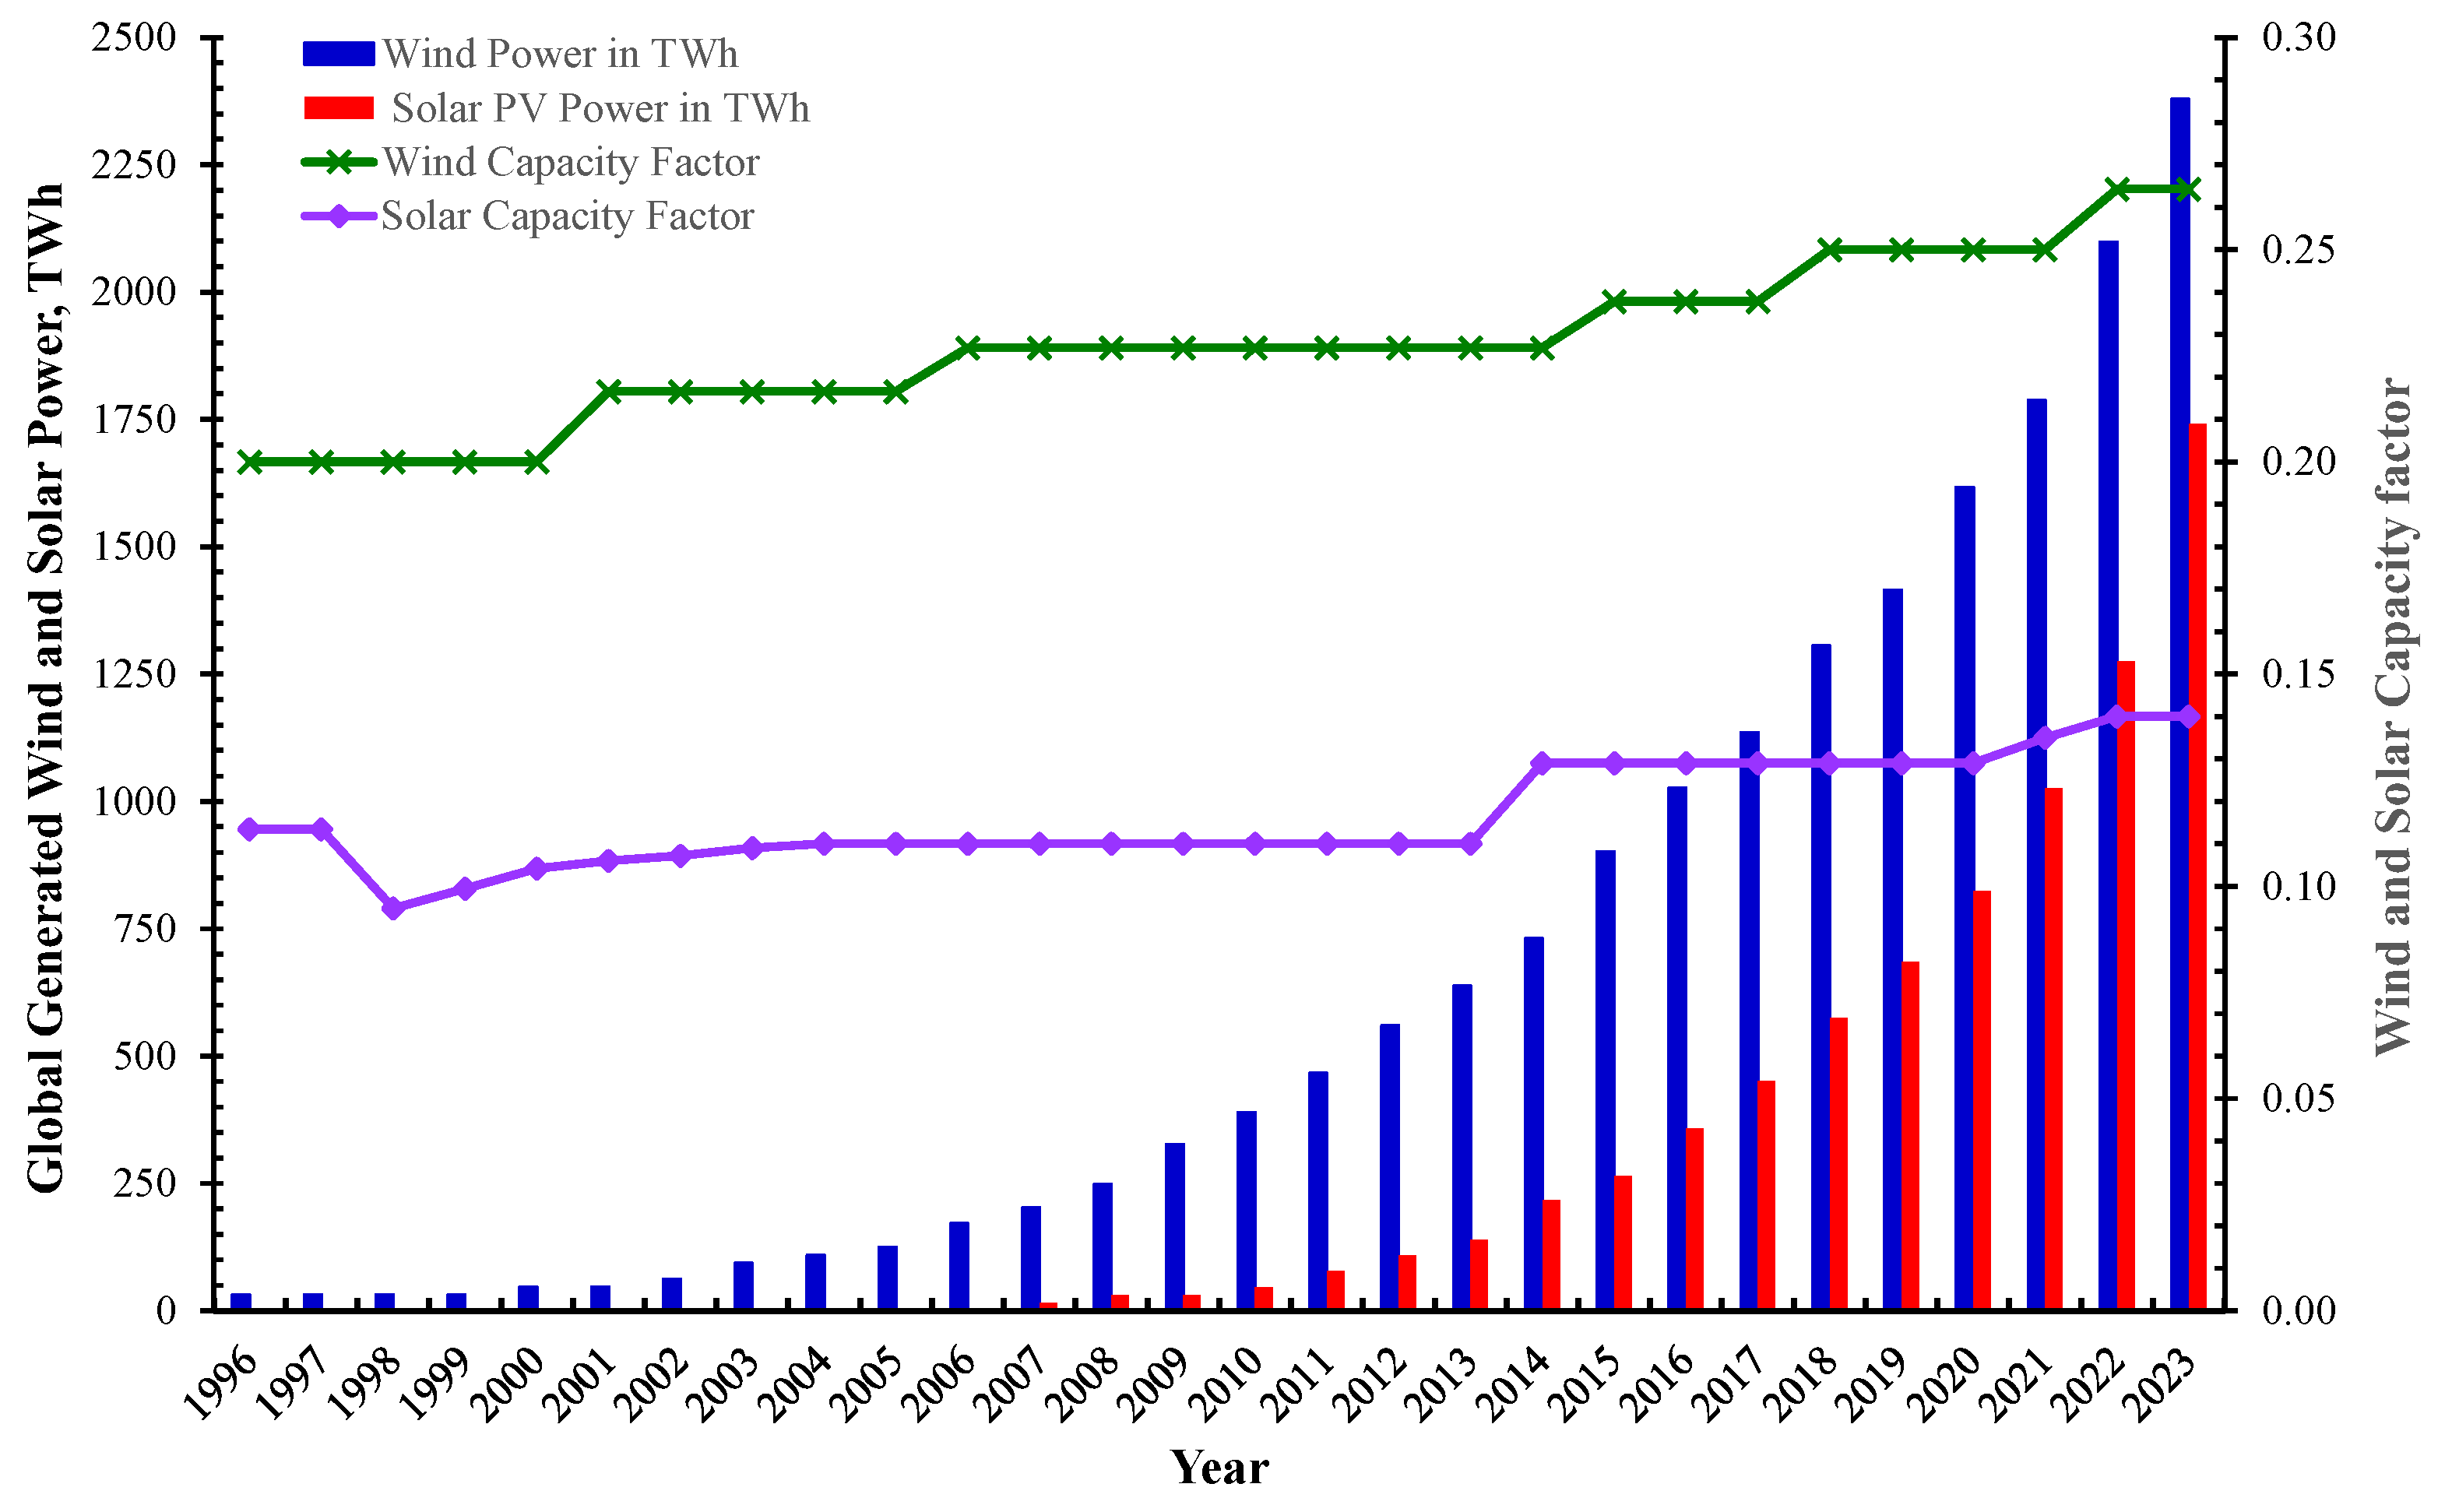
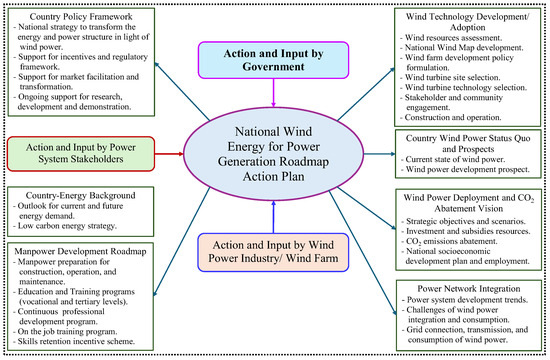
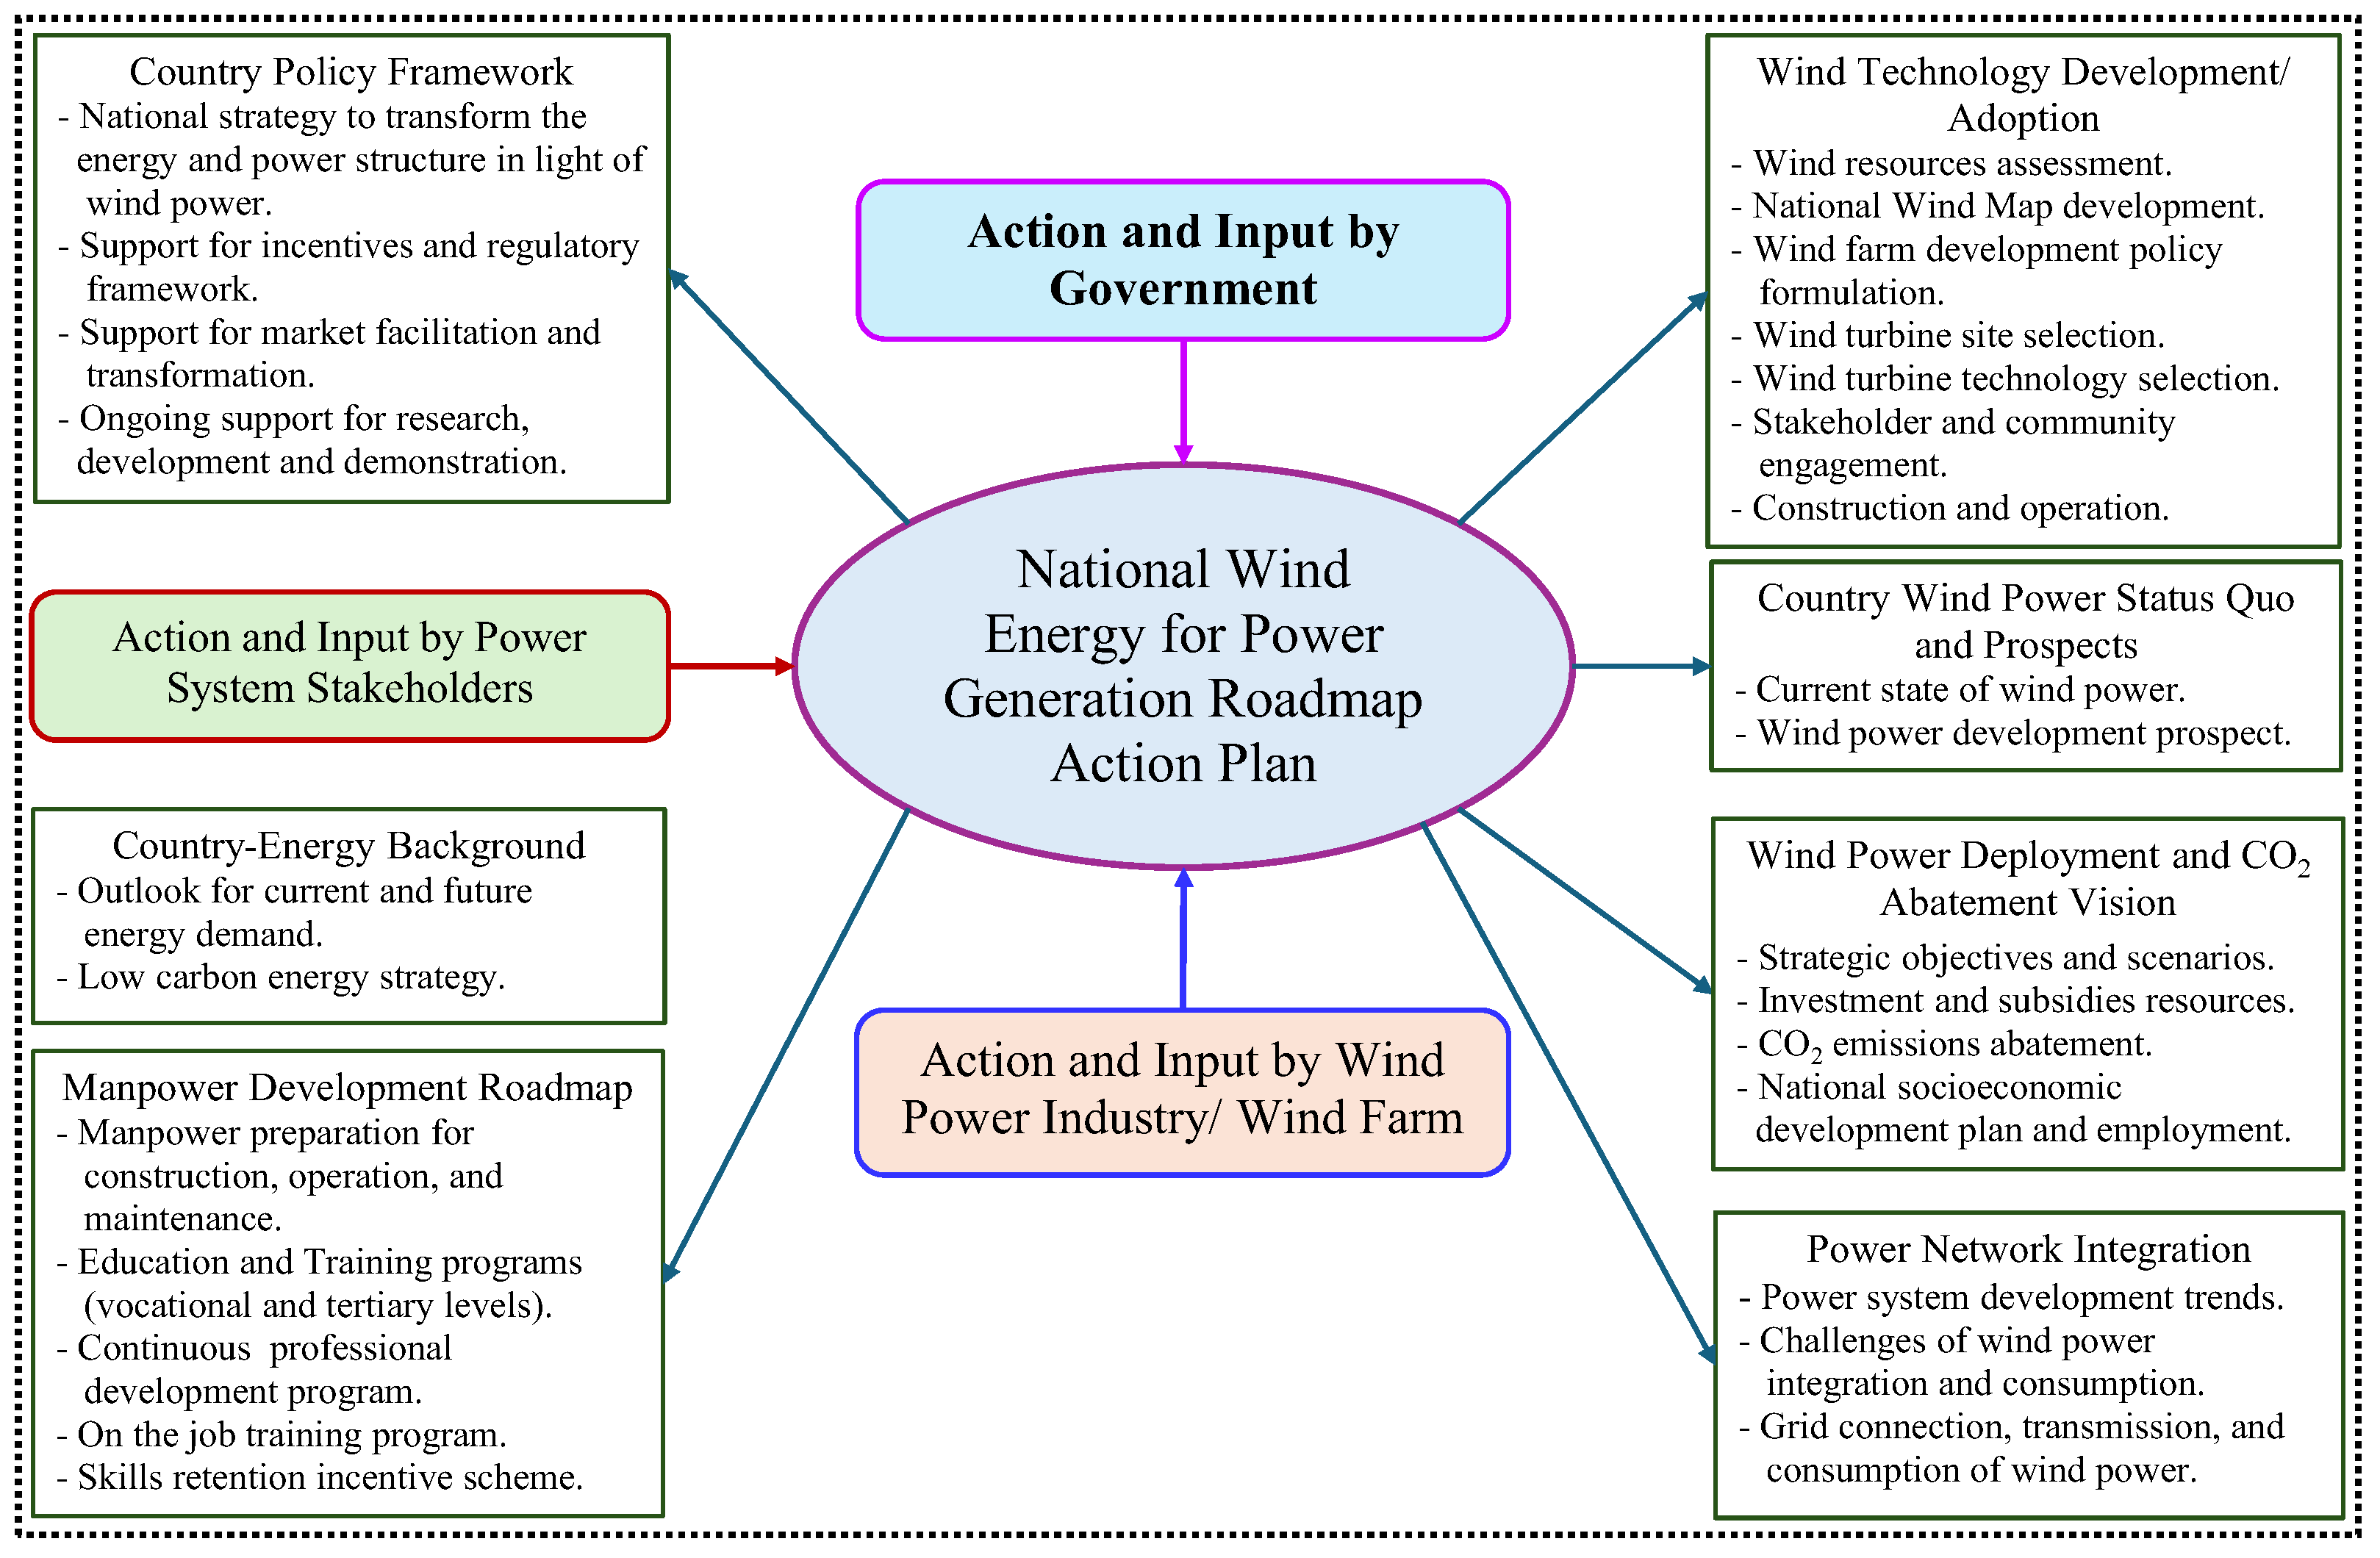
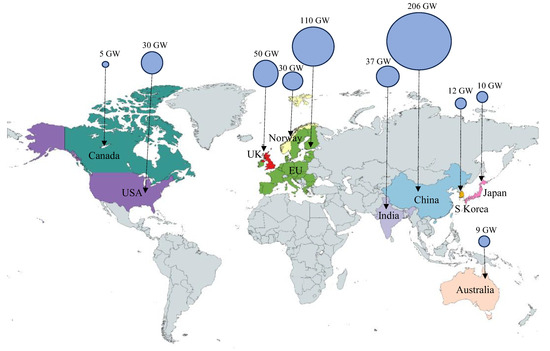
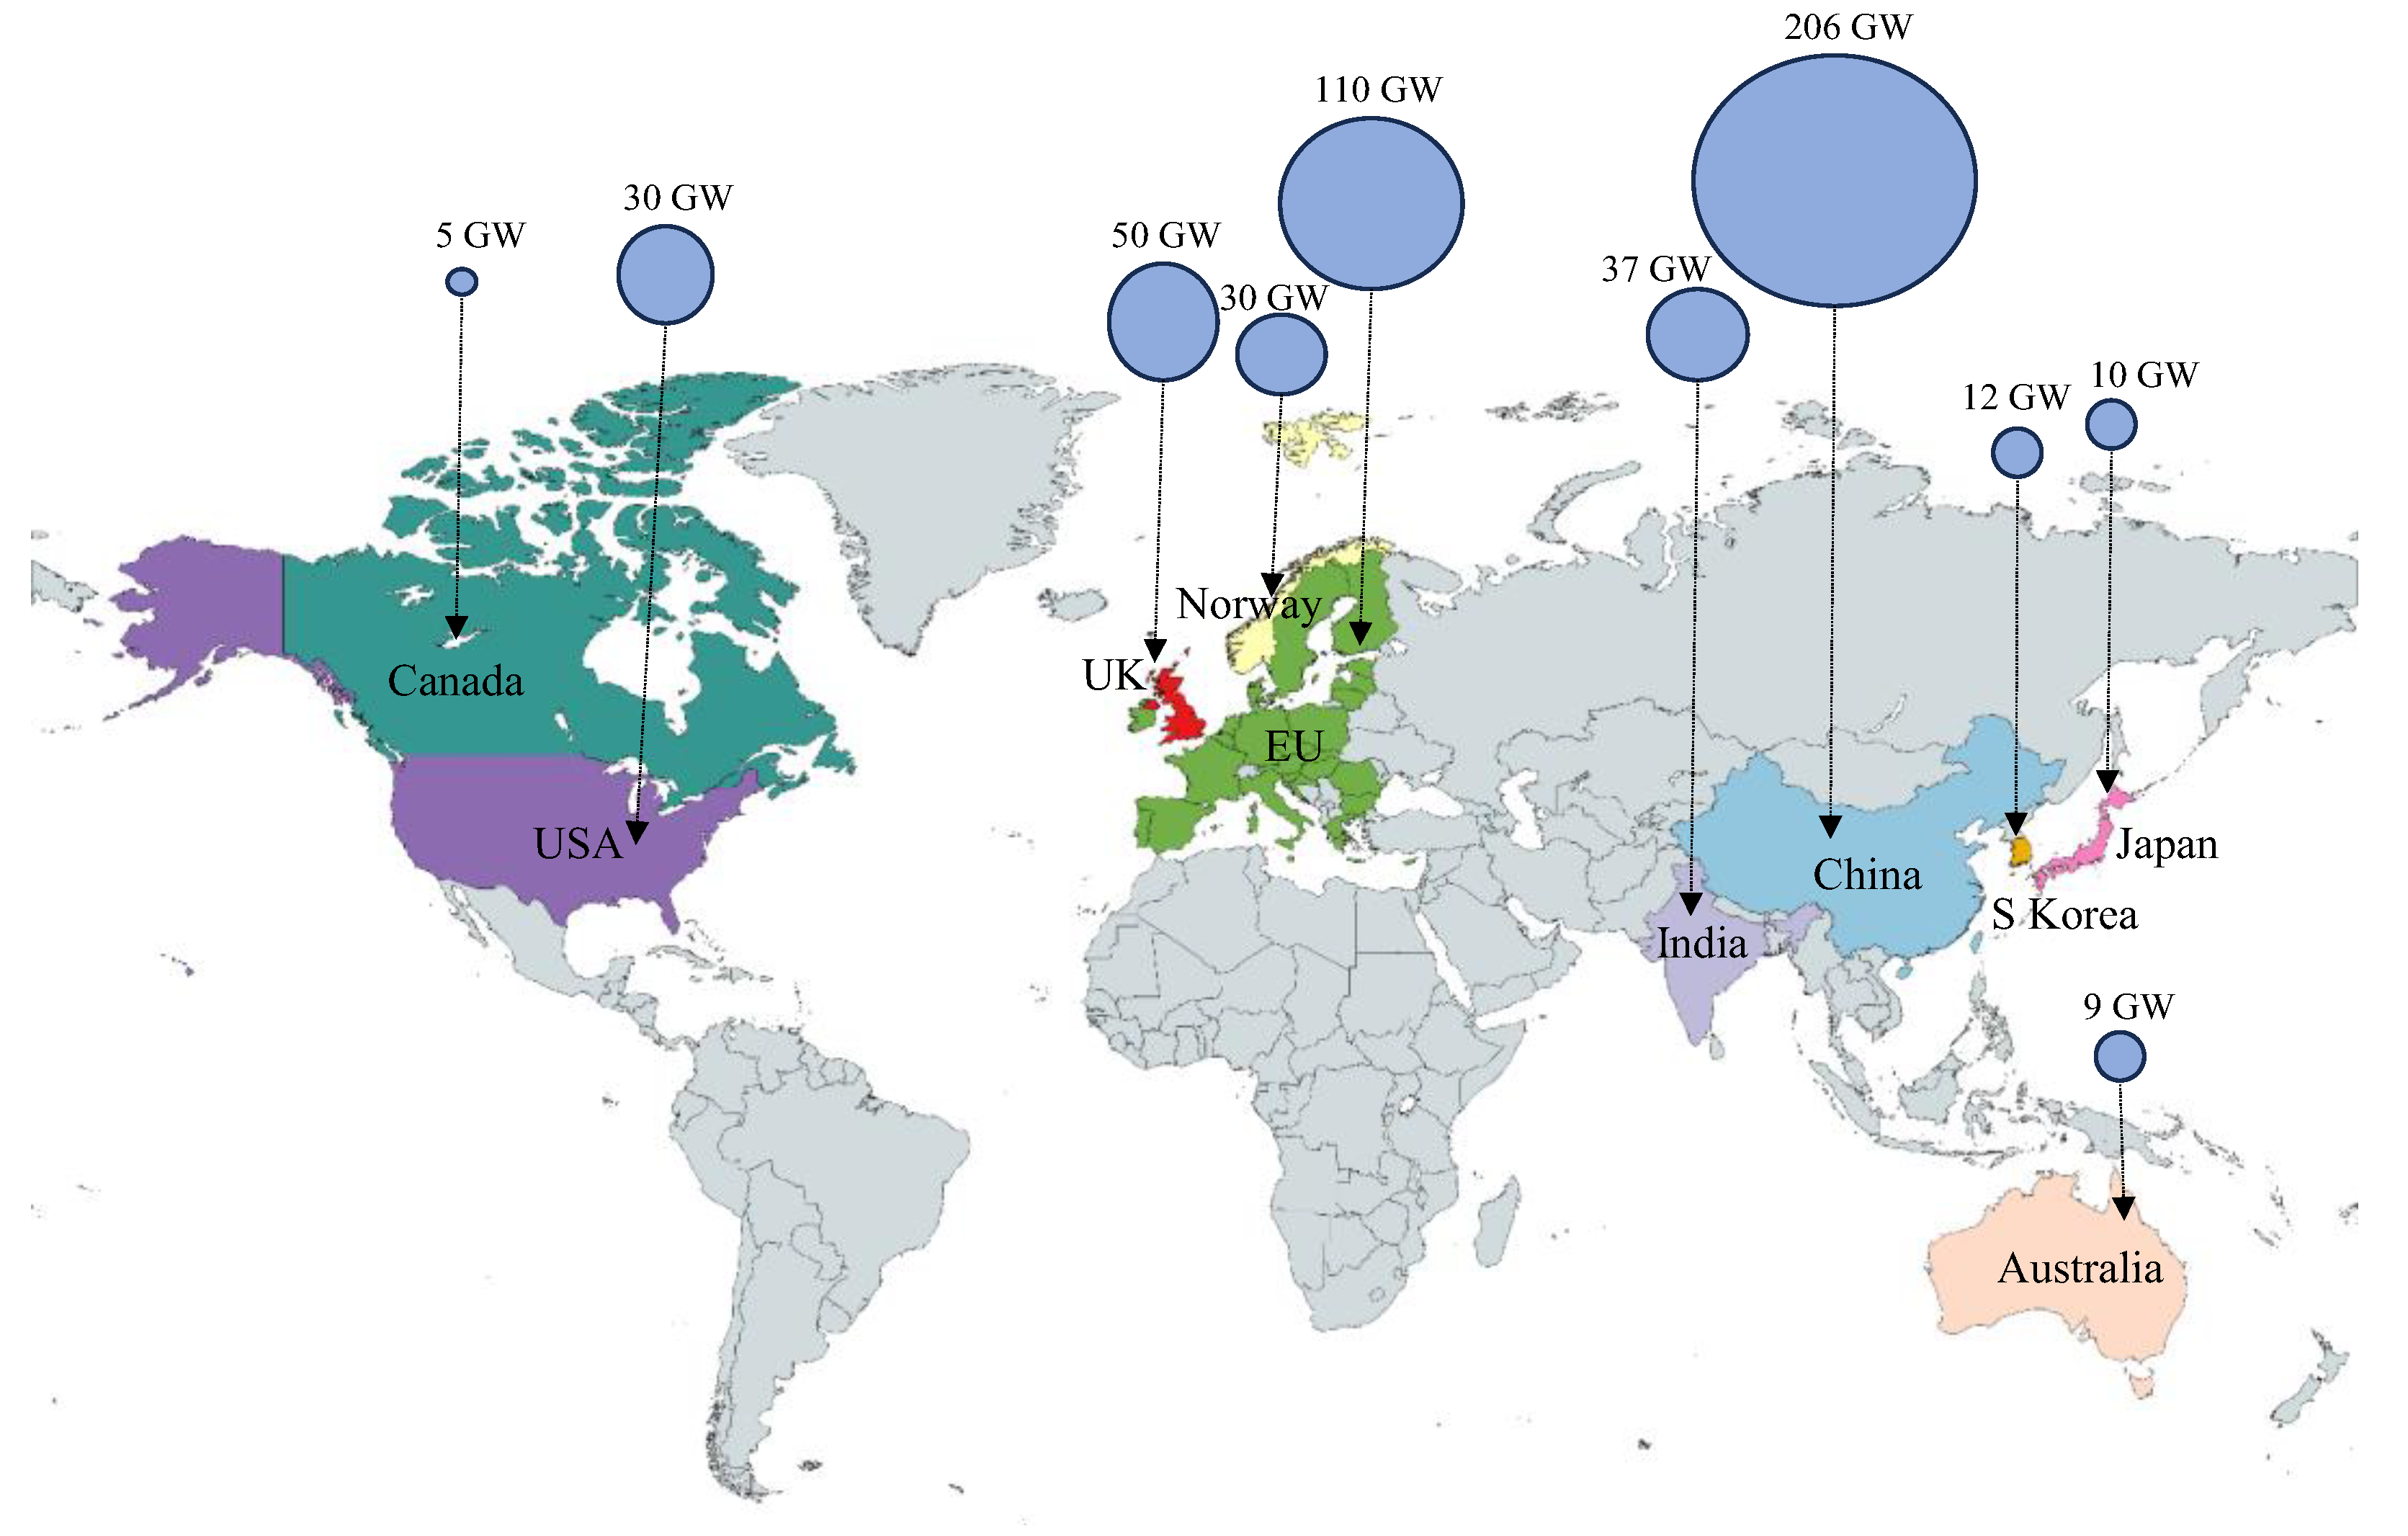

Disclaimer/Publisher’s Note: The statements, opinions and data contained in all publications are solely those of the individual author(s) and contributor(s) and not of MDPI and/or the editor(s). MDPI and/or the editor(s) disclaim responsibility for any injury to people or property resulting from any ideas, methods, instructions or products referred to in the content. |
© 2025 by the authors. Licensee MDPI, Basel, Switzerland. This article is an open access article distributed under the terms and conditions of the Creative Commons Attribution (CC BY) license (https://creativecommons.org/licenses/by/4.0/).