


Abstract
As the core subsystem of high-speed trains, the reliable operation of the traction system is critical to ensuring train safety. To enhance fault detection performance, this study proposes a probability-related slow feature analysis (PRSFA) method that leverages the intrinsic characteristics of the traction system. Specifically, Kullback–Leibler divergence is incorporated into the conventional slow feature analysis framework. Based on the slow features extracted from traction system data, the probability distribution distance between offline and online features is further computed to construct detection statistics. The feasibility of the proposed approach is validated using the high-speed train traction system simulation platform developed by Central South University. Compared with the existing SFA, DSFA and DWSFA methods, the results show that the PRSFA method can effectively improve the accuracy and robustness of fault detection.
1. Introduction
Over the past few decades, high-speed rail technology has advanced rapidly, establishing itself as one of the most preferred modes of transportation due to its speed, comfort, and efficiency. Ensuring the safety of such systems is paramount, as even rare accidents can have catastrophic consequences given the high operating speeds and passenger density. Within this context, the traction system constitutes the core subsystem of high-speed trains, and its reliable operation is fundamental to overall system stability and safety [1].
Fault detection approaches are generally categorized into model-based [2,3,4], signal-based [5,6,7], and data-driven methods [8,9,10]. While model-based techniques demand highly complex mathematical formulations that are often impractical for high-speed trains [11], signal-based methods rely heavily on predefined fault signatures, limiting scalability [12]. By contrast, data-driven methods—particularly multivariate statistical approaches—have attracted growing attention due to their implementation simplicity and ability to capture complex system behaviors without explicit physical models. Among these, Principal Component Analysis (PCA) has been one of the most widely used techniques for multivariate statistical fault detection [13]. To enhance its applicability, numerous extensions have been proposed. For example, Deep PCA (DePCA) combines PCA with kernel and deep learning methods to extract hierarchical data features [14], while other studies incorporate Kullback–Leibler divergence (KLD) to compare online and offline probability density functions for fault detection [15]. However, their dependence on Gauss and linear correlation limits their effectiveness under practical conditions [16]. In order to overcome the limitation of non-Gaussian, independent component analysis (ICA) is introduced. ICA can be applied to extract the independent components of high-speed train bogie structural load and fatigue critical point stress to realize the life monitoring of key fatigue structures [17], or integrate learning and Bayesian methods for non-Gaussian process monitoring [18]. However, ICA’s dependence on statistical independence often reduces its robustness in complex fault scenarios [19].
Given that traction system faults inherently exhibit temporal correlations, Slow Feature Analysis (SFA) has emerged as a promising solution, providing latent features that evolve slowly over time and are sensitive to fault dynamics [20]. Improved versions of SFA have also been explored for high-speed train applications, such as Dynamic Weighted SFA (DWSFA) to mitigate lag in latent variable extraction [21] and Hellinger distance-based SFA for gear system monitoring [22]. Although SFA-based methods can extract temporally correlated slow features for fault detection, they are sensitive to noise.
Building on this foundation, we propose a Probability-Related Slow Feature Analysis (PRSFA) method that integrates Kullback–Leibler divergence into the SFA framework. This integration enables the simultaneous exploitation of temporal correlations and distributional differences between offline and online data. The method is validated using a high-speed train traction system simulation platform, and comparative experiments against conventional SFA, DSFA and DWSFA approaches demonstrate superior performance. Specifically, PRSFA achieves markedly lower false alarm rates (FAR) and missed alarm rates (MAR), while also offering advantages of computational efficiency, low detection latency, and adaptability for real-time deployment. These results underscore PRSFA as both a practical scheme for enhancing traction system reliability and a promising avenue for future research in data-driven fault detection and railway condition monitoring.
2. Method
2.1. Kullback–Leibler Divergence
Kullback–Leibler (KL) divergence is a statistical measure used to quantify the difference between two probability distributions. In this study, KL divergence is employed to evaluate the distance between the probability distributions of the slow feature matrix [23]. Let a random variable follow two continuous probability distribution functions, and . The KL divergence is typically defined as
where represents that the probability distribution functions and are more similar, and , if and only if , . since KL divergence is an asymmetric measure, KLD from to is not necessarily the same as KLD from to , so it is not suitable for distance measurement. To overcome this limitation, a symmetric form is adopted:
When the probability density function and obey the normal distribution, that is, , can be calculated as
In the case of non-Gaussian data, and can be calculated by sliding window as:
Although the probability-based divergence model can be affected by sensor noise and operational variations, the PRSFA framework mitigates these effects by integrating temporal slow features with adaptive probability updates. This hybrid structure enhances diagnostic reliability under changing traction load, temperature, and multi-fault scenarios.
2.2. Slow Feature Analysis Method
The fundamental idea of Slow Feature Analysis (SFA) is to extract features that vary as slowly as possible from rapidly changing time-series signals. Consider a random or ergodic signal . Its temporal variation rate can be expressed as
where is the time average, is the first derivative of to time, is the natural definition of a certain slowness, and the expectation of can be calculated as:
In the traction system, the measurement of process data is usually based on a discrete sampling interval. Suppose that the time series sample is expressed as , where is the number of archived samples. Therefore, the time average of the expectation operator in (6) can be estimated by discrete samples:
At this time, the time derivative can also be expressed approximately by time difference:
The optimization problem of SFA can be described as follows:
For the input signal of m-dimensional traction system, on the premise of linear transformation, the slowness characteristic signal can be expressed as a linear combination of the following input signals:
Make:
Minimum under the following constraints,
From (8), is the first-order differential of slowness characteristic.
is the time average of a signal . Given N historical samples , the time average can be calculated as:
The objective Equation (10) expects the characteristics of each slowness to change as slowly as possible. The zero mean and unit variance constraints can effectively avoid the occurrence of constant solutions, while the last decorrelation constraint can force different slow features to have different information and effectively avoid information duplication.
When all dimensions of the input signal are scaled to zero mean, the optimization problem of Equation (10) can be described as:
where and are covariance matrices of and respectively. is the generalized eigenvalue matrix of m linear mappings, is the eigenvalue matrix containing eigenvalues on the diagonal, . This means:
The covariance matrix is decomposed by SVD to obtain:
From this we can get:
Let the spheroidization matrix , then formula (16) can be written as:
The SVD decomposition of is carried out to obtain
Take it into Equation (17) to get the final solution:
The slowness feature s is divided into two parts: the principal component part and the residual part. According to the slowness feature ranking, the first features can reflect the general trend of system data changes, and the residual features include short-term noise and unknown disturbance.
2.3. Formatting of Mathematical Components
In this paper, KL distance is measured for the slowness characteristics of training data and test data, so as to quantitatively analyze the difference in probability distribution. According to the slowness feature s obtained from the training data and the slowness feature obtained from the test data, the second evaluation function based on KL measurement for the j slowness feature that obeys the Gaussian distribution can be expressed as:
Its mean and variance can be used to calculate the KL measure:
where and are the mean of and respectively, and are the variance of and respectively. and can be calculated from (4).
Therefore, the new statistic can be constructed as
where and are KL evaluation matrices of and respectively, and are covariance matrices of and respectively, and and obey the following distribution:
where is the distribution of degree of freedom , and .
The threshold can be set according to the given confidence limit (i.e., ):
The following judgment can be made
To construct the data set, 20,000 samples were generated for each case using the tdcs-fib 2.0 simulation platform. The first 10,000 samples under normal operation were used for training, and the remaining 10,000 samples with injected faults were used for testing to evaluate the reliability of the constructed statistics.
For ease of understanding, the fault detection method based on PRSFA can be designed as the following Algorithms 1 and 2:
| Algorithm 1: Offline section. |
|
| Algorithm 2: Online section. |
|
3. Verification
To evaluate the effectiveness of the proposed method, simulation experiments were conducted using the TDCS-FIB2.0 platform, developed by Central South University for a high-speed train traction control system (TDCS).
3.1. Traction System of High-Speed Trains
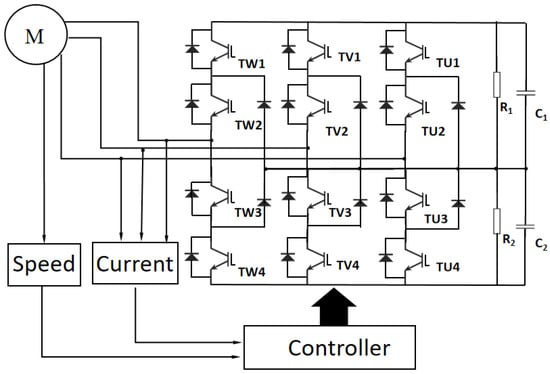
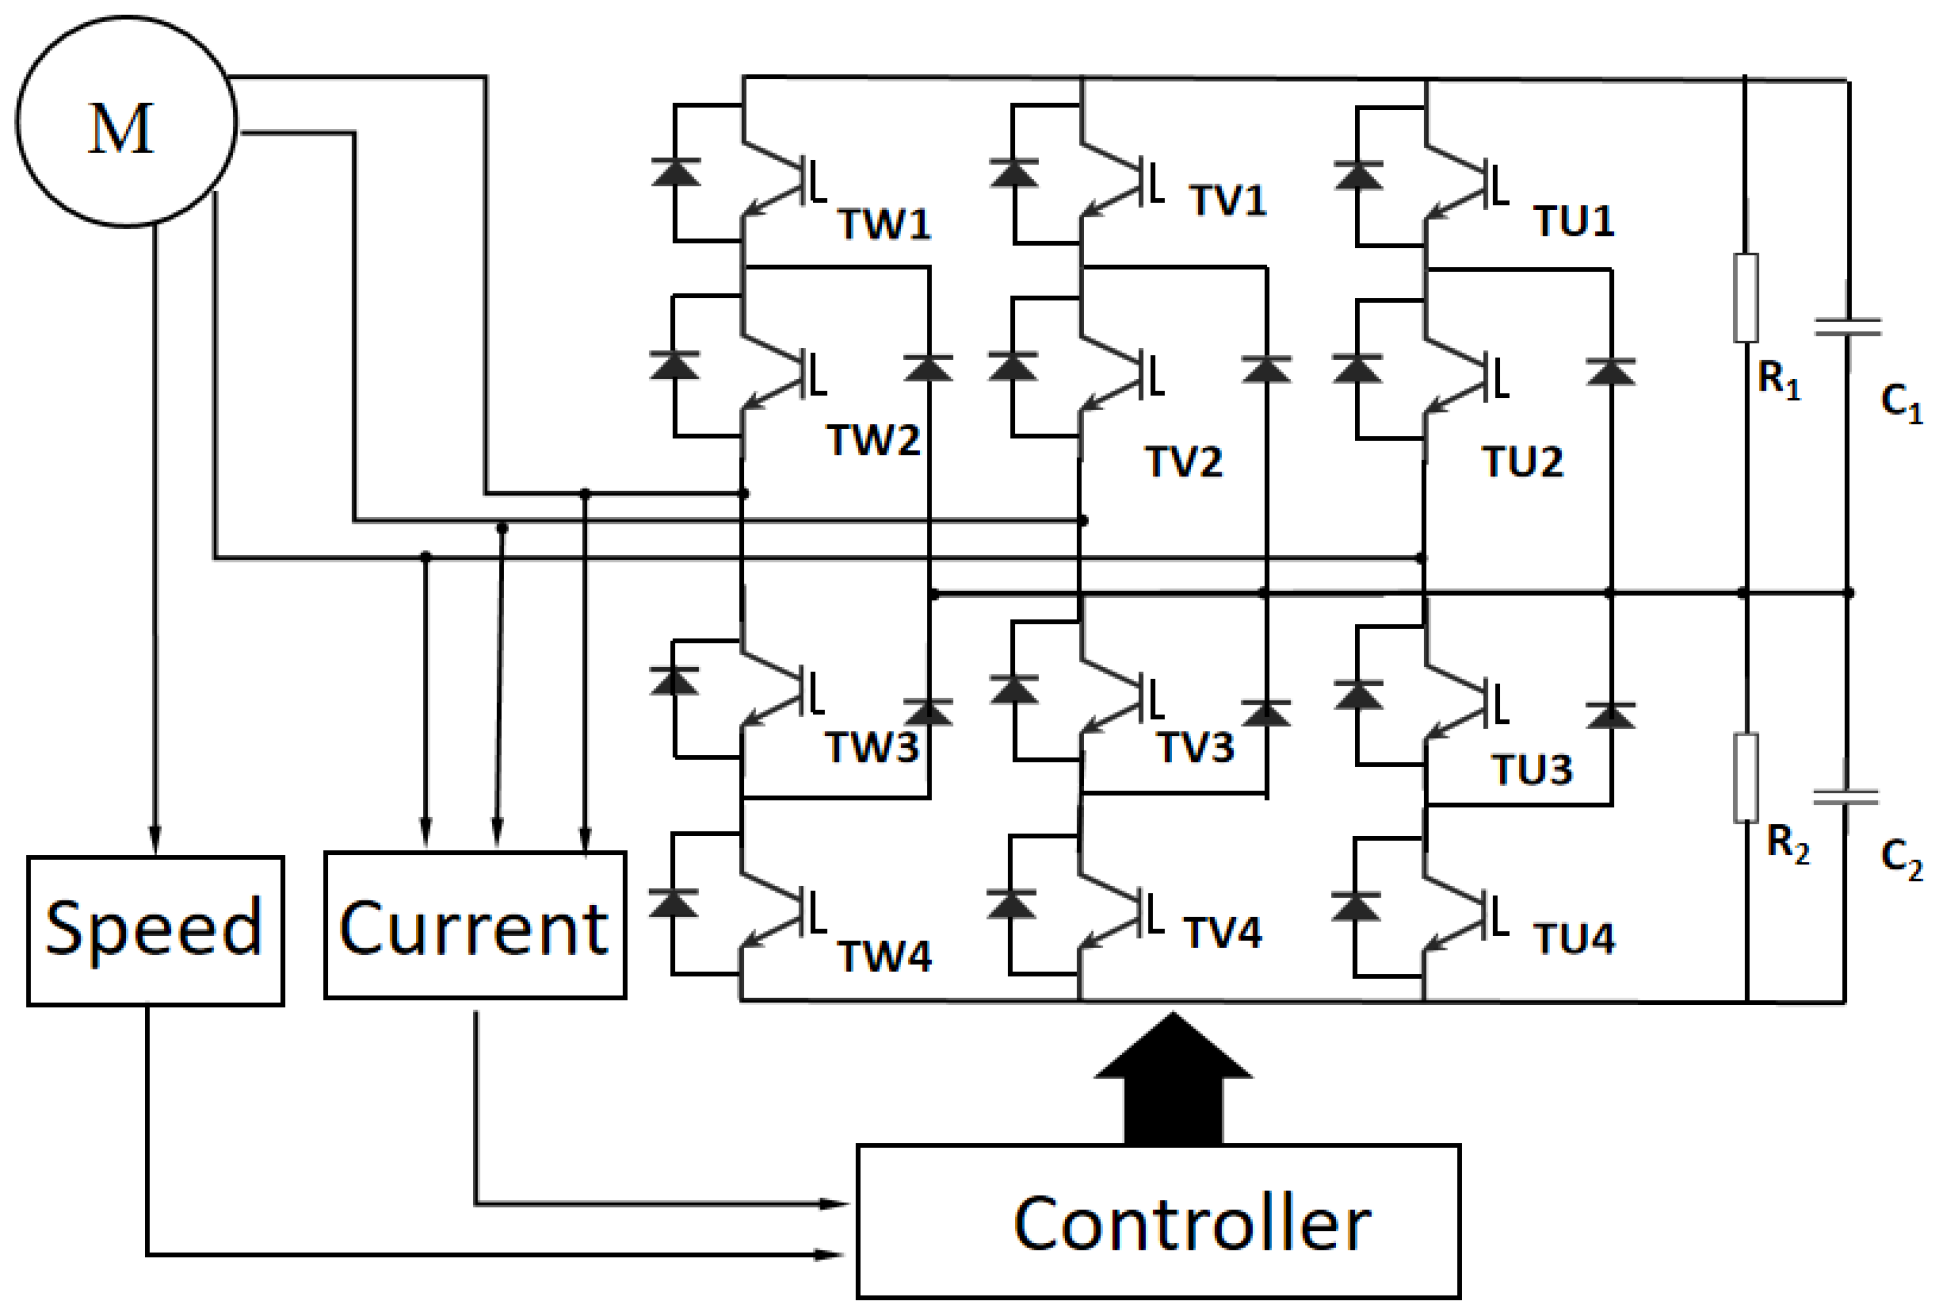
Figure 1 depicts the electrical configuration of the CRH2 high-speed train traction system. The system primarily consists of a traction controller, traction motor, three-level inverter, traction transformer, filter, and other auxiliary components. It adopts a space vector pulse width modulation (SVPWM) control strategy, whereby, once a target traction speed is specified, the controller adjusts the inverter gate signals accordingly to regulate traction power [24].
Figure 1.
Electrical Structure of the Traction System for High-Speed Trains.
To ensure continuous monitoring, multiple sensors—including speed, voltage, and current sensors—are distributed across the system. Faults within the traction system are typically categorized according to their location, such as motor faults, sensor faults, converter faults, and control unit faults [25]. In practice, fault detection is generally performed by comparing real-time sampled data with predefined thresholds, upon which the automatic protection system is activated. Nevertheless, such threshold-based approaches are prone to false alarms and missed detections, often necessitating extensive on-site inspections along the railway line. Consequently, reducing both the false alarm rate (FAR) and the missed alarm rate (MAR) is essential for ensuring the safe and reliable operation of high-speed train traction systems.
3.2. Test Model of Faults
The simulation platform supports two operational modes: fault-free and fault-injection. In the fault-injection mode, users can specify fault types from a library of 23 predefined scenarios, covering subsystems such as sensors, traction converters, traction motors, and traction controllers. Both single and composite faults can be simulated, allowing for diverse fault scenarios. Furthermore, the injection position can be flexibly selected. For example, in simulating a sensor fault, the U-phase, V-phase, or W-phase current sensors in the three-phase motor stator winding can be individually configured.
In addition to selecting fault types and positions, the platform also enables customization of fault parameters, including fault amplitude, injection time, and noise disturbances. This flexibility makes the platform particularly suitable for validating the performance of fault detection methods under realistic and diverse operating conditions.
To further evaluate the reliability and comprehensiveness of the proposed algorithm, two categories of subsystem faults were introduced in the simulations: sensor faults and motor faults. For each category, two representative fault types were selected. Specifically, gain faults and d-impulse faults are common sensor anomalies, used to test the algorithm’s capability to handle measurement errors and sudden noise disturbances. Bearing faults represent typical mechanical failures, while inter-turn short-circuit faults in the stator windings represent common electrical faults. Selecting these four fault types ensures that the algorithm is effectively validated under fault conditions with different physical origins, dynamic behaviors, and spectral characteristics.
Simulations were conducted under a signal-to-noise ratio (SNR) of 30 dB, a window length of , and additive Gaussian noise.
- Sensor faults:
Fault : A gain fault, in which the output signals of the three-phase current sensors increase proportionally.
Fault : A d-impulse fault, in which an impulse is injected into the output of the current sensor at a specified time.
- Motor faults:
Fault : A bearing fault, characterized by the appearance of fault-related frequency components in the three-phase stator currents of the motor.
Fault : An inter-turn short-circuit fault in the stator windings, producing characteristic frequency components determined by the fundamental frequency Hz) and a slip ratio of s = 0.036.
The dataset for each experiment was divided into training and testing subsets. Fault-free data were used for training, while fault-injected data were reserved for testing. For each condition, 20,000 samples were collected, with 10,000 of these containing injected faults. Notably, the d-impulse fault () was modeled as a transient condition: during samples 10,000 to 12,000, an impulse disturbance was injected into the sensor output, after which the signal returned to normal operation.
3.3. Results and Discussion
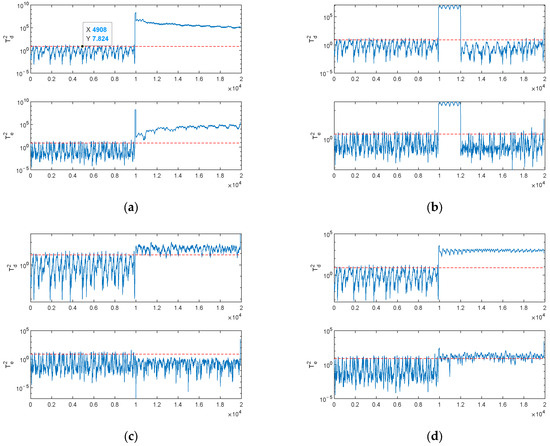
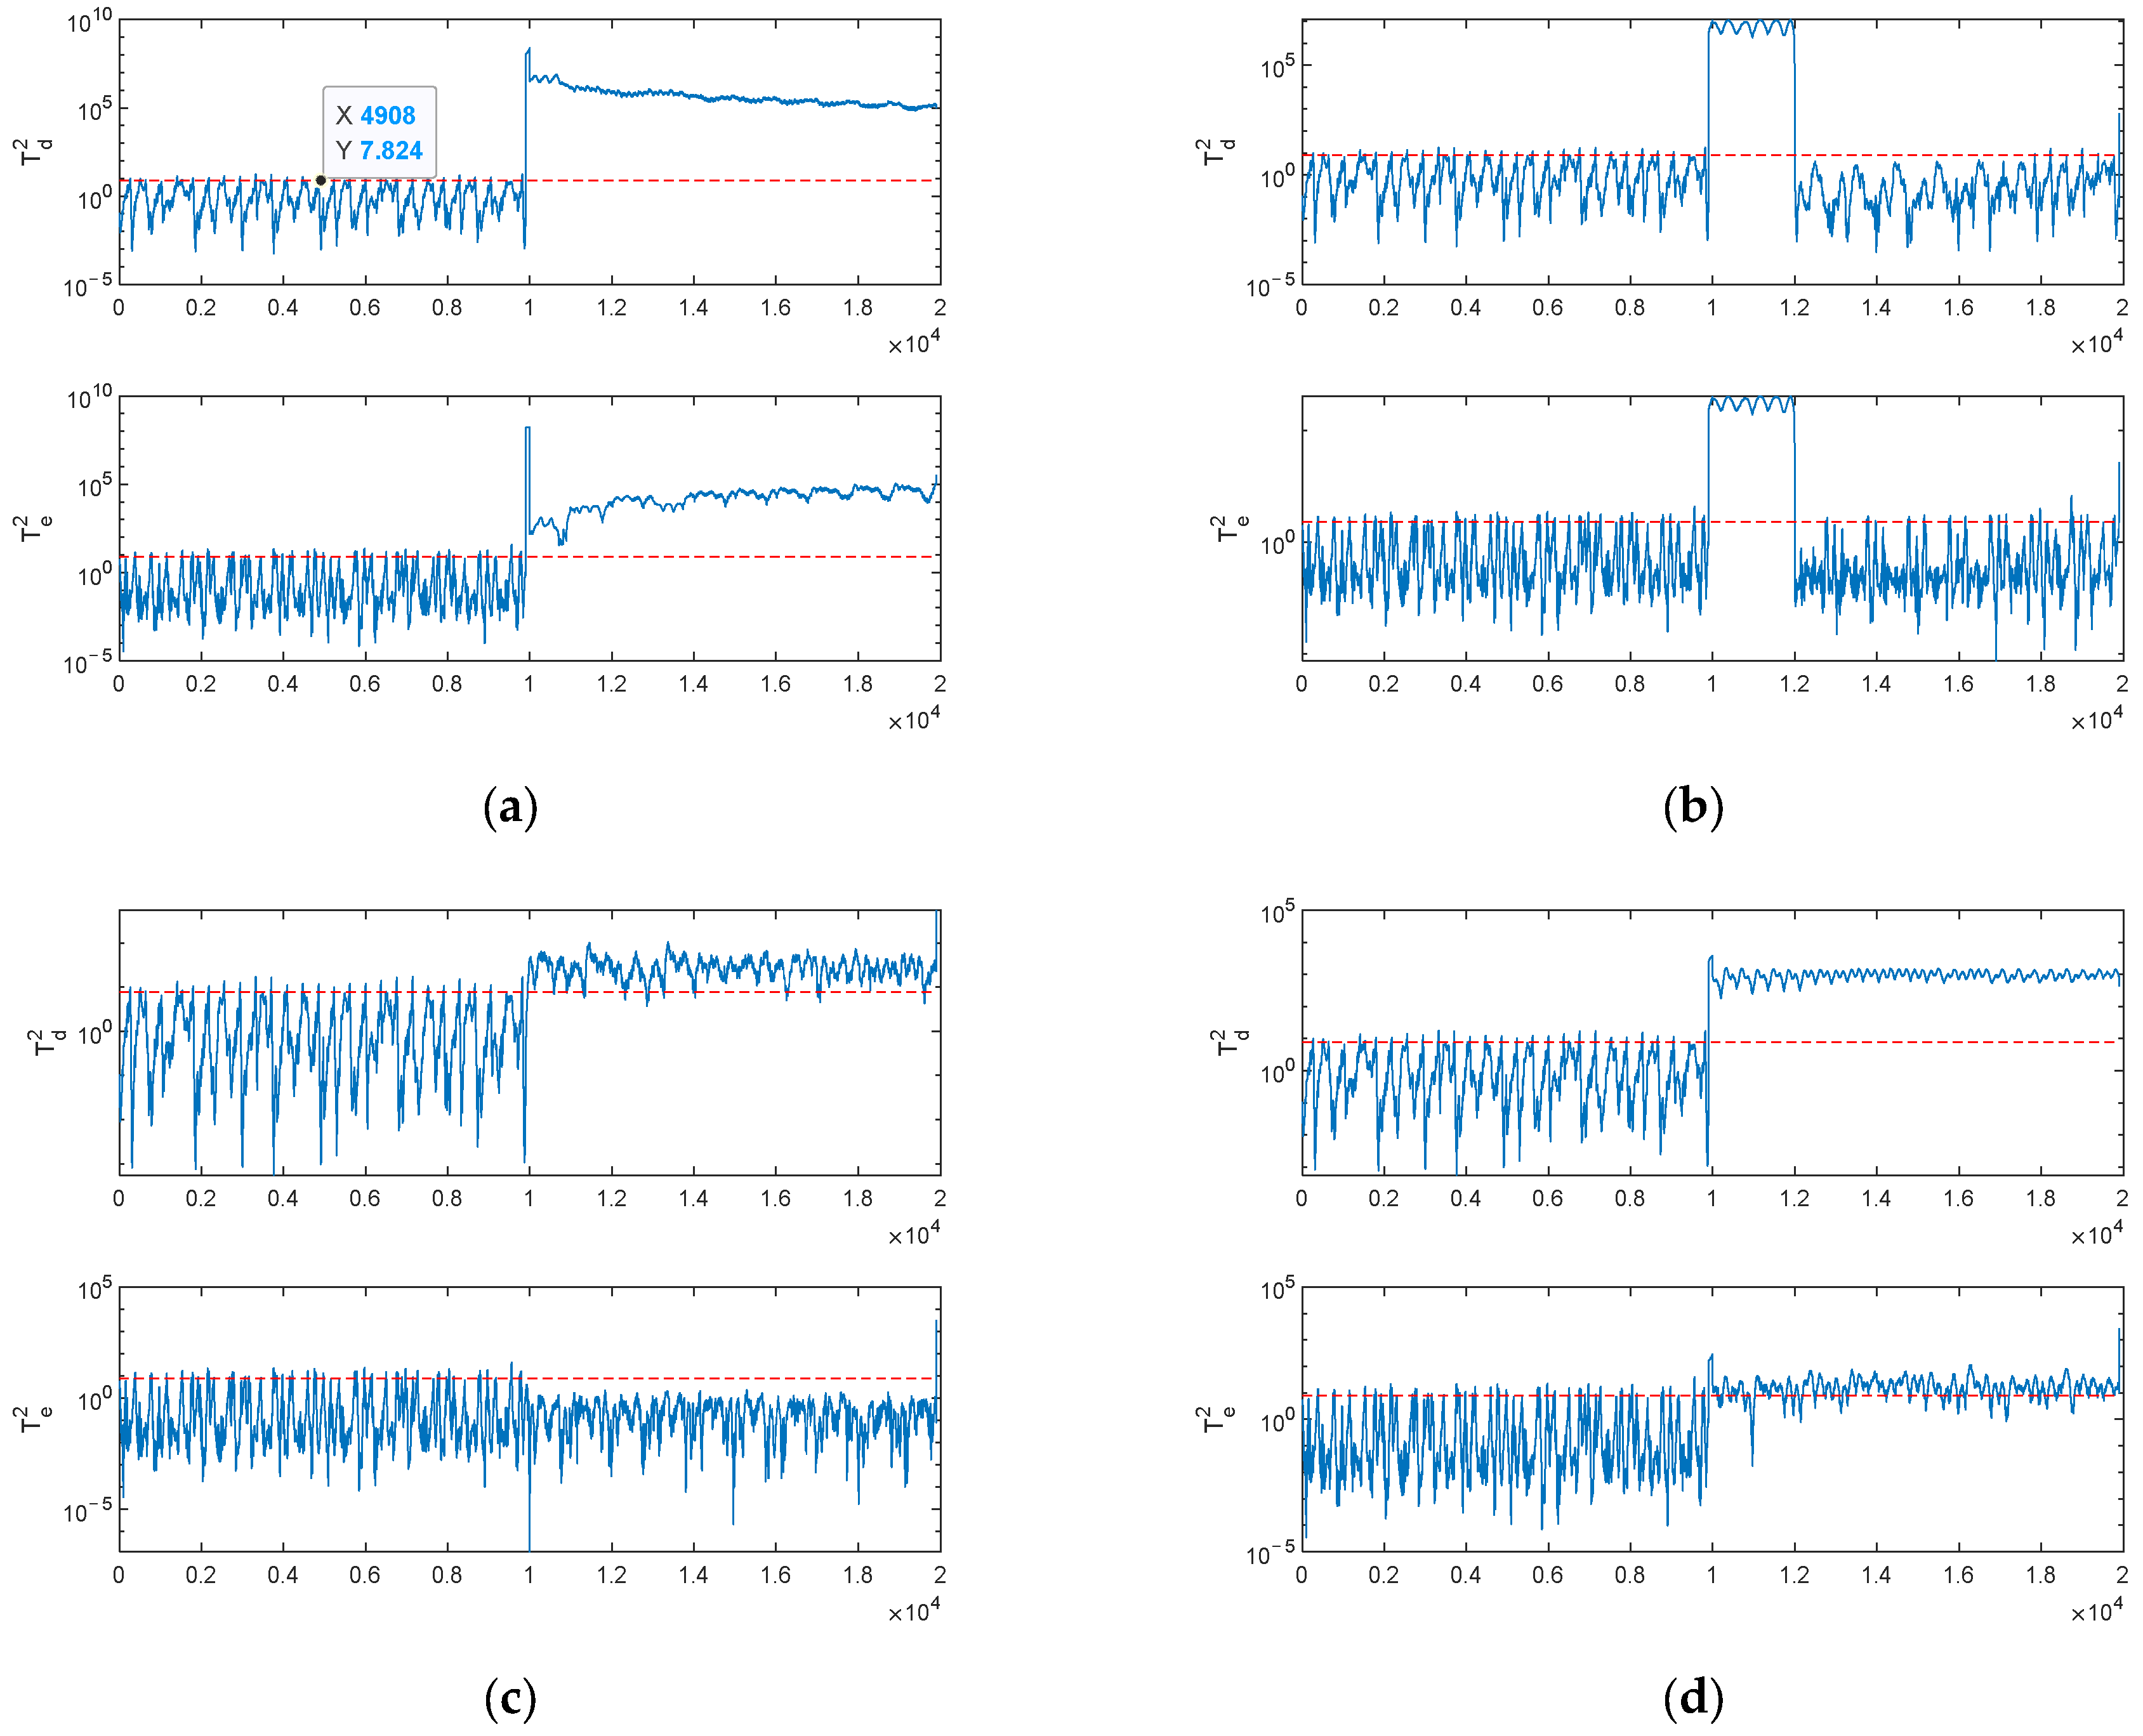
This section mainly discusses the fault detection results and performance of the PRSFA method. Figure 2 illustrates the detection results of four types of faults, where the blue solid line represents the statistical measure and the red dashed line represents the threshold, the abscissa represents the collected samples, and the ordinate represents the statistics. Set , the threshold can be obtained by looking up the table.
Figure 2.
Fault detection results of PRSFA method: (a) Detection results of ; (b) Detection results of ; (c) Detection results of ; (d) Detection results of .
It is obvious from the figure that when four kinds of faults are injected, they can be detected, and the detection results have low delay. As shown in Figure 2a, when fault is injected, statistics and both exceed the threshold and the amplitude changes greatly, which indicates that faults can be detected in both the principal component space and the residual space, and statistics have significantly more false positive data, because the residual space contains more noise interference. As shown in Figure 2b, when fault is injected, the fault is detected in time, and the alarm can be stopped at the end of the impact, showing the characteristics of sensor impact fault, which can provide reference for subsequent judgment of fault type and location. As shown in Figure 2c, when fault is injected, the fault is detected in time on , and the statistic has significantly more false positive data. As shown in Figure 2d, when fault is injected, both statistics can detect the fault in time and have better detection performance in. For the two groups of experimental results, it can be seen that the detection result of sensor fault is slightly better than that of motor fault. This is because the motor fault is mostly compound fault, and the fault amplitude is low, but in general, the fault can still be detected in time, and the error is within the acceptable range.
Two performance indicators are used to evaluate the detection performance, false alarm rate (far) and missing alarm rate (MAR). Define the sample before the failure as positive and the sample after the failure as negative, so before the failure, the sample of error triggered threshold alarm can be expressed as false positive (FP), and the correct sample can be expressed as true positive (TP); After the fault occurs, the samples that do not cause an alarm because the statistics are lower than the threshold can be expressed as false negative (FN), and the correct alarm samples can be expressed as true negative (TN). Thus, far and mar can be obtained from the following formula:
In addition, in order to study the performance advantages of the proposed method, two existing detection methods, SFA, DWSFA [21] and DSFA [26], were compared under the same experimental conditions. The comparison results are shown in Table 1. It is worth noting that both methods have poor detection results for bearing faults. This is because the bearing fault amplitude is small, and its fault characteristics are easily affected by noise, while SFA method and DSFA method are easily affected by noise. In general, the proposed method has better detection performance.
Table 1.
Experimental comparison of traction system %.
3.4. Robustness Analysis
In this section, the robustness of the proposed algorithm is verified by analyzing its behavior under different noise conditions. The mean and variance of the statistical measure are employed as robustness indicators, since both metrics are primarily affected by the window length (n) and the signal-to-noise ratio (SNR). Therefore, these two factors are selected as the key experimental variables.
The experimental settings are as follows:
- SNR: from −50 dB to 50 dB;
- Window length: n = 40, 60, 80, and 100.
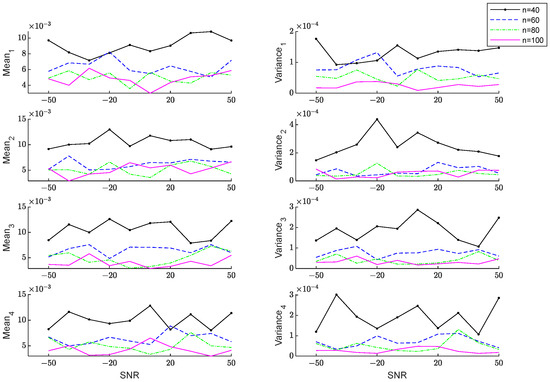
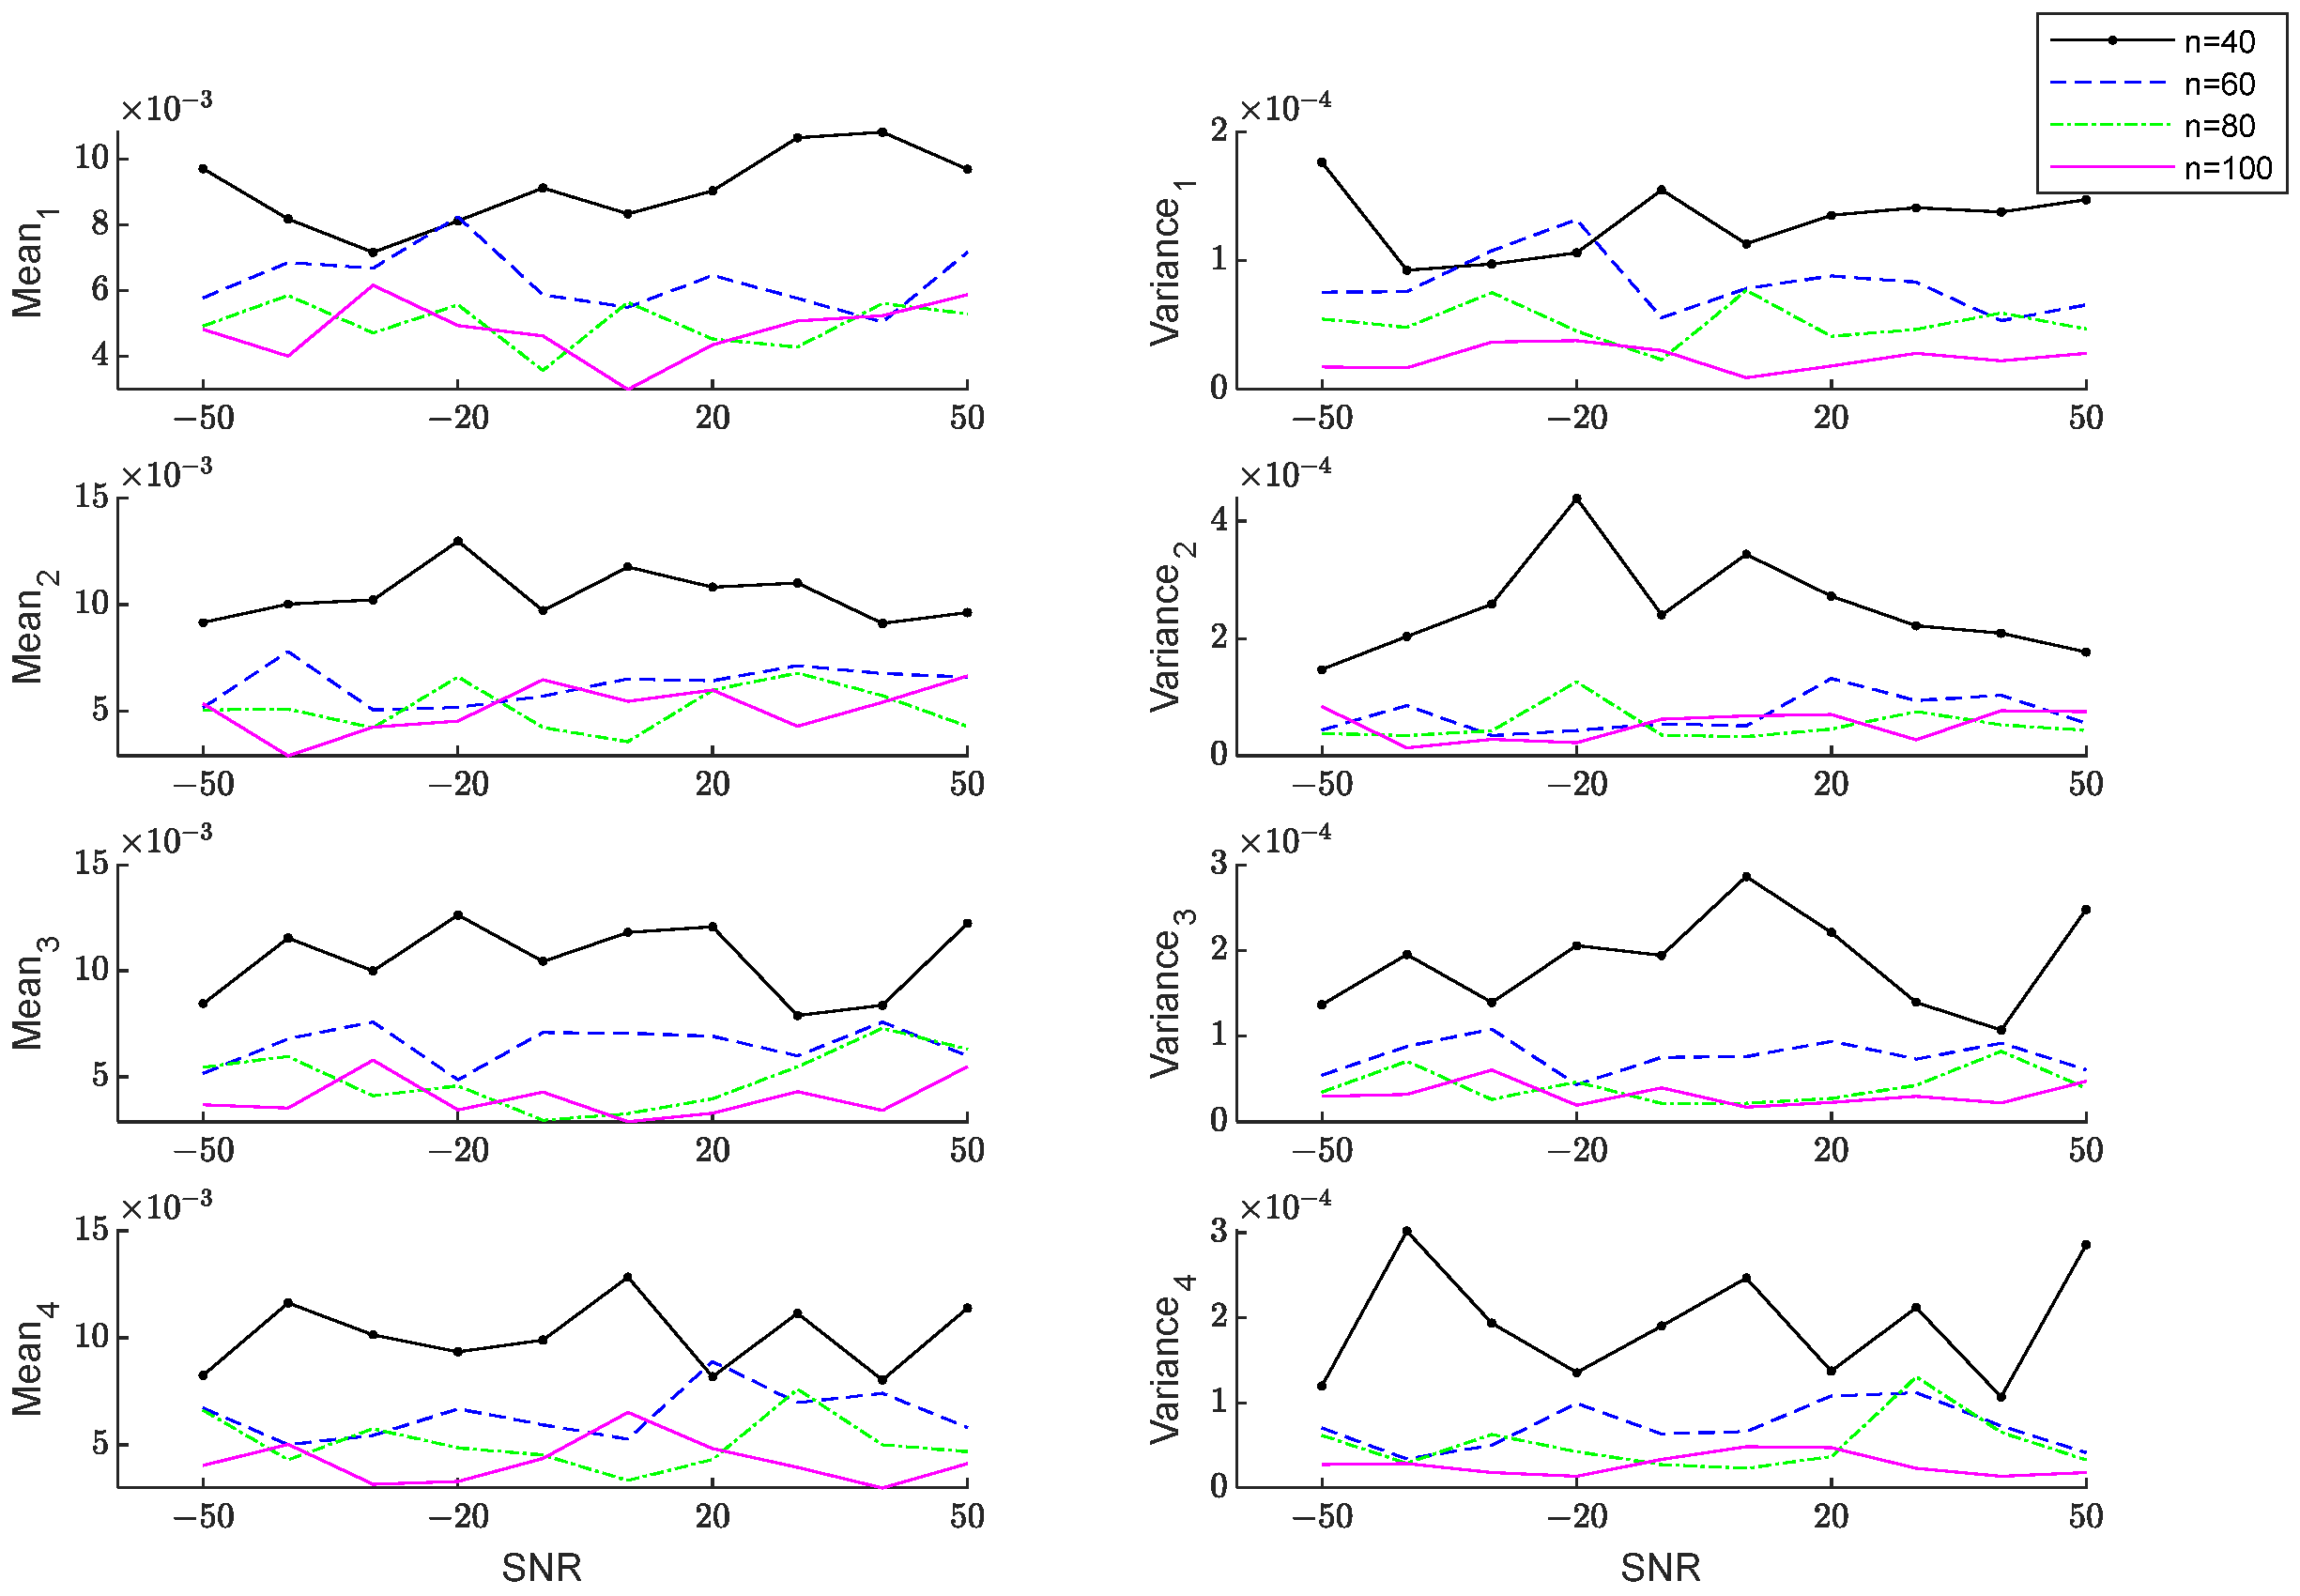
The mean and variance of four types of faults under different window lengths and signal-to-noise ratios are shown in Figure 3. The horizontal axis represents the SNR, while the vertical axis denotes the mean and variance. The black, blue, green, and red curves correspond to window lengths of 40, 60, 80, and 100, respectively.
Figure 3.
Mean and variance of four types of faults under different window lengths and SNR.
As observed from the results, for a fixed window length, the mean and variance exhibit only minor variations across different SNR values, indicating weak sensitivity to noise level. Under the same SNR, the mean and variance slightly differ with varying window lengths, but all values remain within the same order of magnitude. These findings demonstrate that the proposed algorithm maintains strong robustness even in noisy environments.
It is worth noting that the window length has a noticeable effect on the statistical characteristics: as n increases, both the mean and variance decrease. This occurs because a larger window contains more data samples, allowing the estimated distribution parameters to more accurately capture the system’s dynamic characteristics over the observation period, thereby improving noise resistance and detection reliability. However, increasing the window length inevitably leads to longer detection latency. Therefore, considering the trade-off between accuracy and response time, a window length of n = 100 was adopted in the experiments. Under this configuration, the algorithm performs reliably across the SNR range of −50 dB to 50 dB, and an SNR of 30 dB was selected as the reference value based on empirical experience.
4. Conclusions
This paper proposes a Probability-Related Slow Feature Analysis (PRSFA) method to address the challenges of false alarms and missed detections in high-speed train traction-system fault diagnosis. By integrating Kullback–Leibler divergence with slow features extracted via SFA, the proposed framework simultaneously exploits both the statistical distribution and temporal correlations of traction-system data.
Experimental validation on the tDCS-FIB 2.0 simulation platform demonstrates that PRSFA significantly outperforms conventional SFA, DSFA, and DWSFA methods in terms of detection accuracy and robustness. The method achieves markedly lower false-alarm and missed-alarm rates, confirming its potential for practical deployment in traction-system condition monitoring.
Nevertheless, this study has several limitations. The proposed approach has been validated primarily in simulation environments, and its performance under real operating conditions may be affected by complex noise, parameter drift, and environmental uncertainties. Furthermore, computational efficiency could become a concern when scaling the algorithm for large-scale or real-time applications.
Future work will therefore focus on:
- (1)
- Experimentally validating the PRSFA method using field data from actual traction systems.
- (2)
- Optimizing algorithmic complexity to improve real-time performance.
- (3)
- Incorporating adaptive or online learning mechanisms to handle evolving fault patterns.
In addition, coupling PRSFA with predictive-maintenance strategies and life-cycle-assessment frameworks may further enhance the reliability and safety of next-generation high-speed railway operations.
Overall, this study provides a robust and flexible data-driven foundation for advancing intelligent fault-diagnosis systems in the railway traction domain.
Author Contributions
Methodology, R.Z.; writing—original draft preparation, R.Z.; supervision, S.-H.L.; formal analysis, K.-M.L.; writing—review and editing, Y.-S.C. All authors have read and agreed to the published version of the manuscript.
Funding
This research was supported by the Regional Innovation System & Education (RISE) program through the Jeollanamdo RISE center, funded by the Ministry of Education (MOE) and the Jeollanamdo, Republic of Korea (2025-RISE-14-004).
Data Availability Statement
The original contributions presented in this study are included in the article. Further inquiries can be directed to the corresponding author.
Acknowledgments
The authors would like to thank all those who provided valuable comments and suggestions to improve the quality of this study.
Conflicts of Interest
The authors declare no conflicts of interest.
Abbreviations
The following abbreviations are used in this manuscript:
| SFA | Slow Feature Analysis |
| KLD | Kullback–Leibler Divergence |
| PRSFA | Probability Related Slow Feature Analysis |
| FAR | False Alarm Rates |
| MAR | Missed Alarm Rates |
References
- Cheng, C.; Guo, Y.; Wang, J.; Chen, H.; Shao, J. A Unified BRB-Based Framework for Real-Time Health Status Prediction in High-Speed Trains. IEEE Trans. Veh. Technol. 2022, 71, 9272–9282. [Google Scholar] [CrossRef] [Scilit]
- Luo, Y.; Zhang, L.; Chen, C.; Li, K.; Yu, T.; Li, K. FRA-Based Parameter Estimation for Fault Diagnosis of Three-Phase Voltage-Source Inverters. IEEE Access 2023, 11, 113836–113847. [Google Scholar] [CrossRef] [Scilit]
- Han, J.; Liu, X.; Wei, X.; Sun, S. A Dynamic Proportional-Integral Observer-Based Nonlinear Fault-Tolerant Controller Design for Nonlinear System with Partially Unknown Dynamic. IEEE Trans. Syst. Man. Cybern. Syst. 2022, 52, 5092–5104. [Google Scholar] [CrossRef] [Scilit]
- Yin, S.; Peng, T.; Yang, C.; Yang, C.; Chen, Z.; Gui, W. Dynamic Hybrid Observer-Based Early Slipping Fault Detection for High-Speed Train Wheelsets. Control Eng. Pract. 2024, 142, 105736. [Google Scholar] [CrossRef] [Scilit]
- Aiordăchioaie, D. A Comparative Analysis of Fault Detection and Process Diagnosis Methods Based on a Signal Processing Paradigm. Discov. Appl. Sci. 2024, 7, 10. [Google Scholar] [CrossRef] [Scilit]
- Gultekin, M.A.; Bazzi, A. Review of Fault Detection and Diagnosis Techniques for AC Motor Drives. Energies 2023, 16, 5602. [Google Scholar] [CrossRef] [Scilit]
- Zhang, J.; Zhang, Q.; Qin, X.; Sun, Y. Robust Fault Diagnosis of Quayside Container Crane Gearbox Based on 2D Image Representation in Frequency Domain and CNN. Struct. Health Monit. 2024, 23, 324–342. [Google Scholar] [CrossRef] [Scilit]
- Yu, E.; Luo, L.; Peng, X.; Tong, C. A Multigroup Fault Detection and Diagnosis Framework for Large-Scale Industrial Systems Using Nonlinear Multivariate Analysis. Expert Syst. Appl. 2022, 206, 117859. [Google Scholar] [CrossRef] [Scilit]
- de Carvalho Michalski, M.A.; Martha de Souza, G.F. Comparing PCA-Based Fault Detection Methods for Dynamic Processes with Correlated and Non-Gaussian Variables. Expert Syst. Appl. 2022, 207, 117989. [Google Scholar] [CrossRef] [Scilit]
- Gao, Y.; Ahmad, Z.; Kim, J.-M. Fault Diagnosis of Rotating Machinery Using an Optimal Blind Deconvolution Method and Hybrid Invertible Neural Network. Sensors 2024, 24, 256. [Google Scholar] [CrossRef] [Scilit]
- Chen, H.; Jiang, B.; Ding, S.X.; Huang, B. Data-Driven Fault Diagnosis for Traction Systems in High-Speed Trains: A Survey, Challenges, and Perspectives. IEEE Trans. Intell. Transp. Syst. 2022, 23, 1700–1716. [Google Scholar] [CrossRef] [Scilit]
- Huang, J.; Yang, X.; Yan, X. Slow Feature Analysis-Independent Component Analysis Based Integrated Monitoring Approach for Industrial Processes Incorporating Dynamic and Static Characteristics. Control Eng. Pract. 2020, 102, 104558. [Google Scholar] [CrossRef] [Scilit]
- Diallo, A.R.; Homri, L.; Dantan, J.-Y. Reducing False Alarms in Fault Detection: A Comparative Analysis between Conformal Prediction and Classical Methods Applied to PCA and Autoencoders. J. Process Control 2025, 152, 103495. [Google Scholar] [CrossRef] [Scilit]
- Deng, X.; Tian, X.; Chen, S.; Harris, C.J. Deep Principal Component Analysis Based on Layerwise Feature Extraction and Its Application to Nonlinear Process Monitoring. IEEE Trans. Control Syst. Technol. 2019, 27, 2526–2540. [Google Scholar] [CrossRef] [Scilit]
- Chen, H.; Jiang, B.; Ding, S.X.; Lu, N.; Chen, W. Probability-Relevant Incipient Fault Detection and Diagnosis Methodology with Applications to Electric Drive Systems. IEEE Trans. Control Syst. Technol. 2019, 27, 2766–2773. [Google Scholar] [CrossRef] [Scilit]
- Anirud, R.S.; Karri, S.; Nemani, S.T.; Sunil Nag, P.V.; Kumar, C.S.; George, K.K. Data-Driven Intermittent Fault Diagnosis: From Data Acquisition to CNN-Based Classification in Synchronous Generators. In Proceedings of the 2025 International Conference on Power Electronics Converters for Transportation and Energy Applications (PECTEA), Bhubaneswar, India, 18–21 June 2025; pp. 1–6. [Google Scholar]
- Yuan, Z.; Chen, X.; Ma, L.; Zou, X.; Zhang, Z.; Li, Q.; Sun, S.; Wei, Y. Study of Dynamic Response Correlation of High-Speed Train Bogie Based on ICA Algorithm. In Advances in Dynamics of Vehicles on Roads and Tracks III; Huang, W., Ahmadian, M., Eds.; Springer Nature: Cham, Switzerland, 2025; pp. 258–268. [Google Scholar]
- Li, Z.; Yan, X. Performance-Driven Ensemble ICA Chemical Process Monitoring Based on Fault-Relevant Models. Soft Comput. 2020, 24, 12289–12302. [Google Scholar] [CrossRef] [Scilit]
- Song, B.; Song, Y.; Shi, H.; Jiang, Q. Plant-Wide Process Incipient Fault Detection via Double-Layer Subspace Weighted Moving Window Reconstruction ICA. In Proceedings of the 2024 IEEE International Conference on Cybernetics and Intelligent Systems (CIS) and IEEE International Conference on Robotics, Automation and Mechatronics (RAM), Hangzhou, China, 8–11 August 2024; pp. 174–179. [Google Scholar]
- Deng, X.; Yang, W.; Cao, Y.; Bo, Y. Information Enhanced Slow Feature Analysis Integrated with Prior Fault Data for Sensitive Monitoring of Chemical Processes. Process Saf. Environ. Prot. 2024, 191, 2266–2280. [Google Scholar] [CrossRef] [Scilit]
- Cheng, C.; Wang, X.; Xu, S.; Feng, K.; Chen, H. Dynamic Weighted Slow Feature Analysis-Based Fault Detection for Running Gear Systems of High-Speed Trains. Int. J. Control Autom. Syst. 2024, 22, 1924–1934. [Google Scholar] [CrossRef] [Scilit]
- Cheng, C.; Liu, M.; Chen, H.; Xie, P.; Zhou, Y. Slow Feature Analysis-Aided Detection and Diagnosis of Incipient Faults for Running Gear Systems of High-Speed Trains. ISA Trans. 2022, 125, 415–425. [Google Scholar] [CrossRef] [Scilit]
- Cai, P.; Deng, X. Incipient Fault Detection for Nonlinear Processes Based on Dynamic Multi-Block Probability Related Kernel Principal Component Analysis. ISA Trans. 2020, 105, 210–220. [Google Scholar] [CrossRef] [Scilit]
- Zhong, K.; Wang, J.; Xu, S.; Cheng, C.; Chen, H. Overview of Fault Prognosis for Traction Systems in High-Speed Trains: A Deep Learning Perspective. Eng. Appl. Artif. Intell. 2023, 126, 106845. [Google Scholar] [CrossRef] [Scilit]
- Wang, H.; Li, Y.-F.; Ren, J. Machine Learning for Fault Diagnosis of High-Speed Train Traction Systems: A Review. Front. Eng. Manag. 2024, 11, 62–78. [Google Scholar] [CrossRef] [Scilit]
- Lin, S.; Yang, Y.; Liu, X.; Tian, L. DSFA-SwinNet: A Multi-Scale Attention Fusion Network for Photovoltaic Areas Detection. Remote Sens. 2025, 17, 332. [Google Scholar] [CrossRef] [Scilit]

Disclaimer/Publisher’s Note: The statements, opinions and data contained in all publications are solely those of the individual author(s) and contributor(s) and not of MDPI and/or the editor(s). MDPI and/or the editor(s) disclaim responsibility for any injury to people or property resulting from any ideas, methods, instructions or products referred to in the content. |
© 2025 by the authors. Licensee MDPI, Basel, Switzerland. This article is an open access article distributed under the terms and conditions of the Creative Commons Attribution (CC BY) license (https://creativecommons.org/licenses/by/4.0/).