Article

Multi-Objective Optimization for Refined Oil Resource Allocation: Towards Energy and Carbon Saving

1
Sinopec Marketing Central China Company, Wuhan 430023, China
2
National Engineering Laboratory for Pipeline Safety/Beijing Key Laboratory of Urban Oil and Gas Distribution Technology, China University of Petroleum-Beijing, Beijing 102249, China
3
College of Artificial Intelligence, China University of Petroleum-Beijing, Beijing 102249, China
*
Author to whom correspondence should be addressed.
Energies 2025, 18(22), 6075; https://doi.org/10.3390/en18226075 (registering DOI)
Submission received: 17 October 2025 / Revised: 9 November 2025 / Accepted: 18 November 2025 / Published: 20 November 2025

Abstract

In light of the ambitious “dual carbon” targets, the refined oil supply chain faces challenges in balancing economic viability with environmental sustainability. Traditional resource allocation methods predominantly prioritize cost minimization, often overlooking significant environmental impacts and leading to carbon-intensive transportation practices. This paper proposes a multi-objective optimization model to simultaneously minimize total logistics costs and carbon emissions across the entire refined oil supply chain. The model encompasses key stages, including refinery production, external procurement, multimodal transport operations, and inventory management. The proposed framework integrates practical con straints such as sending and receiving capacities, inventory balance, and supply and demand requirements. The ε-constraint method is employed for model solution to generate a set of Pareto optimal solutions, highlighting the inherent trade-offs between economic and environmental objectives. A case study is carried out, involving a refined oil logistics system in Central China, which comprises five refineries, 31 depots, and two external purchasing nodes. Compared to a purely economic optimization, a balanced scenario (e.g., with an ε-constraint of 9000 tons/season for carbon emissions) achieves a substantial 10–15% reduction in emissions with only a marginal 1–2% increase in logistics costs. Furthermore, the optimization significantly reconfigures the transport structure, increasing pipeline utilization from 27.3% to 35% and leading to a 26.1% reduction in waterway-related carbon emissions. This study can offer an efficient decision-making tool that facilitates the green transformation of the refined oil supply chain, bridging the gap between corporate logistics cost efficiency and ambitious carbon neutrality targets.

1. Introduction

Refined oil is an indispensable core energy source for modern economic systems, supporting key areas such as global transport, industrial production, and agricultural mechanization. According to the International Energy Agency, the total global oil consumption in 2024 will reach 102 mb/d, of which 58 mb/d will be consumed in the transport sector [1], accounting for 56.9% (IEA, 2024), which is the top end-use oil sector [2]. This dependence is particularly pronounced in emerging markets, such as China, where the annual consumption of refined oil is huge (in the hundreds of millions of tons range), with the lion’s share of diesel fuel consumption going to heavy duty trucking [3]. The refined oil supply chain is a complex network system, which consists of production, transport, storage, and sales, encompassing both direct distribution and external procurement. This system involves collaborative operations among refiners, logistics carriers, wholesalers, retailers, and other parties. For a long time, resource allocation in this system has primarily optimized logistics cost minimization or benefit maximization as core objectives, extensively employing research methods in operations to conduct both local and global optimization across key areas such as supply planning, transport path planning, and inventory management. While such methods can be effective in reducing operating costs, shortening production and marketing cycles, and improving turnover efficiency, their singular economic orientation has led to a systematic neglect of environmental impacts. This neglect manifests on multiple levels. First, transport mode selection often prioritizes cost, resulting in long-distance cross-regional dispatches and suboptimal routing that increase carbon emissions. This is exemplified by research on pipeline pricing in China, which shows that misaligned pricing mechanisms can discourage the use of energy-efficient pipelines, inadvertently shifting freight to more carbon-intensive road and rail options [4]. Second, inventory strategies that rely on experience-based decisions can produce unnecessary energy consumption and heighten the risk of supply disruptions [5]. Similarly, research on multimodal transportation optimization considering daily scheduling reveals that fragmented, cost-centric scheduling often fails to coordinate transport modes effectively, leading to both economic inefficiencies and heightened environmental impacts [6]. The transportation sector’s environmental footprint is substantial, consuming over half of global oil and generating nearly 25% of anthropogenic CO2 emissions [7]. Confronted with the global energy transition and “dual carbon” targets, the refined oil industry faces the challenge of moving beyond its conventional, cost-centric optimization models. Integrating environmental constraints, especially carbon emissions, into the core of supply chain management has thus become essential for future viability.
In response to these challenges, extensive research has been conducted on optimizing refined oil resource allocation, though it has long focused primarily on economic efficiency [8]. Early classical models, such as those of Bei and Li et al. [9,10], introduced multimodal transport to improve operational performance, but remained committed to transport cost minimization and largely ignored external environmental constraints. Subsequent studies, including those by Sebastian and Ahmad et al. [11,12], employed methods like stochastic programming and mixed-integer linear programming to optimize energy systems. While these works achieved certain results in energy conservation and carbon reduction, they often struggled to fully account for economic benefits within a unified framework. As the importance of the low-carbon economy grows, the limitations of this single-objective paradigm have become more apparent. In complex logistics networks, fragmented allocation decisions among refineries, depots, and external procurement nodes can lead to transport structures that are overly reliant on road haulage, thereby increasing carbon intensity. Empirical and simulation studies support this observation. For instance, Haddad et al. reported that a 10% increase in reliance on road transport raises supply chain carbon intensity by over 15% [13]. Zhu et al. demonstrated through system dynamics simulation that resource mismatch caused by single-objective optimization can create a carbon emission amplification effect [14]. Their empirical study on China’s oil depot network further indicated that declining facility utilization directly weakens economies of scale in emission reduction [15]. Collectively, these findings suggest that traditional single-objective models are insufficient for the carbon-constrained era. Although subsequent research, such as the work by Zhou et al. [16], has begun to incorporate carbon constraints into a dual-objective framework, several limitations persist. These include limited dynamic adaptability to demand volatility and evolving carbon policies, modeling shortcomings of simple weighting approaches, and economic feasibility concerns, which are particularly pronounced in contexts like China with significant regional heterogeneity [17,18].
To address the conflict between economic and environmental objectives, multi-objective optimization methods have been developed [19,20]. These approaches offer a more balanced perspective compared to their single-objective counterparts. Simple methods, such as the weighted-sum method, are easy to implement but highly sensitive to weight selection, which can bias the optimization direction and may fail to capture non-convex portions of the Pareto frontier [21,22]. Heuristic and evolutionary algorithms (e.g., NSGA-II) can generate high-quality Pareto frontiers, yet their computational burden often increases rapidly with problem scale and constraints, making them less suitable for large-scale, complex linear, or mixed-integer problems [23,24]. The ε-constraint method presents a viable alternative. Compared to weighted-sum approaches, it preserves the completeness of the Pareto optimal set. Moreover, it conveniently enforces engineering constraints by converting secondary objectives, like carbon emissions, into explicit thresholds, making it particularly suitable for problems involving multimodal transport and inventory balance [25,26]. Thus, it provides a practical and rigorous methodological basis for coordinated optimization in regional multi-node refined oil systems [27,28,29]. This methodological choice is further justified by the work of Mavrotas and colleagues, who, in their seminal paper on the effective implementation of the ε-constraint method, demonstrated its capability to generate a complete and evenly distributed Pareto set, overcoming the limitations of the weighted-sum approach [28]. For the specific problem class of regional oil supply chains, this is a critical advantage. The method allows environmental objectives like carbon emissions to be treated as a controllable constraint with a clear cap (ε-level), which directly aligns with regulatory targets and integrates seamlessly with inherent operational constraints such as inventory and material balance [30]. However, a discernible research gap remains, particularly in the context of China’s regionally complex refined oil supply chains. Existing studies often lack a holistic focus that integrates external procurement, multimodal transportation, and dynamic inventory coordination within a single optimization framework tailored for multi-provincial networks. Furthermore, there is a scarcity of research that provides a complete Pareto frontier to support tiered emission-reduction decision-making for such large-scale, practical systems.
To better solve the above-mentioned problems, this study develops a comprehensive multi-objective optimization approach for a complex regional refined oil network. The research aims to balance economic costs and carbon emissions through the integration of a full-chain mathematical model and the ε-constraint method. The specific contributions of this work are detailed below.
  • At the modeling level, a full-chain MILP model for refined oil is constructed, encompassing processes from refinery production and external procurement to multimodal transportation and inventory. A distinctive feature is the introduction of a dynamic inventory coordination mechanism between external procurement sources and transit depots, specifically designed to address capacity shortages and demand fluctuations.
  • At the algorithmic level, the ε-constraint method is adopted to resolve conflicts between economic and environmental objectives, effectively generating the complete Pareto frontier that quantifies the trade-offs.
  • At the application level, this study is the first to apply the ε-constraint method to a complex multi-province, multi-node refined oil network in Central China. The application successfully quantifies the cost increments under different emission-reduction targets, providing enterprises with a clear ‘cost-emission’ trade-off map to support strategic decision-making.
The remainder of this paper is structured as follows. Section 2 provides a detailed problem description. Section 3 presents the mathematical model and solution method. Section 4 validates the approach through a case study, and Section 5 concludes the paper and suggests future research directions.

2. Problem Description

The resource allocation of refined oil denotes the coordinated integration of production, transportation, storage, and distribution to efficiently move products from supply sources to meet market demand. The complete supply chain forms a large and complex network linking refineries, transit depots, market depots, and service stations [31]. This paper focuses on the allocation process from refineries to depots, as shown in Figure 1. Beyond the conventional production, transport, storage, and marketing links, external procurement is introduced to address depot shortages when refinery capacity is insufficient. In the transportation stage, four modes are considered: pipeline (PIP), waterway (SHP), railway (RAL), and roadway (TRK). Mode selection embodies an inherent trade-off between economic and environmental objectives. Waterway transport has the lowest cost (0.166 CNY/ton-km), followed by pipeline (0.196 CNY/ton-km), yet their carbon intensities differ markedly: pipeline emits 4.96 g/ton-km while waterway emits 15.90 g/ton-km. Roadway is both the most costly (0.68 CNY/ton-km) and the most carbon-intensive (29.98 g/ton-km). These disparities underscore the complexity of optimizing transport choices to minimize costs and environmental impacts simultaneously.
In daily operations, managers, guided by business rules and supported by optimization tools, holistically consider constraints across the resource allocation process to develop allocation, transport, and inventory plans that improve overall operational efficiency. Traditionally, optimization emphasizes economic goals, chiefly minimizing total cost or maximizing profit. However, the energy sector’s green transformation makes carbon control a strategic imperative. Integrating carbon emissions into the operation decision-making process is therefore essential, not only to fulfill corporate social responsibility and comply with climate policies, but also to enhance long-term competitiveness. This paper proposes a resource allocation optimization method that balances economic efficiency and carbon emissions to offer a practicable industry solution. The research framework of this paper is shown in Figure 2, which systematically presents the modeling preparation, including given parameters, decision variables, and key assumptions, while establishing dual objectives and comprehensive constraints for comparative analysis. The method formulates a multi-objective mathematical programming model that minimizes total cost and carbon emissions by optimizing key decision variables such as external procurement volumes, transport volume, and inventory volume. The model enforces practical constraints such as receiving and sending capacity, supply and demand balance, and transport capacity, seeking an optimal resource allocation that reduces emissions while improving economic performance.
Given:
  • Supply information: location, production plan, sending capacity;
  • Demand information: location, demand plan, receiving capacity;
  • External procurement information: location, procurement capacity;
  • Transport information: transport capacity, transport time;
  • Cost information: unit transport cost, production cost, inventory cost, backlog cost, stockout cost, unit external procurement cost.
Determined:
  • Resource allocation scheme: final sending and receiving volume, external procurement volume, backlog volume, stockout volume;
  • Transport and storage scheme: transport volume and direction, inventory change;
  • Other results: total cost and carbon emissions.
Assumed:
  • All supply, demand, and inventory data are available;
  • Oil losses during transport are neglected;
  • Variations in transport time due to exceptional circumstances are not considered.

3. Methodology

3.1. Multi-Objective Optimization Model

3.1.1. Objective Function

The economic optimization model minimizes the total logistics cost. Set I denotes all sending nodes and J denotes all receiving nodes. Set T denotes all time and N denotes all transportation modes. Set O denotes all materials. Subsets I1 and I2 denote refineries and external procurement nodes, respectively, while J1 and J2 denote transit depots and depots, respectively. Building on the economic optimization model, a carbon-emissions objective is introduced to construct a bi-objective optimization model for cost and carbon emissions.
The objective function F_1 accounts for end-to-end transport costs, node inventory costs, backlog and stockout costs, external procurement costs, and refinery production costs, and is expressed as follows:
min F 1 = f 1 + f 2 + f 3 + f 4              
The transport costs f 1 for the entire process include transport from refineries to each depot, from transit depots to marketing depots, and from the external procurement nodes to each depot.
f 1 = t T i I j J n N o O ( V t , i , j , n , o T R × c i , j , n , o t )
The node inventory costs f 2 include inventory costs at refineries and depots.
f 2 = t T i I 1 o O ( c i , o k × V t , i , o K ) + t T j J o O ( c j , o k × V t , j , o K )      
Penalty costs f 3 covers penalties incurred due to refinery backlogs and depot stockouts.
f 3 = t T j J o O ( c j , o f q × V t , j , o Q )   + t T i I 1 o O ( c i , o f z × V t , i , o Z )    
The external procurement and production costs f 4 comprise the cost of purchasing oil from external nodes and the cost of producing oil at the refinery.
f 4 = t T i I 2 j J n N o O ( V t , i , j , n , o P × c i , o o i l )   +   t T i I 1 o O ( V t , i , o S × c i , o o i l )
The carbon emission objective function accounts for emissions across the entire process, where e n denotes the carbon-emission factor. It is expressed as follows:
m i n F 2 = t T i I j J n N o O e n × d i , j × V t , i , j , n , o T R

3.1.2. Constraints

The model includes four main types of constraints: sending and receiving capacity constraints, inventory constraints, supply and demand capacity constraints, and material balance constraints. The specific expressions are as follows:
Sending and receiving capacity constraints are limits on the capacities of the transport modes used by each node when sending or receiving refined oil, as detailed in Equations (7)–(9) below.
j J o O V t , i , j , n , o T R v n m a x ,   t T , i I J 1 , n N
i I 1 o O V t , i , j , n , o T J + i I 2 o O V t , i , j , n , o T J v n m a x ,   t T , j J 1 , n N
i I 1 o O V t , i , j , n , o T J + i I 2 o O V t , i , j , n , o T J + i J 1 o O V t , i , j , n , o T J v n m a x , t T , j J 2 , n N
Inventory constraints limit the allowable changes in inventory levels at each node over time. The inventory constraints for refineries, transit depots, and marketing depots are given in Equations (10)–(15) below.
V t + 1 , i , o K = V t , i , o K j J n N V t , i , j , n , o T R + V t , i , o P V t + 1 , i , o Z , 0 t < t k m a x , i I 1 , o O    
  V t , i , o K = V 0 , i , o K t = t k m a x , i I 1 , o O  
V t + 1 , j , o K = V t , j , o K + i I n N V t , i , j , n , o T J V t , j , o D + V t + 1 , j , o Q i J 2 n N V t , j , i , n , o T R , 0 t < t k m a x , j J 1 , o O
V t , j , o K = V 0 , j , o K t = t k m a x , j J 1 , o O  
V t + 1 , j , o K = V t , j , o K i I n N V t , i , j , n , o T J V t , j , o D + V t + 1 , j , o Q , t < t k m a x , j J 2 , o O            
V t , j , o K = V 0 , j , o K , t = t k m a x , j J 2 , o O  
Supply and demand capacity constraints require that refinery outputs lie between minimum and maximum supply limits, and that depot demands fall within minimum and maximum demand limits. These are shown in Equations (16)–(18) below.
v i , o s m i n t T V t , i , o P v i , o s m a x                 i I 1 ,   o O
v j , o d m i n t T V t , j , o D v j , o d m a x                 j J ,   o O                
v i , o c m i n t T j J n N V t , i , j , n , o T R v i , o c m a x       i I 2   ,   o O
Material balance constraints require that oil delivered from a sending node arrives at the receiving node after the specified transport time t , and that the quantity received equals the quantity sent.
V t t , i , j , n , o T R = V t , i , j , n , o T J t t T , i I , j J , n N , o O

3.2. ε-Constraint Method

This paper adopts the ε-constraint method for multi-objective optimization. By converting carbon emissions into a constraint, the conflict between economic and environmental objectives is reduced to a single-objective optimization problem. First, an upper bound on allowable supply chain carbon emissions (ε) is specified. Then the objective is to minimize total cost subject to this emission limit, yielding the optimal decision under the given environmental requirement. The approach has three main advantages: (1) by flexibly adjusting the constraint boundary (ε), it enables quantitative analysis of how costs change under different emission reduction targets and provides decision makers with a clear basis for cost and emission trade-offs; (2) it avoids the subjectivity of weight assignment inherent in traditional multi-objective methods and improves adaptability to environmental policies; (3) it is compatible with existing supply chain optimization frameworks and can be embedded into conventional decision models simply by modifying constraints, thereby lowering implementation costs.
The objective function of the resource allocation optimization model with the carbon emission constraint is expressed as follows:
min F 1 = f 1 + f 2 + f 3 + f 4   , s . t .   F 2 ε

4. Case Study

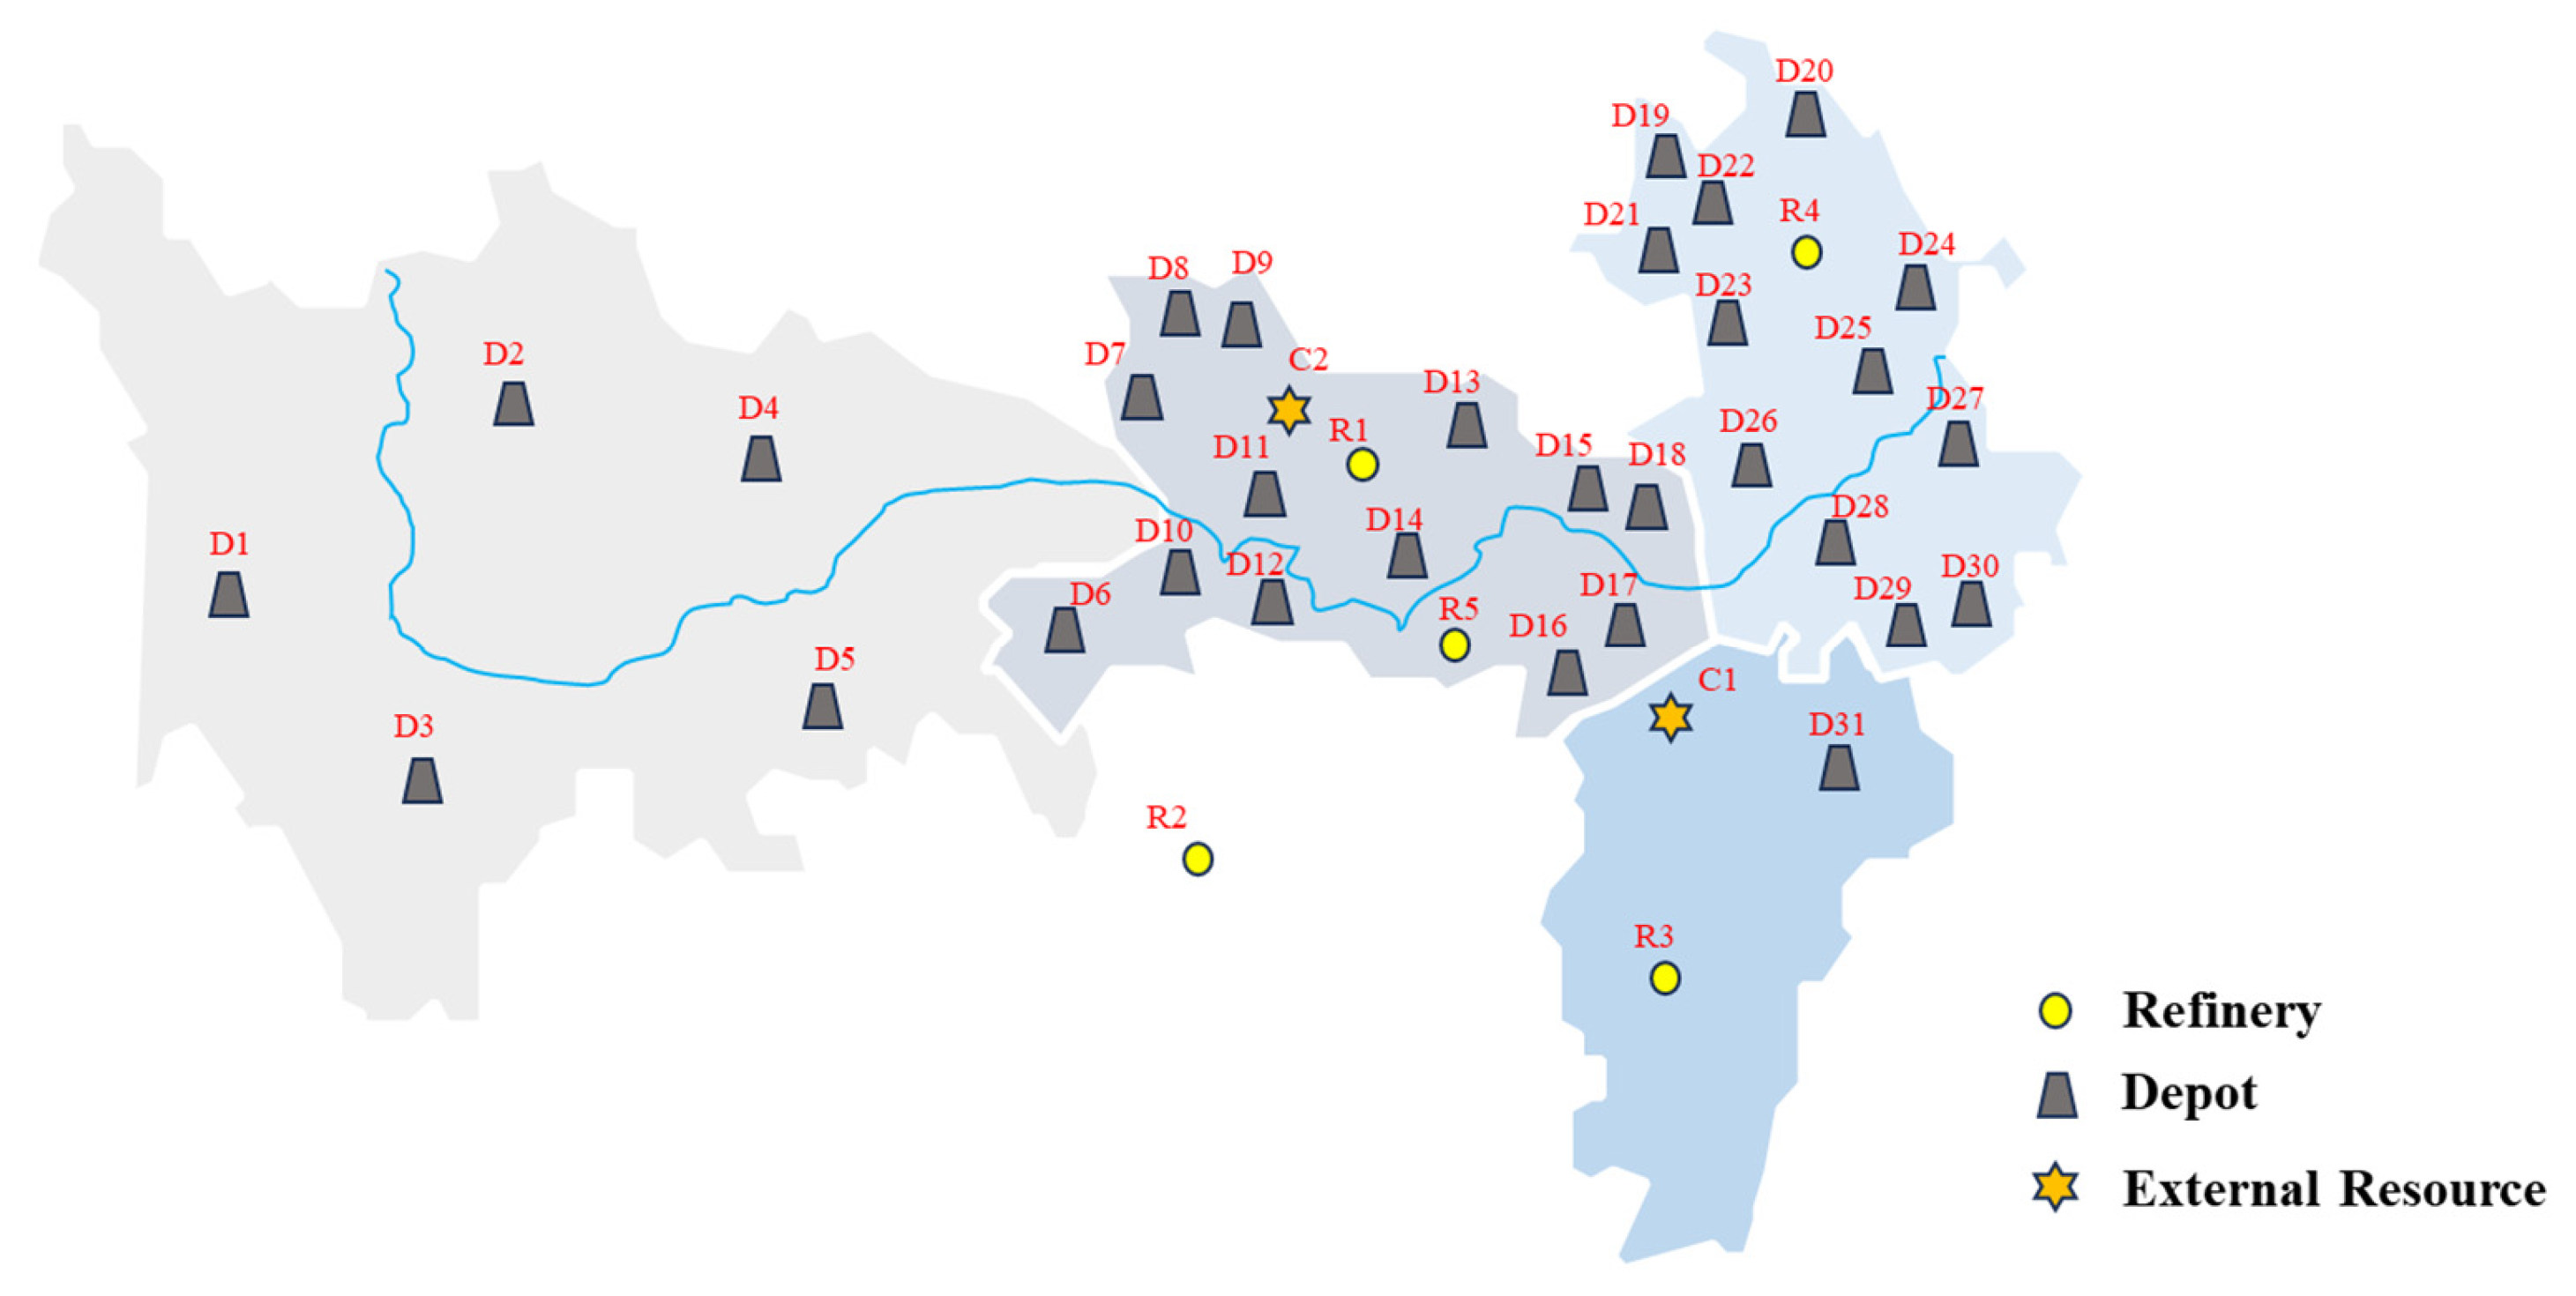
This study uses the refined-oil supply chain in central China as a case study. The network comprises five refineries—Anqing, Jiujiang, Zhonghan, Changling, and Jingmen—thirty-one depots (for example, Tianhui, Pengxi, and Yangluo), and two external supply nodes, Jin’ao and Nantong. The dataset covers the period from 1 January to 31 March 2025, and contains complete operational records for two refined products: gasoline (GAS) and diesel (DIE). The node distribution is shown in Figure 3. Refineries are concentrated in the middle reaches of the Yangtze River, while depots radiate outward to demand regions such as Hubei, Sichuan, Anhui, and Jiangxi. Detailed basic information can be found in the Appendix A.
This supply chain network consists of five refineries (R1–R5), located in the Hubei, Hunan, Jiangxi, and Anhui provinces, with a total quarterly production capacity of 8.404 million tons of gasoline (GAS) and 1.798 million tons of diesel (DIE). The downstream sector covers 31 oil depots (D1–D31), spanning the Sichuan, Hubei, Anhui, and Jiangxi regions, with a quarterly total demand of 0.67 million tons for gasoline and 0.72 million tons for diesel. In addition, external procurement nodes (C1 and C2) can provide 0.11 million tons each of gasoline and diesel, with a unit procurement cost of 0.8 million CNY per ton for both.

4.1. Economy and Environment Analysis

When the economic objective (F1) is prioritized, the total transport cost in Central China for the season is 165.39 million CNY and carbon emissions are 10,439 t. When the environmental objective (F2) is prioritized, the transport cost rises to 172.89 million CNY while carbon emissions fall to 7984.3 t. Objective comparison is shown in Figure 4. Switching from the economic model to the environment model increases transport cost by 7.5 million CNY and reduces carbon emissions by 2454.7 t.
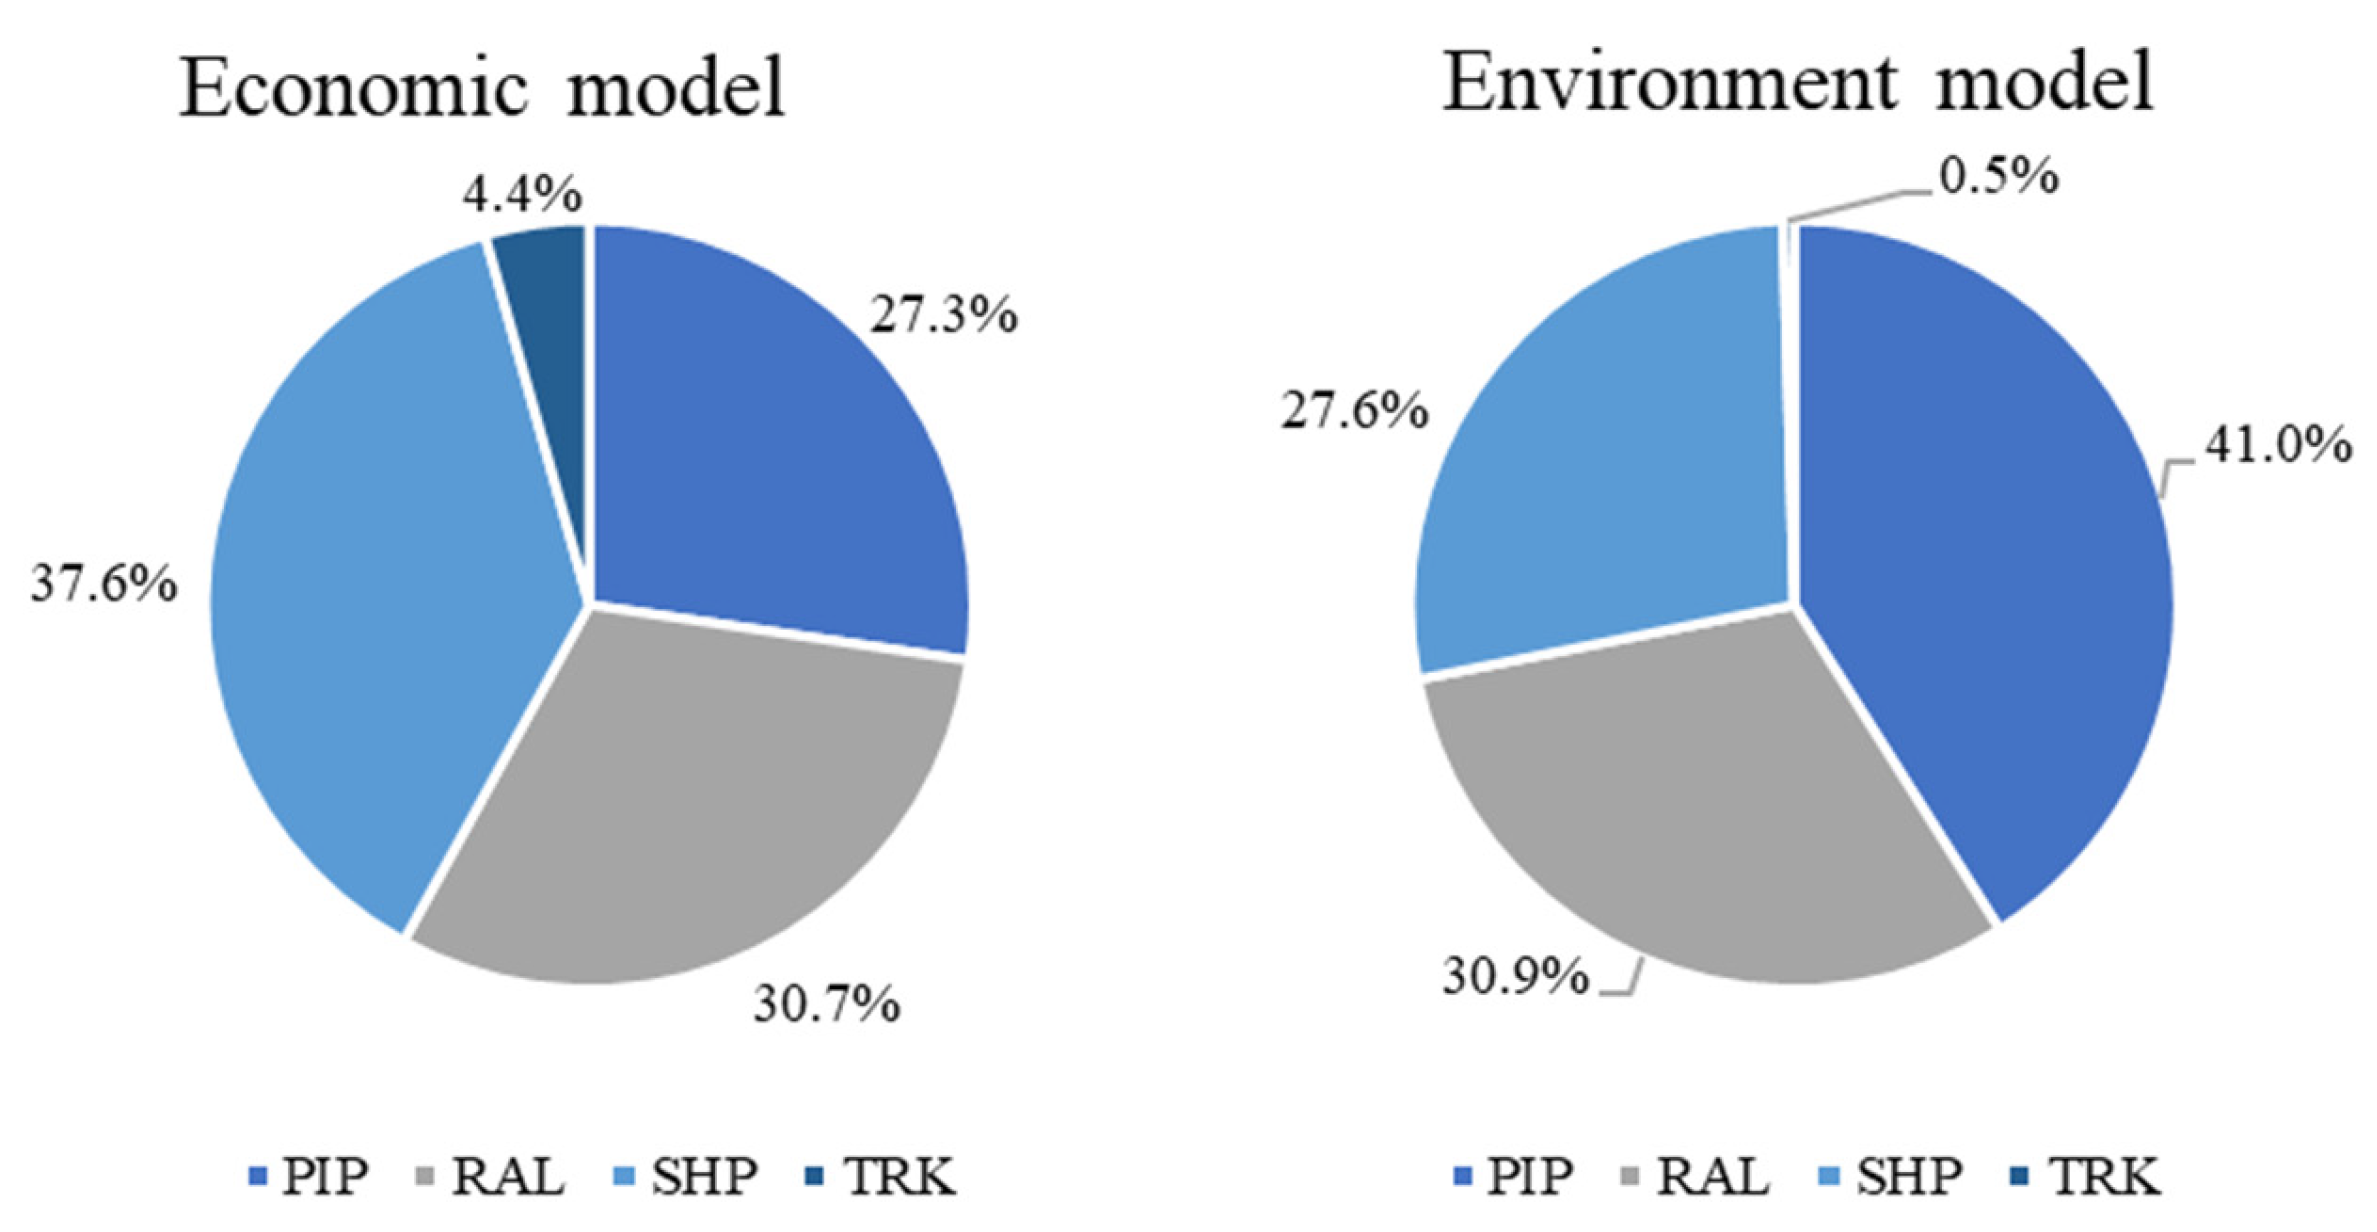
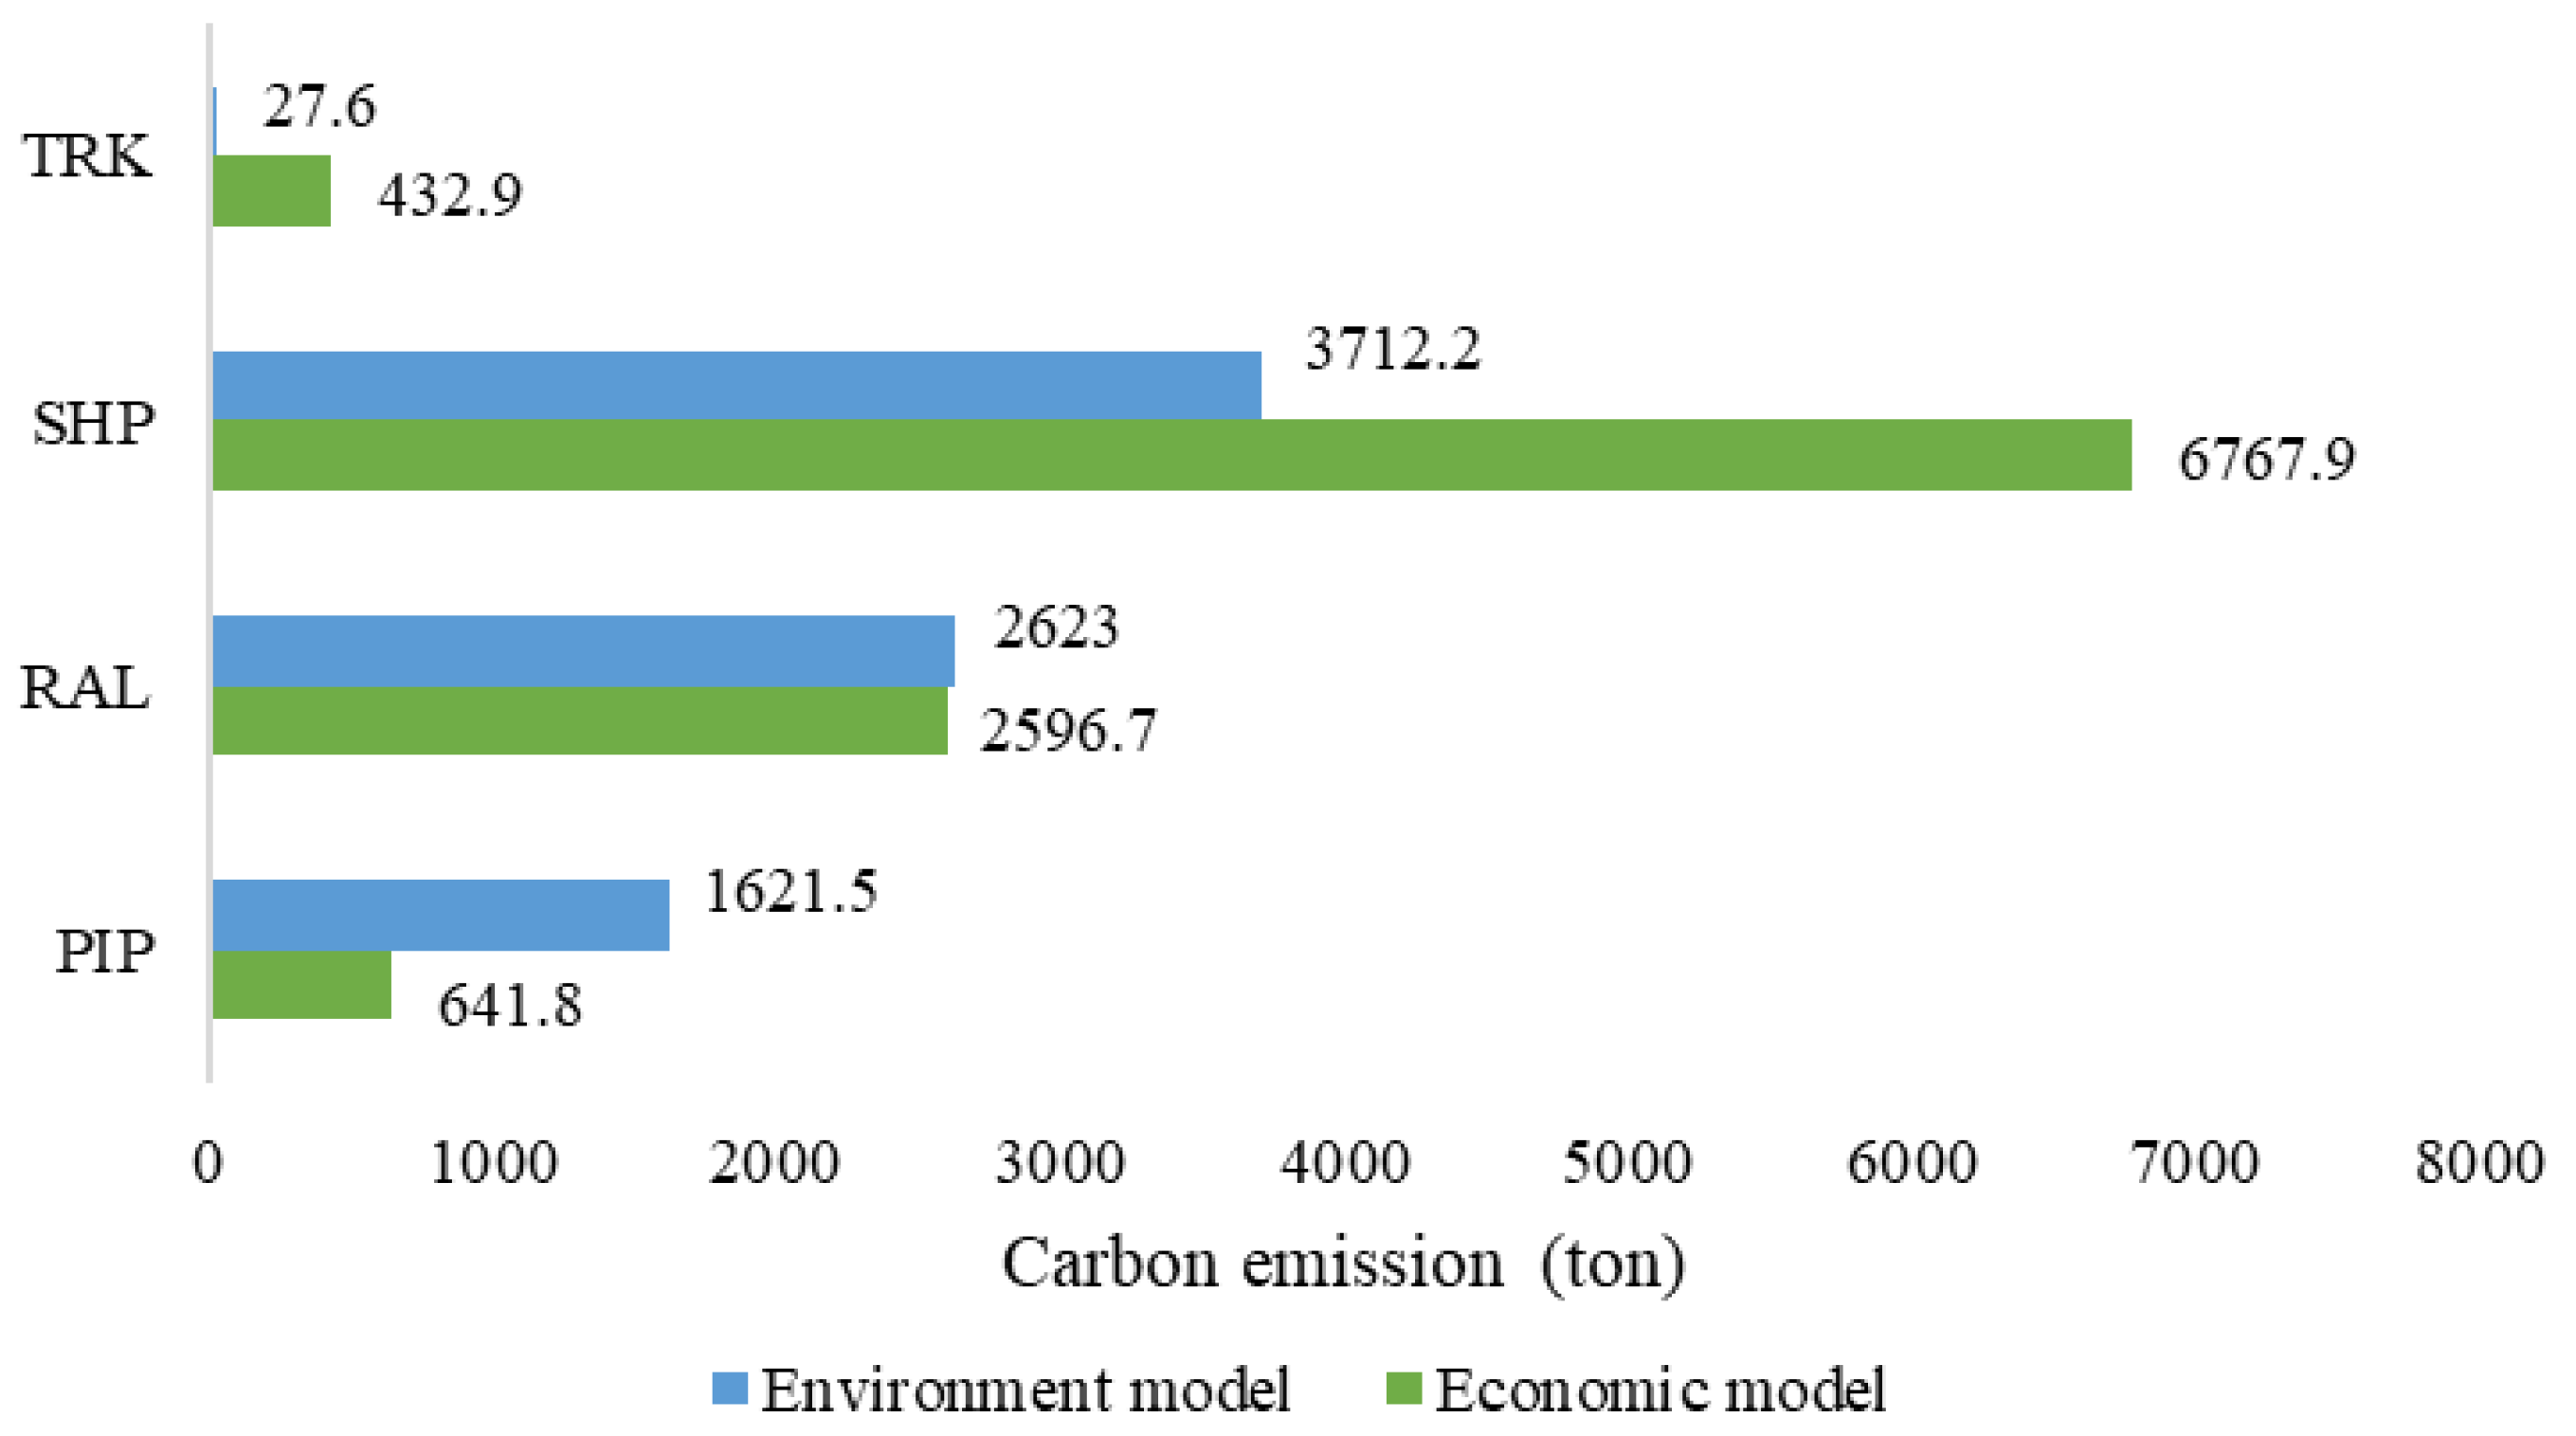
Figure 5 and Figure 6 compare transport ratio and carbon emissions under the economic and environment models. Under the economic model, waterway dominates, with 37.6% of transport volume, followed by railway at 30.7%, pipeline at 27.3%, and roadway at 4.4%. In contrast, the environment model shifts the modal mix toward pipeline, which rises to 41.0%, with railway at 30.9%, waterway at 27.6%, and roadway falling to only 0.5%. The change in modal allocation produces marked shifts in emissions by mode: in the economy model waterway transport emits 6767.9 t, railway 2596.7 t, pipeline 641.8 t, and roadway 432.9 t. Under the environment model, waterway emissions drop to 3712.2 t, railway remains essentially unchanged at 2623.0 t, pipeline increases to 1621.5 t, and roadway emissions fall to 27.6 t. Compared with the economic model, the environment model reduces waterway emissions by 3055.7 t and roadway emissions by 405.3 t, while pipeline emissions increase by 979.7 t and railway emissions increase slightly by 26.3 t, producing an overall emission reduction of 2454.7 t. Thus, prioritizing the environmental objective shifts transport away from higher-emission waterway and roadway transport toward pipeline (and marginally rail), achieving substantial carbon savings.
Clearly, the two models generate different mode ratios. When the objective is economic minimization, waterway transport dominates, while when the objective is environmental minimization, pipelines take the largest share. This divergence arises because transport unit cost and carbon emission intensity are not simply proportional across modes. Waterway transport has the lowest freight rate (0.166 CNY/ton-km) but a relatively high emission factor (15.90 g/ton-km), second only to roadway (29.98 g/ton-km). By contrast, pipeline transport charges slightly more (0.196 CNY/ton-km) but has the lowest emission factor (4.96 g/ton-km). Consequently, an economy-only objective favors the cheapest mode (waterway), whereas an environment-only objective favors the lowest-emission mode (pipeline), producing the observed shift in mode ratio.
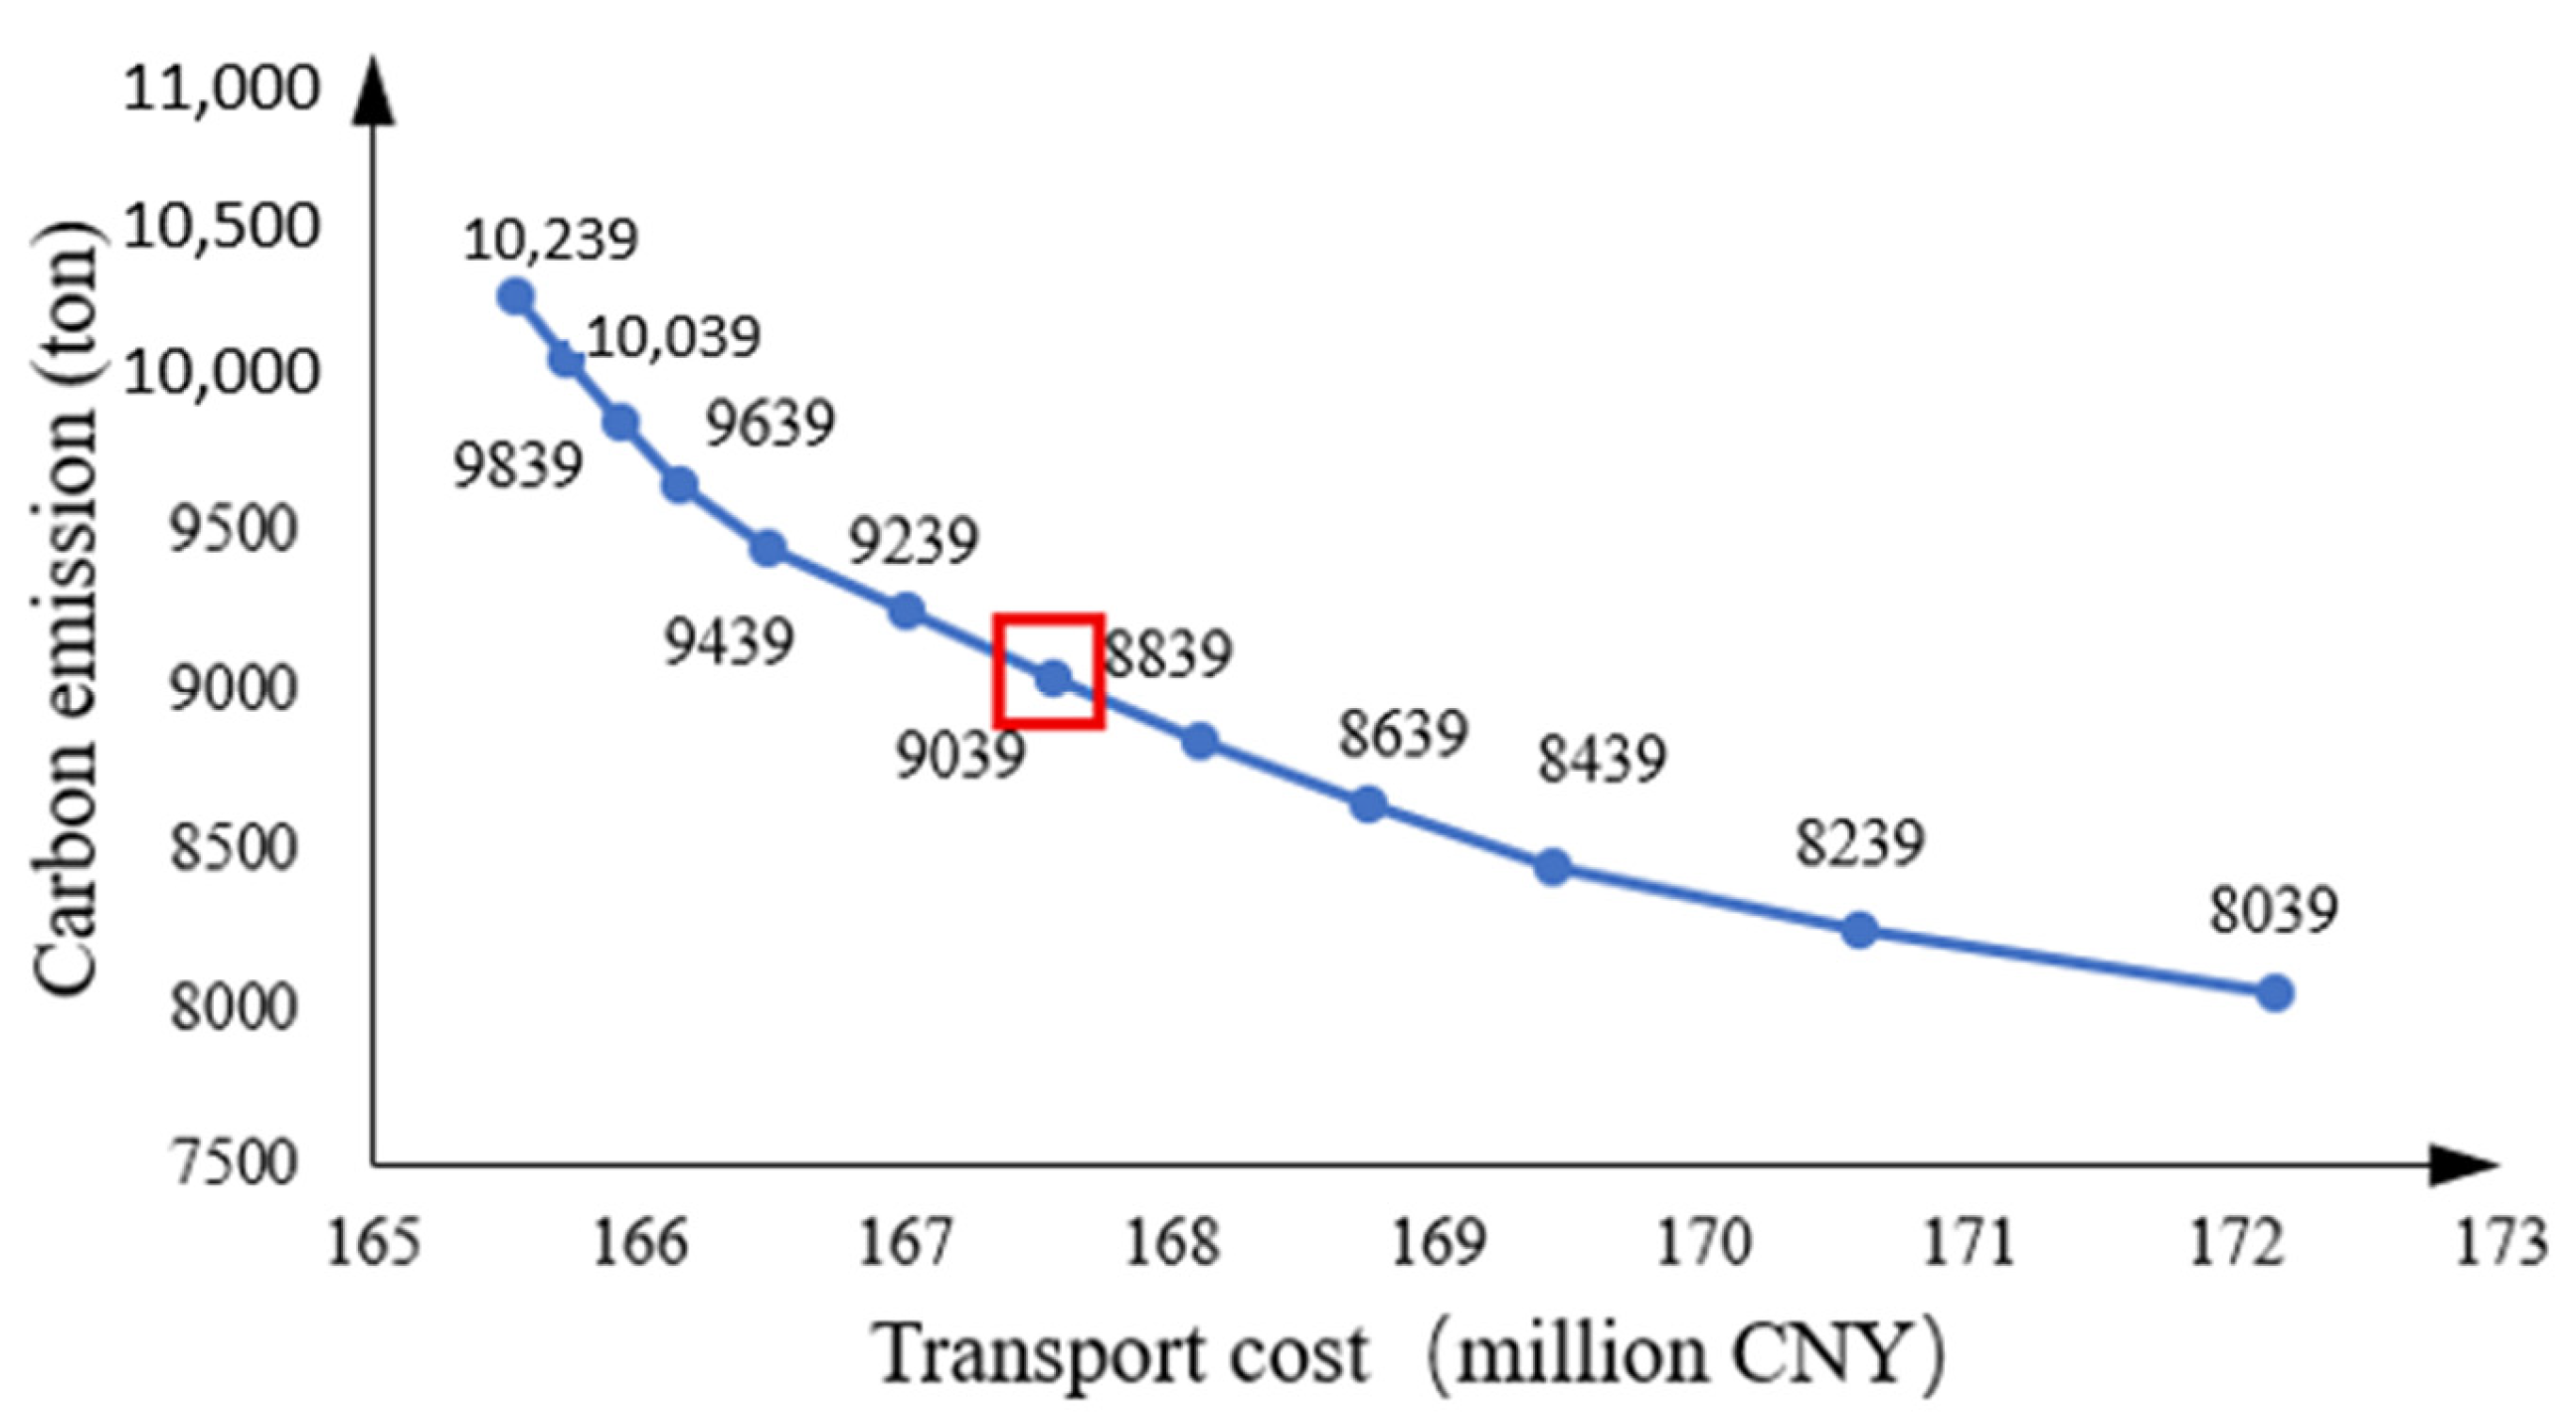
This paper applies the ε-constraint method to multi-objective optimization. By converting the carbon emission objective into a constraint, the conflict between economic and environmental objectives is managed and the problem is reduced to a single-objective optimization. When cost minimization is the objective, the allowable carbon emission upper bound is 10,439 t. When environmental minimization is the objective, the achievable lower bound is 7984.3 t, yielding a total reducible amount of 2454.7 t. Using a step size of 200 t for the emission constraint produces 12 iterations, from which the Pareto frontier in Figure 7 is constructed. Each iteration corresponds to one feasible decision scheme along the trade-off curve.
Based on the Pareto frontier analysis, Scheme 7 (ε = 9000 tons) is selected as the best compromise between economic and environmental objectives. Scheme 7 lies near the inflection point where the marginal cost of abatement increases markedly: moving from the economic solution (165.39 million CNY, 10,439 t) to Scheme 7 requires an additional 2.61 million CNY to abate 1439 t of carbon emissions (1814 CNY/t), whereas further abatement to the environment solution (172.89 million CNY, 7984.3 t) requires an additional 4.89 million CNY to cut only 1016 t (4813 CNY/t). Scheme 7 also improves the transport ratio. The pipeline share rises to about 35% (pipeline emissions 1200 t), while waterway share falls to about 33% (waterway emissions 5000 t), reducing reliance on high emission waterway transport without causing an excessive shift to costly roadway transport. Overall, Scheme 7 minimizes the unit cost of emission reduction (1814 CNY/t) while preserving economic feasibility (cost 4.89 million CNY lower than the full environment solution) and delivering meaningful environmental gains (14% reduction relative to the economic solution). This choice aligns with the ε-constraint method’s intent to balance conflicting economic and environmental goals.

4.2. Resource Allocation Scheme

This section presents a detailed analysis of the resource flows and freight-related carbon allocation for Scheme 7, which has carbon emissions of 9000 t and a transport cost of 167.668 million CNY. Taking node R3 as an example, Figure 8 illustrates the temporal changes in supply volume, sending volume, and inventory, while Figure 9 displays the resource flow for node R3.
Figure 8 depicts the R3 refinery’s supply volume, sending volume and inventory over the period from 4 January to 31 March. The horizontal axis denotes the date and the vertical axis denotes oil volume in tons. Supply remains relatively stable, averaging about 5000 tons. Sending volumes are more volatile: there is no sending between 23 February and 3 March. Beginning 16 March sending volume rises, peaking at nearly 40,000 tons on 18 March, then declines thereafter. Inventory levels likewise fluctuate, rising gradually with incoming supply and dropping sharply following large sending. Figure 9 illustrates the resource flows associated with node R3. As a refinery node, R3 delivers GAS to several regional depots (e.g., D5, D6, D7), shown by purple arrows, and delivers DIE to other depots (e.g., D10, D17, D21), shown by green arrows. Arrow thickness corresponds to shipment volume. The diagram highlights R3’s hub role in regional allocation, demonstrating how it supplies multiple depots and thus underpins local fuel availability.
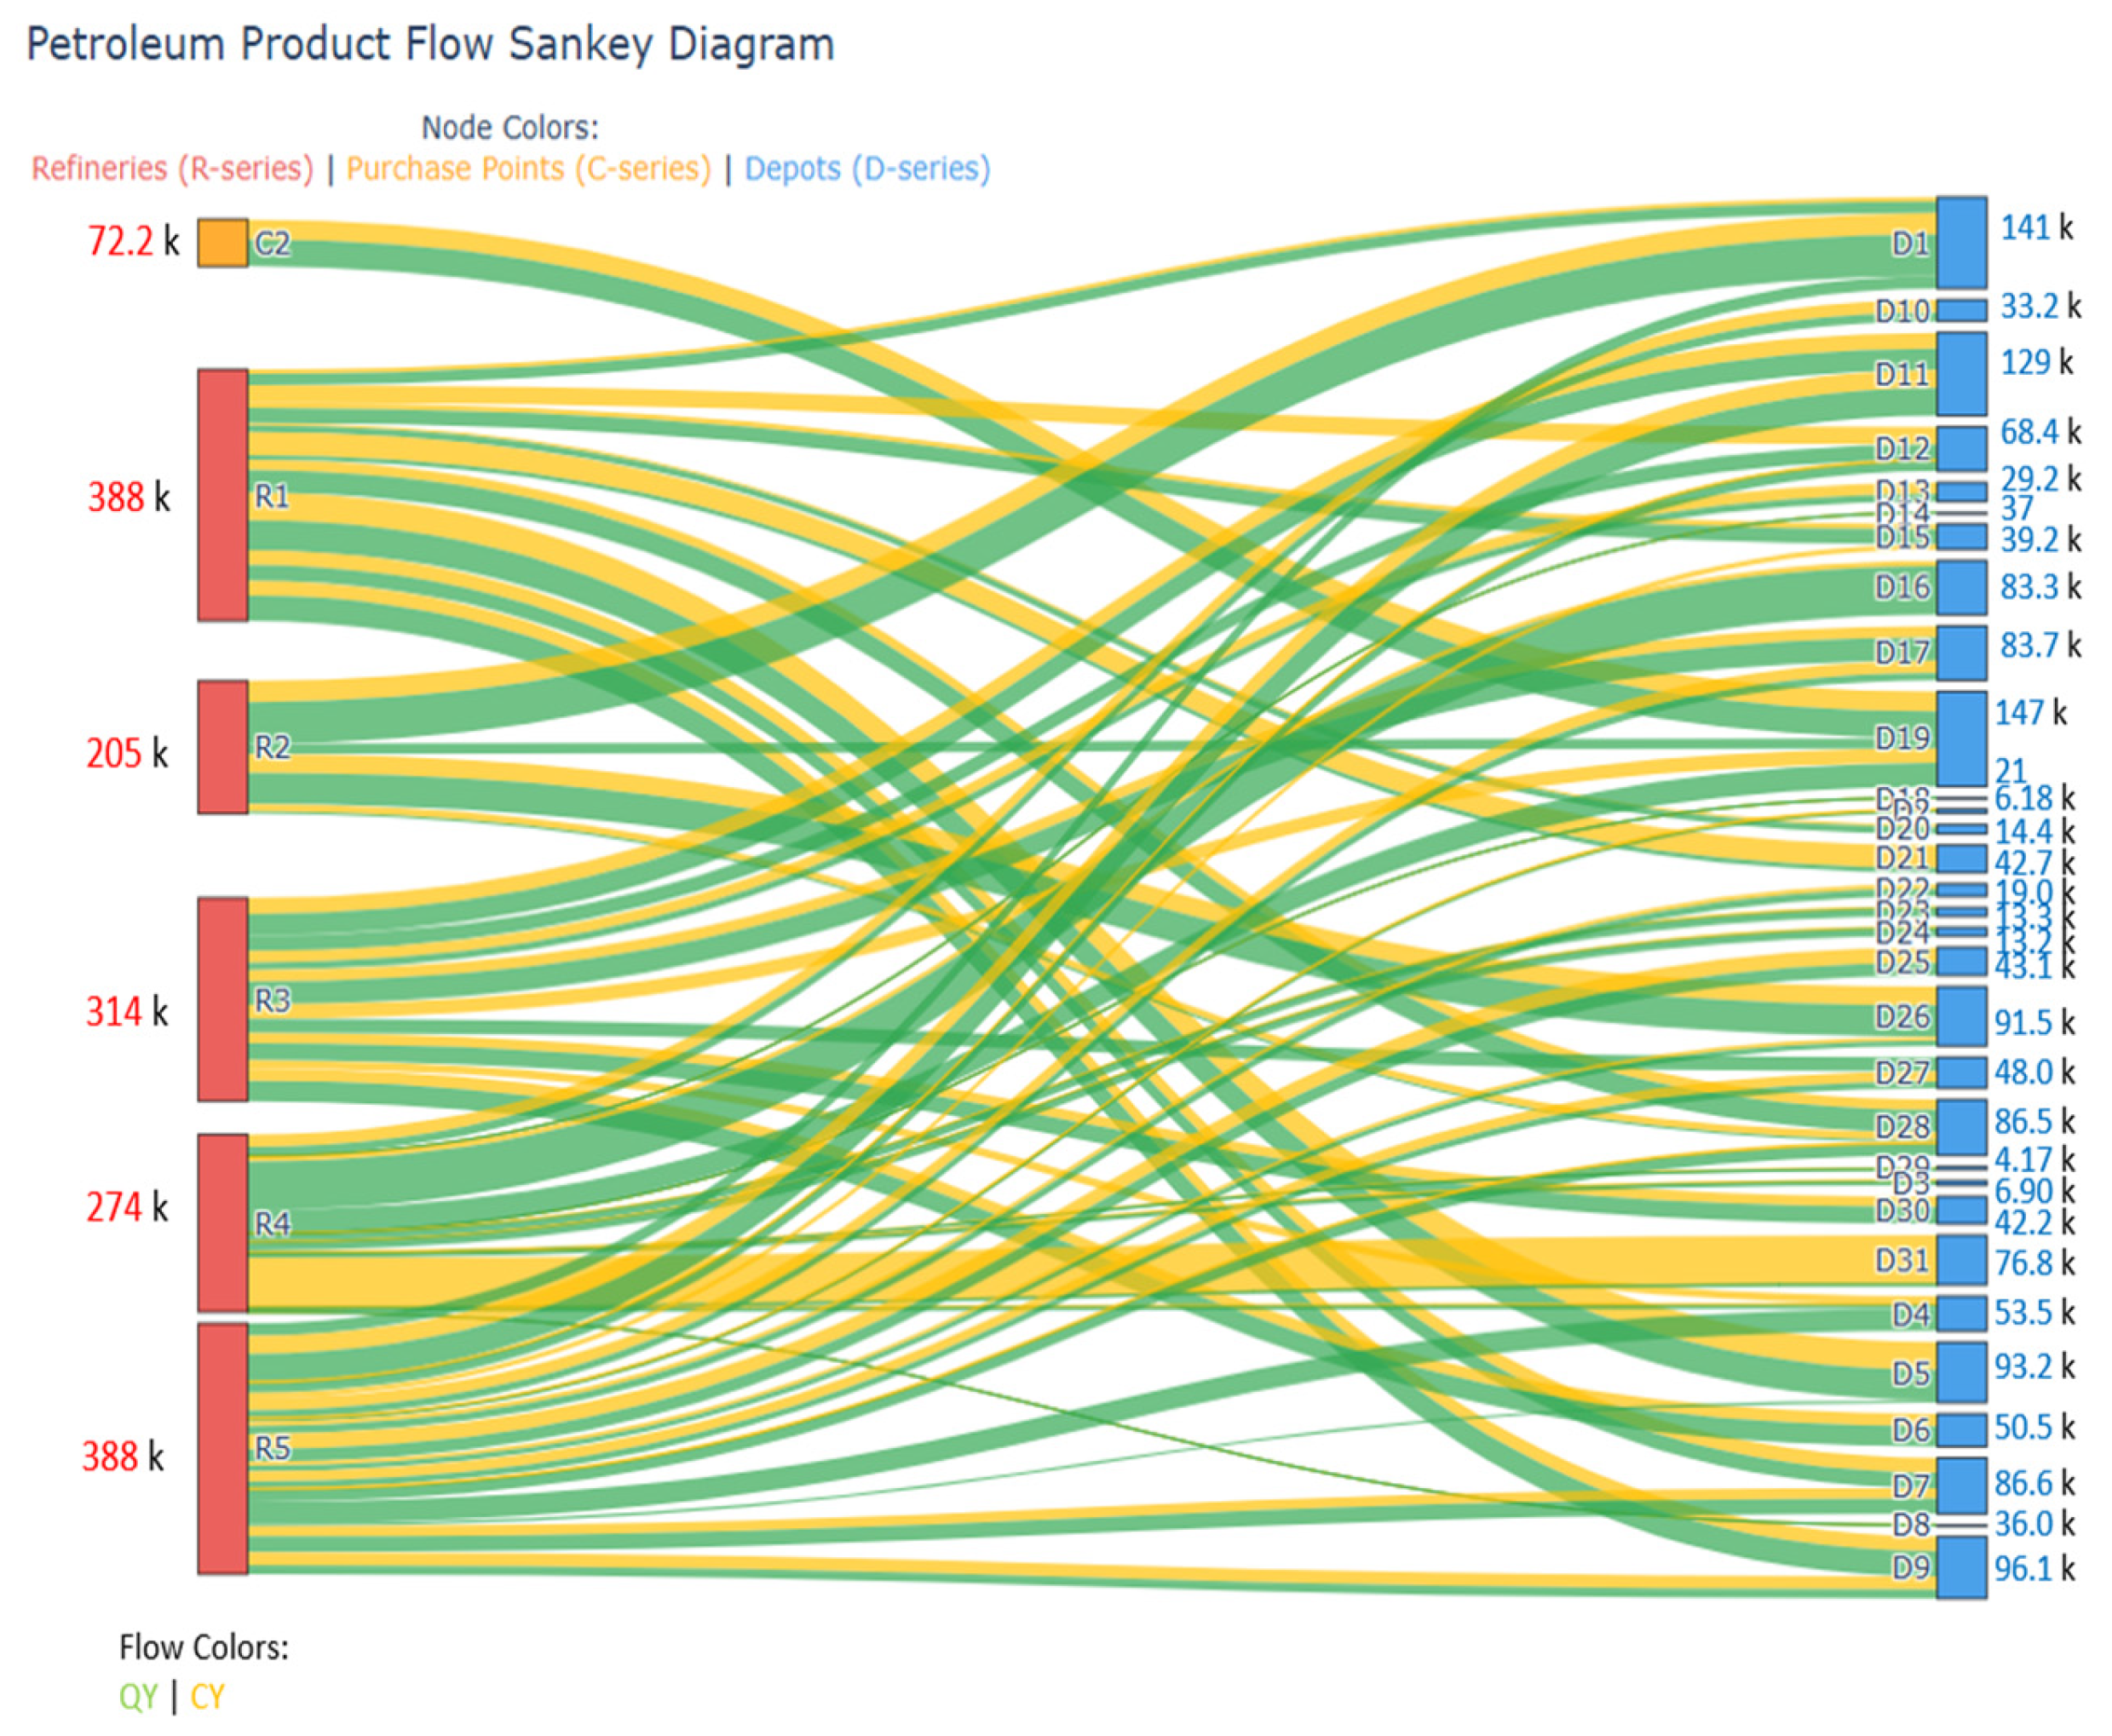
The Sankey diagram of node-level resource allocation is shown in Figure 10, and regional transport cost and carbon emission distributions are presented in Figure 11. Significant differences appear across the four regions in transport volume, transport costs, and carbon emissions, as well as in mode ratio. Regarding transport volume, the Hubei region records the largest throughput at 341,200 t, with roadway and waterway accounting for 72,200 t and 278,300 t, respectively. In contrast, the Jiangxi region has the smallest throughput and relies primarily on roadway transport. These volume differences reflect each region’s economic scale and industrial structure. Regarding transport costs, Sichuan incurs the highest total costs of 26.0238 million CNY, of which waterway transport represents the largest share (15.4778 million CNY). Anhui posts the lowest total transport costs at 11.037 million CNY, largely due to its reliance on roadway and railway transport. Variations in transport costs stem from differences in transport distance, mode type, and unit transport cost. In terms of carbon emissions, Sichuan also has the highest total emissions at 2492.64 tons, with waterway transport contributing 578.67 tons. Jiangxi reports the lowest total emissions, 432.91 tons, and is predominantly served by railway transport.
The current transport network is clearly suboptimal. Several regions over-rely on modes that are both expensive and carbon-intensive. Situation-specific, optimized allocation is therefore necessary. The following recommendations are offered.
  • Optimize transport structure: Increase pipeline share to 35% (currently 27.3%) in high-capacity areas such as Hubei. Although pipeline costs are slightly higher than waterway, this shift can reduce large-scale transport emissions to about 1200 tons. In high-cost regions like Sichuan, limit roadway use (currently 4.4%) and transfer flows to railway, cutting emissions by roughly 80% while lowering overall transport costs.
  • Strengthen regional coordination: For low-demand areas such as Jiangxi, source more from nearby external procurement nodes (e.g., C2) to avoid long-distance shipments. Dynamically deploy inventory through transit depots: move Sichuan’s surplus by railway to neighboring high-demand depots to reduce local roadway reliance and relieve pipeline capacity pressure.
  • Apply stepped carbon constraints: Implement differentiated ε caps: tighter limits (ε = 8000 tons) for high-emission regions like Sichuan to incentivize low-carbon transport and relaxed caps (ε = 9500 tons) for low-emission regions like Jiangxi to avoid excessive cost increases.

5. Conclusions

This paper presents a multi-objective resource allocation optimization method for refined oil that jointly pursues economic efficiency and carbon emission reduction. A whole-chain optimization model is developed encompassing refinery production, external procurement, multimodal transport operations, and inventory management, with dual objectives of minimizing total logistics cost and minimizing carbon emissions while respecting constraints on sending and receiving capacities, inventory balance, and supply and demand requirements. The ε-constraint method is used to convert the carbon objective into explicit constraints, enabling systematic exploration of Pareto-optimal trade-offs. The method is applied to a four-province case in central China. Analysis of the Pareto frontier highlights an attractive solution that increases freight costs by only 1.4% while cutting carbon emissions by 14%, yielding a marginal abatement cost of about 1814 CNY/ton. These results demonstrate that multi-objective optimization can effectively reconcile the conflict between economic and environmental goals and achieve synergistic improvements. Academically, this study contributes a novel, whole-chain modeling framework that integrates the ε-constraint method to quantify cost-carbon trade-offs in complex, multi-provincial oil supply chains. Managerially, it provides actionable decision-support tools for depot leasing, procurement node selection, and transport mode optimization, enabling managers to achieve significant emission reductions at minimal economic cost. Future work will extend the framework to dynamic, demand adaptive analyses, explore multi-policy coupling, and investigate regional coordination mechanisms linking nearby external supply, dynamic transit depot scheduling, and staged carbon constraints.

Author Contributions

Conceptualization, B.D., Z.B. and R.Q.; Software, B.D., G.F. and H.L.; Validation, J.C.; Formal analysis, J.C. and J.L.; Resources, Z.Q.; Data curation, Z.B. and Z.Q.; Writing—original draft, J.C. and B.D.; Visualization, G.F. and H.L.; Supervision, R.Q.; Project administration, Z.B. and J.L.; Funding acquisition, R.Q. All authors have read and agreed to the published version of the manuscript.

Funding

This research was funded by the National Natural Science Foundation of China (52341203) and the National Natural Science Foundation of China (52502411).

Data Availability Statement

The original contributions presented in the study are included in the article, further inquiries can be directed to the corresponding author.

Conflicts of Interest

Authors Jingjun Chen, Zhen Bao, Jingkai Lu and Zhengfang Qi were employed by the company Sinopec Marketing Central China Company. The remaining authors declare that the research was conducted in the absence of any commercial or financial relationships that could be construed as a potential conflict of interest.

Appendix A. Basic Data

Table A1. Refinery production schedule.
RefineryRegionPeriodGAS (×104 t)DIE (×104 t)
R1Hubeiseason47.428.1
R2Hunanseason36.027.0
R3Jiangxiseason70.042.8
R4Anhuiseason60.850.4
R5Hubeiseason626.231.5
Table A2. Season demand plan for oil depots.
DepotRegionPeriodGAS (×102 t)DIE (×102 t)
D1Sichuanseason0.8767.0
D2Sichuanseason0.20.1
D3Sichuanseason0.441.3
D4Sichuanseason407.2128.3
D5Sichuanseason0.20.2
D6Hubeiseason131.70.1
D7Hubeiseason263.3158.8
D8Hubeiseason317.7187.0
D9Hubeiseason750.083.1
D10Hubeiseason68.80.2
D11Hubeiseason0.010.2
D12Hubeiseason133.20.1
D13Hubeiseason138.5193.4
D14Hubeiseason115.7175.9
D15Hubeiseason1013.4394.7
D16Hubeiseason107.536.5
D17Hubeiseason231.1160.8
D18Anhuiseason558.2306.4
D19Anhuiseason387.9295.7
D20Anhuiseason320.1160.1
D21Anhuiseason469.1368.4
D22Anhuiseason38.623.2
D23Anhuiseason566.7348.7
D24Anhuiseason938.2530.9
D25Anhuiseason195.2235.6
D26Anhuiseason120.070.0
D27Anhuiseason506.3426.0
D28Anhuiseason479.0386.9
D29Anhuiseason535.6425.8
D30Anhuiseason73.0353.6
D31Jiangxiseason760.1525.8
Table A3. External procurement nodes information.
Resource NodeOilResource Volume (×104 t)Unit Cost (×104 CNY/t)
C1GAS10.00.8
C1DIE10.00.8
C2GAS1.00.8
C2DIE1.00.8

References

  1. U.S. Energy Information Administration (EIA). Short-Term Energy Outlook; U.S. Energy Information Administration: Washington, DC, USA, 2024. [Google Scholar]
  2. International Energy Agency (IEA). Oil Market Report—2024 Analysis and Forecast to 2028; IEA: Paris, France, 2024. [Google Scholar]
  3. Wang, G.T.; Cheng, Q.W.; Zhao, W.; Liao, Q.; Zhang, H. Review on the transport capacity management of oil and gas pipeline network: Challenges and opportunities of future pipeline transport. Energy Strategy Rev. 2022, 43, 100933. [Google Scholar] [CrossRef]
  4. Qiu, R.; Tu, R.F.; Wei, X.M.; Zhang, H.; Gao, M.; Liao, Q.; Liang, Y. Evaluation and optimization of pipeline pricing strategies on oil product logistics in China. J. Pipeline Sci. Eng. 2024, 4, 100144. [Google Scholar] [CrossRef]
  5. João, N.C.; Gonçalves, M.; Carvalho, S.; Cortez, P. Operations research models and methods for safety stock determination: A review. Oper. Res. Perspect. 2020, 7, 100164. [Google Scholar] [CrossRef]
  6. Wei, Z.W.; Gao, M.D.; Tu, R.F.; Chang, J.; Zhang, X.; Du, M.; Yang, X.; He, W. Multimodal Transportation Optimization of Refined Oil Logistics Considering Daily Scheduling: Case from China. J. Pipeline Sci. Eng. 2024, 15, 1590. [Google Scholar] [CrossRef]
  7. Ibeto, C.; Ugwu, C. Exhaust Emissions from Engines Fuelled with Petrol, Diesel and their Blends with Biodiesel Produced from Waste Cooking Oil. Pol. J. Environ. Stud. 2019, 28, 3197–3206. [Google Scholar] [CrossRef]
  8. Jiao, Y.Q.; Qiu, R.; Liang, Y.T.; Liao, Q.; Tu, R.; Wei, X.; Zhang, H. Integration optimization of production and transportation of refined oil: A case study from China. Chem. Eng. Res. Des. 2022, 188, 39–49. [Google Scholar] [CrossRef]
  9. Bei, H.H.; Lin, H.; Yang, F.J.; Li, X.; Murcio, R.; Yang, T. Optimization on Multimodal Network Considering Time Window Under Uncertain Demand. IEEE Trans. Intell. Transp. Syst. 2025, 26, 11294–11312. [Google Scholar] [CrossRef]
  10. Li, D.; Zhang, S.J.; Xiao, Y.H. Interval Optimization-Based Optimal Design of Distributed Energy Resource Systems under Uncertainties. Energies 2020, 13, 3465. [Google Scholar] [CrossRef]
  11. Miehling, S.; Hanel, A.; Lambert, J.; Fendt, S.; Spliethoff, H. Energy System Optimisation using (Mixed Integer) Linear Programming. arXiv 2023, arXiv:2308.01882. [Google Scholar] [CrossRef]
  12. Alahmad, A.K.; Verayiah, R.; Shareef, H.; Ramasamy, A.; Ba-Swaimi, S. Optimizing renewable energy and green technologies in distribution systems through stochastic planning of distributed energy resources. Energy Convers. Manag. X 2025, 25, 100834. [Google Scholar]
  13. Haddad, M.; Mansour, C.; Diab, J. System dynamics modeling for mitigating energy use and CO2 emissions of freight transport in Lebanon. In Proceedings of the First GCC International Conference on Industrial Engineering and Operations Management, Riyadh, Saudi Arabia, 26–28 November 2019. [Google Scholar]
  14. Zhu, Z.S.; Wang, X.H.; Liu, L.J.; Hua, S. Green sensitivity in supply chain management: An evolutionary game theory approach. Chaos Solitons Fractals 2023, 173, 113595. [Google Scholar] [CrossRef]
  15. Zhu, Z.; Zhang, Z.; Qiu, R.; Liao, Q.; Zhang, H.; Liang, Y. Multi-objective optimisation of refined oil distribution system considering distribution cost and depot utilisation rate. J. Pet. Sci. 2023, 8, 204–213. [Google Scholar]
  16. Ya, Z.; Han, J. Synergizing carbon trading and water management for urban sustainability: A city-level multi-objective planning framework. Appl. Energy 2024, 359, 122636. [Google Scholar]
  17. Jiang, W.; Yu, Q.L. Carbon emissions and economic growth in China: Based on mixed frequency VAR analysis. Renew. Sustain. Energy Rev. 2023, 183, 113500. [Google Scholar] [CrossRef]
  18. Wang, D.Y.; Li, Y.; Hong, J.K. Analysis of the Impact of Different Carbon Emission Reduction Subsidy Policies on Closed-Loop Supply Chain Decisions. J. Environ. Manag. 2025, 373, 123451. [Google Scholar] [CrossRef]
  19. Lu, W.B.; Xiao, Q.; Jiao, Z.P.; Jiang, Q.; Mu, Y.; Hou, K.; Yu, X.; Guo, S.; Jia, H. Multi-objective Optimal Operation of District Integrated Energy System. IEEE Sustain. Power Energy 2020, 11, 1505–1510. [Google Scholar]
  20. Shao, T.; Wang, J.; Wang, R.; Chow, D.; Nan, H.; Zhang, K.; Fang, Y. Multi-Objective Optimization for the Energy, Economic, and Environmental Performance of High-Rise Residential Buildings in Areas of Northwestern China with Different Solar Radiation. Appl. Sci. 2024, 14, 6719. [Google Scholar] [CrossRef]
  21. Delfino, F.; Ferro, G.; Robba, M.; Rossi, M. An Energy Management Platform for the Optimal Control of Active and Reactive Powers in Sustainable Microgrids. IEEE Trans. Ind. Appl. 2019, 55, 7146–7156. [Google Scholar] [CrossRef]
  22. Ji, H.; Wang, C.; Li, P.; Song, G.; Yu, H.; Wu, J. Quantified analysis method for operational flexibility of active distribution networks with high penetration of distributed generators. Appl. Energy 2019, 239, 706–714. [Google Scholar] [CrossRef]
  23. Han, J.M.; Wang, J.J.; Zhou, Y.; Lu, X. Distributed energy systems: Multi-objective optimization and evaluation under different operational strategies. J. Clean. Prod. 2021, 280, 124050. [Google Scholar] [CrossRef]
  24. Dong, Y.C.; Wang, C.; Zhang, H.L.; Zhou, X. A novel multi-objective optimization framework for optimal integrated energy system planning with demand response under multiple uncertainties. Inf. Sci. 2024, 663, 120252. [Google Scholar] [CrossRef]
  25. Wang, J.S.; Ren, X.X.; Li, T.; Zhao, Q.; Dai, H.; Guo, Y.; Yan, J. Multi-objective optimization and multi-criteria evaluation framework for the design of distributed multi-energy system: A case study in industrial park. J. Build. Eng. 2024, 88, 109138. [Google Scholar] [CrossRef]
  26. Xing, X.K.; Yan, Y.M.; Zhang, H.R.; Long, Y.; Wang, Y.; Liang, Y. Optimal design of distributed energy systems for industrial parks under gas shortage based on augmented ε-constraint method. J. Clean. Prod. 2019, 218, 782–795. [Google Scholar] [CrossRef]
  27. Chen, W.X.; Ren, H.T.; Zhou, W.J. Review of multi-objective optimization in long-term energy system models. Glob. Energy Interconnect. 2023, 6, 645–660. [Google Scholar] [CrossRef]
  28. Qiu, R.; Zhang, H.R.; Guo, X.Y.; Zhou, X.; Guo, Z.; Liao, Q.; Liang, Y. A multi-scenario and multi-objective scheduling optimization model for liquefied light hydrocarbon pipeline system. Chem. Eng. Res. Des. 2019, 141, 566–579. [Google Scholar] [CrossRef]
  29. Qiu, R.; Zhang, H.R.; Zhou, X.Y.; Guo, Z.; Wang, G.; Yin, L.; Liang, Y. A multi-objective and multi-scenario optimization model for operation control of CO2-flooding pipeline network system. J. Clean. Prod. 2020, 247, 119157. [Google Scholar] [CrossRef]
  30. Mavrotas, G. Effective implementation of the ε-constraint method in Multi-Objective Mathematical Programming problems. Appl. Math. Comput. 2009, 213, 455–465. [Google Scholar] [CrossRef]
  31. Wang, B.H.; Liang, Y.T.; Zheng, T.C.; Yuan, M.; Zhang, H. Optimisation of a downstream oil supply chain with new pipeline route planning. Chem. Eng. Res. Des. 2019, 145, 300–313. [Google Scholar] [CrossRef]
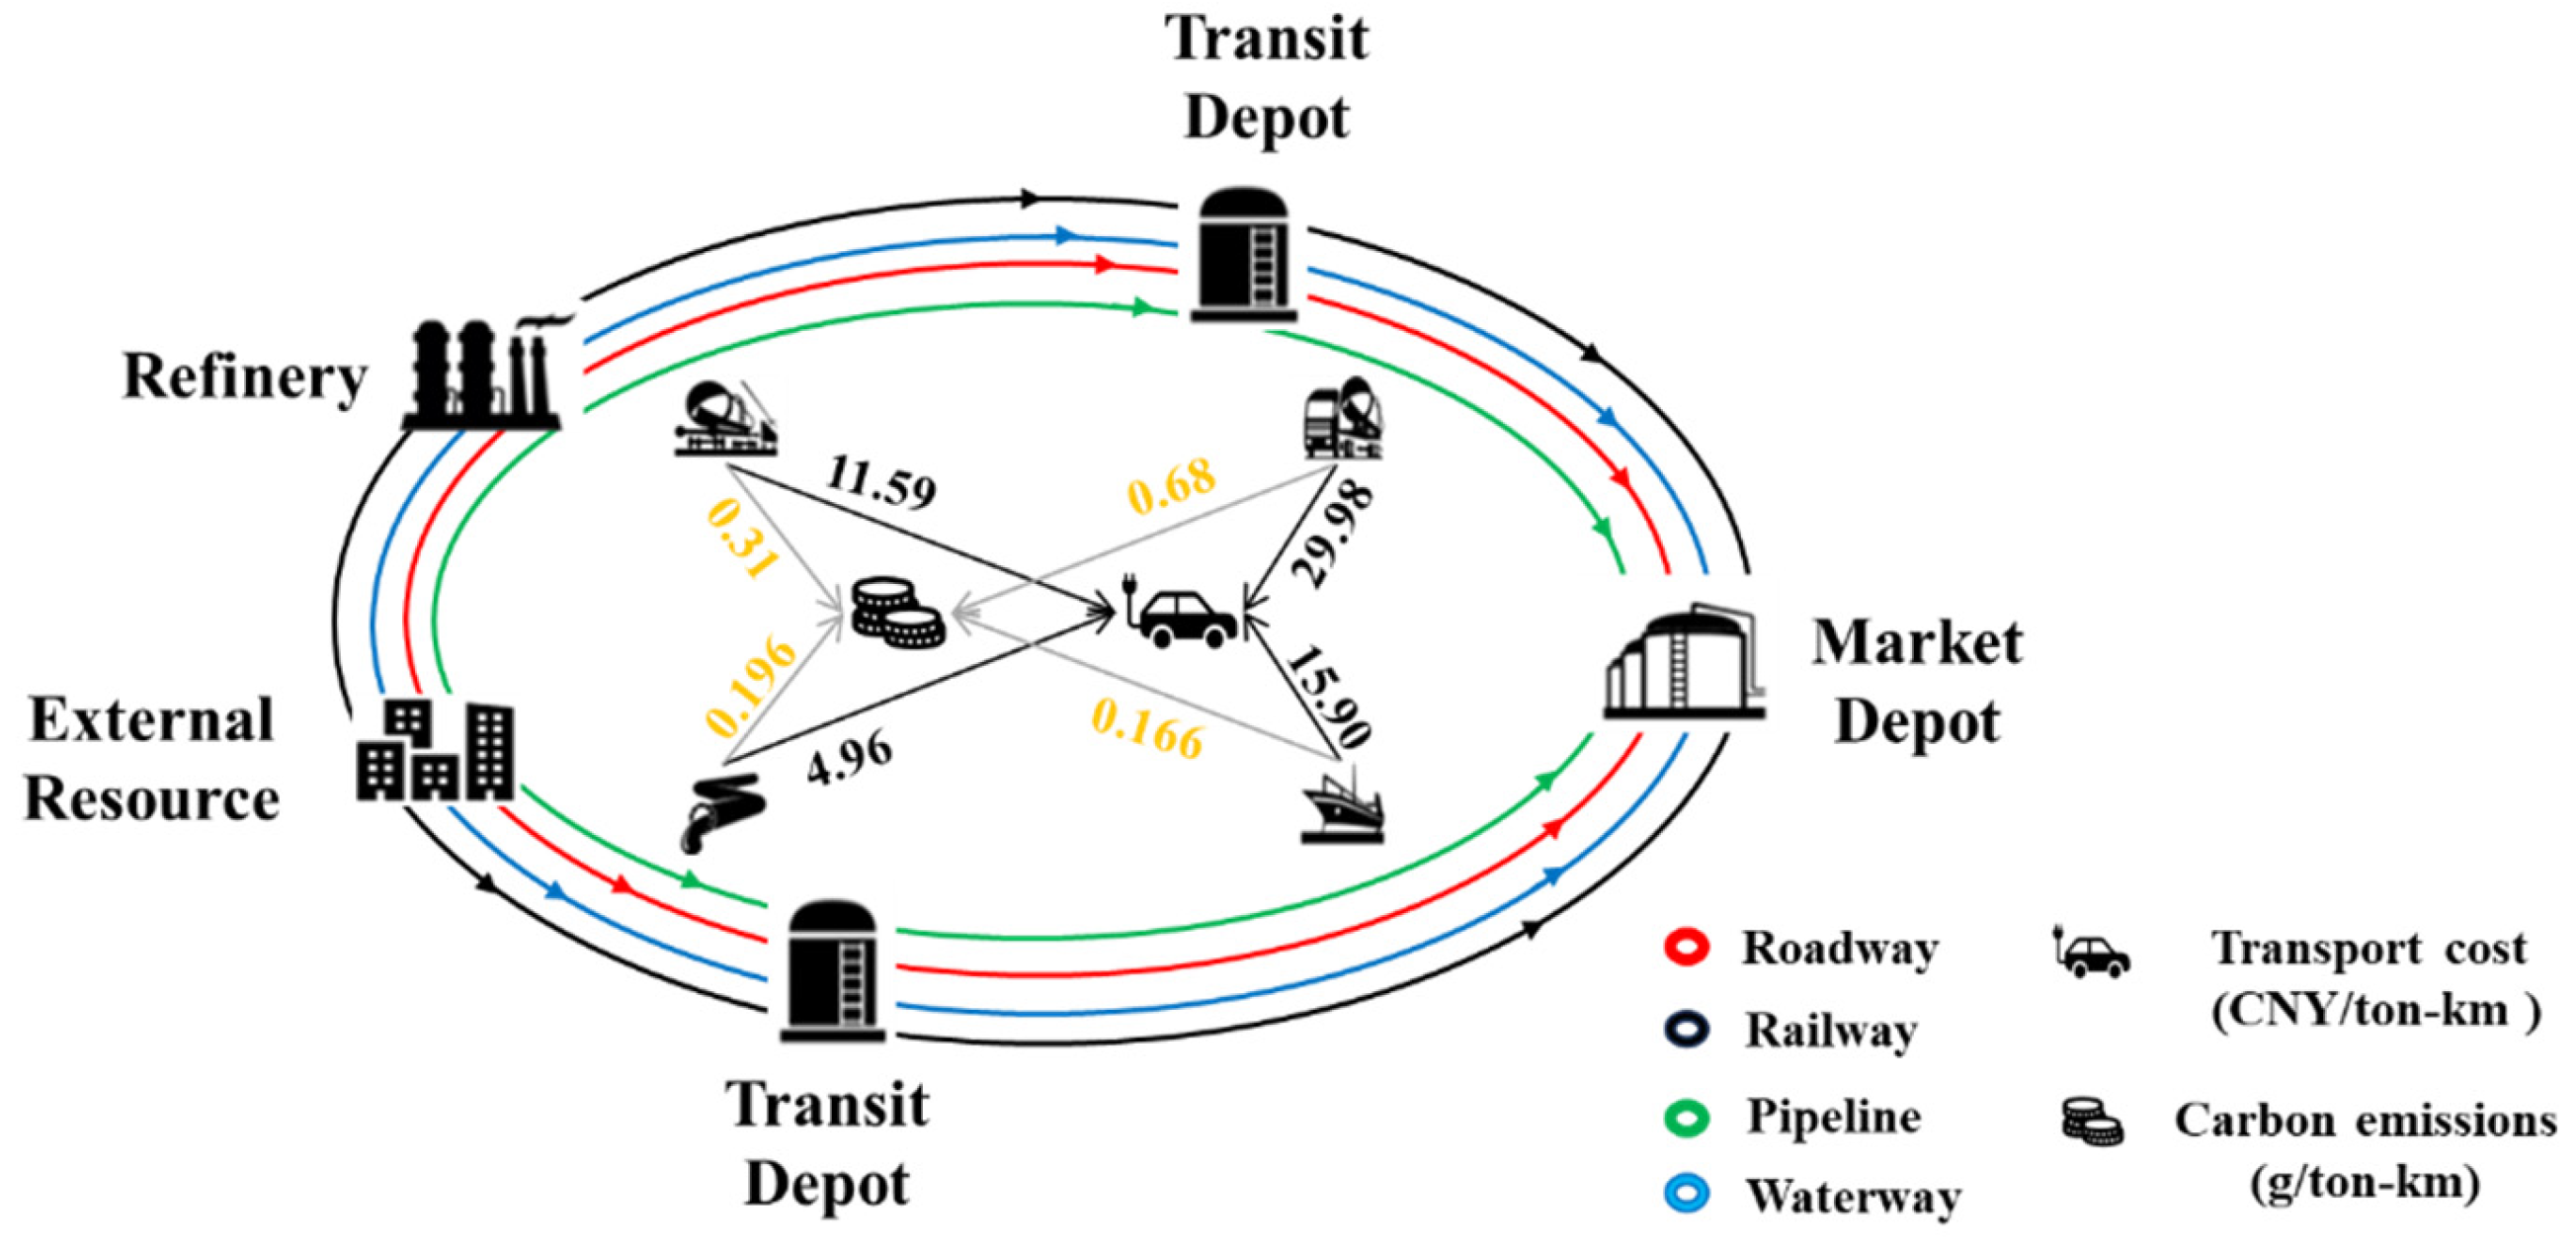
Figure 1. Resource allocation process of refined oil.
Energies 18 06075 g001
Figure 2. Research framework.
Energies 18 06075 g002
Figure 3. Node distribution.
Energies 18 06075 g003
Figure 4. Objective comparison.
Energies 18 06075 g004
Figure 5. Comparison of transport ratio.
Energies 18 06075 g005
Figure 6. Comparison of carbon emissions.
Energies 18 06075 g006
Figure 7. Pareto frontier.
Energies 18 06075 g007
Figure 8. Resource change of node R3.
Energies 18 06075 g008
Figure 9. Resource flow of node R3.
Energies 18 06075 g009
Figure 10. Resource flow of all nodes.
Energies 18 06075 g010
Figure 11. Distribution of transport costs and carbon emissions.
Energies 18 06075 g011
Disclaimer/Publisher’s Note: The statements, opinions and data contained in all publications are solely those of the individual author(s) and contributor(s) and not of MDPI and/or the editor(s). MDPI and/or the editor(s) disclaim responsibility for any injury to people or property resulting from any ideas, methods, instructions or products referred to in the content.