1. Introduction
With the ongoing advancement of new power system construction, particularly under the national strategic backdrop of “carbon peak and carbon neutrality”, distributed renewable energy sources, such as wind and solar PV, are being widely integrated into distribution systems [
1,
2,
3]. The high penetration of distributed generation (DG) has altered the structure and operational characteristics of traditional distribution networks. This shift is transforming the originally top-down, unidirectional, centralized supply paradigm into a new energy supply mode characterized by distributed generation, multi-energy complementarity, and bidirectional power flows [
4,
5]. However, distributed renewable energy exhibits inherent intermittency and randomness. Its unstable output and difficulty in prediction pose unprecedented challenges to the voltage stability and operational reliability of distribution networks [
6,
7]. Consequently, how to rapidly and accurately calculate the distributed energy hosting capacity of active distribution networks has become a focal and challenging issue in both current distribution system research and engineering practice.
In characterizing the operational feasible region and limit violation points, the classical Continuation Power Flow (CPF) method has long been employed to trace the maximum loadability point and PV curves, identify voltage collapse boundaries, and thus provide a practical tool for determining the feasible region boundary [
8]. However, for high-dimensional scenarios with multiple access points, the iterative-based CPF method encounters bottlenecks in convergence and computational efficiency, particularly performing inadequately in constructing feasible regions that require traversal in multiple directions [
9,
10,
11]. In response, researchers have recently proposed several alternative or improved methods to enhance robustness and efficiency, including optimization-based complementarity constraints for boundary determination and geometric approaches for feasible region characterization [
12,
13]. Furthermore, data-driven robust optimization methods have been developed to handle high-dimensional uncertainties. For instance, Liang et al. [
14] proposed a pair convex hull uncertainty set with adjustable conservativeness and a quad-level optimization model for hybrid microgrids, which effectively reduces computational complexity while maintaining robustness against correlated renewable energy sources. These advancements provide valuable insights for the rapid and accurate characterization of high-dimensional operational feasible regions.
On the other hand, since its introduction in 2012 by Spanish scholar Antonio Trias, the Holomorphic Embedding Method (HEM) has rapidly gained significant attention in the field of power flow calculation due to its non-iterative nature, global convergence, and computational stability. Grounded in complex analysis theory, this method embeds the originally nonlinear power flow problem into a holomorphic function space with respect to a complex-valued embedding factor. It solves for nodal voltages by constructing recursive relationships for power series coefficients [
15,
16]. Compared to traditional iterative methods like the Newton-Raphson method, HEM not only effectively avoids issues such as initial value dependency but also demonstrates superior computational efficiency in the operational analysis of systems with high-penetration distributed generation. Subsequently, HEM has been extended and applied to distribution network scenarios, including modeling for three-phase unbalanced systems and ZIP loads [
17], as well as interval or stochastic extensions to enhance its adaptability to the uncertainties inherent in real-world distributed resource integration [
18,
19]. Therefore, introducing the holomorphic embedding method into the characterization of the feasible region for active distribution networks can provide accurate and fast operational boundary delineation, thereby enhancing their security and stability. This approach possesses not only strong theoretical innovation and cutting-edge value but also demonstrates good applicability and promotion potential in practice.
The characterization of the operational feasible region remains subject to several critical challenges, which define the primary research gaps addressed in this work:
- (1)
Computational Efficiency and High-Dimensional Bottleneck: Traditional CPF methods and their variants incur prohibitive computational costs when traversing multi-directional scenarios in high-dimensional DG injection spaces, rendering them impractical for online analysis and rapid decision-making in active distribution networks.
- (2)
Heuristic and Suboptimal Boundary Identification: Optimization-based geometric approaches for feasible region construction often depend on heuristic search strategies, which may fail to guarantee convergence to the globally optimal and tightest security boundary.
- (3)
Lack of a Comprehensive HEM-Based Characterization Framework: While the HEM has proven efficient and reliable in power flow analysis and has been applied to hosting capacity assessment [
18,
19], its potential for systematically tracking multi-directional limit violation points and comprehensively characterizing high-dimensional operational feasible regions remains largely underdeveloped, lacking an integrated and dedicated framework.
To bridge these gaps, this paper proposes a holistic HEM-based methodology for characterizing the operational feasible region of active distribution networks. The main contributions are summarized as follows:
- (1)
We introduce tailored holomorphic embedding models for different node types to enable precise limit violation point tracking and derive the corresponding recursive relations for solving the power series coefficients.
- (2)
We develop a systematic methodology for operational feasible region characterization by constructing a DG power injection space, enabling visual and intuitive representation of the security boundaries.
- (3)
We validate the proposed framework using the IEEE 33-node distribution system, demonstrating its accuracy in power flow computation and its effectiveness in identifying voltage limit violation points.
The remainder of this paper is structured as follows:
Section 2 introduces the fundamental theory of holomorphic functions and power series.
Section 3 constructs the holomorphic embedding model for limit violation point tracking.
Section 4 elaborates on the initial solution acquisition of the HEM model.
Section 5 derives the recursive relations and details the solution procedure.
Section 6 presents the methodology for operational feasible region characterization.
Section 7 validates the accuracy and efficiency of the method via case studies on the IEEE 33-node system. Finally,
Section 8 concludes the paper and outlines future research directions.
2. Holomorphic Functions and Their Power Series
Let a complex function
z(
α) be defined in a neighborhood of a point
α0 in the complex plane. If the limit
exists, then
z(
α) is said to be complex differentiable at
α0. If
z(
α) is complex differentiable at every point in a domain
D, then
z(
α) is said to be holomorphic (also called analytic) in
D.
An important property of holomorphic functions is that they can be represented by a Taylor series expansion within their domain of analyticity. Suppose
z(
α) is holomorphic and analytic inside and on a circle
C centered at
a0. Then
z(
α) can be expressed as a Taylor series about
a0:
If
a0 = 0 lies within the domain of analyticity, the Taylor series is also referred to as a Maclaurin series, and
z(
α) can be written as:
3. Construction of the Holomorphic Embedding Model for Limit Violation Point Tracking
For a distribution system, the holomorphic embedding model is constructed based on the power balance equations for PQ and PV nodes, along with the voltage magnitude constraints for PV and slack nodes. Consider a multi-node system comprising one slack node, along with several PQ and PV nodes. For node
i, the following equations hold:
Here, Equation (4) represents the power balance equation for a PQ node, where Yik is the element (i, k) of the nodal admittance matrix, Si and Vi denote the complex power injection and voltage at node i, respectively. Equations (5) and (6) specify the voltage magnitude constraints for the slack node and PV nodes, respectively, with Visp representing the specified voltage value. Equation (7) is the power balance equation for a PV node, where Pi signifies the active power injection at node i.
To incorporate the integration of DG into the model, an appropriate method is required to embed the holomorphic factor into Equations (4)–(7). The following holomorphic embedding model effectively represents the integration of distributed generation:
In this formulation, Si represents the complex power injection at PQ nodes, and Pi denotes the active power injection at PV nodes. The terms ΔSi, ΔPi, and ΔQi correspond to the base values of complex power, active power, and reactive power injected by distributed generation at node i, respectively. These base values can be freely specified.
The terms
Vi(
α) and
Qi(
α) represent the embedded forms of the nodal voltage and reactive power injection, respectively. They are holomorphic functions of the embedding factor
α and can be expanded as Maclaurin series in terms of
α, where the coefficients
V[
n] are complex numbers and
Q[
n] are real numbers:
Substituting Equations (9)–(11) into the holomorphic embedding model facilitates the subsequent acquisition of the initial solution and enables the derivation of the recursive relations required for solving the power series coefficients.
4. Initial Solution of the Holomorphic Embedding Model
By setting
α = 0 in the holomorphic embedding model given by Equation (8), the equations for obtaining the initial solution of the holomorphic embedding model are derived as follows:
The solution to Equations (12)–(15) yields the nodal voltages and the reactive power injections at PV nodes under the given load level, which constitutes the base power flow solution of the system during normal operation. Solving this system power flow provides the initial solution for the holomorphic embedding model. Substituting this initial solution into the subsequently derived recursive relations enables the determination of higher-order coefficients in the power series expansions for voltage and reactive power.
5. Recursive Relations of the Model and Solution Procedure
For the holomorphic embedding model to hold for any value of the embedding factor
α, the coefficients of the power series in
α on both sides of the equation must be equal. To determine these coefficients, the reciprocal of the voltage function in the model is expressed as another power series,
W(
α). The relationship between
W(
α) and
V(
α) is given by:
To compute the coefficients of the power series
W(
α), both sides of Equation (16) are multiplied by
V(
α). Expanding both functions as power series yields:
The product of two power series corresponds to the convolution of their coefficients of the same order. By equating the coefficients of like powers of
α on both sides of Equation (17), the following recursive relation between
W(
n) and
V(
n) is obtained:
Substituting Equation (16) into the holomorphic embedding model and expanding the involved terms into their power series representations, we proceed as follows. For a PQ node, by equating the coefficients of like powers of
α on both sides of the equation when
n ≥ 1, the following recursive relation is derived:
Moving the first term from the right-hand side to the left-hand side of the equation yields:
Similarly, for the slack node, when
n ≥ 0, the following relation is obtained:
For the power balance equation of a PV node, when
n ≥ 1, equating the coefficients yields:
The terms involving the initial solution on the right-hand side are transposed to the left-hand side. The reorganized recursive relations are as follows:
The relationship between
W and
V is given by:
The relationship between
V and
V* is:
Expanding into real and imaginary parts yields:
Equations (20), (21), (23), (24) and (26) collectively form the complete set of recursive relations for calculating the power series coefficients.
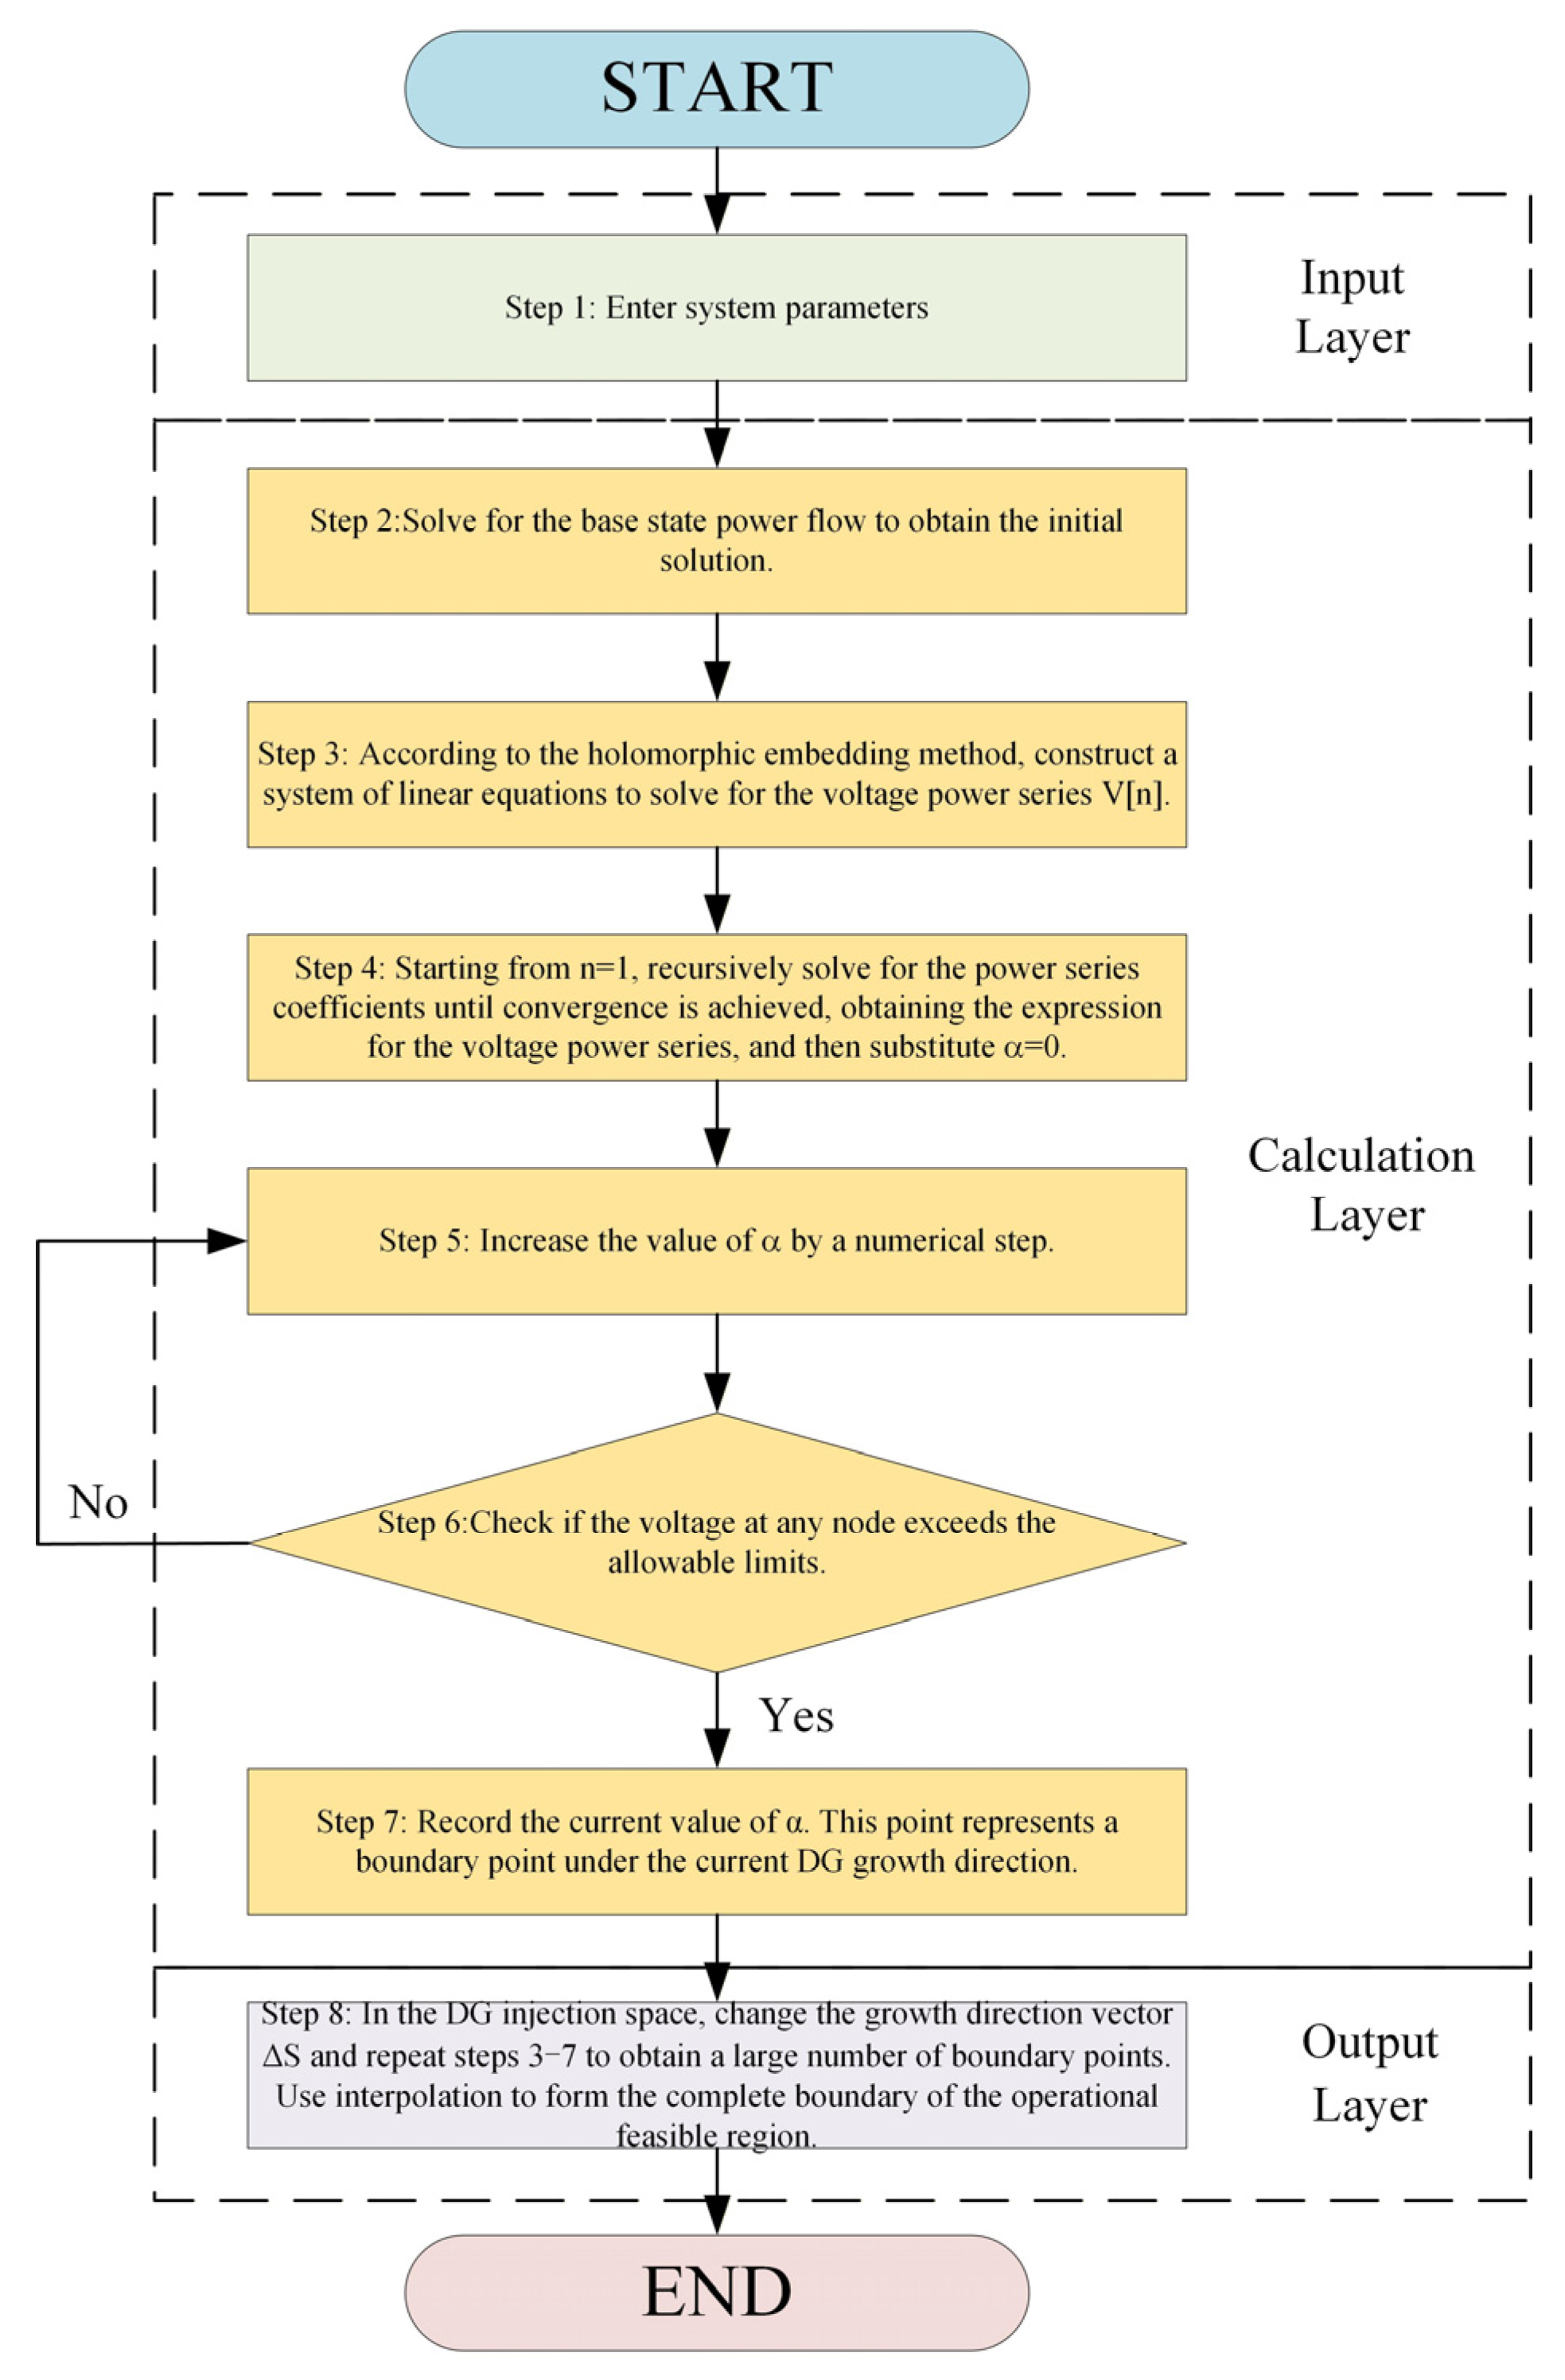
After obtaining the base power flow solution as the initial condition and substituting it into the recursive relations, the power series coefficients are solved iteratively until a prescribed accuracy is attained. The embedding factor α is then gradually increased in fixed increments. At each step, the nodal voltages are evaluated for limit violations. This procedure is repeated until the voltage security limit point—along with its corresponding operating data—is identified.
To ensure the validity of the recursive power series expansion, the convergence of the series is analyzed based on the theory of holomorphic functions. Specifically, for each nodal voltage
Vi(
α), the holomorphic embedding ensures analyticity within a radius of convergence determined by the nearest singularity in the complex
α-plane. In power system applications, this singularity typically corresponds to the voltage collapse point, implying that the series converges for all operating points within the secure voltage stability region [
20].
In practical implementation, the following empirical truncation criterion is adopted:
where
δ is the relative tolerance chosen (we use
δ = 10
−4). Once
εn falls below
δ for all buses, the power series has sufficiently converged.
6. Characterization of the Operational Feasible Region for Active Distribution Networks
The impact on system operational status varies with the integration locations of DG, significantly influencing the system’s DG hosting capacity across different connection points. To accurately assess this hosting capacity, this paper establishes a multi-dimensional space composed of the DG injection powers at each node. Within this space, the hosting capacity is analyzed under various integration locations and configuration ratios.
The dimension of this space corresponds to the number of nodes, denoted as m, with distributed generation integrated. Each coordinate axis represents the DG injection power at the corresponding node. A point in this space is defined as SPV(SPV1, SPV2, …, SPVm), where SPV1, SPV2, …, SPVm denote the magnitudes of DG integration at the respective nodes. Each specific set of DG integration schemes corresponds to a unique point within this space. The visualization of both the voltage security limit points and the feasible region is based upon this defined multidimensional framework.
A vector ΔS = [SPV1, SPV2, …, SPVm]T is defined to represent the direction of DG integration, with its elements being values obtained through dense sampling. Customizing the integration direction is achieved by altering ΔS. The holomorphic embedding algorithm for limit violation point tracking introduces the holomorphic factor α into the model. By controlling α, the injection power is adjusted along a specified DG integration direction, enabling the traversal of numerous scenarios.
Node voltages are influenced by the DG injection power. As α varies, if the voltage magnitude at any node exceeds the stipulated limits, a voltage limit violation is detected. The corresponding voltage limit violation point along that specific direction is then identified and marked within the aforementioned DG injection power space.
Based on the aforementioned definitions, for a specific node
i in the network, the voltage security operational feasible region
, representing the distributed generation hosting capacity, can be expressed as:
where
Vi is the voltage at node
i, and
Vmax is the specified upper voltage limit.
Under secure operating conditions, the voltage at any node in the distribution system must not exceed the specified upper limit. Therefore, the voltage security operational feasible region
for the entire network is the intersection of the feasible regions of all individual nodes, which can be expressed as:
where
V represents the voltage at any node within the distribution system.
In this paper, within the constructed distributed generation injection power space, a certain number of values are uniformly selected from the range [0, 1] on each coordinate axis according to the sampling count. The values obtained on each axis are then combined through permutation to form various injection scenarios.
Figure 1 illustrates the algorithm’s workflow.
7. Case Study
7.1. Case Description
The IEEE 33-node distribution system is adopted as the test case in this paper. An IEEE 33-node distribution network model incorporating distributed generation is constructed. Furthermore, the voltage deviation index specified in the Technical Guideline for Evaluating Power Grid Bearing Capability of Distributed Resources Connected to Network [
21] is selected as the criterion for characterizing the feasible region boundary of distributed generation integration. This ensures the security of the power grid after the integration of distributed generation.
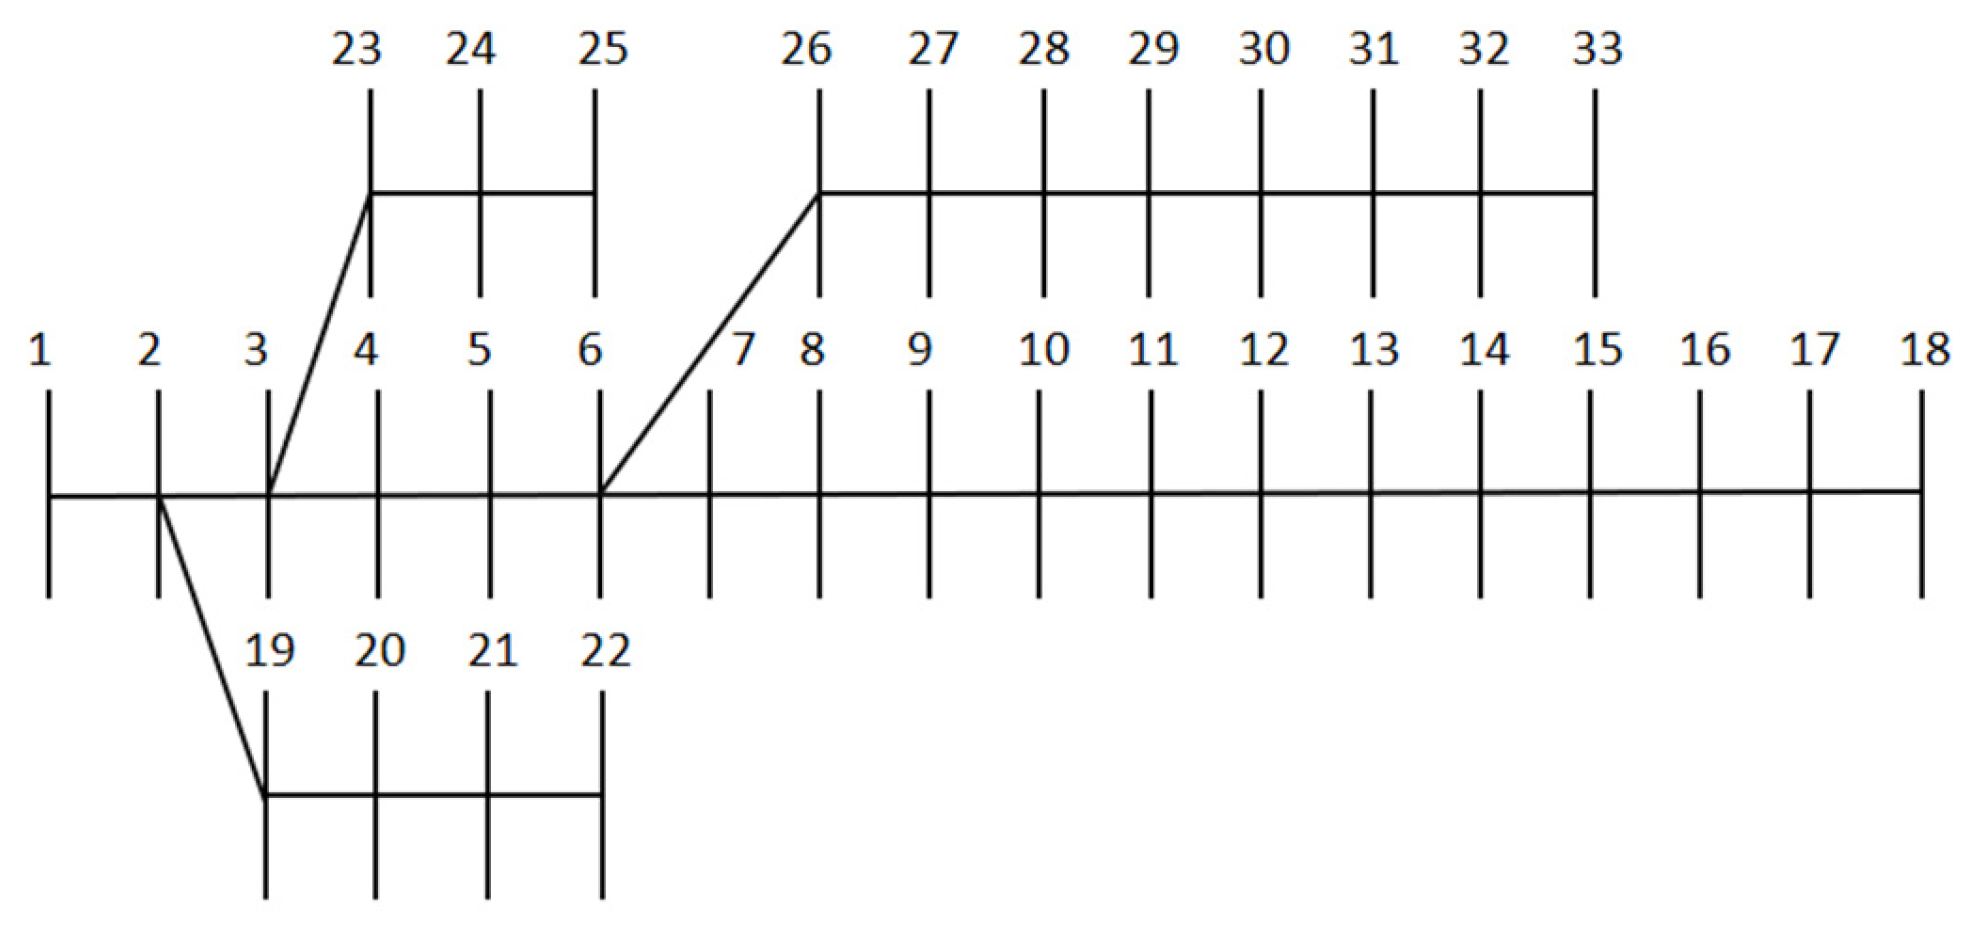
The network topology of the IEEE 33-node distribution system is shown in
Figure 2, with a base voltage of 12.66 kV and a base capacity of 10 MV·A.
7.2. Error Comparison
To systematically validate the computational accuracy of the proposed method, a “typical scenario coverage + random combination” strategy is adopted to design photovoltaic (PV) integration schemes within the constructed IEEE 33-node distribution network simulation system. This strategy includes not only typical scenarios commonly encountered in engineering practice, such as single-point high-power integration and multi-point balanced integration of distributed generation but also generates combined schemes with varying PV integration nodes and injection powers through random sampling. This approach mitigates the limitations associated with verification based on a single scenario type.
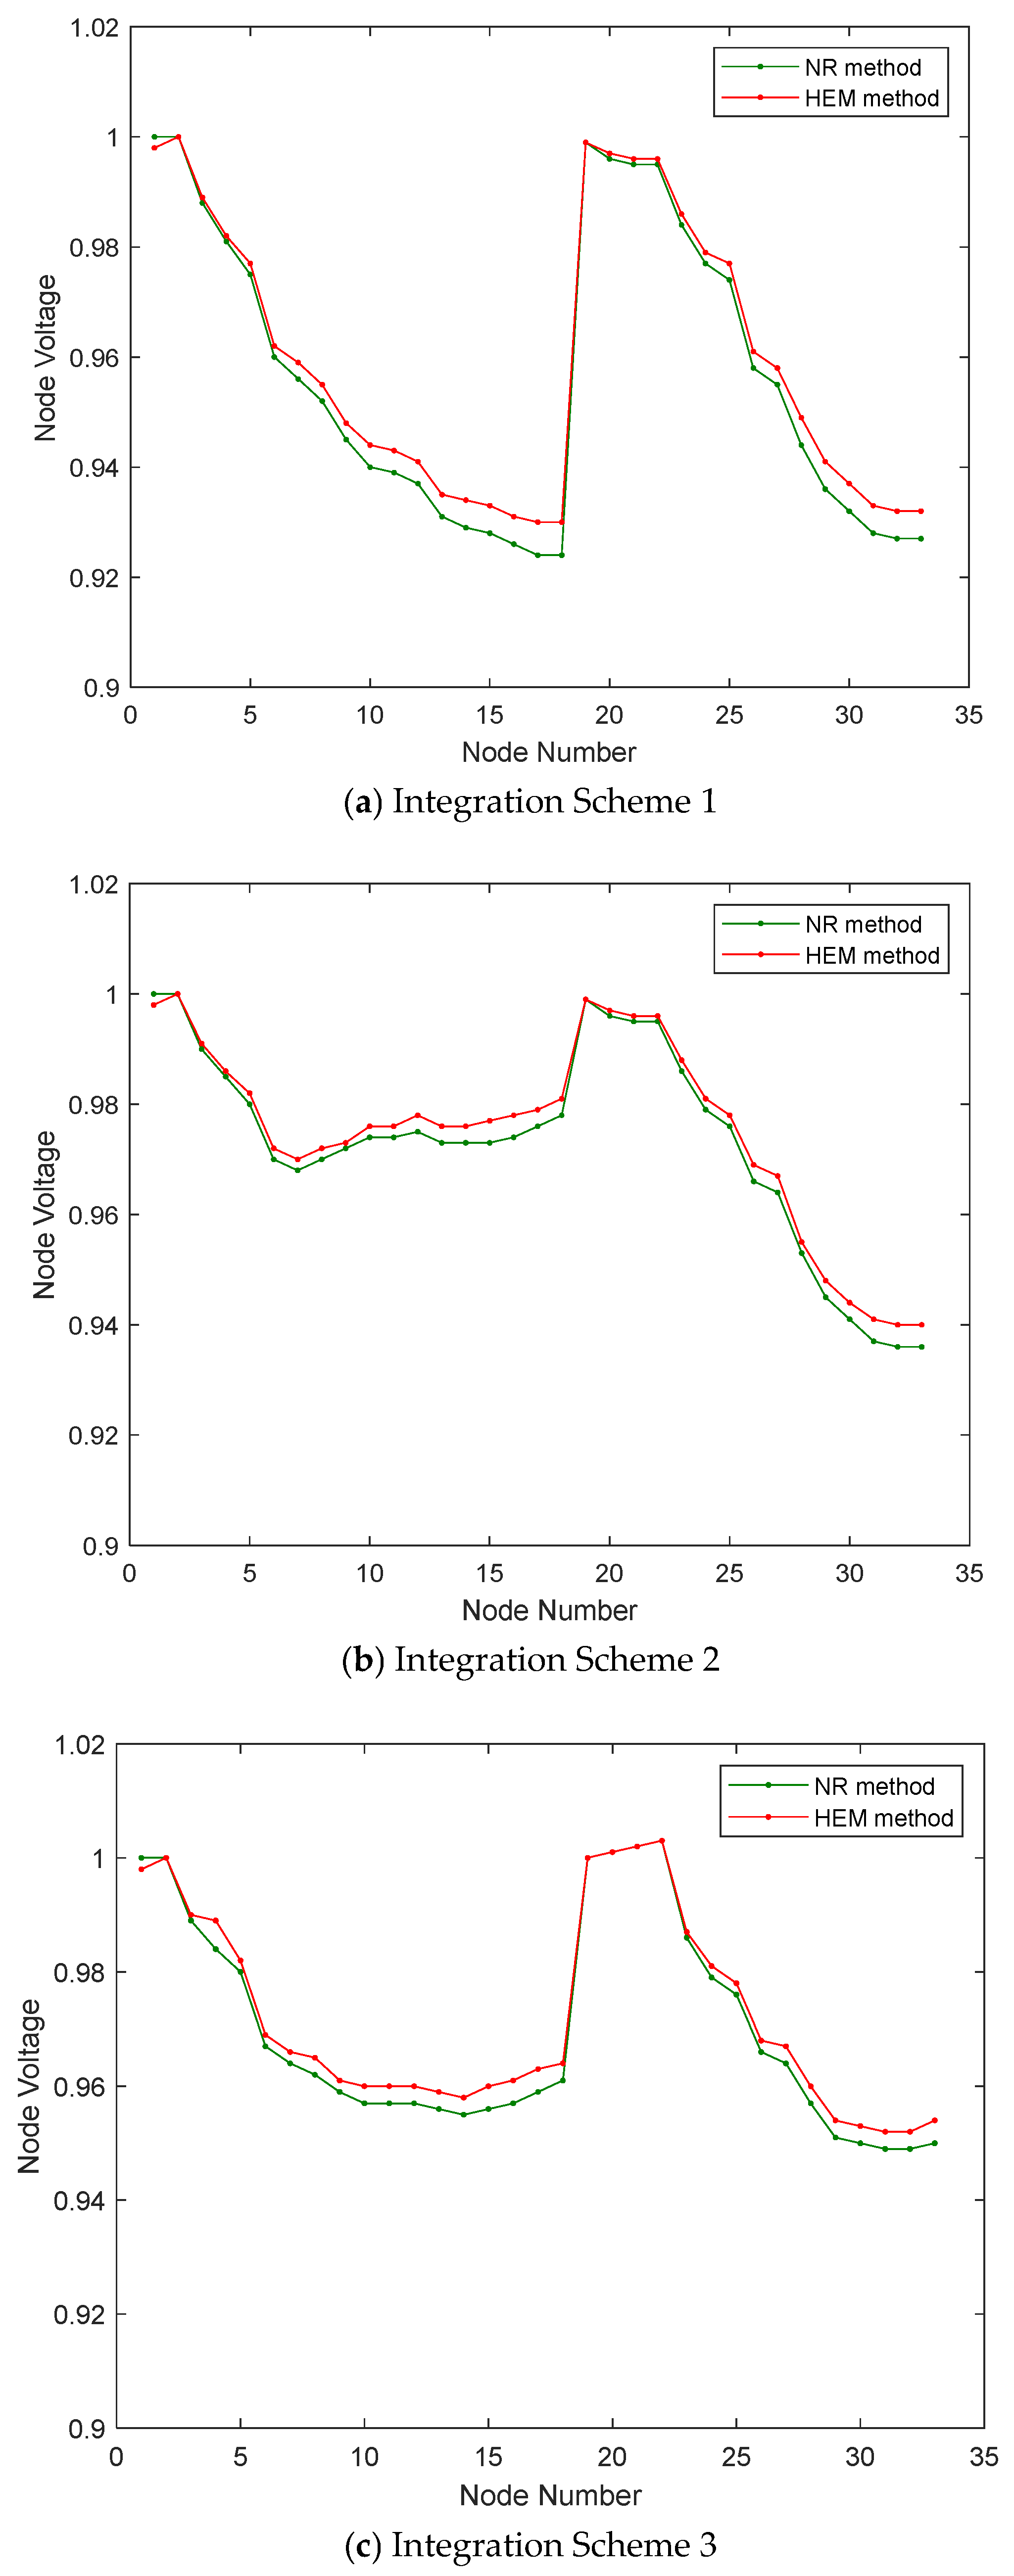
For each of the PV integration schemes mentioned above, node voltage calculations are performed using both the proposed method and the Newton-Raphson power flow algorithm. The specific parameters of the different PV integration schemes are listed in
Table 1, providing a clear basis for subsequent error analysis and accuracy verification.
Figure 3 clearly demonstrates that across various scenarios—including single-point, two-point, and three-point PV integration—the overall trends of nodal voltage variations remain consistent. The maximum deviation between the curves does not exceed 0.015 p.u., with errors evenly distributed and no significant outliers observed. Such minor deviations have negligible impact on the reliability of voltage measurements and the accuracy of subsequent feasible region boundary characterization, thereby validating the feasibility of the proposed method in terms of trend consistency and error control.
Table 2 further quantifies the accuracy of the algorithm. Compared to the Newton-Raphson power flow method, the proposed approach maintains very low error levels across all integration scenarios, fully demonstrating its high precision under varying PV penetration conditions.
7.3. Voltage Limit Violation Point Tracking
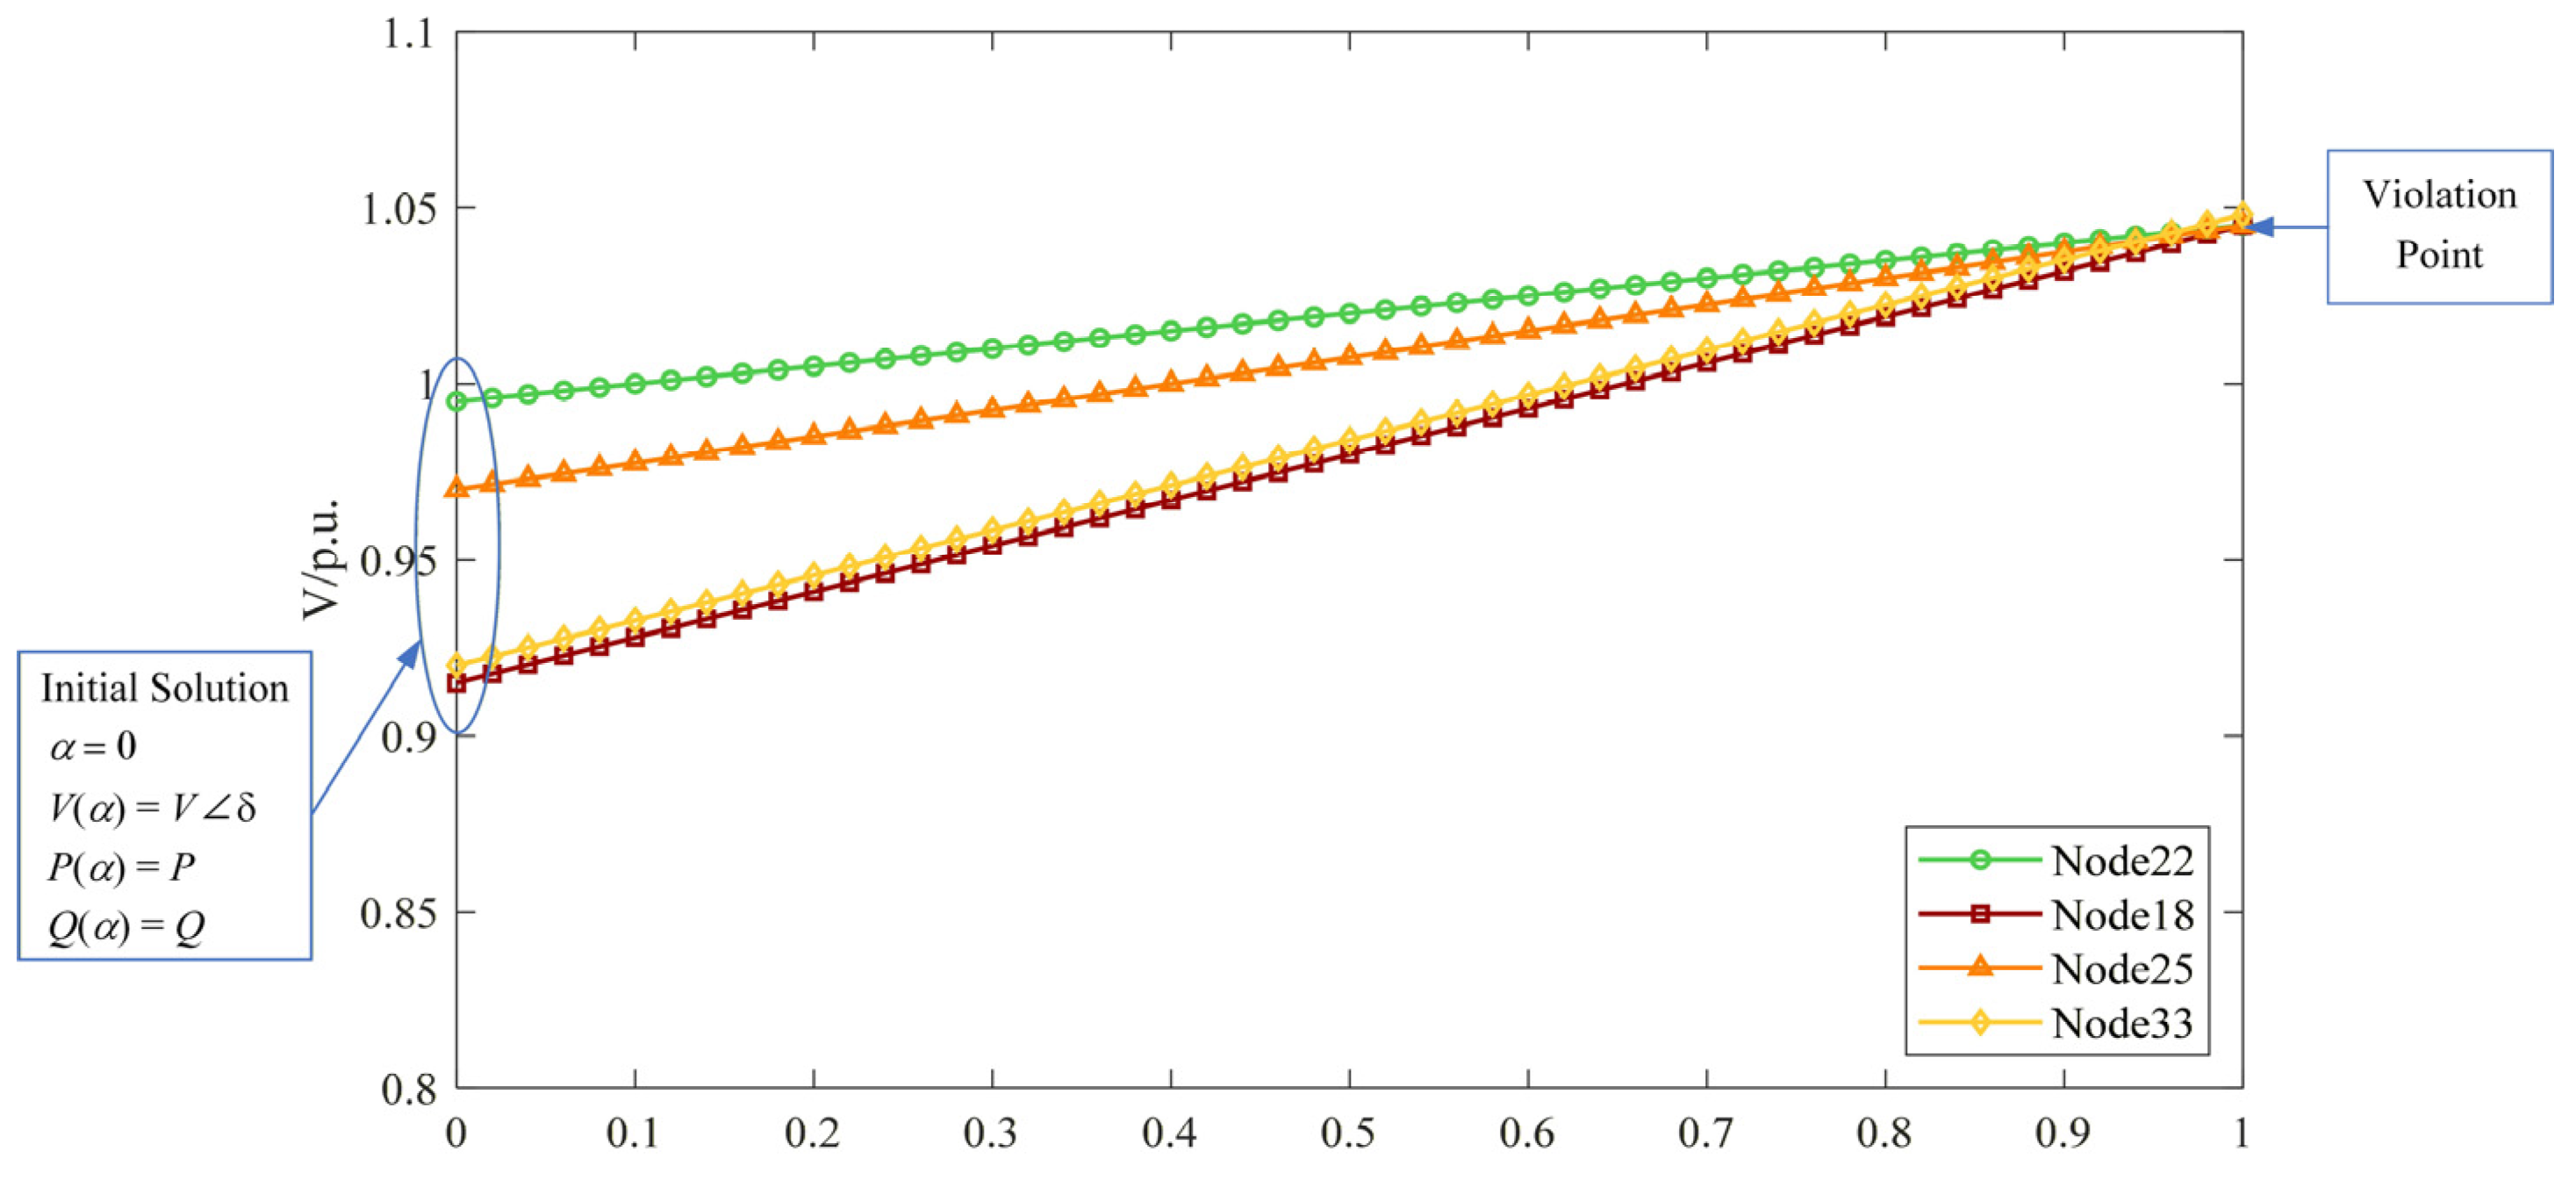
In the established IEEE 33-node distribution network simulation system, the secure operational upper limit for node voltages is set at 1.05 p.u.—exceeding this value is identified as a voltage limit violation—based on distribution network operation safety standards and engineering practice. Four branch-end nodes, numbered 18, 22, 25, and 33, are selected as DG integration points. The DG injection power directions corresponding to these four nodes are incorporated into the proposed holomorphic embedding algorithm. The algorithm automatically converts the PV output at each node into holomorphic embedding factors, which are then integrated with existing system parameters such as line impedances and load powers to form the holomorphic embedding equations.
During the computation process, the holomorphic factor
α is incrementally increased in steps of 0.02 MW. At each step, the voltage magnitudes
V at the four integration nodes are obtained by solving the power series recursively. The corresponding data pairs of
α and
V are recorded in real-time to generate the relationship curves, as shown in
Figure 4. By observing the curves depicting the relationship between the holomorphic embedding factor
α and the node voltage
V at the DG integration nodes, it can be demonstrated that the algorithm automatically tracks the voltage limit violation points.
7.4. Feasible Region Characterization and Hosting Capacity Assessment
Nodes 18 and 33, located at the feeder ends of the IEEE 33-node system, are selected as distributed photovoltaic integration points. A two-dimensional power injection space is constructed based on the power injection directions of these two nodes to simulate operational conditions with coordinated output from the two sources. After incorporating the power injection direction of this dual-node integration scenario into the proposed holomorphic embedding algorithm, the algorithm traverses the two-dimensional power space. For each scenario during the traversal, the algorithm automatically solves the voltage magnitudes for all 33 nodes in the system and checks whether they reach the security upper limit of 1.05 p.u. When the voltage at any node first exceeds the threshold, the current injection power coordinates and the corresponding limit-violating node number are recorded, forming a set of voltage limit violation points composed of multiple discrete points.
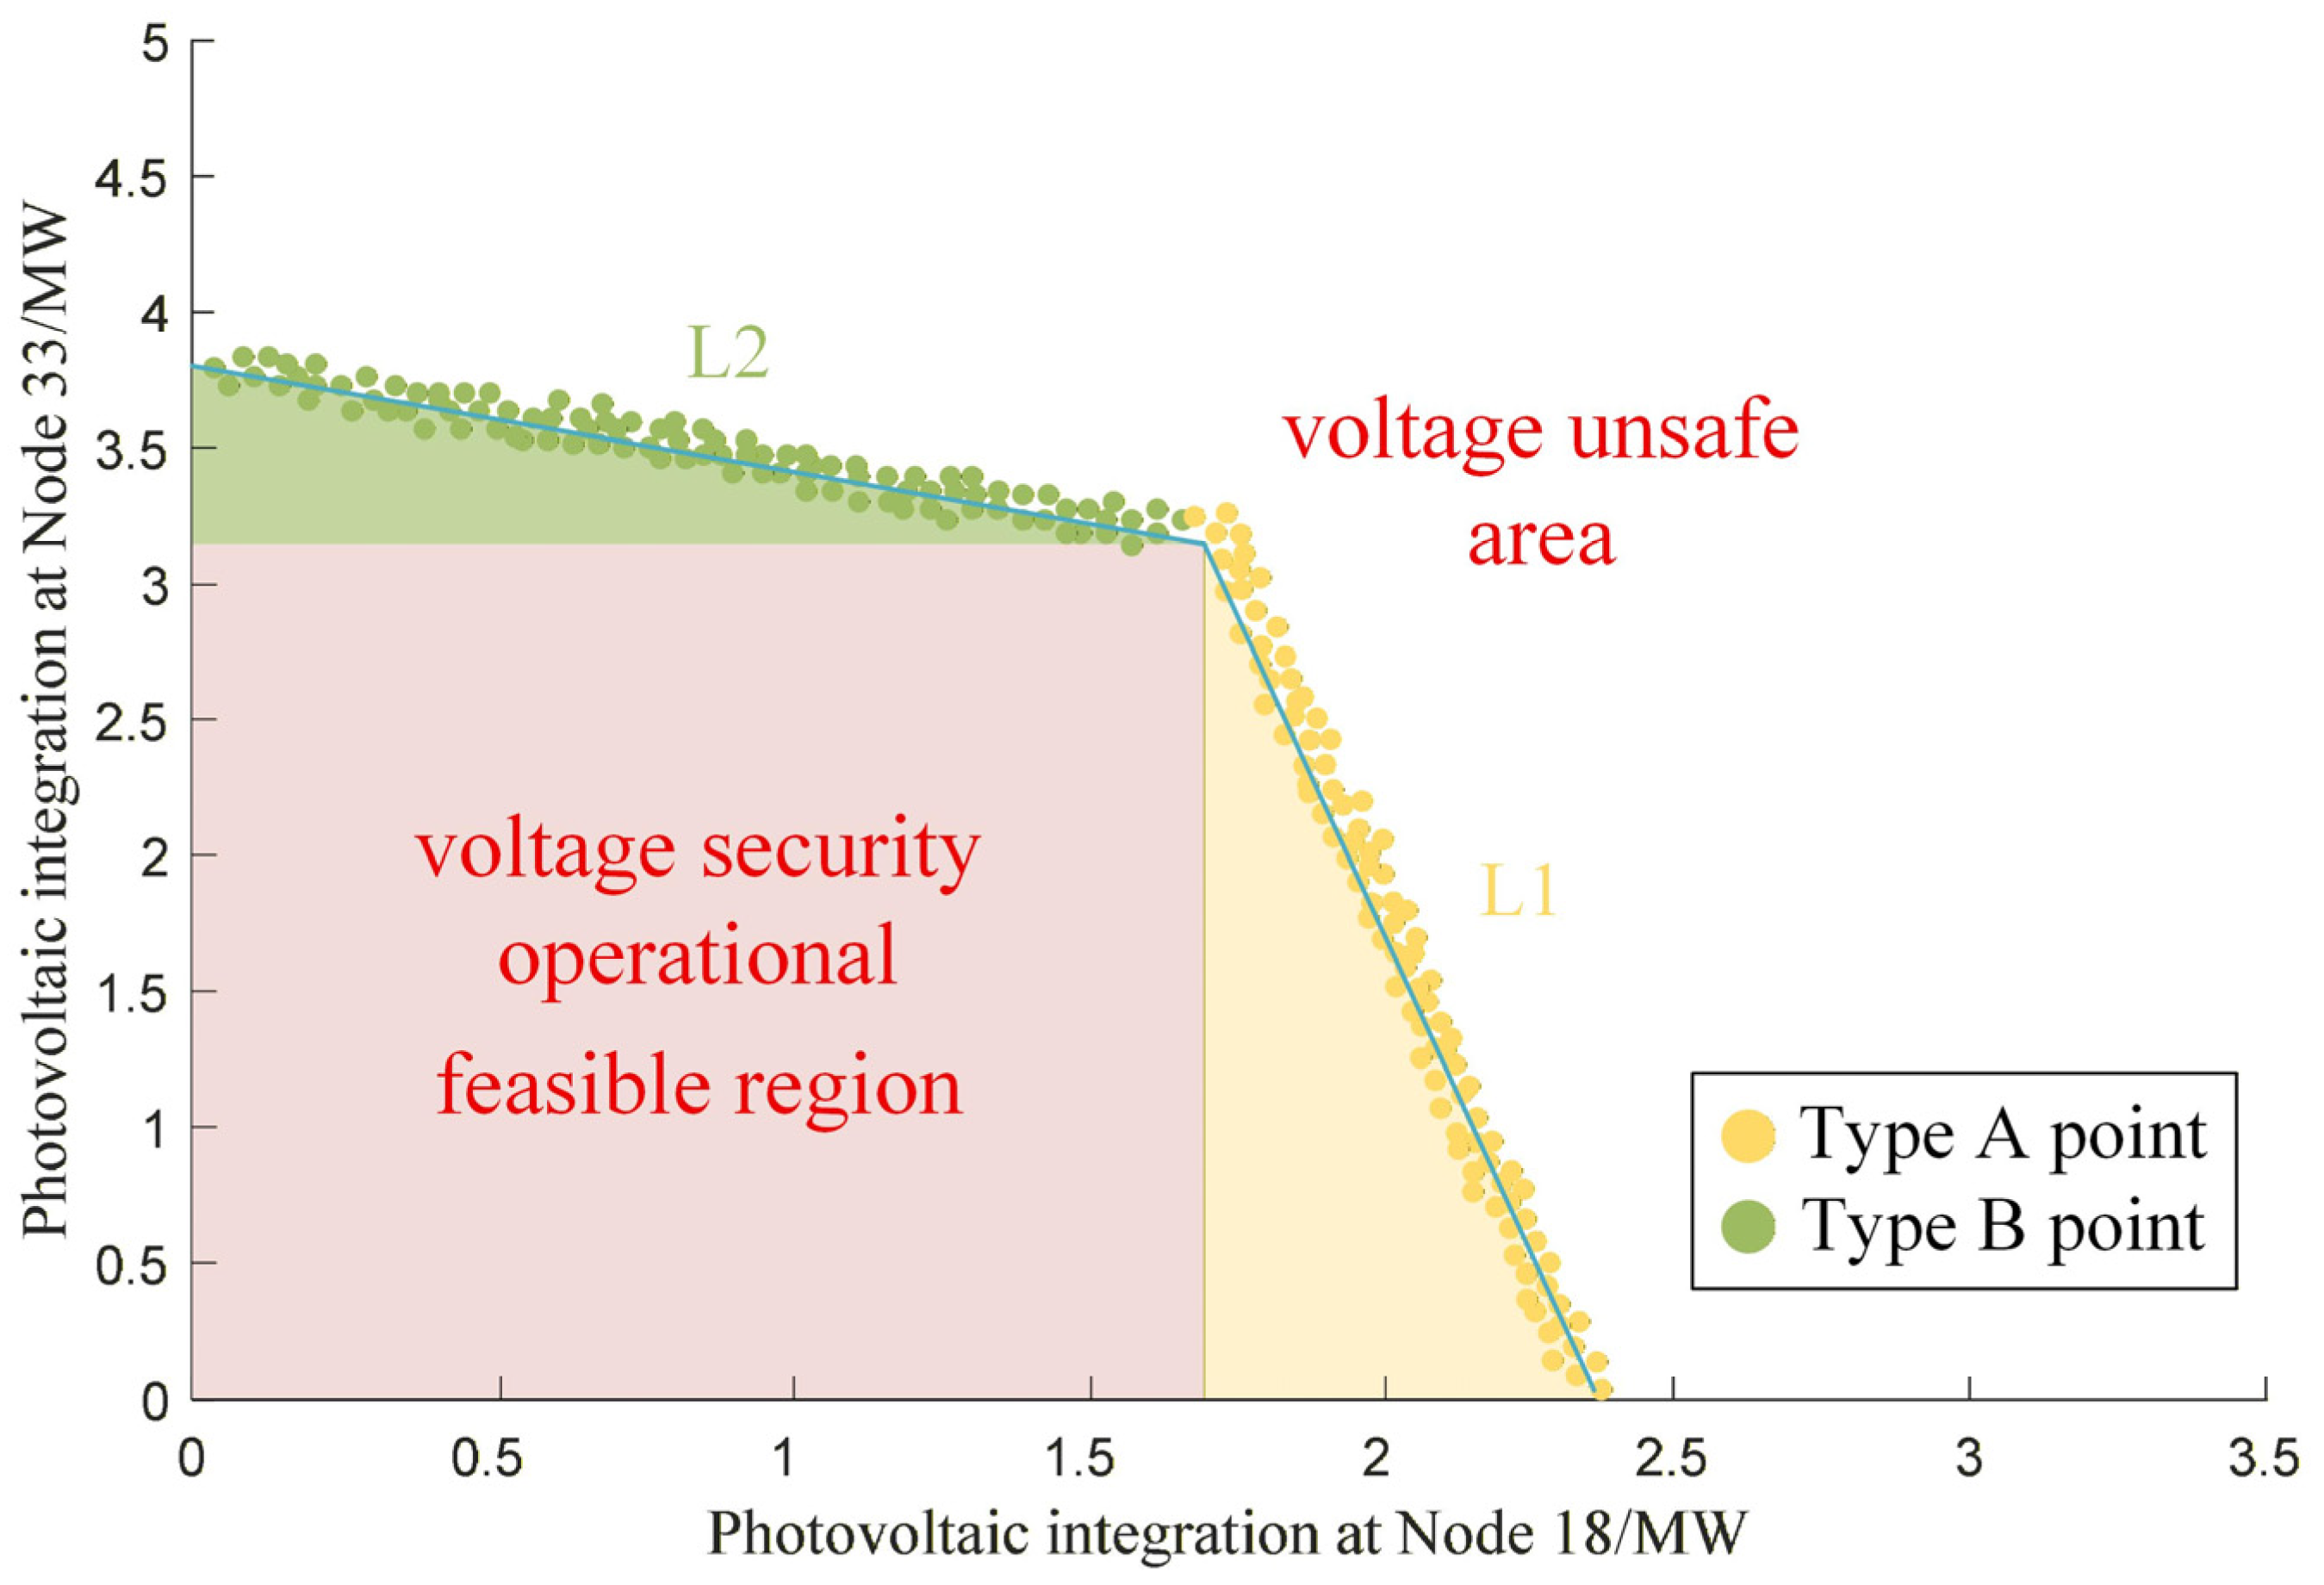
To accurately characterize the feasible region boundary, the aforementioned discrete point set is classified based on the limit-violating node numbers: one category comprises points where the voltage at Node 18 violates the limit first (denoted as Type A points), and the other category comprises points where the voltage at Node 33 violates the limit first (denoted as Type B points). Boundary fitting is performed on the two point sets separately: boundary curve L1 is obtained by fitting Type A points, and boundary curve L2 is obtained by fitting Type B points. The closed region enclosed by the two fitted curves L1 and L2, together with the coordinate axes, represents the two-dimensional voltage security operational feasible region when PV is integrated simultaneously at Nodes 18 and 33, as shown in
Figure 5. This feasible region visually reflects the secure matching relationship between the PV outputs at the two nodes—for example, when the PV injection at Node 18 is 1.5 MW, the maximum secure injection at Node 33 is 3.3 MW.
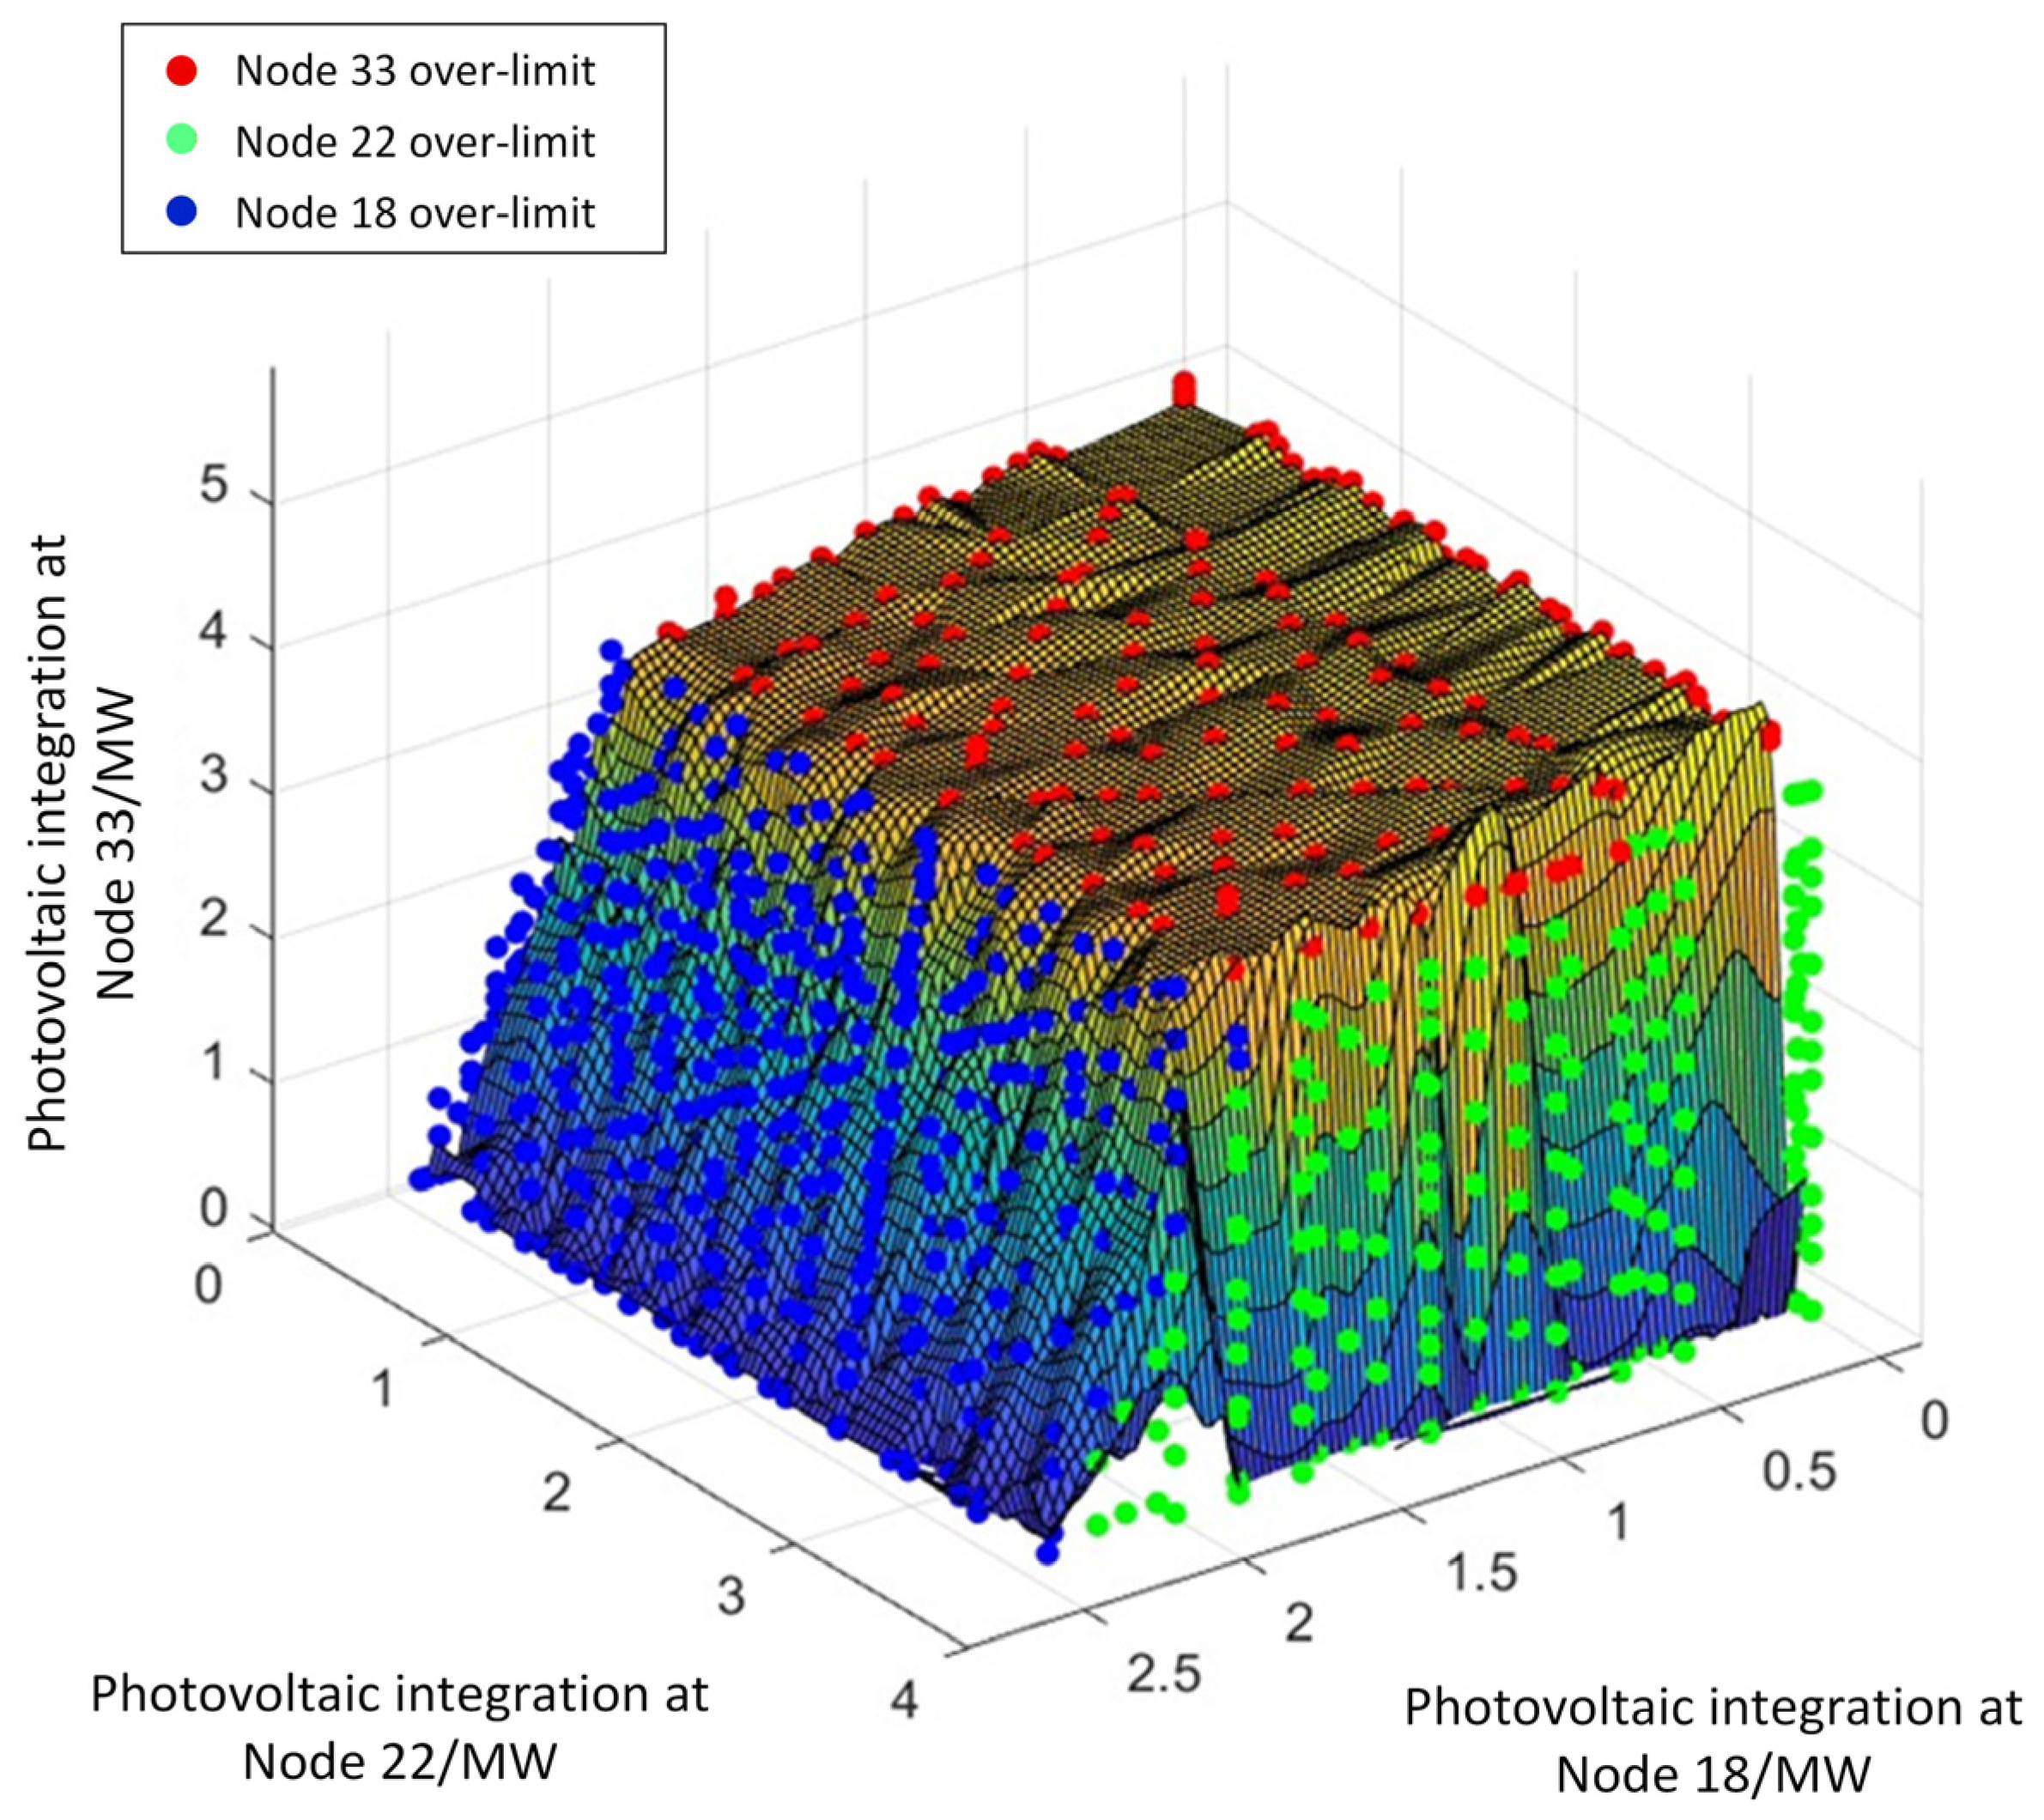
To visualize the voltage security operational feasible region boundary within the distributed generation (DG) injection power space, three end nodes—specifically Nodes 18, 22, and 33—in the IEEE 33-node distribution system are selected for simultaneous DG integration. Various sampled DG injection power directions are input into the limit violation point-oriented holomorphic embedding algorithm, yielding the corresponding voltage limit violation points for each direction. For groups of violation points where two dimensions share identical values, only the point with the smallest value in the third dimension is retained. Interpolation is then applied to the final set of violation points, resulting in the voltage security operational feasible region shown in
Figure 6. The secure operational space of the distribution network after DG integration is defined by the interior of this feasible region, bounded by the limit violation points.
To assess the practicality of the proposed method, we compare the computational time of the proposed Holomorphic Embedding Method (HEM) against the traditional Continuation Power Flow (CPF) method for tracking 1000 voltage limit violation points on the same hardware platform (a workstation with 32 GB RAM and an Intel i7-11800H CPU).
As summarized in
Table 3, the CPF method requires several hours to complete the computation, whereas the proposed HEM completes the same task in only 20 min. This represents a speedup of more than an order of magnitude. The high efficiency of HEM stems from its non-iterative and globally convergent nature. Once the power series coefficients are obtained via the recursive relations, the voltage solution for different embedding factors α can be rapidly evaluated through straightforward series summation, bypassing the iterative solving of nonlinear equations required at each step of the CPF. Moreover, CPF exhibited convergence sensitivity when approaching voltage-collapse regions, whereas the HEM maintained stable convergence for all tested DG injection directions due to its holomorphic formulation.
This result strongly demonstrates that the proposed HEM-based approach is not only theoretically sound but also computationally efficient and of significant practical value, effectively meeting the requirement for rapid operational feasible region analysis in active distribution networks.
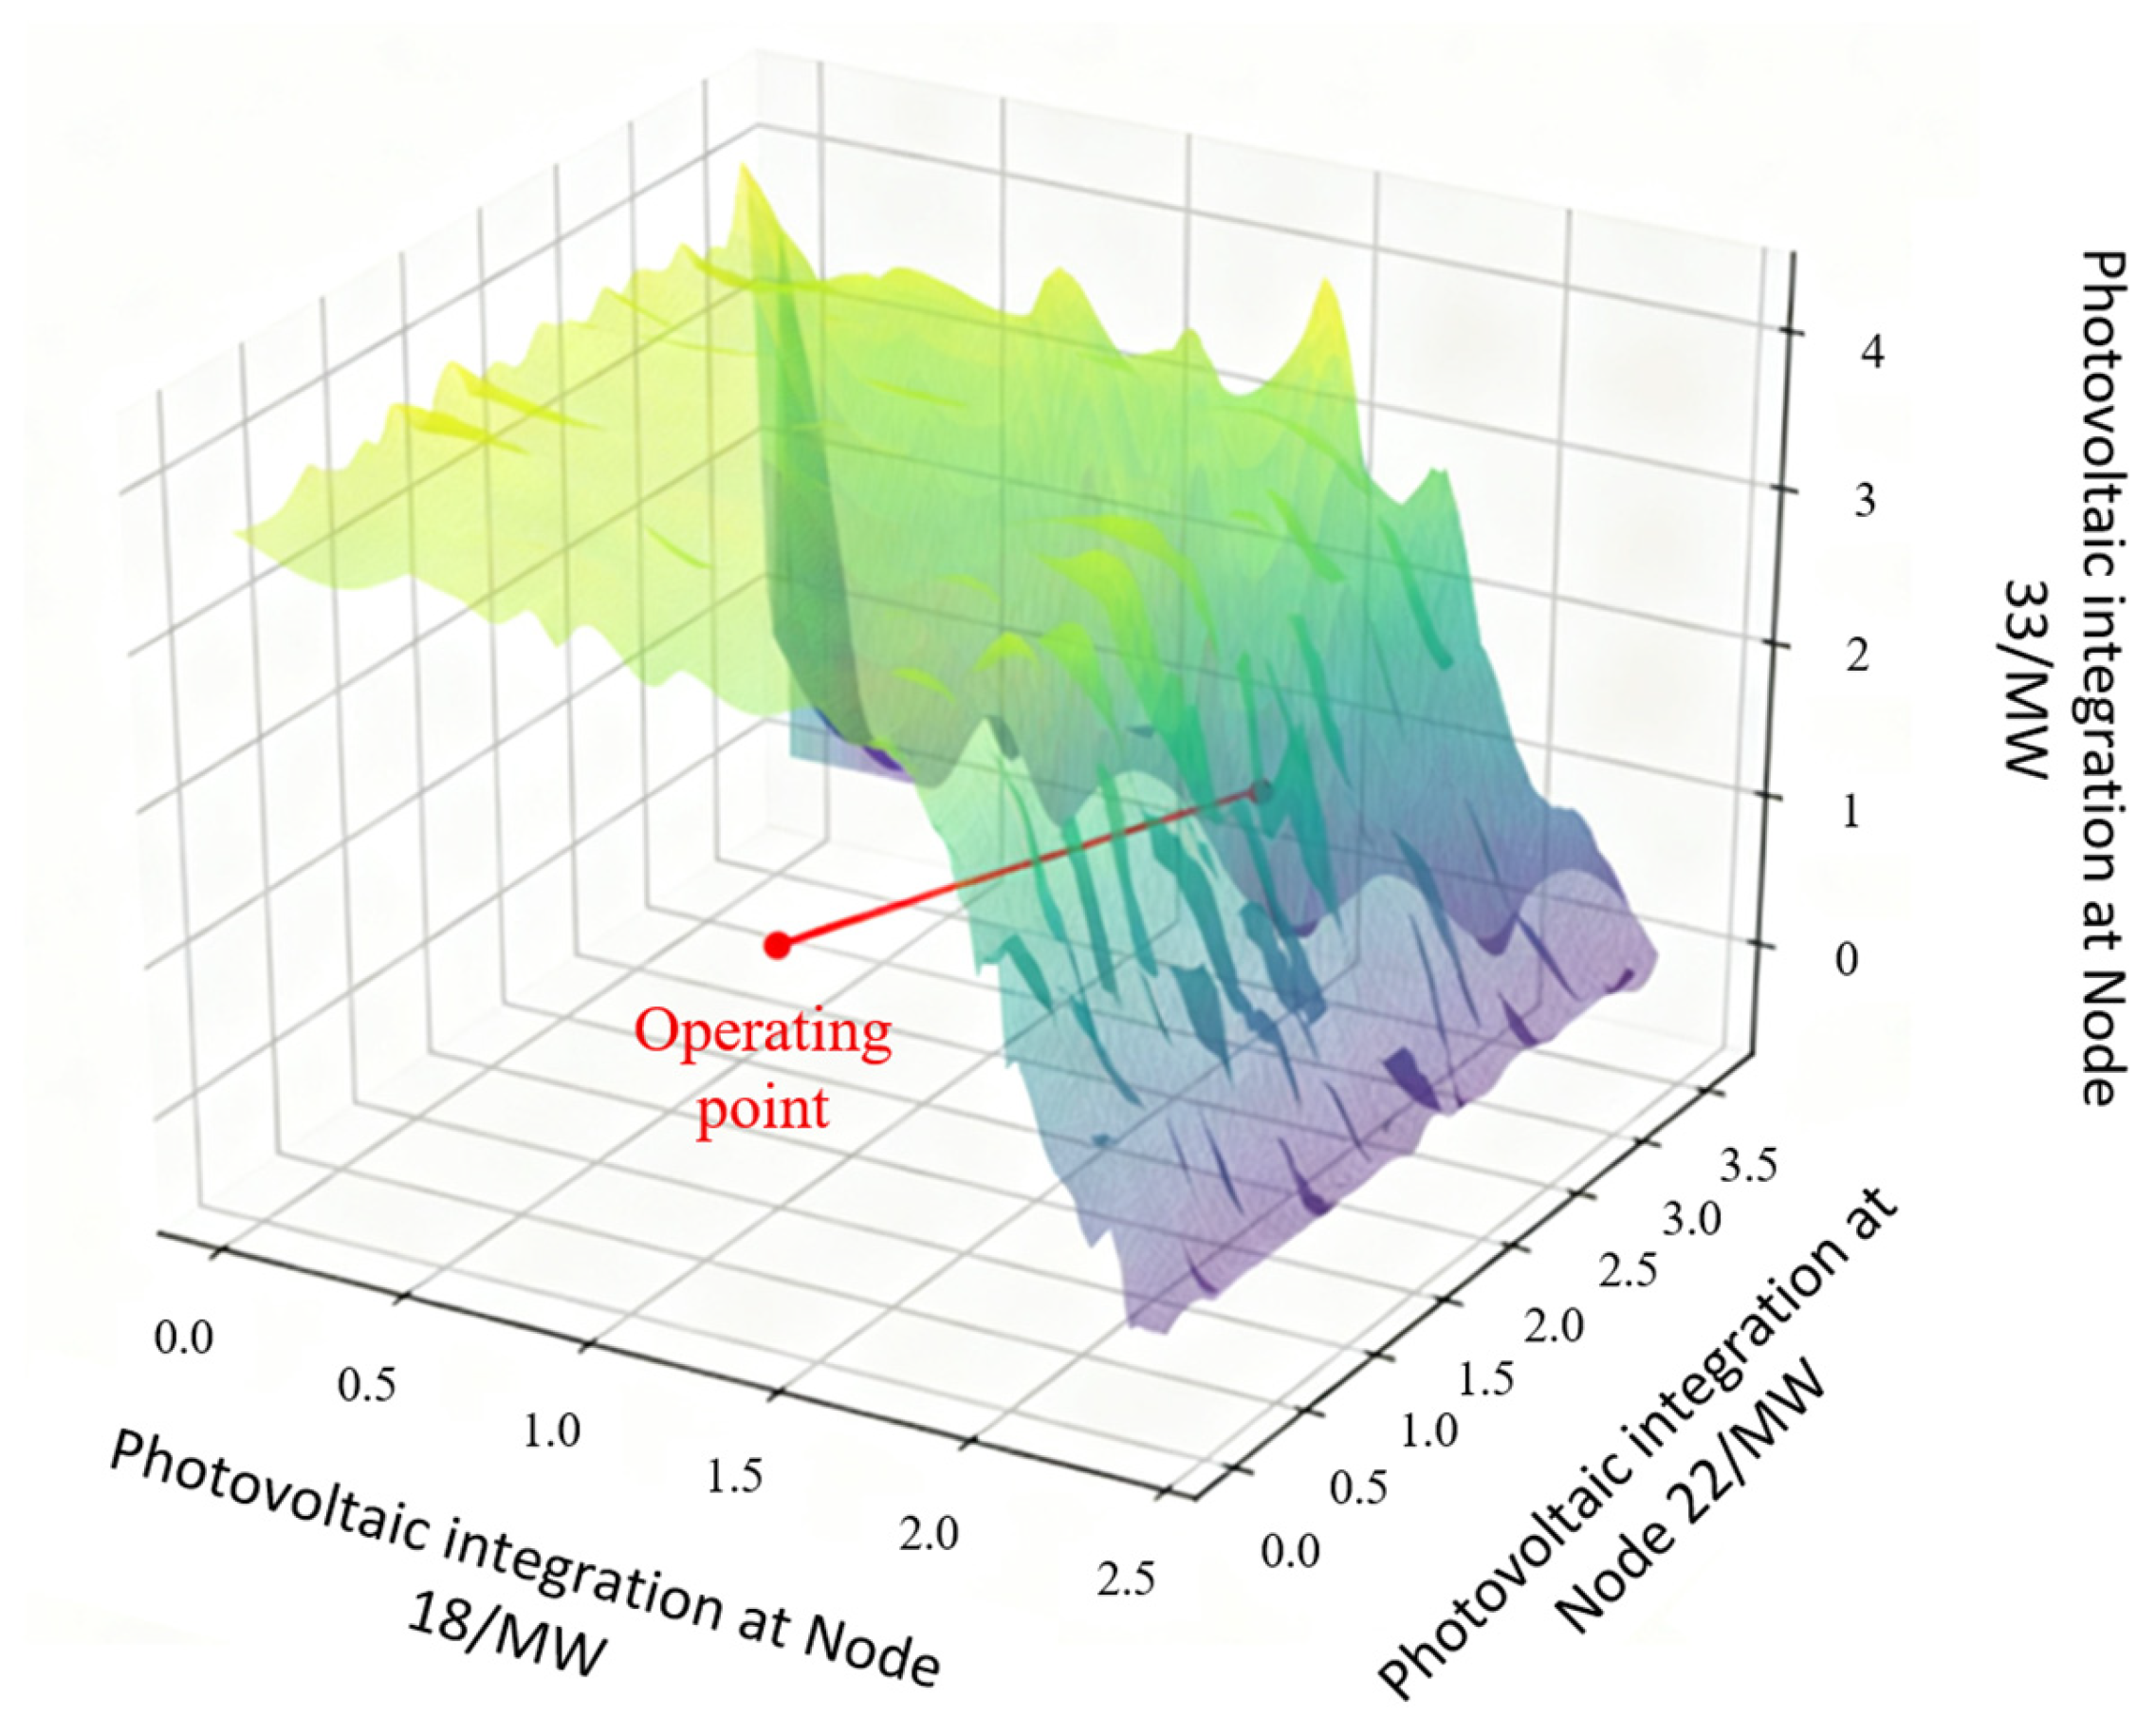
Building on the obtained security operational feasible region, a given DG integration scheme can be further evaluated for security. By examining the positional relationship between the actual operating point of the DG integration scheme and the security operational feasible region, it can be determined whether the scheme would cause voltage limit violations. If the operating point lies within the feasible region, the scheme is considered secure. Furthermore, the spatial distance between the limit point in the direction corresponding to the DG integration scheme and the actual operating point can be calculated as a security margin. This security margin quantifies the remaining PV hosting capacity of the grid. Assuming 1 MW of DG is integrated at each of the three nodes, the results indicate that this DG integration scheme does not cause voltage limit violations, with a security margin of 1.59, as illustrated in
Figure 7.
8. Conclusions
This paper proposes an efficient method for characterizing the operational feasible region of active distribution networks based on the holomorphic embedding algorithm. By leveraging the global convergence and high computational efficiency of the holomorphic embedding method, the proposed approach successfully addresses the computational bottlenecks faced by traditional methods when characterizing high-dimensional feasible regions. The study demonstrates the following:
- (1)
The holomorphic embedding model constructed in this paper for limit violation point tracking incorporates the power injection characteristics of distributed generation (DG) into the holomorphic embedding framework through tailored embedding strategies for different node types. By deriving and solving the recursive power series relations, the model eliminates the dependency on initial values inherent in traditional iterative algorithms and enables continuous tracking from the base power flow solution to voltage limit violation points. Error comparison experiments on the IEEE 33-node system show that the model maintains high computational accuracy under various DG integration schemes, providing a solid foundation for the precise characterization of feasible region boundaries.
- (2)
By constructing a DG injection power space and implementing a directional sampling strategy, the proposed method achieves multidimensional visualization of the operational feasible region for active distribution networks. It efficiently explores different DG integration scenarios and rapidly acquires voltage limit violation point sets in various directions. For both 2D and 3D feasible regions, the security boundaries are clearly delineated through violation point fitting and interpolation, overcoming the limitations of traditional continuation power flow methods, such as low traversal efficiency and vague boundary characterization in high-dimensional scenarios. This offers distribution network planners a concrete reference framework for secure operation.
- (3)
Case studies fully demonstrate the engineering value of the proposed method: when handling the computation of 1000 voltage limit violation points, the holomorphic embedding algorithm requires only 20 min, whereas the traditional continuation power flow method takes several hours, representing a more than tenfold improvement in computational efficiency. Furthermore, the security margin analysis based on the feasible region enables rapid security checks for practical integration schemes and quantifies the remaining hosting capacity, providing actionable decision-making support for the fast and accurate calculation of distributed energy hosting capacity in active distribution networks.
While the proposed method demonstrates significant advantages in computational efficiency and convergence robustness, it is important to acknowledge its limitations, which also point to directions for future research. First, the current model is based on the single-phase balanced assumption, suitable for preliminary screening and planning studies. However, for active distribution networks with severe three-phase unbalance, developing a more precise three-phase holomorphic embedding model to capture inter-phase coupling and nonlinearity represents a critical extension. Second, the current model relies on deterministic load and DG growth directions. Its computational stability and the validity of the identified boundary when directly applied to scenarios with high uncertainty, such as stochastic or dynamic operations, require further assessment and enhancement.
Consequently, in the future, the technical framework of this research can be extended to introduce probabilistic modeling methods to account for time-varying load characteristics and the stochastic nature of distributed generation, thereby constructing dynamic feasible region characterization models with probabilistic security guarantees. It can also be generalized to three-phase unbalanced distribution networks and complex systems involving diverse entities such as energy storage and electric vehicles, enabling more comprehensive security boundary analysis.
Author Contributions
Conceptualization, J.W. and J.Z.; methodology, H.L., H.Z. and G.Z.; software, S.C.; validation, F.L.; formal analysis, J.W. and J.Z.; investigation, H.L.; resources, J.W., J.Z., H.L., H.Z., G.Z., S.C., F.L. and R.M.; data curation, S.C. and R.M.; writing—original draft preparation, S.C.; writing—review and editing, F.L. All authors have read and agreed to the published version of the manuscript.
Funding
The authors declare that this study received funding from the Science and Technology Projects of the State Grid Jilin Electric Power Company Limited (SGJLDK00DWJS2400196). The funder had the following involvement with the study: Provision of study data, computing resources, or other analysis tools.
Data Availability Statement
The original contributions presented in this study are included in the article. Further inquiries can be directed to the corresponding author.
Acknowledgments
The authors would also like to thank the anonymous reviewers for their valuable comments and suggestions to improve the quality of the paper.
Conflicts of Interest
Authors Jiarui Wang, Jiajun Zhang and Haifeng Zhang were employed by the State Grid Jilin Electric Power Research Institute. Author Haitao Lan was employed by the State Grid Jilin Electric Power Company Limited. Author Guicheng Zhang was employed by the State Grid Tonghua Power Supply Company. The remaining authors declare that the research was conducted in the absence of any commercial or financial relationships that could be construed as a potential conflict of interest.
References
- Wang, S.Y.; Luo, F.Z.; Fo, J.C.; Lv, Y.; Wang, C. Two-stage spatiotemporal decoupling configuration of SOP and multi-level electric-hydrogen hybrid energy storage based on feature extraction for distribution networks with ultra-high DG penetration. Appl. Energy 2025, 398, 126438. [Google Scholar] [CrossRef]
- Wang, S.Y.; Luo, F.Z.; Wang, C.S.; Lyu, Y.; Mu, R.; Fo, J.; Ge, L. Collaborative Configuration Optimization of Soft Open Points and Hydrogen-Based Distributed Multi-Energy Stations Considering Spatiotemporal Coordination and Complementarity. J. Mod. Power Syst. Clean Energy 2025, 1–13. [Google Scholar]
- Luo, F.Z.; Wang, S.Y.; Lv, Y.Q.; Mu, R.; Fo, J.; Zhang, T.; Xu, J.; Wang, C. Domain knowledge-enhanced graph reinforcement learning method for Volt/Var control in distribution networks. Appl. Energy 2025, 398, 126409. [Google Scholar] [CrossRef]
- Yin, H.; Chen, C.Q.; Peng, X.G.; Huang, W.K. Study on the Stability of Distributed Power Access to Distributed Network. Northeast. Electr. Power Technol. 2012, 33, 6–10. [Google Scholar]
- Xu, J.J.; Wu, Z.J.; Zhou, L. Robust Dynamic Reconfiguration for Distribution Networks Considering Uncertainty of Distributed Generations. Proc. CSEE 2018, 38, 4715–4725. [Google Scholar]
- Sun, Y.Y.; Cheng, K.Q.; Xu, Q.S.; Li, D.; Li, Y. Identification of weak link for active distribution network considering correlation of photovoltaic output. Autom. Electr. Power Syst. 2022, 46, 96–103. [Google Scholar]
- Fang, Y.C.; Zhang, S.X.; Cheng, H.Z.; Cai, X.W.; Lin, M.X.; Xu, H.H. Robust optimization of distributed photovoltaic hosting capacity of active distribution network with soft open point. Autom. Electr. Power Syst. 2021, 45, 8–17. [Google Scholar]
- Jabr, R.A. Radial distribution load flow using conic programming. IEEE Trans. Power Syst. 2006, 21, 1458–1459. [Google Scholar] [CrossRef]
- Jereminov, M.; Bromberg, D.M.; Pandey, A.; Wagner, M.R.; Pileggi, L. Evaluating Feasibility within Power Flow. IEEE Trans. Smart Grid 2020, 11, 3522–3534. [Google Scholar] [CrossRef]
- Zeng, L.; Chiang, H.D.; Neves, L.S.; Alberto, L.F.C. On the accuracy of power flow and load margin calculation caused by incorrect logical PV/PQ switching: Analytics and improved methods. Int. J. Electr. Power Energy Syst. 2023, 147, 108905. [Google Scholar] [CrossRef]
- Kim, H.T.; Lee, J.; Yoon, M.; Lee, M.-J.; Cho, N.; Choi, S. Continuation Power Flow Based Distributed Energy Resource Hosting Capacity Estimation Considering Renewable Energy Uncertainty and Stability in Distribution Systems. Energies 2020, 13, 4367. [Google Scholar] [CrossRef]
- Weng, Y.; Rajagopal, R.; Zhang, B.S. A Geometric Analysis of Power System Loadability Regions. IEEE Trans. Smart Grid 2020, 11, 3580–3592. [Google Scholar] [CrossRef]
- Ali, M.; Gryazina, E.; Dymarsky, A.; Vorobev, P. Calculating voltage feasibility boundaries for power system security assessment. Int. J. Electr. Power Energy Syst. 2023, 146, 108739. [Google Scholar] [CrossRef]
- Liang, Z.; Yin, X.; Chung, C.Y.; Rayeem, S.K.; Chen, X.; Yang, H. Managing Massive RES Integration in Hybrid Microgrids: A Data-Driven Quad-Level Approach with Adjustable Conservativeness. IEEE Trans. Ind. Inform. 2025, 21, 7688–7705. [Google Scholar] [CrossRef]
- Trias, A. The Holomorphic Embedding Load Flow Method. In Proceedings of the IEEE Power and Energy Society General Meeting, San Diego, CA, USA, 22–26 July 2012. [Google Scholar]
- Rao, S.; Feng, Y.; Tylavsky, D.J.; Subramanian, M.K. The Holomorphic Embedding Method Applied to the Power-Flow Problem. IEEE Trans. Power Syst. 2016, 31, 3816–3828. [Google Scholar] [CrossRef]
- Heidarifar, M.; Andrianesis, P.; Caramanis, M. Holomorphic Embedding Load Flow Method in Three-Phase Distribution Networks with ZIP Loads. IEEE Trans. Power Syst. 2023, 38, 4605–4616. [Google Scholar] [CrossRef]
- Tang, F.; Xie, J.R.; Liu, C.X.; Lin, Z.Y.; Qi, J.F.; Liu, Z.; Deng, H.P. PV Hosting Capacity Evaluation of Distribution Networks Based on Holomorphic Embedding Method. Power Syst. Technol. 2024, 48, 291–303. [Google Scholar]
- Jiang, W.X.; Du, Z.B.; Zhou, W.X.; Lin, X. Photovoltaic hosting capacity assessment of a distributed network based on an improved holomorphic embedding load flow method and stochastic scenario simulation. J. Renew. Sustain. Energy 2024, 16, 023506. [Google Scholar] [CrossRef]
- Li, S.Y.; Tylaysky, D.; Shi, D.; Wang, Z.W. Implications of Stahl’s theorems to holomorphic embedding part I: Theoretical convergence. CSEE J. Power Energy Syst. 2021, 7, 761–772. [Google Scholar]
- DL/T 2041—2019; Technical Guideline for Evaluating Power Grid Bearing Capability of Distributed Resources Connected to Network. National Energy Administration: Beijing, China, 2019.
| Disclaimer/Publisher’s Note: The statements, opinions and data contained in all publications are solely those of the individual author(s) and contributor(s) and not of MDPI and/or the editor(s). MDPI and/or the editor(s) disclaim responsibility for any injury to people or property resulting from any ideas, methods, instructions or products referred to in the content. |
© 2025 by the authors. Licensee MDPI, Basel, Switzerland. This article is an open access article distributed under the terms and conditions of the Creative Commons Attribution (CC BY) license (https://creativecommons.org/licenses/by/4.0/).
