Article

Comparison of Typical Meteorological Years for Assessment and Simulation of Renewable Energy Systems

by
Sebastian Pater
1,* and
Krzysztof Szczotka
2
1
Faculty of Chemical Engineering and Technology, Cracow University of Technology, Warszawska 24, 31-155 Krakow, Poland
2
Department of Power Systems and Environmental Protection Facilities, Faculty of Mechanical Engineering and Robotics, AGH University of Krakow, Al. A. Mickiewicza 30, 30-059 Krakow, Poland
*
Author to whom correspondence should be addressed.
Energies 2025, 18(22), 6063; https://doi.org/10.3390/en18226063
Submission received: 21 October 2025 / Revised: 11 November 2025 / Accepted: 18 November 2025 / Published: 20 November 2025
(This article belongs to the Section B: Energy and Environment)

Abstract

Selecting accurate climatic data is crucial for reliable simulations of Renewable Energy Systems (RESs) and the assessment of building energy performance, particularly under ongoing global climate change. Typical Meteorological Year (TMY) datasets are widely used to represent long-term average weather conditions. However, they may not fully capture regional climatic variability, recent temperature or solar radiation trends, potentially leading to substantial discrepancies in simulation outcomes. Despite the widespread use of TMY and reanalysis datasets, limited studies have systematically compared multiple contemporary meteorological databases in the context of RES simulations across Europe. This study evaluates and compares five meteorological databases—Meteonorm, TMY, TMYx, ERA5, and SARAH3—for twenty European capitals located between 38° and 56° N. A transient model developed in TRNSYS was employed to assess the performance of photovoltaic and solar collector systems with different datasets. The results reveal significant differences between datasets, with deviations reaching up to 200–300 kWh/m2 in annual total horizontal radiation and 40–50% in simulated useful energy gains. PV efficiency remained relatively stable across Europe (17.7–18.7%) with very low standard deviation (<0.12%), while SC efficiency showed higher variability (25.8–28.7%). The findings demonstrate that the choice of climatic database can substantially influence energy yield predictions, technical optimization, thereby introducing significant uncertainty into the economic bankability assessment of renewable energy projects, especially in Central and Northern Europe, where climatic variability is more pronounced. The study emphasizes the need for careful database selection and periodic validation of TMY datasets in the context of evolving climatic conditions to ensure accurate, risk-aware, and future-proof energy system simulations.

1. Introduction

RESs play a critical role in addressing some of the most pressing global challenges of the 21st century, including mitigating climate change, energy security, and sustainable development. Unlike fossil fuels, renewable energy sources—such as solar, wind, hydro, biomass, and geothermal—are naturally replenished and produce little to no greenhouse gas emissions. By harnessing these sources, we can reduce dependence on finite, carbon-intensive energy and move toward a cleaner, more resilient energy future [1]. RESs help decarbonize electricity generation, transportation, and heating, offering scalable solutions to cut emissions across all sectors.
Accurate simulation of RESs is crucial for proper design, investment planning, and operational efficiency. However, this process is quite challenging due to the frequent changes in local weather conditions, which must be known because they constitute input data for the calculations. Moreover, in this regard, the weather data used in the simulations can be a source of uncertainty due to its significant impact on the model’s predictions [2]. Available weather data are not always reliable and representative of actual weather conditions in a given area due to constant changes in weather patterns, poor weather station maintenance, erroneous instrument readings or inaccurate data digitization and post-processing [2]. The selection of appropriate weather files is crucial for accurate model predictions.
The interannual variability of meteorological conditions is often ignored in favor of single-year data sets for modelling of RES projects and evaluating their economic aspects [3]. The development of reference years based on actual observed meteorological data, typically 30-year-long, started in the 1980s [4]. To model long-term energy performance, simulation tools often use Typical Meteorological Year (TMY) datasets—synthetic weather files constructed from historical data to represent average climatic conditions [5].
TMY has been widely used as input to the plant model, for example, in photovoltaic (PV) and concentrating solar technologies [6]. This datasets are commonly generated following the ISO 15927-4 methodology, Sandia method or derived procedures [7]. They typically require at least 10 years of hourly time series meteorological data and apply different weighting metrics to select the most typical of each calendar month, which are joined to form a complete TMY file [8]. They eliminate the issues arising from incomplete raw datasets, for instance, caused by measurement outages and maintenance of sensors, but what is important to emphasize does not capture the variability and extremes of actual weather years [7]. In fact, several studies have quantified the impact of using a single TMY versus a full multi-year dataset, highlighting potential discrepancies in building load and system performance calculations [9].
Various studies have been conducted to provide accurate meteorological data for energy systems simulations. In the paper [7], Ernst and Gooday highlighted the issue of obtaining high-quality solar radiation data with wide geographic coverage. They have developed a methodology for generating TMY data with much higher temporal resolution using gap-filling methods to get photovoltaic system performance modelling data. In the study [4], Seyed et al. suggested a TMY-generating method fully based on long-term energy simulations to eliminate uncertainty with the weighting factor determination. They increased the speed and accuracy of energy simulation estimations compared to the conventional method that provides TMY from hourly values. Bigtashi et al. in [10] proposed a flexible, data-driven method for generating TMY weather files. The presented approach was adapted to various climates and datasets by selecting generation parameters based on statistical analysis and clustering techniques. This enhanced the accuracy and representativeness of TMY files, which are crucial for reliable building energy simulations and climate-responsive design. Costanzo et al. in [11] focused on generating new TMY datasets tailored to the Mediterranean climate, specifically for different locations in Sicily. The authors compared the updated TMY datasets to assess their impact on building energy simulations, showing significant differences in heating and cooling demands. The study highlighted the importance of using localized and up-to-date weather data to improve the accuracy of energy performance assessments. The article [12] examined the differences between using a TMY and actual multi-year solar radiation data for the location in central Poland. The study analyzed solar resource variability and evaluated how well TMY data represents long-term solar conditions. Results indicated that while TMY provided a simplified overview, it did not capture the full variability of solar energy potential, which could affect the accuracy of solar energy system simulations. Shibo Gai et al. in [13] evaluated different methods for generating TMY data tailored to the marine climate of China. The authors compared several statistical approaches, analyzing their accuracy in representing long-term weather patterns for reliable building energy simulations. The study concluded that the choice of TMY generation method significantly affected simulation outcomes, emphasizing the need for method selection based on local climate characteristics. Rudniak in [14] compared locally measured solar radiation parameters with data from different TMY files in Poland and found significant differences between them. This highlights the ongoing global effort to establish reliable, localized TMYs using various statistical approaches [15].
As can be seen, in the last several years there has been intensive research into the development of accurate methods related to obtaining a representative TMY. Despite this fact, in the case of RES studies, researchers still do not attach much importance to meteorological input data for calculations. A study on a hybrid solar-biomass heating system for rural households in cold regions of China was discussed in [16]. The authors presented a multi-parameter optimization strategy over the full life cycle to achieve optimal energy performance and economy of the hybrid system. However, it briefly touched on the meteorological data of the TMY without presenting what period they refer to. Research on multi-objective optimization of control strategies and equipment parameters for a combined geothermal and solar heating system in cold and arid regions was discussed in [17]. In the study, a building model with two heating strategies was developed in TRaNsient SYStems Simulation (TRNSYS) 18 software focusing on maximizing solar energy utilization, heat pump COP and minimizing ground heat load. The study period included only a dozen selected days, which do not reflect typical weather conditions. The authors used data that they briefly, without details, described in article.
In a publication [18] released in 2025 about long-term performance simulation analysis of solar-assisted borehole thermal energy storage combined with a heat pump heating system, the authors used data from the Meteonorm 8 database for the years 1996–2015 in their calculations. As can be seen, these data were over 10 years old and did not include recent years. Whereas in a study [19] authors used meteorological data provided by the Photovoltaic Geographical Information System (PVGIS) model [20] from 2023 to 2024 for simulation of heat pump with heat storage and PV system. The article [21] investigated the performance of a hybrid heating system combining a ground source heat pump, parabolic solar collector, and phase change material heat storage. Through simulations and experiments, the study compared different configurations to evaluate their energy efficiency, thermal performance, and operational stability. While the authors emphasize the importance of accurate weather data, they do not specify the source of the data used in their calculations. This tendency to overlook data validation is also apparent in other advanced simulation studies on system optimization. For instance, ref. [22] presents a detailed optimization of a hybrid thermal storage system. The source, time period, and justification for the selected weather data are not specified, undermining reproducibility. Similarly, the analysis in [23] focuses exclusively on the control strategy of a solar-assisted heat pump system, treating the climatic input data as a fixed “black box” rather than a variable subject to uncertainty. This pattern, also evident in [24,25,26], highlights a common gap where the sophistication of the simulation model is not matched by the scrutiny applied to its most critical input data. Modelling heating demands in a Chinese-style solar greenhouse using the transient building energy simulation model in TRNSYS has been presented in [27]. In their publication, the authors of the work used a current weather database TMY from the Canadian weather year for energy calculation covering several years before the calculations were performed.
A critical review of the existing literature reveals that insufficient attention has been devoted to the selection, characterization, and validation of climatic input data used in the simulation of RES. In many studies, the meteorological data sources are either inadequately documented or entirely omitted, which hinders reproducibility and comparability of the obtained results. This methodological gap undermines the credibility of simulation-based assessments and limits the transferability of conclusions across different climatic contexts. Furthermore, the coexistence of multiple meteorological databases introduces an additional layer of uncertainty. Variations in data generation methodologies, temporal coverage, spatial resolution, and statistical processing can substantially influence the outcomes of energy yield simulations.
Furthermore, in the context of ongoing global climate change, the concept of a ‘typical’ year based on historical data is increasingly being questioned. Recent studies emphasize that older TMYs, even those based on long time series, may no longer accurately represent current or future operational conditions due to evident warming trends and shifts in solar radiation patterns. Consequently, they fail to reflect the emerging “new normal” climate [28]. Updated datasets are therefore essential, as climate projection studies show that TMYs based solely on historical data are no longer suitable for designing climate-resilient buildings and systems [29].
While many studies perform basic sensitivity analysis, formal uncertainty quantification—which systematically propagates the uncertainty from the meteorological inputs themselves through to the final energy yield and financial metrics—remains a methodological gap in many applied RES assessments [28]. This is a critical omission, as the building performance simulation community has long recognized that input data uncertainty is a primary driver of the “performance gap” between designed and actual energy use [30].
Although TMY are widely adopted in both research and practice, comprehensive and systematic comparative analyses of their impact on RES performance predictions remain limited. Moreover, many studies fail to clearly specify or validate their climatic input data, which raises concerns regarding the reproducibility and credibility of their findings. Therefore, this study aims to evaluate and compare multiple meteorological databases for selected European locations to quantify their impact on the simulated performance of PV and SC systems. The findings are expected to provide valuable insights into the sensitivity of energy yield predictions to climatic input data and to highlight the importance of appropriate database selection for accurate, risk-aware, and future-oriented design and assessment of RES. The presented results aim to fill the identified research gap by quantifying the sensitivity of energy yield estimations to climatic input data and establishing guidelines for the informed selection of meteorological datasets in future RES modeling and techno-economic assessments.

2. Materials and Methods

2.1. Research Area and Data Sources

This study utilizes historical meteorological data for the analyzed cities in Europe, encompassing at least 14 years of measurements. The dataset includes hourly values of key parameters relevant to the assessment and simulation of RES, such as air temperature, global solar radiation (and its components), relative humidity, and wind speed. Five meteorological data repositories, each representing different input data period, were examined. Information on four of these databases is summarized in Table 1, where abbreviated names are introduced to facilitate data analysis and improve clarity in subsequent figures and discussions.
Five meteorological databases were selected to capture the heterogeneous range of data sources used in energy systems simulation. The selection was structured to represent distinct categories of data origin and processing: (1) a historical baseline reflecting 20th-century climate normals (Meteonorm V5.0); (2) modern, widely used satellite-derived (SARAH3) and reanalysis (ERA5) datasets available on open-source platforms; (3) contemporary ground-station-derived TMY files using recent data (TMYx); and (4) traditional, long-term TMY files based on the longest available local measurements (TMY). The explicit goal is to compare the simulation outcomes resulting from these varied, real-world data choices, rather than to perform a normalized intercomparison of TMY generation methodologies. Additionally, the selection of the databases was intentional and guided by their proven reliability, broad availability, methodological diversity, and established use in solar energy and climate modeling studies. Repositories enable a comprehensive assessment of TMY file generation methods based on data obtained through distinct acquisition and processing approaches.
Meteonorm is a global meteorological database and calculation tool that provides comprehensive climatological interpolated data for solar energy applications, including the simulation of a wide range of heating and cooling systems for engineering design, environmental research, agriculture, forestry, and other fields. In Meteonorm V5.0 (2003) most of the data is taken from the Global Energy Balance Archive, from the World Meteorological Organization Climatological Normals from years 1961–1990, as well as high-quality datasets from various national meteorological services [31]. This data repository (similarly to other databases) is generated stochastically, which means it is not representative of a specific historical year.
Although newer Meteonorm releases include updated climate normals reflecting recent trends, this specific historical version (V5) was intentionally selected to serve as a critical baseline representing older (1961–1990) climatological normals. This period is significant as it largely precedes the most accelerated phase of recent global climate change, making it an ideal historical reference for this analysis. This choice is methodologically crucial. Without a historical reference point, it would be difficult to quantify the extent of changes driven by recent climatic trends. A comparison confined to contemporary datasets would highlight methodological differences (e.g., satellite vs. reanalysis) but overlook the broader impact of the underlying climate shift.
The name of the database PVGIS-SARAH3 comes from the words PhotoVoltaic Geographical Information System (PVGIS)—SurfAce Radiation DAtaset Heliosat (SARAH), and it is generated by the European Organisation of Meteorological Satellites Climate Monitoring Satellite Application Facility [20,32]. The SARAH3 is based on instruments on board the series of Meteosat geostationary satellites, also accompanied and temporally extended by the Interim Climate Data Record. The concept of SARAH3 includes the generation and provision of a temporally stable and very consistent climate data record based on high-quality and homogeneous input data. More information about this database can be found in the article [32].
ERA5 is the climate reanalysis dataset from the European Centre for Medium- range Weather Forecast, featuring a finer spatial grid of 31 km, hourly time resolution, and an increase in the amount of data assimilated [33]. More information about this database and comparison with SARAH3 can be found in [33,34].
TMYx meteorological data repository is derived from several public sources for generating data into the EnergyPlus Weather (EPW) file format using the TMY/ISO 15927-4:2005 methodologies [35]. These data covered the shortest period considered, which was 14 years.
The data analysis was conducted for 20 European capitals located between latitudes 38° and 56°, for which the necessary input data for the simulations were available, as presented in Table 2. This table also includes information on the fifth database used in the analyses—the TMY dataset. For each capital city, the TMY input data covered the longest available time period (but no shorter than 65 years), which varied by location, ranging from 67 years (for Madrid) to 92 years (for Prague and Warsaw). For example, the dataset for Warsaw was compiled using information from the Institute of Meteorology and Water Management of the Polish Ministry of Infrastructure and Development and spans 25 years more than that for Madrid.
SARAH3 and ERA5 repositories were specifically chosen for assessment and simulation of renewable energy systems as they represent advanced and complementary methodologies for obtaining solar and meteorological parameters. SARAH3 delivers high-resolution, satellite-derived surface radiation data, which is particularly valuable for solar resource assessment across Europe. Conversely, ERA5 combines satellite and in situ observations within a physically consistent assimilation framework, offering superior temporal and spatial continuity. The joint use of these datasets allows for a robust cross-validation between satellite-based and model-based data under varying climatic conditions.
Alternative products, such as COSMO-REA6, were excluded due to their limited geographical coverage (restricted to Central Europe) and reduced accessibility, which hinders their applicability in multi-regional analyses. Furthermore, the restricted public availability of TMY-formatted data derived directly from certain reanalysis datasets further constrained their inclusion. In contrast, SARAH3 and ERA5 are readily accessible, widely validated, and extensively used in international research, providing a robust methodological and comparative foundation for the present analysis. Furthermore, the direct comparison of satellite (SARAH) and reanalysis (ERA5) products is a key research topic, as their underlying methodologies can lead to different results, particularly in areas with specific geographical features [36].

2.2. System Configuration in TRNSYS

To evaluate the individual databases in terms of their suitability for simulating RES, a transient installation model was developed in Simulation Studio within the TRNSYS 18 environment. TRNSYS is a graphical software used to analyze the dynamic behavior of transient systems, particularly those involving RESs [37]. Thanks to its flexibility and extensive library of predefined components—called Types—TRNSYS enables accurate modeling of complex systems and efficient execution of parallel analyses [38]. A graphic representation of part of the developed installation, together with the components used in TRNSYS, is shown in Figure 1. The dashed and solid lines represent connections between the variable outputs of one component and the variable inputs of another. The simulation calculation was performed for a period of one year. More detailed information about TRNSYS and components presented in Figure 1 can be found in [39].
The main components of the installation are the solar collectors (SCs), represented by Type539, and the PV panels installation (Type103b-2). Type539 is a flat-plate SCs model featuring capacitance and flow modulation. Type103b-2 models the electrical performance of 30 mono-PV panels (58.59 m2 total area), yielding a nominal maximum power of 12 kW. The PV model primarily accounts for the effect of temperature on module efficiency. However, it neglects other influential factors, such as spectral variations in solar radiation, soiling losses associated with precipitation frequency, and the cooling influence of wind. Incorporating these effects could further amplify the differences observed in simulation outcomes across various meteorological databases. Additional data about system components are provided in Table 3.
Type539 is connected to Type156, a fluid-filled, constant-volume storage tank with an immersed coiled-tube heat exchanger. This component models a cylindrical, vertically oriented tank with a volume of 0.3 m3 and a surface heat loss coefficient of 0.5 W/(m2K). The tank is divided into 10 isothermal nodes to simulate thermal stratification.
The daily domestic hot water demand was modeled using the Type14b component, assuming a total consumption of 160 L per day, distributed as 80 L in the early morning and 80 L in the evening. When the desired domestic hot water temperature of 45 °C was not achieved, an auxiliary boiler (Type 122) was activated to supply heat to storage tank, with a nominal thermal output of 4 kW. The operation of the auxiliary boiler was restricted using the Type14h component, disabling its function between 06:00 and 19:00 to ensure priority operation of the SCs system during daytime. The SCs and pump were controlled by a differential controller (Type 2b), in which the upper dead-band value (ΔT) was set to 5 K to improve responsiveness. The developed model reflects a configuration typical of domestic solar-assisted heating systems widely used in Central and Northern Europe [37,40], for example, in Poland, comprising SCs system with a conventional gas boiler.

2.3. Annual Optimum Tilt Angle

In the conducted studies, it was necessary to determine the optimal inclination angle β opt for devices utilizing solar radiation at different latitudes L . For this purpose, quadratic regression polynomials equation derived from the EnergyPlus database, as proposed in [33], were applied [41]:
β o p t = p 0 L 3 + p 1 L 2 + p 2 L + p 3
where p 0 = 0, p 1 = −0.005366, p 2 = 0.9815; p 3 = 2.479. The results of the calculations are summarized in Table 4. The calculated value of β opt was within the range 29.5–38.5°.

3. Results and Discussion

3.1. Annual Total Horizontal Radiation

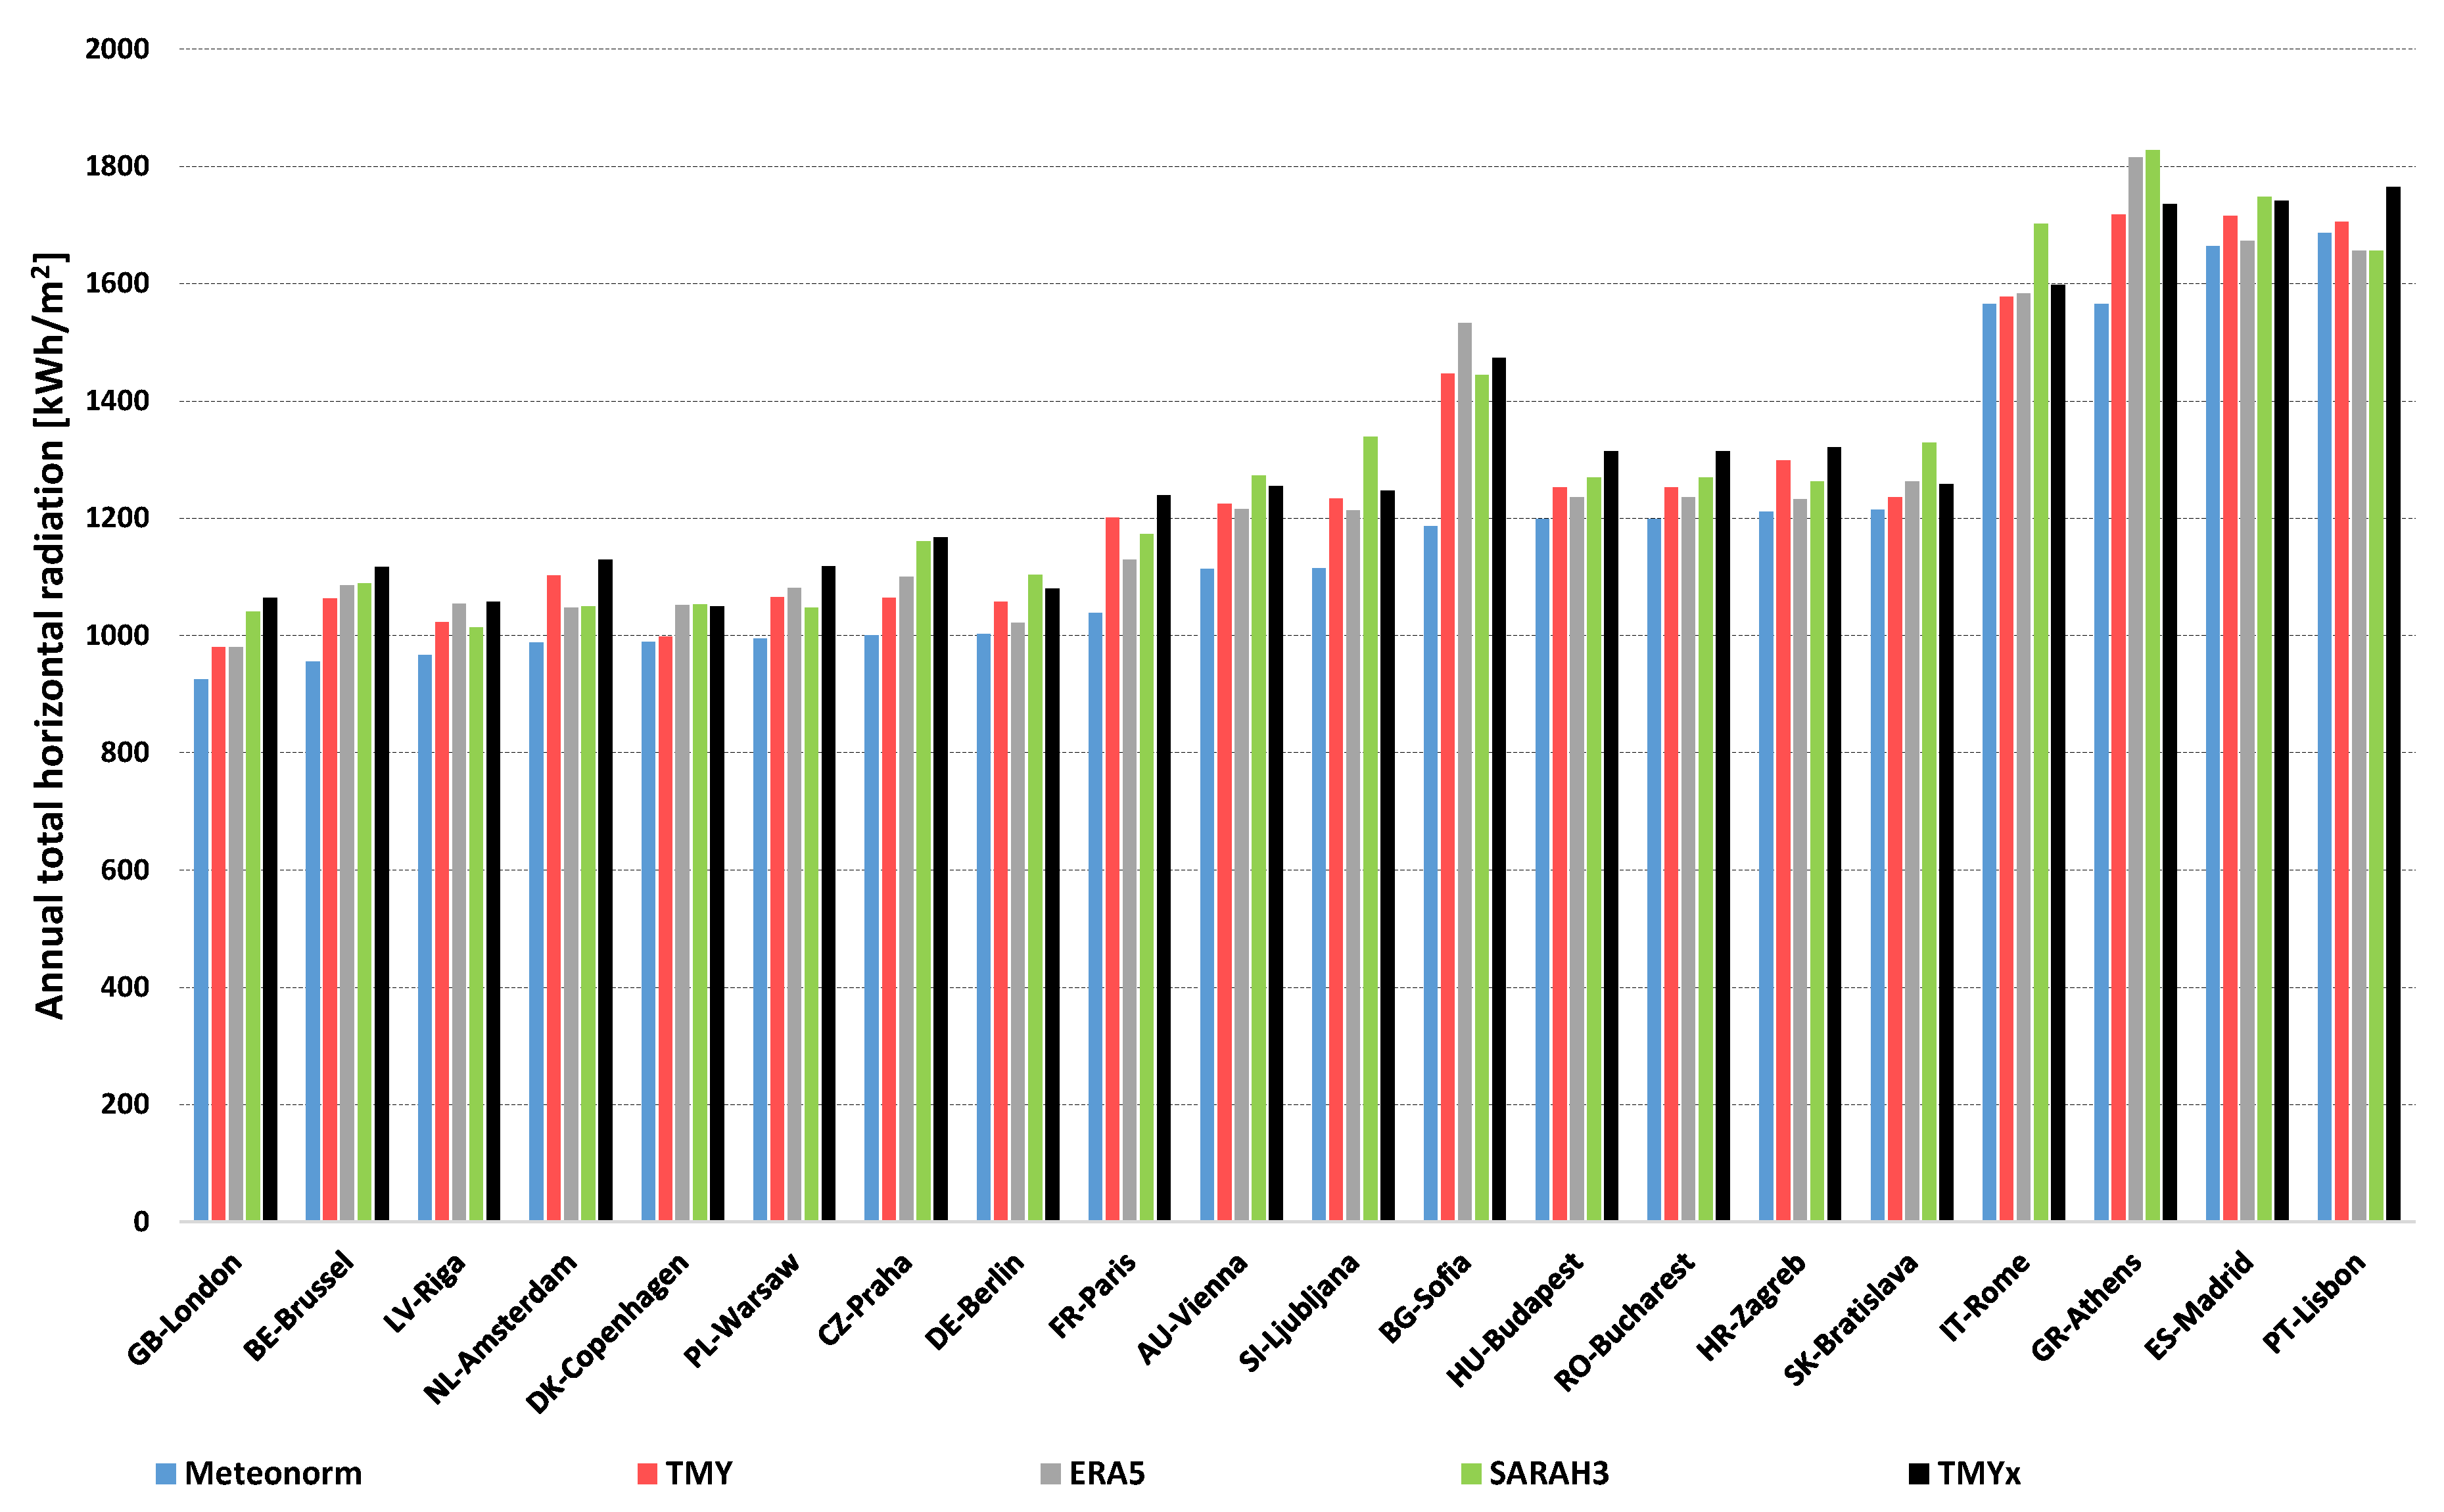
Figure 2 shows the annual sums of total horizontal radiation for different locations in Europe based on five different sources: Meteonorm, TMY, ERA5, SARAH3, and TMYx. Meteorological data for the capitals of 20 European countries were selected for the analysis. The results are ranked relative to the Meteonorm database. It is evident that locations in southern Europe (e.g., Madrid, Athens, Lisbon) exhibit significantly higher annual radiation values, exceeding 1600 kWh/m2. The highest values are observed in Athens, where data from SARAH3 and TMYx even exceed 1800 kWh/m2. In contrast, cities located in northern Europe, such as Copenhagen, Amsterdam, and Riga, show lower values, around 1000–1200 kWh/m2. Among the analyzed capitals, London records the lowest solar radiation. Cities situated at similar latitudes (e.g., Amsterdam, Berlin, Warsaw) display comparable levels of solar radiation.
When comparing data from different meteorological repositories, noticeable discrepancies can be observed, which may significantly affect the technical and economic analyses of projects utilizing solar energy (Figure 2). For each city, the lowest solar radiation values were obtained from the Meteonorm database (Table 5). In contrast, data from the SARAH3 and TMYx repositories generally show higher solar radiation levels, particularly for southern European locations such as Athens, Rome, and Madrid. This can be attributed to differences in data acquisition methods. For instance, the SARAH3 database relies on satellite-derived radiation measurements, which tend to represent weather conditions in high-irradiance regions with greater accuracy owing to the enhanced capability of satellites to detect cloud cover. Conversely, ERA5 data, derived from meteorological reanalysis models, can average and “smooth out” local extremes, leading to more conservative (lower) estimates. While this may reflect a more conservative estimation approach, it can also lead to an underestimation of the actual solar energy potential.
The differences between meteorological data sources are substantial, reaching up to 200–300 kWh/m2 per year in some locations (Figure 2 and Table 5). The largest discrepancies, approaching 30%, were observed for Sofia, and around 20% for Ljubljana and Paris. In contrast, for Rome, the results from the four databases were relatively consistent. A considerably small spread of values was also found in Central and Eastern European cities such as Warsaw, Bratislava and Bucharest.
Another important observation is that the Meteonorm and TMY databases, which cover the longest time periods, yield noticeably lower results compared to the other sources (Figure 2). In contrast, the SARAH3, ERA5, and TMYx datasets, representing the last 15–19 years, generally report higher solar radiation values. It is also noteworthy that even between SARAH3 and ERA5, which cover the same measurement years, differences of several percents in annual total horizontal radiation are observed.
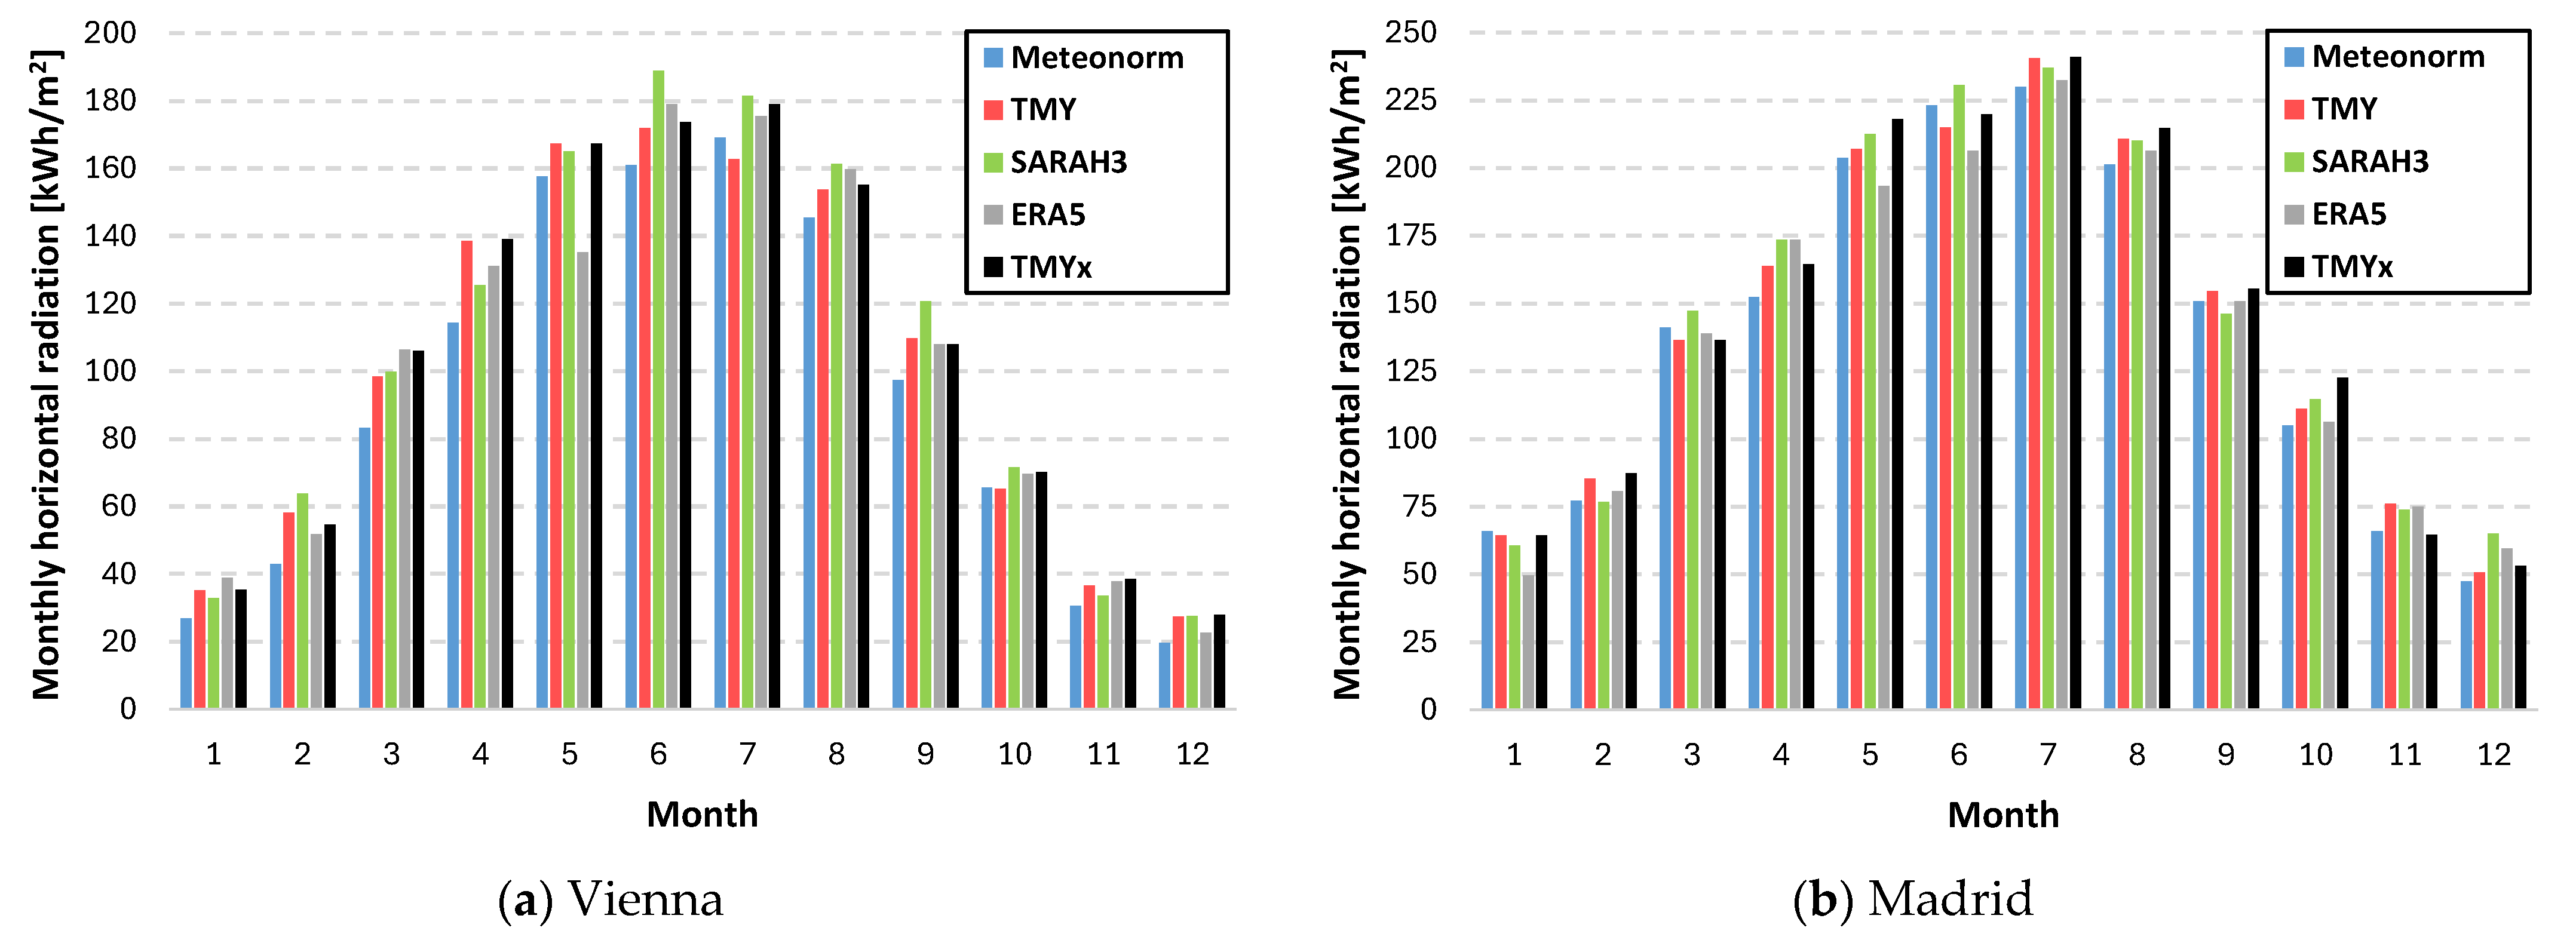
Extremely valuable insights into the variability of meteorological data and the resulting differences in monthly horizontal radiation can be drawn from the data analysis presented in Figure 3 and Figure 4 for selected cities. In general, all repositories show a consistent seasonal pattern, with maximum radiation during the summer months (June–July) and minimum values during winter (December–January). However, noticeable quantitative differences between repositories can be observed, particularly during the transitional months (March–April and September–October) when solar radiation can change rapidly. For Riga, Warsaw and Vienna in January, February, October, November, and December, the difference between the results from individual databases is relatively small. This is likely due to the lower levels of solar radiation during these periods, corresponding to the winter months with limited solar exposure. Such findings are particularly important for short-term analyses—such as monthly or seasonal evaluations—because the observed discrepancies can significantly affect system performance and energy yield estimates.
In the case of Madrid (Figure 4b), the monthly horizontal radiation profiles obtained from the different datasets show a fairly good level of agreement throughout the year, with only minor deviations between the repositories. All datasets capture the characteristic Mediterranean solar pattern, with a gradual increase in radiation from January to a peak in June–July, followed by a steady decline toward December.
Among the datasets (Figure 4b), SARAH3 and TMYx generally report slightly higher monthly irradiation values compared to Meteonorm and ERA5, particularly during the summer months. This may be attributed to the higher spatial resolution and improved cloud detection algorithms in the satellite-based SARAH3 database, which can better represent local radiative conditions under clear-sky dominance. The relatively small discrepancies between datasets for Madrid suggest that, in regions with a stable and dry Mediterranean climate, the uncertainty related to the choice of meteorological source is less significant than in northern or continental climates.

3.2. Annual Average Ambient Temperature

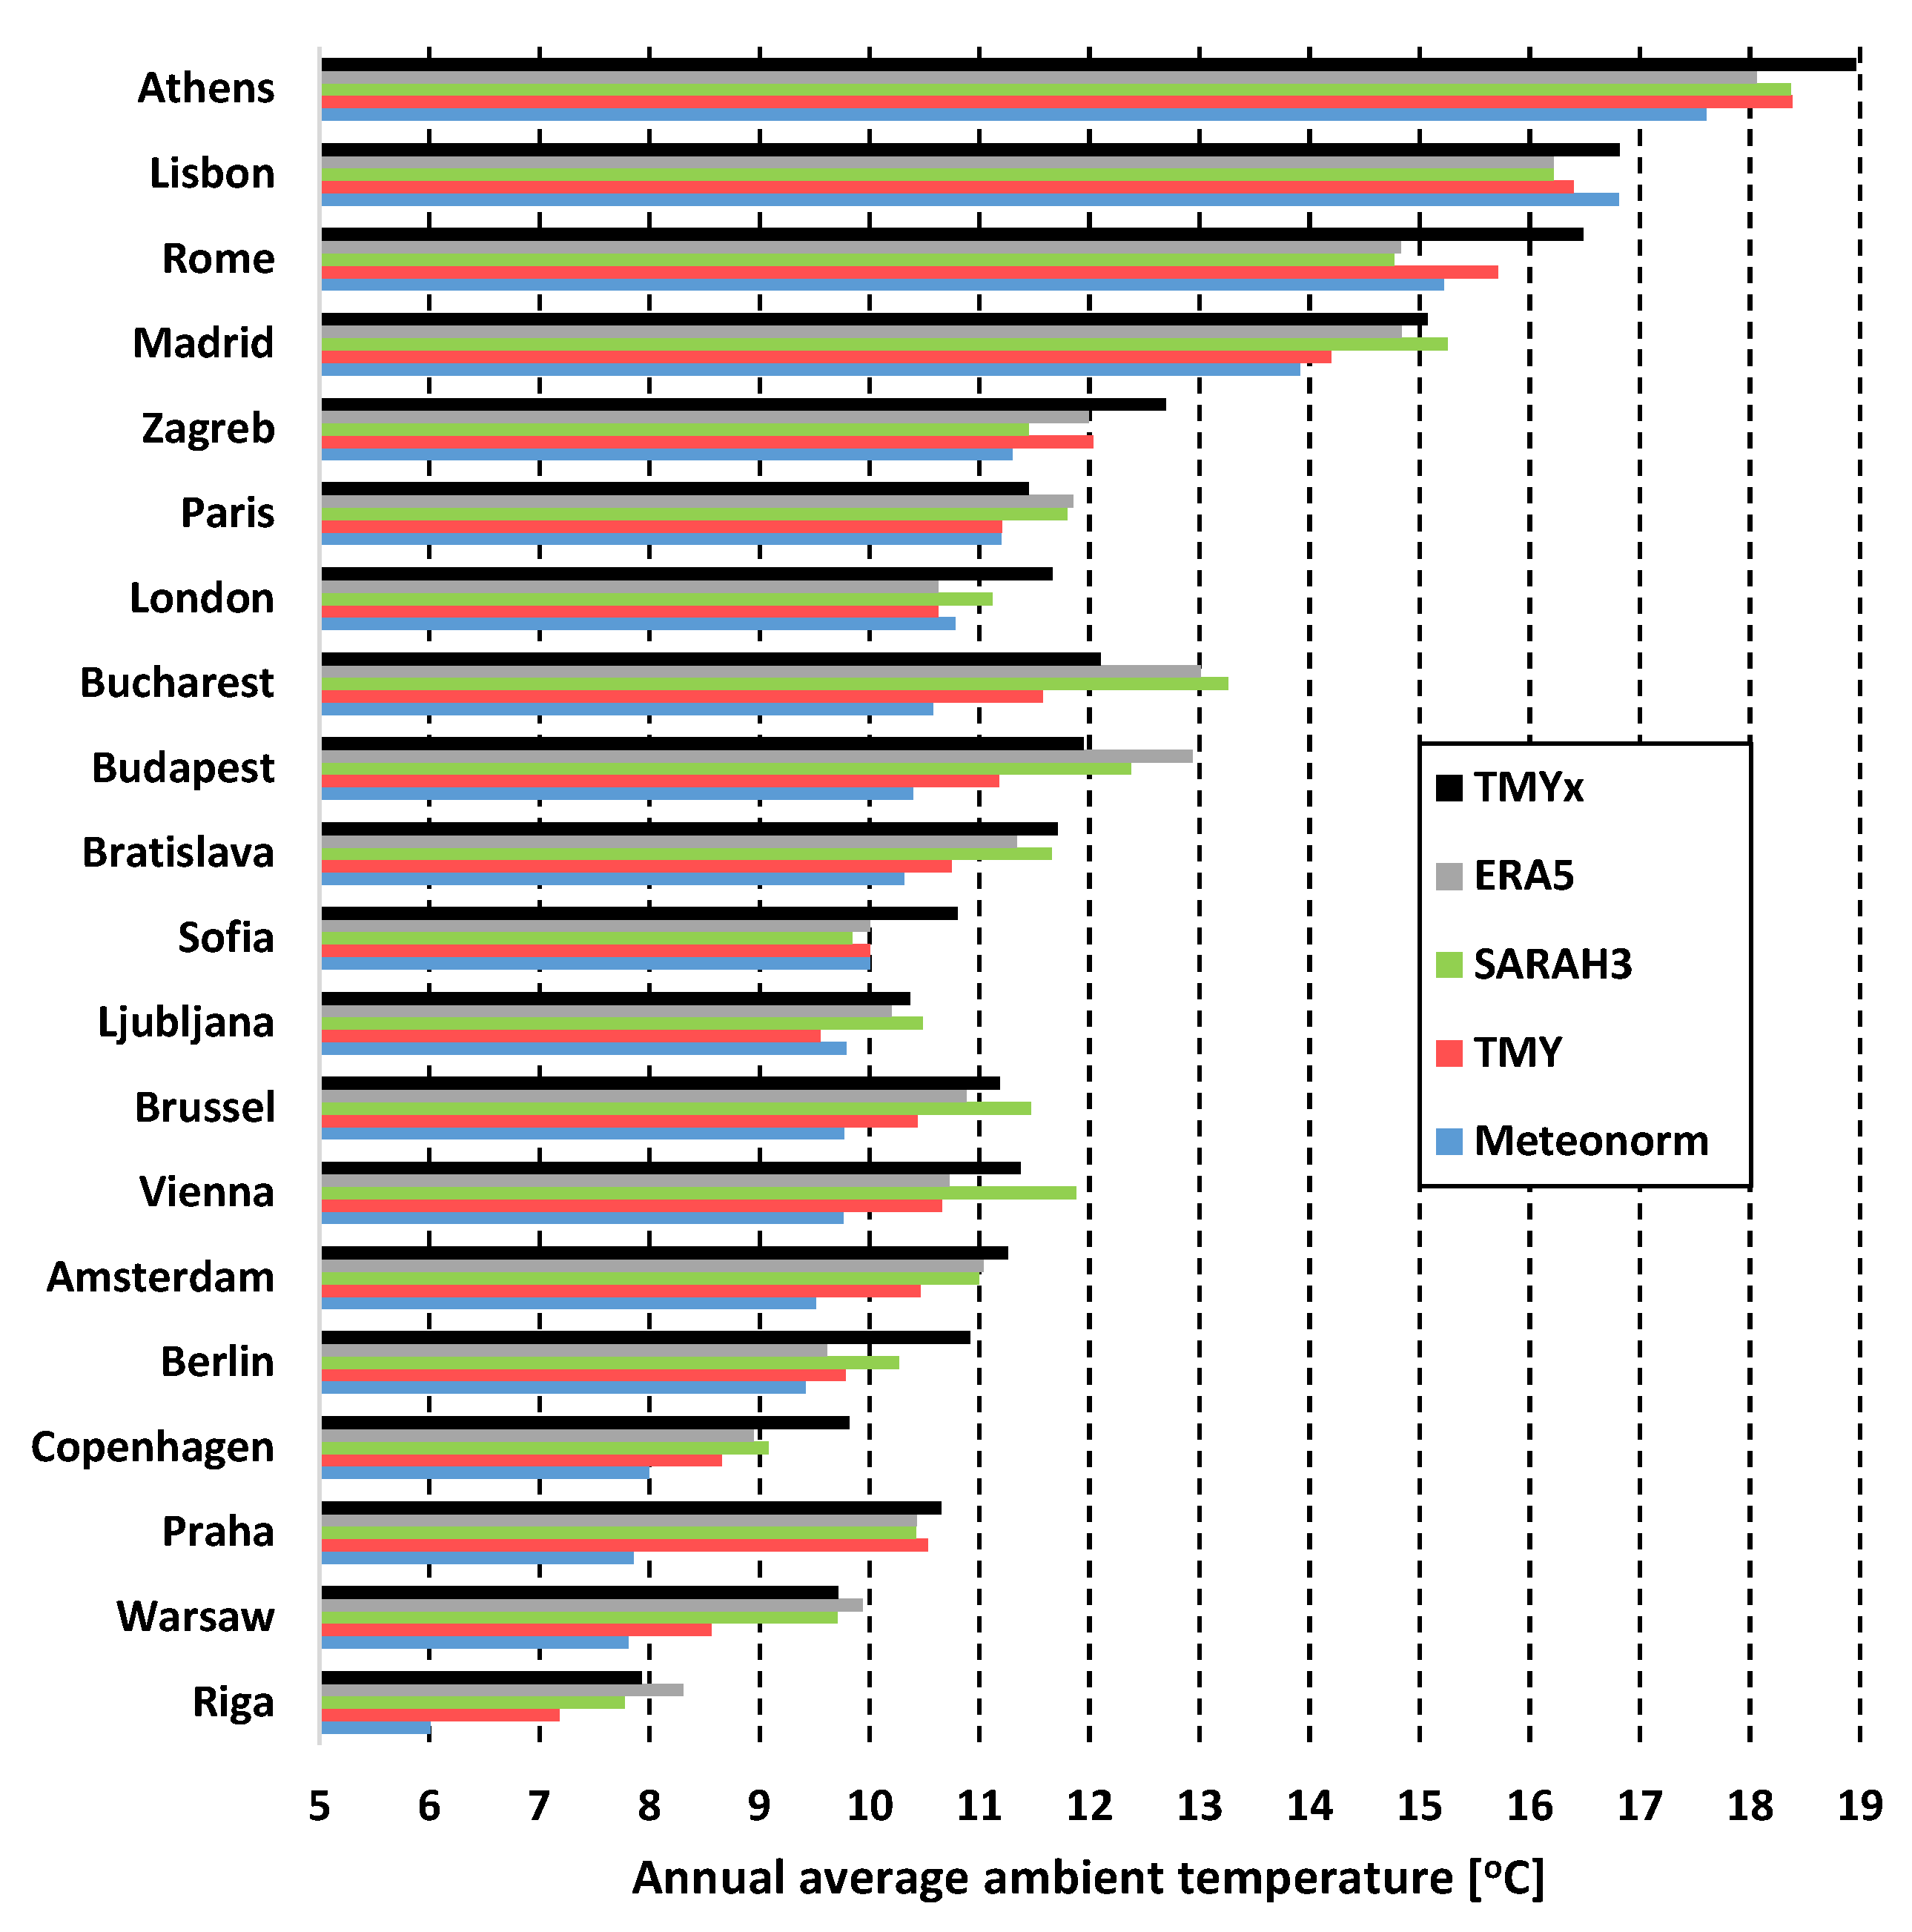
An important parameter in the assessment and simulation of RESs is the annual average ambient (dry-bulb) temperature. This parameter influences, among other factors, heat losses in thermal energy storage tanks, heat dissipation through equipment casings and piping, and consequently the efficiency of SCs installations as well as the performance of air-source heat pumps. Figure 5 presents a comparison of the average annual ambient temperatures for selected European cities, ranked from the warmest (Athens) to the coldest (Riga) according to the results from the Meteonorm database.
Noticeable temperature differences of up to several degrees are observed between the datasets (Figure 5). In most cases, the lowest average temperatures were obtained from the Meteonorm database (with exceptions such as Lisbon, Rome, London, Sofia, and Ljubljana), whereas the highest values were generally reported by the TMYx database. Differences between databases covering the same time period were also examined. The discrepancies between the ERA5 and SARAH3 datasets were relatively small, not exceeding 0.6 °C for most locations. The only notable exception was Vienna, where the difference reached 1.15 °C. Much larger deviations were observed when comparing the maximum and minimum values among all analyzed meteorological databases, with differences ranging from 0.6 °C (for Lisbon) to as high as 2.8 °C (for Prague).
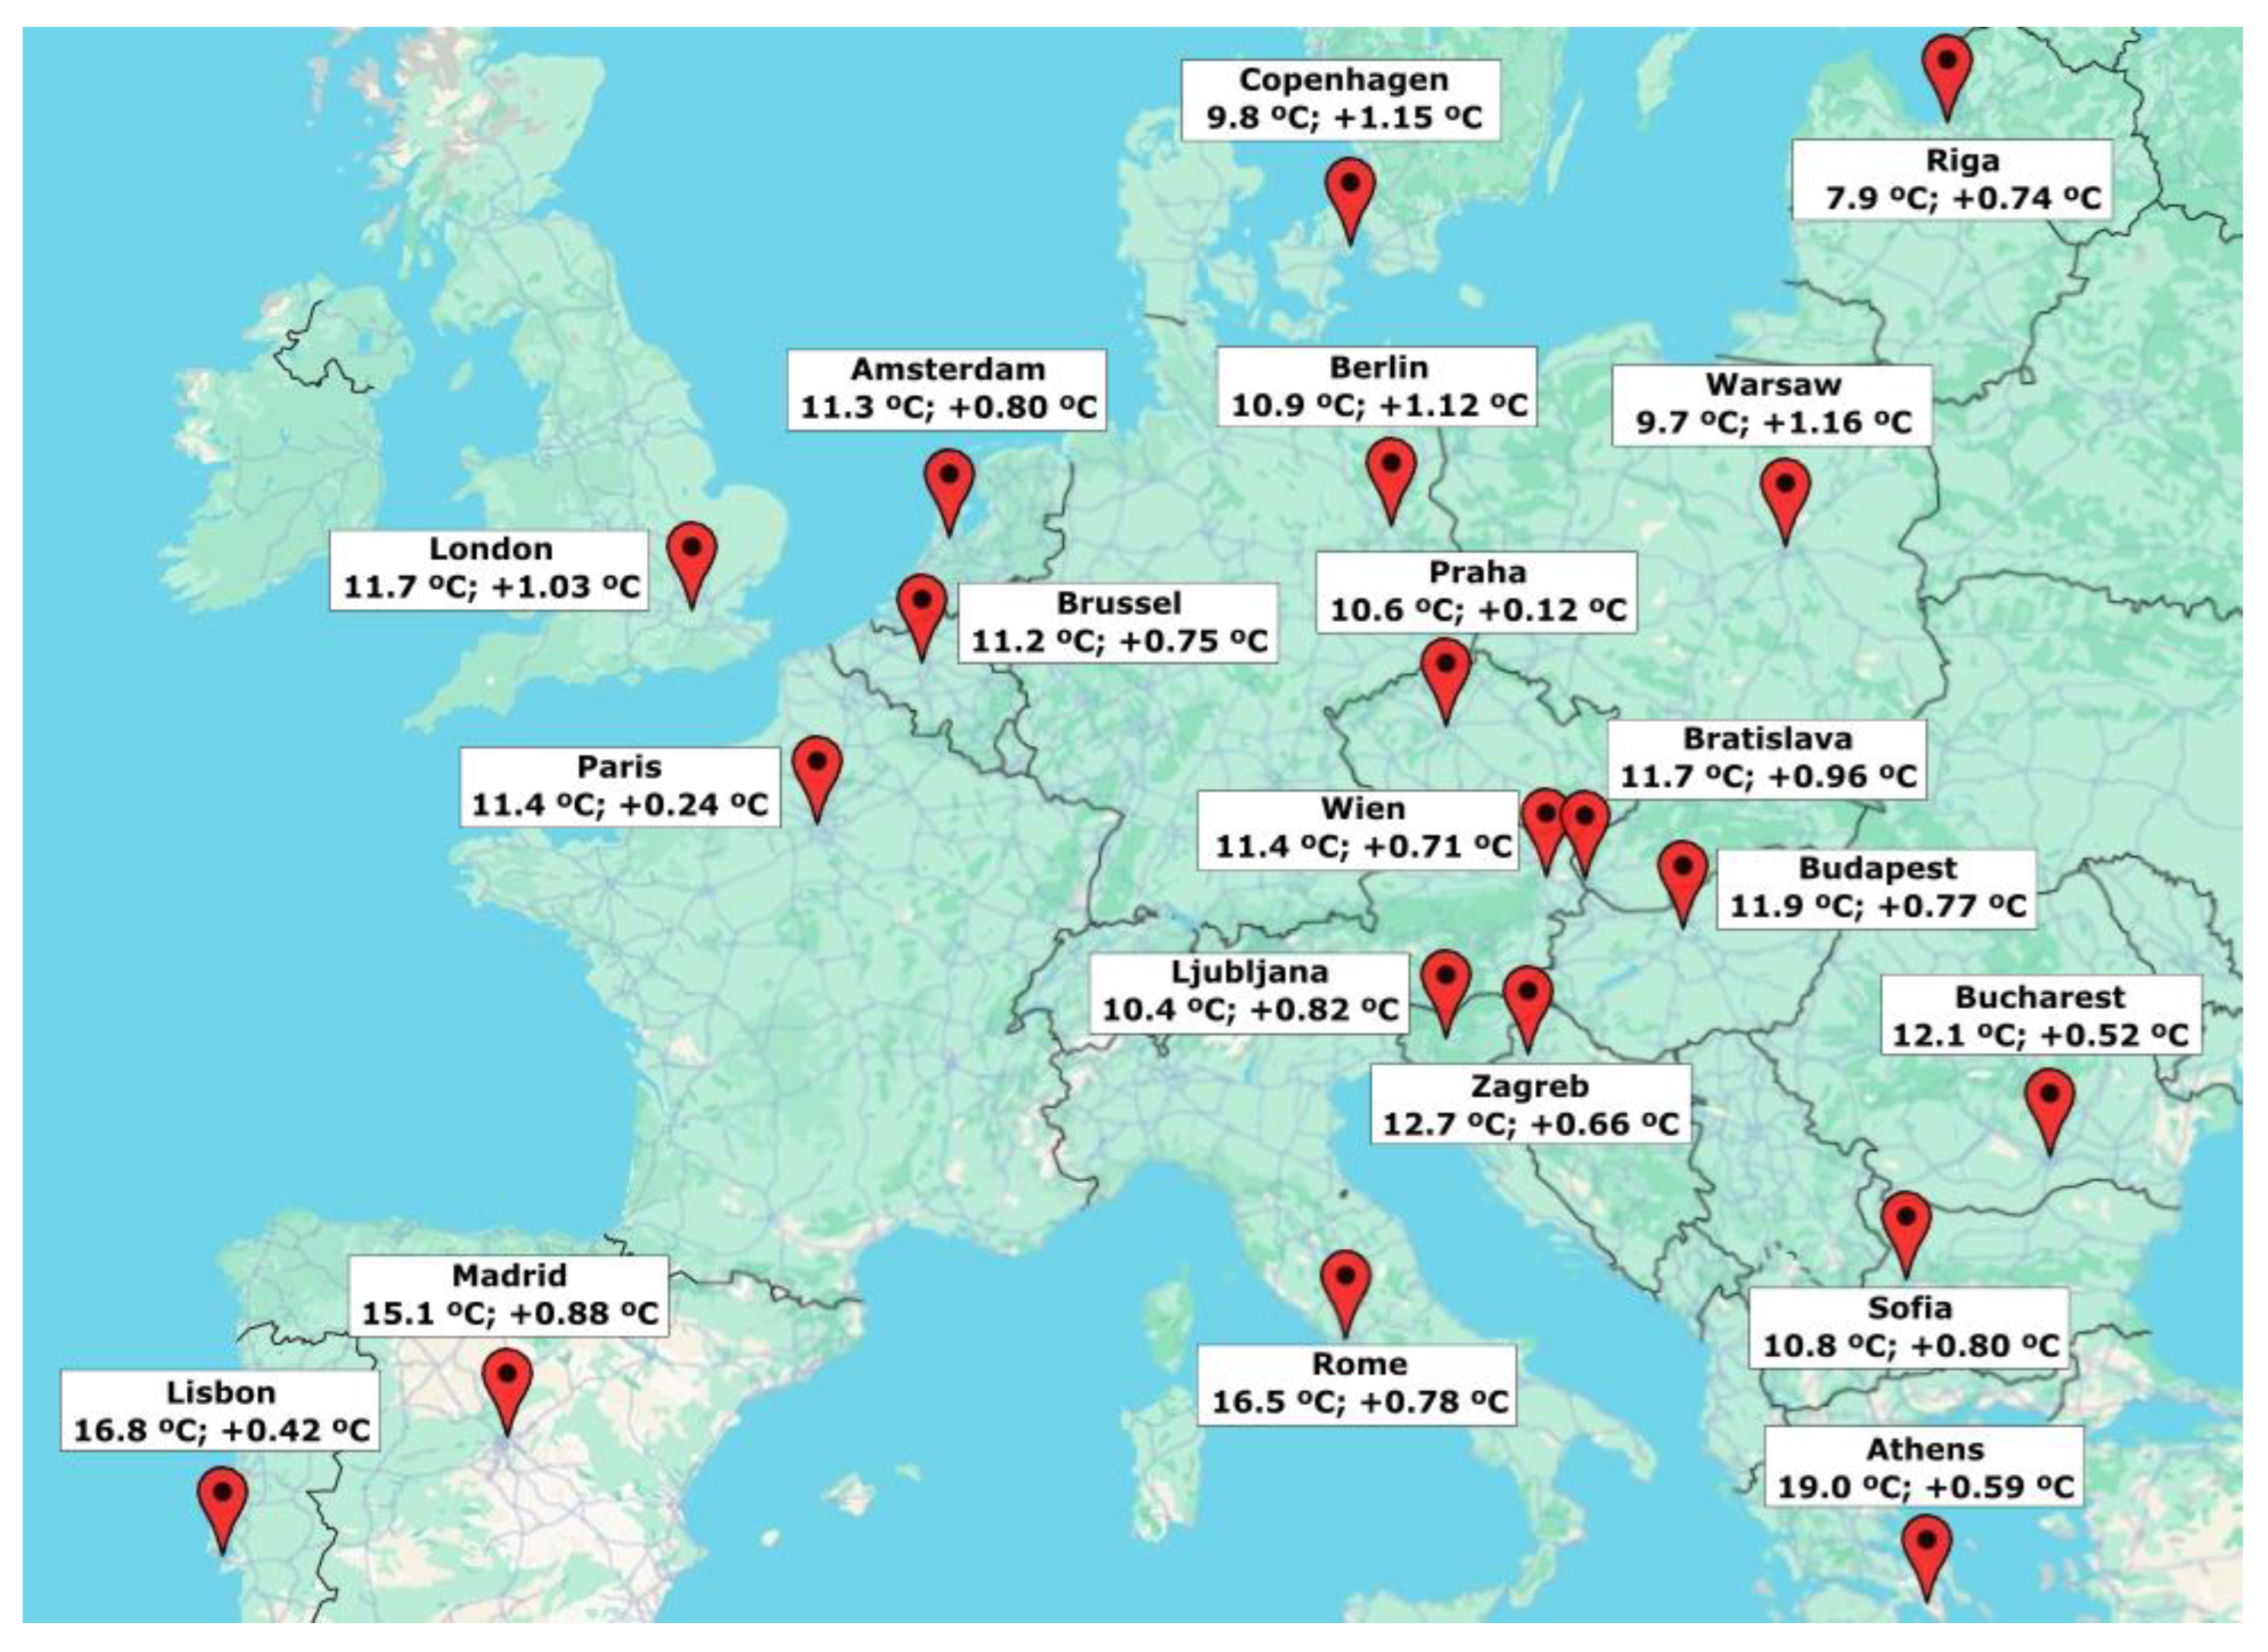
Figure 6 presents the results for the analyzed cities, showing the annual average ambient temperatures obtained from the TMYx database and the corresponding temperature differences calculated between the TMYx and TMY datasets. The analysis indicates that narrowing the meteorological data period to recent years (2009–2023) results in an increase in air temperature for all cities, reaching up to 1.16 °C in Warsaw. These findings clearly confirm the general trend of rising air temperatures across Europe.

3.3. Annual Assessment of RES in TRNSYS

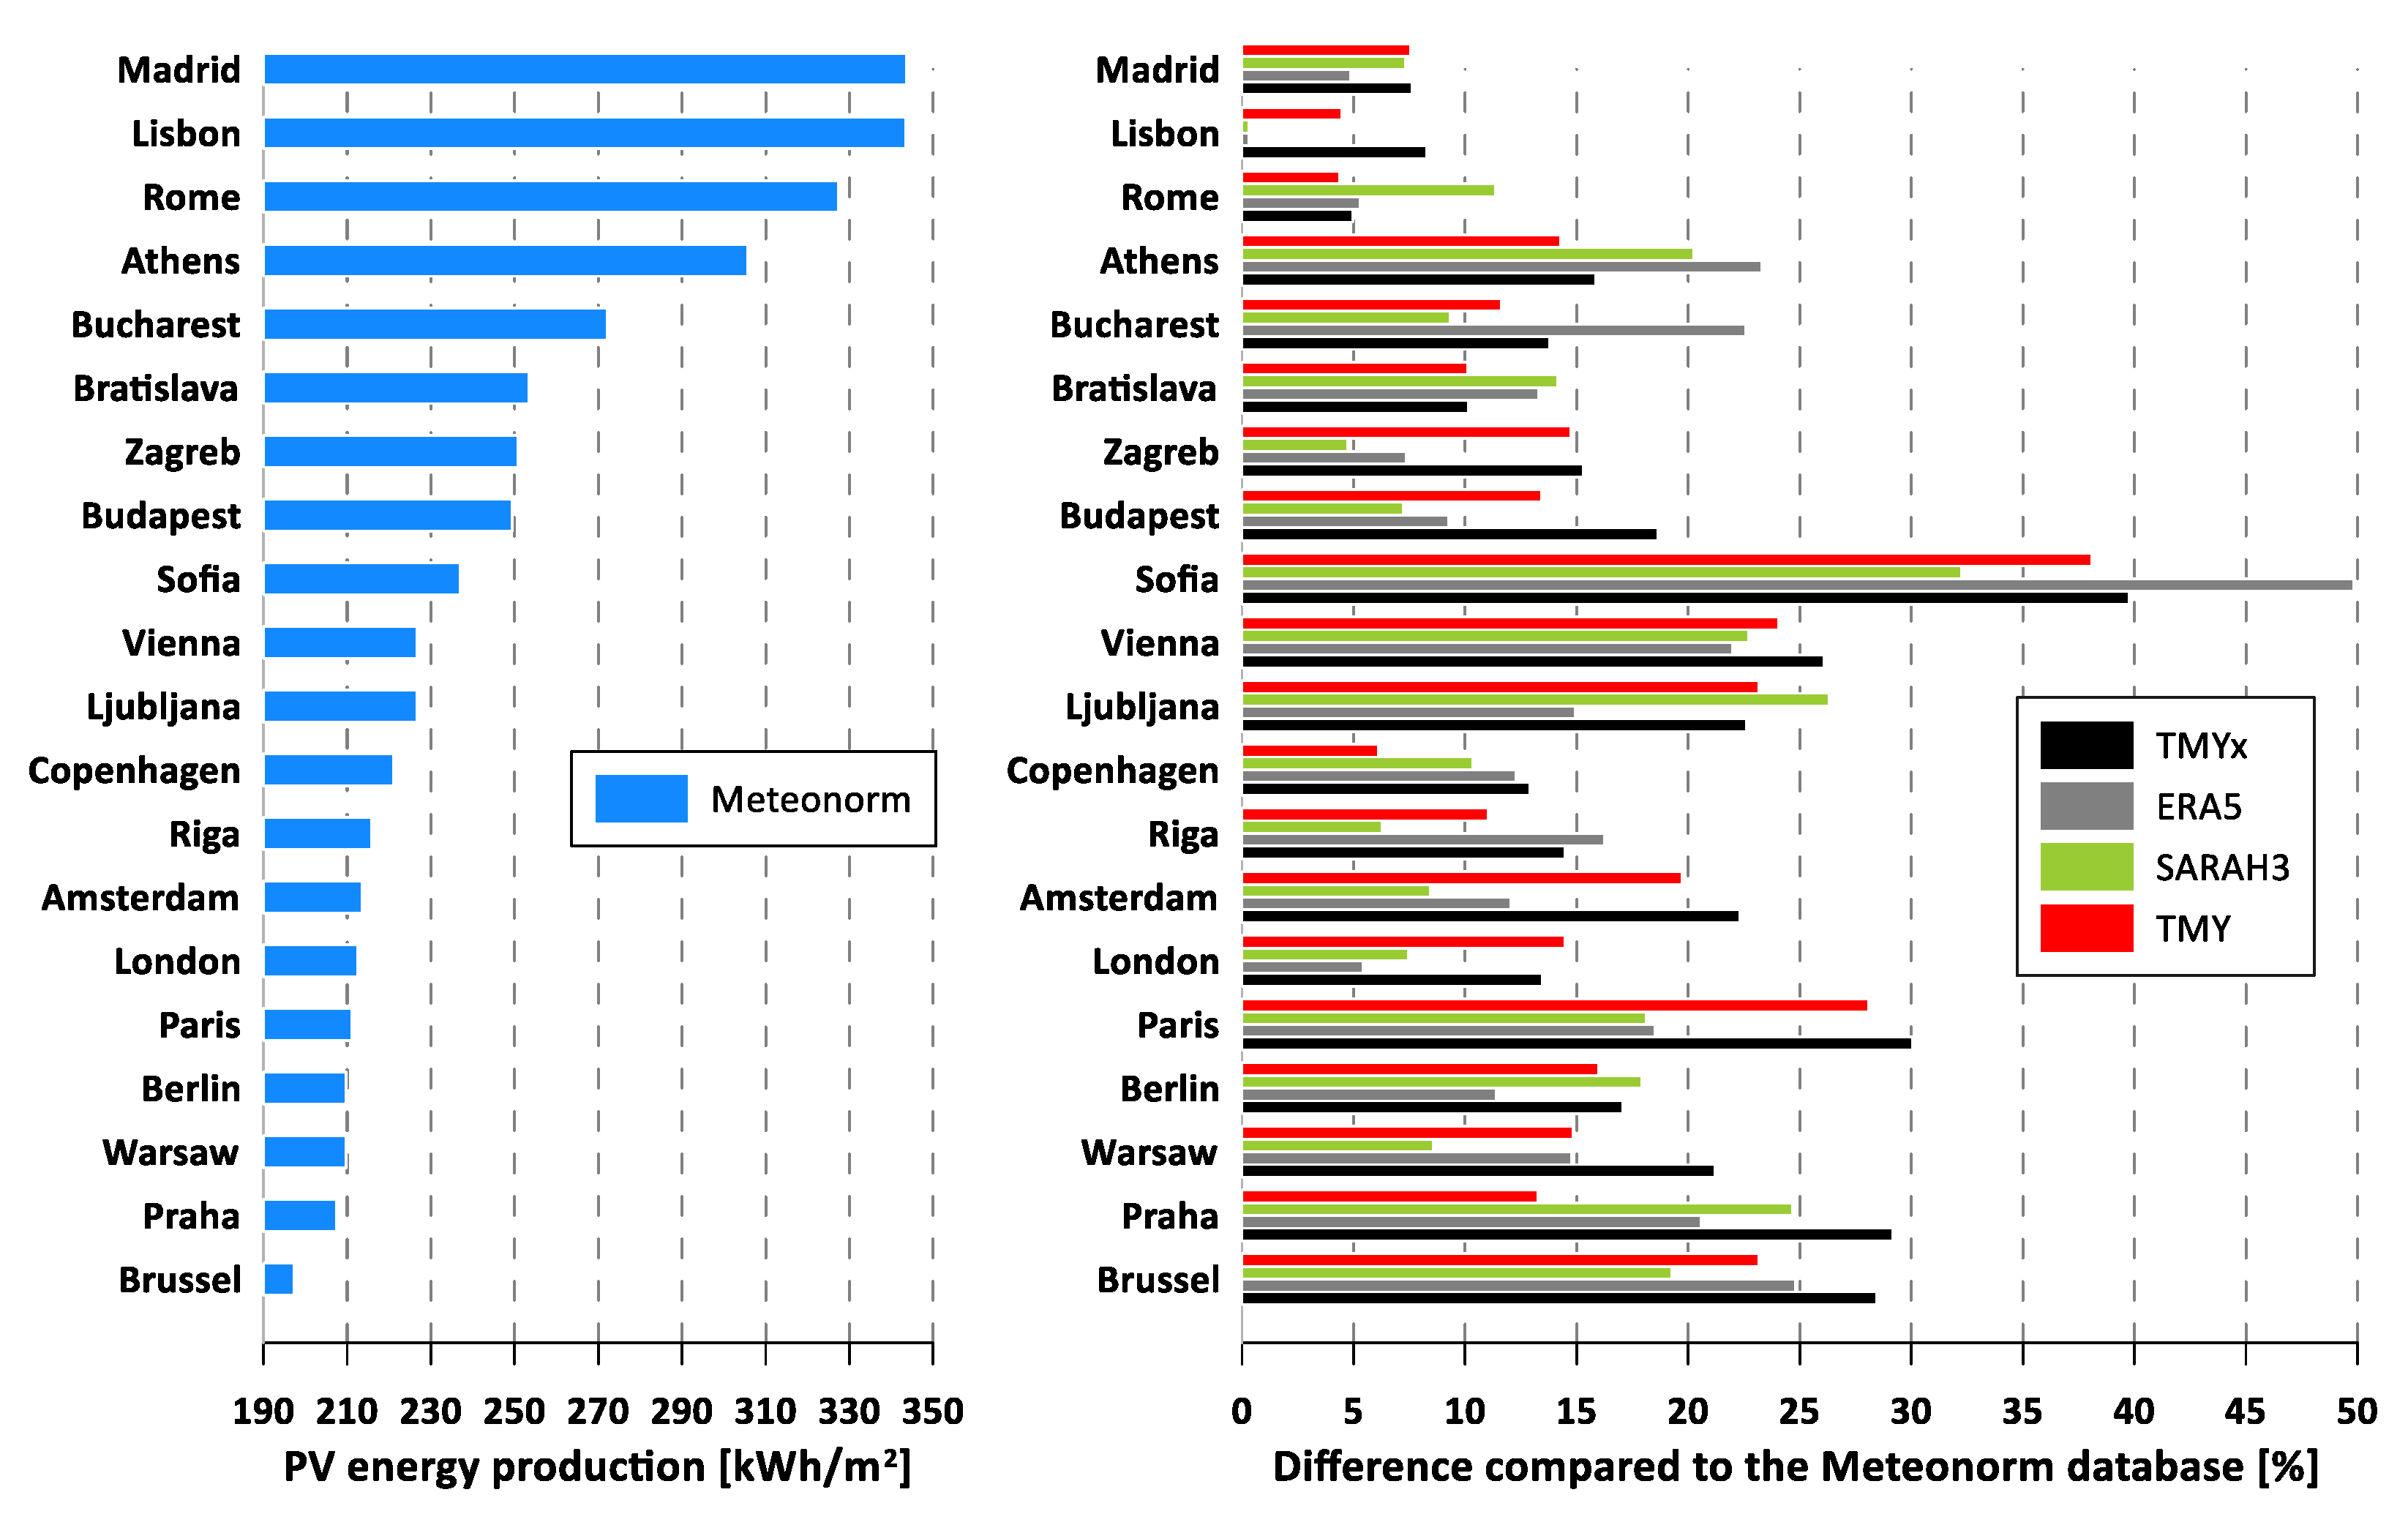
Figure 7 presents the simulation results obtained using the TRNSYS software and consists of two graphs. The left graph shows the electricity production from PV systems in various European cities, expressed in kWh/m2 of PV panels area, based on data from the Meteonorm database. The right graph illustrates the percentage differences in PV energy production obtained from other databases relative to the Meteonorm dataset. The cities are arranged in descending order of PV energy production according to the Meteonorm results. As expected, cities located in southern Europe (Madrid, Lisbon, Rome, Athens) exhibit the highest PV energy production, exceeding 300 kWh/m2, due to higher solar irradiance and favorable climatic conditions. In contrast, northwestern European cities such as Brussels, Prague, Warsaw, and Berlin show lower PV energy production levels, ranging from approximately 195 to 210 kWh/m2. This is primarily due to shorter sunshine durations and a higher frequency of cloudy days. Interestingly, the ranking of cities on the left-hand graph is not fully consistent with their order in Figure 2. For example, London—despite receiving the lowest annual total horizontal radiation among all the analyzed cities—demonstrates higher energy production than Paris. This can be attributed to the influence of ambient temperature on PV panels efficiency. Although the annual average temperatures in London and Paris are comparable (Figure 5), London’s lower air temperatures during the period from April to October provide more favorable conditions for PV panel operation.
The discrepancies between the results obtained and those from the Meteonorm database are substantial, reaching up to 50% (Figure 7). The largest deviations are observed mainly in cities with low annual PV energy production, such as Brussels and Prague, while the smallest occur in southern European locations like Madrid and Lisbon. These findings are consistent with the trends presented earlier in Figure 2. It is worth noting that even minor differences—of just a few percent—in annual total horizontal radiation between meteorological databases can translate into much larger variations in the simulated energy output. Particularly interesting are the results obtained from the ERA5 and SARAH3 databases, which cover the same time period. In this case, the discrepancies ranged from a few percent up to 18%. By contrast, the difference between the TMY and TMYx databases was generally small, amounting to only a few percent, with the highest value (16%) observed for Prague.
The results presented in Figure 8 show clear geographical differentiation in the annual useful energy gain from SCs system across Europe. Similarly to Figure 7 the highest values were obtained for southern locations (Lisbon, Madrid, Athens, Rome), exceeding 450–500 kWh/m2, while significantly lower values—around 300 kWh/m2—were recorded for northern and northwestern cities such as London, Brussels, and Riga.
When comparing the simulation results based on different meteorological databases, the discrepancies are significant, reaching up to 40% relative to the Meteonorm baseline. In most of the analyzed cities, the TMYx database—which covers the most recent decade of meteorological data—yields the highest values of useful energy production from SC systems (Figure 8). Interestingly, the SARAH3 database produces noticeably lower results than other contemporary datasets (except for Meteonorm), differing considerably even from the ERA5 database, despite both relying on the same reference period. For example, in Bratislava, the difference between SARAH3 and ERA5 results reaches nearly 20%, highlighting significant discrepancies.
Table 6 presents the average annual efficiencies of PV and SC systems calculated based on different meteorological databases, along with the corresponding standard deviations σ. The obtained results indicate relatively small variation in PV efficiency across Europe, with values ranging from 17.65% (Athens) to 18.65% (Copenhagen and Riga). The standard deviation values are generally very low, typically below 0.12%, except for Sofia, where it reaches 0.25%. This indicates that the choice of meteorological database has a negligible influence on the calculated efficiency of PV installations. The highest PV efficiencies are observed in northern cities, while the lowest occur in southern locations (Athens, Rome, Lisbon). This trend is consistent with the known inverse relationship between PV module temperature and conversion efficiency—lower ambient temperatures in northern Europe favor PV operation despite reduced solar irradiance levels.
In contrast, SC systems exhibit slightly greater differences in average efficiency, ranging from 25.83% (Madrid) to 28.67% (London). The highest SC efficiencies are recorded mainly for cities located in temperate or maritime climates (London, Amsterdam, Brussels), whereas the lowest occur in southern regions such as Madrid and Athens. These differences arise from the dependence of SCs performance not only on solar radiation but also on operating temperature levels, heat losses, and the potential for effective utilization of stored heat in the thermal tank. The higher variability in the efficiency of SC systems (σ up to 0.98%) compared to PV systems (σ typically < 0.12%) stems from their dual dependence on both solar radiation and ambient temperature, which directly influences the collector’s heat losses. PV efficiency, while also dependent on temperature, has a more direct relationship with irradiance, making it less sensitive to the combined uncertainty of both of these meteorological parameters. Nevertheless, these deviations remain within acceptable limits and do not indicate substantial inconsistencies among the databases.

4. Conclusions

The data repositories considered in this study are based on distinct time spans; however, this diversity was intentional and constitutes an essential part of the research design. The primary objective was not to directly compare absolute climatic conditions between the datasets, but rather to evaluate how the use of various meteorological sources—each developed under its own methodological framework and historical baseline—affects the generation of TMY and, consequently, the simulation outcomes for renewable energy systems. The variation in dataset periods reflects the actual diversity of data sources commonly applied in renewable energy modeling and enables a realistic assessment of discrepancies that may occur in practical applications.
The conducted analyses clearly demonstrate that the choice of meteorological database has a substantial impact on the assessment and simulation of RES. The observed discrepancies in solar radiation, ambient temperature, and resulting energy yields emphasize the importance of reliable and consistent climatic data. Among the analyzed datasets (Meteonorm, TMY, TMYx, ERA5, SARAH3), significant differences were found—locally reaching 200–300 kWh/m2 per year in total horizontal solar radiation and up to 40–50% in simulated useful energy gains for PV and SC systems. The largest deviations were recorded for cities in Central and Eastern Europe (e.g., Budapest, Sofia, Warsaw), highlighting the spatial variability of database accuracy. In contrast, southern European cities (Lisbon, Madrid, Athens) exhibited relatively consistent results across databases.
Analysis of average annual efficiencies showed relatively small variation for PV systems (17.7–18.7%), with very low standard deviations (typically < 0.12%), indicating that PV efficiency simulations are relatively robust to the choice of climatic database. In contrast, SC systems exhibited greater variability in efficiency (25.8–28.7%) and higher standard deviations (up to 0.98%), suggesting stronger sensitivity to the selected meteorological inputs and modeling assumptions.
The results also confirm the growing trend of increasing ambient temperatures in Europe over recent decades, as evidenced by higher temperature values obtained from more modern datasets such as TMYx and ERA5. This temperature rise directly influences system performance—particularly in PV installations, where efficiency decreases with increasing module temperature, and in SC systems, where higher ambient temperatures can reduce heat losses and improve thermal efficiency.
From a broader perspective, these findings have important implications for the financial modeling and risk assessment of renewable energy projects. A fundamental uncertainty of 40–50% in the annual energy yield—the primary driver of revenue—poses a significant challenge to assessing economic bankability and translates directly into considerable financial and design uncertainties. Therefore, careful selection and validation of meteorological databases are essential, particularly in feasibility studies and investment analyses. In regions such as central and northern Europe, where climatic conditions are more variable, conservative approaches and cross-verification of datasets are recommended.
Beyond the primary findings, this comparative analysis offers direct insights for practitioners, engineers, and financial stakeholders. Based on the significant discrepancies quantified in this study, we formulate the following recommendations for the practical application of meteorological data in RESs and other simulations:
  • The choice of database is not equally critical in every location:
    -
    Southern Europe: Our results demonstrated relatively high consistency and smaller discrepancies among the modern datasets.
    -
    Central and Northern Europe: We observed the largest discrepancies in annual radiation and simulated energy yield. Here, the choice of database is critically important and constitutes a major uncertainty factor that must be actively managed.
  • Using older climatic databases to assess the project’s performance and bankability is a high-risk approach. The historical database consistently generated the lowest annual solar radiation and average ambient temperature values across nearly all locations. This directly leads to a systematic and significant underestimation of potential energy yield (by up to 40–50% in our simulations).
  • Even the most modern, high-quality databases are not interchangeable. They exhibit systematic tendencies that a designer must understand to interpret simulation results correctly.
  • Recommended best practice: Performing a sensitivity analysis to ensure the reliability and transparency of simulation results. Since no single database is perfect (even modern databases such as ERA5 and SARAH3 for the same period can produce different results) simulations should never rely on a single data source but on at least two types. Presenting clients or investors with a range of outcomes is more transparent and credible than providing a single, seemingly precise but potentially misleading value.
  • Direct relevance for energy policy and decarbonization goals. Using outdated datasets can lead to substantial underestimation of available resources, resulting in overly conservative decarbonization targets and inefficient subsidy allocation. However, overestimation of generation potential increases the risk of underperforming infrastructure and missed climate objectives.
Finally, the study confirms that TMY data remain an indispensable tool in energy performance analysis of buildings and RES. However, given the ongoing climate change and the evident warming trends, periodic updates and regional validation of these databases are crucial to ensure the accuracy and reliability of long-term energy simulations and system design. This study provides a clear, quantitative answer to why meteorological datasets cannot be static, “set-and-forget” tools. Energy systems designed to operate for the next 30 years must be modeled using data that represents the actual climate they will operate in, not the climate of the past. The choice of dataset is not a minor technical decision, but a fundamental risk factor that can drastically affect the assessment of an RES project’s “bankability” and profitability.

Author Contributions

Conceptualization, S.P.; methodology, S.P.; software, S.P.; validation, S.P. and K.S.; formal analysis, S.P.; investigation, S.P. and K.S.; resources, S.P.; data curation, S.P. and K.S.; writing—original draft preparation, S.P.; writing—review and editing, S.P. and K.S.; visualization, S.P.; supervision, S.P. and K.S.; project administration, S.P. All authors have read and agreed to the published version of the manuscript.

Funding

This research received no external funding.

Institutional Review Board Statement

Not applicable.

Informed Consent Statement

Not applicable.

Data Availability Statement

The data used in this study can be obtained from the corresponding author upon request.

Conflicts of Interest

The authors declare no conflicts of interest.

Nomenclature

The following abbreviations are used in this manuscript:
EPWEnergyPlus Weather
ERAEuropean Centre for Medium-range Weather Forecast ReAnalysis
LLatitude, °;
PVPhotovoltaic
PVGISPhotovoltaic Geographical Information System
RESRenewable Energy Systems
SARAHSurfAce Radiation DAtaset Heliosat
SCSolar Collector
TMYTypical Meteorological Years
TRNSYSTRaNsient SYStems Simulation
β opt Optimal inclination angle, °;
σStandard deviation

References

  1. Pater, S. Increase of energy self-consumption in hybrid RES installations with PV panels and air-source heat pumps. Chem. Process Eng. New Front. 2023, 44, e43. [Google Scholar] [CrossRef]
  2. Moradi, A.; Kavgic, M.; Costanzo, V.; Evola, G. Impact of typical and actual weather years on the energy simulation of buildings with different construction features and under different climates. Energy 2023, 270, 126875. [Google Scholar] [CrossRef]
  3. Bryce, R.; Losada Carreño, I.; Kumler, A.; Hodge, B.M.; Roberts, B.; Brancucci Martinez-Anido, C. Consequences of neglecting the interannual variability of the solar resource: A case study of photovoltaic power among the Hawaiian Islands. Sol. Energy 2018, 167, 61–75. [Google Scholar] [CrossRef]
  4. Seyed Salehi, S.S.; Kalamees, T.; Kurnitski, J.; Thalfeldt, M. New typical meteorological year generation method based on long-term building energy simulations. Build. Environ. 2024, 256, 111504. [Google Scholar] [CrossRef]
  5. Zeng, Z.; Stackhouse, P.; Kim, J.H.; Muehleisen, R.T. Development of typical solar years and typical wind years for efficient assessment of renewable energy systems across the U.S. Appl. Energy 2025, 377, 124698. [Google Scholar] [CrossRef]
  6. Polo, J.; Alonso-Abella, M.; Martín-Chivelet, N.; Alonso-Montesinos, J.; López, G.; Marzo, A.; Nofuentes, G.; Vela-Barrionuevo, N. Typical Meteorological Year methodologies applied to solar spectral irradiance for PV applications. Energy 2020, 190, 116453. [Google Scholar] [CrossRef]
  7. Ernst, M.; Gooday, J. Methodology for generating high time resolution typical meteorological year data for accurate photovoltaic energy yield modelling. Sol. Energy 2019, 189, 299–306. [Google Scholar] [CrossRef]
  8. Anoune, K.; Bouya, M.; Astito, A.; Abdellah, A.B. Sizing methods and optimization techniques for PV-wind based hybrid renewable energy system: A review. Renew. Sustain. Energy Rev. 2018, 93, 652–673. [Google Scholar] [CrossRef]
  9. Cui, Y.; Yan, D.; Hong, T.; Xiao, C.; Luo, X.; Zhang, Q. Comparison of typical year and multiyear building simulations using a 55-year actual weather data set from China. Appl. Energy 2017, 195, 890–904. [Google Scholar] [CrossRef]
  10. Bigtashi, A.; Papakyriakou, A.; Lee, B. Defining generation parameters with an adaptable data-driven approach to construct typical meteorological year weather files. Energy Build. 2024, 303, 113781. [Google Scholar] [CrossRef]
  11. Costanzo, V.; Evola, G.; Infantone, M.; Marletta, L. Updated typical weather years for the energy simulation of buildings in mediterranean climate. A case study for sicily. Energies 2020, 13, 4115. [Google Scholar] [CrossRef]
  12. Kulesza, K. Comparison of typical meteorological year and multi-year time series of solar conditions for Belsk, central Poland. Renew. Energy 2017, 113, 1135–1140. [Google Scholar] [CrossRef]
  13. Gai, S.; Zhang, X.; Xie, J.; Xiao, G.; Liu, J. Comparison of typical meteorological year generation methods for building energy simulation in marine climate of China. Energy Build. 2024, 304, 113845. [Google Scholar] [CrossRef]
  14. Rudniak, J. Comparison of local solar radiation parameters with data from a typical meteorological year. Therm. Sci. Eng. Prog. 2020, 16, 100465. [Google Scholar] [CrossRef]
  15. Laetitia, U.; Kim, H.-G.; Kim, J.-Y.; Kim, B.; Kim, C.K. Multi-Year and Typical Year Data for Solar Energy System in South Korea. J. Korean Sol. Energy Soc. 2020, 40, 135–149. [Google Scholar] [CrossRef]
  16. Li, J.; Ma, X.; Shen, G.; Ren, Y.; Ma, Y.; Yu, Z.; Wang, Q.; Reaihan, E.; Ai, N.; Li, J.; et al. Optimal study of a hybrid solar-biomass heating system for rural household in cold regions of China. Sol. Energy 2024, 284, 113101. [Google Scholar] [CrossRef]
  17. Sun, C.; Ju, X.; Hao, W.; Lu, Y. Research on multi-objective optimization of control strategies and equipment parameters for a combined heating system of geothermal and solar energy in cold and arid regions based on TRNSYS. Case Stud. Therm. Eng. 2023, 50, 103441. [Google Scholar] [CrossRef]
  18. Wang, X.; Zhang, H.; Zang, P.; Cui, L.; Zhao, P.; Tang, J.; Wang, J.; Lee, C.; Dong, Y. Long-term performance simulation analysis of solar-assisted borehole thermal energy storage combined with a heat pump heating system. Renew. Energy 2025, 252, 123508. [Google Scholar] [CrossRef]
  19. Szymiczek, J.; Szczotka, K.; Michalak, P. Simulation of Heat Pump with Heat Storage and PV System—Increase in Self-Consumption in a Polish Household. Energies 2025, 18, 2325. [Google Scholar] [CrossRef]
  20. Huld, T.; Müller, R.; Gambardella, A. A new solar radiation database for estimating PV performance in Europe and Africa. Sol. Energy 2012, 86, 1803–1815. [Google Scholar] [CrossRef]
  21. Chen, H.; Li, X.; Gao, J.; Cao, J.; Dong, H.; Wang, W.; Chen, Y. Comparative study on a solar-assisted ground source heat pump with CPC solar collector and phase change heat storage. Renew. Energy 2025, 239, 122065. [Google Scholar] [CrossRef]
  22. Ren, C.; Lin, J.; Guo, N. Performance and Optimization of Novel Solar-Assisted Heat Pump System with Hybrid Thermal Energy Storage. Energies 2024, 17, 5944. [Google Scholar] [CrossRef]
  23. Naili, N.; Nouicer, O.; Attar, I.; Mgadmi, G. Optimization and behavior result analysis of a solar assisted ground source heat pump system using TRNSYS simulation tool. Geothermics 2025, 131, 103353. [Google Scholar] [CrossRef]
  24. Cao, Y.; Zhang, Z.; Jia, G.; Zhai, J.; Hao, J.; Zhang, M.; Jin, L. Performance Prediction and Analysis of Solar-Assisted Ground-Source Heat Pump Systems in Typical Rural Areas, China. Energies 2025, 18, 2208. [Google Scholar] [CrossRef]
  25. Wang, M.; Hu, E.; Chen, L. TRNSYS Simulation of a Bi-Functional Solar-Thermal-Energy-Storage-Assisted Heat Pump System. Energies 2024, 17, 3376. [Google Scholar] [CrossRef]
  26. Gagliano, A.; Tina, G.M.; Aneli, S. Improvement in Energy Self-Sufficiency in Residential Buildings Using Photovoltaic Thermal Plants, Heat Pumps, and Electrical and Thermal Storage. Energies 2025, 18, 1159. [Google Scholar] [CrossRef]
  27. Ahamed, M.S.; Guo, H.; Tanino, K. Modeling heating demands in a Chinese-style solar greenhouse using the transient building energy simulation model TRNSYS. J. Build. Eng. 2020, 29, 101114. [Google Scholar] [CrossRef]
  28. Kulesza, K.; Martinez, A.; Taylor, N. Assessment of Typical Meteorological Year Data in Photovoltaic Geographical Information System 5.2, Based on Reanalysis and Ground Station Data from 147 European Weather Stations. Atmosphere 2023, 14, 1803. [Google Scholar] [CrossRef]
  29. Chan, A.L.S.; Chow, T.T.; Fong, S.K.F.; Lin, J.Z. Generation of a typical meteorological year for Hong Kong. Energy Convers. Manag. 2006, 47, 87–96. [Google Scholar] [CrossRef]
  30. Hopfe, C.J.; Hensen, J.L.M. Uncertainty analysis in building performance simulation for design support. Energy Build. 2011, 43, 2798–2805. [Google Scholar] [CrossRef]
  31. Meteotest AG: Meteonorm. Data for TMY. Available online: https://docs.meteonorm.com/knowledge/climate/data-tmy (accessed on 20 October 2025).
  32. Pfeifroth, U.; Drücke, J.; Kothe, S.; Trentmann, J.; Schröder, M.; Hollmann, R. SARAH-3—Satellite-based climate data records of surface solar radiation. Earth Syst. Sci. Data 2024, 16, 5243–5265. [Google Scholar] [CrossRef]
  33. Urraca, R.; Huld, T.; Gracia-Amillo, A.; Martinez-de-Pison, F.J.; Kaspar, F.; Sanz-Garcia, A. Evaluation of global horizontal irradiance estimates from ERA5 and COSMO-REA6 reanalyses using ground and satellite-based data. Sol. Energy 2018, 164, 339–354. [Google Scholar] [CrossRef]
  34. Narowski, P.G. Analiza porównawcza typowych lat meteorologicznych Polski wyznaczonych na podstawie danych źródłowych z lat 2001–2020. Instal 2022, 10, 11–25. [Google Scholar] [CrossRef]
  35. Lawrie, L.K.; Drury, B.C. Development of Global Typical Meteorological Years (TMYx). Available online: https://climate.onebuilding.org/default.html (accessed on 20 October 2025).
  36. Babar, B.; Graversen, R.; Boström, T. Solar radiation estimation at high latitudes: Assessment of the CMSAF databases, ASR and ERA5. Sol. Energy 2019, 182, 397–411. [Google Scholar] [CrossRef]
  37. Kupiec, K.; Pater, S. On the possibility of achieving high solar fractions for space heating in temperate climates. Sol. Energy 2025, 300, 113789. [Google Scholar] [CrossRef]
  38. Pater, S. Increasing Energy Self-Consumption in Residential Photovoltaic Systems with Heat Pumps in Poland. Energies 2023, 16, 4003. [Google Scholar] [CrossRef]
  39. Thermal Energy System Specialists LLC. TRNSYS 18—A Transient System Simulation Program; Standard Component Library Overview; University of Wisconsin-Madison: Madison, WI, USA, 2017; Volume 3. [Google Scholar]
  40. European Solar Thermal Industry Federation. Solar Domestic Hot Water preparation (SDHW). Available online: http://www.estif.org/st_energy/technology/solar_domestic_hot_water_heating_sdhw/ (accessed on 20 October 2025).
  41. Chinchilla, M.; Santos-Martín, D.; Carpintero-Rentería, M.; Lemon, S. Worldwide annual optimum tilt angle model for solar collectors and photovoltaic systems in the absence of site meteorological data. Appl. Energy 2021, 281, 116056. [Google Scholar] [CrossRef]
Figure 1. Part of the analyzed installation in TRNSYS.
Energies 18 06063 g001
Figure 2. Annual total horizontal radiation for various cities in Europe.
Energies 18 06063 g002
Figure 3. Monthly horizontal radiation for Riga and Warsaw.
Energies 18 06063 g003
Figure 4. Monthly horizontal radiation for Vienna and Madrid.
Energies 18 06063 g004
Figure 5. Annual average ambient temperature for selected cities.
Energies 18 06063 g005
Figure 6. Annual average ambient temperature for the TMYx database and the value of the temperature difference between TMYx and TMY databases for the analyzed cities. Map partially developed using the application available on: https://maps.co/gis/ (accessed on 20 October 2025).
Energies 18 06063 g006
Figure 7. PV system simulation results.
Energies 18 06063 g007
Figure 8. SCs system simulation results.
Energies 18 06063 g008
Table 1. Information about used meteorological data repositories.
Meteorological Data RepositoryInput Data PeriodPeriod Length (Years)Shortcut
Meteonorm V5.01961–199030Meteonorm
PVGIS-SARAH32005–202319SARAH3
PVGIS-ERA52005–202319ERA5
TMYx2009–202315TMYx
Table 2. Information about used meteorological data repositories for TMY [35].
No.Country Code—CapitalTMY Input Data PeriodPeriod Length (Years)
1.AU—Vienna1952–202372
2.BE—Brussel1940–202384
3.BG—Sofia1937–202387
4.CZ—Praha1932–202392
5.DE—Berlin1955–202369
6.DK—Copenhagen1931–202393
7.ES—Madrid1957–202367
8.FR—Paris1958–202366
9.GB—London1948–202376
10.GR—Athens1949–202375
11.HR—Zagreb1941–202383
12.HU—Budapest1952–202372
13.IT—Rome1951–202373
14.LV—Riga1932–202392
15.NL—Amsterdam1949–202375
16.PL—Warsaw1932–202392
17.PT—Lisbon1935–202389
18.RO—Bucharest1936–202388
19.SI—Ljubljana1952–202372
20.SK—Bratislava1940–202384
Table 3. PV panels and SC main parameters.
PV Panel Installation
ParameterValue
Panel area [m2]1.953
Nominal maximum panel power [Wp]400
Short-circuit current at reference conditions [A]13.76
Current at max power point and reference conditions [A]13.01
Open-circuit voltage at reference conditions [V]36.75
Voltage at max power point and reference conditions [V]30.75
Temperature coefficient of Isc [A/K]0.050
Temperature coefficient of Voc [V/K] −0.265
Solar Collector Installation
ParameterValue
Collector area [m2]6.0
Intercept Efficiency a0 [-]0.85
1st Order Efficiency Coefficient a1 [W/(m2K)]4.0
2nd Order Efficiency Coefficient a2 [W/(m2K)]0.015
Table 4. Annual optimum tilt angle for devoices in the capitals under consideration.
Country Code
—Capital
AU—ViennaBE—BrusselBG—SofiaCZ—PrahaDE—BerlinDK—CopenhagenES—MadridFR—ParisGB—LondonGR—AthensHR—ZagrebHU—BudapestIT—RomeLV—RigaNL—AmsterdamPL—WarsawPT—LisbonRO—BucharestSI—LjubljanaSK—Bratislava
[°]48.1250.9042.7050.0752.5655.6140.4848.7851.4837.8945.8247.4441.8156.9552.3252.1638.7844.5146.2248.17
β o p t
[°]
37.336.132.135.736.838.030.935.136.329.533.734.531.738.536.736.630.033.133.934.8
Table 5. Extreme values of annual total horizontal radiation in the analyzed cities.
Country Code—CapitalMAX [kWh/m2]MIN [kWh/m2]Difference [%]
AU–Vienna1272111414.3
BE–Brussel111795616.9
BG–Sofia1533118729.2
CZ–Praha1168100016.8
DE–Berlin1104100310.1
DK–Copenhagen10539896.4
ES–Madrid174816645.0
FR–Paris1239103819.3
GB–London106492515.0
GR–Athens1829156516.8
HR–Zagreb132112129.0
HU–Budapest131412009.6
IT–Rome170315658.8
LV–Riga10579679.3
NL–Amsterdam113098814.4
PL–Warsaw111899412.5
PT–Lisbon176516576.6
RO–Bucharest131412009.6
SI– Ljubljana1339111520.1
SK– Bratislava132912149.4
Table 6. Average annual efficiencies of PV and SC systems calculated using all climatic databases, along with corresponding standard deviations.
EuropeCapital L [°]PV Efficiency [%]σ [%]SCs Efficiency [%]σ [%]
NorthernRiga56.9518.650.0625.990.22
Copenhagen55.6118.650.0527.310.31
Central
& Western
Berlin52.5618.290.1227.810.46
Amsterdam52.3218.440.0428.200.23
Warsaw52.1618.380.0927.410.28
London51.4818.410.0628.670.32
Brussel50.9018.360.1028.120.27
Praha50.0718.370.0527.860.43
Paris48.7818.230.1127.690.66
Bratislava48.1718.250.0827.550.71
Vienna48.1218.330.1228.050.25
Budapest47.4418.160.1128.350.59
Ljubljana46.2218.360.1227.660.83
Zagreb45.8218.160.0727.870.70
Bucharest44.5118.180.1327.290.38
SouthernSofia42.7018.560.2527.280.43
Rome41.8118.010.0827.640.57
Madrid40.4818.030.0825.830.48
Lisbon38.7818.020.0726.980.43
Athens37.8917.650.1026.760.98
Disclaimer/Publisher’s Note: The statements, opinions and data contained in all publications are solely those of the individual author(s) and contributor(s) and not of MDPI and/or the editor(s). MDPI and/or the editor(s) disclaim responsibility for any injury to people or property resulting from any ideas, methods, instructions or products referred to in the content.