Comparison of Typical Meteorological Years for Assessment and Simulation of Renewable Energy Systems
Abstract
1. Introduction
2. Materials and Methods
2.1. Research Area and Data Sources
2.2. System Configuration in TRNSYS
2.3. Annual Optimum Tilt Angle
3. Results and Discussion
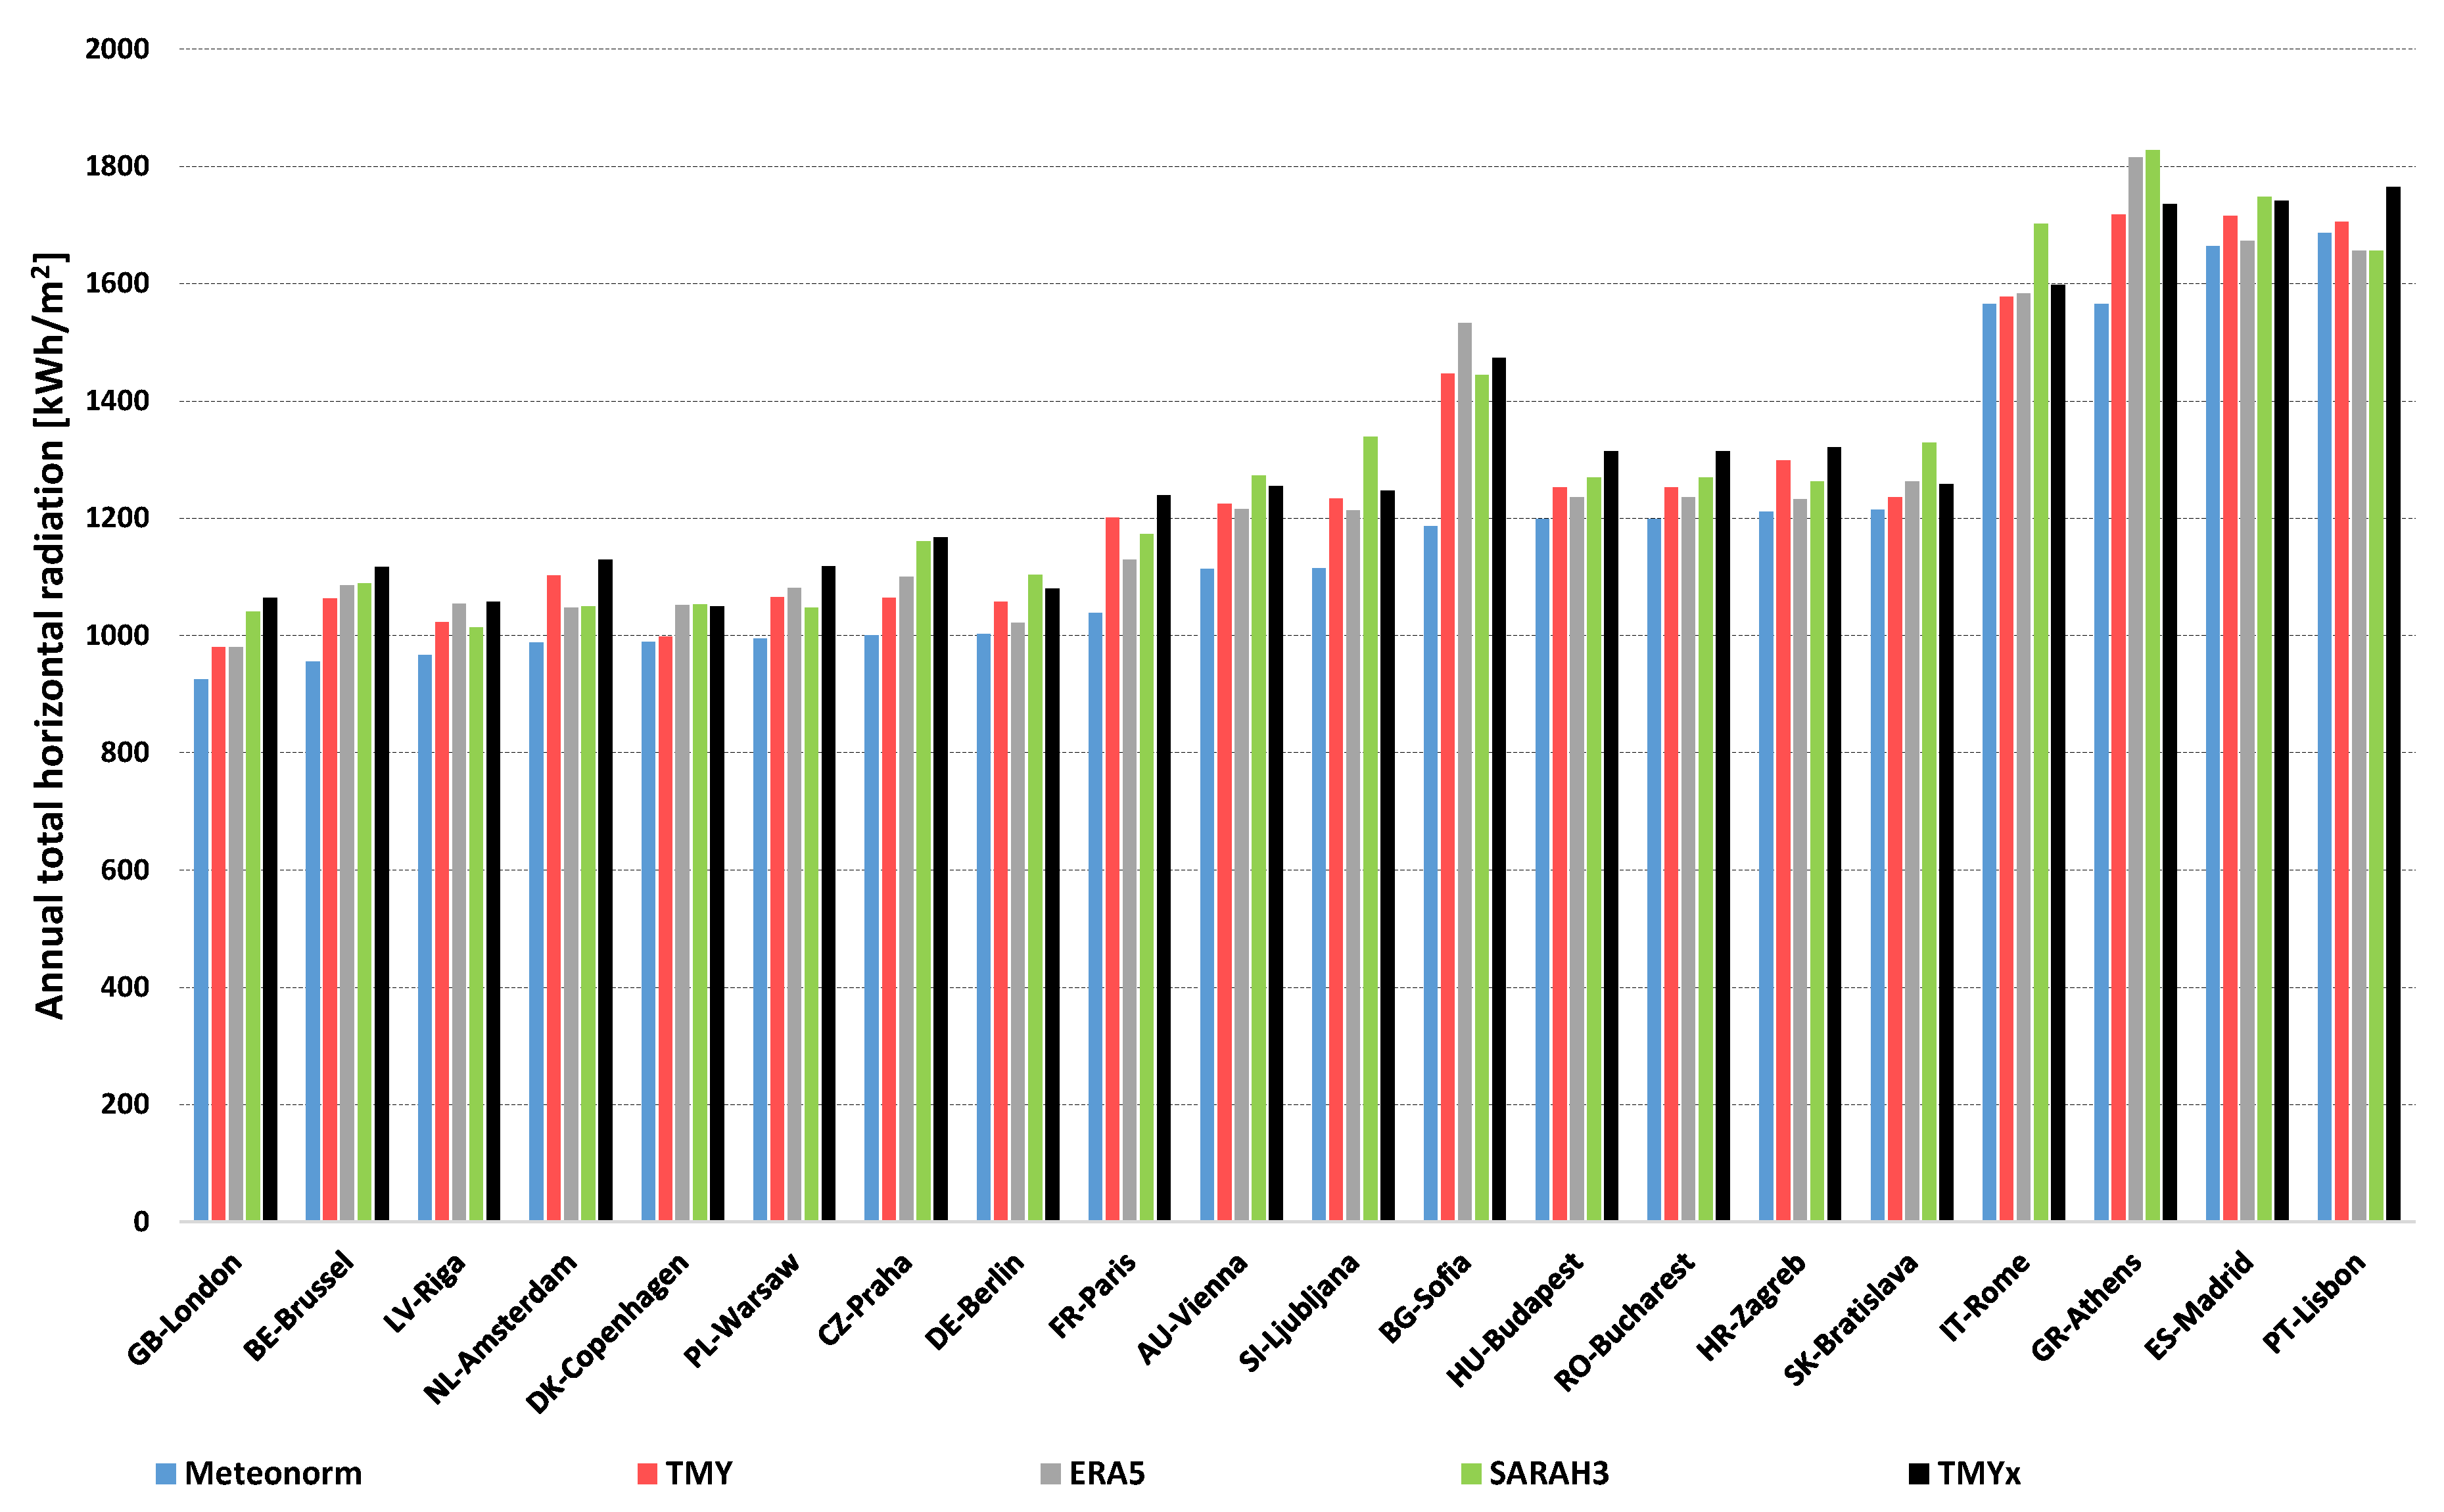
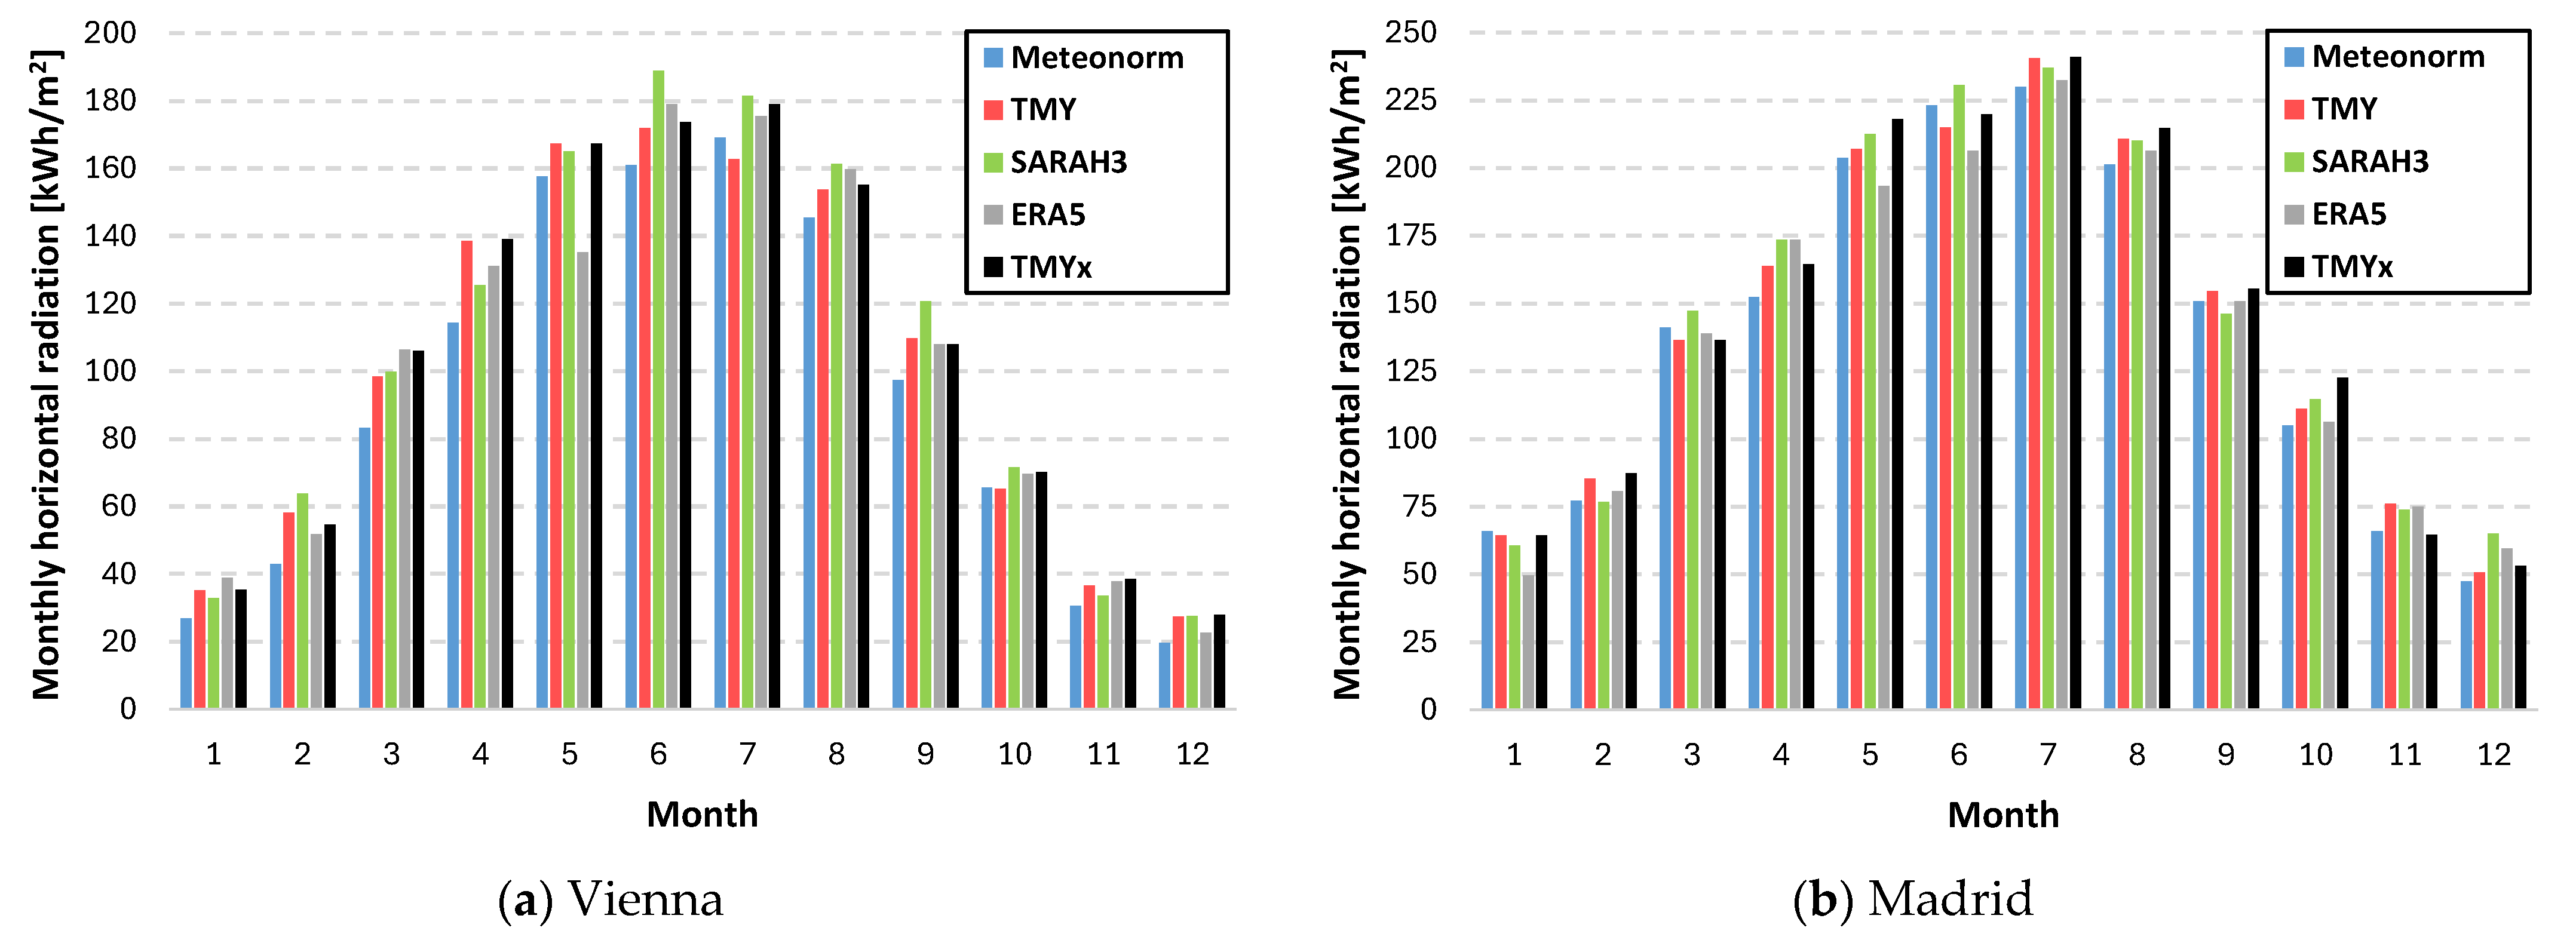
3.1. Annual Total Horizontal Radiation
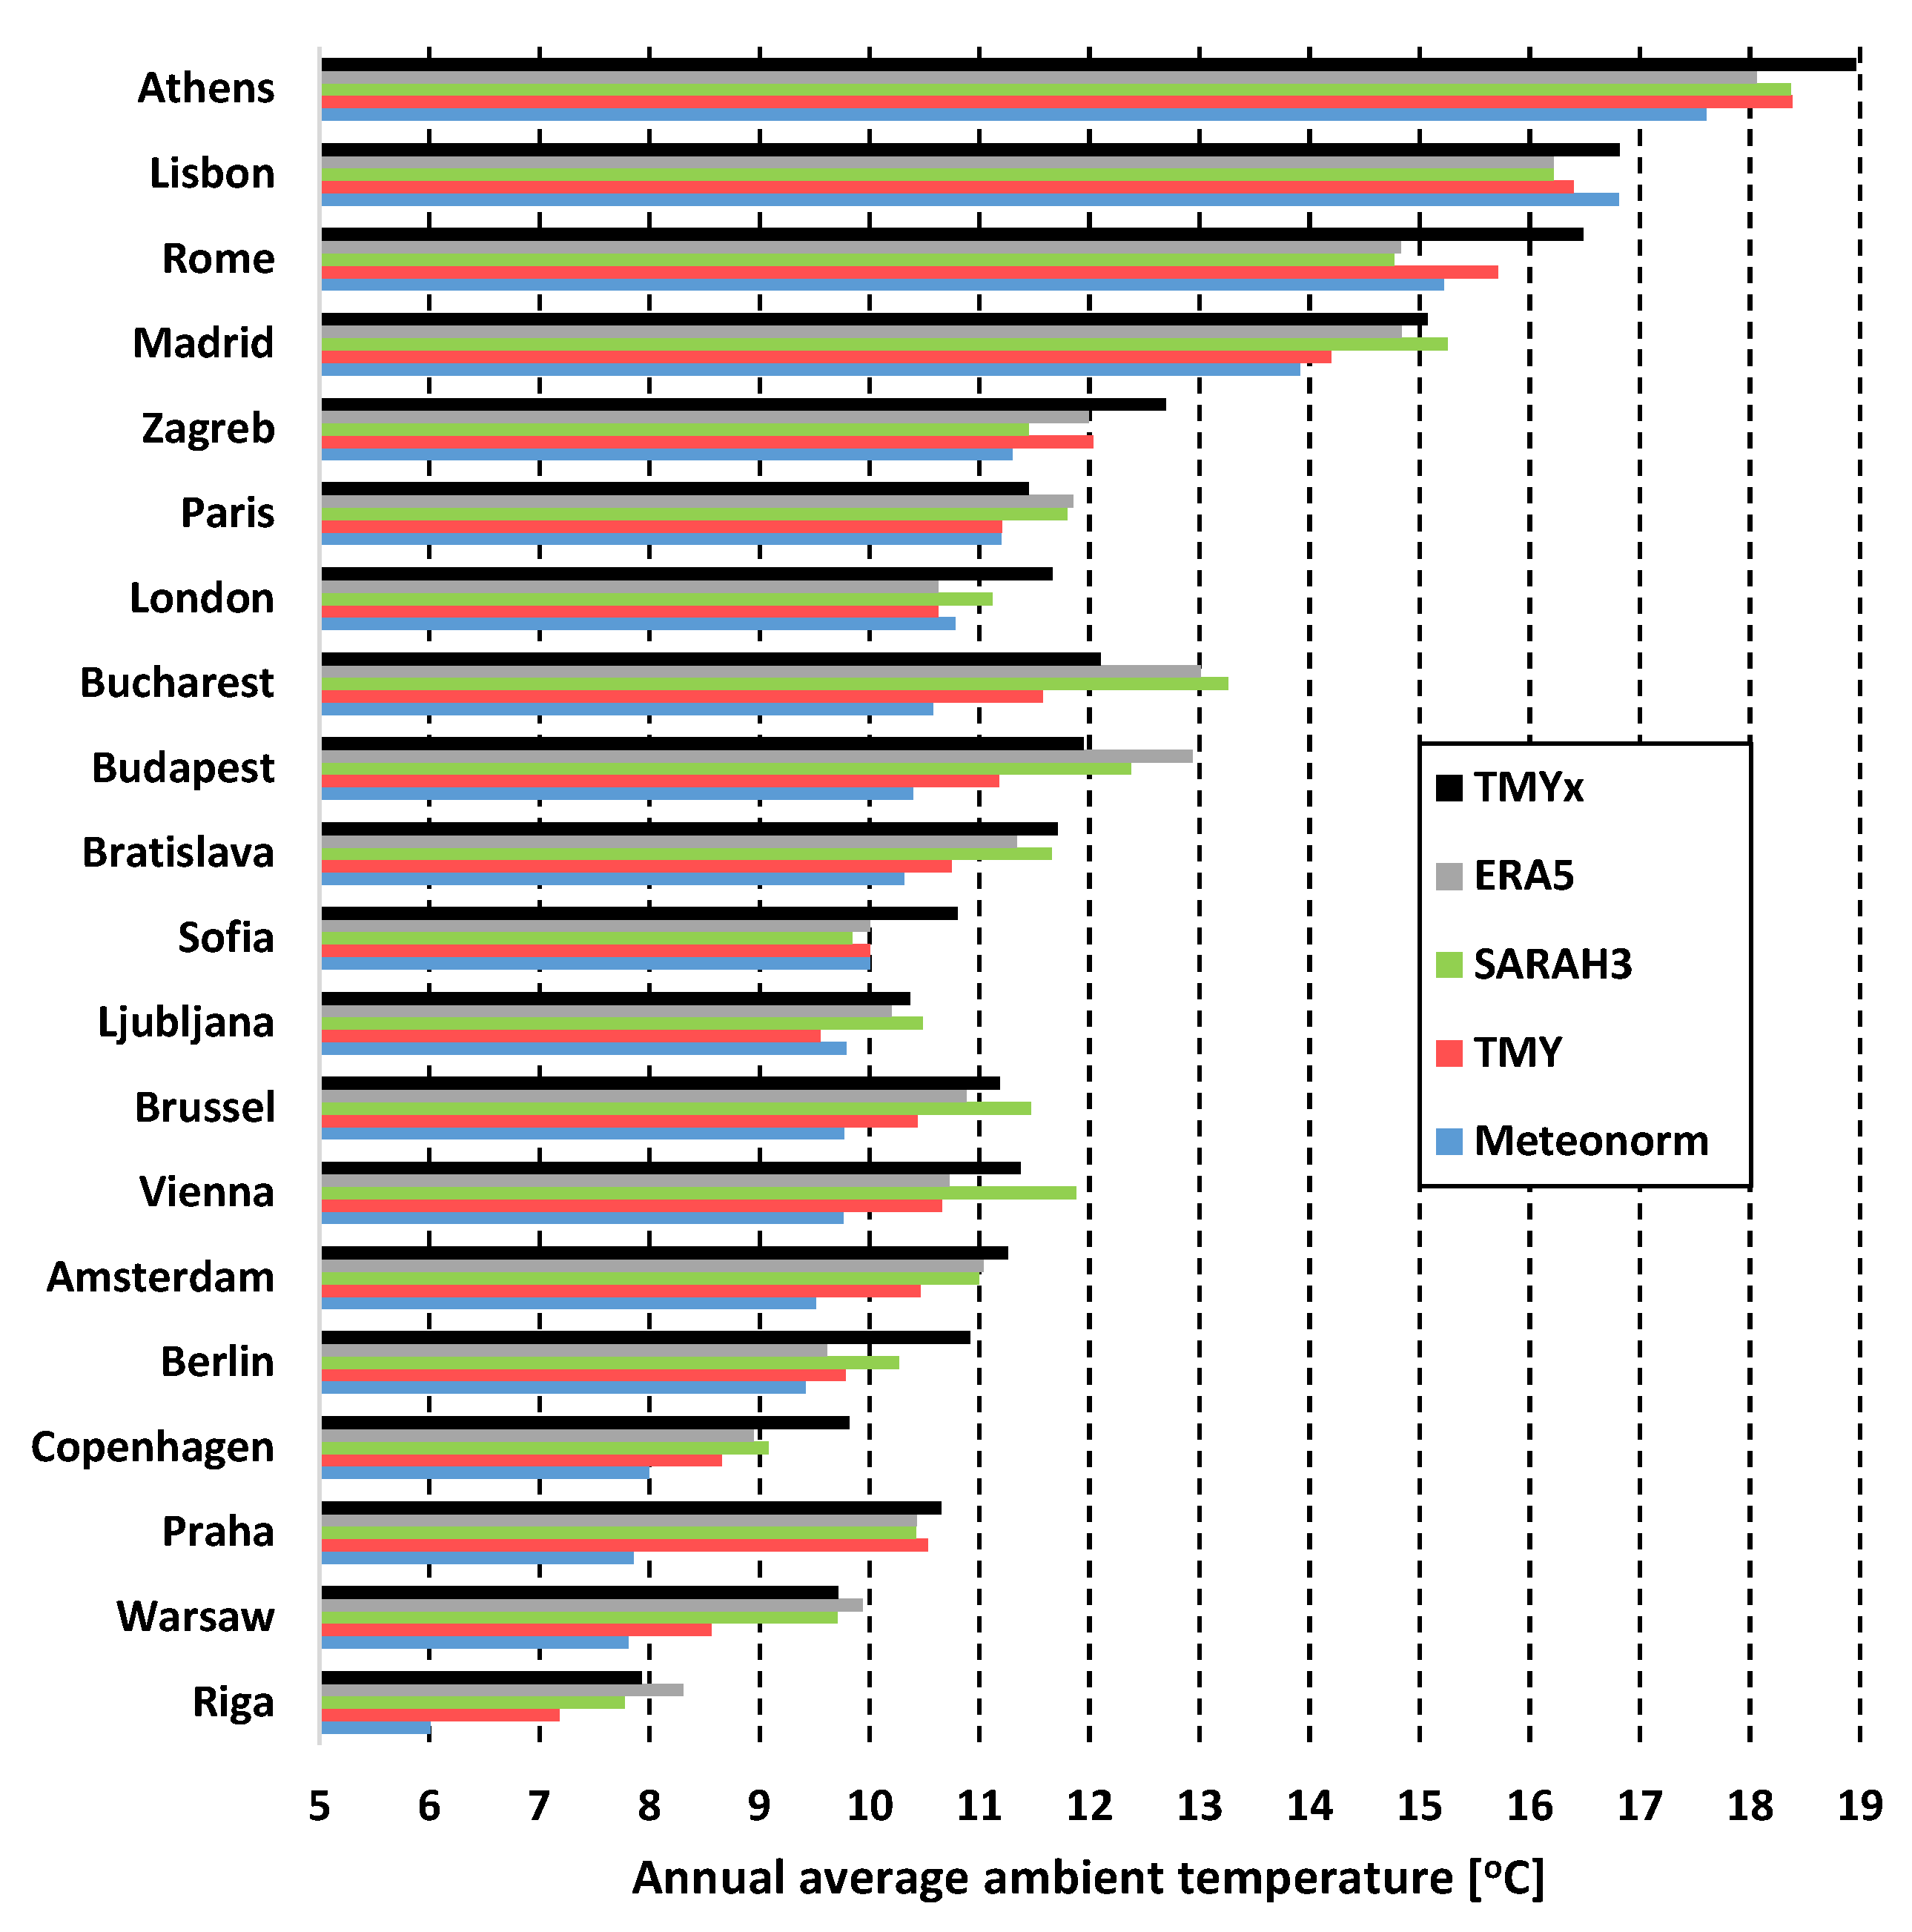
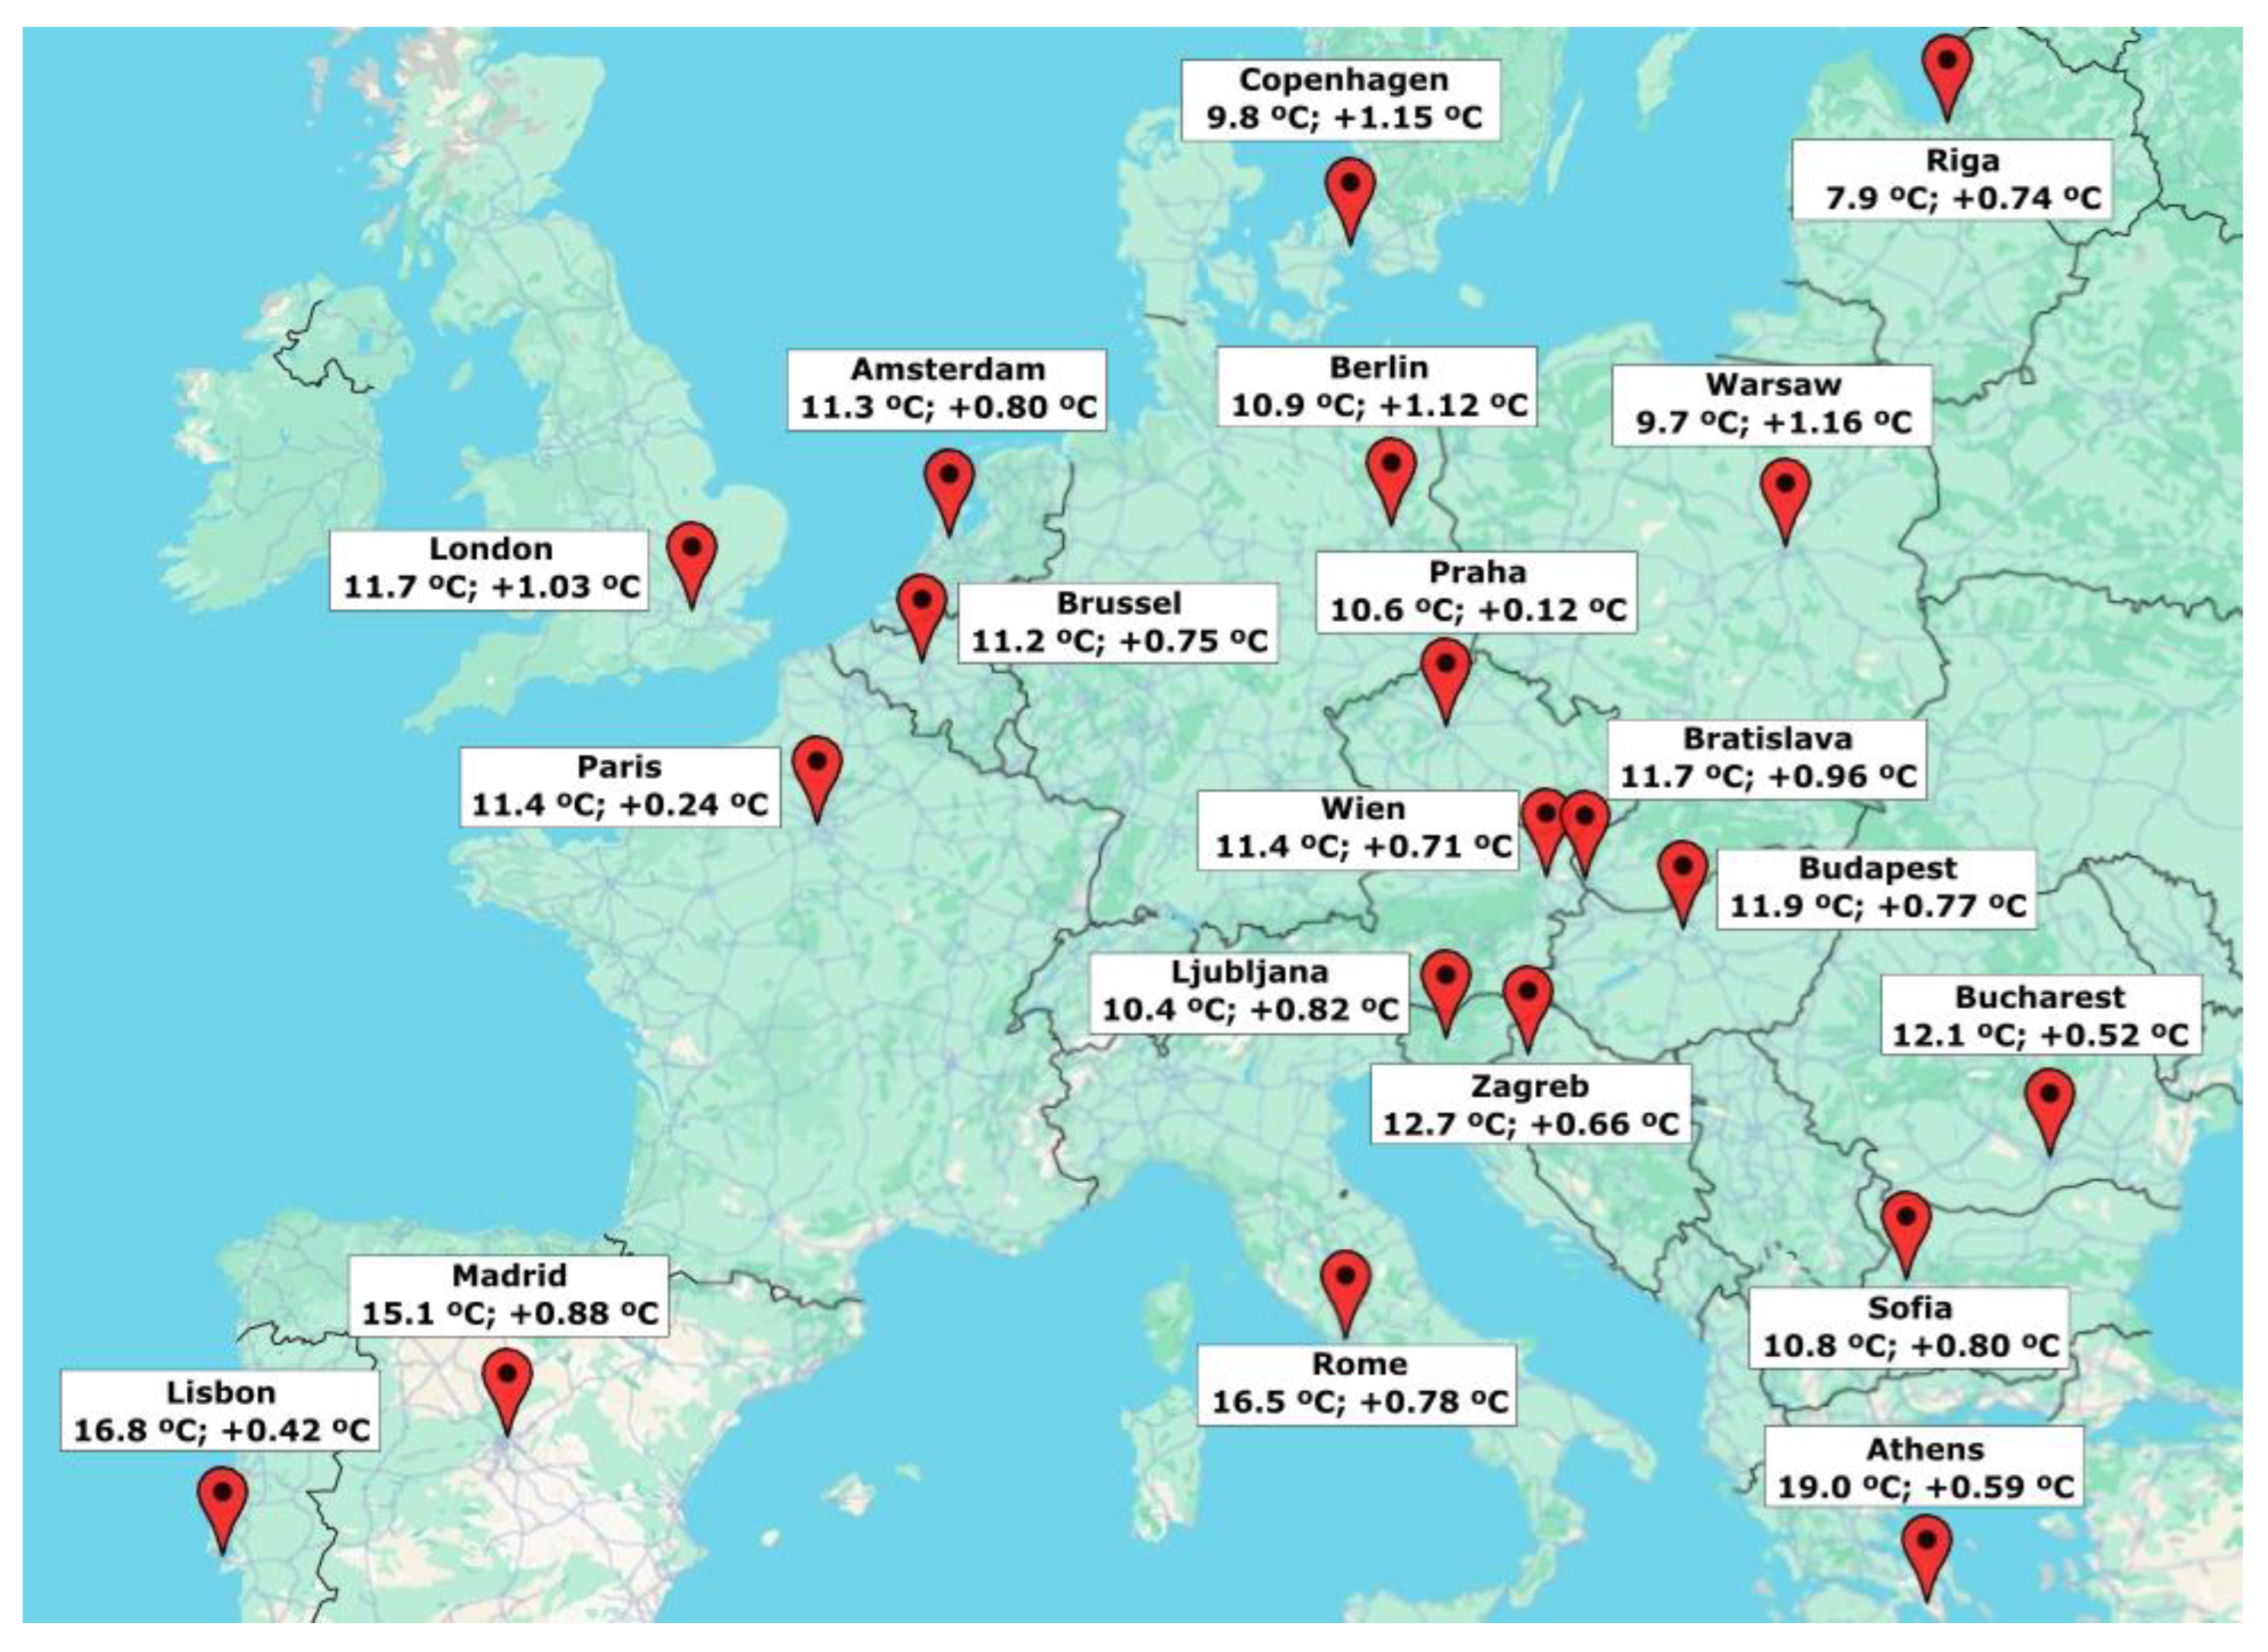
3.2. Annual Average Ambient Temperature
3.3. Annual Assessment of RES in TRNSYS
4. Conclusions
- The choice of database is not equally critical in every location:
- -
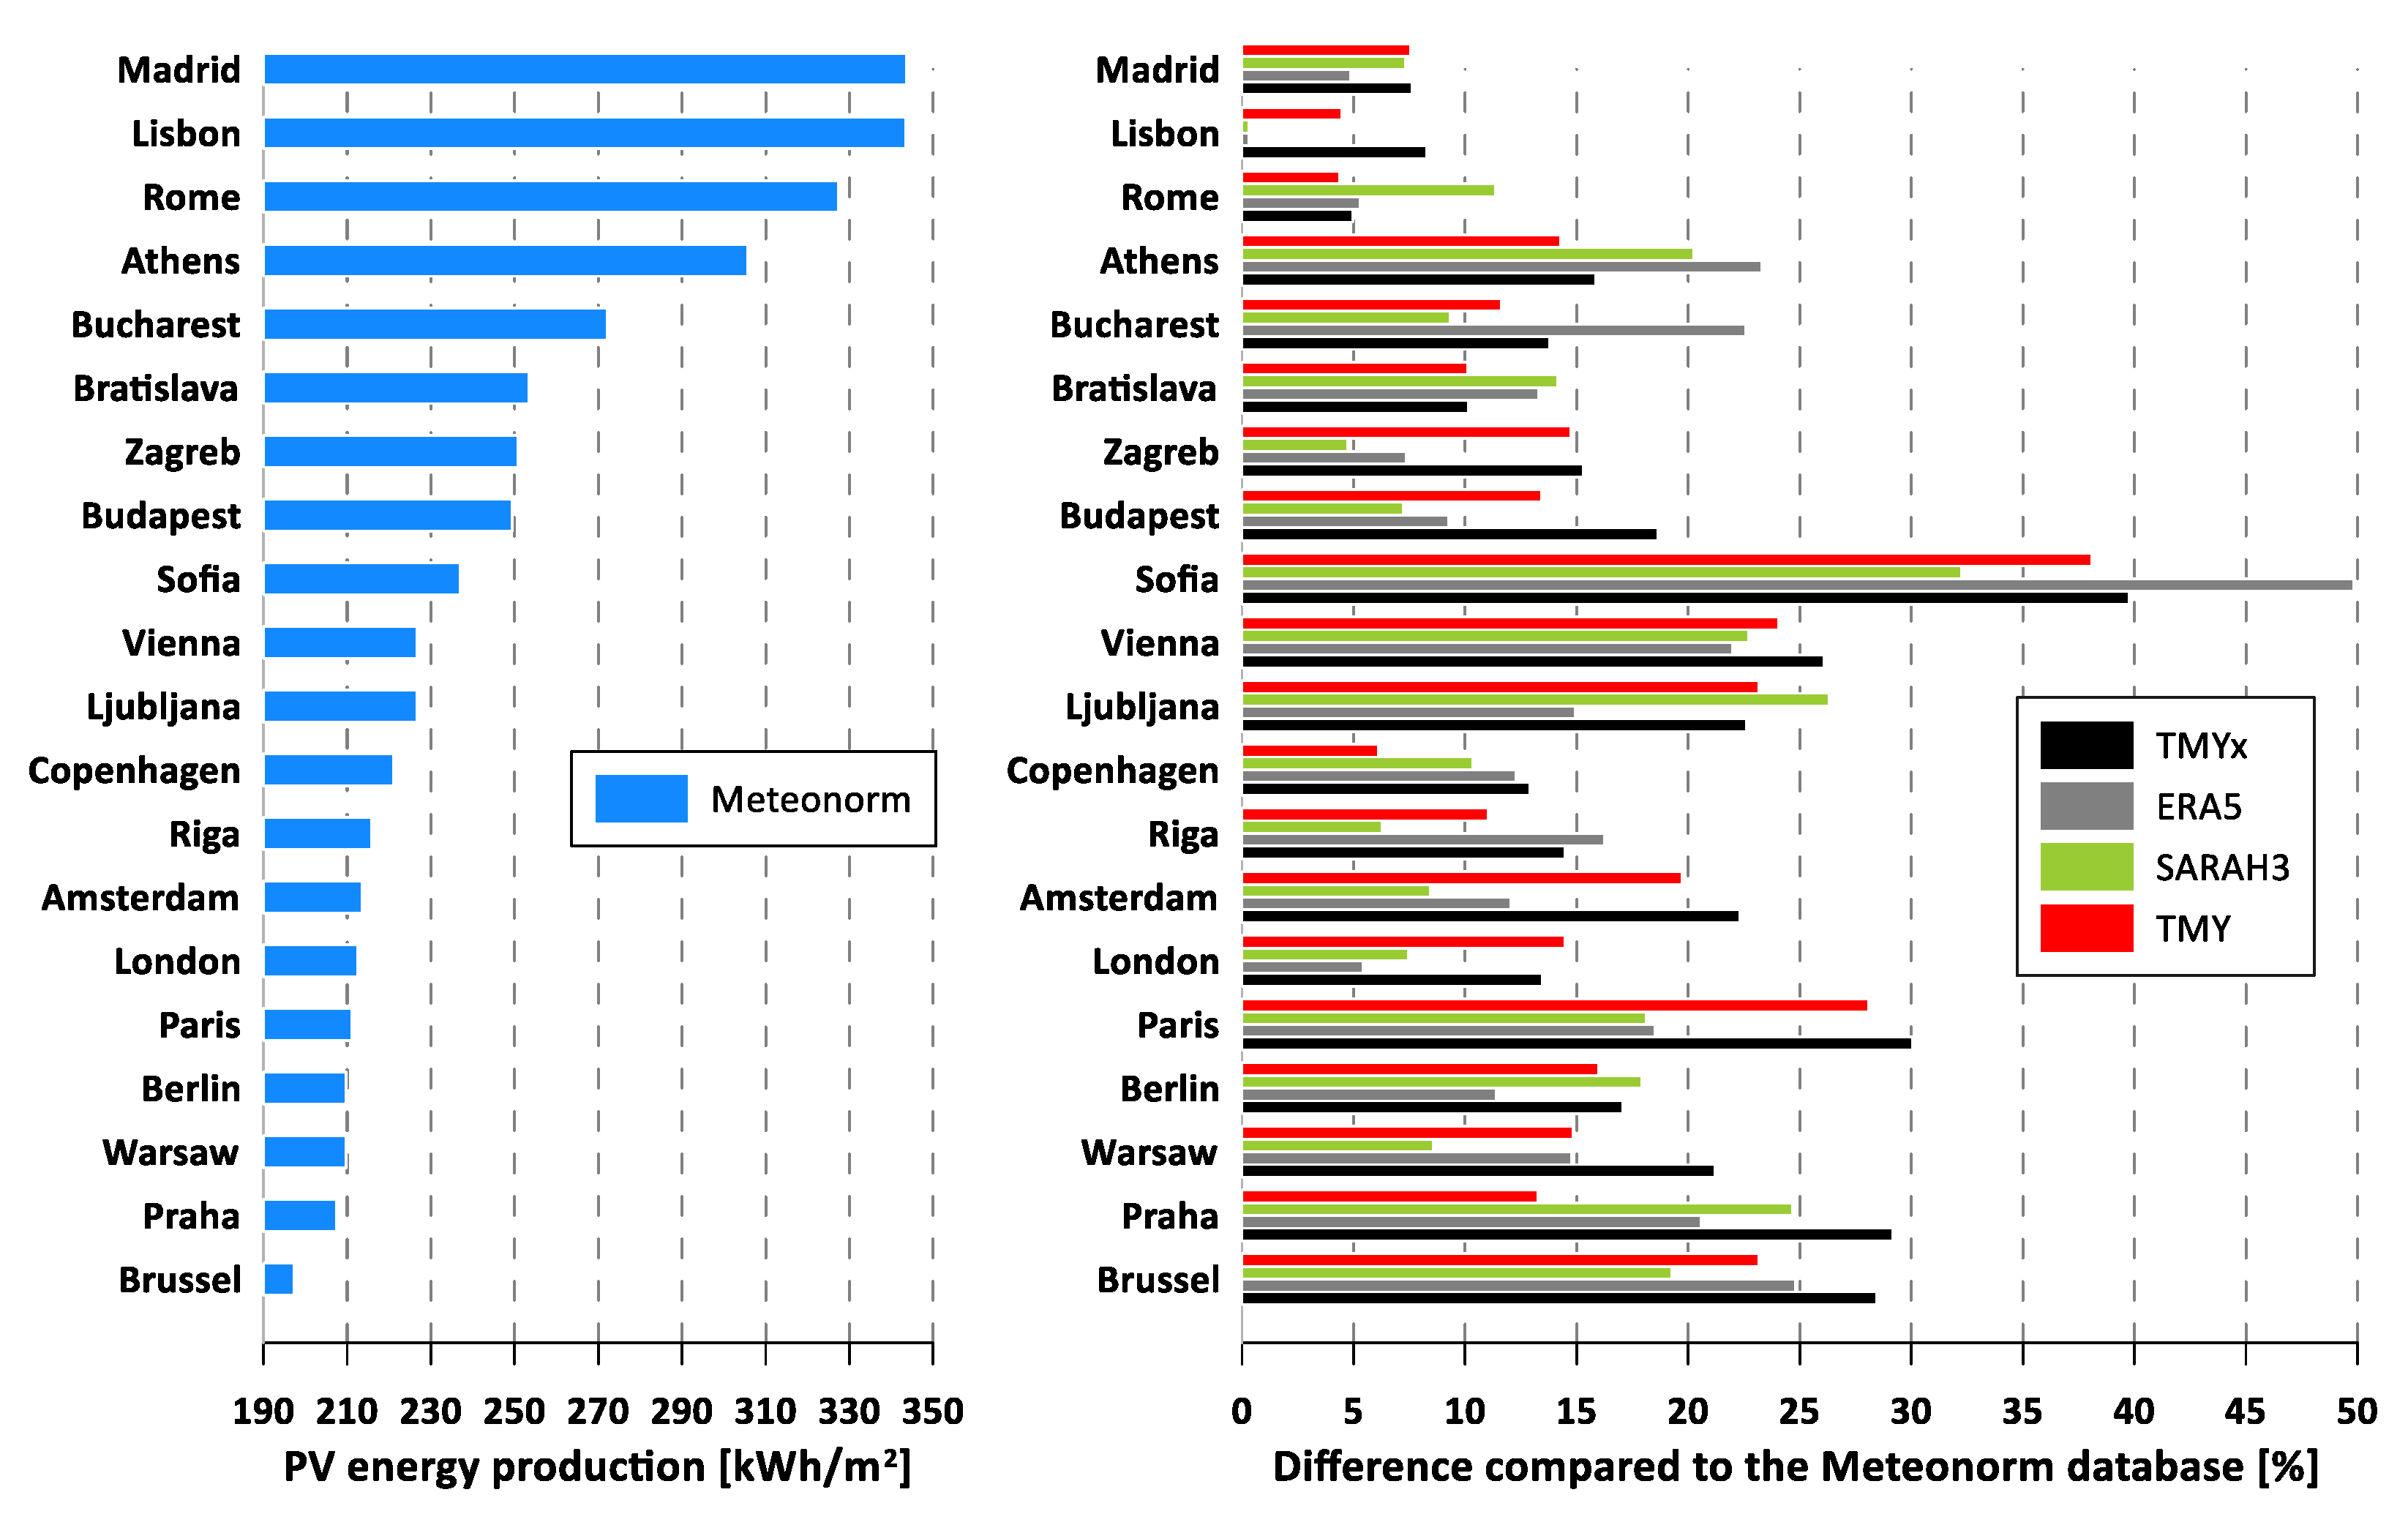
- Southern Europe: Our results demonstrated relatively high consistency and smaller discrepancies among the modern datasets.
- -
- Central and Northern Europe: We observed the largest discrepancies in annual radiation and simulated energy yield. Here, the choice of database is critically important and constitutes a major uncertainty factor that must be actively managed.
- Using older climatic databases to assess the project’s performance and bankability is a high-risk approach. The historical database consistently generated the lowest annual solar radiation and average ambient temperature values across nearly all locations. This directly leads to a systematic and significant underestimation of potential energy yield (by up to 40–50% in our simulations).
- Even the most modern, high-quality databases are not interchangeable. They exhibit systematic tendencies that a designer must understand to interpret simulation results correctly.
- Recommended best practice: Performing a sensitivity analysis to ensure the reliability and transparency of simulation results. Since no single database is perfect (even modern databases such as ERA5 and SARAH3 for the same period can produce different results) simulations should never rely on a single data source but on at least two types. Presenting clients or investors with a range of outcomes is more transparent and credible than providing a single, seemingly precise but potentially misleading value.
- Direct relevance for energy policy and decarbonization goals. Using outdated datasets can lead to substantial underestimation of available resources, resulting in overly conservative decarbonization targets and inefficient subsidy allocation. However, overestimation of generation potential increases the risk of underperforming infrastructure and missed climate objectives.
Author Contributions
Funding
Institutional Review Board Statement
Informed Consent Statement
Data Availability Statement
Conflicts of Interest
Nomenclature
| EPW | EnergyPlus Weather |
| ERA | European Centre for Medium-range Weather Forecast ReAnalysis |
| L | Latitude, °; |
| PV | Photovoltaic |
| PVGIS | Photovoltaic Geographical Information System |
| RES | Renewable Energy Systems |
| SARAH | SurfAce Radiation DAtaset Heliosat |
| SC | Solar Collector |
| TMY | Typical Meteorological Years |
| TRNSYS | TRaNsient SYStems Simulation |
| Optimal inclination angle, °; | |
| σ | Standard deviation |
References
- Pater, S. Increase of energy self-consumption in hybrid RES installations with PV panels and air-source heat pumps. Chem. Process Eng. New Front. 2023, 44, e43. [Google Scholar] [CrossRef]
- Moradi, A.; Kavgic, M.; Costanzo, V.; Evola, G. Impact of typical and actual weather years on the energy simulation of buildings with different construction features and under different climates. Energy 2023, 270, 126875. [Google Scholar] [CrossRef]
- Bryce, R.; Losada Carreño, I.; Kumler, A.; Hodge, B.M.; Roberts, B.; Brancucci Martinez-Anido, C. Consequences of neglecting the interannual variability of the solar resource: A case study of photovoltaic power among the Hawaiian Islands. Sol. Energy 2018, 167, 61–75. [Google Scholar] [CrossRef]
- Seyed Salehi, S.S.; Kalamees, T.; Kurnitski, J.; Thalfeldt, M. New typical meteorological year generation method based on long-term building energy simulations. Build. Environ. 2024, 256, 111504. [Google Scholar] [CrossRef]
- Zeng, Z.; Stackhouse, P.; Kim, J.H.; Muehleisen, R.T. Development of typical solar years and typical wind years for efficient assessment of renewable energy systems across the U.S. Appl. Energy 2025, 377, 124698. [Google Scholar] [CrossRef]
- Polo, J.; Alonso-Abella, M.; Martín-Chivelet, N.; Alonso-Montesinos, J.; López, G.; Marzo, A.; Nofuentes, G.; Vela-Barrionuevo, N. Typical Meteorological Year methodologies applied to solar spectral irradiance for PV applications. Energy 2020, 190, 116453. [Google Scholar] [CrossRef]
- Ernst, M.; Gooday, J. Methodology for generating high time resolution typical meteorological year data for accurate photovoltaic energy yield modelling. Sol. Energy 2019, 189, 299–306. [Google Scholar] [CrossRef]
- Anoune, K.; Bouya, M.; Astito, A.; Abdellah, A.B. Sizing methods and optimization techniques for PV-wind based hybrid renewable energy system: A review. Renew. Sustain. Energy Rev. 2018, 93, 652–673. [Google Scholar] [CrossRef]
- Cui, Y.; Yan, D.; Hong, T.; Xiao, C.; Luo, X.; Zhang, Q. Comparison of typical year and multiyear building simulations using a 55-year actual weather data set from China. Appl. Energy 2017, 195, 890–904. [Google Scholar] [CrossRef]
- Bigtashi, A.; Papakyriakou, A.; Lee, B. Defining generation parameters with an adaptable data-driven approach to construct typical meteorological year weather files. Energy Build. 2024, 303, 113781. [Google Scholar] [CrossRef]
- Costanzo, V.; Evola, G.; Infantone, M.; Marletta, L. Updated typical weather years for the energy simulation of buildings in mediterranean climate. A case study for sicily. Energies 2020, 13, 4115. [Google Scholar] [CrossRef]
- Kulesza, K. Comparison of typical meteorological year and multi-year time series of solar conditions for Belsk, central Poland. Renew. Energy 2017, 113, 1135–1140. [Google Scholar] [CrossRef]
- Gai, S.; Zhang, X.; Xie, J.; Xiao, G.; Liu, J. Comparison of typical meteorological year generation methods for building energy simulation in marine climate of China. Energy Build. 2024, 304, 113845. [Google Scholar] [CrossRef]
- Rudniak, J. Comparison of local solar radiation parameters with data from a typical meteorological year. Therm. Sci. Eng. Prog. 2020, 16, 100465. [Google Scholar] [CrossRef]
- Laetitia, U.; Kim, H.-G.; Kim, J.-Y.; Kim, B.; Kim, C.K. Multi-Year and Typical Year Data for Solar Energy System in South Korea. J. Korean Sol. Energy Soc. 2020, 40, 135–149. [Google Scholar] [CrossRef]
- Li, J.; Ma, X.; Shen, G.; Ren, Y.; Ma, Y.; Yu, Z.; Wang, Q.; Reaihan, E.; Ai, N.; Li, J.; et al. Optimal study of a hybrid solar-biomass heating system for rural household in cold regions of China. Sol. Energy 2024, 284, 113101. [Google Scholar] [CrossRef]
- Sun, C.; Ju, X.; Hao, W.; Lu, Y. Research on multi-objective optimization of control strategies and equipment parameters for a combined heating system of geothermal and solar energy in cold and arid regions based on TRNSYS. Case Stud. Therm. Eng. 2023, 50, 103441. [Google Scholar] [CrossRef]
- Wang, X.; Zhang, H.; Zang, P.; Cui, L.; Zhao, P.; Tang, J.; Wang, J.; Lee, C.; Dong, Y. Long-term performance simulation analysis of solar-assisted borehole thermal energy storage combined with a heat pump heating system. Renew. Energy 2025, 252, 123508. [Google Scholar] [CrossRef]
- Szymiczek, J.; Szczotka, K.; Michalak, P. Simulation of Heat Pump with Heat Storage and PV System—Increase in Self-Consumption in a Polish Household. Energies 2025, 18, 2325. [Google Scholar] [CrossRef]
- Huld, T.; Müller, R.; Gambardella, A. A new solar radiation database for estimating PV performance in Europe and Africa. Sol. Energy 2012, 86, 1803–1815. [Google Scholar] [CrossRef]
- Chen, H.; Li, X.; Gao, J.; Cao, J.; Dong, H.; Wang, W.; Chen, Y. Comparative study on a solar-assisted ground source heat pump with CPC solar collector and phase change heat storage. Renew. Energy 2025, 239, 122065. [Google Scholar] [CrossRef]
- Ren, C.; Lin, J.; Guo, N. Performance and Optimization of Novel Solar-Assisted Heat Pump System with Hybrid Thermal Energy Storage. Energies 2024, 17, 5944. [Google Scholar] [CrossRef]
- Naili, N.; Nouicer, O.; Attar, I.; Mgadmi, G. Optimization and behavior result analysis of a solar assisted ground source heat pump system using TRNSYS simulation tool. Geothermics 2025, 131, 103353. [Google Scholar] [CrossRef]
- Cao, Y.; Zhang, Z.; Jia, G.; Zhai, J.; Hao, J.; Zhang, M.; Jin, L. Performance Prediction and Analysis of Solar-Assisted Ground-Source Heat Pump Systems in Typical Rural Areas, China. Energies 2025, 18, 2208. [Google Scholar] [CrossRef]
- Wang, M.; Hu, E.; Chen, L. TRNSYS Simulation of a Bi-Functional Solar-Thermal-Energy-Storage-Assisted Heat Pump System. Energies 2024, 17, 3376. [Google Scholar] [CrossRef]
- Gagliano, A.; Tina, G.M.; Aneli, S. Improvement in Energy Self-Sufficiency in Residential Buildings Using Photovoltaic Thermal Plants, Heat Pumps, and Electrical and Thermal Storage. Energies 2025, 18, 1159. [Google Scholar] [CrossRef]
- Ahamed, M.S.; Guo, H.; Tanino, K. Modeling heating demands in a Chinese-style solar greenhouse using the transient building energy simulation model TRNSYS. J. Build. Eng. 2020, 29, 101114. [Google Scholar] [CrossRef]
- Kulesza, K.; Martinez, A.; Taylor, N. Assessment of Typical Meteorological Year Data in Photovoltaic Geographical Information System 5.2, Based on Reanalysis and Ground Station Data from 147 European Weather Stations. Atmosphere 2023, 14, 1803. [Google Scholar] [CrossRef]
- Chan, A.L.S.; Chow, T.T.; Fong, S.K.F.; Lin, J.Z. Generation of a typical meteorological year for Hong Kong. Energy Convers. Manag. 2006, 47, 87–96. [Google Scholar] [CrossRef]
- Hopfe, C.J.; Hensen, J.L.M. Uncertainty analysis in building performance simulation for design support. Energy Build. 2011, 43, 2798–2805. [Google Scholar] [CrossRef]
- Meteotest AG: Meteonorm. Data for TMY. Available online: https://docs.meteonorm.com/knowledge/climate/data-tmy (accessed on 20 October 2025).
- Pfeifroth, U.; Drücke, J.; Kothe, S.; Trentmann, J.; Schröder, M.; Hollmann, R. SARAH-3—Satellite-based climate data records of surface solar radiation. Earth Syst. Sci. Data 2024, 16, 5243–5265. [Google Scholar] [CrossRef]
- Urraca, R.; Huld, T.; Gracia-Amillo, A.; Martinez-de-Pison, F.J.; Kaspar, F.; Sanz-Garcia, A. Evaluation of global horizontal irradiance estimates from ERA5 and COSMO-REA6 reanalyses using ground and satellite-based data. Sol. Energy 2018, 164, 339–354. [Google Scholar] [CrossRef]
- Narowski, P.G. Analiza porównawcza typowych lat meteorologicznych Polski wyznaczonych na podstawie danych źródłowych z lat 2001–2020. Instal 2022, 10, 11–25. [Google Scholar] [CrossRef]
- Lawrie, L.K.; Drury, B.C. Development of Global Typical Meteorological Years (TMYx). Available online: https://climate.onebuilding.org/default.html (accessed on 20 October 2025).
- Babar, B.; Graversen, R.; Boström, T. Solar radiation estimation at high latitudes: Assessment of the CMSAF databases, ASR and ERA5. Sol. Energy 2019, 182, 397–411. [Google Scholar] [CrossRef]
- Kupiec, K.; Pater, S. On the possibility of achieving high solar fractions for space heating in temperate climates. Sol. Energy 2025, 300, 113789. [Google Scholar] [CrossRef]
- Pater, S. Increasing Energy Self-Consumption in Residential Photovoltaic Systems with Heat Pumps in Poland. Energies 2023, 16, 4003. [Google Scholar] [CrossRef]
- Thermal Energy System Specialists LLC. TRNSYS 18—A Transient System Simulation Program; Standard Component Library Overview; University of Wisconsin-Madison: Madison, WI, USA, 2017; Volume 3. [Google Scholar]
- European Solar Thermal Industry Federation. Solar Domestic Hot Water preparation (SDHW). Available online: http://www.estif.org/st_energy/technology/solar_domestic_hot_water_heating_sdhw/ (accessed on 20 October 2025).
- Chinchilla, M.; Santos-Martín, D.; Carpintero-Rentería, M.; Lemon, S. Worldwide annual optimum tilt angle model for solar collectors and photovoltaic systems in the absence of site meteorological data. Appl. Energy 2021, 281, 116056. [Google Scholar] [CrossRef]



| Meteorological Data Repository | Input Data Period | Period Length (Years) | Shortcut |
|---|---|---|---|
| Meteonorm V5.0 | 1961–1990 | 30 | Meteonorm |
| PVGIS-SARAH3 | 2005–2023 | 19 | SARAH3 |
| PVGIS-ERA5 | 2005–2023 | 19 | ERA5 |
| TMYx | 2009–2023 | 15 | TMYx |
| No. | Country Code—Capital | TMY Input Data Period | Period Length (Years) |
|---|---|---|---|
| 1. | AU—Vienna | 1952–2023 | 72 |
| 2. | BE—Brussel | 1940–2023 | 84 |
| 3. | BG—Sofia | 1937–2023 | 87 |
| 4. | CZ—Praha | 1932–2023 | 92 |
| 5. | DE—Berlin | 1955–2023 | 69 |
| 6. | DK—Copenhagen | 1931–2023 | 93 |
| 7. | ES—Madrid | 1957–2023 | 67 |
| 8. | FR—Paris | 1958–2023 | 66 |
| 9. | GB—London | 1948–2023 | 76 |
| 10. | GR—Athens | 1949–2023 | 75 |
| 11. | HR—Zagreb | 1941–2023 | 83 |
| 12. | HU—Budapest | 1952–2023 | 72 |
| 13. | IT—Rome | 1951–2023 | 73 |
| 14. | LV—Riga | 1932–2023 | 92 |
| 15. | NL—Amsterdam | 1949–2023 | 75 |
| 16. | PL—Warsaw | 1932–2023 | 92 |
| 17. | PT—Lisbon | 1935–2023 | 89 |
| 18. | RO—Bucharest | 1936–2023 | 88 |
| 19. | SI—Ljubljana | 1952–2023 | 72 |
| 20. | SK—Bratislava | 1940–2023 | 84 |
| PV Panel Installation | |
| Parameter | Value |
| Panel area [m2] | 1.953 |
| Nominal maximum panel power [Wp] | 400 |
| Short-circuit current at reference conditions [A] | 13.76 |
| Current at max power point and reference conditions [A] | 13.01 |
| Open-circuit voltage at reference conditions [V] | 36.75 |
| Voltage at max power point and reference conditions [V] | 30.75 |
| Temperature coefficient of Isc [A/K] | 0.050 |
| Temperature coefficient of Voc [V/K] | −0.265 |
| Solar Collector Installation | |
| Parameter | Value |
| Collector area [m2] | 6.0 |
| Intercept Efficiency a0 [-] | 0.85 |
| 1st Order Efficiency Coefficient a1 [W/(m2K)] | 4.0 |
| 2nd Order Efficiency Coefficient a2 [W/(m2K)] | 0.015 |
| Country Code —Capital | AU—Vienna | BE—Brussel | BG—Sofia | CZ—Praha | DE—Berlin | DK—Copenhagen | ES—Madrid | FR—Paris | GB—London | GR—Athens | HR—Zagreb | HU—Budapest | IT—Rome | LV—Riga | NL—Amsterdam | PL—Warsaw | PT—Lisbon | RO—Bucharest | SI—Ljubljana | SK—Bratislava |
|---|---|---|---|---|---|---|---|---|---|---|---|---|---|---|---|---|---|---|---|---|
| [°] | 48.12 | 50.90 | 42.70 | 50.07 | 52.56 | 55.61 | 40.48 | 48.78 | 51.48 | 37.89 | 45.82 | 47.44 | 41.81 | 56.95 | 52.32 | 52.16 | 38.78 | 44.51 | 46.22 | 48.17 |
[°] | 37.3 | 36.1 | 32.1 | 35.7 | 36.8 | 38.0 | 30.9 | 35.1 | 36.3 | 29.5 | 33.7 | 34.5 | 31.7 | 38.5 | 36.7 | 36.6 | 30.0 | 33.1 | 33.9 | 34.8 |
| Country Code—Capital | MAX [kWh/m2] | MIN [kWh/m2] | Difference [%] |
|---|---|---|---|
| AU–Vienna | 1272 | 1114 | 14.3 |
| BE–Brussel | 1117 | 956 | 16.9 |
| BG–Sofia | 1533 | 1187 | 29.2 |
| CZ–Praha | 1168 | 1000 | 16.8 |
| DE–Berlin | 1104 | 1003 | 10.1 |
| DK–Copenhagen | 1053 | 989 | 6.4 |
| ES–Madrid | 1748 | 1664 | 5.0 |
| FR–Paris | 1239 | 1038 | 19.3 |
| GB–London | 1064 | 925 | 15.0 |
| GR–Athens | 1829 | 1565 | 16.8 |
| HR–Zagreb | 1321 | 1212 | 9.0 |
| HU–Budapest | 1314 | 1200 | 9.6 |
| IT–Rome | 1703 | 1565 | 8.8 |
| LV–Riga | 1057 | 967 | 9.3 |
| NL–Amsterdam | 1130 | 988 | 14.4 |
| PL–Warsaw | 1118 | 994 | 12.5 |
| PT–Lisbon | 1765 | 1657 | 6.6 |
| RO–Bucharest | 1314 | 1200 | 9.6 |
| SI– Ljubljana | 1339 | 1115 | 20.1 |
| SK– Bratislava | 1329 | 1214 | 9.4 |
| Europe | Capital | [°] | PV Efficiency [%] | σ [%] | SCs Efficiency [%] | σ [%] |
|---|---|---|---|---|---|---|
| Northern | Riga | 56.95 | 18.65 | 0.06 | 25.99 | 0.22 |
| Copenhagen | 55.61 | 18.65 | 0.05 | 27.31 | 0.31 | |
| Central & Western | Berlin | 52.56 | 18.29 | 0.12 | 27.81 | 0.46 |
| Amsterdam | 52.32 | 18.44 | 0.04 | 28.20 | 0.23 | |
| Warsaw | 52.16 | 18.38 | 0.09 | 27.41 | 0.28 | |
| London | 51.48 | 18.41 | 0.06 | 28.67 | 0.32 | |
| Brussel | 50.90 | 18.36 | 0.10 | 28.12 | 0.27 | |
| Praha | 50.07 | 18.37 | 0.05 | 27.86 | 0.43 | |
| Paris | 48.78 | 18.23 | 0.11 | 27.69 | 0.66 | |
| Bratislava | 48.17 | 18.25 | 0.08 | 27.55 | 0.71 | |
| Vienna | 48.12 | 18.33 | 0.12 | 28.05 | 0.25 | |
| Budapest | 47.44 | 18.16 | 0.11 | 28.35 | 0.59 | |
| Ljubljana | 46.22 | 18.36 | 0.12 | 27.66 | 0.83 | |
| Zagreb | 45.82 | 18.16 | 0.07 | 27.87 | 0.70 | |
| Bucharest | 44.51 | 18.18 | 0.13 | 27.29 | 0.38 | |
| Southern | Sofia | 42.70 | 18.56 | 0.25 | 27.28 | 0.43 |
| Rome | 41.81 | 18.01 | 0.08 | 27.64 | 0.57 | |
| Madrid | 40.48 | 18.03 | 0.08 | 25.83 | 0.48 | |
| Lisbon | 38.78 | 18.02 | 0.07 | 26.98 | 0.43 | |
| Athens | 37.89 | 17.65 | 0.10 | 26.76 | 0.98 |
Disclaimer/Publisher’s Note: The statements, opinions and data contained in all publications are solely those of the individual author(s) and contributor(s) and not of MDPI and/or the editor(s). MDPI and/or the editor(s) disclaim responsibility for any injury to people or property resulting from any ideas, methods, instructions or products referred to in the content. |
© 2025 by the authors. Licensee MDPI, Basel, Switzerland. This article is an open access article distributed under the terms and conditions of the Creative Commons Attribution (CC BY) license (https://creativecommons.org/licenses/by/4.0/).
Share and Cite
Pater, S.; Szczotka, K. Comparison of Typical Meteorological Years for Assessment and Simulation of Renewable Energy Systems. Energies 2025, 18, 6063. https://doi.org/10.3390/en18226063
Pater S, Szczotka K. Comparison of Typical Meteorological Years for Assessment and Simulation of Renewable Energy Systems. Energies. 2025; 18(22):6063. https://doi.org/10.3390/en18226063
Chicago/Turabian StylePater, Sebastian, and Krzysztof Szczotka. 2025. "Comparison of Typical Meteorological Years for Assessment and Simulation of Renewable Energy Systems" Energies 18, no. 22: 6063. https://doi.org/10.3390/en18226063
APA StylePater, S., & Szczotka, K. (2025). Comparison of Typical Meteorological Years for Assessment and Simulation of Renewable Energy Systems. Energies, 18(22), 6063. https://doi.org/10.3390/en18226063


