Article

Topology and Reactive Power Co-Optimization for Condition-Aware Distribution Network Reconfiguration

by
Arash Mohammadi Vaniar
,
Mohammad Mansouri
and
Mohsen Assadi
*
Department of Energy and Petroleum Engineering, University of Stavanger, 4019 Stavanger, Norway
*
Author to whom correspondence should be addressed.
Energies 2025, 18(22), 6062; https://doi.org/10.3390/en18226062
Submission received: 29 October 2025 / Revised: 12 November 2025 / Accepted: 18 November 2025 / Published: 20 November 2025

Abstract

Distribution networks (DNs) now operate under tighter conditions due to rising penetration of renewables, active prosumers, and exposure to transmission-level contingencies. Distribution Network Reconfiguration (DNR) has proven effective for reducing losses, improving voltage profiles, and enhancing the resiliency of the grid. This paper introduces a three-stage optimization strategy for DNR, combining topological reconfiguration with reactive power support. The first stage, Reconfiguration of Tie-Line Switches (RTLS), utilizes a Particle Swarm Optimization (PSO) algorithm augmented with a Depth-First Search (DFS) mechanism to identify optimal radial structures that minimize active power losses. Once a viable configuration is established, the process proceeds to the second stage, Shunt Capacitor Sizing (SCS), wherein PSO is again employed to determine optimal capacitor sizing across predefined bus locations. The third stage reexecutes the RTLS process using the updated reactive power profile to assess whether further improvements in loss reduction can be achieved. If a superior topology is discovered, it is adopted as the final configuration; otherwise, the SCS solution is retained. This iterative and feedback-based architecture ensures an effective balance between network efficiency and voltage stability using a heuristic approach. The proposed methodology is validated on the IEEE 33-bus and IEEE 123-bus benchmark systems, as well as a custom 7-bus test case. Comprehensive scenario-based analysis, including normal, heavily, and lightly loaded conditions and varying power factor (PF) cases (good and poor PF), confirms the robustness and effectiveness of the approach in achieving considerable loss minimization and voltage profile improvement. For instance, in heavy-load conditions, active-power losses dropped by 39% and 70% for 33-bus and 123-bus cases, respectively.

1. Introduction

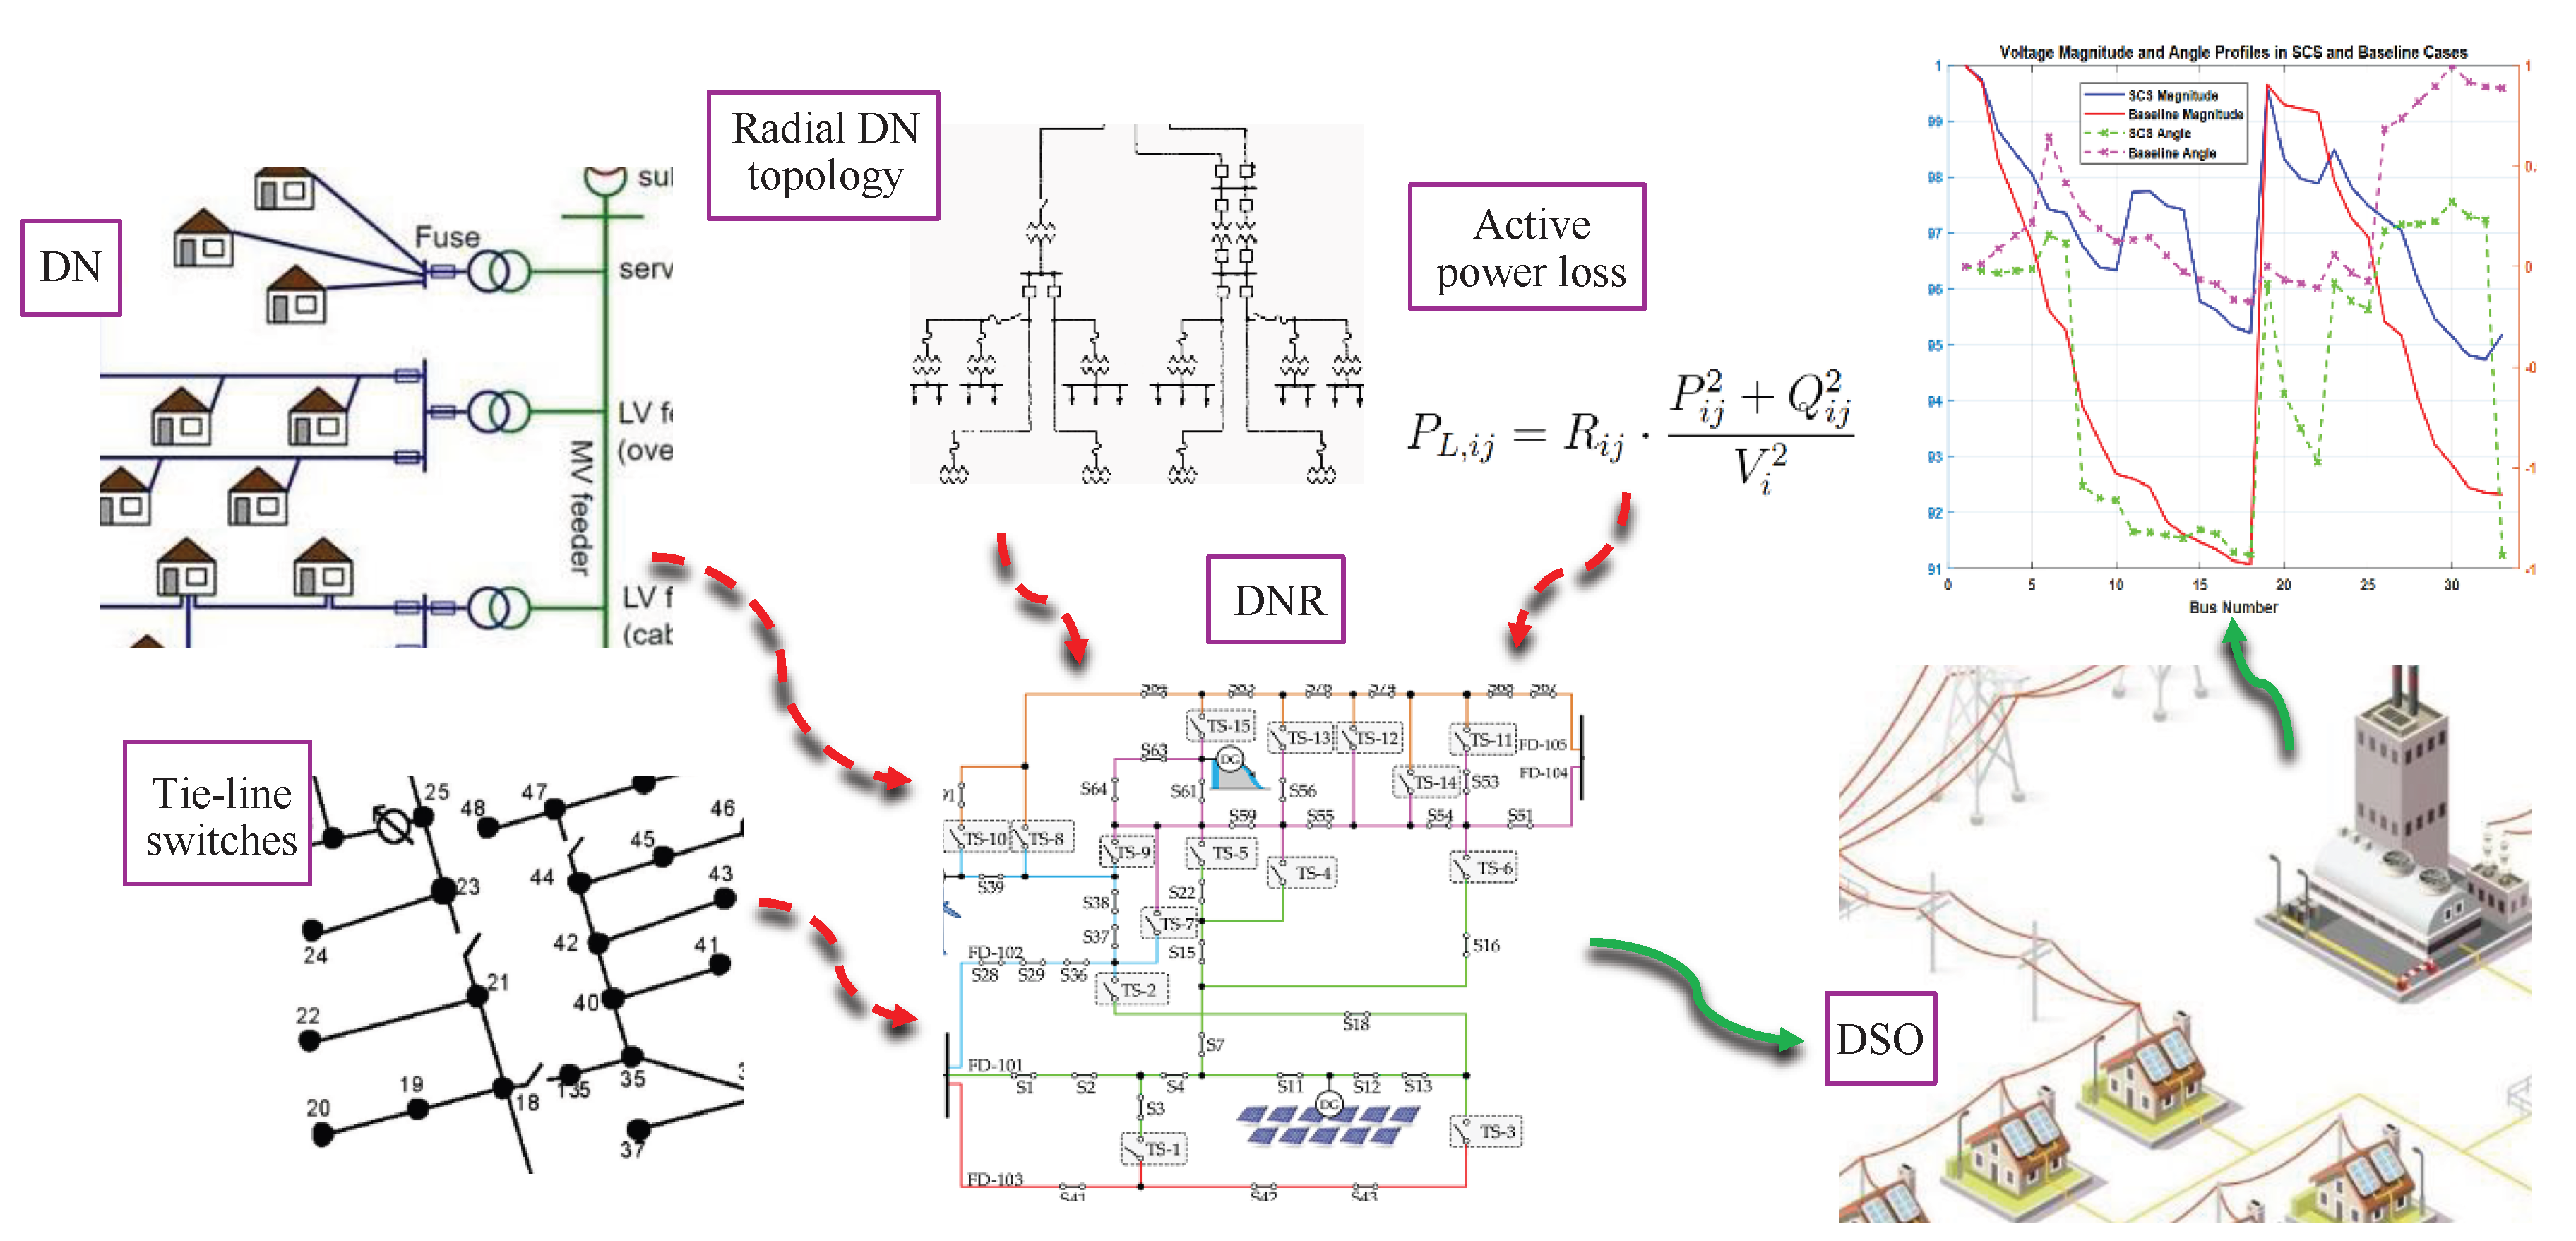
Distribution Network Reconfiguration (DNR) is increasingly central as Distributed Energy Resources (DERs) reshape distribution operations. While DERs advance sustainability and decentralization [1], their intermittency introduces bidirectional flows and voltage rise and raises power quality concerns [2]. Without targeted control, high DER penetration aggravates losses and voltage deviations [3,4]. DNR addresses these issues by altering topology via tie-line switching to reduce losses, improve voltage profiles, and expand renewable hosting capacity [5]. It also enhances distribution system operator (DSO) flexibility, enabling real-time responses to congestion and variability and deferring costly reinforcements through better use of existing assets [6]. As demonstrated in Figure 1, DNR changes the radial topology of a DN by operating tie-line switches. The goal is to reduce feeder active power losses and improve bus voltage profiles while keeping the network radial and within operational limits. The DSO uses this technical flexibility approach [7] in real-time or day-ahead operation strategies to adapt the DN to load and generation conditions.

Literature Review

The concept of DNR was first introduced for meshed networks using Kirchhoff’s second law in [8], aiming to minimize active power losses by identifying optimal radial topologies. A compensation-based power flow technique to reduce line losses was later proposed in [9]. Building upon this, ref. [10] formulated a mathematical approach to feeder reconfiguration using search-based methods, while [11] contributed approximate power flow models tailored for reconfiguration tasks. Evolutionary computation began entering the field in [12], where Genetic Algorithms (GAs) were applied to solve the loss minimization problem under a mixed-integer framework. Similarly, ref. [13] implemented a Simulated Annealing method for line loss reduction using simplified load flow models. More recent work has explored advanced metaheuristic methods: ref. [14] introduced a heap-based structure to enhance voltage profiles and reduce losses, and ref. [15] proposed a Shark Smell Optimization algorithm aimed at improving reliability and voltage stability.
The inclusion of high-penetration Renewable Energy Sources (RESs) in DNs increases the complexity of DNR, especially due to their intermittent behavior. Reconfiguration decisions alter tie-line switch statuses and impact backup power management and grid dynamics. Consequently, the use of accurate AC power flow models has been recommended [16,17,18], as they closely reflect the physical behavior of real-world systems. However, combining continuous AC flow equations with binary switch status variables transforms the DNR problem into a Mixed-Integer Nonlinear Programming (MINLP) challenge. A variety of solution methodologies have been proposed, including stochastic [19], deterministic [20], and robust optimization [21], as well as Second-Order Cone Programming (SOCP) relaxations [22,23], and branch-and-bound [24]. Model Predictive Control (MPC) has also been applied for adaptive reconfiguration under uncertainty [25].
Several heuristic approaches have been developed to handle the combinatorial nature of DNR. These include classic and modified GAs [26], Particle Swarm Optimization (PSO) variants [27], and novel techniques such as the θ -bat algorithm [28], branch current matrix methods [29], and the Firefly algorithm [30]. Each method aims to reduce power losses, enhance voltage profiles, or both—offering trade-offs in accuracy and computational efficiency. Beyond energy efficiency, DNR has been used to improve power quality metrics. A non-iterative Harmonic Load Flow (HLF) method is proposed in [31] to address harmonic distortions in capacitor-compensated networks. Similarly, refs. [32,33] apply discrete PSO techniques to minimize voltage flicker, balance voltages, and reduce power losses under varying load conditions. The integration of DERs and RESs has motivated new DNR strategies. In [34], an Ant Lion Optimizer is used to minimize operational costs under RES uncertainty. Ref. [35] explores the Selective Bat Algorithm for both balanced and unbalanced networks. Ref. [36] presents a dynamic DNR approach incorporating RESs, energy storage, and electricity price variability, validated on the IEEE 95-bus system.
Several studies have explored hybrid algorithms that merge the strengths of multiple metaheuristics. Ref. [37] combines binary PSO with conventional PSO for joint DNR and DG placement. A hybrid PSO–ACO model is proposed in [38], and further comparisons between PSO, GA, and exhaustive search are made in [39]. PSO-based frameworks integrating DG sizing are also demonstrated in [40,41]. Harmony Search Algorithms (HSA) are employed in [42] to jointly optimize DNR and DG placement while satisfying operational constraints. Addressing uncertainty and operational cost, ref. [43] proposes a scenario-based stochastic framework for RES-integrated microgrids. Ref. [44] considers the impact of electric vehicles on tie-line switching, and ref. [45] optimizes scheduling and reconfiguration jointly using PSO while incorporating demand response and protection costs. Ref. [46] analyzes DNR frequency and switching replacement strategies across different time scales. In [47], dynamic DNR is combined with power electronics to maximize hosting capacity. Refs. [48,49] develop optimization frameworks to enhance HC in RES-rich environments using DNR, OLTCs, and DG allocation. Refs. [50,51] explore unbalanced operation scenarios with reported reductions in power losses by 12% and 25%, respectively. The work in [52] integrates photovoltaic generation with STATCOMs and reconfiguration, tested on the IEEE 33-bus system. To address challenges from increasing EV and DG integration, ref. [53] proposes a stochastic DNR approach using PDFs and Monte Carlo simulations, achieving loss minimization and operational efficiency across varying EV/DG penetration levels. A fault recovery strategy for DC networks is introduced in [54], utilizing EV discharging and Soft Open Points (SOPs) within a two-tier optimization framework, ensuring load restoration and minimized losses under post-disaster scenarios.
Recent work combines DG siting/sizing with DNR to jointly reduce losses and improve voltage regulation. The Electric Eel Foraging Optimization achieves strong loss and voltage gains on 33- and 84-bus feeders and outperforms Zebra and Whale optimizers while requiring no parameter tuning [55]. A graph-theory-enhanced Adaptive Mountain Gazelle Optimizer co-optimizes reconfiguration and PV DG placement and improves stability, cost, and emissions on IEEE 33 and 69 buses [56]. Improved radiality maintenance with IRMA and hybrid GA–TLBO and TLBO–GA delivers faster convergence and lower losses and voltage deviations across benchmarks [57]. Hippopotamus Optimization for DG–DNR under voltage-dependent loads surpasses standalone DG planning on large systems [58]. A distributed ADMM formulation decomposes DNR across agents while preserving radiality and scales to standard and real networks [59]. A Simulated Annealing framework with reactive compensation models hourly variability with BESS and DG under operational limits [60]. A Selective PSO implementation on a 125-bus Indonesian feeder improves voltage and reduces losses across load scenarios, supporting practical feasibility [61].
Recent studies have emphasized hybrid optimization strategies that integrate distributed generation (DG) allocation with DNR for improved efficiency and voltage regulation. The Electric Eel Foraging Optimization (EEFO) algorithm introduces adaptive search behaviors and parameter-free tuning, achieving substantial loss reduction and voltage improvements in 33- and 84-bus networks, outperforming other metaheuristics like Zebra and Whale optimizers [55]. Similarly, a graph-theory-enhanced Adaptive Mountain Gazelle Optimizer (AMGO) is developed to jointly optimize reconfiguration and photovoltaic DG placement, delivering enhanced voltage stability and cost-effectiveness while significantly reducing emissions in the IEEE 33- and 69-bus systems [56]. An improved radiality maintenance framework using IRMA, along with two hybrid metaheuristic schemes (GA-TLBO and TLBO-GA), shows superior convergence and stability across benchmark systems by effectively minimizing power losses and voltage deviations [57]. Another novel approach employs the Hippopotamus Optimization Algorithm (HOA) for DG-DNR co-optimization under voltage-dependent load models, demonstrating marked improvements over standalone DG planning across large-scale systems [58]. A distributed ADMM-based method for DNR is proposed in [59], decomposing the optimization problem across agents while maintaining radial topology, validated on both standard and real-world networks. In parallel, ref. [60] formulates a realistic DNR framework incorporating reactive power compensation using Simulated Annealing, addressing hourly variations in load and generation with BESS and DG under operational constraints. Additionally, a Selective PSO method applied to a 125-bus Indonesian network under various load scenarios effectively enhances voltage profiles and reduces power losses, reinforcing the method’s practical feasibility [61].
Recent work applies Deep Reinforcement Learning (DRL) to DNR for adaptive operation under both normal and faulted conditions. RDDNR enables real-time reconfiguration and fast post-fault restoration, which strengthens resilience and service continuity [62]. A multi-agent DRL scheme for urban networks introduces a switch-contribution metric and a two-stage learning design with reward sharing and an improved QMIX, and it scales to a 297-node practical system [63]. A bi-level, data-driven Volt/Var Control formulates continuous PV control and discrete reconfiguration as a POMDP, combines TD3 and DDQN, and uses graph neural networks to compress the topology space, achieving stronger voltage regulation on IEEE 33- and 69-bus feeders [64]. Also, authors proposed a dynamical sequential DNR approach using DRL in [65].
Despite advancements in DNR, existing methods often suffer from oversimplified modeling (e.g., DC or linearized AC power flow), limited scalability, and a lack of adaptability under dynamic grid conditions. To address these challenges, this paper introduces a robust three-stage optimization framework for DNR that integrates network reconfiguration and reactive power support, leveraging full AC power flow modeling for accuracy. The proposed method is validated on the IEEE 33-bus, the IEEE 123-bus, and a custom 7-bus system. To examine robustness and applicability, the methodology is tested under five realistic conditions: heavy loading, light loading, normal loading, poor power factor (PF), and good PF scenarios. The core contributions of the paper are as follows:
  • A modular three-stage design that decouples reconfiguration from reactive compensation while preserving radiality.
  • A DFS-augmented PSO in the initial and feedback stages that enforces connectivity and minimizes active power losses.
  • A feedback stage that conditionally refines topology using updated reactive profiles when further gains are possible.
  • Full AC power-flow modeling throughout and comprehensive validation on IEEE 33/123 and a 7-bus system under five operating conditions, demonstrating scalability and robustness.
The remainder of the paper presents the methodology and solution procedure in Section 2, Section 3 presents the case study, numerical results are provided in Section 4, and finally, Section 5 concludes the paper.
2. The Proposed Methodology

The active power losses are minimized in radial DNs using a sequential three-stage framework under AC power flow modeling to ensure high modeling accuracy and reflect the physical behavior of the DN [66,67,68,69]. The steady-state behavior of DNs can be accurately described using conventional AC power flow equations [70]. The complex power injected at each bus is formulated in Equation (1), with its real and imaginary components corresponding to the active and reactive power injections, respectively, as shown in Equations (2) and (3). These equations incorporate bus voltage magnitudes, voltage angles, and the real and imaginary parts of line admittances. To maintain the secure operation of the DN, operational constraints must be enforced. These include the voltage limits at each bus (Equation (4)) and thermal loading limits of distribution lines (Equation (5)). Lastly, to ensure the network operates with a radial topology, the structure must satisfy the spanning tree condition, whereby the rank of the network’s adjacency matrix is equal to the number of buses minus one (Equation (6)).
S i = V i k = 1 n V k ( G i k + j B i k ) ( cos ( θ i θ k ) + j sin ( θ i θ k ) ) ( i , k )
P i = V i k = 1 n V k G i k cos ( θ i θ k ) + B i k sin ( θ i θ k ) ( i , k )
Q i = V i k = 1 n V k G i k sin ( θ i θ k ) B i k cos ( θ i θ k ) ( i , k )
V i min | V i | V i max , i B
| I i k | I i k max ( i , k )
rank ( A ik ) = | B | 1
In the first stage of the proposed methodology, a PSO with an in-loop DFS algorithm ensures tie-line switch statuses u to minimize active power losses as Equation (7), which is subjected to AC power flow constraints.
F = min u ( i , j ) E Lines P L , i j ( u )
P L , i j = R i j · P i j 2 + Q i j 2 V i 2
where P L , i j ( u ) is the active power loss on line ( i , j ) as a function of the topology determined by u .
To ensure the feasibility of candidate topologies during optimization, a DFS-based mechanism is implemented in the first stage. Each candidate configuration generated by the PSO in Stage 1 is represented as an undirected graph G = ( V , E ) , where the active branch set is defined according to the switch status vector. For a configuration to be feasible, the following two key conditions must be satisfied:
1.
Connectivity: All buses in the network must be reachable from the slack bus.
2.
Radiality: The resulting graph must form a spanning tree, which is ensured by verifying
| E | = | V | 1 and rank ( A ) = | V | 1
where A is the incidence matrix of the network.
The DFS traversal initiates from the slack bus and marks each node visited during the traversal. If the number of visited nodes equals the total number of buses and the active branch count satisfies the radiality constraint, the configuration is deemed valid. Otherwise, a penalty term is applied in the fitness function to discourage the selection of infeasible solutions. By embedding DFS directly into the optimization loop, the search space is effectively constrained to topologies that preserve both connectivity and radiality. This ensures that the PSO algorithm explores only operationally feasible configurations, enhancing both the computational efficiency and the convergence behavior of the proposed methodology.
Given the topology update from Stage 1, shunt injections Q cap are sized by another PSO to further reduce losses and improve voltages as modeled by the Equation (10) as follows:
F = min Q cap ( i , j ) E Lines P L , i j ( u , Q cap )
subject to
0 Q cap , i Q cap , i max , i
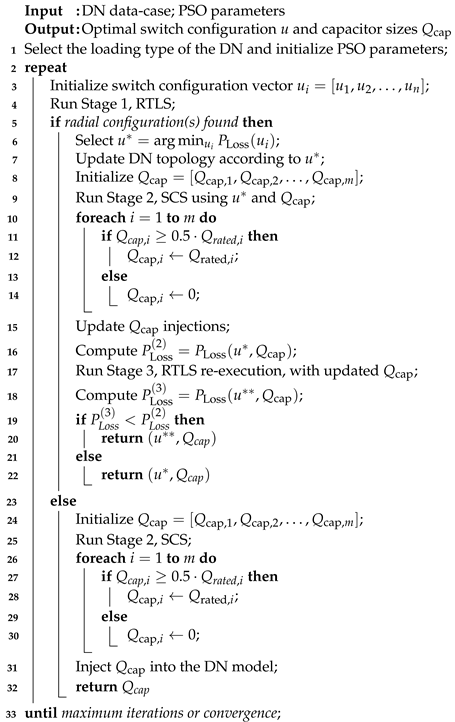
where Q cap = [ Q cap , 1 , Q cap , 2 , . . . , Q cap , m ] is the vector of reactive power injections from shunt capacitors installed at m candidate buses. Reactive injections reduce upstream reactive demand and associated losses, improving voltage support at distant buses. In practice, shunt capacitor banks are typically operated in discrete steps (often whole-bank on/off) to limit mechanical wear-and-tear cost and reduce transient switching. To this end, Stage 2 treats each installed shunt capacitor with the following logic implemented in the second stage: if the resultant size at a candidate bus is at least 50% of the shunt capacitor’s rating, then it is switched on; otherwise, it remains off. This logic is formulated by Equation (12).
Q cap , i = Q rated , i , if Q cap , i 0.5 × Q rated , i 0 , otherwise
The final stage re-applies RTLS with updated reactive injections from Stage 2 to explore further loss reduction opportunities. If the new configuration outperforms the previous stage, it is adopted; otherwise, the solution from Stage 2 is retained. This staged framework ensures computational tractability while progressively ensuring the near-optimality of the results obtained by the proposed DFS-based PSO method.

Solution Procedure

This subsection describes the complete solution process for the proposed three-stage DNR optimization framework, aimed at reducing power losses and improving voltage profiles in DNs. The steps of the methodology are outlined in Algorithm 1, which integrates a PSO approach to determine both the optimal switching configuration and capacitor sizes. The process begins by selecting the DN’s operating condition (e.g., heavy/light/normal loading, and good/poor PF). PSO parameters, including inertia weight and acceleration coefficients, are initialized. The optimization loop then proceeds until the maximum number of iterations is reached or the convergence criteria are satisfied. In each iteration, Stage 1 (RTLS) is executed first to identify a feasible radial topology that minimizes active power losses. If a valid configuration is obtained, the network is reconfigured by updating the network topology accordingly, and proceeds to Stage 2. Stage 2 (SCS) follows, wherein candidate shunt capacitors are sized based on their effectiveness: units reaching at least 50% of rated capacity are activated fully, while others remain off. The updated reactive injections are then incorporated into the network. Next, Stage 3 re-runs RTLS using the updated reactive power data from Stage 2. If the new topology results in lower active power losses than the previous stage, it is adopted as the final solution. Otherwise, the Stage 2 configuration is retained. If Stage 1 fails to find a valid radial topology due to reaching a local optimum, the algorithm skips penalization and directly proceeds to Stage 2, finalizing the configuration with capacitor sizing alone. However, if RTLS fails without reaching optimality, a penalty is applied to the fitness function, and PSO continues exploring alternative configurations. This iterative procedure continues until termination conditions are met, at which point the final network topology and shunt capacitor sizes are returned as the optimal solution. It is noteworthy to add that the Newton–Raphson (NR) method is used to solve the AC power flow equations within all stages, and standard termination thresholds are used as the mismatch of the active power losses and the maximum iteration, which are set to be 1 × 10⁻⁶ and 50, respectively.
Algorithm 1: Pseudo-code for the proposed methodology
Energies 18 06062 i001

3. Case Study

To validate the proposed three-stage optimization framework for the DNR problem, simulations are conducted on three test systems of varying complexity and scale: the IEEE 33-bus feeder (Case 1), the IEEE 123-bus feeder (Case 2), and a compact illustrative 7-bus system (Case 3). These systems are selected to evaluate the method’s effectiveness, scalability, and flexibility under different operational conditions. All simulations are executed on a standard PC with an Intel Core i5-10300H processor (2.50 GHz) and 8 GB of RAM. MATLAB version 2022b is used as a software for simulation purposes. Figure 2 demonstrates baseline topologies and candidate tie-line switches for Cases 1 and 2. The key modeling details for each case are summarized below:
  • Case 1: Includes five tie-line switches and five shunt capacitors, each rated at 90 kVAr, installed at buses 6, 12, 20, 23, and 29.
  • Case 2: Includes 11 tie-line switches and 5 shunt capacitors (90 kVAr each) at buses 33, 41, 75, 96, and 114. Buses 251 and 451 are treated as external transmission sources to emulate realistic interfacing with upstream networks.
  • Case 3: A simplified test case including three fixed shunt capacitors (50 kVAr each) placed at buses 3, 4, and 5. This case serves to analyze system behavior when minimal reconfiguration is possible due to limited topology flexibility.
Cases 1 and 2 are evaluated under five operating scenarios to simulate diverse practical conditions: normal, light, heavy loading, good and poor PF conditions. The PSO algorithm uses a swarm of 50 particles and runs for a maximum of 50 iterations. The acceleration coefficients are set to c 1 = 2.0 and c 2 = 1.6 . Here, c 1 is the cognitive (self-learning) term and c 2 is the social (swarm-learning) term. These terms control how strongly each particle is attracted to its own best-known position and to the global best position. The inertia weight w is decreased linearly from w max = 0.93 to w min = 0.4 to enforce a controlled shift from global exploration in early iterations to local exploitation in later iterations. At iteration k, the inertia weight is given by Equation (13):
w ( k ) = w max w max w min K max k ,
where k is the current iteration index and K max is the maximum number of iterations. To assess the performance of the proposed methodology, simulation outputs are categorized into the following four stages:
  • Baseline: Power flow analysis of the initial configuration with no switching or capacitor support.
  • RTLS (Stage 1): Topology reconfiguration via the DFS-based PSO algorithm.
  • SCS (Stage 2): Reactive compensation through optimized capacitor sizing.
  • RTLS’ (Stage 3): Final topology re-evaluation based on the reactive power compensation from Stage 2.
These outputs are analyzed and compared in Section 4, where detailed numerical results are presented for all scenarios. The comparison includes key metrics such as total active power loss, voltage profile enhancement, and switching efficiency, highlighting the impact and practicality of each optimization stage. It is noteworthy to state that numerical results are reported in rounded form to reflect modeling assumptions, numerical tolerances, and other sources of approximation in the calculation process.

4. Numerical Results

4.1. Case 1 Results

This section presents the numerical results for Case 1. The performance of the proposed three-stage methodology is evaluated under five distinct loading scenarios: normal, heavy, and light loading in Section 4.1.1, and poor and good PF conditions in Section 4.1.2. The notation RTLS’ refers to the results of the third stage, re-execution of RTLS, in figures and tables.

4.1.1. Normal, Light, and Heavy Loading Conditions

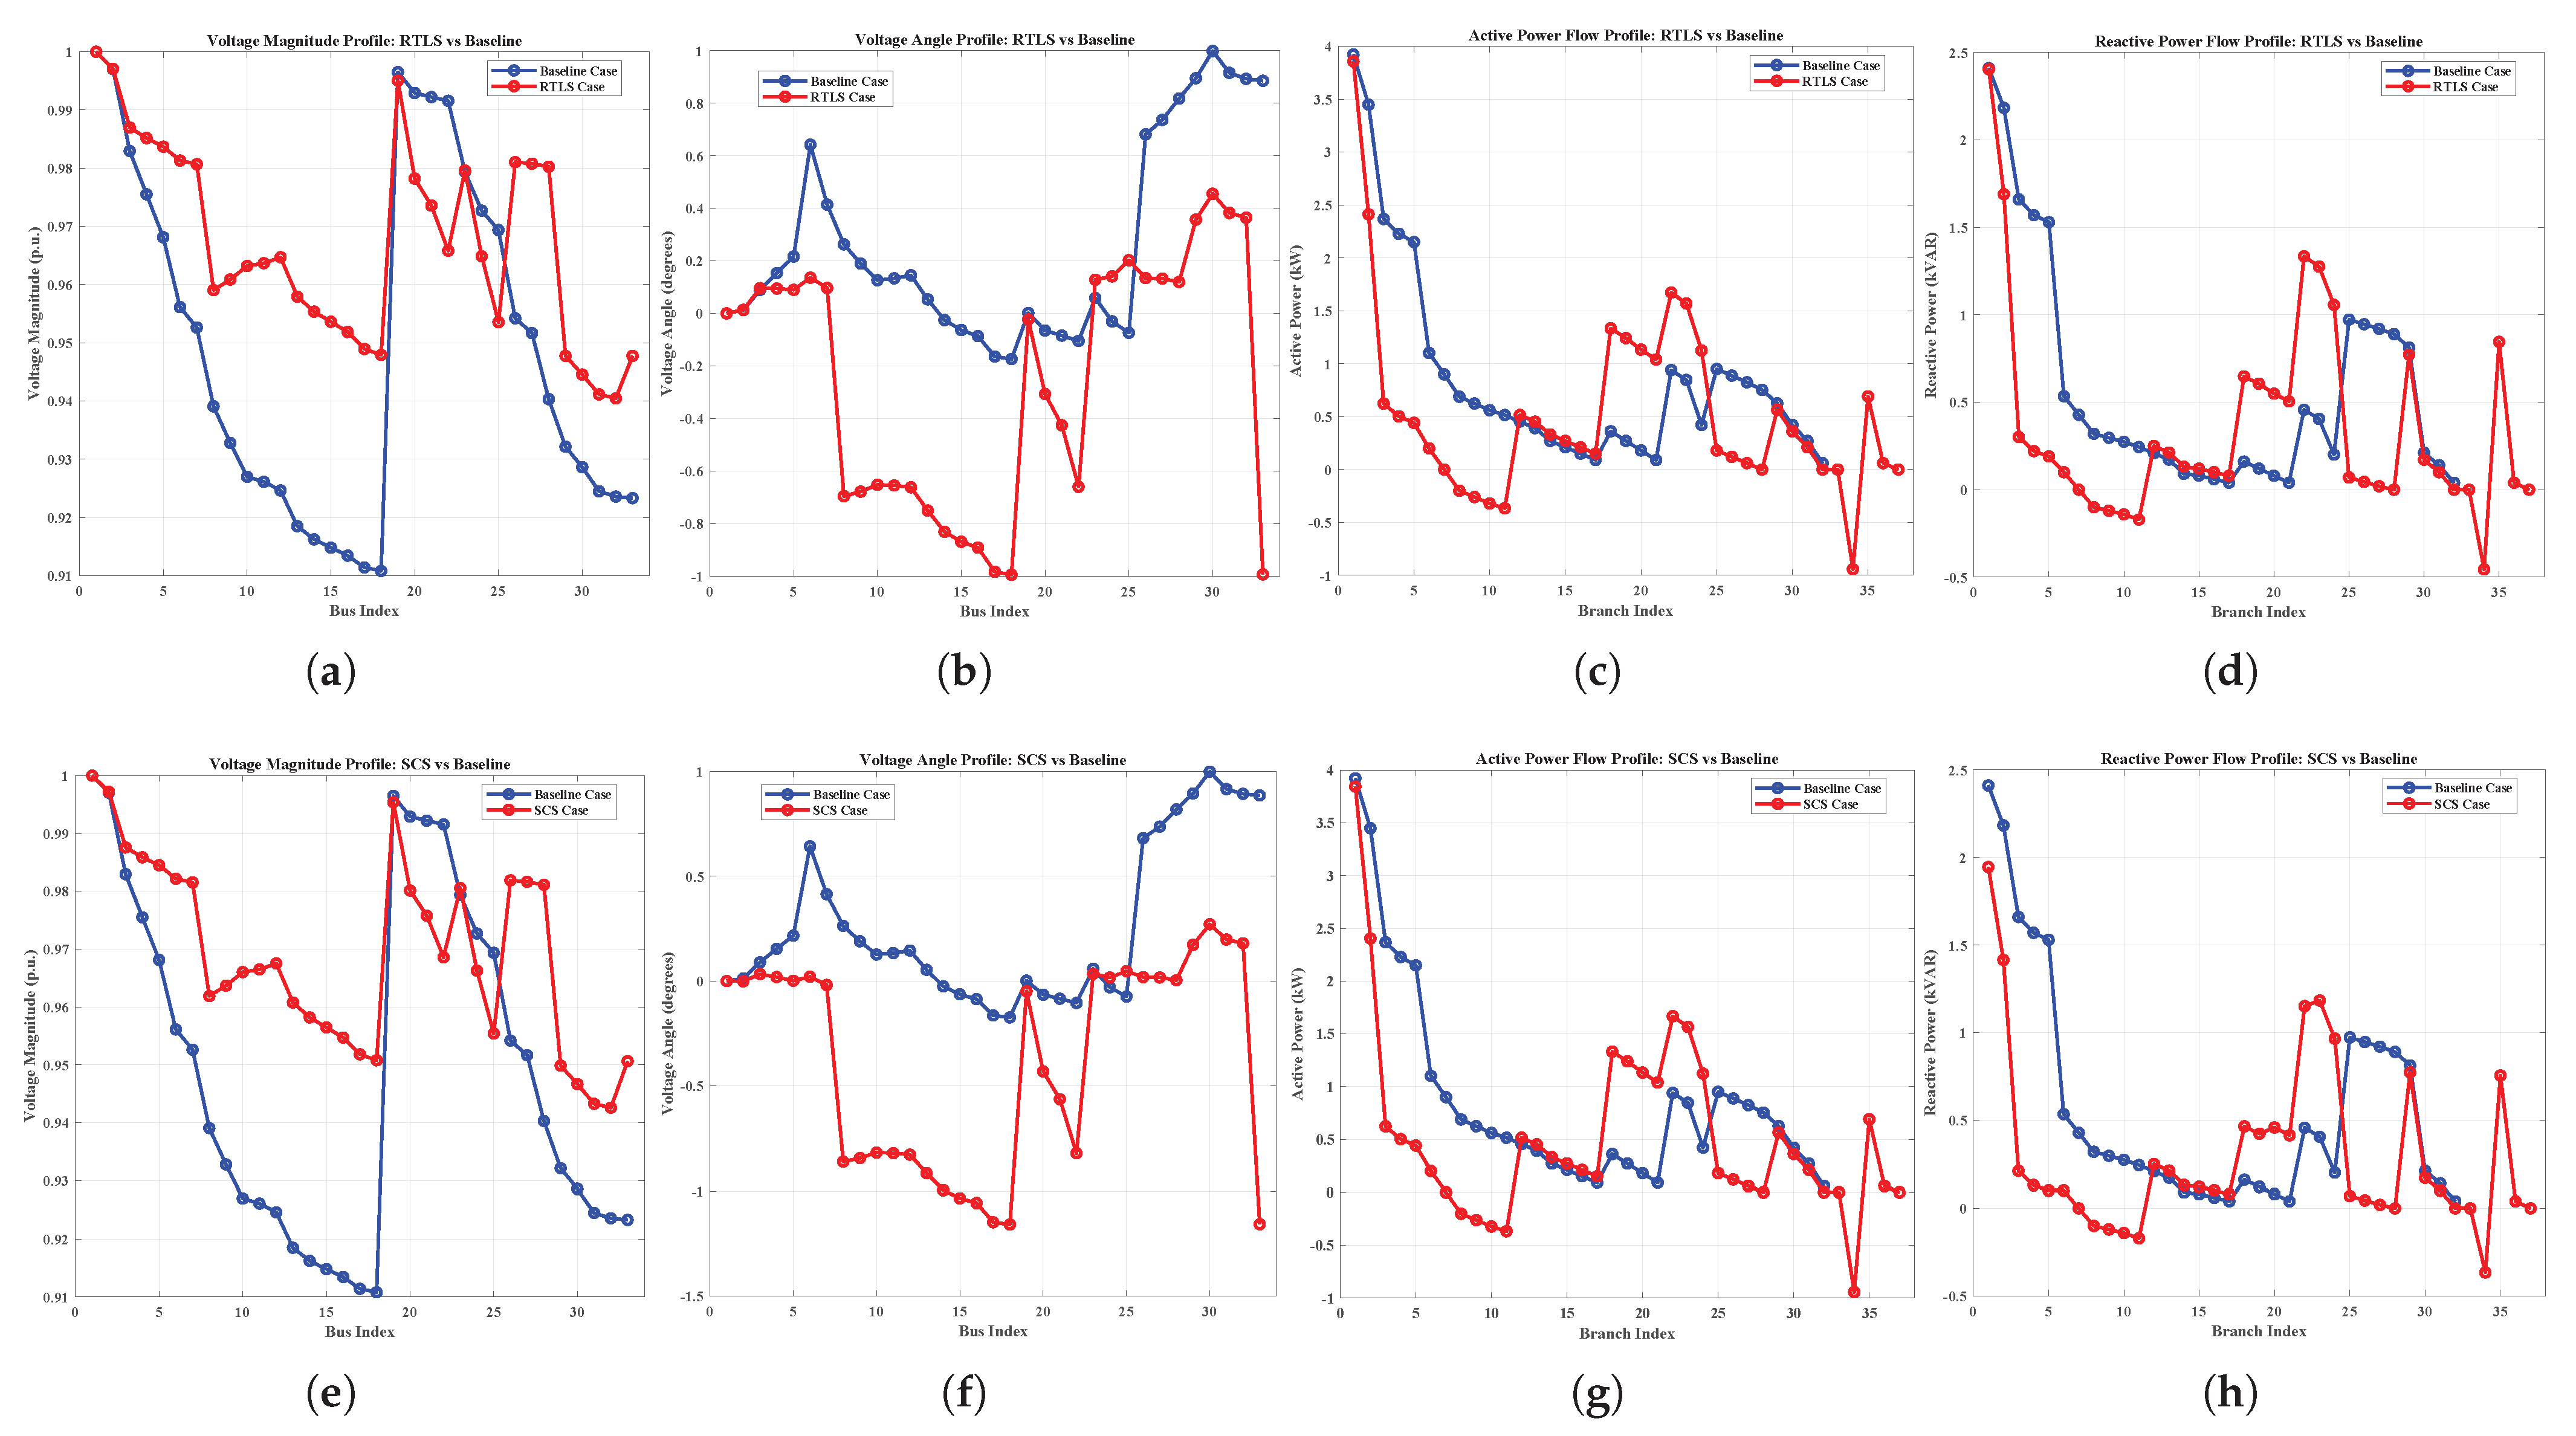
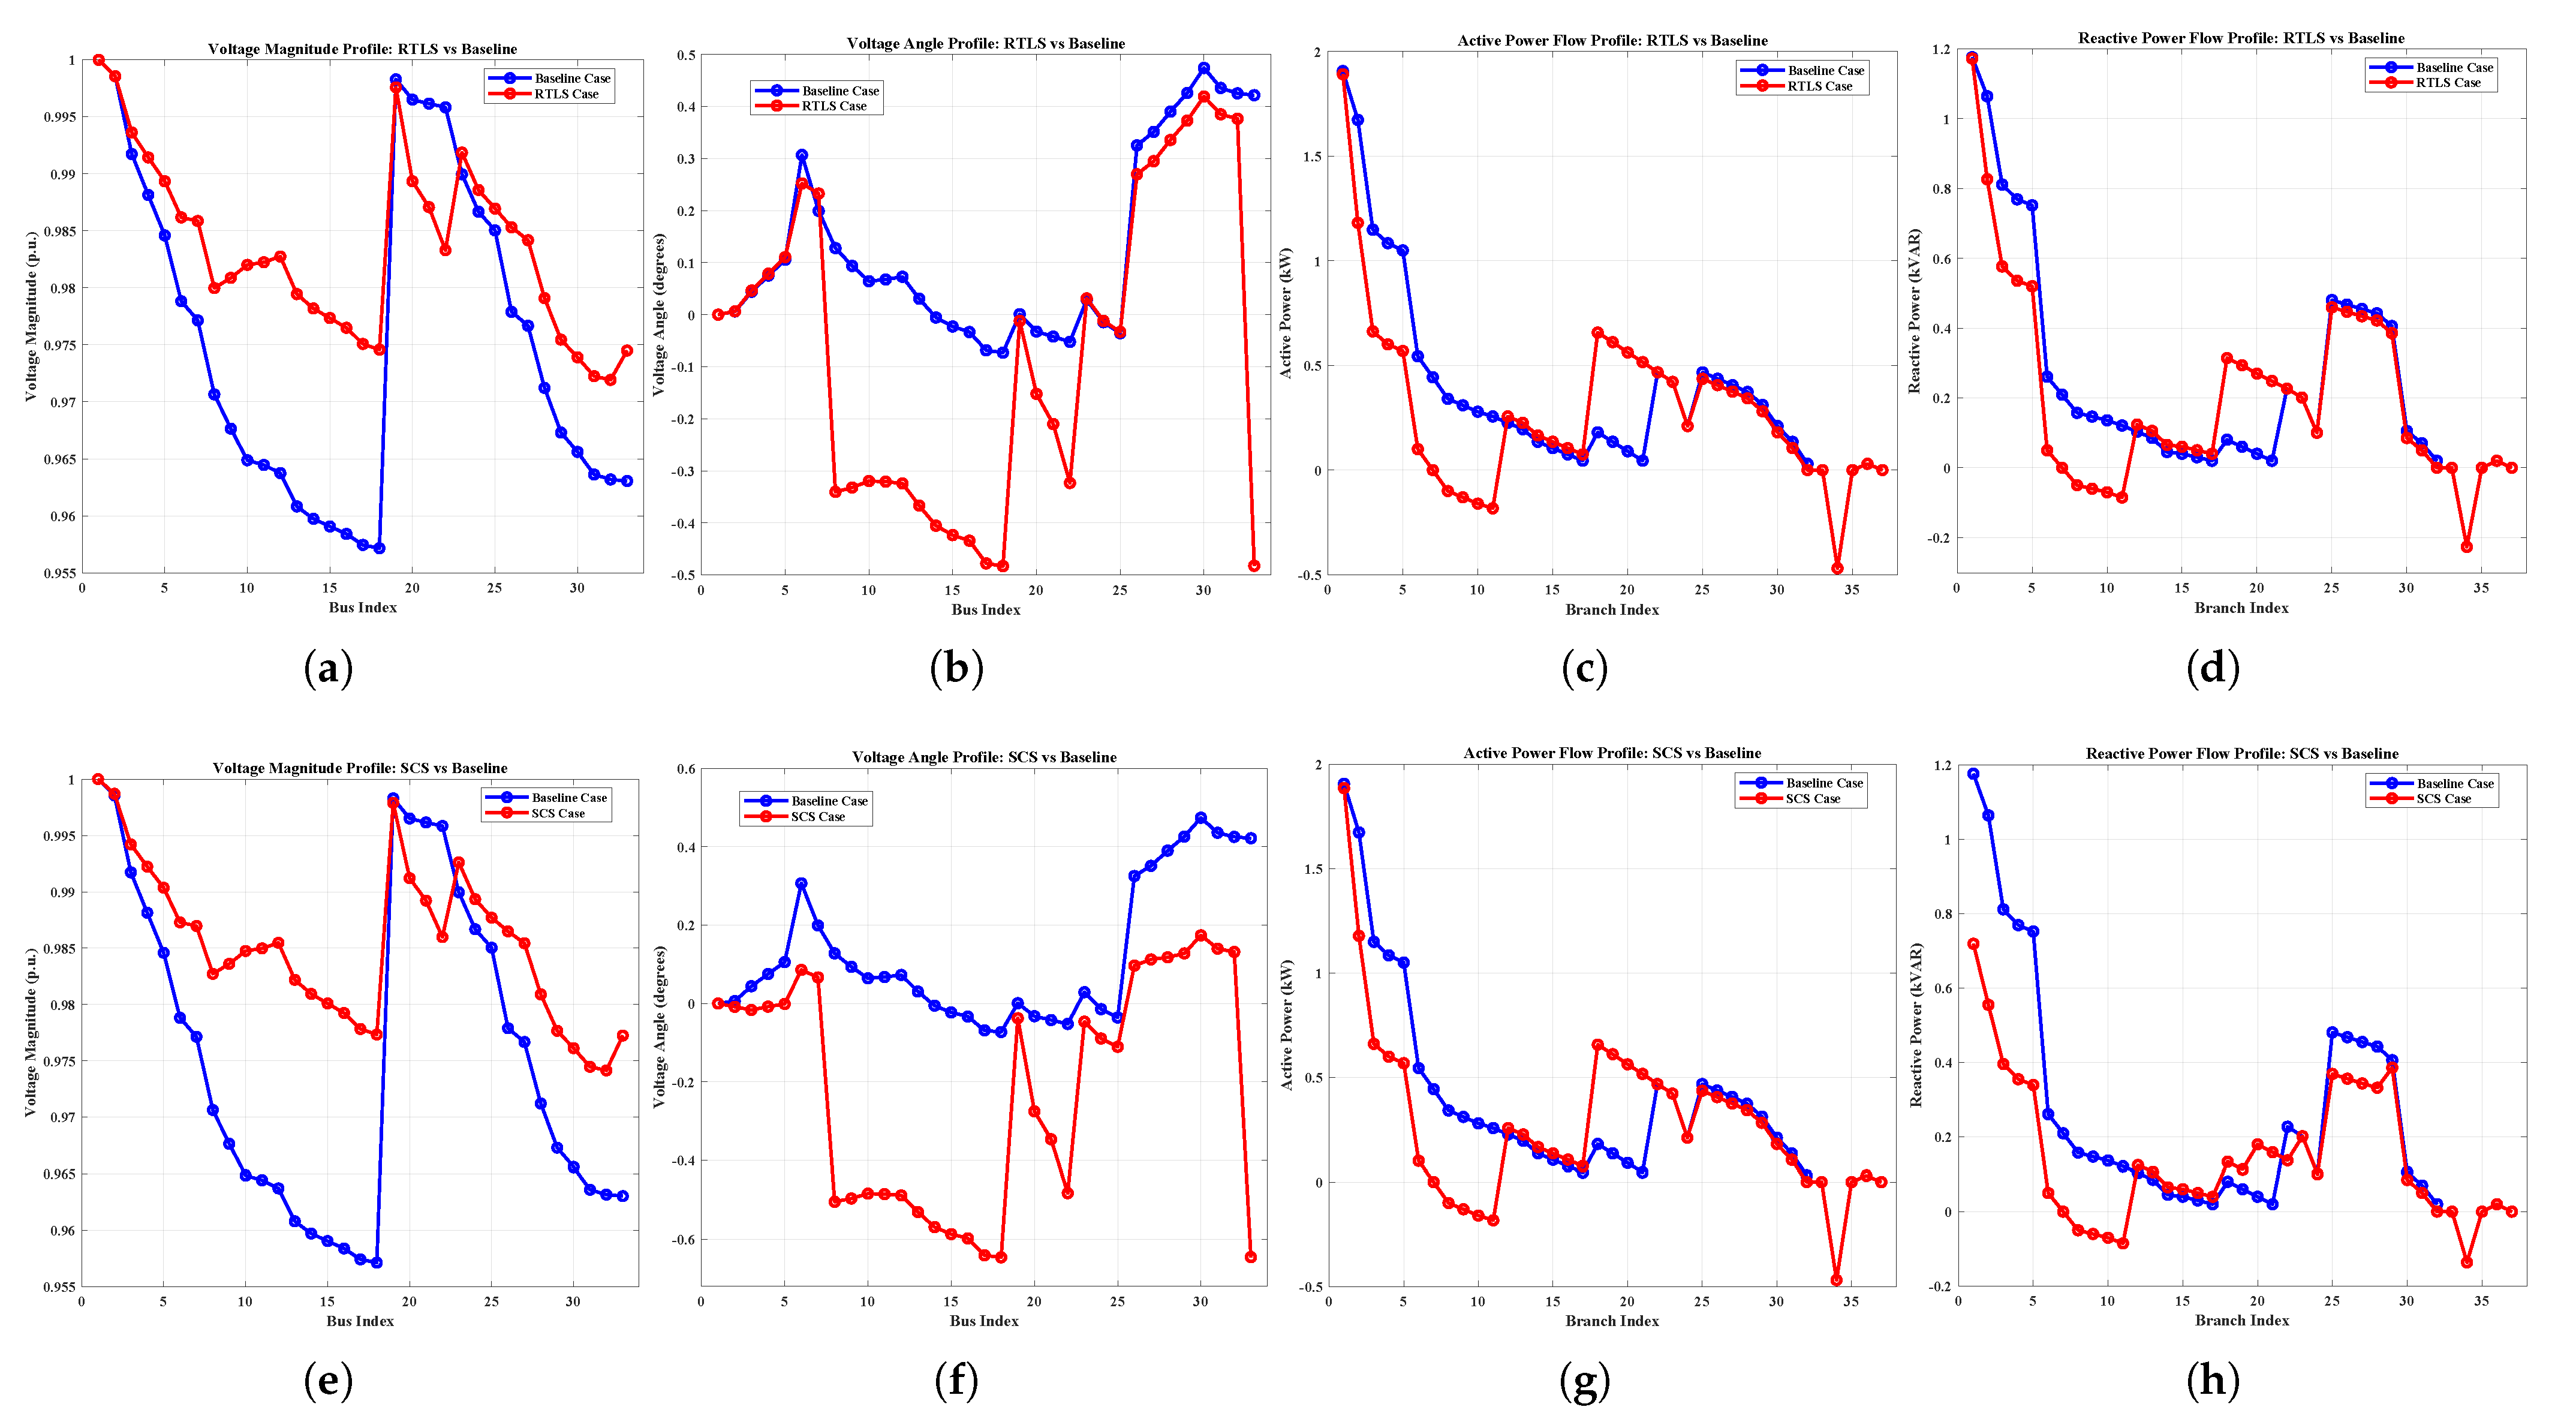
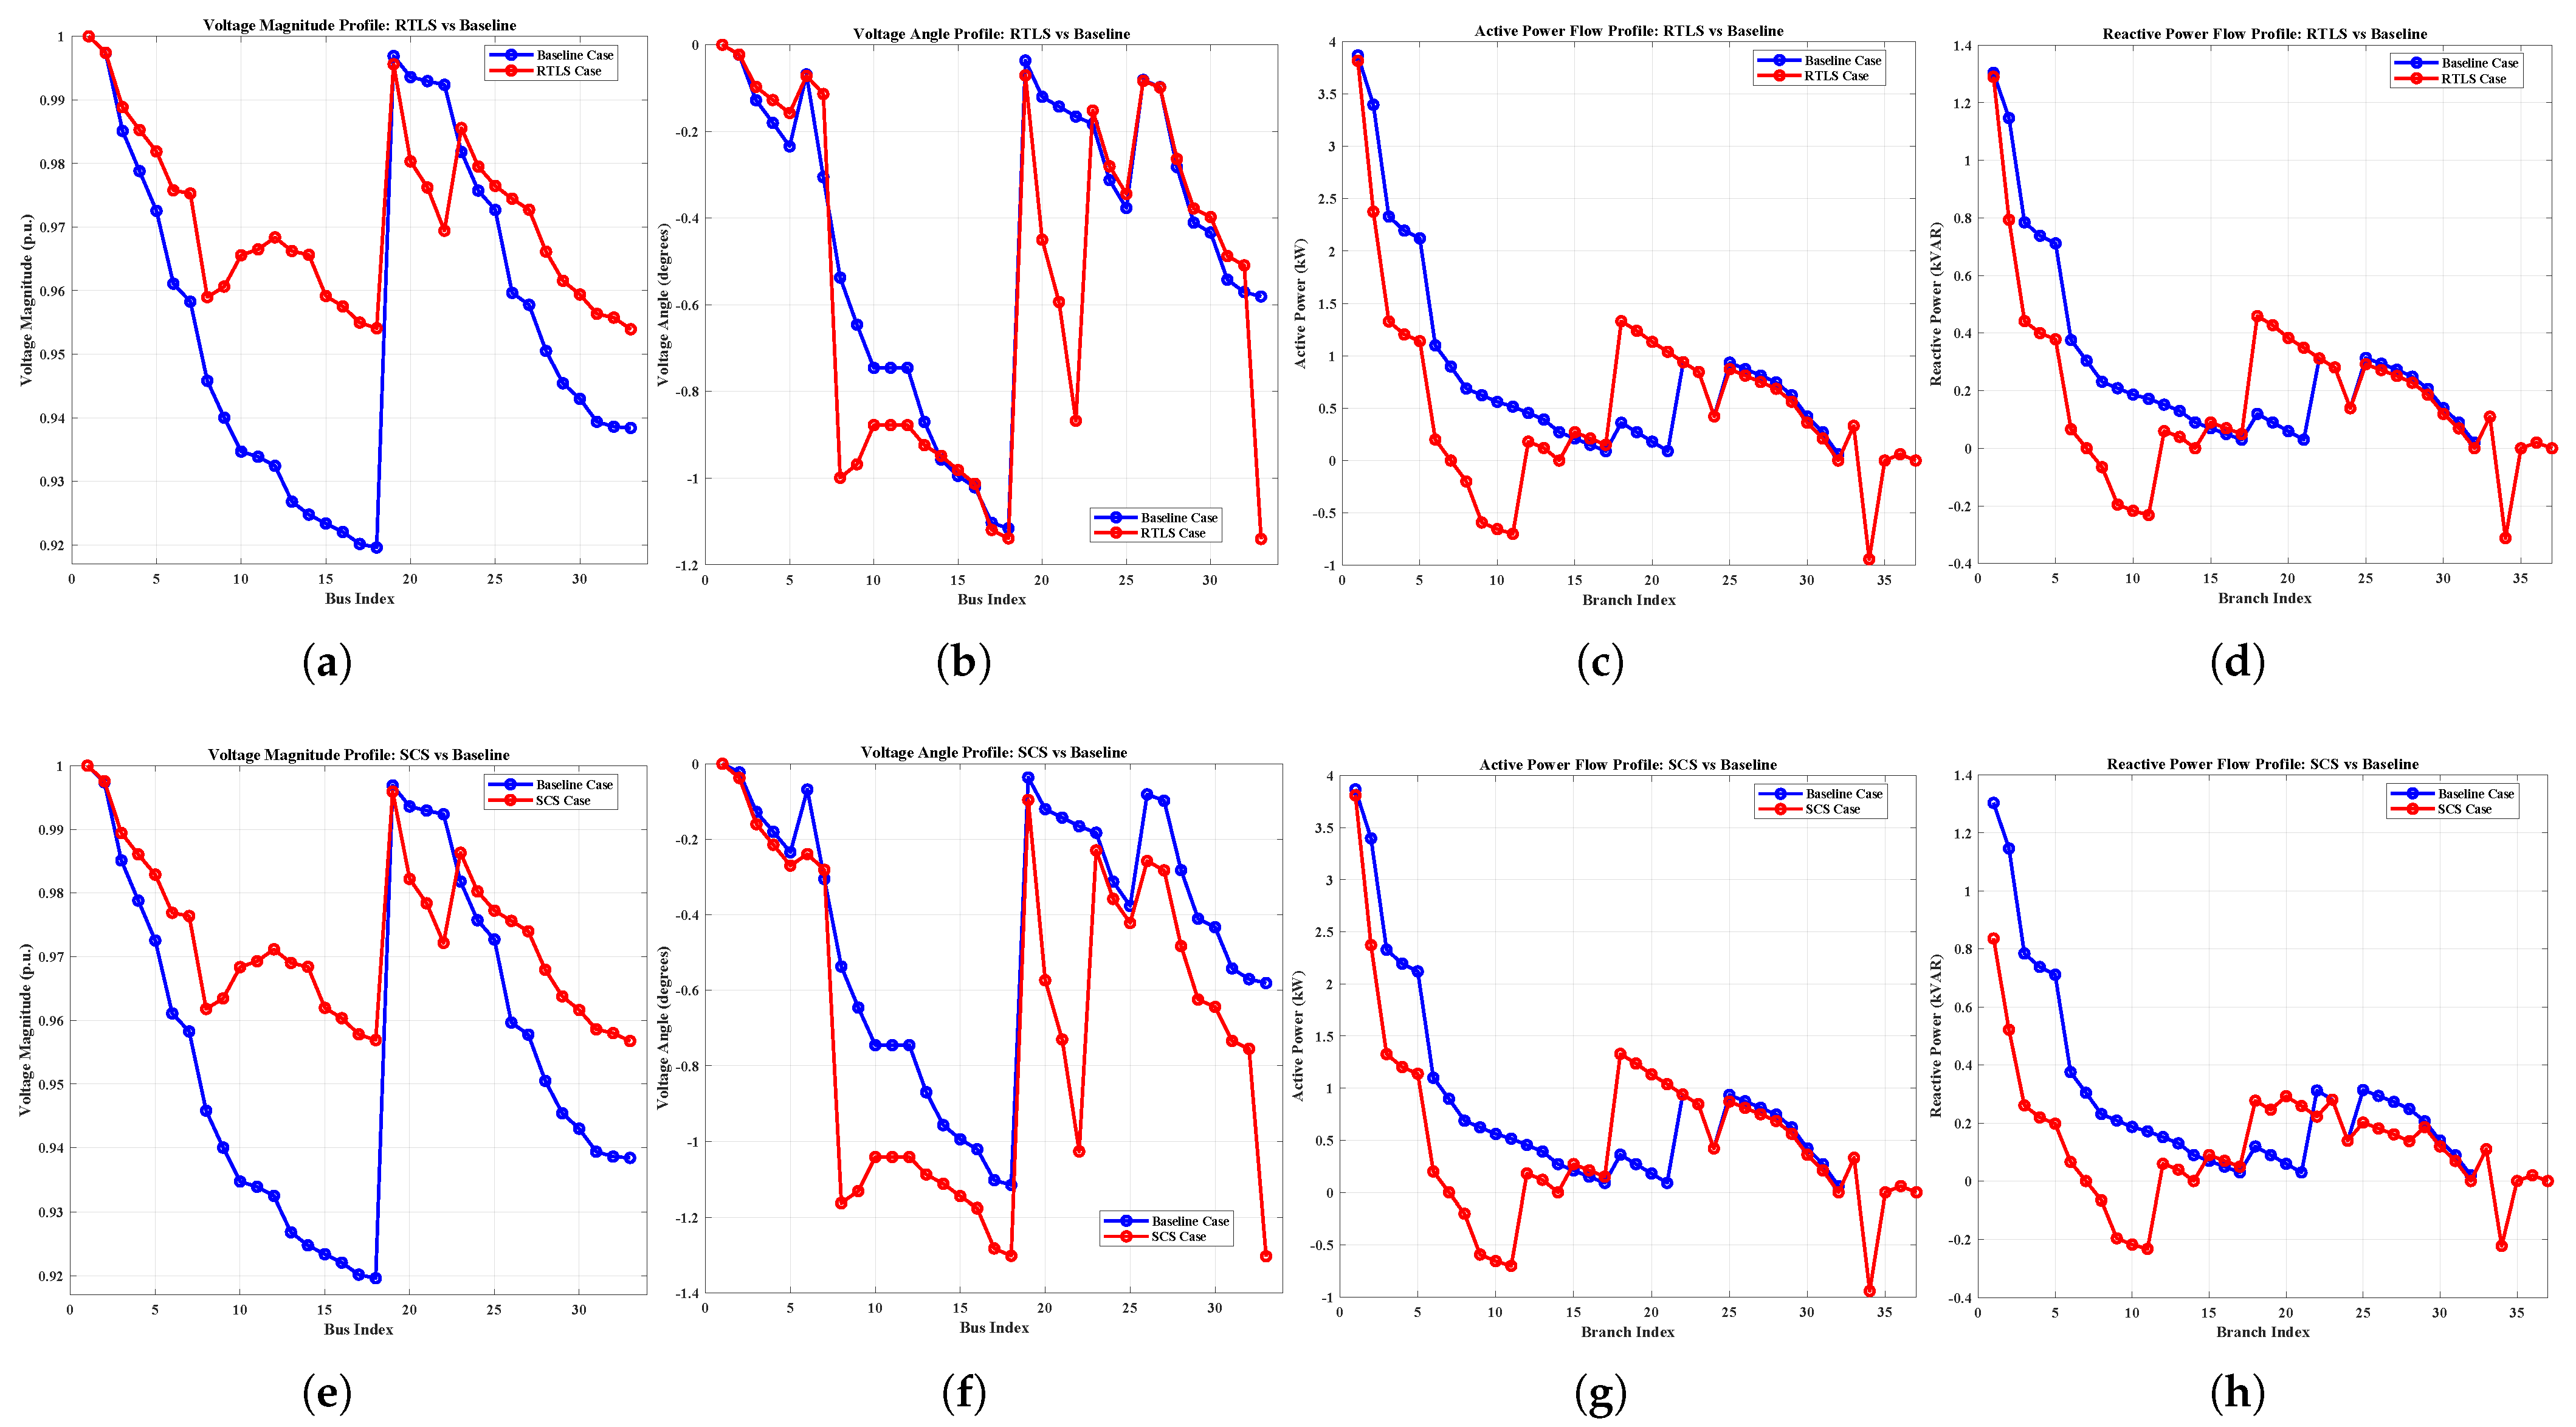
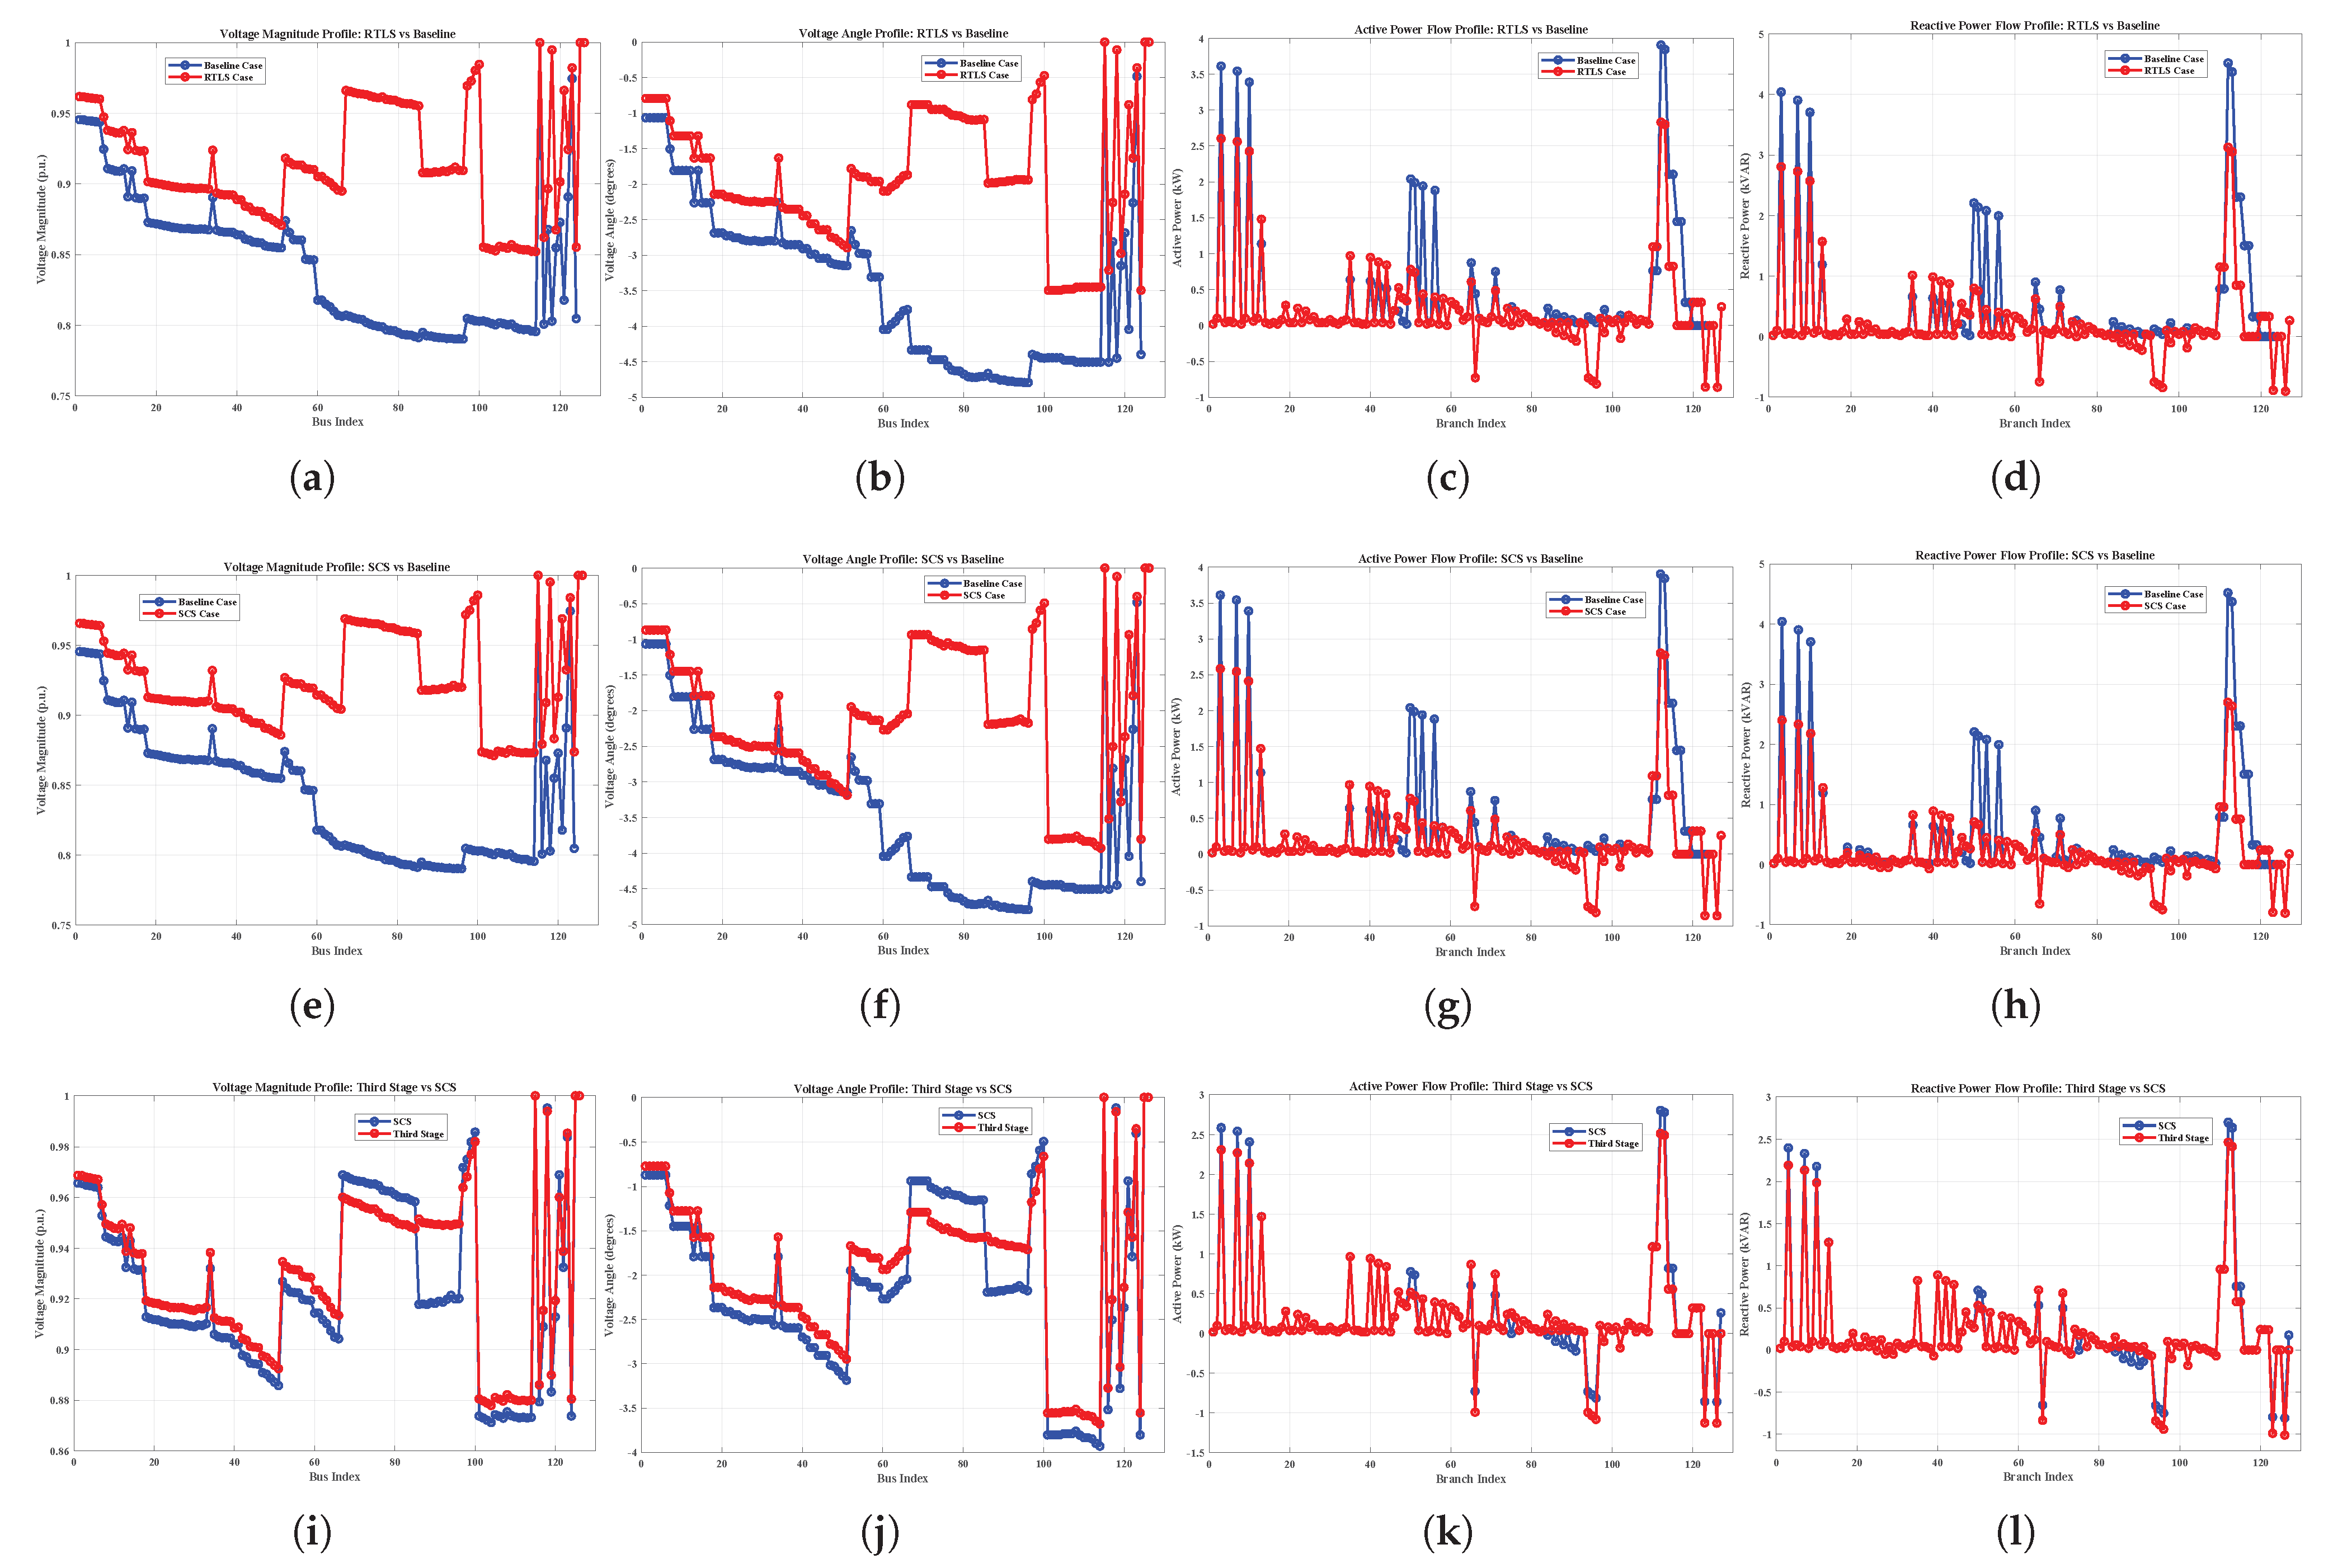
This subsection presents the performance of the proposed three-stage DNR methodology for Case 1 under normal, light, and heavy loading scenarios, as summarized in Table 1. Under normal loading, the baseline active power loss is 208 kW. The first-stage RTLS reconfigures the network by opening switches (7,8), (28,29), (32,33), (9,15), and (8,21), reducing losses to 143 kW (31%). The second stage (SCS) activates all five candidate capacitors at full capacity, further lowering the losses to 131 kW (8% improvement). A final RTLS iteration yields a marginal loss reduction to 130 kW (0.5%), with a slight change in topology, replacing switch (9,15) with (14,15). This marginal gain prompts DSOs to weigh the added switching cost against operational benefits. Voltage and power flow improvements across the stages are illustrated in Figure 3, and the total runtime is 409.68 s. In the heavy loading case, where both active and reactive demands are increased by 50%, the baseline losses rise to 508 kW. The first-stage RTLS opens switches (7,8), (11,12), (32,33), (25,29), and (8,21), achieving a 29% reduction. The second stage reduces losses by another 6% using full-capacity capacitors, and the final RTLS iteration refines the configuration further, substituting switch (11,12) with (9,15), yielding an additional 8% improvement. This scenario highlights the value of the third stage in high-demand conditions where the network has more optimization headroom. Total runtime is 404.07 s, and voltage and power flow profiles are depicted in Figure 4. For light loading, with active and reactive demands halved, the baseline loss is just 48 kW. The RTLS stage still achieves a notable 31% reduction, followed by a 16% gain from the SCS stage. However, no further improvement is observed in the third stage, indicating that the solution after two stages is near-optimal. In this scenario, only three of the five capacitors (at buses 12, 20, and 29) are utilized. The RTLS configuration includes opened switches at (7,8), (9,15), (32,33), (25,29), and (8,21). With a total runtime of 381.10 s, this case demonstrates the method’s ability to adapt to low-demand conditions, avoiding unnecessary reconfiguration. Voltage and loss distributions are shown in Figure 5. Across all three scenarios, the results validate the effectiveness of the proposed staged strategy. The third stage proves useful under heavier system stress while being bypassed when its marginal benefit does not justify additional switching, demonstrating both robustness and operational efficiency.

4.1.2. Poor and Good PF Conditions

This subsection analyzes Case 1 under both good (0.95) and poor (0.75) PF conditions to evaluate the robustness of the proposed three-stage optimization method across varying levels of reactive power compensation. The performance across all stages is summarized in Table 1. Under poor PF conditions, the baseline losses are significantly high due to inefficient reactive power handling. Stage 1 (RTLS) reduces active losses by 32% by opening switches at (11,12), (28,29), (9,15), (18,33), and (8,21). Stage 2 (SCS), with all five capacitors fully utilized, offers an additional 9% improvement. In Stage 3, the RTLS is re-executed, resulting in a refined configuration that replaces the earlier switch set with (7,8), (14,15), (32,33), (25,29), and (8,21), yielding a further 4% loss reduction. Though marginal, this additional gain reflects the method’s adaptability in highly stressed scenarios. The total active loss reduction across all stages is approximately 41%, validating the method’s effectiveness even under suboptimal PF conditions. The voltage and power flow improvements are visualized in Figure 6, and the total runtime is 411.24 s. Under good PF conditions, the system begins in a relatively well-compensated state. The RTLS stage still provides a meaningful 33% reduction in active power losses by opening switches at (7,8), (14,15), (32,33), (25,29), and (8,21). The SCS stage builds on this by delivering a further 5% improvement through full utilization of all five shunt capacitors. However, the third-stage RTLS does not yield a new configuration; as such, the topology identified in Stage 1 is retained. Voltage profiles and loss trajectories across the stages are presented in Figure 7, and the execution time for this scenario is recorded at 386.84 s. In summary, the third stage proves particularly beneficial under poor PF conditions, where significant reactive power challenges exist. Conversely, under good PF, the method obtains near-optimal results in terms of loss minimization.
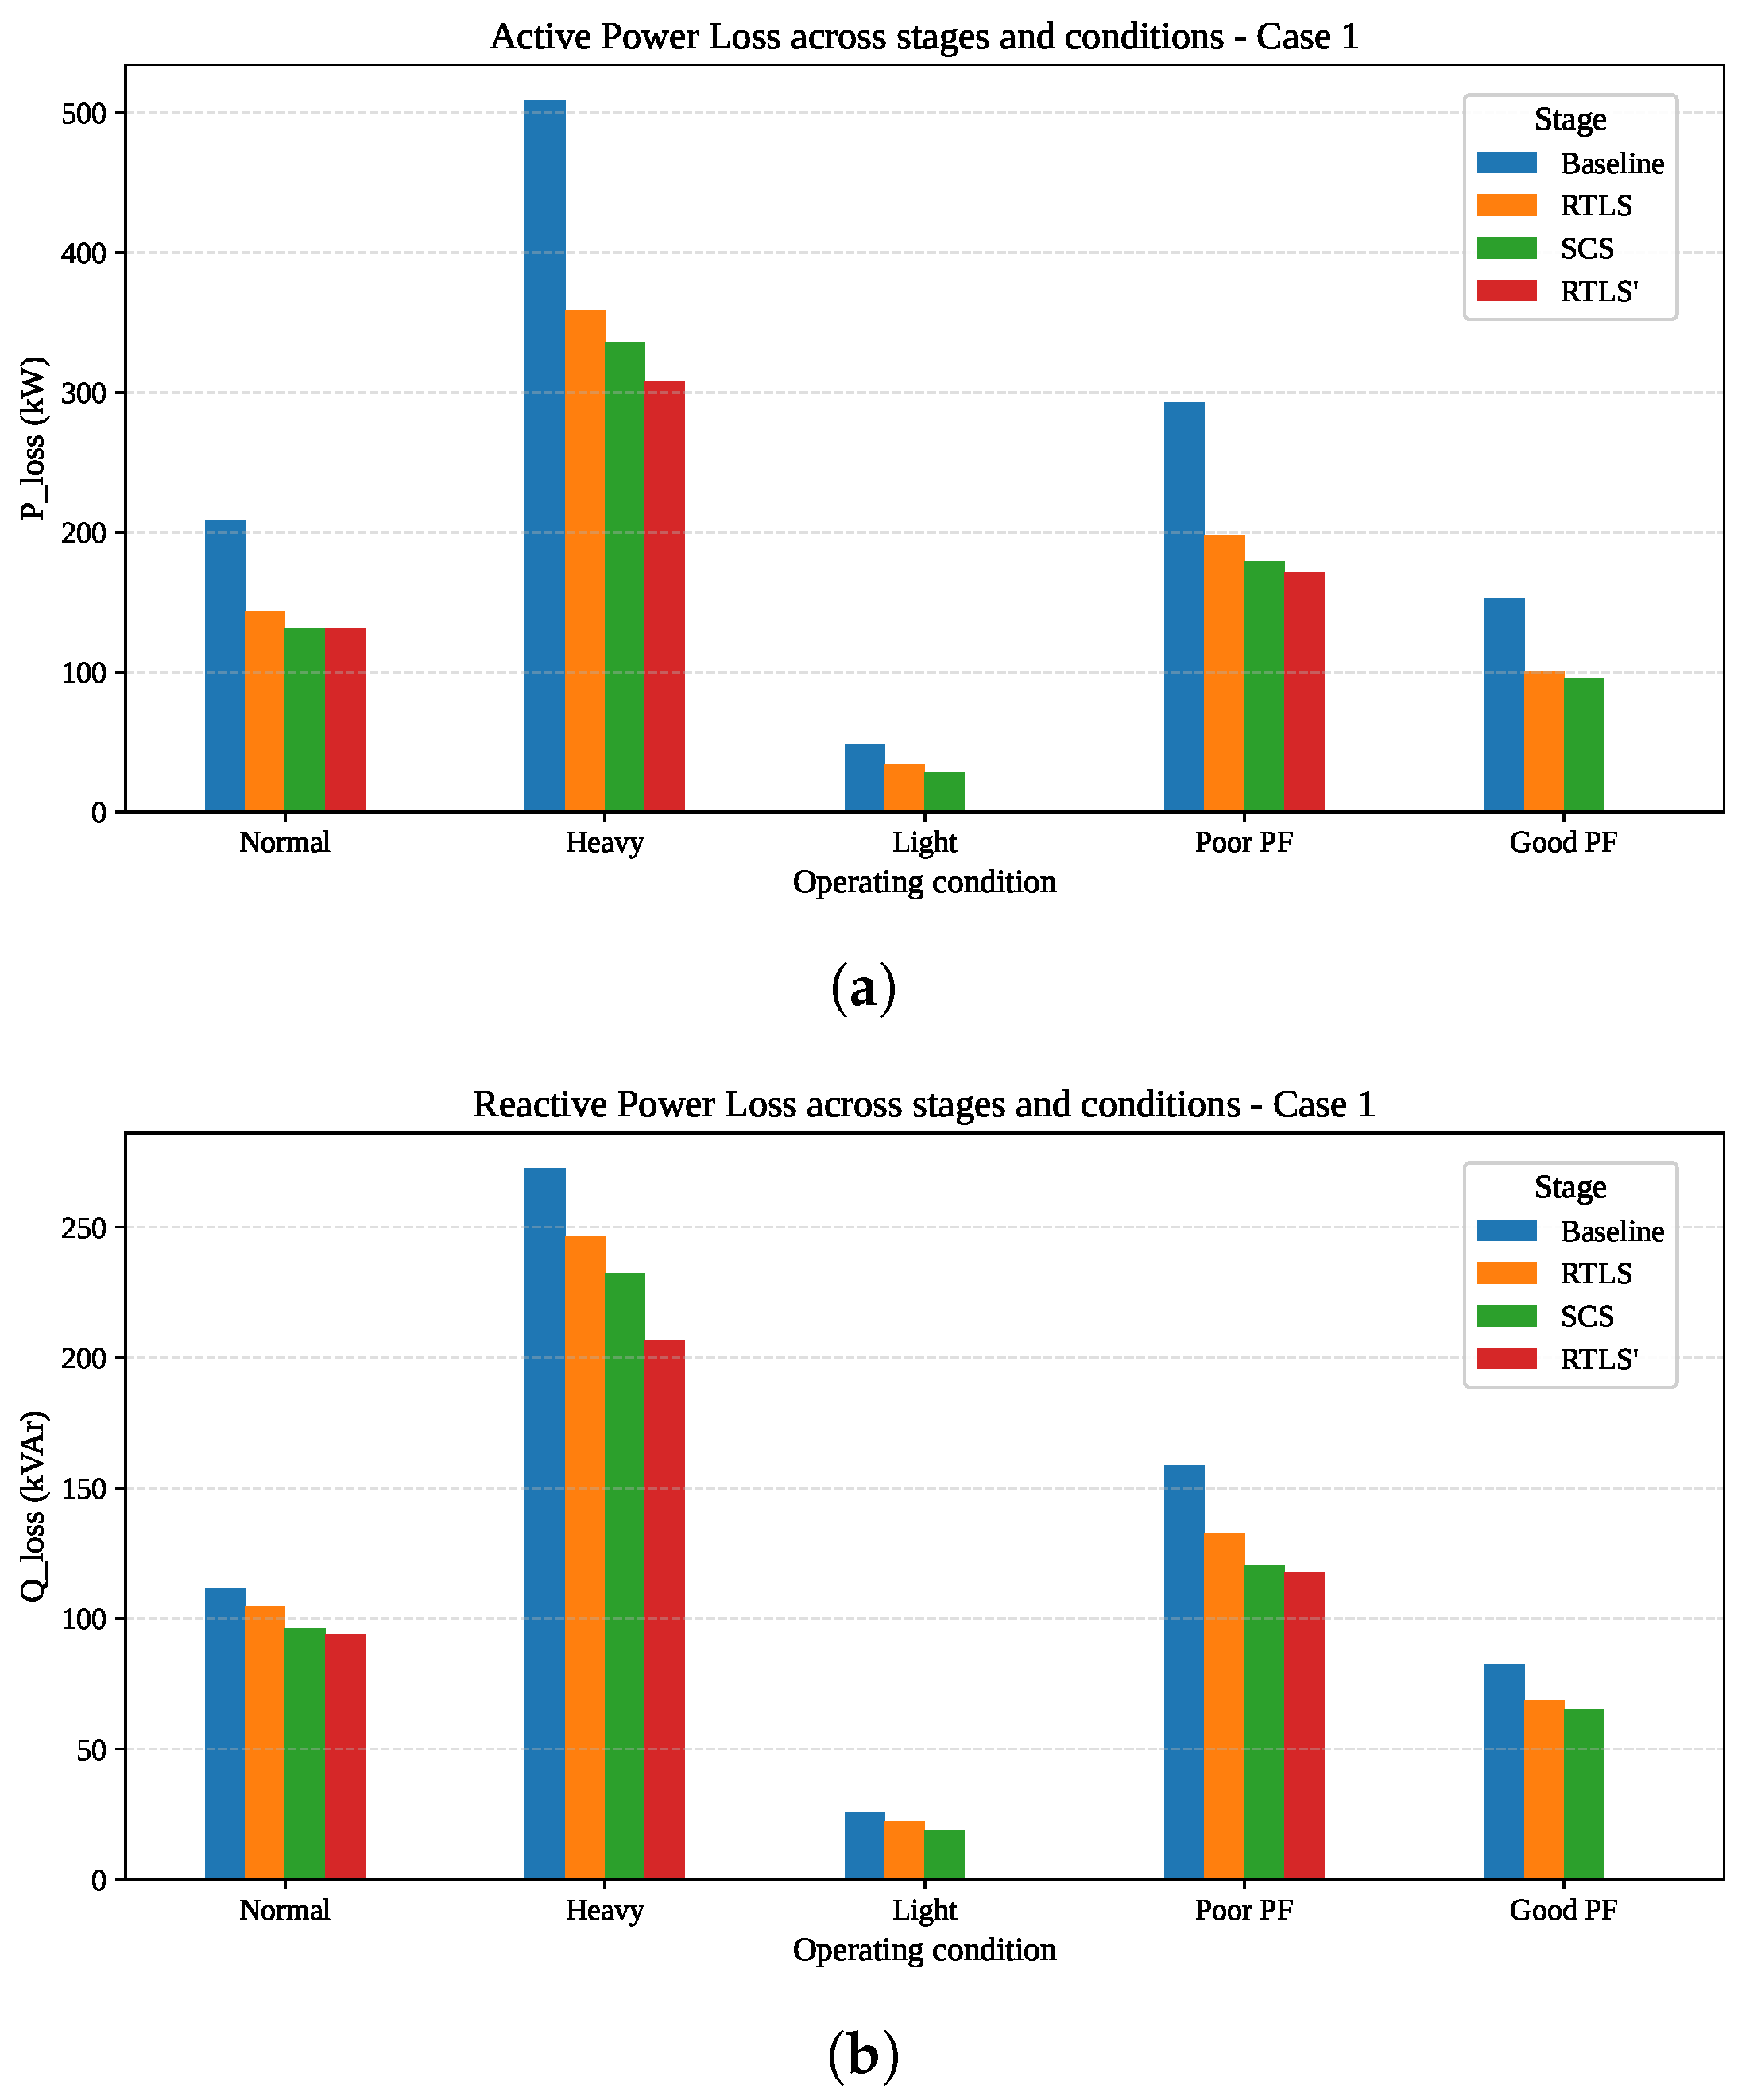
To summarize the performance of the proposed methodology across varying operating scenarios, Table 2 provides a summary of the results, covering a range of loading and PF conditions. It should be noted that the term “Topo. Update” in the last column accounts for the new topology in the third stage, if found. Also, bar chart presentations for active and reactive power losses are provided via Figure 8 for better visualization. The proposed three-stage optimization framework consistently achieved notable reductions in active power losses. In certain cases, particularly under heavy loading and poor PF, the third stage identified alternative topologies, leading to marginal additional reductions in losses. However, the relatively small improvements observed at this stage suggest that the configurations produced by the first two stages were already close to optimal. This outcome underscores the practical trade-off for DSOs: while the third stage may yield minor gains in loss reduction, it introduces additional switching operations, which must be weighed against operational costs. In contrast, for scenarios like light loading and good PF, the third stage did not identify any superior configurations, further validating the effectiveness of the proposed methodology in finding high-quality solutions without overfitting the network. Overall, the method demonstrated adaptability and robustness, tailoring its reconfiguration and reactive support strategies to the specific needs of each condition. Execution times remained within an acceptable range (381–411 s), and all solutions adhered to radiality and capacitor deployment constraints, ensuring their feasibility for real-world applications. These results highlight the practicality of the approach, particularly in its ability to balance performance improvement with operational considerations.

4.2. Case 2 Results

4.2.1. Normal, Light, and Heavy Loading Conditions

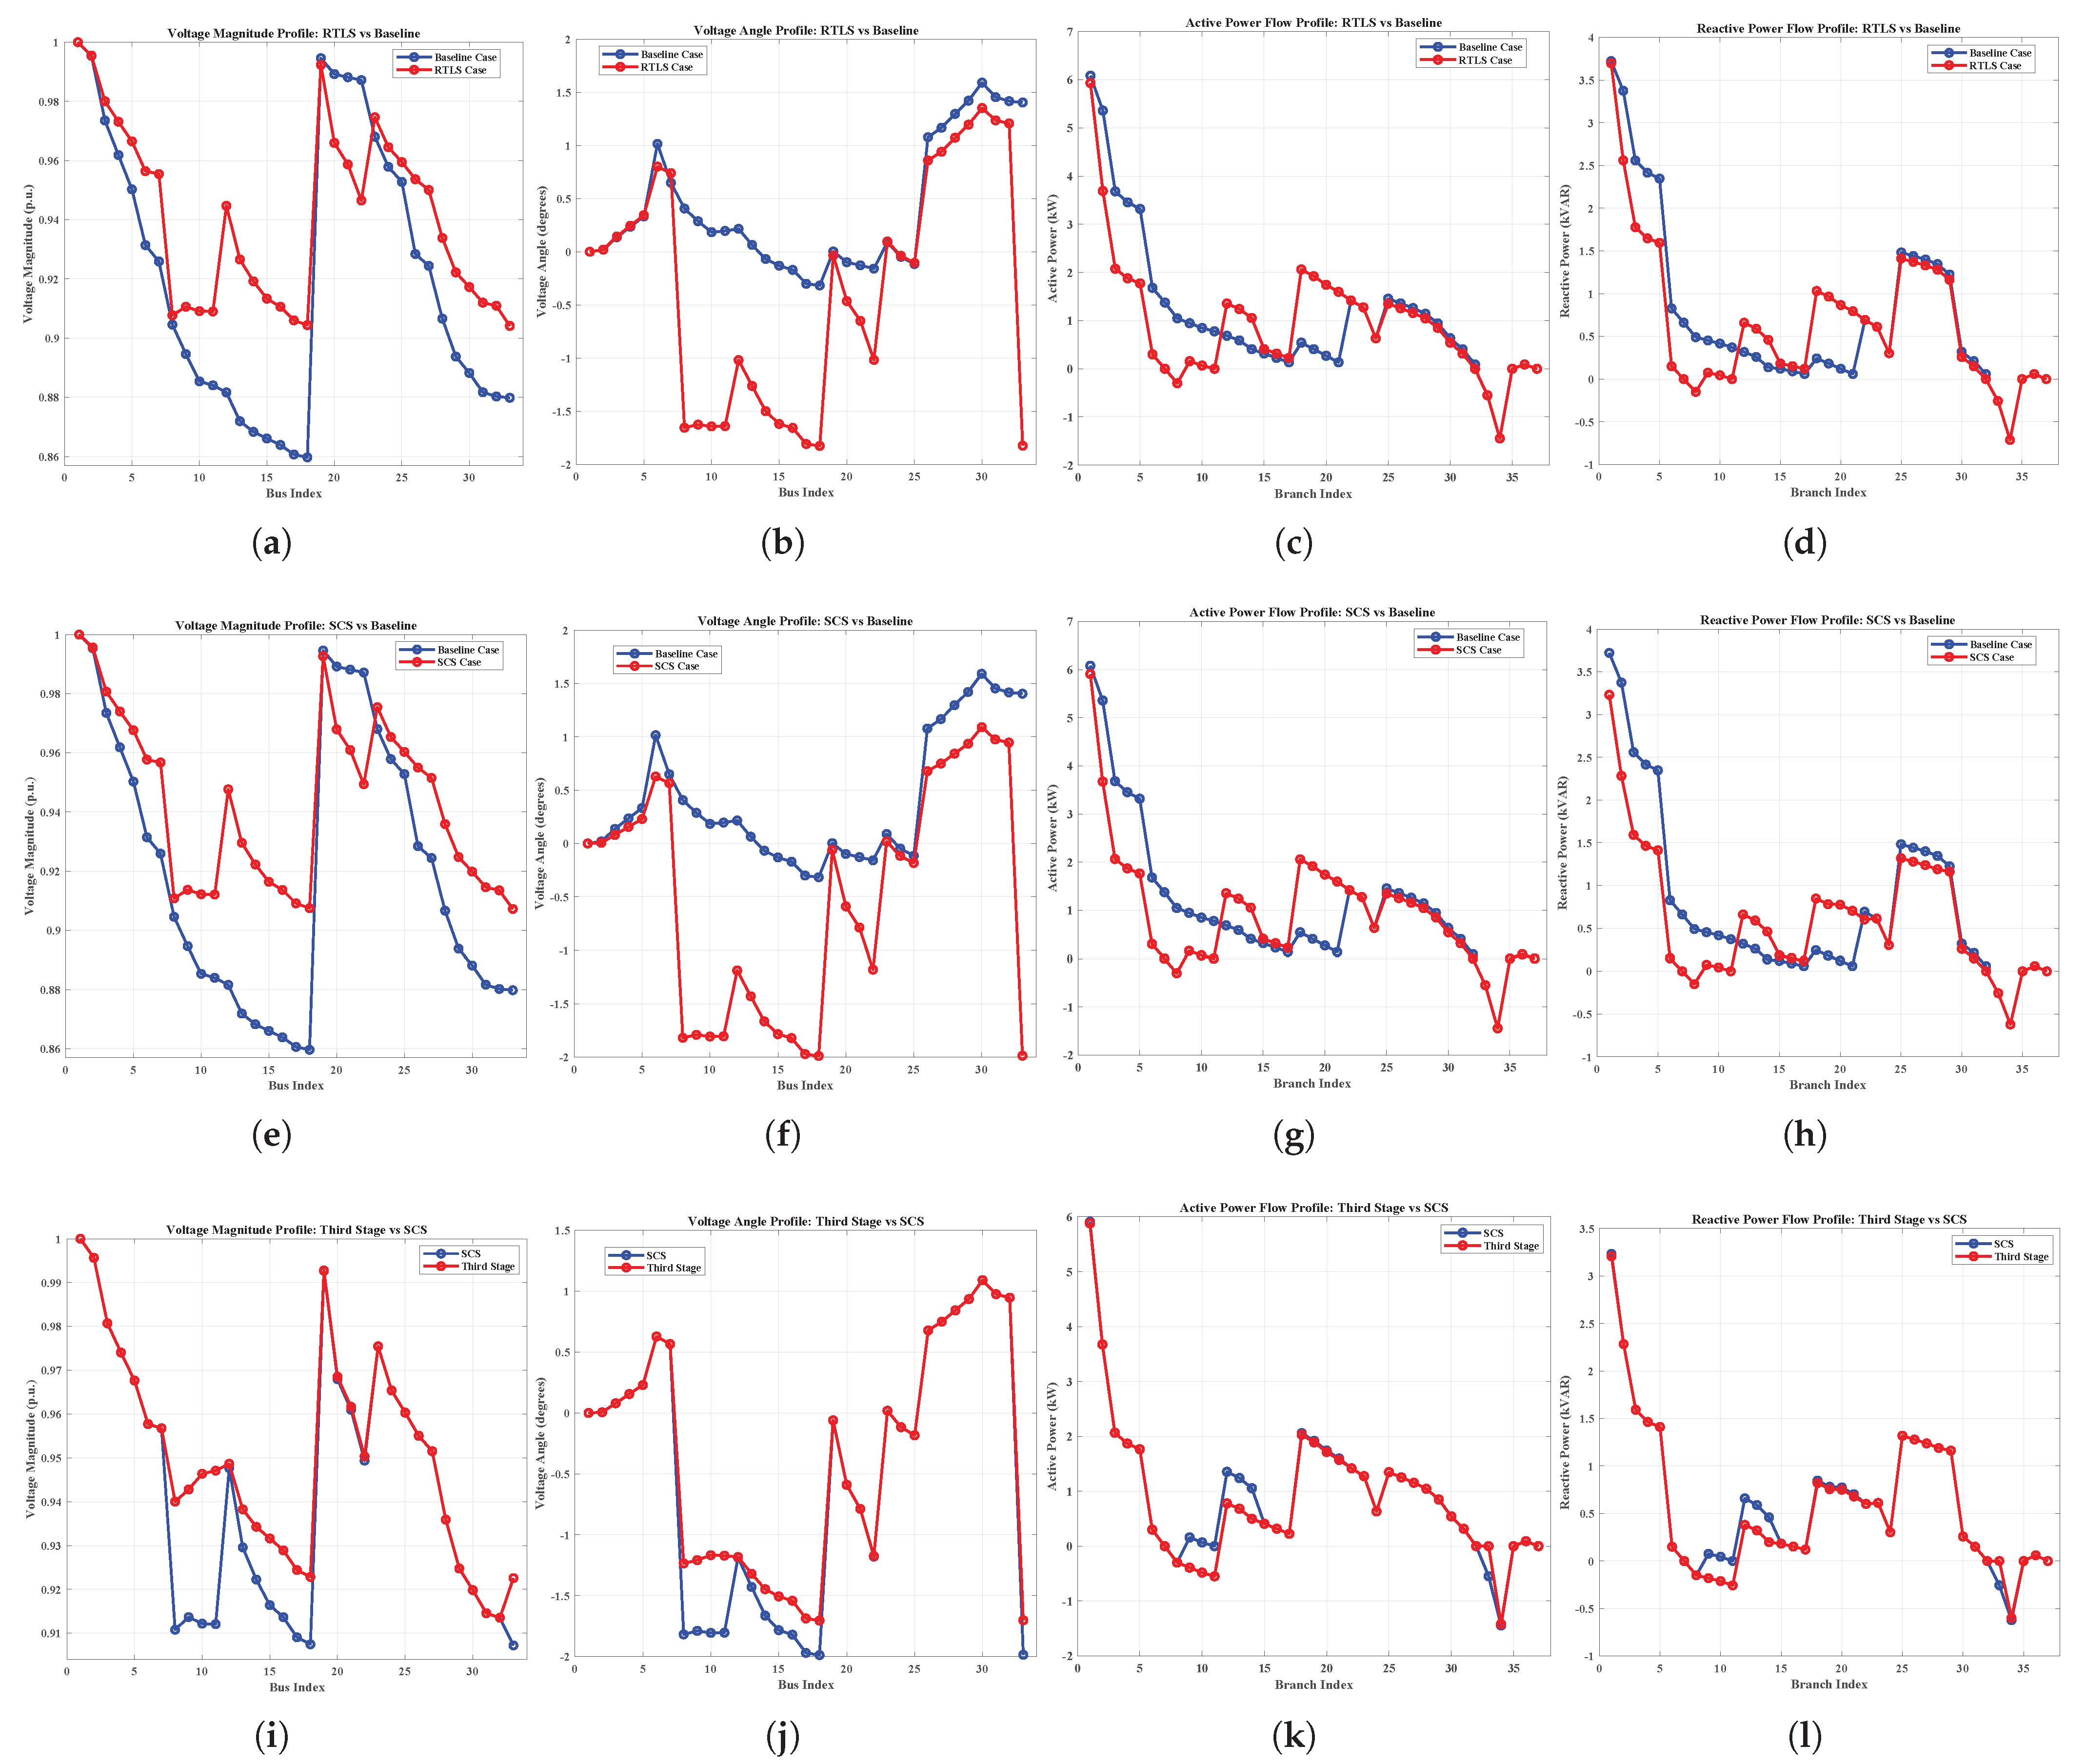
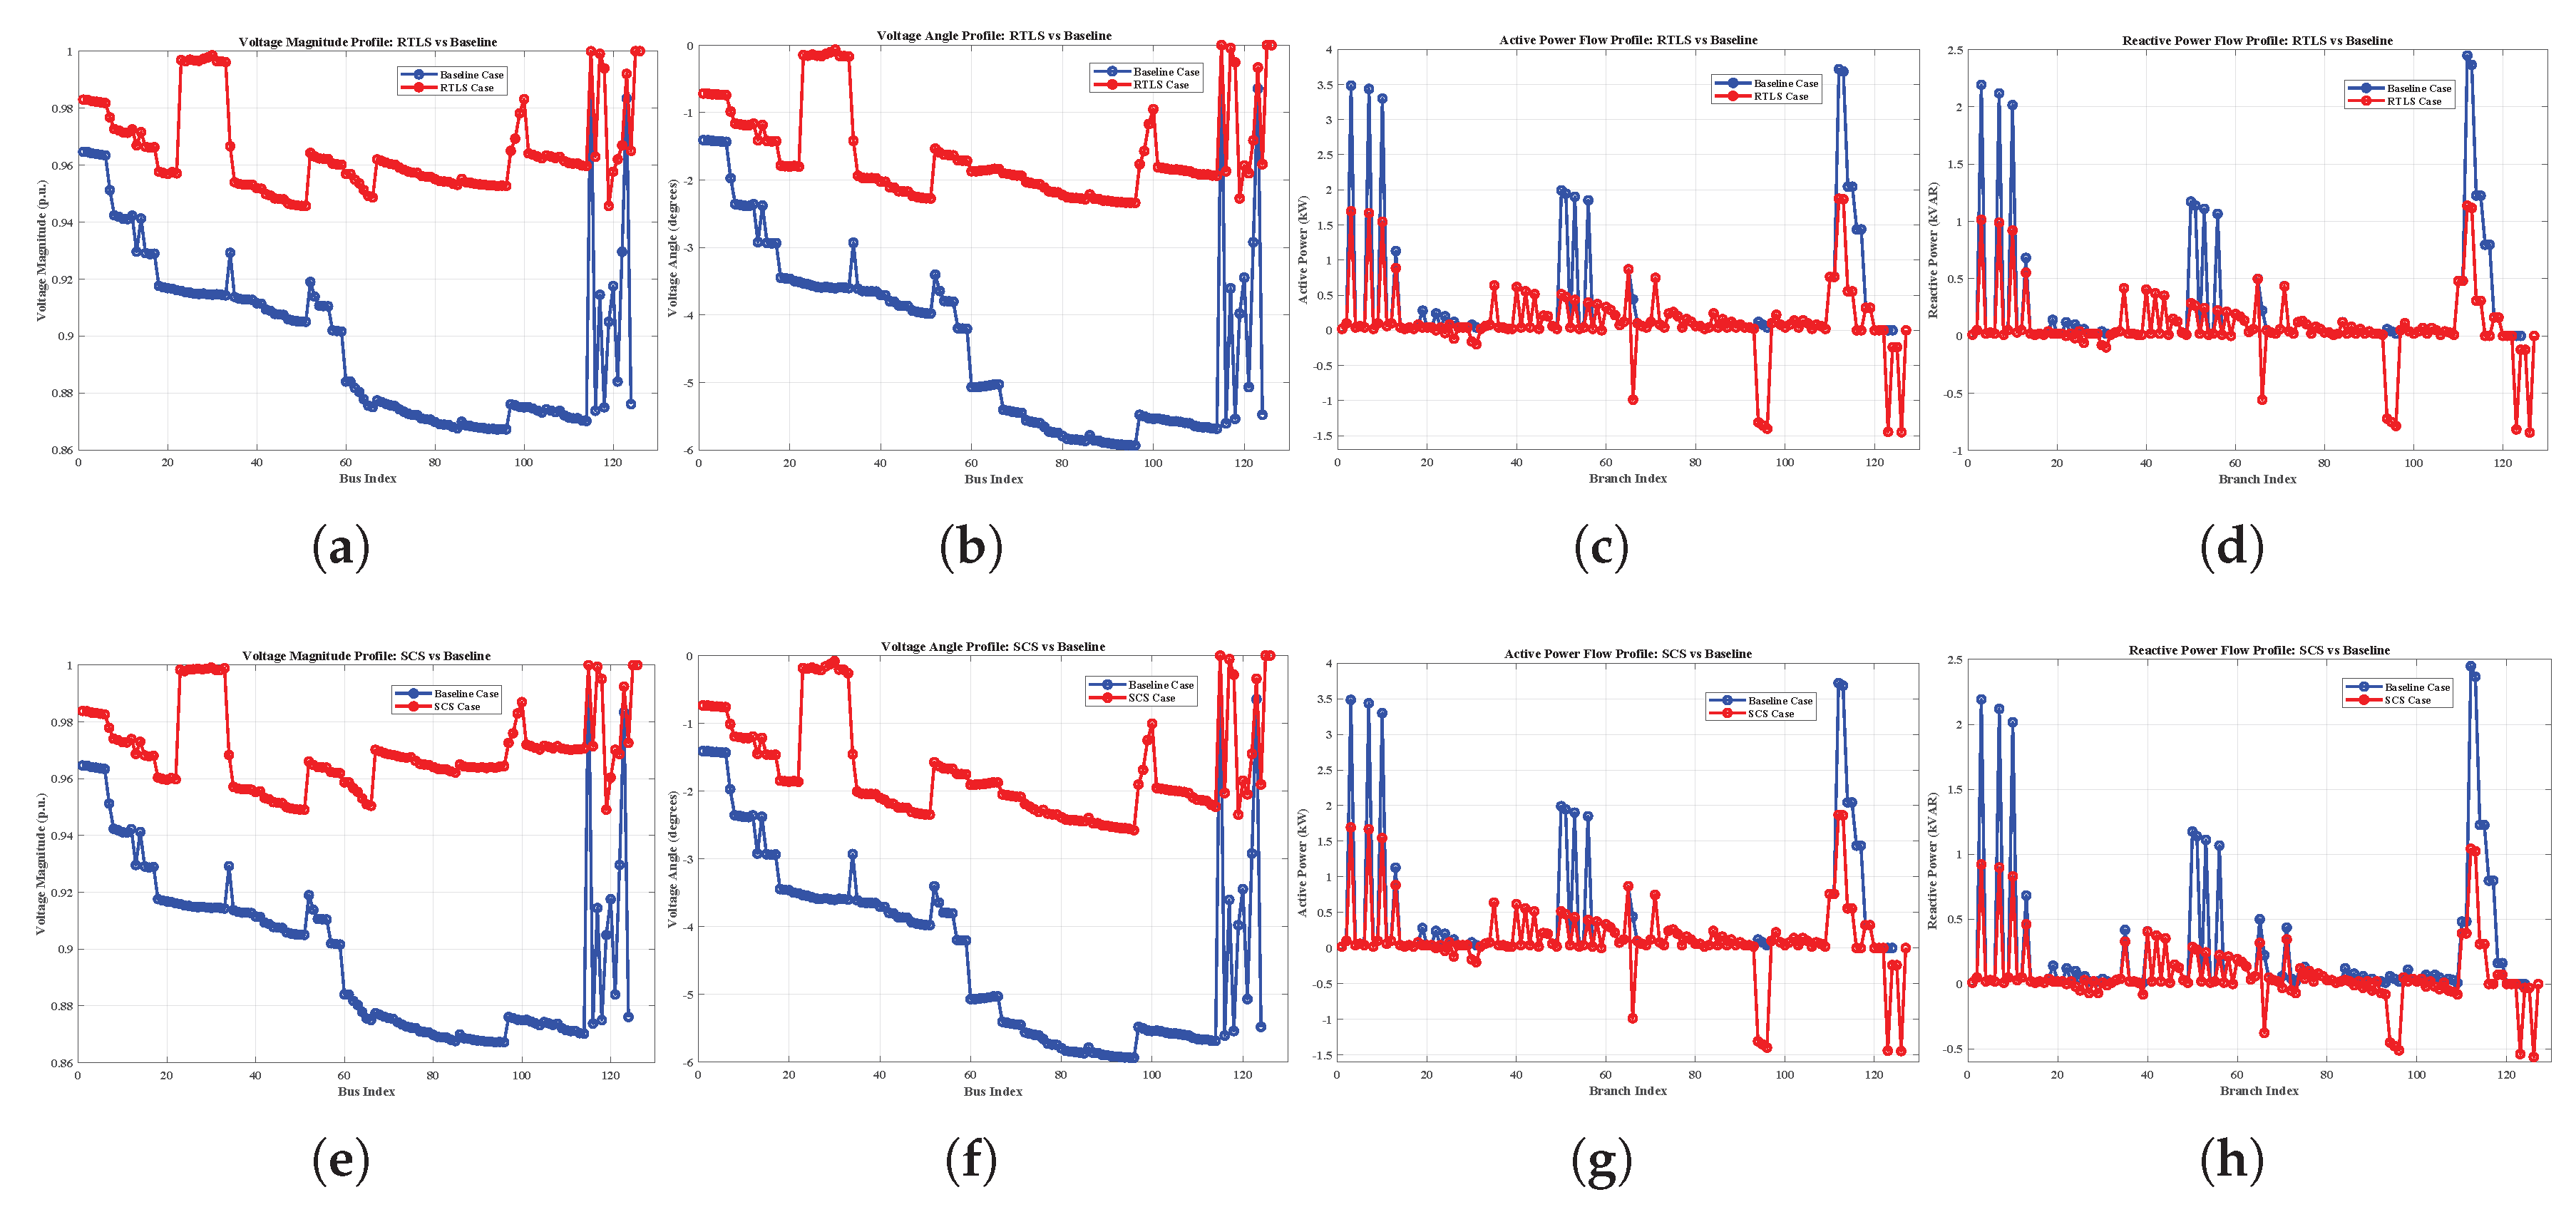
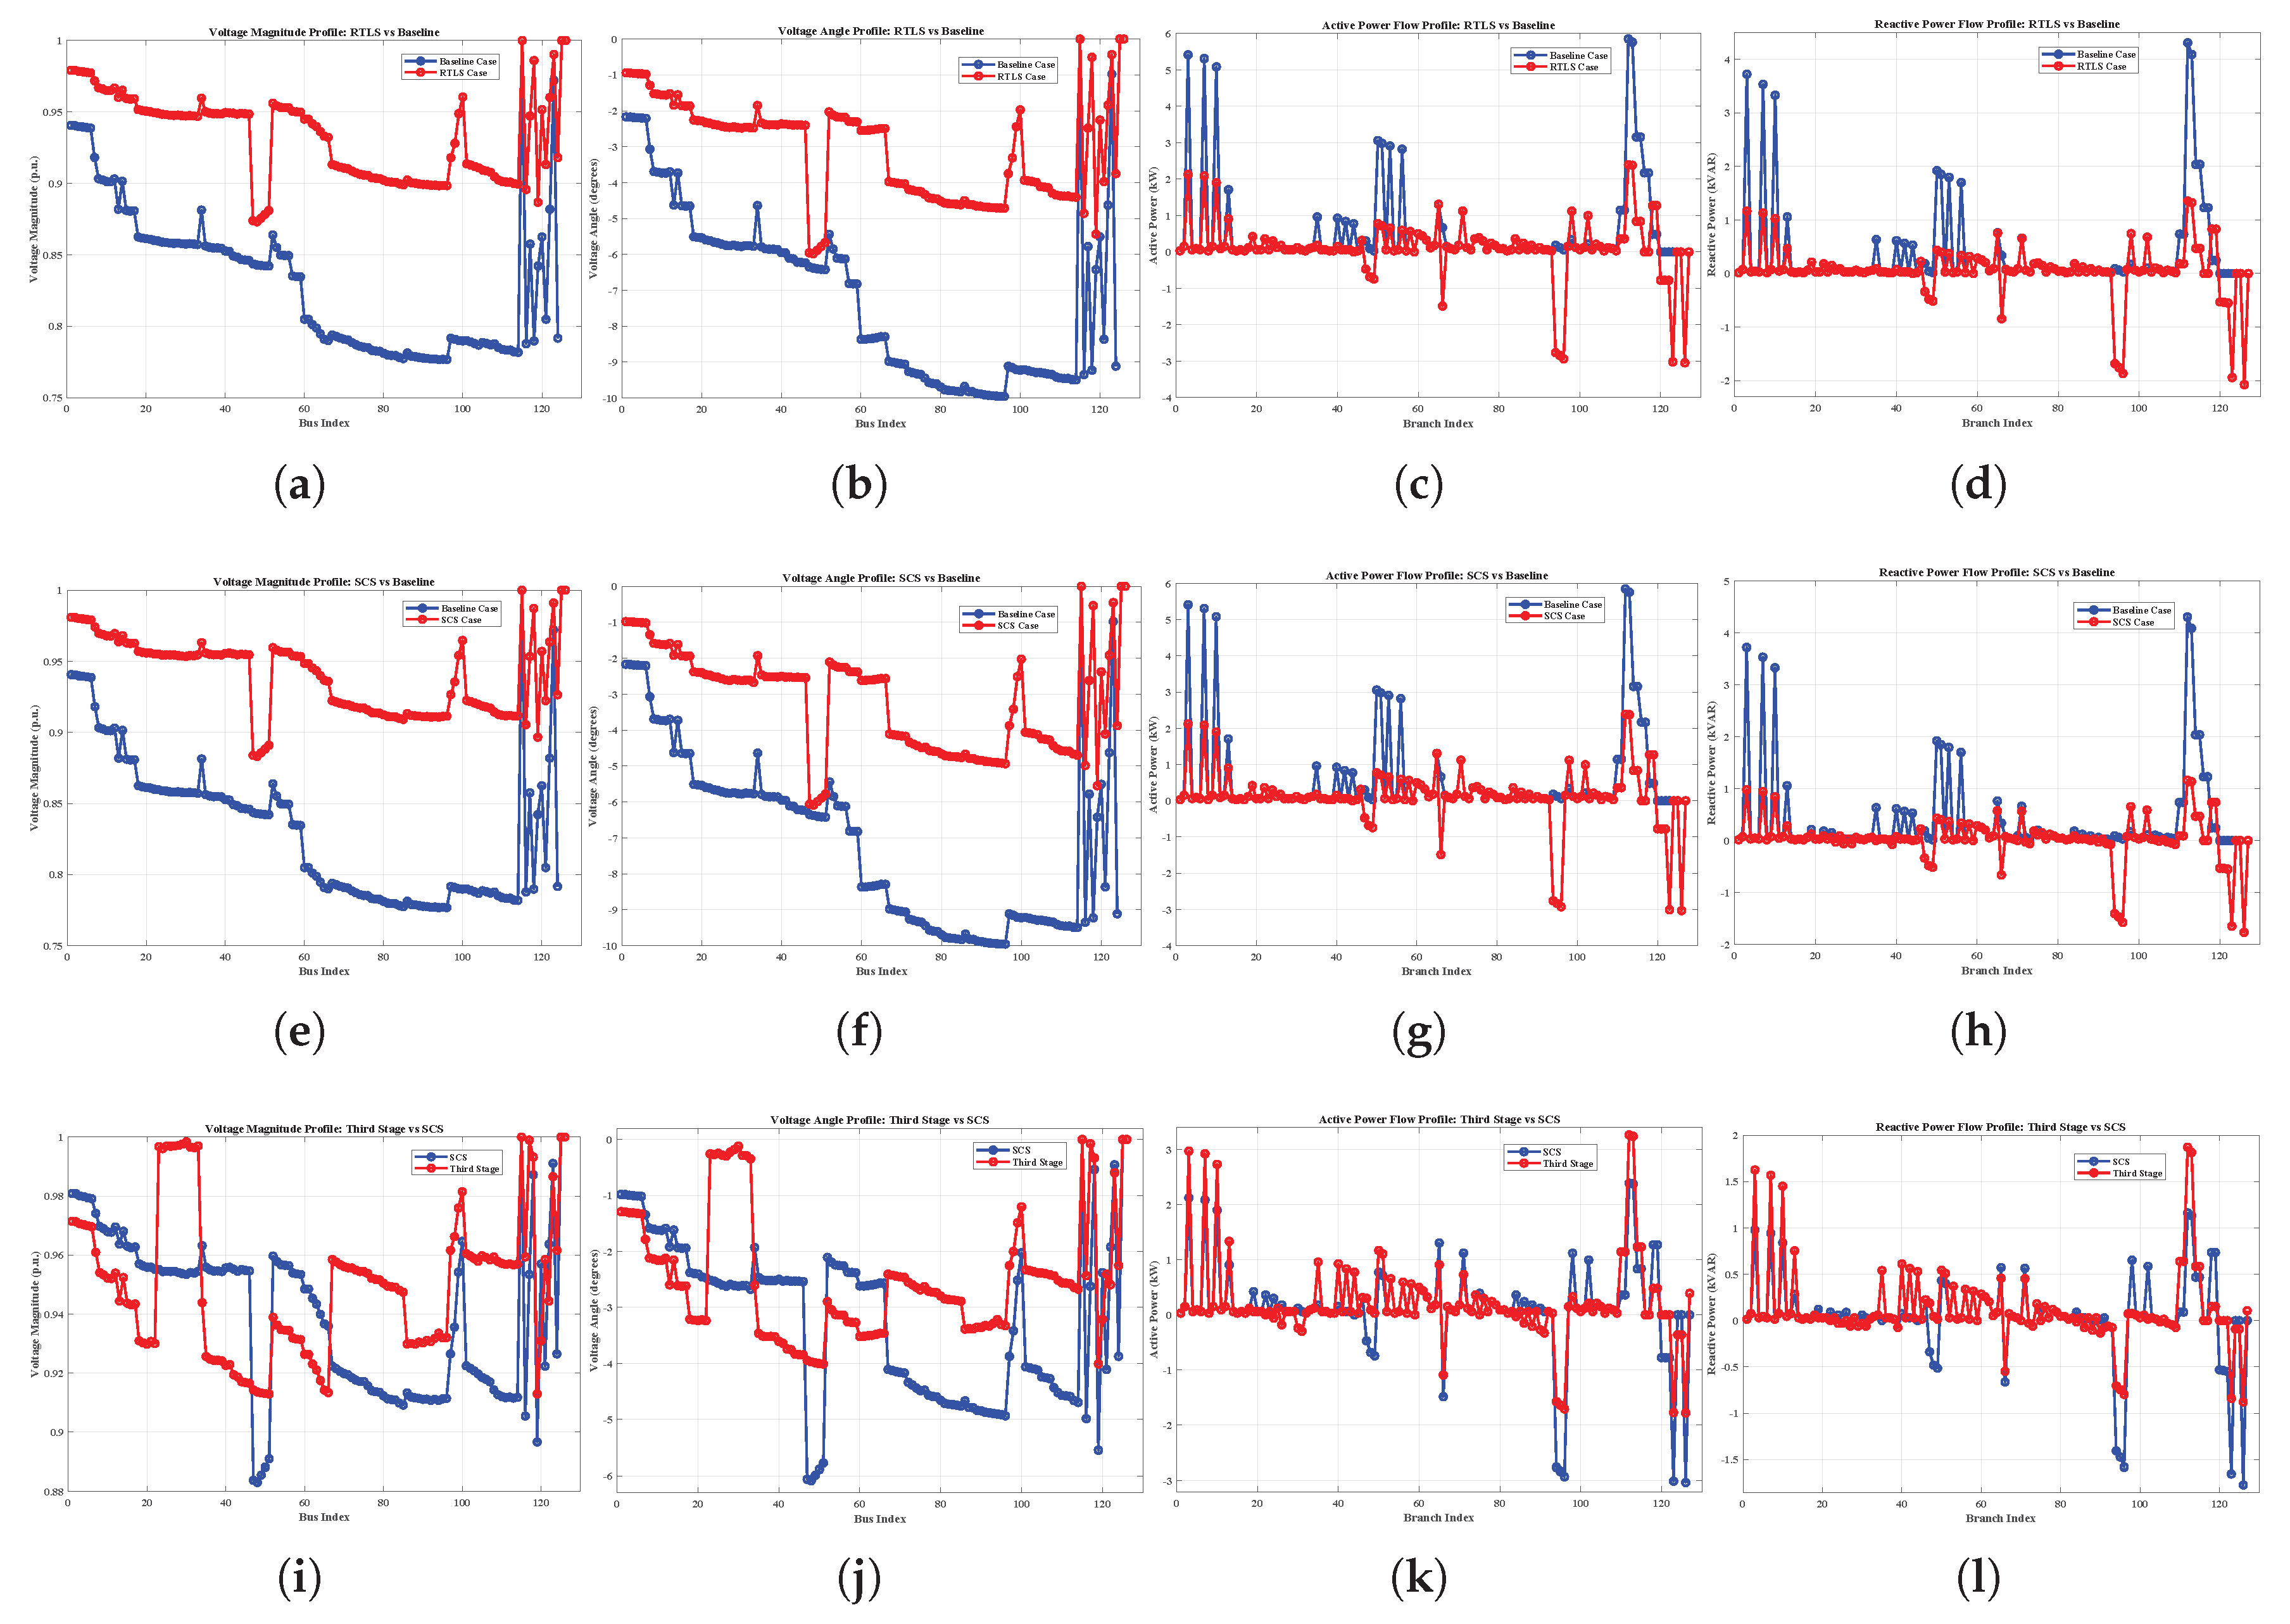
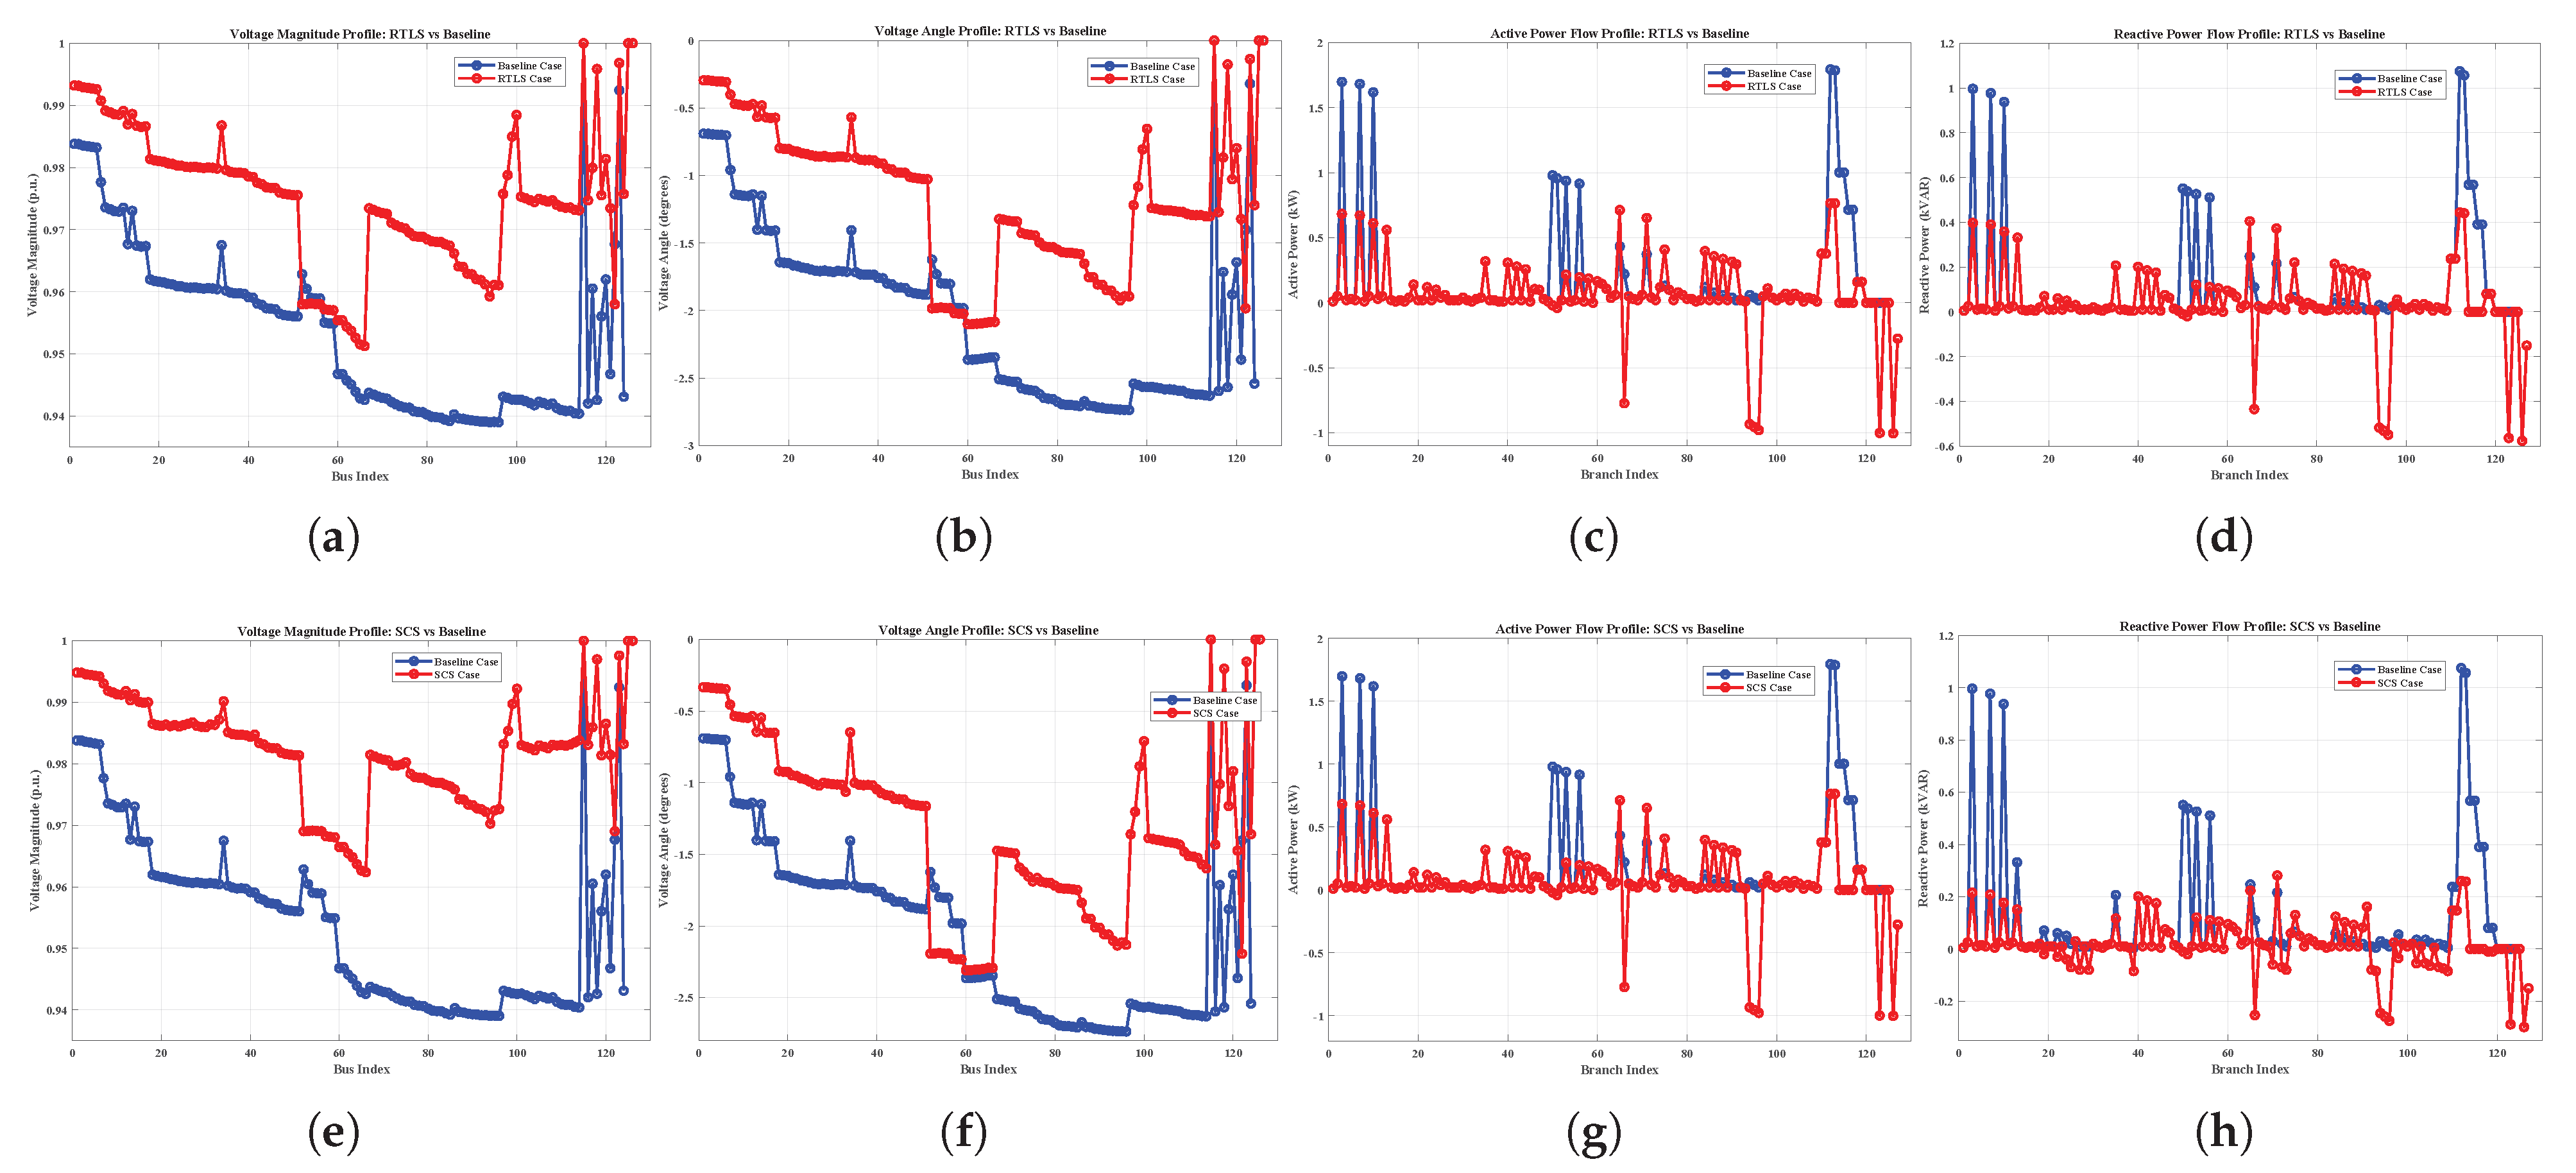
Under varying loading conditions, Case 2 was evaluated using the proposed three-stage optimization framework, with the results summarized in Table 3 and visualized in Figure 9, Figure 10 and Figure 11. Despite differences in system stress levels, all three scenarios demonstrate the scalability and adaptability of the proposed methodology. Under normal loading, the baseline configuration exhibits substantial power losses, 229 kW active and 528 kVAr reactive, highlighting the inefficiency of the original topology. In Stage 1, RTLS identifies an improved configuration by opening switches (21,23), (60,160), (151,300), and (54,94), reducing losses to 80 kW and 192 kVAr. Stage 2 (SCS) then deploys all five capacitors at buses 33, 41, 75, 96, and 114 at full capacity, further minimizing losses to 73 kW and 174 kVAr. No additional improvement is observed in Stage 3, confirming the near-optimality of the prior stages. The total execution time is 388.72 s. In the light loading scenario (50% active and reactive load reduction), the baseline still exhibits significant losses, similar to the normal case, again at 229 kW and 528 kVAr. RTLS reconfiguration in Stage 1, opening switches (13,152), (60,160), (151,300), and (250,251), reduces these to 80 kW and 192 kVAr. Stage 2 provides further loss reduction to 73 kW and 174 kVAr, despite only activating three of the five available capacitors (buses 41, 96, and 114). Due to the already high efficiency, Stage 3 could not yield a topology that results in lower active power losses compared to the second stage’s output. Total runtime is recorded as 388.53 s. In contrast, heavy loading (50% load increase) results in a much higher baseline loss: 617 kW and 1425 kVAr. RTLS first reduces this to 231 kW and 602 kVAr by opening switches (44,47), (60,160), (250,251), and (54,94). SCS follows, activating all five capacitors to reach 212 kW and 551 kVAr. The third stage yielded an improved topology by opening switches (21,23), (76,86), (60,160), and (151,300), reducing losses to 182 kW and 428 kVAr due to the high-stress level of the system. Execution time for this scenario is 375.37 s. The final decision to adopt this refined topology, however, depends on DSO preferences regarding switching cost and system efficiency.

4.2.2. Poor and Good PF Conditions

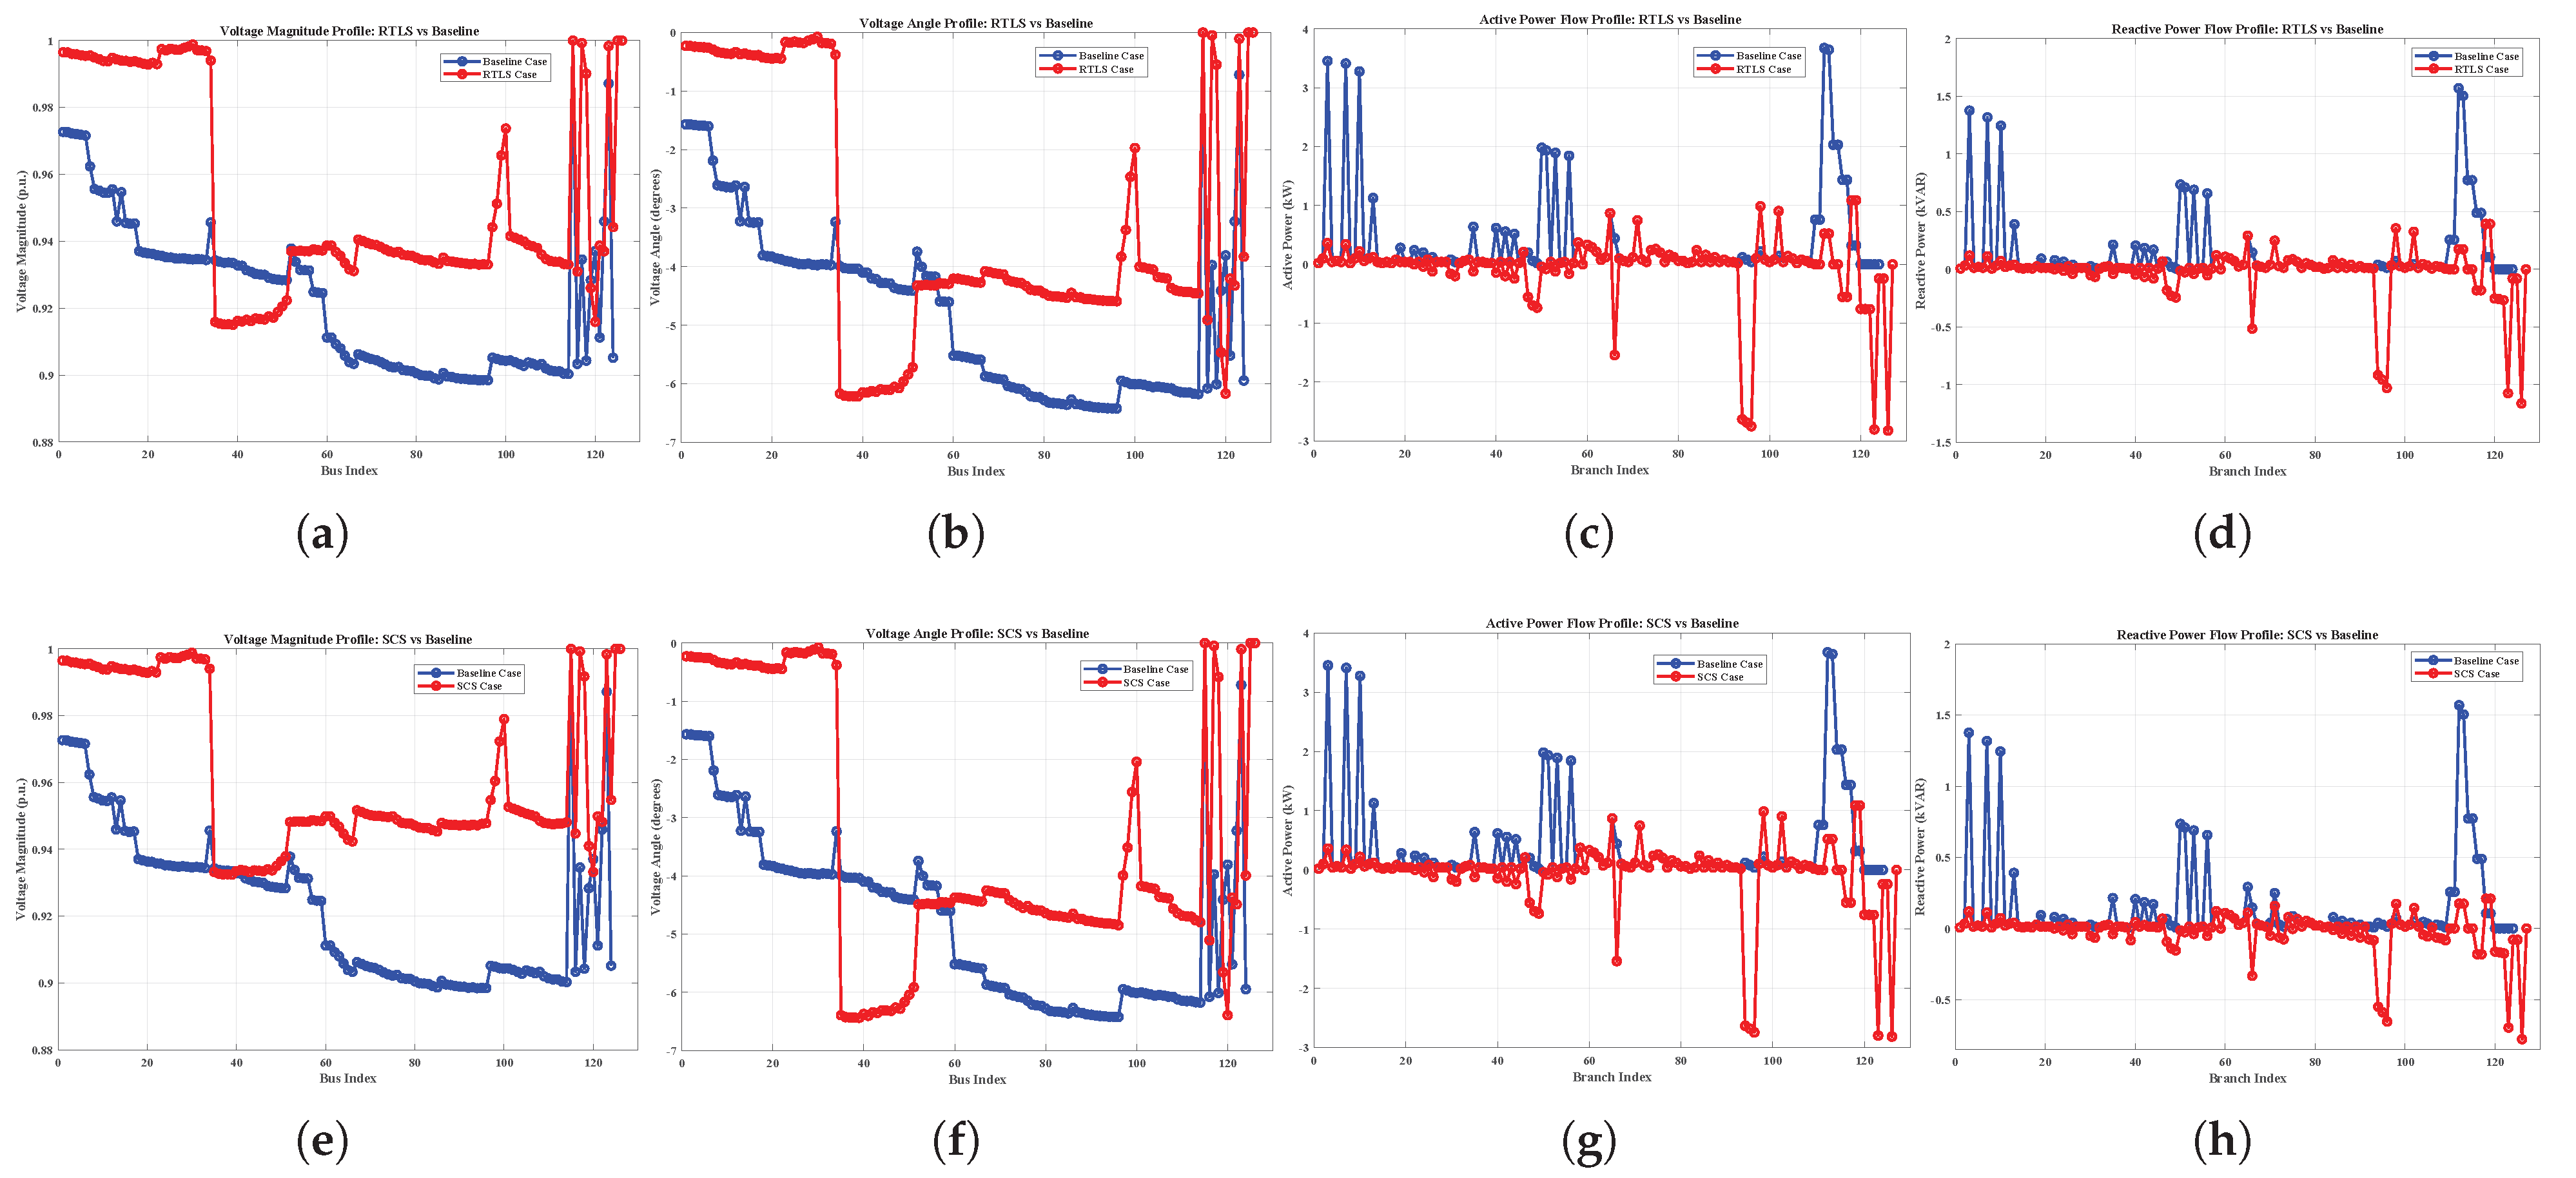
Case 2 was further examined under two contrasting PF conditions to assess the robustness and selectivity of the proposed three-stage optimization framework. The numerical outcomes are presented in Table 3, while voltage and power flow evolutions across stages are visualized in Figure 12 and Figure 13. Under the poor PF condition (0.75), the network is exposed to high reactive power demands, leading to elevated baseline losses of 415 kW and 960 kVAr. In Stage 1 (RTLS), the optimizer identifies a more efficient topology by opening switches (13,152), (97,197), (250,251), and (54,94), achieving a 50% reduction in active losses. Stage 2 (SCS) then deploys all five capacitors at full capacity, reducing the losses further to 172 kW and 401 kVAr. Based on the updated voltage and power flow profiles, the third stage re-executes RTLS and yields a refined configuration, (60,160), (97,197), (250,251), and (54,94), achieving the lowest losses at 160 kW and 376 kVAr. Although the third stage delivers only modest improvements over Stage 2, it validates the adaptiveness of the method under stressed reactive conditions. DSOs may assess whether the marginal gain justifies the additional switching effort. The entire optimization process concludes in 385.03 s. Conversely, under a good PF condition (0.95), the network is already operating in a relatively efficient state. Yet, the baseline still presents losses of 229 kW and 528 kVAr, indicating that optimization potential exists. In Stage 1, RTLS opens switches (21,23), (18,135), (13,152), and (54,94), bringing losses down to 80 kW and 192 kVAr. Stage 2 (SCS) further reduces losses to 73 kW and 174 kVAr by activating four out of five capacitors, with bus 33 remaining unused. The total execution time for this scenario was 388.53 s. These PF-based scenarios reinforce the flexibility of the proposed optimization framework across diverse operating conditions. Table 4 consolidates the outcomes of applying the proposed three-stage optimization framework to Case 2 under five different operating scenarios, including variations in loading and PF conditions. Also, bar chart presentations for active and reactive power losses are provided via Figure 14 for better visualization of Case 2 as well.

4.3. Case 3-7-Bus System

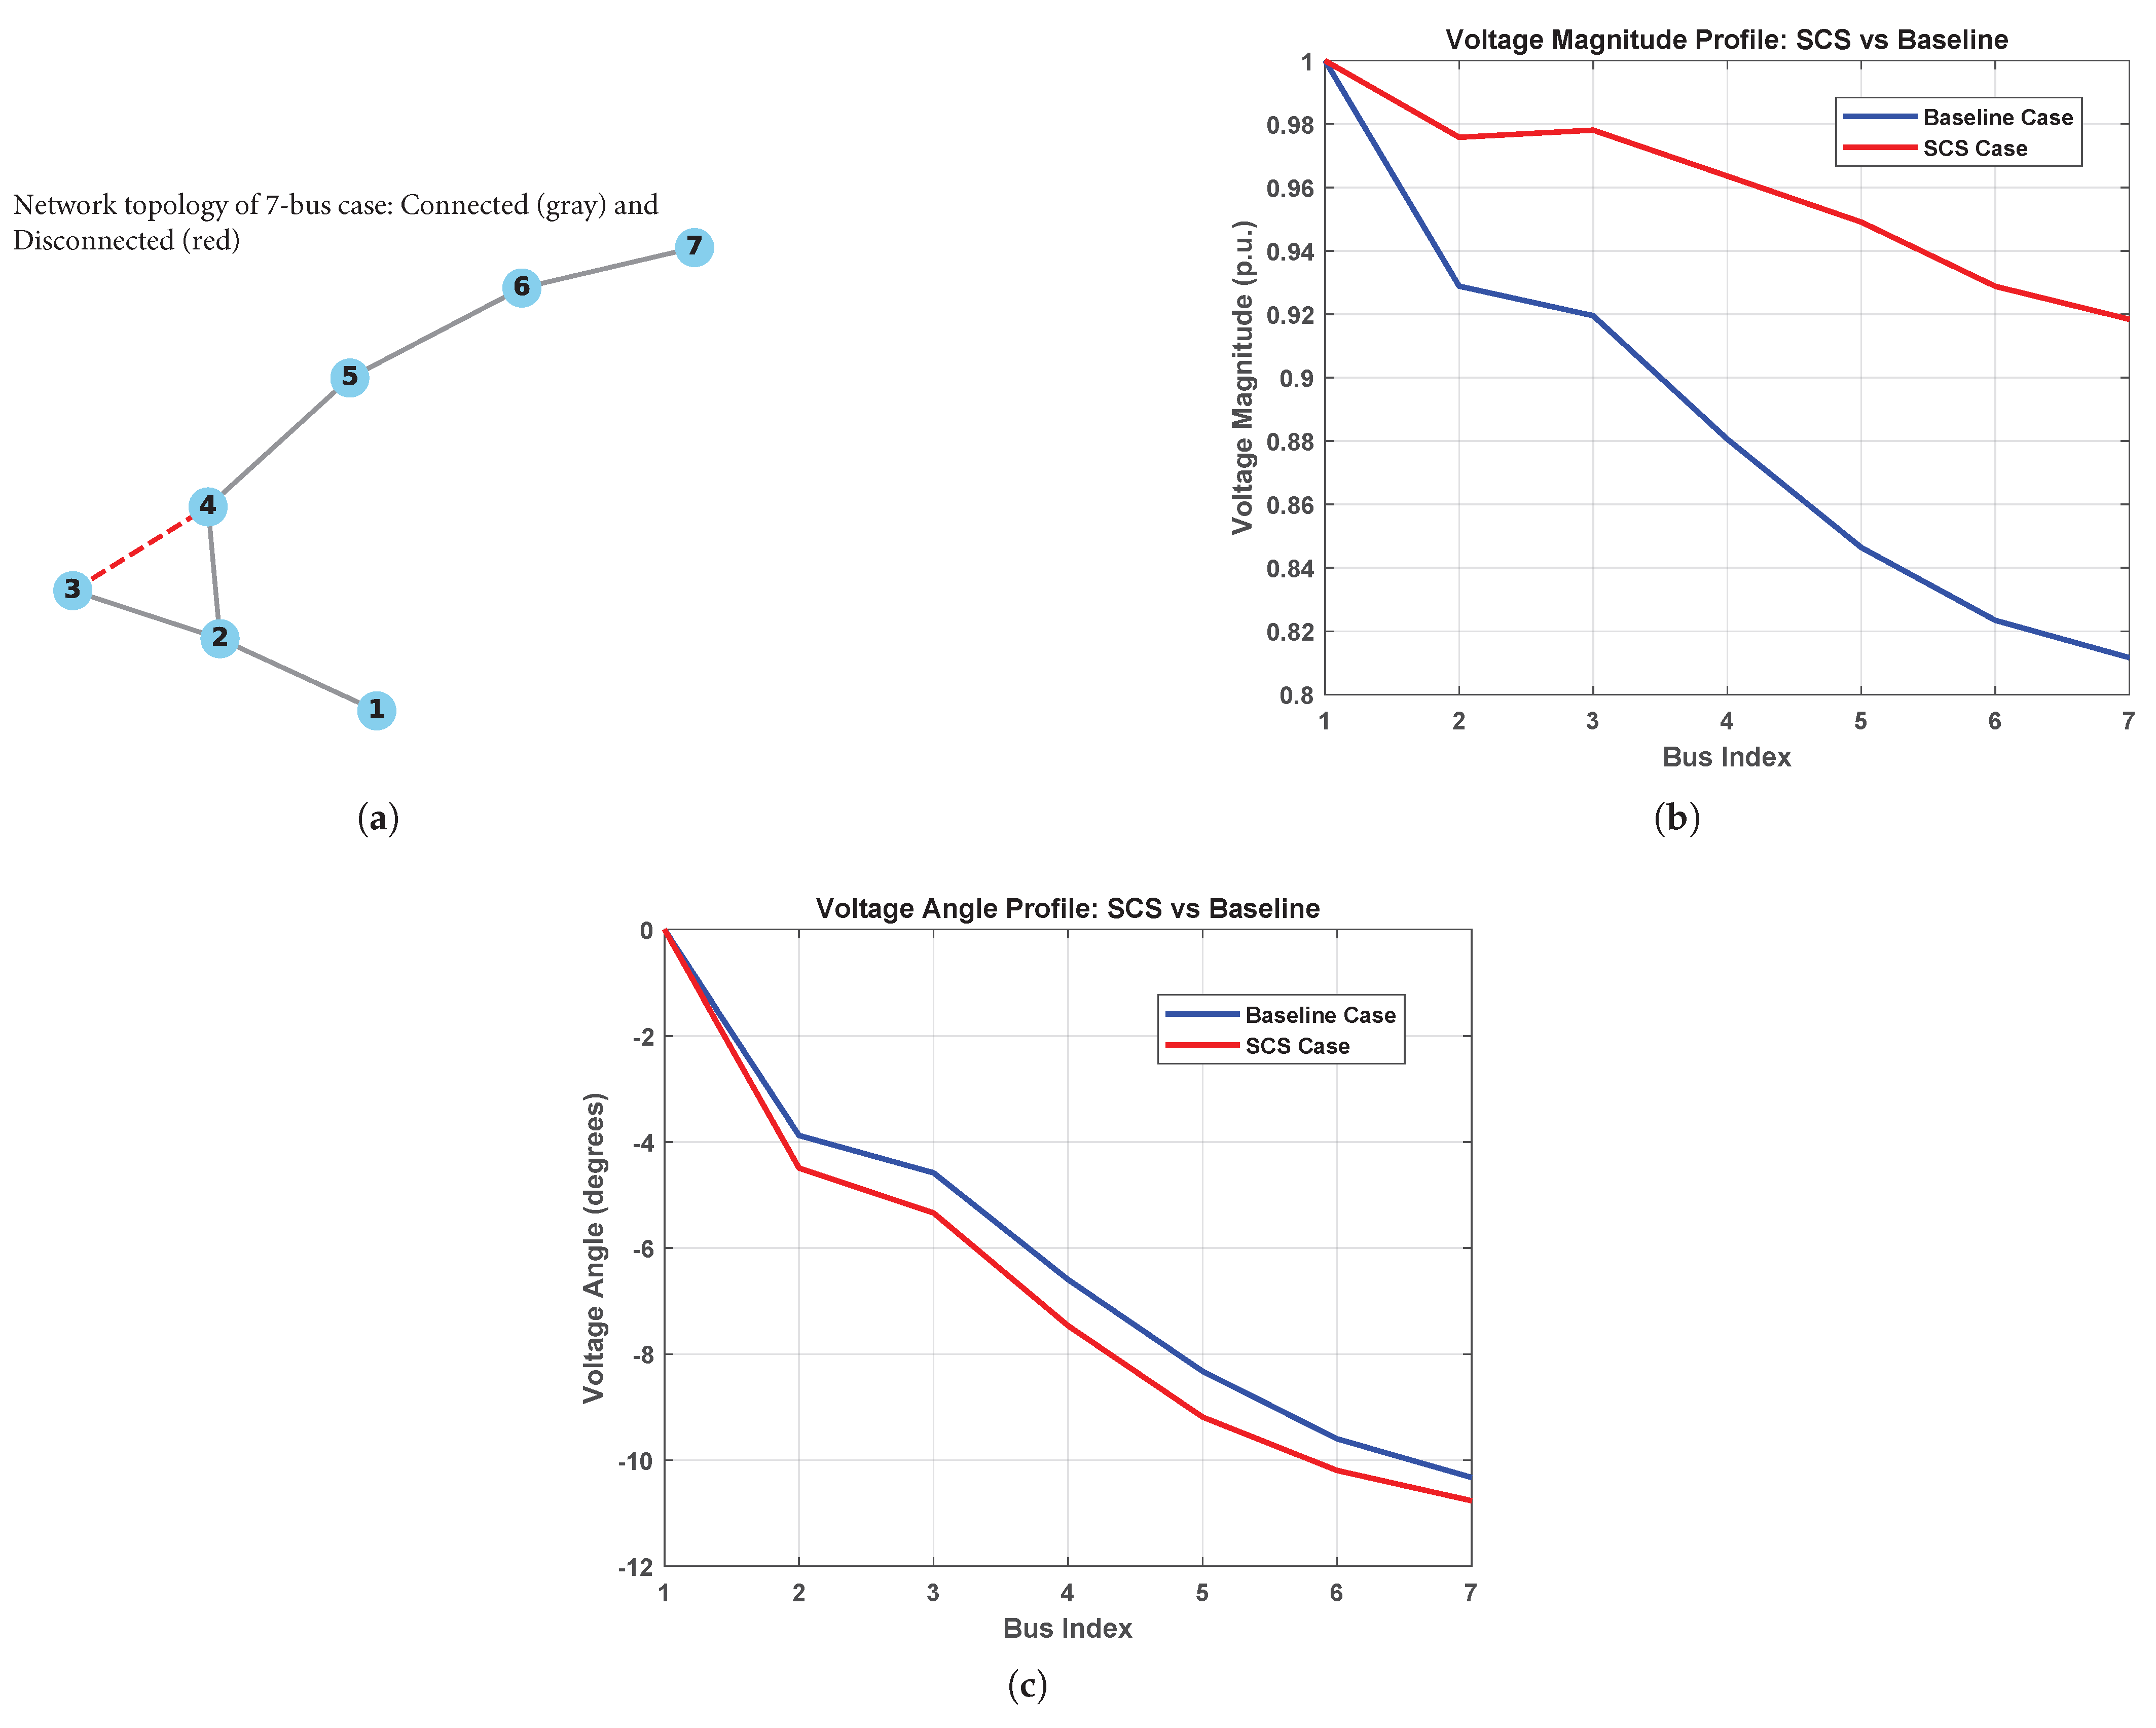
In certain network conditions, the existing switch configuration may already represent an optimal or near-optimal topology in terms of power loss. In such scenarios, the RTLS stage may be unable to identify any alternative configuration that results in further improvement. To address this limitation and maintain the effectiveness of the proposed methodology, the algorithm transitions to the SCS stage when no advantageous reconfiguration is found. This ensures continued optimization through reactive power support, even when reconfiguration alone is insufficient. To demonstrate this behavior, a 7-bus test system is employed, as illustrated in Figure 15. The network includes three shunt capacitors, each rated at 50 kVAr, pre-installed at buses 3, 4, and 5. Initially, the algorithm attempts to execute the RTLS stage; however, no switching configuration surpasses the baseline topology in terms of active power loss. As a result, the process transitions to the SCS stage. The SCS optimization determines that full-rated compensation at buses 3 and 4 (50 kVAr each) is sufficient to achieve improved voltage profiles and a reduction in reactive burden. These enhancements are accomplished without altering the network topology, showcasing the adaptability of the proposed framework. Figure 15 also illustrates the voltage magnitude and angle profiles before and after compensation, confirming that the SCS stage alone fulfills the voltage regulation and loss mitigation objectives. Ultimately, the algorithm concludes with the SCS-derived configuration as the final output, highlighting the robustness of the proposed method in scenarios where topological reconfiguration is either infeasible or unnecessary.
Table 5 benchmarks the proposed method on the IEEE 33-bus system (normal loading) against cited approaches. The RTLS stage alone cuts losses by 31% and lifts the minimum voltage to 0.9423 p.u., comparing favorably with the best reported results. Running the full three-stage framework reduces losses to 130 kW (37%) and raises the minimum voltage to 0.9478 p.u., outperforming most entries in the table. While the compared studies assess only a single operating point, our method is validated across five operating conditions and two networks, underscoring its effectiveness, robustness, and practical relevance.

5. Conclusions

This paper presented a comprehensive three-stage optimization framework for Distribution Network Reconfiguration (DNR), integrating RTLS, SCS, and a re-execution of RTLS as a refinement stage to enhance system performance under diverse operating conditions. The proposed method was validated across two benchmark systems, IEEE 33-bus and IEEE 123-bus, as well as a custom 7-bus case, under 5 distinct scenarios involving variations in loading levels and PF: normal, light, and heavy loading and good and poor PF conditions. Full AC power flow modeling, radiality enforcement, and binary decision-making for reactive support were considered, ensuring realism and practical feasibility. The results demonstrate that the proposed framework consistently reduces active power losses while improving voltage profiles. The RTLS stage alone achieved substantial improvements by identifying optimal radial topologies, while the SCS stage provided additional reactive support that further enhanced voltage stability and minimized losses. In scenarios characterized by high loading or poor PF, the third stage was activated and successfully identified alternative configurations with marginal yet measurable loss reductions. Across all scenarios, the proposed framework delivered substantial active-power loss reductions. For Case 1, reductions were 37% (normal), 39% (heavy), 42% (light), 41% (poor PF), and 37% (good PF). For Case 2, reductions reached 68% (normal), 70% (heavy), 36% (light), 61% (poor PF), and 52% (good PF). These values are the result of the full application of the proposed methodology for each scenario. These cases validate that the preceding stages had already achieved near-optimal configurations, and that the marginal gains from the third stage must be weighed against the operational cost of additional switching by the DSO. In contrast, when the third stage failed to identify a better topology, it served as confirmation of the optimality of the two-stage outcome, highlighting the context-aware design of the proposed method. This dynamic behavior ensures computational efficiency and operational practicality, two key requirements for real-world distribution network operation. Comparison with existing heuristic-based approaches in the literature shows that, even under normal loading, the proposed RTLS stage performs competitively in terms of loss reduction and voltage improvement. The full three-stage framework, however, significantly outperforms previous methods in both technical performance and adaptability, demonstrating robust scalability and effectiveness across diverse grid conditions. The proposed methodology provides DSOs with a flexible, efficient, and intelligent decision-making tool for DNR and reactive power compensation. It should be noted that there is still room to extend this work. For example, the computational burden can be reduced using convex relaxation approaches, including semidefinite programming or second-order cone programming. Further directions include multi-period (e.g., 24-h) optimization and real-time control, using the three stages as modular components in a model-predictive control setup. Also, an explicit switching-cost term can be embedded in the objective to formalize the trade-off between Stage-3’s incremental loss reductions and operational burden, enabling cost-aware reconfiguration decisions. Finally, adaptive event-triggered output feedback control for nonlinear multi-agent systems using output information only can be implemented, considering the associated switching costs of the tie-line switches. A promising direction is to integrate cyber-secure, attack-resilient mechanisms, such as FDI detection and authenticated command channels, so that DNR decisions remain reliable under adversarial conditions.

Author Contributions

Conceptualization, A.M.V.; methodology, A.M.V.; software, A.M.V.; validation, A.M.V.; formal analysis, A.M.V., M.M. and M.A.; investigation, A.M.V., M.M. and M.A.; resources, A.M.V.; data curation, A.M.V.; writing—original draft preparation, A.M.V.; writing—review and editing, A.M.V., M.M. and M.A.; visualization, A.M.V.; supervision, M.M. and M.A.; project administration, M.M. and M.A. All authors have read and agreed to the published version of the manuscript.

Funding

This research received no external funding.

Data Availability Statement

The raw data supporting the conclusions of this article will be made available by the authors on request.

Conflicts of Interest

The authors declare that they have no known competing financial interests or personal relationships that could have appeared to influence the work reported in this paper.

Nomenclature

The following symbols and abbreviations are used in this manuscript:
i , j Bus Indices (Sending i and Receiving j)
kBranch Index
tTime Index
B Set of All Buses
P L , i Active Power Demand at Bus i (kW)
Q L , i Reactive Power Demand at Bus i (kVAr)
V i Voltage Magnitude at Bus i (p.u.)
θ i Voltage Angle at Bus i (rad)
R i j Line Resistance Between Buses i and j ( Ω )
X i j Line Reactance Between Buses i and j ( Ω )
S ¯ i j Apparent Power Limit on Branch i j (kVA)
V ¯ i , V ̲ i Upper and Lower Voltage Limits at Bus i (p.u.)
P i j , Q i j Active/Reactive Power Flow from i to j (kW, kVAr)
P loss , Q loss Total Active/reactive Power Losses (kW, kVAr)
u Binary Switch-Status Vector (1 = closed, 0 = open)
Q cap Reactive Power Injection from Shunt Capacitors (kVAr)
A i k Network Incidence/Adjacency Matrix Entry
F Objective Function
DNDistribution Network
DNRDistribution Network Reconfiguration
RTLSReconfiguration of Tie-Line Switches
SCSShunt Capacitor Sizing
PSOParticle Swarm Optimization
DFSDepth-First Search
AC PFAC Power Flow
DSODistribution System Operator
PFPower Factor
GAGenetic Algorithm
HSAHarmony Search Algorithm
kWKilowatt
kVArKilovolt–Ampere Reactive
p.u.Per Unit

References

  1. Noh, Y.; Jafarinejad, S.; Anand, P. A Review on Harnessing Renewable Energy Synergies for Achieving Urban Net-Zero Energy Buildings: Technologies, Performance Evaluation, Policies, Challenges, and Future Direction. Sustainability 2024, 16, 3444. [Google Scholar] [CrossRef]
  2. Mishra, A.; Tripathy, M.; Ray, P. A survey on different techniques for distribution network reconfiguration. J. Eng. Res. 2024, 12, 173–181. [Google Scholar] [CrossRef]
  3. Bahrami, S.; Chen, Y.C.; Wong, V.W. Dynamic Distribution Network Reconfiguration with Generation and Load Uncertainty. IEEE Trans. Smart Grid 2024, 15, 5472–5484. [Google Scholar] [CrossRef]
  4. Vaniar, A.M.; Göl, M. Two-Stage Distribution Network Reconfiguration Considering Shunt Compensation. In Proceedings of the 2025 IEEE Kiel PowerTech, Kiel, Germany, 29 June–3 July 2025; pp. 1–6. [Google Scholar]
  5. Behbahani, M.R.; Jalilian, A.; Bahmanyar, A.; Ernst, D. Comprehensive Review on Static and Dynamic Distribution Network Reconfiguration Methodologies. IEEE Access 2024, 12, 9510–9525. [Google Scholar] [CrossRef]
  6. Graine, A.; Gaubert, J.P.; Larraillet, D. TSO-DSO Coordination for Voltage Regulation based on the Distribution Network Reconfiguration and Variable Shunt Reactors. In Proceedings of the 2024 IEEE PES Innovative Smart Grid Technologies Europe (ISGT EUROPE), Dubrovnik, Croatia, 14–17 October 2024; pp. 1–5. [Google Scholar]
  7. Esmaeilnezhad, B.; Amini, H.; Noroozian, R.; Jalilzadeh, S. Flexible Reconfiguration for Optimal Operation of Distribution Network Under Renewable Generation and Load Uncertainty. Energies 2025, 18, 266. [Google Scholar] [CrossRef]
  8. Merlin, A.; Back, H. Search for a minimal-loss operating spanning tree configuration in an urban power distribution system. In Proceedings of the 5th Power System Computation Conference, Cambridge, UK, 1–5 September 1975; Volume 5, pp. 1–18. [Google Scholar]
  9. Shirmohammadi, D.; Hong, H.W. Reconfiguration of electric distribution networks for resistive line losses reduction. IEEE Trans. Power Deliv. 1989, 4, 1492–1498. [Google Scholar] [CrossRef]
  10. Civanlar, S.; Grainger, J.; Yin, H.; Lee, S. Distribution feeder reconfiguration for loss reduction. IEEE Trans. Power Deliv. 1988, 3, 1217–1223. [Google Scholar] [CrossRef]
  11. Baran, M.E.; Wu, F.F. Network reconfiguration in distribution systems for loss reduction and load balancing. IEEE Trans. Power Deliv. 1989, 4, 1401–1407. [Google Scholar] [CrossRef]
  12. Nara, K.; Shiose, A.; Kitagawa, M.; Ishihara, T. Implementation of genetic algorithm for distribution systems loss minimum re-configuration. IEEE Trans. Power Syst. 1992, 7, 1044–1051. [Google Scholar] [CrossRef]
  13. Chang, H.C.; Kuo, C.C. Network reconfiguration in distribution systems using simulated annealing. Electr. Power Syst. Res. 1994, 29, 227–238. [Google Scholar] [CrossRef]
  14. Otuo-Acheampong, D.; Rashed, G.I.; Akwasi, A.M.; Haider, H. Application of Optimal Network Reconfiguration for Loss Minimization and Voltage Profile Enhancement of Distribution System Using Heap-Based Optimizer. Int. Trans. Electr. Energy Syst. 2023, 2023, 9930954. [Google Scholar] [CrossRef]
  15. Anteneh, D.; Khan, B.; Mahela, O.P.; Alhelou, H.H.; Guerrero, J.M. Distribution network reliability enhancement and power loss reduction by optimal network reconfiguration. Comput. Electr. Eng. 2021, 96, 107518. [Google Scholar] [CrossRef]
  16. Peng, Q.; Tang, Y.; Low, S.H. Feeder reconfiguration in distribution networks based on convex relaxation of OPF. IEEE Trans. Power Syst. 2014, 30, 1793–1804. [Google Scholar] [CrossRef]
  17. Taylor, J.A.; Hover, F.S. Convex models of distribution system reconfiguration. IEEE Trans. Power Syst. 2012, 27, 1407–1413. [Google Scholar] [CrossRef]
  18. Liu, Y.; Li, J.; Wu, L. Coordinated optimal network reconfiguration and voltage regulator/DER control for unbalanced distribution systems. IEEE Trans. Smart Grid 2018, 10, 2912–2922. [Google Scholar] [CrossRef]
  19. Akrami, A.; Doostizadeh, M.; Aminifar, F. Optimal reconfiguration of distribution network using PMU measurements: A data-driven stochastic robust optimization. IEEE Trans. Smart Grid 2019, 11, 420–428. [Google Scholar] [CrossRef]
  20. Azizivahed, A.; Arefi, A.; Ghavidel, S.; Shafie-Khah, M.; Li, L.; Zhang, J.; Catalão, J.P. Energy management strategy in dynamic distribution network reconfiguration considering renewable energy resources and storage. IEEE Trans. Sustain. Energy 2019, 11, 662–673. [Google Scholar] [CrossRef]
  21. Zheng, W.; Huang, W.; Hill, D.J.; Hou, Y. An adaptive distributionally robust model for three-phase distribution network reconfiguration. IEEE Trans. Smart Grid 2020, 12, 1224–1237. [Google Scholar] [CrossRef]
  22. Dorostkar-Ghamsari, M.R.; Fotuhi-Firuzabad, M.; Lehtonen, M.; Safdarian, A. Value of distribution network reconfiguration in presence of renewable energy resources. IEEE Trans. Power Syst. 2015, 31, 1879–1888. [Google Scholar] [CrossRef]
  23. Cao, X.; Wang, J.; Wang, J.; Zeng, B. A risk-averse conic model for networked microgrids planning with reconfiguration and reorganizations. IEEE Trans. Smart Grid 2019, 11, 696–709. [Google Scholar] [CrossRef]
  24. Huang, S.; Wu, Q.; Cheng, L.; Liu, Z. Optimal reconfiguration-based dynamic tariff for congestion management and line loss reduction in distribution networks. IEEE Trans. Smart Grid 2015, 7, 1295–1303. [Google Scholar] [CrossRef]
  25. Rahmani-Andebili, M.; Fotuhi-Firuzabad, M. An adaptive approach for PEVs charging management and reconfiguration of electrical distribution system penetrated by renewables. IEEE Trans. Ind. Inform. 2017, 14, 2001–2010. [Google Scholar] [CrossRef]
  26. Asrari, A.; Lotfifard, S.; Ansari, M. Reconfiguration of smart distribution systems with time varying loads using parallel computing. IEEE Trans. Smart Grid 2016, 7, 2713–2723. [Google Scholar] [CrossRef]
  27. Wu, H.; Dong, P.; Liu, M. Distribution network reconfiguration for loss reduction and voltage stability with random fuzzy uncertainties of renewable energy generation and load. IEEE Trans. Ind. Inform. 2018, 16, 5655–5666. [Google Scholar] [CrossRef]
  28. Kavousi-Fard, A.; Niknam, T.; Fotuhi-Firuzabad, M. A novel stochastic framework based on cloud theory and bat algorithm to solve the distribution feeder reconfiguration. IEEE Trans. Smart Grid 2015, 7, 740–750. [Google Scholar] [CrossRef]
  29. Harsh, P.; Das, D. A simple and fast heuristic approach for the reconfiguration of radial distribution networks. IEEE Trans. Power Syst. 2023, 38, 2939–2942. [Google Scholar] [CrossRef]
  30. Naguib, M.; Omran, W.A.; Talaat, H.E. Performance enhancement of distribution systems via distribution network reconfiguration and distributed generator allocation considering uncertain environment. J. Mod. Power Syst. Clean Energy 2021, 10, 647–655. [Google Scholar] [CrossRef]
  31. Amini, M.; Jalilian, A.; Behbahani, M.R.P. Fast network reconfiguration in harmonic polluted distribution network based on developed backward/forward sweep harmonic load flow. Electr. Power Syst. Res. 2019, 168, 295–304. [Google Scholar] [CrossRef]
  32. Rahimipour Behbahani, M.; Jalilian, A. Reconfiguration of harmonic polluted distribution network using modified discrete particle swarm optimization equipped with smart radial method. IET Gener. Transm. Distrib. 2023, 17, 2563–2575. [Google Scholar] [CrossRef]
  33. Rahimi Pour Behbahani, M.; Jalilian, A.; Amini, M. Reconfiguration of distribution network using discrete particle swarm optimization to reduce voltage fluctuations. Int. Trans. Electr. Energy Syst. 2020, 30, e12501. [Google Scholar] [CrossRef]
  34. Salkuti, S.R. Feeder reconfiguration in unbalanced distribution system with wind and solar generation using ant lion optimization. Int. J. Adv. Comput. Sci. Appl. 2021, 12. [Google Scholar] [CrossRef]
  35. Gerez, C.; Coelho Marques Costa, E.; Sguarezi Filho, A.J. Distribution network reconfiguration considering voltage and current unbalance indexes and variable demand solved through a selective bio-inspired metaheuristic. Energies 2022, 15, 1686. [Google Scholar] [CrossRef]
  36. Lotfi, H.; Shojaei, A.A. A dynamic model for multi-objective feeder reconfiguration in distribution network considering demand response program. Energy Syst. 2023, 14, 1051–1080. [Google Scholar]
  37. Essallah, S.; Khedher, A. Optimization of distribution system operation by network reconfiguration and DG integration using MPSO algorithm. Renew. Energy Focus 2020, 34, 37–46. [Google Scholar] [CrossRef]
  38. Amin Heidari, M. Optimal network reconfiguration in distribution system for loss reduction and voltage-profile improvement using hybrid algorithm of PSO and ACO. CIRED 24 2017, 2017, 2458–2461. [Google Scholar]
  39. Kahouli, O.; Alsaif, H.; Bouteraa, Y.; Ben Ali, N.; Chaabene, M. Power system reconfiguration in distribution network for improving reliability using genetic algorithm and particle swarm optimization. Appl. Sci. 2021, 11, 3092. [Google Scholar] [CrossRef]
  40. Dahalan, W.M.; Mokhlis, H. Network reconfiguration for loss reduction with distributed generations using PSO. In Proceedings of the 2012 IEEE international conference on power and energy (PECon), Kota Kinabalu, Malaysia, 2–5 December 2012; pp. 823–828. [Google Scholar]
  41. Merzoug, Y.; Abdelkrim, B.; Larbi, B. Distribution network reconfiguration for loss reduction using PSO method. Int. J. Electr. Comput. Eng. 2020, 10, 5009. [Google Scholar]
  42. Rao, R.S.; Ravindra, K.; Satish, K.; Narasimham, S. Power loss minimization in distribution system using network reconfiguration in the presence of distributed generation. IEEE Trans. Power Syst. 2012, 28, 317–325. [Google Scholar] [CrossRef]
  43. Khajevand, M.; Fakharian, A.; Sedighizadeh, M. Stochastic joint optimal distributed generation scheduling and distribution feeder reconfiguration of microgrids considering uncertainties modeled by copula-based method. Iran. J. Electr. Electron. Eng. 2020, 16, 371–392. [Google Scholar]
  44. Khorram-Nia, R.; Bahmani-Firouzi, B.; Simab, M. Optimal scheduling of reconfigurable microgrids incorporating the PEVs and uncertainty effects. IET Renew. Power Gener. 2022, 16, 3531–3543. [Google Scholar] [CrossRef]
  45. Esmaeili, S.; Anvari-Moghaddam, A.; Jadid, S.; Guerrero, J.M. Optimal simultaneous day-ahead scheduling and hourly reconfiguration of distribution systems considering responsive loads. Int. J. Electr. Power Energy Syst. 2019, 104, 537–548. [Google Scholar] [CrossRef]
  46. Li, Z.; Jazebi, S.; De Leon, F. Determination of the optimal switching frequency for distribution system reconfiguration. IEEE Trans. Power Deliv. 2016, 32, 2060–2069. [Google Scholar] [CrossRef]
  47. Diaaeldin, I.M.; Abdel Aleem, S.H.; El-Rafei, A.; Abdelaziz, A.Y.; Zobaa, A.F. Enhancement of hosting capacity with soft open points and distribution system reconfiguration: Multi-objective bilevel stochastic optimization. Energies 2020, 13, 5446. [Google Scholar] [CrossRef]
  48. Abbas, A.S.; Abou El-Ela, A.A.; El-Sehiemy, R.A. Maximization approach of hosting capacity based on uncertain renewable energy resources using network reconfiguration and soft open points. Int. Trans. Electr. Energy Syst. 2022, 2022, 2947965. [Google Scholar] [CrossRef]
  49. Čađenović, R.; Jakus, D. Maximization of distribution network hosting capacity through optimal grid reconfiguration and distributed generation capacity allocation/control. Energies 2020, 13, 5315. [Google Scholar] [CrossRef]
  50. Cikan, N.N.; Cikan, M. Reconfiguration of 123-bus unbalanced power distribution network analysis by considering minimization of current & voltage unbalanced indexes and power loss. Int. J. Electr. Power Energy Syst. 2024, 157, 109796. [Google Scholar] [CrossRef]
  51. Gangwar, P.; Singh, S.; Chakrabarti, S. Network reconfiguration for unbalanced distribution systems. In Proceedings of the TENCON 2017-2017 IEEE Region 10 Conference, Penang, Malaysia, 5–8 November 2017; pp. 3028–3032. [Google Scholar]
  52. Hachemi, A.T.; Sadaoui, F.; Saim, A.; Ebeed, M.; Arif, S. Dynamic operation of distribution grids with the integration of photovoltaic systems and distribution static compensators considering network reconfiguration. Energy Rep. 2024, 12, 1623–1637. [Google Scholar] [CrossRef]
  53. Ghofrani, M. Sensitivity analysis of distribution network reconfiguration optimization for electric vehicle and renewable distributed generator integration. Energies 2025, 18, 1903. [Google Scholar] [CrossRef]
  54. Kang, Y.; Lu, G.; Chen, M.; Li, X.; Li, S. Fault recovery method of DC distribution network considering EV charging and discharging and SOP network reconfiguration. Electr. Power Syst. Res. 2025, 245, 111607. [Google Scholar] [CrossRef]
  55. Maurya, P.; Tiwari, P.; Pratap, A. Electric eel foraging optimization algorithm for distribution network reconfiguration with distributed generation for power system performance enhancement considerations different load models. Comput. Electr. Eng. 2024, 119, 109531. [Google Scholar] [CrossRef]
  56. Salimon, S.A.; Fajinmi, I.O.; Adewuyi, O.B.; Pandey, A.K.; Adebiyi, O.W.; Kotb, H. Graph theory-enhanced integrated distribution network reconfiguration and distributed generation planning: A comparative techno-economic and environmental impacts analysis. Clean. Eng. Technol. 2024, 22, 100808. [Google Scholar]
  57. Iftikhar, M.Z.; Imran, K. Network reconfiguration and integration of distributed energy resources in distribution network by novel optimization techniques. Energy Rep. 2024, 12, 3155–3179. [Google Scholar] [CrossRef]
  58. Maurya, P.; Tiwari, P.; Pratap, A. Application of the hippopotamus optimization algorithm for distribution network reconfiguration with distributed generation considering different load models for enhancement of power system performance. Electr. Eng. 2025, 107, 3909–3946. [Google Scholar] [CrossRef]
  59. Mokhtari, Y.; Coirault, P.; Moulay, E.; Le Ny, J.; Larraillet, D. Distributed ADMM Approach for the Power Distribution Network Reconfiguration. Sustain. Energy Grids Netw. 2025, 43, 101890. [Google Scholar] [CrossRef]
  60. Rajić, T.; Stojanović, B. Algorithm for distribution network reconfiguration and reactive power compensation with battery energy storage systems. Electr. Power Syst. Res. 2025, 244, 111547. [Google Scholar] [CrossRef]
  61. Musaruddin, M.; Tambi, T.; Zulkaidah, W.; Masikki, G.A.N.; Lolok, A.; Djohar, A.; Marwan, M. Optimizing network reconfiguration to reduce power loss and improve the voltage profile in the distribution system: A practical case study. e-Prime-Adv. Electr. Eng. Electron. Energy 2024, 8, 100599. [Google Scholar] [CrossRef]
  62. Jo, S.; Oh, J.Y.; Yoon, Y.T.; Jin, Y.G. Self-healing radial distribution network reconfiguration based on deep reinforcement learning. Results Eng. 2024, 22, 102026. [Google Scholar] [CrossRef]
  63. Gao, H.; Jiang, S.; Li, Z.; Wang, R.; Liu, Y.; Liu, J. A two-stage multi-agent deep reinforcement learning method for urban distribution network reconfiguration considering switch contribution. IEEE Trans. Power Syst. 2024, 39, 7064–7076. [Google Scholar] [CrossRef]
  64. Peng, H.; Liao, K.; Yang, J.; Pang, B.; He, Z. Deep Reinforcement Learning Based Multi-Timescale Volt/Var Control in Distribution Networks Considering Network Reconfiguration. IEEE Trans. Sustain. Energy 2025, 16, 2948–2958. [Google Scholar] [CrossRef]
  65. Oh, J.Y.; Oh, S.H.; Lee, G.S.; Yoon, Y.T.; Jo, S. Sequential Control of Individual Switches for Real-time Distribution Network Reconfiguration Using Deep Reinforcement Learning. IEEE Trans. Smart Grid 2025, 16, 3666–3683. [Google Scholar] [CrossRef]
  66. Aravena, I.; Molzahn, D.K.; Zhang, S.; Petra, C.G.; Curtis, F.E.; Tu, S.; Wächter, A.; Wei, E.; Wong, E.; Gholami, A.; et al. Recent developments in security-constrained AC optimal power flow: Overview of challenge 1 in the ARPA-E grid optimization competition. Oper. Res. 2023, 71, 1997–2014. [Google Scholar] [CrossRef]
  67. Bayat, M.; Koushki, M.M.; Ghadimi, A.A.; Tostado-Véliz, M.; Jurado, F. Comprehensive enhanced Newton Raphson approach for power flow analysis in droop-controlled islanded AC microgrids. Int. J. Electr. Power Energy Syst. 2022, 143, 108493. [Google Scholar] [CrossRef]
  68. Roy, A.K.; Jain, S.K. Improved transmission line contingency analysis in power system using fast decoupled load flow. Int. J. Adv. Eng. Technol. 2013, 6, 2159. [Google Scholar]
  69. Park, S.; Chen, W.; Mak, T.W.; Van Hentenryck, P. Compact optimization learning for AC optimal power flow. IEEE Trans. Power Syst. 2023, 39, 4350–4359. [Google Scholar] [CrossRef]
  70. Usman, M.; Capitanescu, F. Three solution approaches to stochastic multi-period AC optimal power flow in active distribution systems. IEEE Trans. Sustain. Energy 2022, 14, 178–192. [Google Scholar] [CrossRef]
Figure 1. Overview of the DNR.
Energies 18 06062 g001
Figure 2. Network topologies and candidate tie-line switches. (a) Case 1 (IEEE 33-bus). (b) Case 2 (IEEE 123-bus).
Energies 18 06062 g002
Figure 3. Case 1 under normal loading. (a) RTLS: voltage magnitude | V | . (b) RTLS: voltage angle V . (c) RTLS: active branch power P k . (d) RTLS: reactive branch power Q k . (e) SCS: voltage magnitude | V | . (f) SCS: voltage angle V . (g) SCS: active branch power P k . (h) SCS: reactive branch power Q k . (i) RTLS’: voltage magnitude | V | . (j) RTLS’: voltage angle V . (k) RTLS’: active branch power P k . (l) RTLS’: reactive branch power Q k .
Energies 18 06062 g003aEnergies 18 06062 g003b
Figure 4. Case 1 under heavy loading. (a) RTLS: voltage magnitude | V | . (b) RTLS: voltage angle V . (c) RTLS: active branch power P k . (d) RTLS: reactive branch power Q k . (e) SCS: voltage magnitude | V | . (f) SCS: voltage angle V . (g) SCS: active branch power P k . (h) SCS: reactive branch power Q k . (i) RTLS’: voltage magnitude | V | . (j) RTLS’: voltage angle V . (k) RTLS’: active branch power P k . (l) RTLS’: reactive branch power Q k .
Energies 18 06062 g004
Figure 5. Case 1 under light loading. (a) RTLS: voltage magnitude | V | . (b) RTLS: voltage angle V . (c) RTLS: active branch power P k . (d) RTLS: reactive branch power Q k . (e) SCS: voltage magnitude | V | . (f) SCS: voltage angle V . (g) SCS: active branch power P k . (h) SCS: reactive branch power Q k .
Energies 18 06062 g005
Figure 6. Case 1 under poor power factor (PF). (a) RTLS: voltage magnitude | V | . (b) RTLS: voltage angle V . (c) RTLS: active branch power P k . (d) RTLS: reactive branch power Q k . (e) SCS: voltage magnitude | V | . (f) SCS: voltage angle V . (g) SCS: active branch power P k . (h) SCS: reactive branch power Q k . (i) RTLS’: voltage magnitude | V | . (j) RTLS’: voltage angle V . (k) RTLS’: active branch power P k . (l) RTLS’: reactive branch power Q k .
Energies 18 06062 g006
Figure 7. Case 1 under good power factor (PF). (a) RTLS: voltage magnitude | V | . (b) RTLS: voltage angle V . (c) RTLS: active branch power P k . (d) RTLS: reactive branch power Q k . (e) SCS: voltage magnitude | V | . (f) SCS: voltage angle V . (g) SCS: active branch power P k . (h) SCS: reactive branch power Q k .
Energies 18 06062 g007
Figure 8. Case 1 losses across operating conditions and optimization stages. (a) Active power loss. (b) Reactive power loss.
Energies 18 06062 g008
Figure 9. Case 2 (IEEE 123-bus) under normal loading. (a) RTLS: voltage magnitude | V | . (b) RTLS: voltage angle V . (c) RTLS: active branch power P k . (d) RTLS: reactive branch power Q k . (e) SCS: voltage magnitude | V | . (f) SCS: voltage angle V . (g) SCS: active branch power P k . (h) SCS: reactive branch power Q k .
Energies 18 06062 g009
Figure 10. Case 2 (IEEE 123-bus) under heavy loading. (a) RTLS: voltage magnitude | V | . (b) RTLS: voltage angle V . (c) RTLS: active branch power P k . (d) RTLS: reactive branch power Q k . (e) SCS: voltage magnitude | V | . (f) SCS: voltage angle V . (g) SCS: active branch power P k . (h) SCS: reactive branch power Q k . (i) RTLS’: voltage magnitude | V | . (j) RTLS’: voltage angle V . (k) RTLS’: active branch power P k . (l) RTLS’: reactive branch power Q k .
Energies 18 06062 g010
Figure 11. Case 2 (IEEE 123-bus) under light loading. (a) RTLS: voltage magnitude | V | . (b) RTLS: voltage angle V . (c) RTLS: active branch power P k . (d) RTLS: reactive branch power Q k . (e) SCS: voltage magnitude | V | . (f) SCS: voltage angle V . (g) SCS: active branch power P k . (h) SCS: reactive branch power Q k .
Energies 18 06062 g011
Figure 12. Case 2 (IEEE 123-bus) under poor power factor (PF). (a) RTLS: voltage magnitude | V | . (b) RTLS: voltage angle V . (c) RTLS: active branch power P k . (d) RTLS: reactive branch power Q k . (e) SCS: voltage magnitude | V | . (f) SCS: voltage angle V . (g) SCS: active branch power P k . (h) SCS: reactive branch power Q k . (i) RTLS’: voltage magnitude | V | . (j) RTLS’: voltage angle V . (k) RTLS’: active branch power P k . (l) RTLS’: reactive branch power Q k .
Energies 18 06062 g012
Figure 13. Case 2 (IEEE 123-bus) under good power factor (PF). (a) RTLS: voltage magnitude | V | . (b) RTLS: voltage angle V . (c) RTLS: active branch power P k . (d) RTLS: reactive branch power Q k . (e) SCS: voltage magnitude | V | . (f) SCS: voltage angle V . (g) SCS: active branch power P k . (h) SCS: reactive branch power Q k .
Energies 18 06062 g013
Figure 14. Case 2 (IEEE 123-bus) losses across operating conditions and optimization stages. (a) Active power loss. (b) Reactive power loss.
Energies 18 06062 g014
Figure 15. 7-bus illustrative case. (a) Network topology. (b) Bus voltage magnitude | V | . (c) Bus voltage angle V .
Energies 18 06062 g015
Table 1. Three-stage DNR results for Case 1 across all loading and PF conditions.
StageNormalHeavyLightPoor PFGood PF
P loss Q loss Δ P P loss Q loss Δ P P loss Q loss Δ P P loss Q loss Δ P P loss Q loss Δ P
Baseline208111508272482629315815282
RTLS1431043135824629332231197132321006833
SCS1319683352326271816179120995655
RTLS’130940.530820681711174
P loss in kW, Q loss in kVAr. Δ P is the percentage loss reduction relative to the previous stage.
Table 2. Summary of Case 1 results across loading conditions.
Scenario P base (kW) P final (kW) Δ P loss (%)Time (s)Cap. UseTopo. Update in RTLS’
Normal20813037409.75/5Yes
Heavy50830839404.15/5Yes
Light482742381.13/5No
Poor PF29317141411.25/5Yes
Good PF1529537386.85/5No
Table 3. Three-stage DNR results for Case 2 across all loading and PF conditions.
StageNormalHeavyLightPoor PFGood PF
P loss Q loss Δ P P loss Q loss Δ P P loss Q loss Δ P P loss Q loss Δ P P loss Q loss Δ P
Baseline229528617142550115415960183422
RTLS8019265231602622765452044755011230838
SCS7317482125518225415172401151032818
RTLS’182428141603767
P loss in kW, Q loss in kVAr. Δ P is the percentage loss reduction relative to the previous stage.
Table 4. Summary of Case 2 results across loading conditions.
Scenario P base (kW) P final (kW) Δ P loss (%)Time (s)Caps. UsedTopo. Update in RTLS’
Normal2297368388.725/5No
Heavy61718270375.375/5Yes
Light1147336388.533/5No
Poor PF41516061391.415/5Yes
Good PF1527352388.534/5No
Table 5. Comparison of the proposed method with recent methods in terms of power loss reduction and minimum voltage for Case 1.
ReferenceApproach P base (kW) P final (kW) Δ P loss (%) V min (p.u.)
[37]PSO202131330.9394
[38]PSO–ACO202129340.9388
[39]PSO202139310.9372
[40]PSO20212637
GA20213533
[41]PSO208139330.9411
[42]HSA202138310.9342
GA202141300.9310
Refined GA202139310.9315
Proposed First StageRTLS208143310.9423
Full MethodologyRTLS + SCS + RTLS’208130370.9478
Disclaimer/Publisher’s Note: The statements, opinions and data contained in all publications are solely those of the individual author(s) and contributor(s) and not of MDPI and/or the editor(s). MDPI and/or the editor(s) disclaim responsibility for any injury to people or property resulting from any ideas, methods, instructions or products referred to in the content.