1. Introduction
Energy has always been a core issue affecting the survival and development of human society [
1]. In recent years, the intensifying environmental pollution and other issues associated with the extensive utilization of fossil fuels, coupled with the proposal of the ‘dual-carbon’ strategic objective, have led to a growing focus on the development and utilization of geothermal resources [
2,
3,
4,
5,
6]. Geothermal energy represents a novel form of renewable energy, characterized by its cleanliness, low carbon footprint, widespread distribution, abundance, safety and high quality. Its development and utilization are distinguished by a continuous and stable energy supply, coupled with efficient recycling. Its contribution to carbon emission reduction (estimated to avoid 45 million tonnes of CO
2 annually by 2030) [
7,
8,
9,
10].
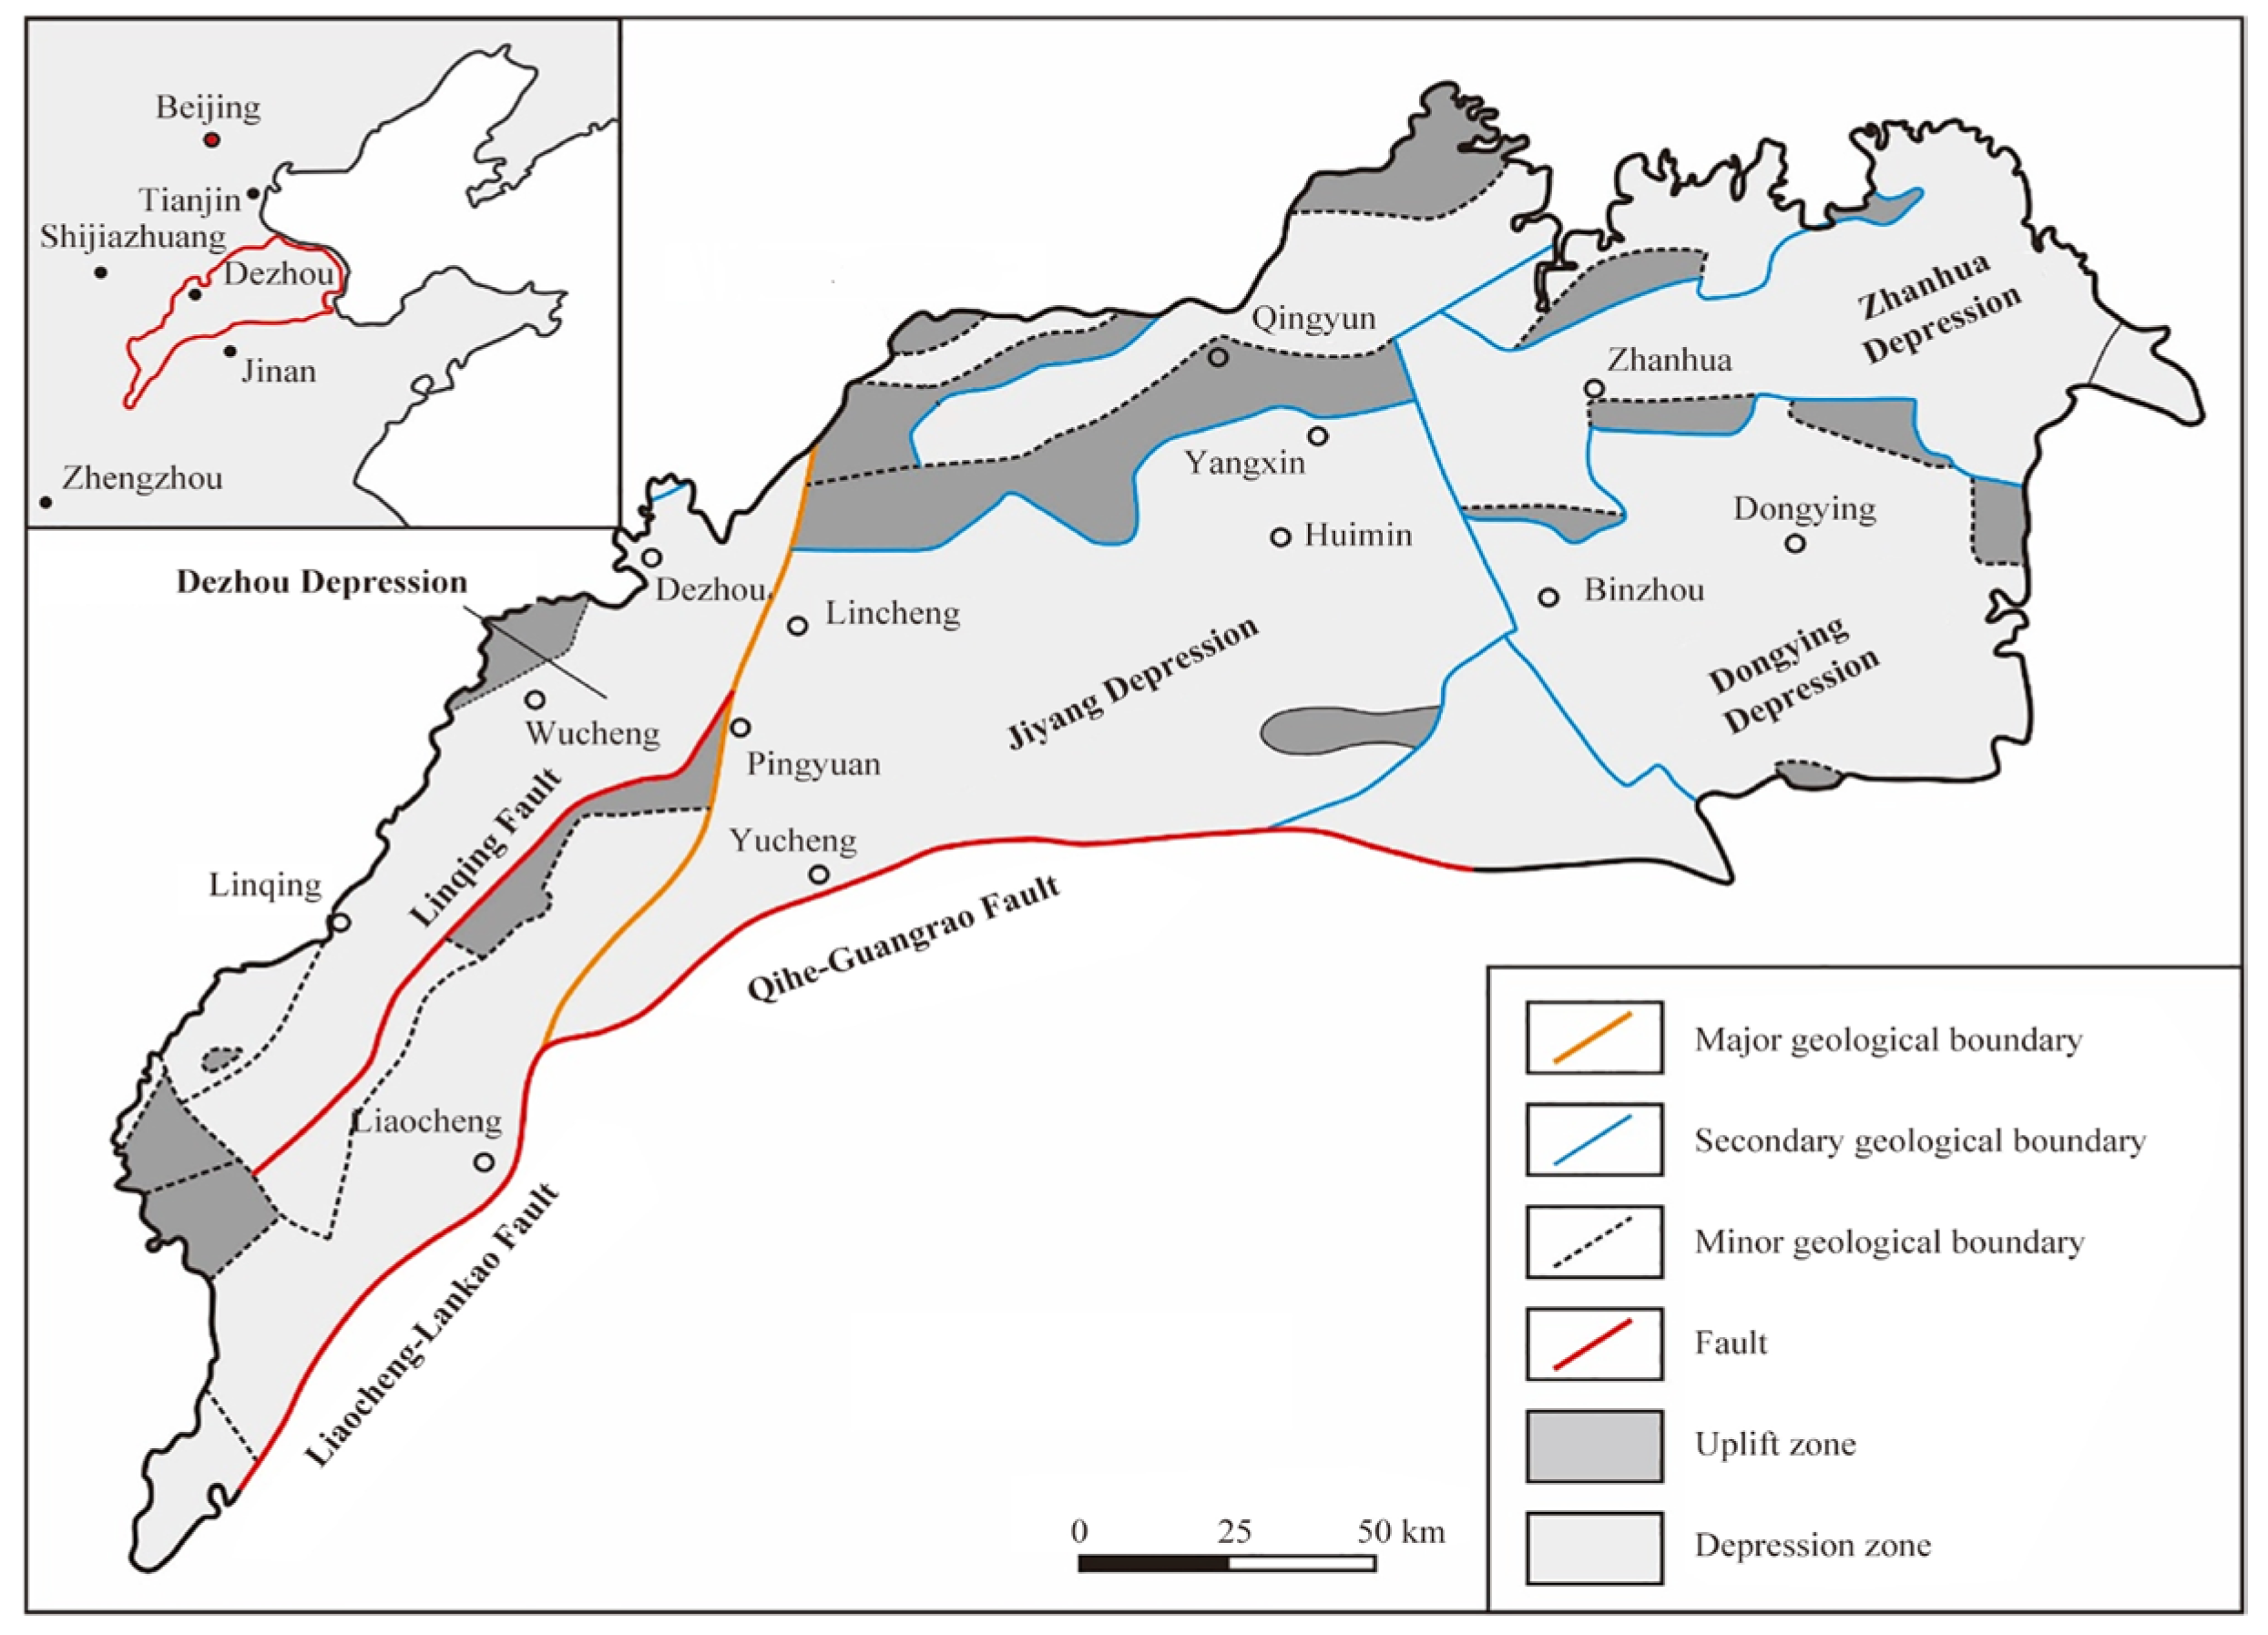
China’s Shandong Province is endowed with substantial geothermal resources, with an estimated annual mining volume of 1.405 × 10
8 m
3. Of this, 1.216 × 10
8 m
3 is utilized for heating, serving a heating area of approximately 4.060 × 10
4 m
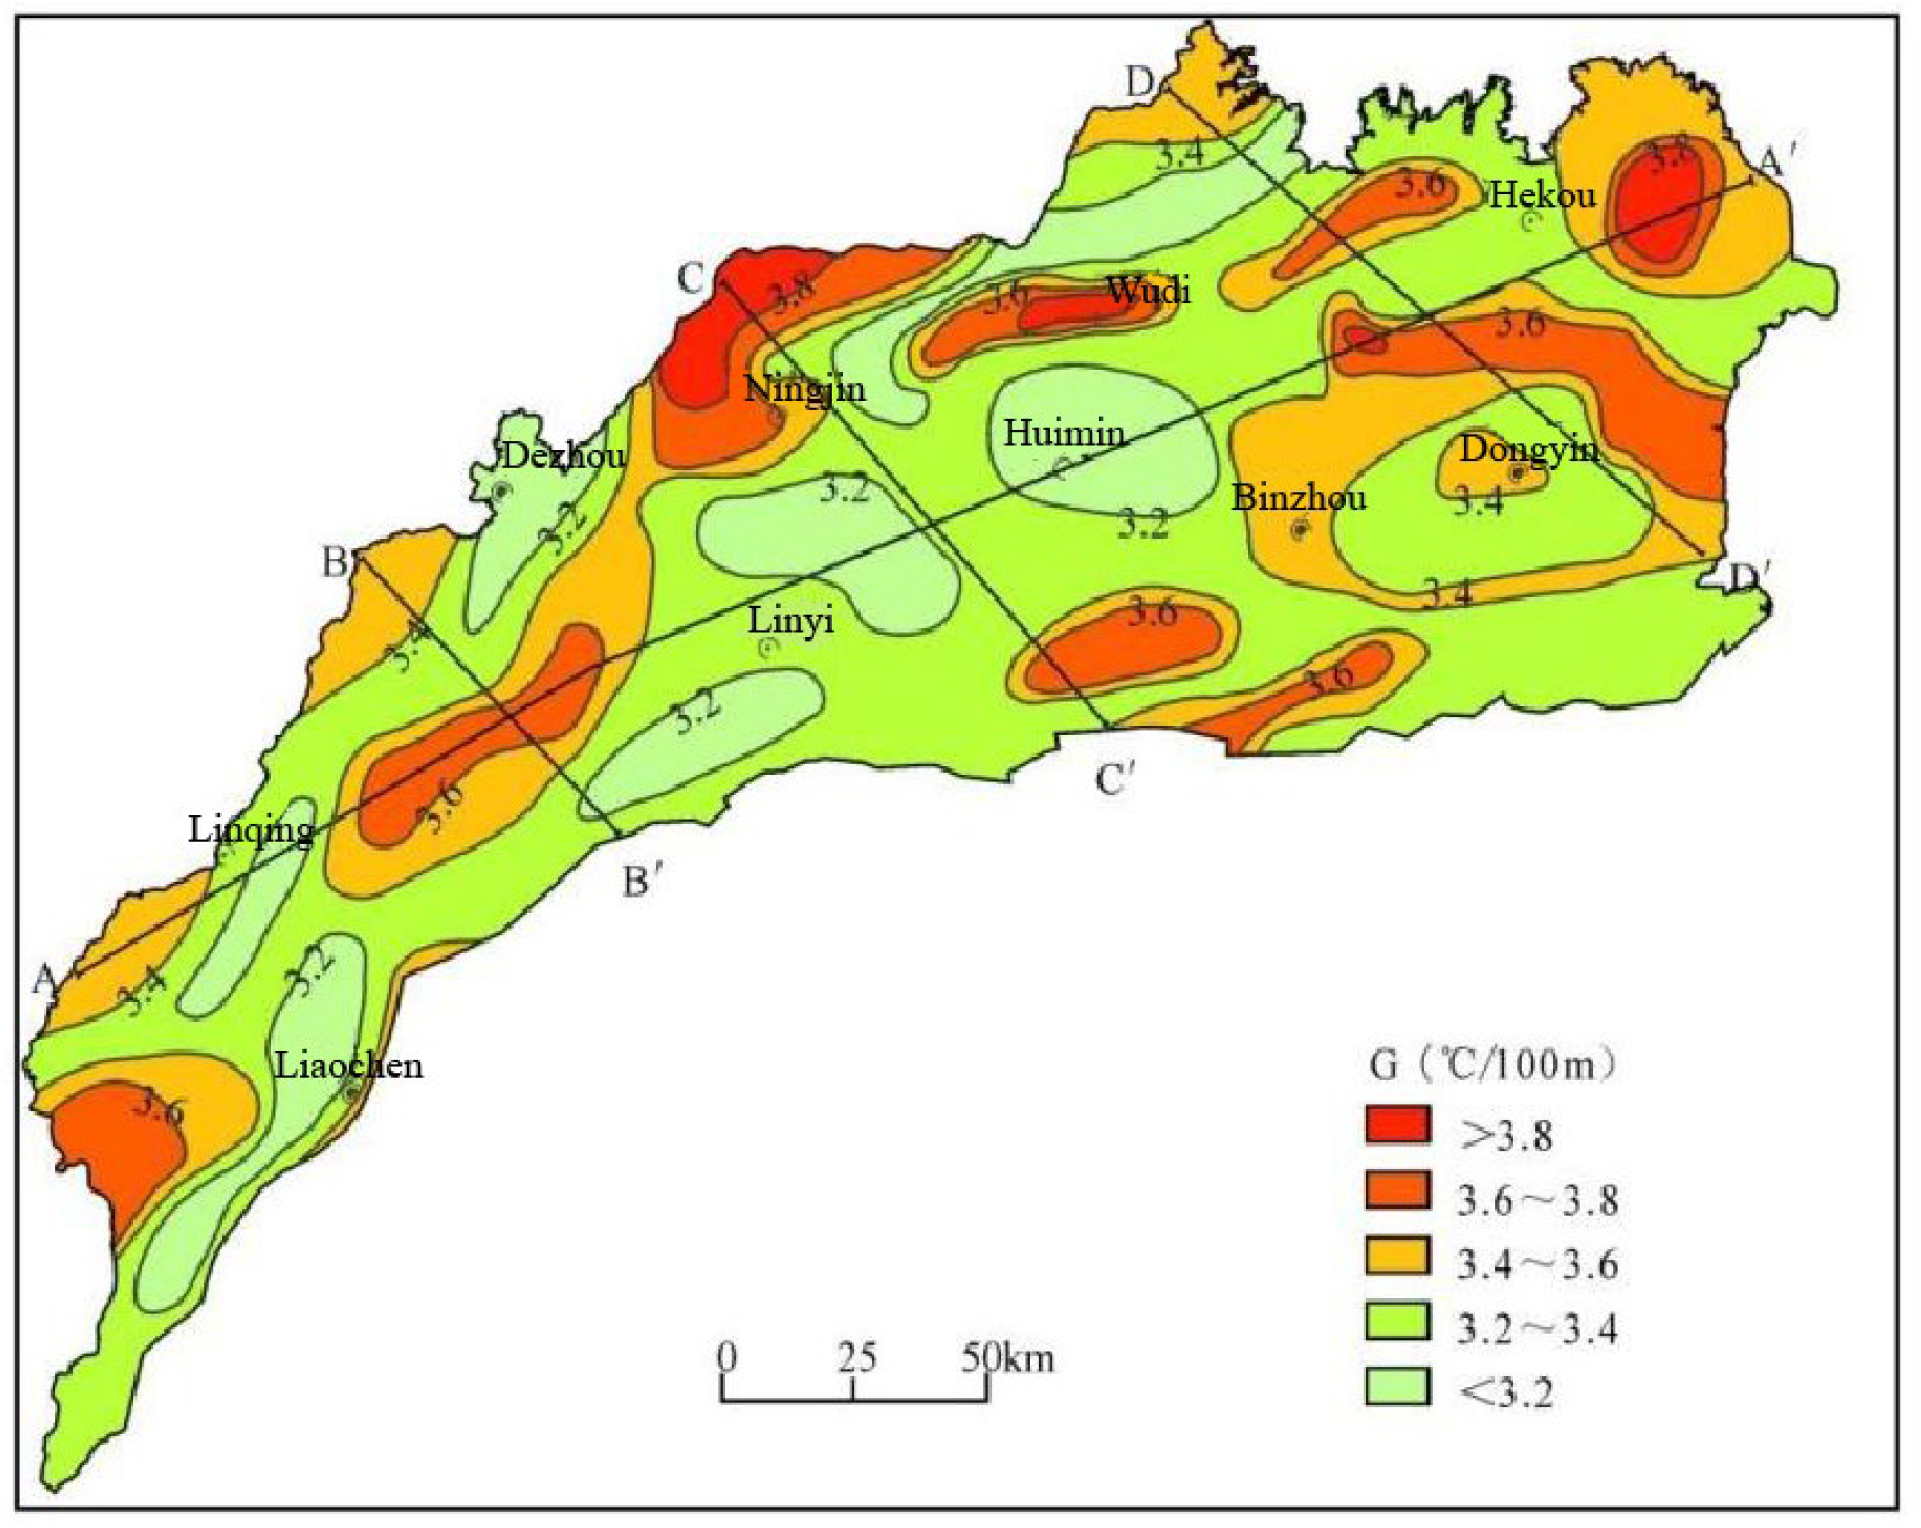
2. The north-west Luhu depression area accounts for approximately 93% of the province’s total geothermal heating area [
11].
In the existing research on geothermal resources in Decheng District, relevant scholars have carried out a series of exploratory work, Ma Hongyuan [
12] used COMSOL software to establish a three-dimensional model of the sandstone thermal storage geothermal group well system, compared the heating potential of traditional and new well networks, and verified the feasibility of the new well network through sensitivity analysis. Xu Tianfu et al. [
13] constructed a three-dimensional water–heat coupling model using TOUGH software, predicting that the outlet water temperature of extraction wells would drop to 48 °C after 50 years of extraction and recharge, and further to 46.6 °C after 100 years. Fan Tao [
14] focused on the impact of recharge cooling on water–rock chemistry equilibrium, and explored the water–rock reaction law under different recharge temperatures.
From the perspective of the latest global and domestic research progress, geothermal reservoir recharge research has become a hotspot, but key technical gaps remain prominent. Research on medium–low-temperature sandstone reservoirs is mostly confined to single-dimensional simulation of temperature fields. Even doublet-well extraction-recharge models based on the Guantao Formation thermal storage only focus on analyzing the impact of extraction-recharge volume and well spacing on thermal breakthrough time, failing to involve the role of chemical processes in reservoir performance [
15]. A field test in the urban area of Shenyang confirmed that Fe
2+ is a key factor causing chemical clogging, and its synergistic effect with Mn
2+ will aggravate clogging. However, this conclusion has not been extended to the medium-temperature environment unique to geothermal reservoirs, nor has it involved the influence law of common ions such as Ca
2+ and Mg
2+ [
16].
In response to the above research gaps, this study adopts an innovative method combining indoor high-temperature and high-pressure static experiments with TOUGHREACT numerical simulation. By verifying model parameters with experimental data, it accurately reveals the mineral dissolution-precipitation mechanism during sandstone reservoir recharge and its impact on porosity and permeability. Identifying key dissolved (K-feldspar, Na-feldspar) and precipitated (illite, dolomite) minerals, quantifying long-term porosity-permeability degradation, and proposing a Ca2+/Mg2+ reduction strategy to mitigate impairment. The findings of this study offer valuable insights and directions for the advancement and optimization of the sandstone geothermal reservoir doublet-well system research.
From the perspective of sustainable development, this research is highly aligned with national and local energy and environmental policies. China’s 14th Five-Year Plan for Renewable Energy Development clearly emphasizes promoting the large-scale development and utilization of geothermal energy and improving resource recycling efficiency. Shandong Province has also issued relevant policies to support the construction of geothermal clean energy exploitation and reinjection engineering technology research centers, aiming to realize the green and low-carbon transformation of the heating industry. The research results can effectively alleviate the problem of reservoir permeability attenuation caused by recharge, extend the service life of geothermal wells, and improve the utilization efficiency of geothermal resources, thereby supporting the achievement of national “dual-carbon” goals and the sustainable development of regional energy and environment. This study not only provides technical support for the optimization of geothermal recharge schemes in Decheng District but also offers a reference for similar sandstone geothermal reservoir development projects at home and abroad.
3. Indoor Experiment
3.1. Purpose
The objective of this study is to analyze the precipitation and dissolution of rock minerals and the subsequent changes in the chemical composition of the water body caused by water–rock interactions occurring in sandstone reservoirs due to geothermal recharge water. Additionally, this study aims to determine the types of minerals undergoing dissolution and precipitation in the thermal reservoirs, and to provide parameters for the subsequent identification and validation of the coupled model.
3.2. Sample Selection
The samples for this study were taken from the sandstone geothermal reservoir of the Guantao Formation in DeCheng District, at a sampling depth of 1311.0–1311.5 m. The XRD scanning results indicate that the reservoir rock is primarily composed of K-feldspar, quartz, and Na-feldspar, with a minor proportion of biotite, illite, and kaolinite. Additionally, the presence of illite/montmorillonite mixed layers has been observed. The specific content of each mineral is presented in
Table 1.
The water samples utilized in this study were obtained from the circulating water of the exemplar demonstration project of the well extraction and irrigation system situated in Decheng District. The primary ion constituents of the water samples are presented in
Table 2 below.
3.3. Experimental Program
(1) The experimental temperature and pressure settings are consistent with the actual conditions of the sandstone thermal reservoir in the study area (temperature 60 °C, pressure 13 MPa), the fixed experimental temperature (60 °C) and pressure (13 MPa) were determined based on the actual conditions of the targeted Guantao Formation reservoir (burial depth: 1311.0–1311.5 m): 60 °C represents the median temperature of this reservoir zone (field monitoring: 58–62 °C), while 13 MPa approximates the hydrostatic pressure at this depth (calculated from formation water density: 1.03 g/cm3). The water–rock ratio in this experiment is set at 10:1, which is in accordance with the prevailing conditions.
(2) The experiment comprised six groups, with each group providing a response time measurement at one of six time points: 0 (initial), 1, 5, 10, 20 and 30 days.
(3) The reaction solution was sent for determination of water quality composition, and the rock powder was tested for XRF metal oxide content. This was done in order to obtain the relative content of each metal oxide in the rock samples, to speculate on the changes in the mineral components before and after the water–rock reaction, and to determine the characteristics of the dissolution and precipitation of the minerals.
3.4. Analysis of Results
3.4.1. Water Sample Analysis
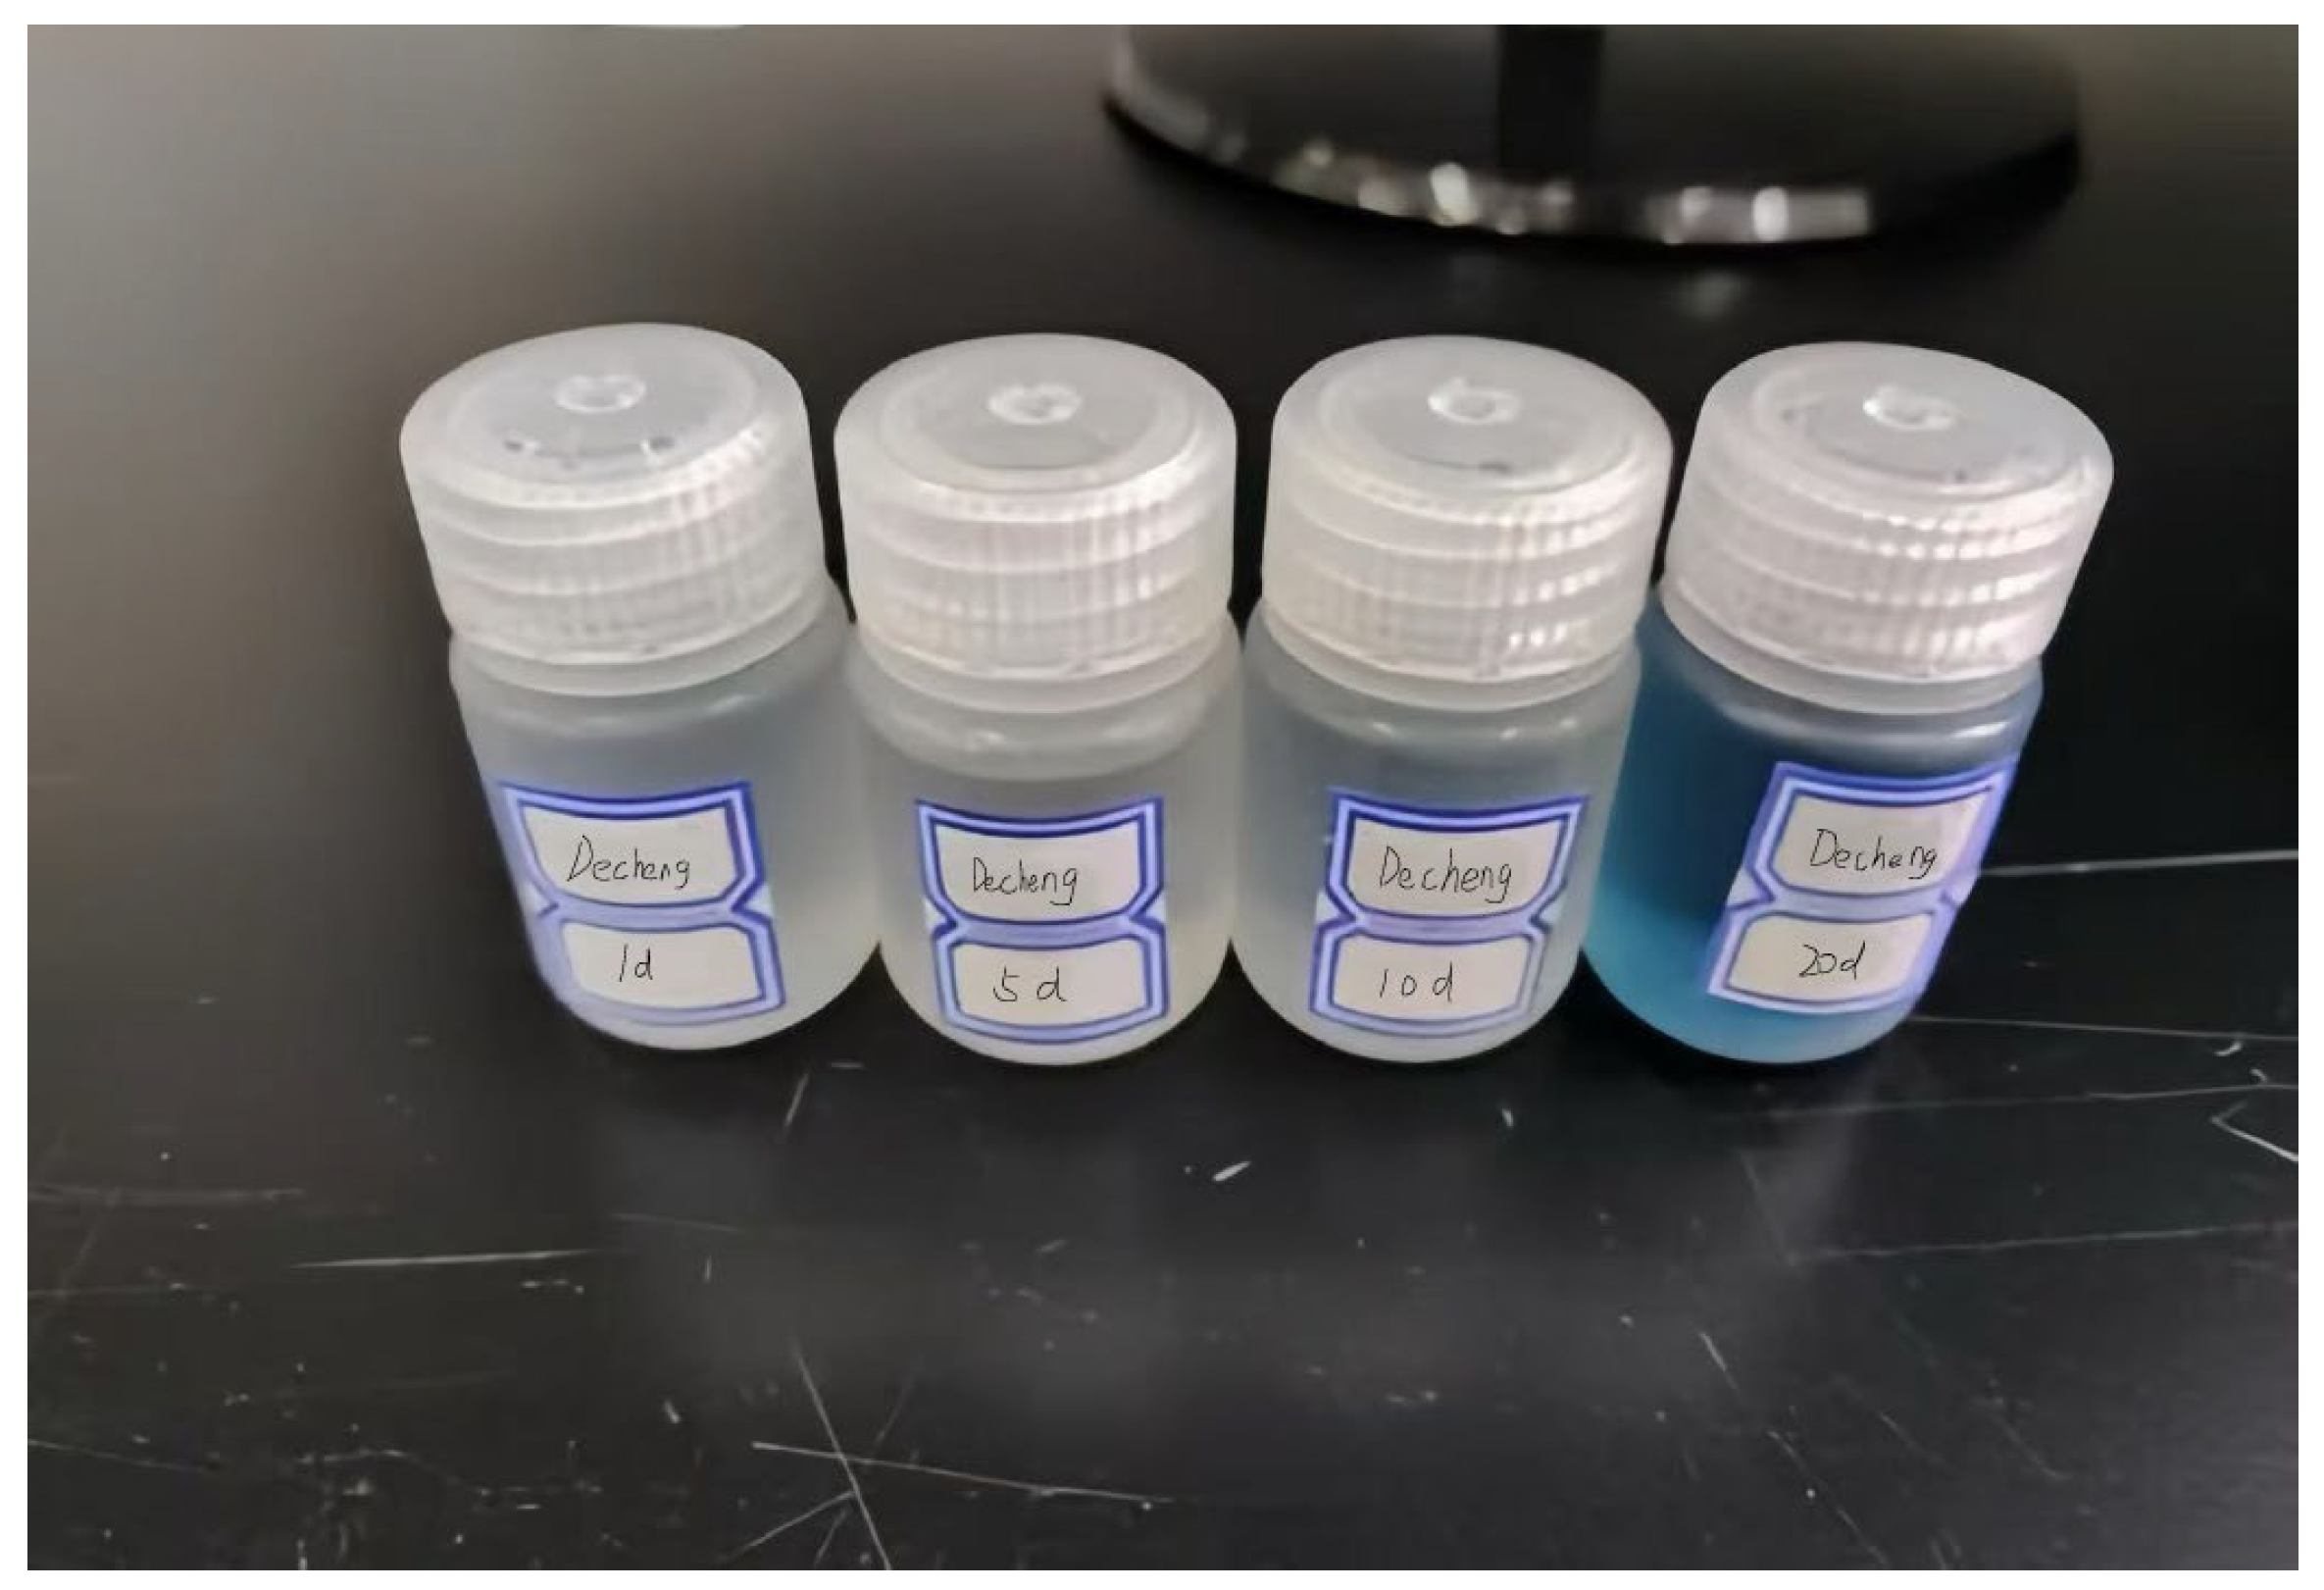
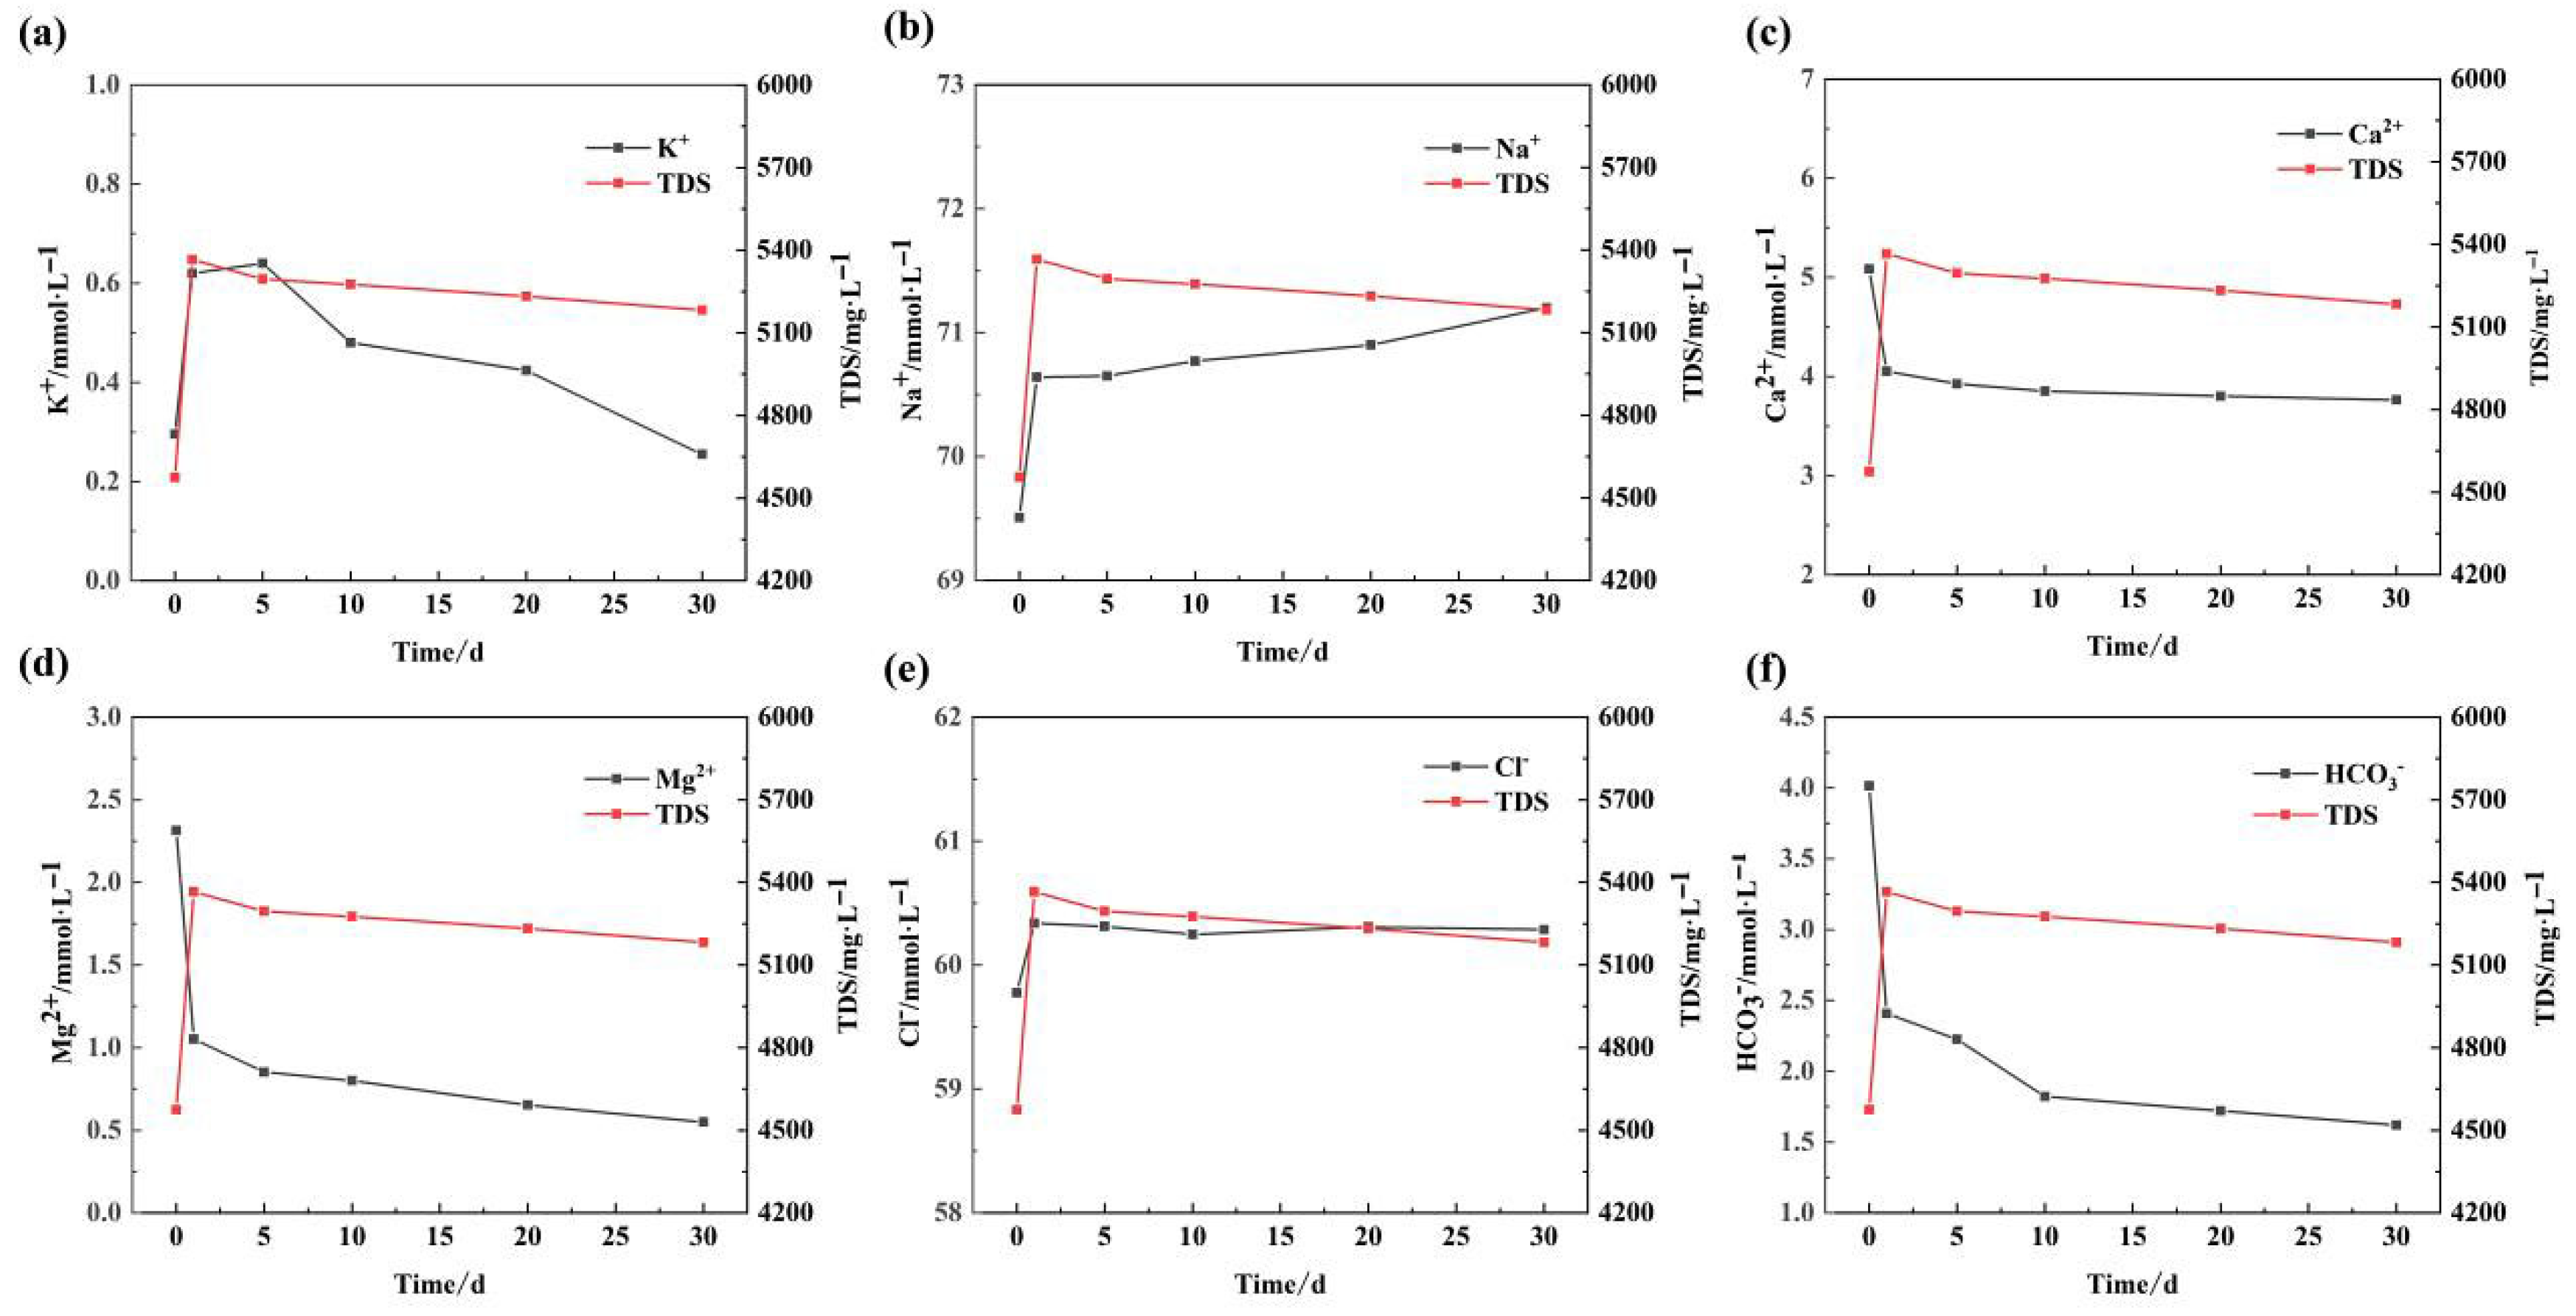
In order to preliminarily analyze the mineral dissolution and precipitation caused by water–rock interaction under high temperature and high pressure conditions during the flow of water in the sandstone reservoir, and to provide a basis for the establishment of the model, hydro chemical analyses were carried out on a number of water samples collected at the conclusion of the experiments (
Figure 3), and the results are presented in
Table 3 and
Figure 4.
(1) The change rule of main cations: The change trend of K+ content is approximately linear with the continuation of the water–rock reaction experiment time, initially rising and then falling. At the outset of the reaction, the K+ content exhibited a gradual increase, while with the continuation of the reaction, potassium-containing secondary minerals (montmorillonite, Illite, etc.). As the reaction continues, the precipitation of secondary minerals gradually assumes the dominant role in the dissolution of soluble components, which is now occurring at a rate that is less than the rate of precipitation. Consequently, after approximately five to ten days, the K+ content begins to decline. The reaction proceeds for a period of approximately five to ten days, during which time the concentration of potassium ions begins to decline. The trend of Na+ content demonstrates a contrasting pattern to that of K+, with an overall increase occurring at both a rapid and a gradual pace.
Ca2+ and Mg2+ content in the water as a whole showed a continuous decreasing trend, the rate of change is roughly the reaction of the initial rate is faster, but with the continuation of time, the water–rock components gradually reach equilibrium, the rate is gradually slowed down. As can be judged from the changes in Ca2+ and Mg2+ content, dolomite (CaMg(CO3)2) should be the main secondary mineral produced by the water–rock reaction.
(2) The main anion change law: The ionic components of the water samples at different time nodes after the water–rock reaction experiment were sorted out and the law of the change in the content of the two main anions, Cl− and HCO3−, with time was analyzed.
In the early stage of the water–rock reaction, the Cl− content appeared to rise, because Cl− almost does not produce secondary precipitation with other major metal cations, so it can basically be judged that when the water–rock reaction is carried out to 5 d, the soluble component is basically completely dissolved or basically saturated, and the trend of the change in the Cl− content is a rapid rise in the early stage, and then gradually stabilized in the later stage.
The HCO3− content first decreased rapidly and then slowed down. As the reaction proceeded, the acid-base equilibrium in the water was basically realized, while the generation of secondary dolomite accelerated the decrease in HCO3− content, but the decrease in HCO3− began to slow down after the 10th d due to the large decrease in the content of Ca2+, Mg2+ and so on.
3.4.2. Sandstone Sample Analysis
The objective of this study is to detect the metal oxide content (XRF) of sandstone samples following the initial samples and aqueous rock reaction experiments. This is achieved by determining the proportion of different metal oxides in the rock powder samples, which allows the trend of changes in metal oxides to be analyzed. This, in turn, enables the trend of changes in metal elements in the rock sample to be evaluated. The qualitative inference was made regarding the type of secondary mineral precipitate generated.
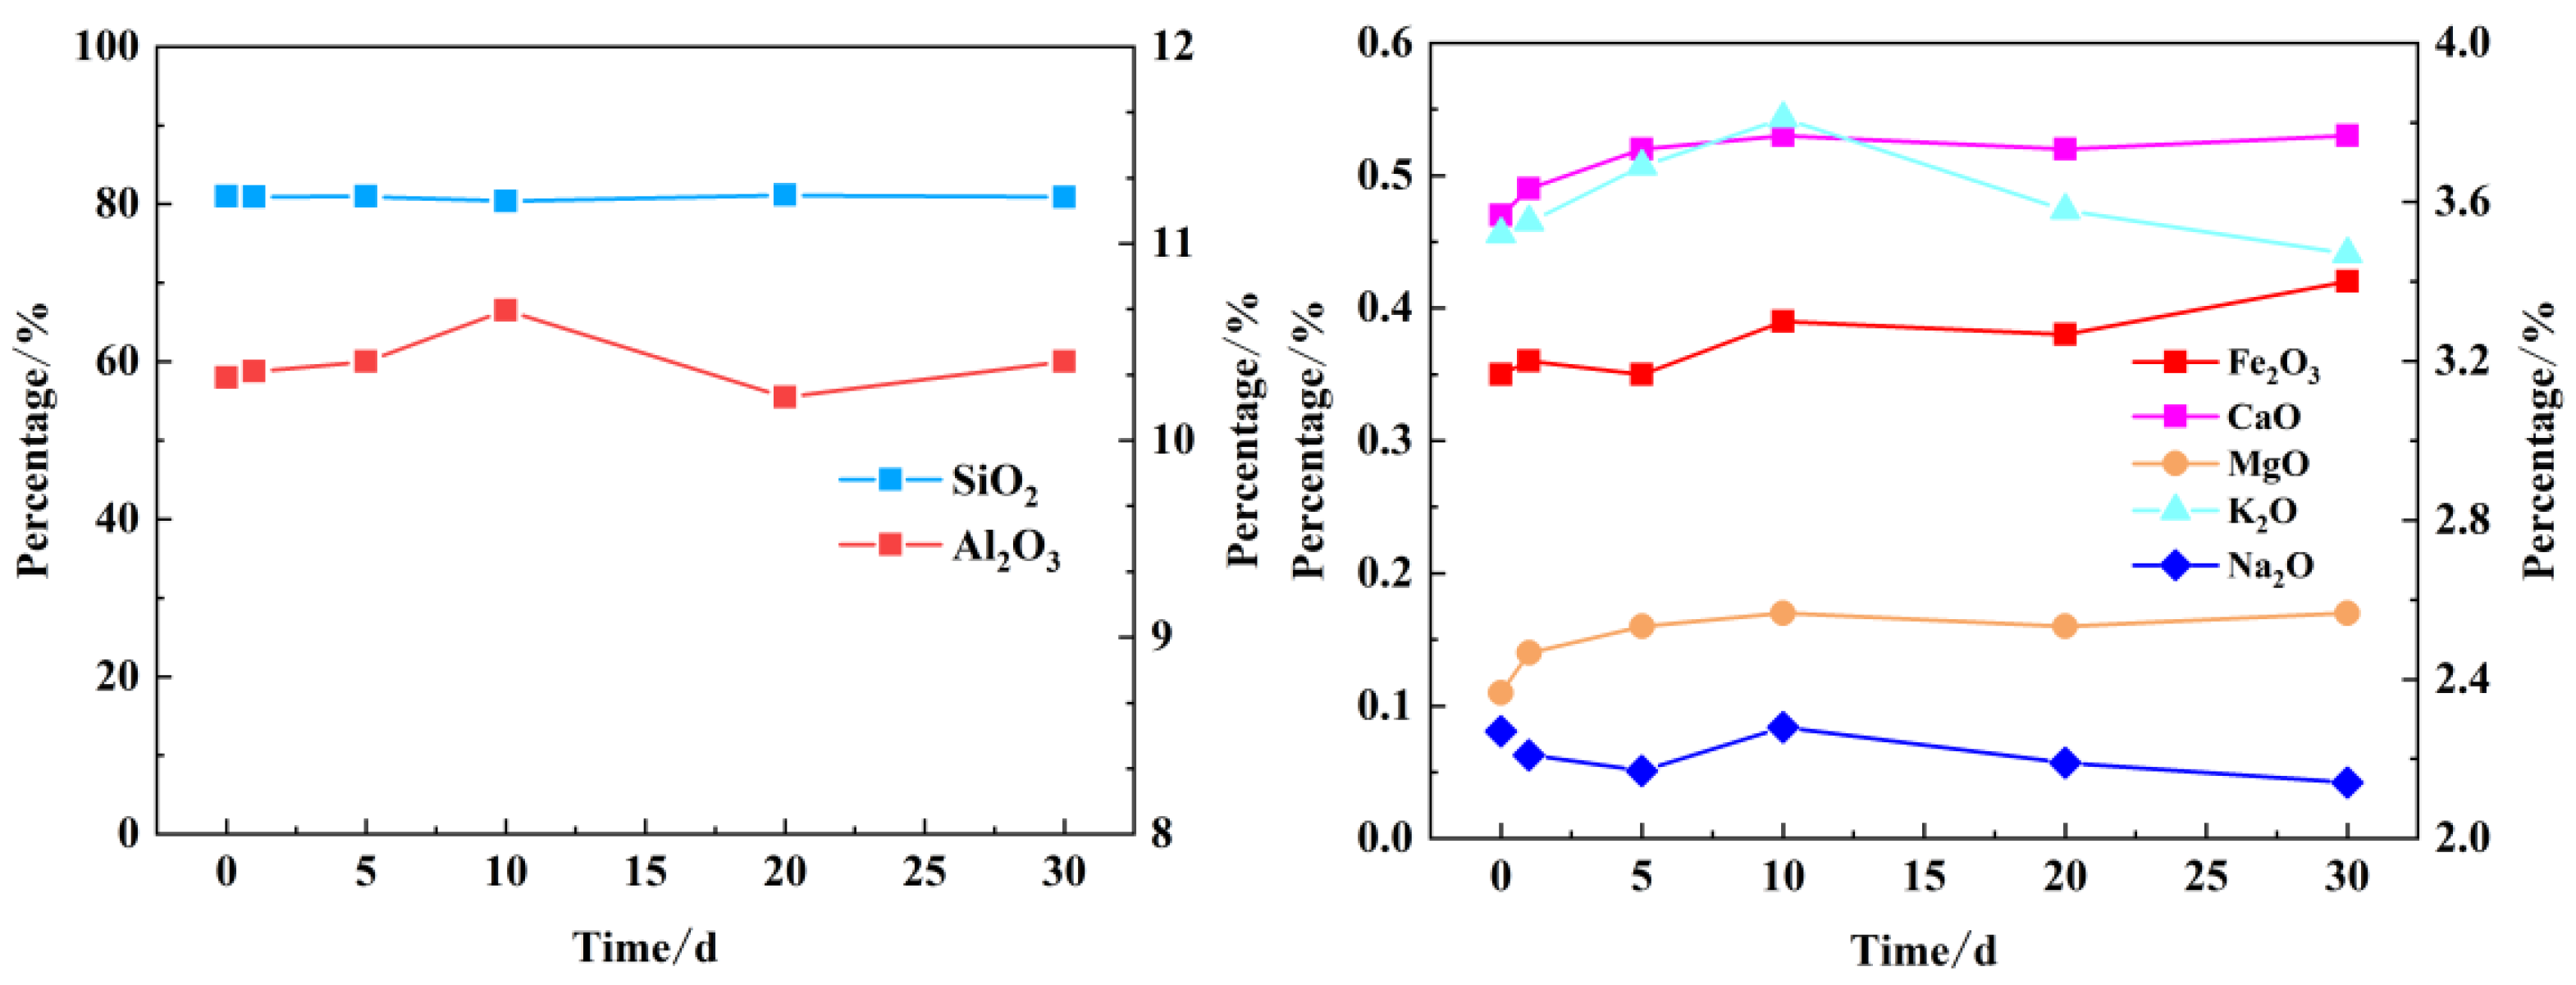
Table 4 illustrates the ratio of each metal oxide present in the samples at specified time points.
Overall, the change in proportion of each component is relatively minor, as evidenced by the time scale. The precipitation of minerals is relatively weak, and the formation of secondary minerals is not prevalent. The primary components of illite and dolomite are Al
2O
3, CaO, MgO and K
2O. The trend of change in the content of Al
2O
3 and K
2O is illustrated in
Figure 5, which depicts an initial increase followed by a decline. Meanwhile, the trend change of SiO
2 is similar to that of Al
2O
3 and K
2O, so the content of SiO
2 changes relatively little in the simulation results, which is also related to its own stable chemical properties. The principal upward trend in CaO is attributable to the adsorption of Ca
2+ from the injected water into the rock, which subsequently gives rise to the formation of CaO metal oxides. Concurrently, the presence of MgO in the rock itself renders the formation of dolomite more probable when sufficient quantities of CaO are supplied. This evidence suggests that dolomite may be the primary secondary mineral. The decline in the concentration of calcium, magnesium, and bicarbonate ions in the recharge water lends support to this hypothesis. The percentage of Na
2O content is essentially in a declining trend, which suggests that the dissolved amount of sodium feldspar in the mineral should be greater.
4. Numerical Simulation
In light of the findings from the indoor experiments investigating the water–rock reaction, a numerical model was constructed to align with the experimental parameters, thus enabling a comprehensive numerical simulation study of the water–rock reaction. The individual dissolved/precipitated mineral fractions were subjected to further analysis, with the corresponding lithological parameters corrected on the basis of the reaction kinetic parameters. The individual dissolved/precipitated mineral fractions were subjected to further analysis, with the corresponding lithological parameters corrected on the basis of the reaction kinetic parameters. A recharge site model was developed based on corrected parameters to simulate changes in reservoir porosity and permeability under long-term heating scenarios.
4.1. Simulation Program
The TOUGHREACT was selected for this simulation because it specializes in modeling hydro–thermo–chemical (HTC) coupling processes in porous media—including multiphase flow, reactive solute transport, and mineral dissolution/precipitation—and can explicitly integrate the effects of pressure, temperature, and ion concentration on geochemical reactions, which aligns with our goal of analyzing water–rock interaction impacts on sandstone reservoir properties.
4.2. Simulation of Water–Rock Reactions
4.2.1. Conceptual Model and Boundary Conditions
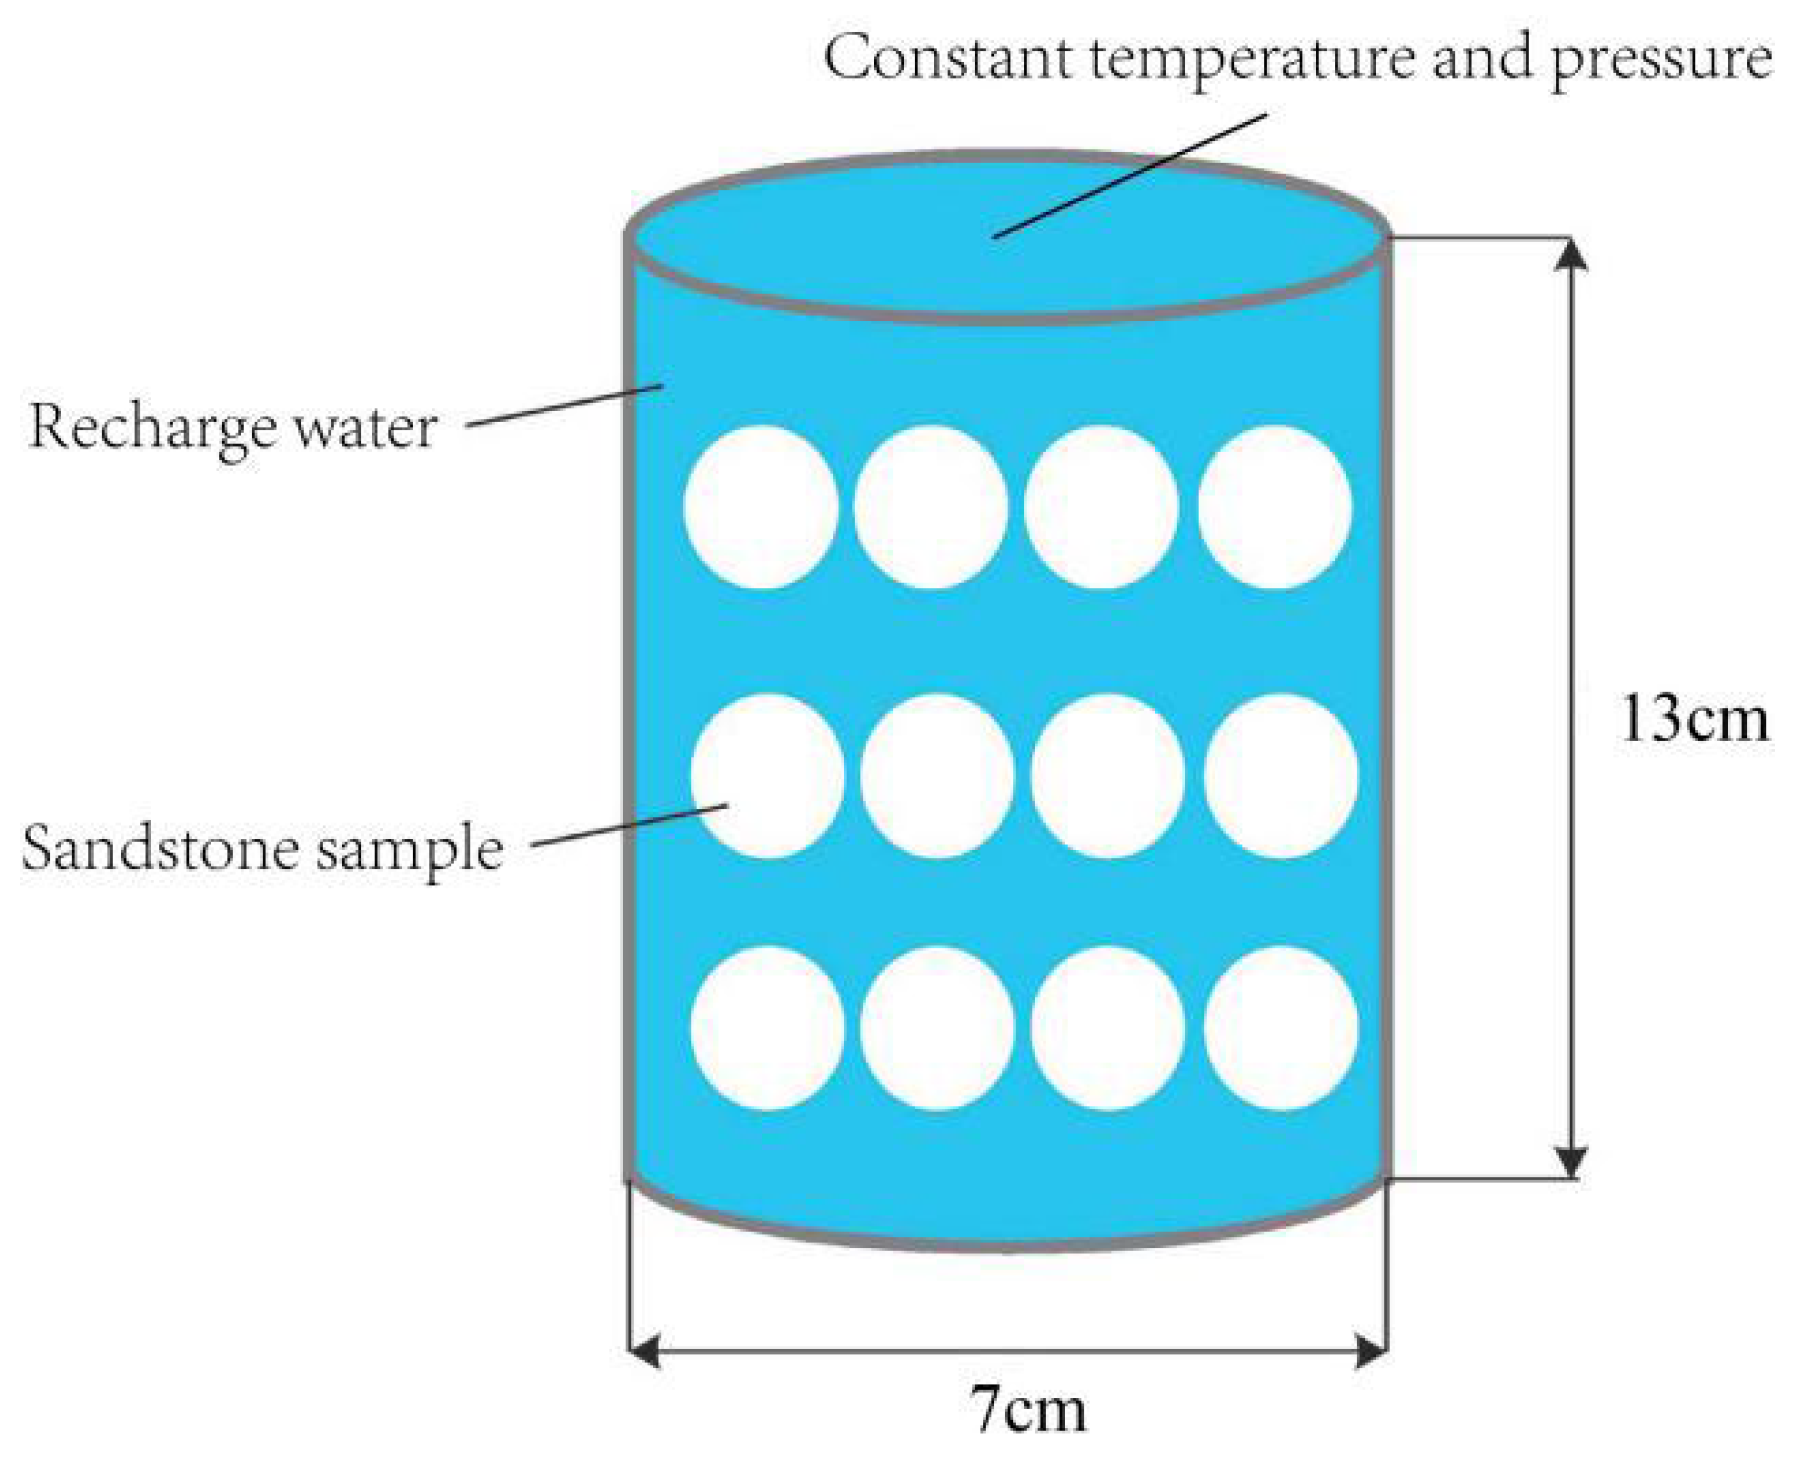
In this simulation, a single mesh simulation is selected, with the mesh size referenced to the indoor high-temperature and high-pressure reactor, with a diameter of 7.0 cm and a height of 13.0 cm (see
Figure 6). The timescale is consistent with that of the indoor experiments, and the chemical components of the injected water and rock minerals of the model are set according to the pre-reaction components of the indoor experiments. Furthermore, the model is defined as an impermeable boundary with a constant temperature and pressure, which allows for a more accurate representation of the confined state within the reactor.
4.2.2. Model Validation and Parameter Setting
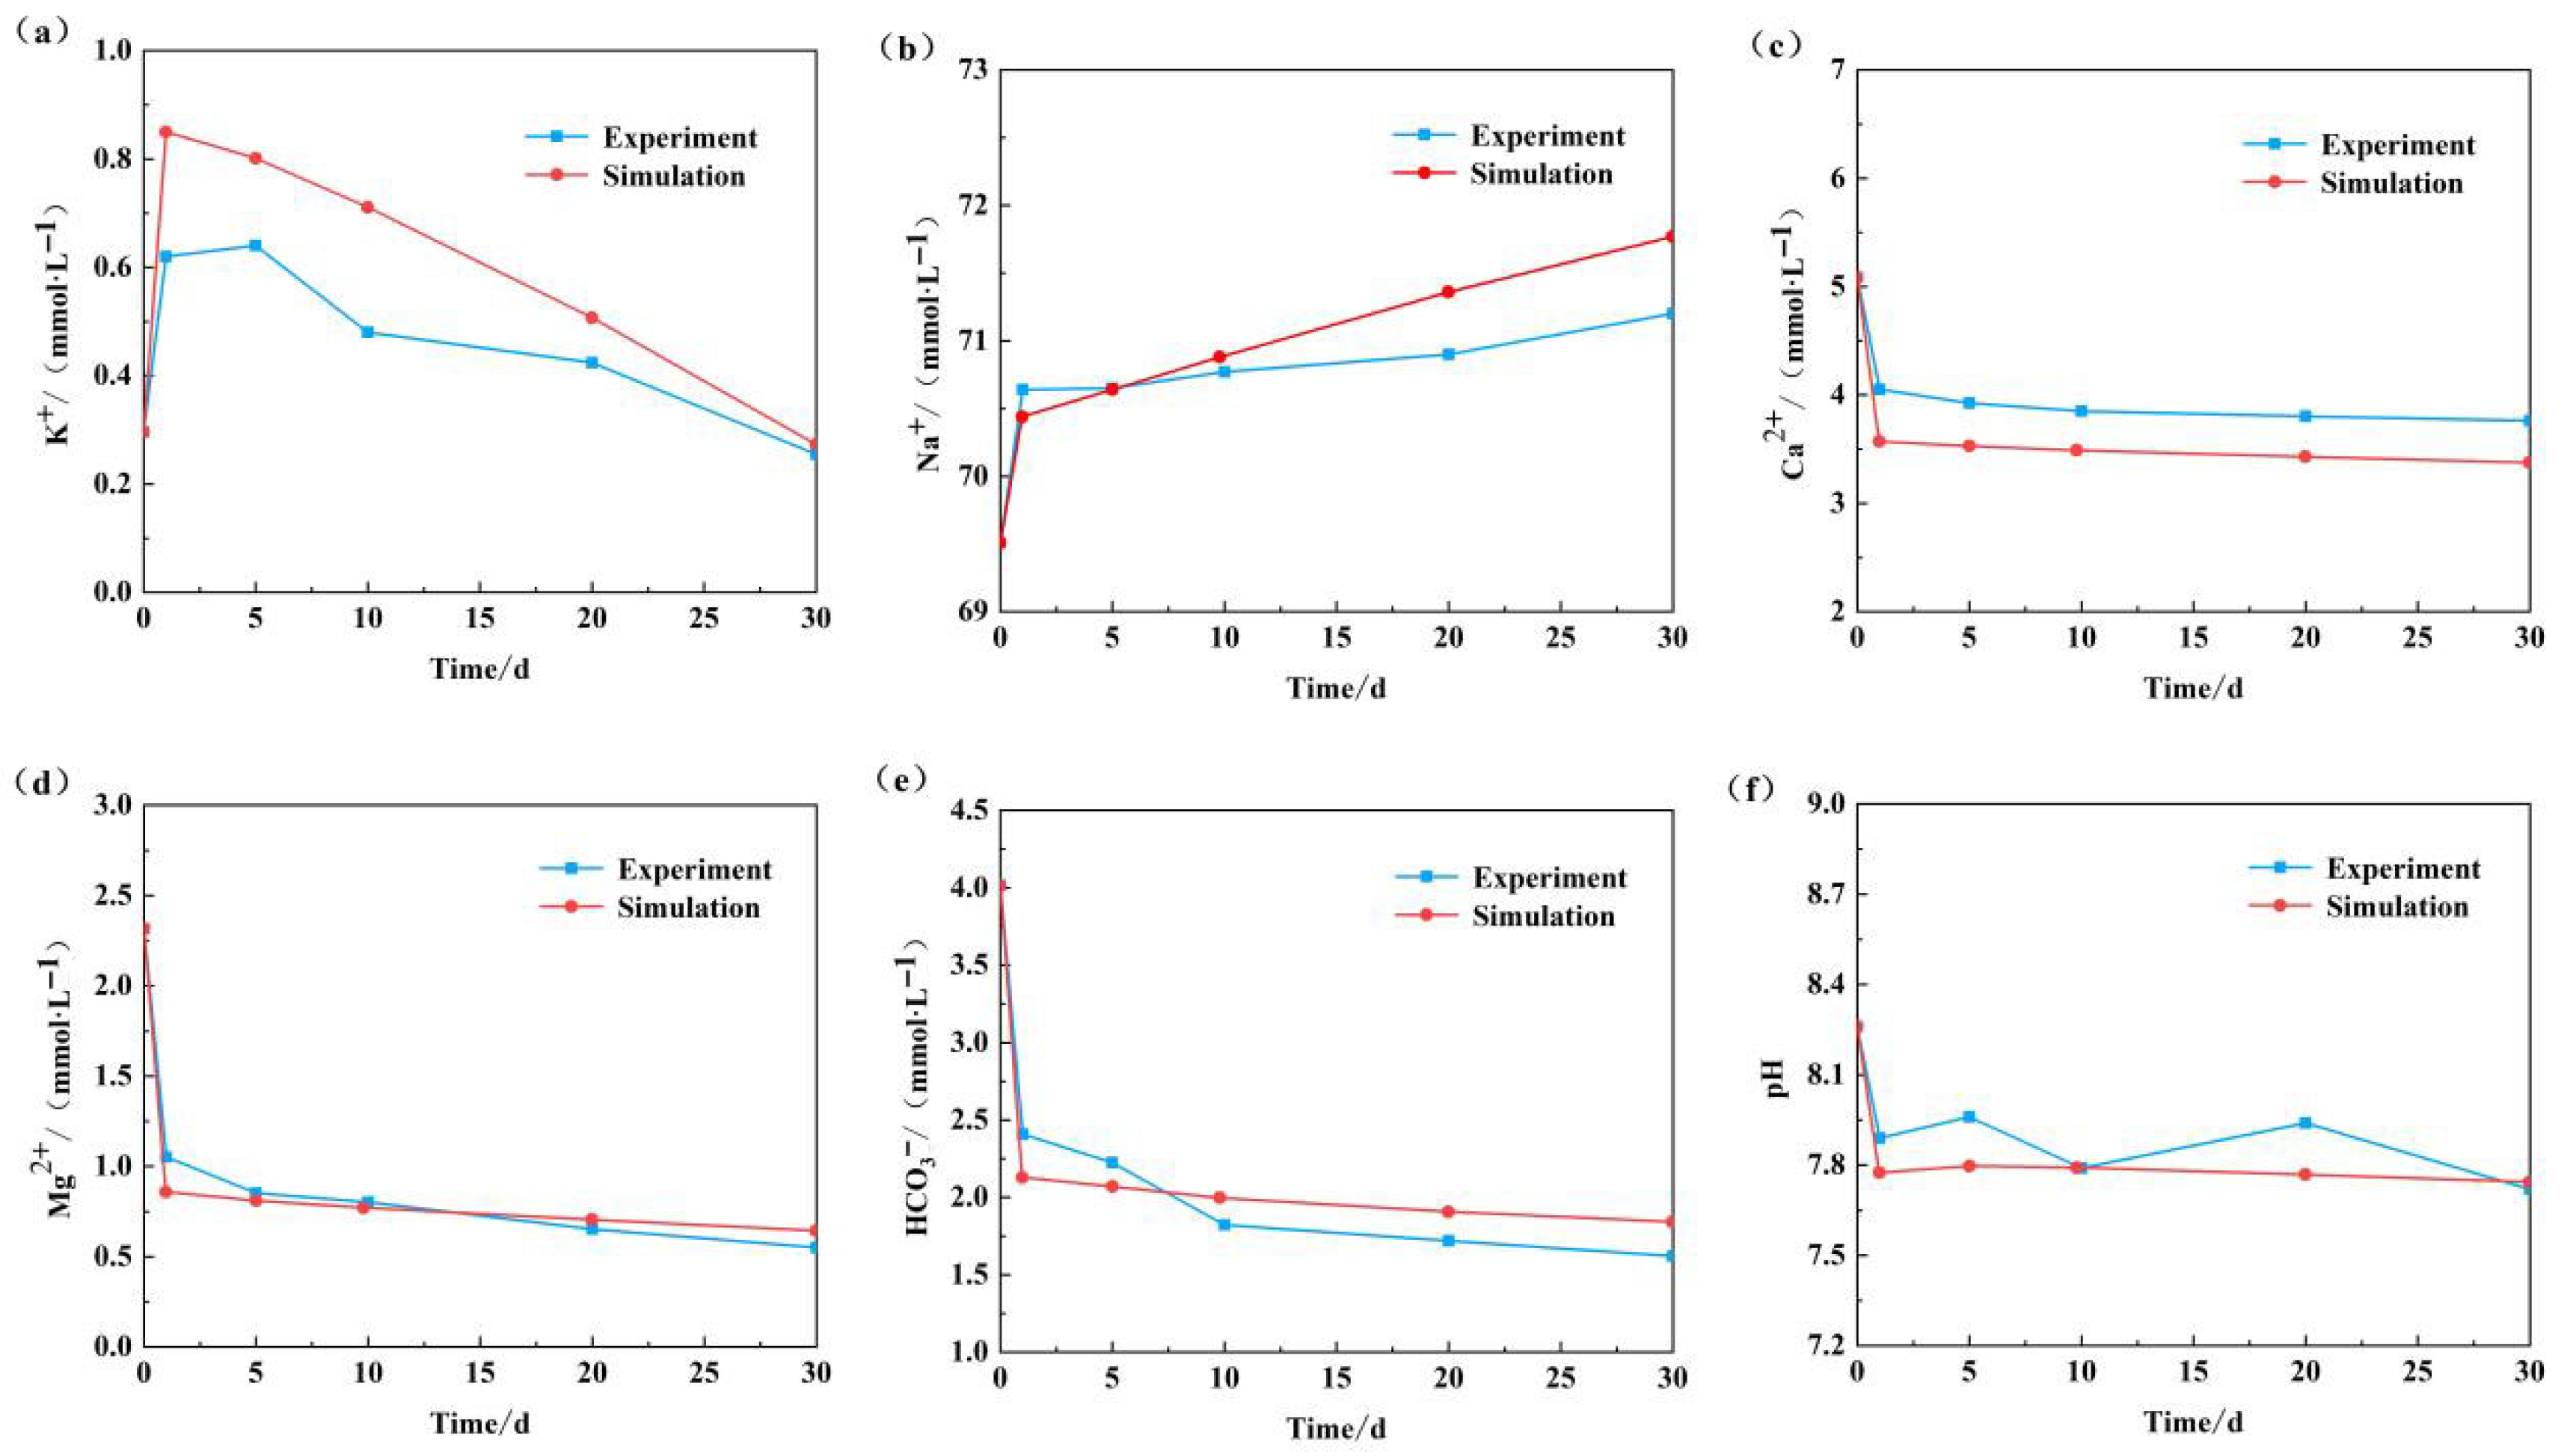
The aforementioned conceptual model was employed to simulate the water–rock reaction process in the high-temperature and high-pressure reactor under identical temperature, pressure, and reaction time conditions. Following the application of several parameter corrections, the simulated major ion concentrations and pH values were aligned with the experimental results. The outcomes of this alignment are illustrated in
Figure 7 below.
Following a 30-day simulation period, the K+ concentration exhibited a pattern of initial increase, followed by a decline. In contrast, the Na+ concentration continued to rise, with a relatively stable rate of increase. The changes in the concentrations of Ca2+, Mg2+, and HCO3− were characterized by a continuous decrease. The overall change trend is, in general, accordance with the experimental results, which demonstrate that the fitting effect is satisfactory and provide further confirmation of the reliability of the experimental results and simulation parameters.
The alterations in the volume of major primary minerals that are dissolved and secondary minerals that are precipitated after 30 days of simulation are illustrated in
Table 5 and
Table 6 below. The results of the simulation demonstrate that the primary dissolved minerals are potassium feldspar and sodium feldspar, while the secondary precipitates generated are illite, dolomite and montmorillonite. The volume change in mineral dissolution is approximately equivalent to the volume increase in precipitation, with volume changes on the order of ten thousandths of a degree. This demonstrates that porosity alterations are markedly insignificant at this time scale and simulation intensity.
The decrease in K
+ concentration in the recharge water corresponds exactly to the production of illite and montmorillonite, while the dissolution of potassium feldspar provides sufficient K
+. The dissolution of sodic feldspar is also responsible for the observed rise in Na
+ concentration. This is supported by the evidence that the precipitation of Na-montmorillonite is less than the dissolution of Na-feldspar. The substantial reduction in the concentration of calcium, magnesium, and bicarbonate ions in the water is also the reason why dolomite is the primary precipitating mineral. In conclusion, the potential chemical reactions that can be deduced from the experimental and simulation data are presented in
Table 7 below.
4.2.3. Parameter Determination
The principal parameters employed in the model can be classified into two categories: lithological parameters and reaction dynamics parameters. The former are established on the basis of data obtained from on-site research and investigation, in addition to related numerical simulation work, as illustrated in
Table 8. The dynamic water–rock reaction between the mineral and the injected fluid is controlled by the kinetic parameters of the mineral reaction. In this simulation, three reaction conditions are fully considered: acidic, neutral and alkaline. The reaction kinetic parameters of each mineral under different reaction mechanisms are presented in
Table 9.
4.3. Coupled Hydro–Thermo–Chemistry Simulation
4.3.1. Conceptual Model and Boundary Conditions
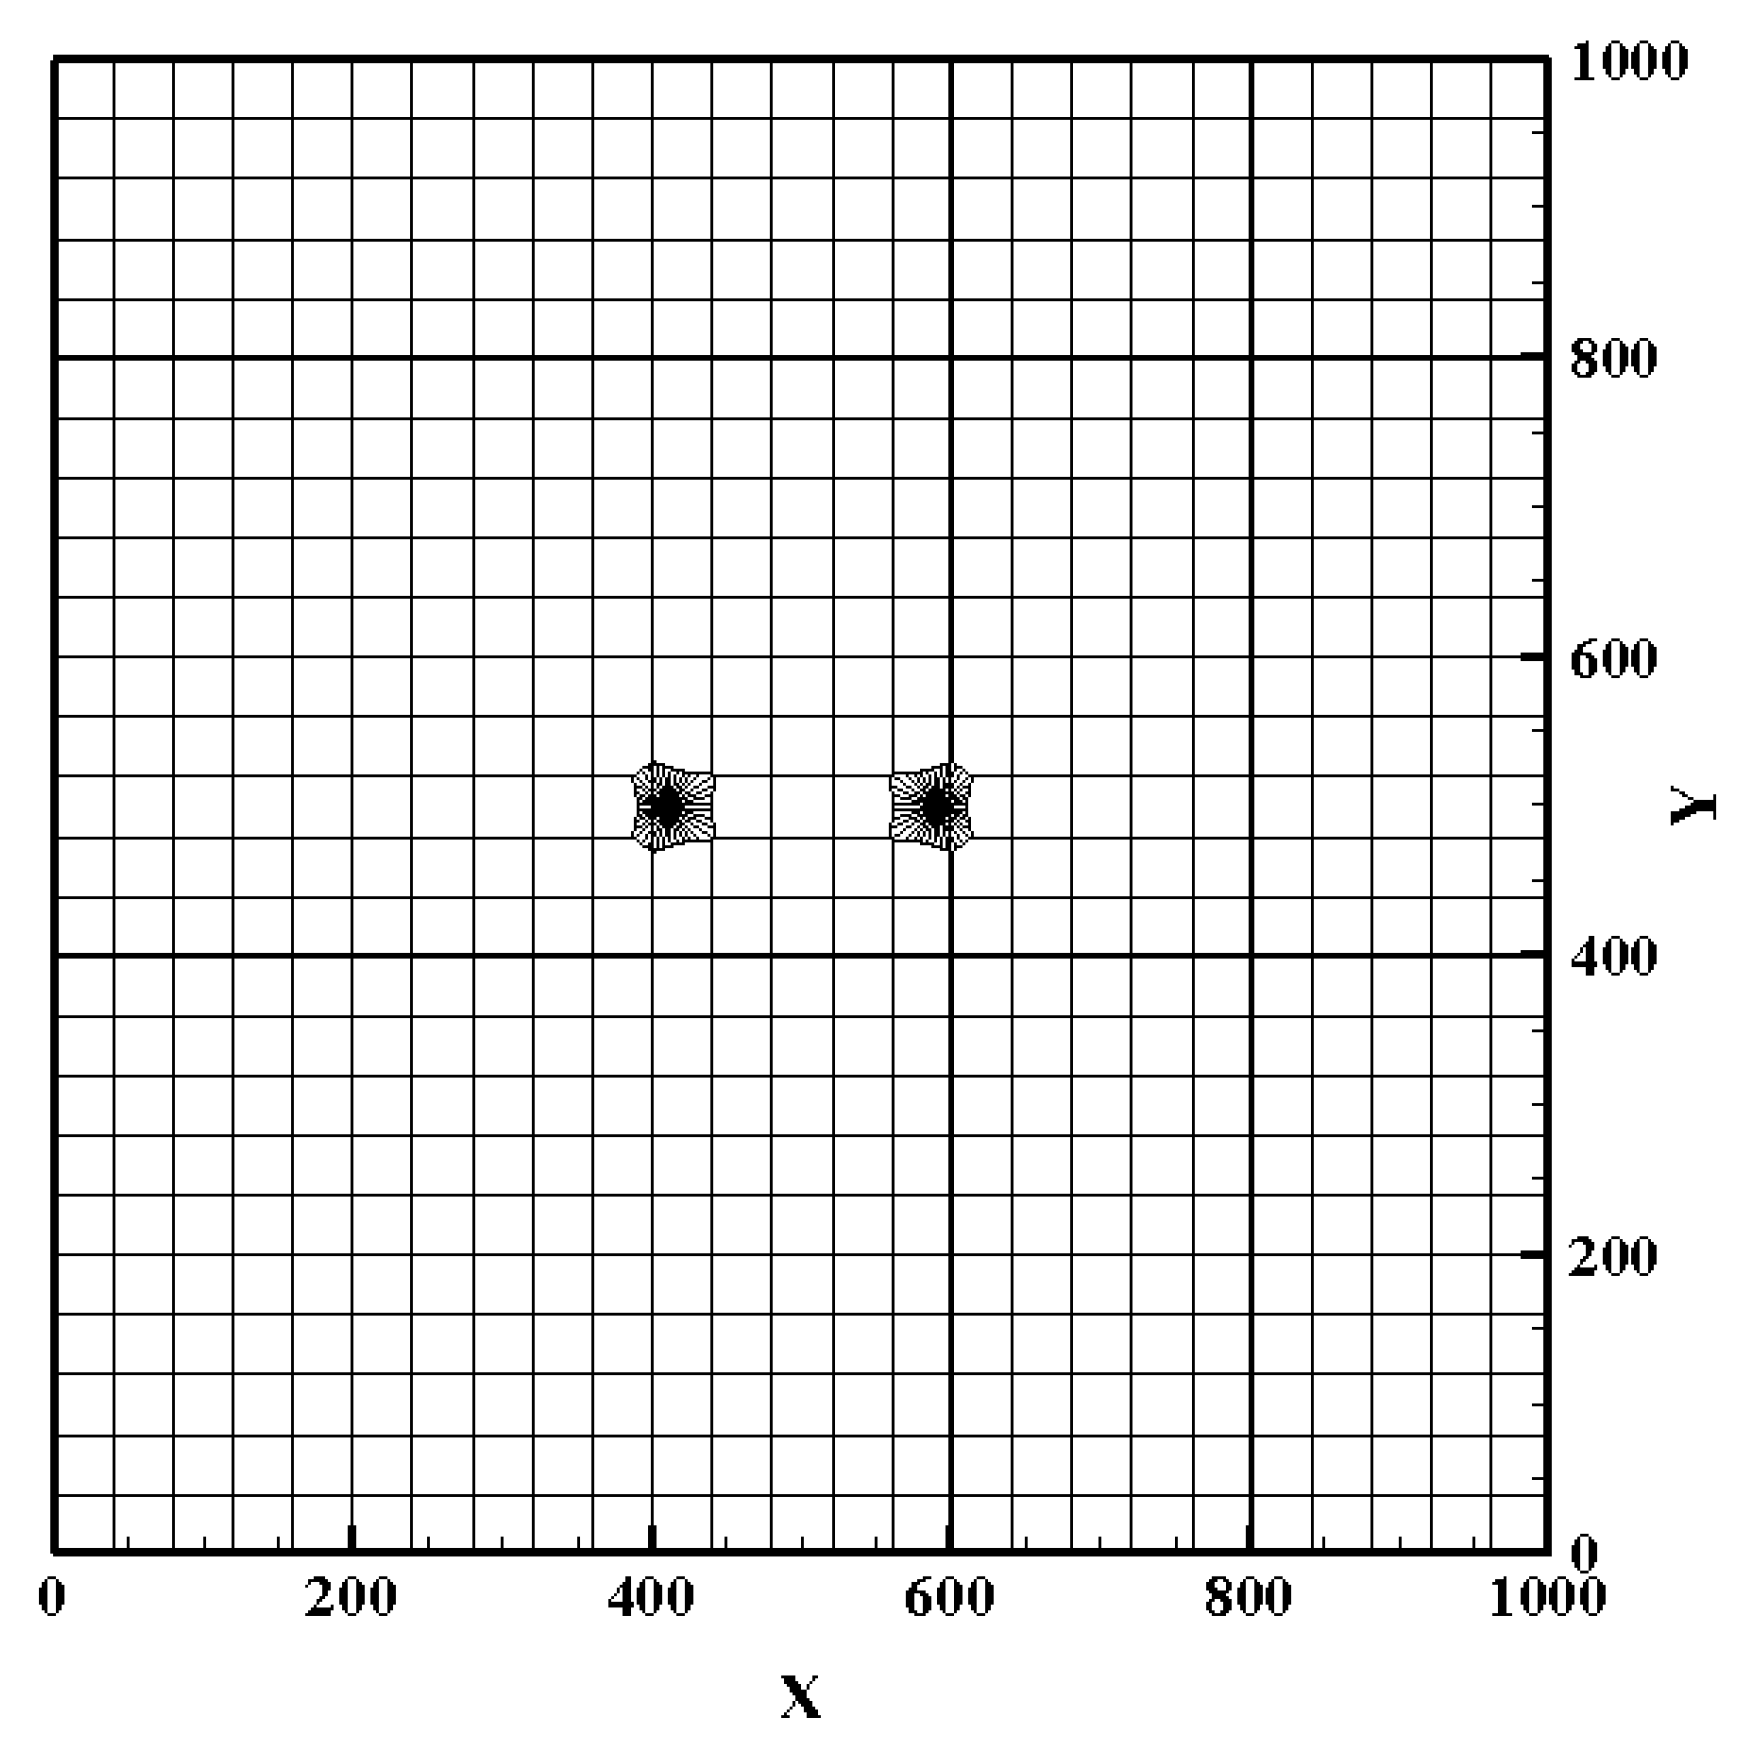
The conceptual model for the hydro–thermal–chemical simulation of the doublet-well system in DeCheng District is primarily based on the actual conditions observed at the site. The simulation of reactive solute transport involves the migration of water chemical components, dynamic hydrogeochemical reactions between polyminerals and fluids, and dissolution and precipitation processes. Furthermore, the calculation of the effects of these processes on the porosity, permeability and other parameters is based on this information. As a result, the number of calculations required is significant. Therefore, this simulation and subsequent result analysis of a layer of representative shot hole section situated at a depth of 1420 m (i.e., the Z-axis plane where the shot hole section constructed by the XY-axis is located) within the context of the well extraction and irrigation system is presented in
Figure 8. The spatial discretization of the simulation model was performed using the IGMESH V1.0 grid dissection method. This was done on the assumption that the influence of the injected fluid on the reservoir gradually decreases with the increase in the distance from the recharge wells and that the grid size is gradually increased from the extraction wells to the surroundings. The model exhibited a thickness of 10 m in the Z direction and 1000 m in the XY direction, with the grid in the vicinity of the extraction and irrigation wells encrypted.
The model is circumscribed by a watertight boundary with a constant temperature and pressure, while the extraction and irrigation wells are configured as a Dirichlet boundary with a flow rate that can fluctuate over time. The model temperature and pressure conditions were set to 54 °C and 14 MPa, respectively, and the lithological and reaction kinetic parameters were set in accordance with the specifications outlined in
Table 8 and
Table 9.
4.3.2. Simulation Scheme
The recharge flow rate for this simulation scenario was set to 3.6 m3/h, and the injection temperature was maintained at 35 °C. The simulation was conducted over a period of 50 heating cycles, with each cycle comprising 120 days (from 15 November to 15 March). During the non-heating phase, recharge was halted.
Heating period: 120 days/period (15 November–15 March of the next year), with continuous recharge (3.6 m3/h).
Non-heating period: 245 days/period (16 March–14 November), no recharge.
Total simulated years: 50 years for both the original and optimized scenarios (50 heating cycles + 50 non-heating cycles). The specific simulation scheme is shown in
Table 10.
4.3.3. Simulation Results and Analyses
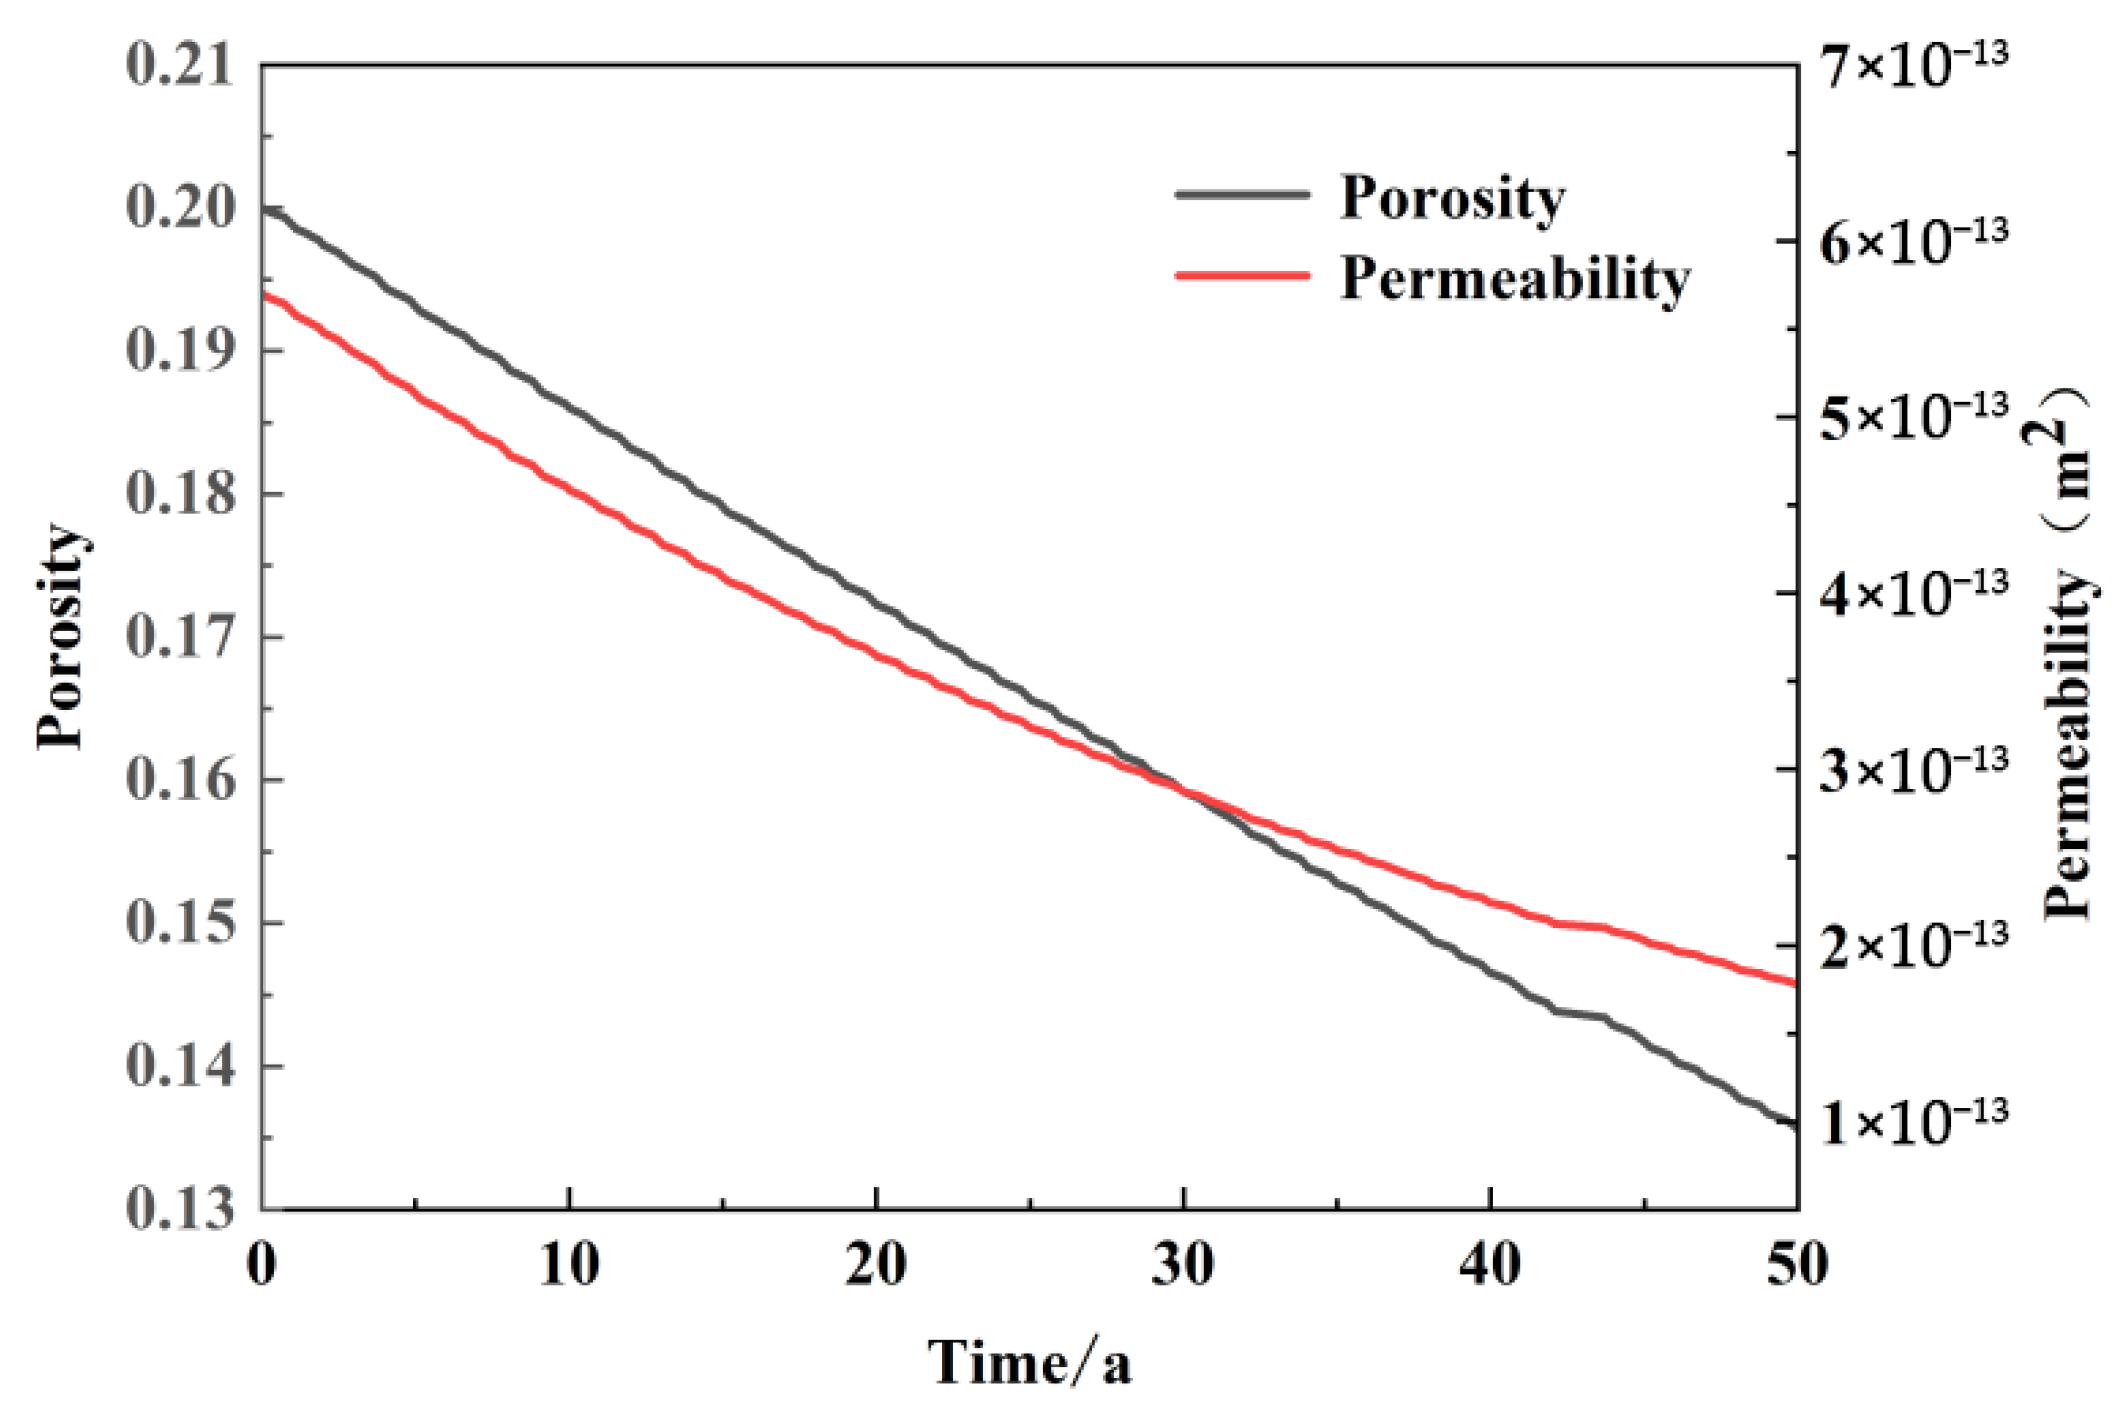
Figure 9 illustrates the pattern of change in pore penetration in the vicinity of the recharge wells following 50 years of intermittent operation of the model. The initial value of sandstone porosity in the vicinity of the recharge wells was 0.2, which subsequently decreased to 0.136 at the conclusion of the 50-year simulation. The overall trend in porosity over time in the vicinity of the recharge wells was a continuous linear decline, with some degree of fluctuation in porosity during periods of cessation of recharge during non-heating periods. However, the trend was less pronounced. The initial permeability of 5.7 × 10
−13 m
2 was reduced to 1.77 × 10
−13 m
2 after 50 years of intermittent operation, which is consistent with the trend of porosity change. During the non-heating period, slight fluctuations were observed, but the overall magnitude was small and almost negligible.
Before the model was run, the sandstone reservoir was in chemical equilibrium with geothermal water. The injection of recharge water represents an additional perturbation to the original equilibrium. This disrupts the balance between the reservoir and the geothermal initial water, resulting in chemical reactions between the recharge water and the sandstone reservoir. These reactions generate a multitude of insoluble secondary mineral precipitates, with a production rate exceeding that of the dissolution of the original minerals. This phenomenon is known as the precipitation effect, which is greater than the dissolution filtration effect. As the heating period persists, the portion of the sandstone occupied by specific primary minerals is encroached upon by secondary deposits. Additionally, a certain volume of secondary deposits begins to emerge within the pores of the sandstone. Prior to the model being run, the sandstone reservoir was characterized by high porosity and well-connected pore spaces. However, following the injection of recharge water, the continuous generation of secondary precipitation led to the partial occupation of the pore space by precipitation, thereby rendering seepage increasingly challenging. The greater the number of years that the apparatus has been in operation, the more likely it is that the connecting pores will become plugged. This phenomenon is responsible for the overall decline in permeability that has been observed. During the non-heating period, there is no recharge water injection. Instead, the chemical reaction between the sandstone reservoir and the geothermal water occurs. This results in greater dissolution and filtration than precipitation due to the loss of external disturbances. However, the two processes are essentially in equilibrium prior to the commencement of the next heating period. Fluctuations in pore and permeability in sandstone reservoirs in proximity to recharge wells are observed during non-heating periods, despite the continued decline on long-term time scales.
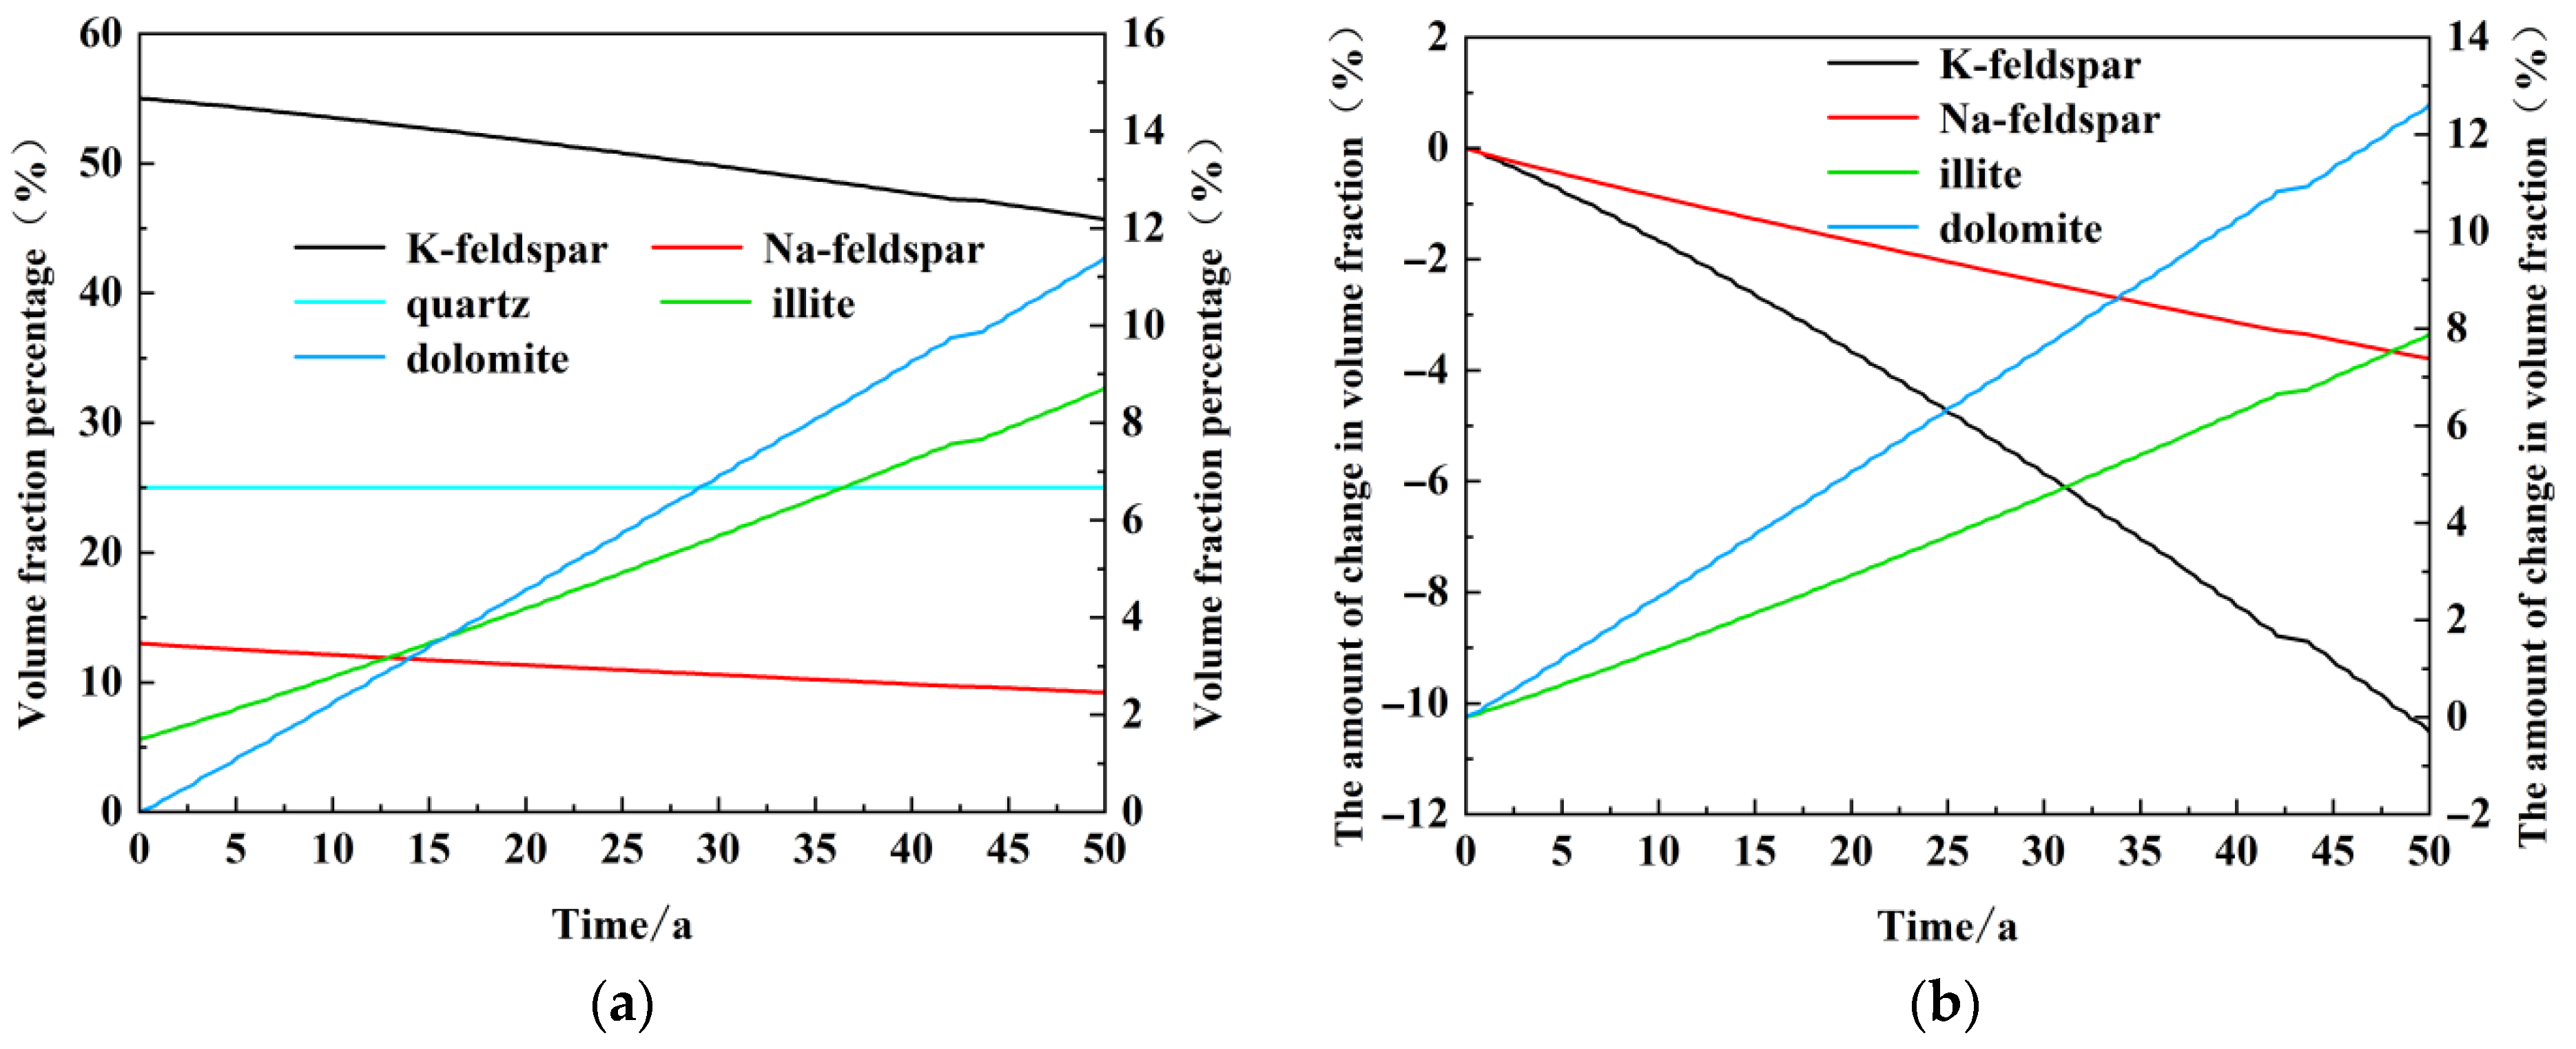
In addition to the changes in physical properties such as porosity and permeability, the mineral composition near the recharge wells also undergoes obvious temporal variations.
Figure 10 illustrates the pattern of major dissolved and precipitated minerals in the vicinity of the recharge wells over time.
Figure 10a illustrates that the proportion of K-feldspar in the sandstone reservoir is the largest, at 55%. After 50 years of operation, the proportion of K-feldspar is reduced to 45.7%. Quartz is in the second place, with an initial content of 25%. The content of quartz is almost unchanged after 50 heating periods of operation. This is also closely related to the stable chemical properties of quartz. Na-feldspar occupies the third position, with an initial content of 13% and a subsequent dissolution to 9.2% after 50 years of operation. This illustrates that the primary dissolved minerals in sandstone reservoirs are feldspar minerals, including K-feldspar and Na-feldspar. The initial mineral content of illite was only 1.4 per cent; however, following the completion of the model, the illite content increased significantly, reaching 8.7 per cent after 50 years. The initial content of dolomite is 0, which is consistent with the changing trend of illite. By the end of the model run, the proportion of dolomite has reached 11.4%, which is a greater proportion than that of primary Na-feldspar. It can be observed that the principal secondary minerals produced during the recharge phase are illite and dolomite.
Figure 10b illustrates the extent of the absolute change in the volume fraction of several major dissolved and precipitated minerals over the course of the model run. As illustrated in
Figure 10b, the dissolution of K-feldspar was observed to be 10.5 per cent over the course of the experiment, while Na-feldspar exhibited a dissolution rate of 3.8 per cent. Secondary illite precipitation was observed to generate 7.9%, while dolomite precipitation generated 12.7%. The total volume of dissolved minerals is approximately 14.3 per cent, while the total volume of precipitated minerals is 20.5 per cent. The additional 6.3% precipitated volume is essentially equivalent to a reduction in porosity of 0.064. The principal dissolved minerals are identified as K-feldspar and Na-feldspar, while the main precipitated minerals are illite and dolomite.
5. Recharge Water Components Optimization
In the previous analysis, it can be concluded that in order to reduce the amount of precipitation should be mainly to control the two main secondary minerals of illite and dolomite, the generation of illite and potassium feldspar related to the sandstone minerals of potassium feldspar accounted for a very large proportion of the sandstone minerals, so the control of the generation of illite is relatively more difficult, and the amount of volumetric changes caused by the precipitation of illite is less than the amount of dolomite, and dolomite generation and the concentration of Ca
2+, Mg
2+ in water The generation of dolomite is closely related to the concentration of Ca
2+ and Mg
2+ in water, so this simulation is carried out by reducing the concentration of Ca
2+ and Mg
2+ in the recharge water, and the specific scheme is shown in
Table 11 below.
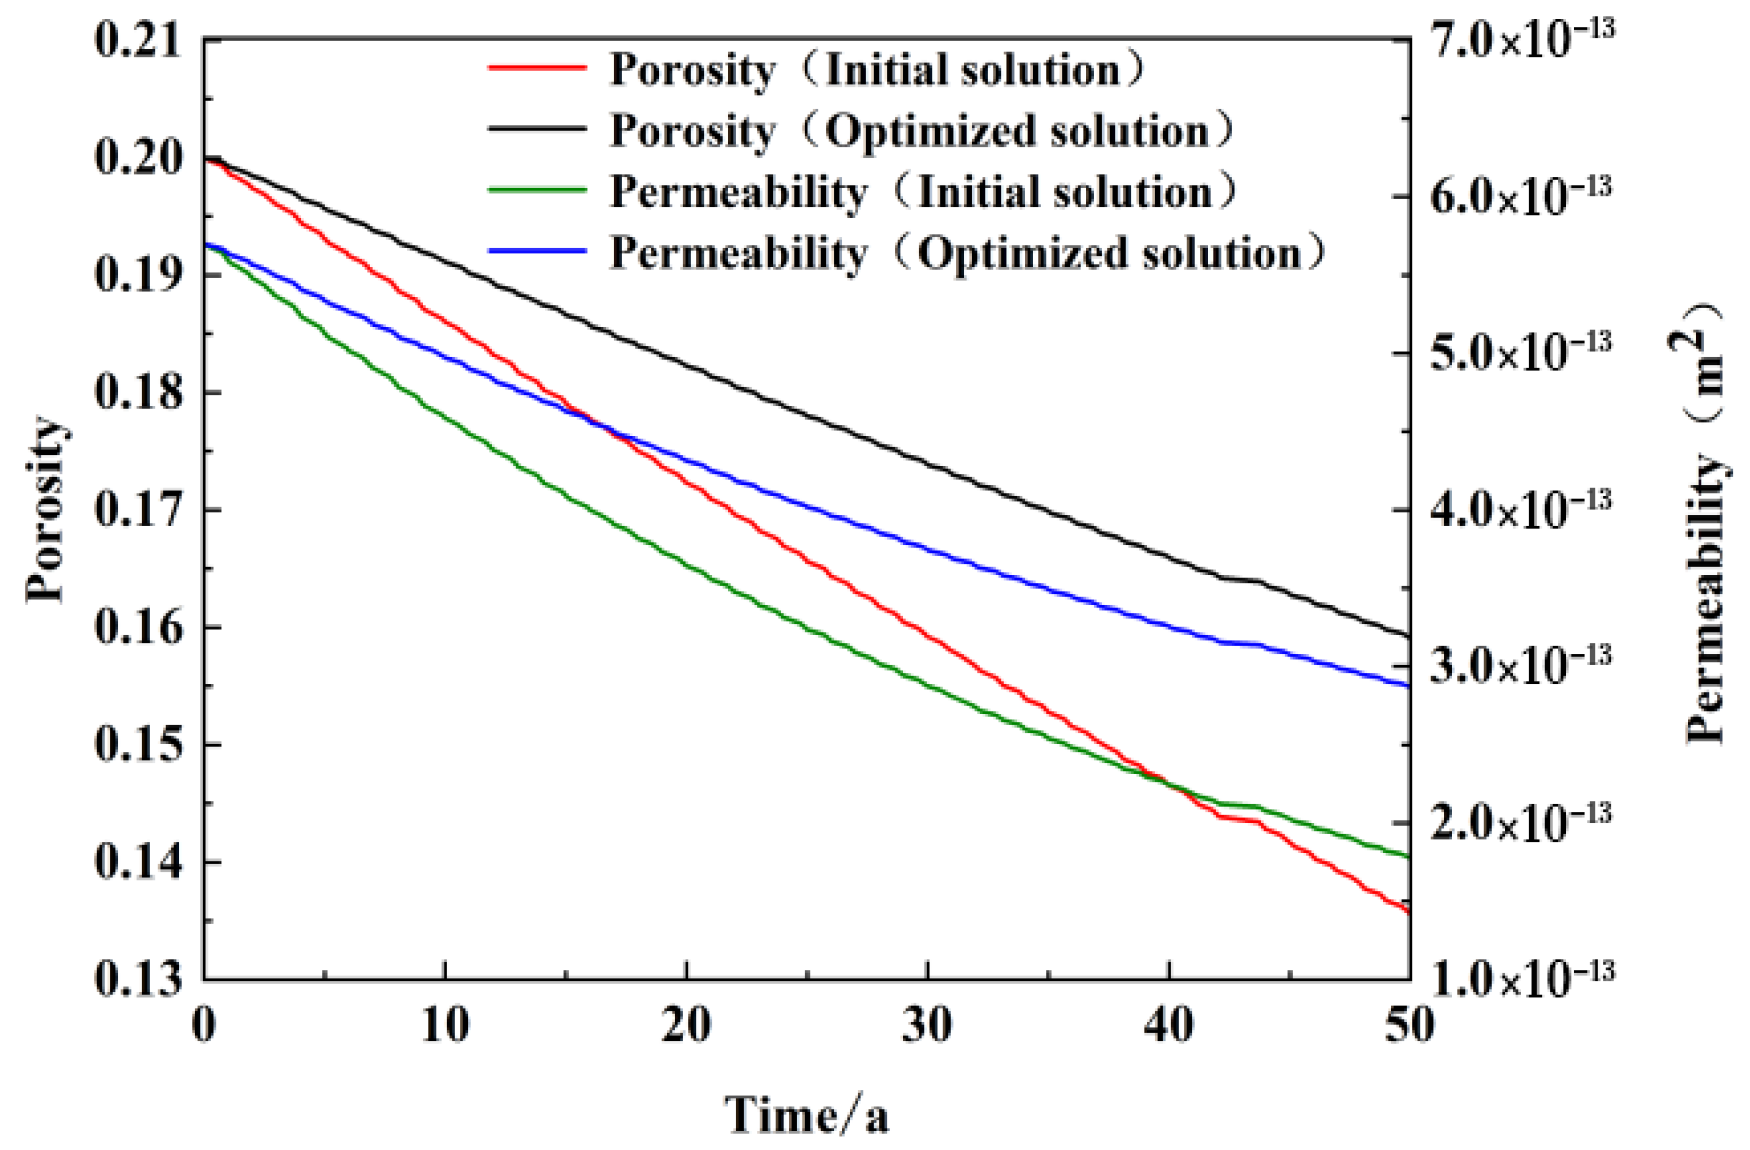
Figure 11 illustrates the temporal trends in porosity and permeability for sandstone reservoirs situated at the recharge well locations. The optimized scenario demonstrated a significantly reduced rate of decline in porosity and permeability when compared to the original scheme, which had been in operation for over 50 years. Upon completion of the model run, the porosity of the initial scenario exhibited a reduction from 0.2 to 0.136, while the permeability decreased from 5.7 × 10
−13 m
2 to 1.78 × 10
−13 m
2. In contrast, the optimized scenario demonstrated a porosity of 0.159 and a permeability of 2.87 × 10
−13 m
2.
It can be observed that a reduction in the concentration of calcium and magnesium ions in the recharge water by half results in a notable increase in the reduction in porosity and permeability of the sandstone reservoir. After 50 years of operation, the reduction in porosity is found to have increased from 32% to 20.5% in the original scheme, while the permeability has increased from the original scheme of attenuation of 68% to 50%. It can be concluded that this scheme is an effective method of controlling the reduction in reservoir porosity and permeability caused by recharge. This plays an important role in enhancing the heating potential of the counter well system and extending the service life of geothermal wells.
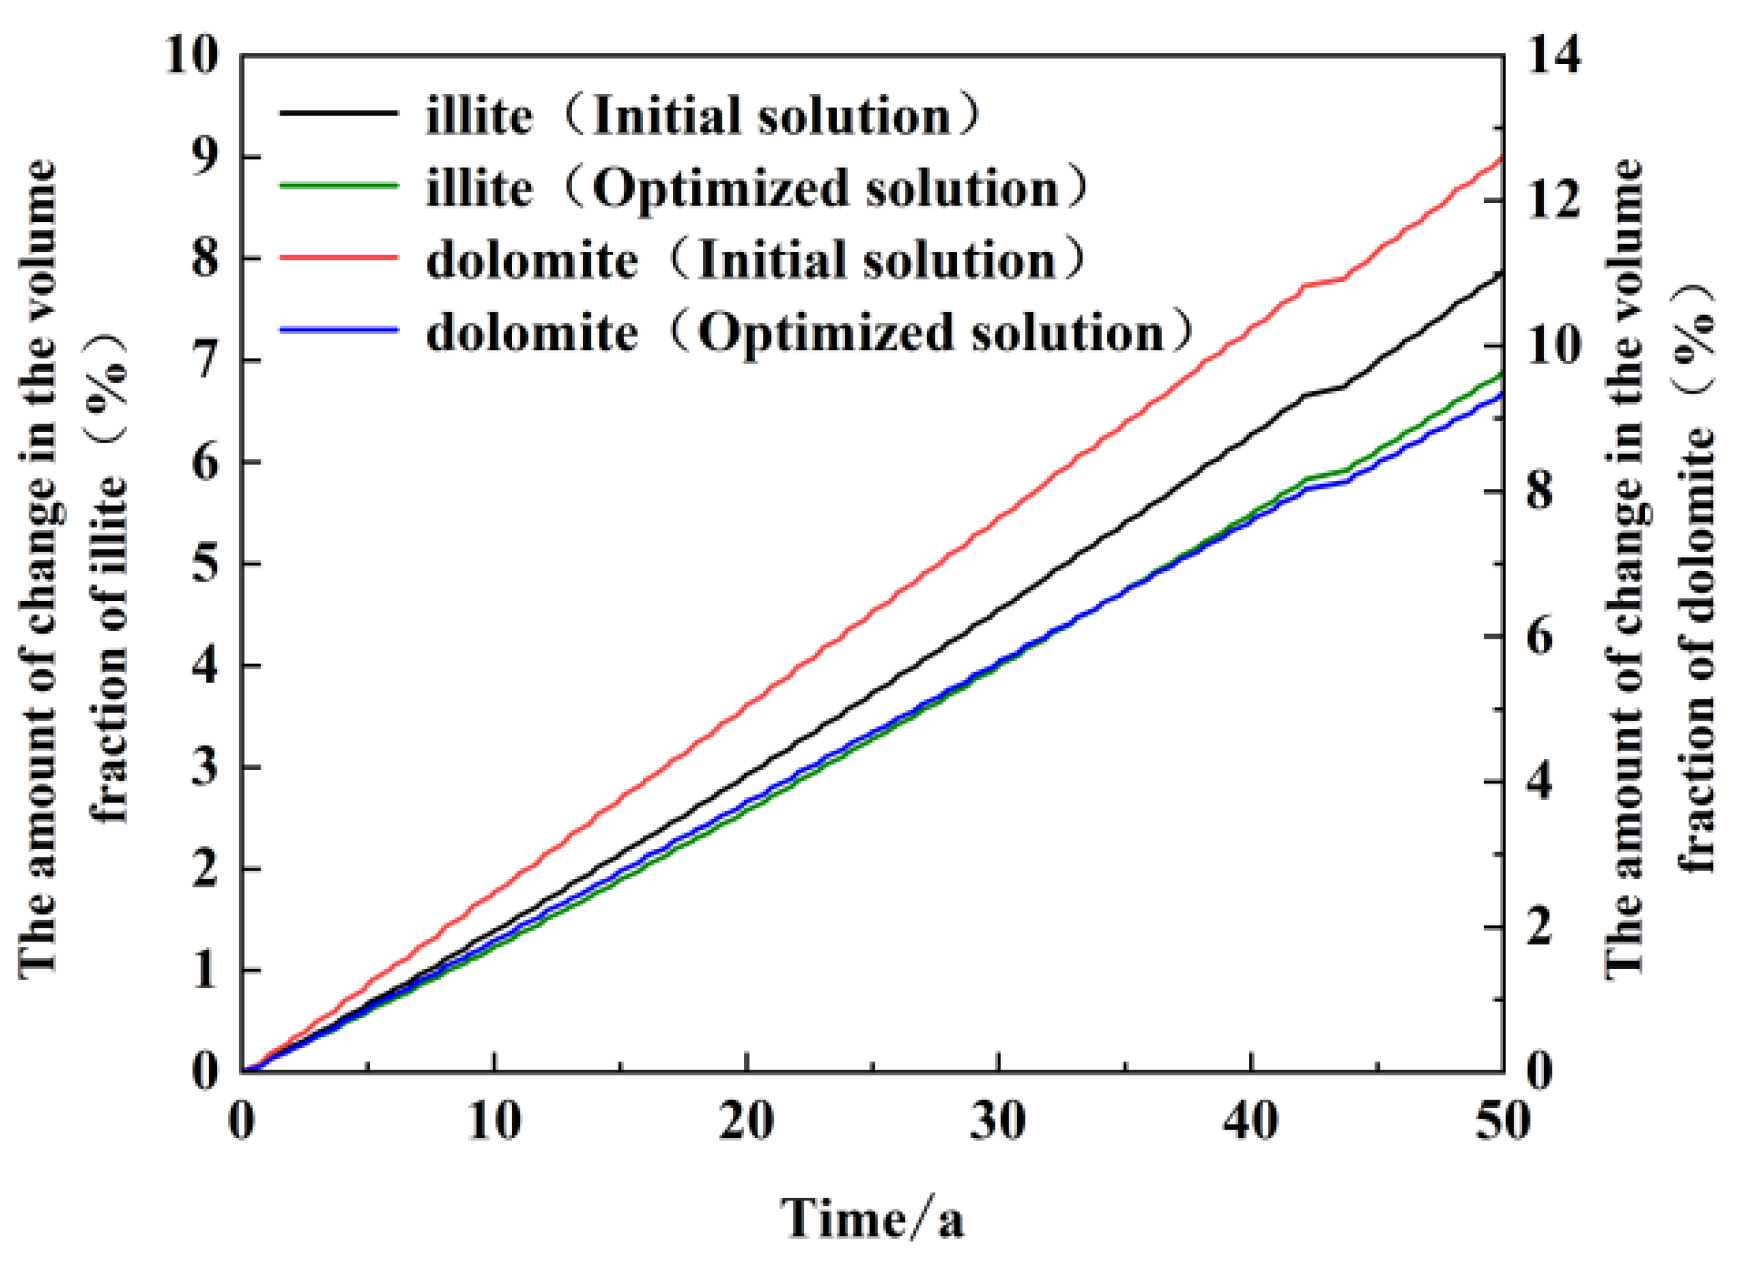
Figure 12 illustrates the trend in volume change in major precipitated minerals in the vicinity of recharge wells over time. This figure illustrates the trends of the two minerals, illite and dolomite, for both the original and optimized scenarios. As illustrated in the figure, following 50 years of operation, the volume change resulting from illite precipitation in the optimized scenario is 6.9%, in comparison to 7.8% in the original scheme. The discrepancy in volume change is relatively minor, amounting to a mere 0.9%. In contrast, the volume change in dolomite precipitation was reduced from 12.6% to 9.3% in the original scheme, with a difference in volume change of 3.3%. This demonstrates that the scheme is an effective means of controlling the generation of dolomite precipitation. A reduction in the concentrations of calcium and magnesium ions in the recharge water resulted in an inability of the recharge water to provide sufficient calcium and magnesium ions for the generation of dolomite precipitation. Consequently, the precipitation was controlled to a greater extent. Given that the scheme was optimized for the convenient control of dolomite precipitation only, the amount of illite precipitation did not decrease significantly; rather, it exhibited a slight reduction. It is postulated that the optimized scenario has impeded the dissolution of potassium feldspar.
6. Conclusions
This study focused on the doublet-well system of the sandstone geothermal reservoir in Decheng District, Dezhou, Shandong Province. By combining indoor high-temperature and high-pressure static experiments with hydro–thermo–chemical coupling numerical simulations, it systematically explored the porosity and permeability change characteristics of the sandstone geothermal reservoir and the laws of water–rock interaction under recharge conditions. The key findings are as follows:
During the recharge process, the main dissolved minerals in the sandstone reservoir are K-feldspar and Na-feldspar, while quartz content remains basically unchanged due to its stable chemical properties. The main precipitated minerals are illite and dolomite, and the content of other secondary precipitated minerals such as montmorillonite is extremely low, with negligible impact on the reservoir’s porosity and permeability. The injection of recharge water disrupts the chemical equilibrium between the reservoir and the original geothermal water. The continuous formation of illite and dolomite fills the reservoir pores, leading to a significant decline in the porosity and permeability of the near-well reservoir. Under the existing development conditions, after 50 heating periods (120 days per period), the porosity of the near-well sandstone reservoir decreases from the initial 0.2 to 0.136, and the permeability drops from 5.7 × 10⁻¹³ m2 to 1.77 × 10⁻¹³ m2. Regulating the chemical composition of recharge water can effectively alleviate the decline in reservoir porosity and permeability. When the Ca2+ concentration in recharge water is controlled below 3.085 mmol/L and the Mg2+ concentration below 1.315 mmol/L, after 50 heating periods, the porosity reduction rate of the reservoir decreases from 32% (original scheme) to 20.5%, and the permeability attenuation rate drops from 68% to 50%, which can significantly extend the service life of the doublet-well system and improve heating potential.
Most prior studies on sandstone geothermal reservoirs reported qualitative trends of feldspar dissolution but lacked quantitative rate data under high-temperature/pressure conditions matching our study area (60 °C, 13 MPa). By contrast, our indoor static experiments and TOUGHREACT V4.13-OMP simulations provided precise dissolution rates for key minerals. Our simulation showed a 5.589 × 10⁻⁴% volume loss over 30 days (equivalent to a dissolution rate of 6.21 × 10⁻¹⁴ mol/(m2·s)), which is ~1.8 times higher than the rate reported by Fan Tao (3.45 × 10⁻¹⁴ mol/(m2·s)) for a similar sandstone reservoir (but at lower pressure: 10 MPa). Our rate data are more applicable to deep sandstone reservoirs (>1300 m, typical of Decheng District) where pressure exceeds 12 MPa, as they capture the pressure-induced acceleration of feldspar dissolution. Simulation results for the 50-year period confirmed dolomite accounted for 12.7% of mineral volume precipitation. This contrasts with Xu Tianfu et al.’s 85% calcite contribution because their study area had higher HCO3− concentrations (12.1 mmol/L vs. our 4.015 mmol/L), favoring calcite over dolomite. Our findings are more applicable to low-HCO3− sandstone reservoirs (e.g., Decheng District, where HCO3− < 5 mmol/L), filling the gap in understanding dolomite-driven porosity loss in such settings.
This study also has certain limitations that need to be further addressed in subsequent work. In terms of research scope, the porosity and permeability change laws and recharge optimization schemes obtained in this study are based on the geological and hydrogeological conditions of the Guantao Formation sandstone reservoir in Decheng District. The applicability of the results in other lithologies (such as carbonate rocks) or different geothermal backgrounds (such as high-temperature hot dry rocks and fractured reservoirs) has not been thoroughly explored, and there is insufficient support for the large-scale promotion of the results. Regarding research uncertainty, although mineral reaction kinetic parameters under different acid-base conditions were set in the numerical simulation, the impact of dynamic fluctuations in mineral reaction rates, fluid chemical composition, temperature, and pressure in actual field conditions on long-term prediction results was not fully considered, and the sensitivity analysis and uncertainty quantification of model output were insufficient. In addition, no comparative analysis and collaborative application discussion were conducted in combination with new reservoir permeability enhancement technologies such as plasma-based stimulation, which has shown potential in improving the near-well permeability of low-permeability reservoirs in recent years, and its effect in alleviating reservoir blockage can be verified through experiments and numerical simulations.
Based on the above research results and limitations, future in-depth research can be carried out in the following directions. In terms of result promotion, sandstone reservoirs with different geological conditions (such as other areas of the North China Plain and arid areas in the northwest) as well as fractured and carbonate geothermal reservoirs can be selected. By supplementing indoor experiments and on-site monitoring, an adaptation model of recharge optimization schemes suitable for multiple types of reservoirs can be established to clarify the applicable boundaries of the conclusions of this study.
