Article

Developing an Italian Library of Reference Buildings for Urban Building Energy Modeling (UBEM): Lessons Learnt from the URBEM Project

by
Martina Ferrando
1,*,
Francesco Causone
1,*,
Alessia Banfi
1,
Vincenzo Corrado
2,
Ilaria Ballarini
2,
Matteo Piro
2,
Angelo Zarrella
3,
Laura Carnieletto
3,4,
Nicola Borgato
3,
Gianpiero Evola
5,
Maurizio Detommaso
5,
Francesco Nicoletti
6,
Andrea Vallati
7 and
Costanza Vittoria Fiorini
7
1
Department of Energy, Politecnico di Milano, Via Lambruschini 4, 20156 Milan, Italy
2
Department of Energy, Politecnico di Torino, Corso Duca degli Abruzzi 24, 10129 Turin, Italy
3
Department of Industrial Engineering, Università degli Studi di Padova, Via Venezia 1, 35131 Padova, Italy
4
Department of Environmental Sciences, Informatics and Statistics, Ca’ Foscari University of Venice, Via Torino 155, 30172 Mestre, Italy
5
Department of Electrical, Electronic and Computer Engineering, Università degli Studi di Catania, Via Santa Sofia 64, 95123 Catania, Italy
6
Department of Civil, Energy, Environmental and Material Engineering (DICEAM), Mediterranea University of Reggio Calabria, 89122 Reggio Calabria, Italy
7
Department of Astronautical, Electrical and Energy Engineering, Università di Roma La Sapienza, Via Eudossiana 18, 00184 Rome, Italy
*
Authors to whom correspondence should be addressed.
Energies 2025, 18(22), 6026; https://doi.org/10.3390/en18226026
Submission received: 13 October 2025 / Revised: 10 November 2025 / Accepted: 12 November 2025 / Published: 18 November 2025

Abstract

Urban Building Energy Modeling (UBEM) plays a critical role in supporting data-driven strategies for the energy transition of cities. However, its application is often hindered by the lack of harmonized, high-quality input data representing the building stock. This paper presents the methodology and outputs of a national research project to construct an Italian library of reference buildings suitable for UBEM applications described with scorecards. The methodological workflow included six key phases: definition of a national data classification framework, acquisition and integration of heterogeneous data sources, data harmonization, statistical analysis and clustering, archetype formalization, and dissemination. The result is a library of 380 scorecards covering residential, educational, office, commercial, and catering buildings across multiple climate zones and construction periods. Each scorecard is based on empirical data from public databases, field surveys, or technical standards, and includes detailed descriptions of geometry, envelope characteristics, HVAC systems, internal gains, and ventilation. The scorecards are shared openly on the project’s website and were built to work with different UBEM platforms. Overall, both the method and the results help bring more consistency to UBEM practice and support better, data-driven urban energy planning.

1. Introduction

1.1. The Role of Urban Building Energy Modeling (UBEM)

The decarbonization of cities is among the most pressing challenges of the 21st century [1]. Urban areas are responsible for more than 70% of global CO2 emissions related to energy, and buildings alone account for a significant share of this impact [2]. These figures matter a lot in contexts such as Italy, where a significant share of the building stock was built before the introduction of energy-saving rules [3]. On top of that, construction technologies differ widely across regions, the climate changes sharply from north to south, and cities have very different shapes [4]. All these factors make large-scale energy planning much harder [5,6]. Achieving climate neutrality and energy resilience in such contexts requires data-informed decision-making tools that can operate on a broad scale while capturing the diversity of local conditions [7]. Urban Building Energy Modeling (UBEM) has emerged in recent years as a promising approach to support energy transition efforts in urban contexts [8]. UBEM enables the simulation of the energy performance of buildings in districts or cities [7]. In particular, the bottom-up, physics-based approaches can be used to estimate energy use, identify retrofit opportunities, test urban energy scenarios, and evaluate the potential integration of renewables at multiple spatial scales (from the entire city to the single building) and temporal scales (from yearly values to hourly ones). As reviewed by Ferrando et al. (2020) [7], various UBEM platforms have been developed, each with different degrees of complexity, data requirements, and intended applications. Despite their promise, the accuracy and usefulness of UBEMs hinge critically on the availability of high-quality, georeferenced information systems (GIS) data on building geometry, construction assemblies, energy systems, and usage patterns. In practice, data (i.e., both acquisition and organization) remains one of the most significant bottlenecks in the field. Wang et al. [9] provided a systematic review of the difficulties associated with data inputs for UBEM, including the limited availability of three-dimensional building models, the stochastic nature of occupant behavior [10], the variation in construction systems even within similar typologies [11], and the restricted access to actual energy consumption data due to privacy and institutional barriers [12].

1.2. The Need for National Reference Building Libraries

The need for consistent building of standardized reference buildings to facilitate UBEM adoption and comparability across studies is emphasized by several studies [13,14,15,16]. As a matter of fact, using reference buildings is the most adopted solution to mitigate the lack of building-level data [17]. Reference buildings (also called archetypes or prototypes) are simplified representations of typical buildings, usually categorized through easy-to-access information like use and construction period. These reference buildings allow for scalable modeling by assigning representative properties to large groups of buildings. In this context, the term “typical building” refers to a building representative of common construction features within a given use and age category. The term “archetype” usually denotes a simplified or idealized model used in simulation to represent a group of similar buildings. In contrast, a “reference building,” as used in this study, indicates a statistically derived and data-based representative entity that captures the main physical and system characteristics of a given segment of the national building stock.
In Europe, the most comprehensive effort in this direction is the TABULA/EPISCOPE project [18,19], which aimed to define a harmonized typology of residential buildings across multiple countries. While pioneering, TABULA’s outputs [20,21] are primarily intended for national-level energy statistics and retrofit scenario assessments. The models are based on fixed geometries, aggregated performance indicators, and standard usage assumptions, making them not directly suited for integration into dynamic, geometrically explicit UBEM workflows. Moreover, TABULA focuses exclusively on the residential sector, leaving a large portion of the building stock, including offices, schools, and public buildings, unaddressed.
This limitation is particularly relevant, with Italy representing an example of a situation shared by many other countries. Existing datasets for Italian buildings are fragmented, inconsistent, and generally lacking in spatial granularity [22]. National standards such as UNI/TS 11300 [23] and UNI/TR 11552 [24] contain valuable information on envelope characteristics and system efficiencies, but they are not harmonized across regions and do not provide the structured, parametric inputs required by UBEM platforms. The available datasets are mainly incomplete, with limited adaptability to different geometries, occupancy profiles, or technological configurations. As a result, researchers and planners often resort to ad hoc assumptions or local surveys, undermining both the comparability and the scalability of UBEM studies. Although research efforts are now gaining momentum worldwide [25,26,27], at the current state, the Italian context needs reference buildings to simplify the use of UBEM and respond to the increasing European environmental challenges [1,28]. This work contributes a structured library of reference buildings and practical lessons learnt in addressing fragmented data sources, regional heterogeneity, and multi-institutional collaboration. A first attempt to cover the Italian context was made by Carnieletto et al. [22]: the work developed a set of 46 detailed archetype buildings for the Northern Italian context, focusing on residential and office buildings in climate zone E. The reference buildings are categorized by use (i.e., single-family, multi-family, and offices), construction period, and envelope properties. They also include specifications about HVAC systems and internal loads based on national standards and statistical data. Unlike previous approaches, the archetypes were designed with parametric flexibility, making them suitable for urban-scale simulations using UBEM tools. However, the scope was limited to a single climate zone and did not provide a complete national framework or a generalized methodology for the setting of archetypes.

1.3. The URBEM Project

In this fragmented and evolving landscape, the research project named “Urban Reference Buildings for Energy Modeling” (URBEM) [4] represented a systematic and forward-looking attempt to redefine how reference buildings are developed and used in UBEM. The project was funded under the Italian PRIN 2020 research program and coordinated by Politecnico di Milano with the participation of four other leading Italian universities (i.e., Politecnico di Torino, Università di Padova, Università di Catania, and Università di Roma La Sapienza) and five supporting universities (i.e., Università degli Studi di Firenze, Università degli Studi di Pavia, Università Iuav di Venezia, Università della Calabria, Università degli Studi di Roma ‘Tor Vergata’). URBEM developed a national reference library of use-flexible, UBEM-ready reference buildings. Rather than prescribing fixed shapes and performance values, they are designed to be coupled with real building geometries and datasets (e.g., cadastral footprints, height maps, or GIS shapefiles), enabling simulations with UBEM tools. Thus, since geometry in UBEM is defined at the urban scale from GIS data or similar information, the description of the reference buildings includes only complementary geometric indicators rather than explicit floor plans. This paper draws from the URBEM project to report on the creation of a national reference building library and to discuss critical challenges and lessons related to data integration, institutional collaboration, and the scalability of UBEM methods. In doing so, the final aim is to provide a valuable dataset with insights and lessons that can guide future initiatives in Italy and abroad.
The ultimate aim of the URBEM project is to create a transparent and interoperable national database of reference buildings that can be directly used within UBEM environments. By providing standardized and traceable inputs, the dataset enables more reliable energy simulations, supports evidence-based policy design, and promotes the broader adoption of data-driven urban energy planning across Italian cities. Based on the context described above, this study addresses the following research questions (RQ):
  • How can a harmonized methodological framework be designed to generate national reference buildings suitable for UBEM applications?
  • What procedures and quality assessment steps are required to integrate heterogeneous data sources into a consistent, simulation-ready dataset?
  • To what extent can the resulting reference building library improve the transparency, interoperability, and scalability of UBEM studies across different Italian regions?
  • What lessons can be derived from the URBEM project to guide future national and international initiatives in developing reference building databases?
The remainder of this paper is structured as follows: Section 2 shows an overview of the related works; then, Section 3 presents the methodological framework adopted in the URBEM project, outlining the overall workflow used to generate the national library of reference buildings. Section 4 describes in detail the results and discusses the phases described in the methodology applied to the Italian context. Section 5 offers concluding remarks and outlines directions for future developments. Finally, Appendix A shows a full building scorecard (i.e., standardized reference sheets summarizing the statistical and technical parameters of each representative building) as an example.

2. Related Works

In the last decade, using reference buildings has become a central strategy in UBEM to cope with limited and fragmented building data. These models serve as standardized representations of typical buildings, allowing large-scale simulation while maintaining computational efficiency. Reference buildings have been increasingly adopted in national [29] and international [25] initiatives to provide shared inputs for urban-scale analyses, policy assessments, and scenario planning. Although the terminology varies (i.e., “reference buildings” [30], “archetypes” [31], or “prototypes” [32]), their common purpose is to translate empirical or statistical information on the building stock into a manageable number of representative entities [33,34].
At the global level, numerous projects and national programs have developed reference building datasets to support both research and policy. In the United States, for instance, the U.S. Department of Energy (DOE) created a set of Commercial and Residential Reference Buildings [35] that became widely used benchmarks for simulation studies and code development. Similar initiatives have been established in Canada [36], China [37], and Australia [38], generally emphasizing energy code compliance or retrofit benchmarking. These efforts typically rely on fixed geometries, standard operating schedules, and normative assumptions, which make them robust for comparison and regulation but less flexible for UBEM.
In Europe, the TABULA [18,19] and EPISCOPE [19] projects are the most influential works, which aimed to harmonize the description of residential building typologies across more than twenty European countries. TABULA introduced a systematic structure for defining representative buildings by age class, use type, and construction system, offering a transparent typology that enabled comparative analyses and policy modeling at national and EU levels [5,20]. EPISCOPE later extended this work by adding dynamic monitoring of renovation progress and energy performance at the stock level. However, while these projects established a solid foundation for typological harmonization, their outputs were conceived primarily for statistical assessments and energy policy tracking. As such, the resulting models are typically not directly compatible with bottom-up UBEM workflows that require building-specific geometrical data [39].
Beyond TABULA, many studies have sought to develop local or regional libraries of reference buildings tailored for UBEM or district energy analysis. Early examples include studies from Ireland [15] and China [13], which proposed structured sets of representative dwellings based on surveys and national data. Pasichnyi et al. (2019) [16] provided one of the first comprehensive data-driven frameworks for archetype generation at the urban scale, combining administrative data with statistical clustering. More recent work has emphasized automation and flexibility, leveraging GIS integration and open datasets to improve transferability [25,40]. Despite these advances, the majority of studies still focus on the residential sector, while non-residential uses (e.g., offices, schools, or retail buildings) remain less covered, partly due to the scarcity of consistent data [41].
Several research groups have also explored the methodological side of archetype development. Approaches range from rule-based segmentation by age, typology, and use [20,21] to unsupervised clustering and hybrid machine-learning methods [14]. While clustering enhances statistical representativeness, it requires extensive and homogeneous datasets, which are not always available or accessible, especially in countries with decentralized data governance. Consequently, most national-scale initiatives rely on expert-driven typologies complemented by standardized assumptions derived from codes and surveys.
Despite growing research attention, three critical limitations persist. First, data fragmentation remains a significant obstacle: energy certificates, cadastral data, and system information are often stored in regionally isolated databases using incompatible formats. Second, there is a lack of transparency and uncertainty documentation in many existing libraries, which undermines reproducibility and cross-study comparison. Third, interoperability across modeling tools is still limited, since reference building datasets are rarely structured for seamless use within different UBEM environments (e.g., EnergyPlus-based, resistance–capacitance, or statistical models). These issues highlight the need for standardized frameworks to harmonize data sources, document quality, and provide simulation-ready outputs in an open format.
Italy exemplifies this challenge. While several datasets and technical standards exist, such as the national UNI/TS 11300 [23,42,43,44] and UNI/TR 11552 [24], they are not integrated within a common framework, and only partial regional databases are openly accessible. A first step toward structured UBEM-ready reference buildings was the work by Carnieletto et al. (2021) [22], which produced a detailed set of archetypes for Northern Italy. However, that study focused on a single climate zone and limited typologies (i.e., residential and office buildings).
Against this background, the URBEM project introduces a systematic and transparent methodology to develop a harmonized national library of reference buildings for Italy. By combining data integration, quality assessment, and standardized formalization into interoperable scorecards, URBEM bridges the gap between statistical typologies and dynamic UBEM inputs, offering a reproducible framework applicable to Italy and other contexts facing similar data fragmentation and heterogeneity.

3. Methodology

The methodology developed within the URBEM project is structured into a multi-phase framework designed to generate a national library of reference buildings for Urban Building Energy Modeling (UBEM). The approach integrates data collection, harmonization, statistical analysis, and standardized output generation, with a strong focus on transparency, reproducibility, and applicability across diverse areas in Italy and other contexts with similar data input. The workflow (Figure 1) unfolds through six major phases: (1) Definition of the Data Classification Framework, (2) Acquisition and Integration of Data Sources, (3) Data Processing and Harmonization, (4) Statistical Analysis and Clustering of Building Data, (5) Formalization of Reference Buildings in Scorecards, and (6) Dissemination and Interoperability.

3.1. Definition of the Data Classification Framework

The foundation of the URBEM methodology lies in the development of a shared and standardized data classification framework. This structure defines the categories of input data required for UBEM, regardless of the specific simulation platform used. This framework was essential to ensure that the final outputs (i.e., the reference buildings) could be implemented flexibly and without compatibility constraints across different UBEM tools. This phase involved a comprehensive review of all aspects of building characterization to identify which variables should be included in the scorecards and which could be excluded. Major building characteristics affecting the energy performance were examined, including:
  • Geometric features like number of stories, heated gross and net floor area, heated gross and net volume, building height, compactness ratio;
  • Envelope properties such as U-values for walls, roofs, floors, and windows, window-to-wall ratio (WWR), and construction assemblies;
  • Thermal systems for heating, cooling, ventilation, and domestic hot water (DHW), including generator types and efficiencies;
  • Occupancy-related data like internal gains, schedules, and user densities;
  • Climate data, such as classification by climate zones, heating and cooling degree days.
The classification system of this information into a framework was developed in alignment with relevant European and international standards (e.g., EN ISO 52016 [45], EN ISO 6946 [46], UNI/TR 11552 [24]) and operationalized through a series of structured spreadsheets. This ensured internal consistency and supported interoperability and future applications, laying the groundwork for a harmonized, scalable, and simulation-ready dataset. The originality of the approach lies less in the six generic steps themselves and more in the systematic way they were applied to a fragmented national context, combining data quality assessment protocols, harmonization rules, and expert-driven clustering.

3.2. Acquisition and Integration of Data Sources

A broad data acquisition campaign was conducted to populate the data framework. This activity involved identifying, retrieving, and organizing datasets from public and private sources, including Energy Performance Certificate (EPC) (i.e., standardized building energy declarations, originally introduced at the EU level by the 2002 Energy Performance of Buildings Directive, and currently collected at the regional level in Italy) databases from Italian regions, thermal plant and building cadasters, national statistics, technical standards, GIS data, and results from targeted field campaigns. To assess and classify each data source, a metadata structure was defined to describe accessibility, digital format, granularity, and source type.
One of the most innovative elements of this framework is the integration of a structured and systematic data quality assessment procedure, developed in the context of the H2020 TIMEPAC project (Towards Innovative Methods for Energy Performance Assessment and Certification of Buildings) [47]. This procedure responds to the widespread concern regarding the reliability of EPC input data, which can significantly affect the robustness of both individual building assessments and broader-scale analyses. The core idea is to associate each data input with two key attributes: its provenance (e.g., institutional databases, technical guidelines, or user-provided information) and the method by which it was obtained, distinguishing between direct measurements, standard assumptions, and derived calculations. These two characteristics assign each parameter a qualitative uncertainty rating, structured into three levels (e.g., high, medium, low reliability). This evaluation is guided by a compatibility matrix that cross-references the source and method of each input, enabling a consistent and transparent attribution of reliability labels. Rather than relying on subjective judgments or generic assumptions, the matrix provides a reproducible framework to quantify data trustworthiness.

3.3. Data Processing and Harmonization

The raw data collected through this process underwent a structured data processing workflow. The processing was organized in four main steps: data cleaning, imputation, standardization, and segmentation. The first step, data cleaning, addressed inconsistencies, errors, and missing values through a combination of rule-based filters and statistical diagnostics. Records were excluded if they exhibited physically impossible values or incoherent system configurations (e.g., presence of terminal devices such as radiators, with “no heating system” declared).
Regarding the data cleaning operations, after performing the qualitative data quality assessment described in Section 3.2, a detailed procedure has been applied to remove inconsistent data in the EPC information sources. This quantitative methodology is derived from the H2020 TIMEPAC project [48]. It involves a scoring system that evaluates the quality of EPC data by comparing each energy certificate against a predefined maximum error threshold. According to this procedure, certificates that exceed the threshold are considered unreliable and are excluded from the reference buildings generation process.
The EPC data have been categorized into two groups to structure the assessment: critical variables significantly impacting the whole use and interpretation of the certificate, and non-critical variables. An overall acceptability threshold has also been defined to determine whether the EPC can be considered valid.
Each selected data point in the EPC is evaluated using an associated validity rule. These rules fall into three main categories:
  • Data type checks to ensure the data conforms to the expected mathematical, logical, or relational formats;
  • Physical plausibility checks to verify that values fall within physically reasonable ranges, based on expected orders of magnitude;
  • Consistency checks to assess whether a parameter logically aligns with the results or values of related parameters.
Therefore, applying this methodology is essential to prevent the inclusion of unreliable or inaccurate EPC data in the reference buildings generation process.
Specific rules were also applied to ensure consistency across variables; for instance, if no cooling system was reported, all related fields (power, type, emission) must be zero or blank. In case of numerical variables with missing values, the entry was discarded to preserve dataset integrity; moreover, if the numerical variables were not retrieved from EPCs, the data cleaning procedure relied on the rules listed below:
  • The ratio of heated gross volume to heated gross floor surface must differ by no more than 10 cm from the gross height;
  • The ratio of heated net volume to heated gross volume must be between 0.55 and 0.85;
  • The compactness ratio must be between 0.2 and 1.2;
  • The WWR values for all orientations must be positive and below 1;
  • The U-values of the various structures must be physically reasonable (i.e., walls between 0.15 and 2.8 W∙m−2∙K−1, roofs and floors between 0.15 and 3 W∙m−2∙K−1, windows between 0.7 and 6.5 W∙m−2∙K−1);
  • The Air Exchange rate, if available, must be higher than 0.25 h−1.
The data cleaning rules were not arbitrary but derived from physical plausibility checks and existing standards. For example, the requirement WWR < 1 excluded erroneous entries where window areas exceeded façade areas.
Finally, if only one of the above checks was not met for a given building, the specific data affected by the error was excluded from the record. Instead, if more than one check was disregarded, the entire record (e.g., all the building’s information) was deleted because of its marked unreliability. Although these criteria may seem arbitrary, they can still highlight evident anomalies in the compilation of the scorecards, thus allowing for correcting the data and excluding unreliable records. This produced a harmonized dataset of building entries suitable for statistical analysis and UBEM input preparation.

3.4. Statistical Analysis and Clustering of Building Data

The core phase of the methodology consisted of the statistical analysis and clustering of the harmonized dataset to define representative reference buildings. This phase served as the bridge between raw, empirical data and the structured, simulation-ready reference buildings. The analysis was conducted separately for each combination of building use, construction period, and climate zone, ensuring statistical homogeneity and contextual relevance. For numerical variables, descriptive statistics (e.g., median, interquartile range, and standard deviation) were computed to summarize central tendencies and variability. Categorical variables, i.e., those variables that cannot assume a numerical value, were analyzed by defining their frequency distribution.
The methodological framework also considered the potential use of unsupervised machine learning algorithms, such as k-means [49] or hierarchical clustering [50], as fallback tools in case of ambiguous, highly heterogeneous data distributions, or in case of registered time series data that can be differently exploited in the simulation of buildings [51,52,53]. In case of use, the unsupervised algorithms must be coupled with classical indexes to assess the significant number of clusters such as Davies–Bouldin indexes or Silhouette [54]. These techniques were included in the methodology to address uncertainty about the nature, quality, and structure of the data before acquisition and harmonization. The intent was to preserve methodological flexibility and ensure that clustering could be adapted to structured and unstructured data sources. In practice, however, the quality and consistency of the harmonized dataset proved sufficient to rely predominantly on rule-based thresholds and expert validation. Most reference buildings were thus defined without the need for algorithmic clustering, based on dominant patterns and statistically representative values. The resulting reference building clusters were consolidated through an iterative process that combined quantitative evidence with expert judgment, ensuring that each reference building captured not only statistical relevance but also constructive realism and alignment with historical building practices.

3.5. Formalization of Reference Buildings in Scorecards

Each reference building was formalized in a structured document known as a scorecard. These scorecards collect significant metrics and are designed to ensure uniformity and usability in simulation workflows, both manual and automated. Each document included metadata identifiers, summary tables of categorical and numerical variables, graphical representations where appropriate, and references to source data. Particular attention was given to the harmonization of terminology, numerical ranges, and graphical formats to facilitate integration with UBEM platforms and comparisons. Parameters derived from normative references were explicitly indicated, and placeholder fields were included where empirical data were unavailable. Finally, a scorecard must be based on data collected from at least five buildings; otherwise, it is not statistically significant and must be merged with another scorecard.

3.6. Dissemination and Interoperability

All reference buildings and associated documentation were published in open-access formats on the project website [4] compatible with multiple modeling platforms and workflows. The outputs were structured to support both human consultation and machine-readable integration due to their repetitive and strict structure among the scorecards, promoting replicability and transferability to other national and international contexts. The methodology provides a comprehensive framework for developing statistically robust, scalable, and harmonized reference building datasets to support energy modeling and planning at the urban scale.

4. Results and Discussion

This section presents the main results produced at each phase of the methodological workflow, leading to the construction of the final reference buildings. While the overall process was standardized, it is essential to note that the nature and availability of data varied across building categories, regions, and periods. As a result, local adaptations were occasionally required to define specific scorecards to ensure consistency and representativeness.

4.1. Definition of the Data Classification Framework

The first phase of the URBEM project delivered a critical foundational output: a comprehensive and operational classification system for UBEM input data, designed to support simulation at the urban scale and compatible with multiple modeling tools. This framework was built to accommodate actual data and drive clustering and archetype modeling, covering what UBEM tools need. The classification is articulated across five macro-categories: (i) geometrical information, (ii) envelope characteristics (both opaque and transparent elements), (iii) HVAC systems, (iv) occupancy schedules and internal gains, and (v) climate data. The collected input variables were aligned with the nomenclature, units, and syntax specified in relevant international standards, including EN ISO 52016-1 [45], EN ISO 6946 [46], EN 16798-1 [55], and UNI/TR 11552 [24].
A framework was developed and organized into a Microsoft Excel file with multiple sheets. It is divided into sub-categories, each referring to a specific macro-category. These include general information, thermal zone characteristics, building envelope characteristics, separate templates for different generation systems (gas boiler, chiller, heat pump, district heating, PV, and solar thermal panels), ventilation systems, occupancy schedules, and climatic conditions. Each sheet includes not only the variables themselves, but also metadata fields indicating standard references, uncertainty labels, and the expected acquisition method.
To ensure functional relevance and practical integration into simulation workflows, the variable selection and structure were guided by the input requirements of two complementary UBEM tools: UMI [56] and EUReCA [57]. UMI relies on the EnergyPlus [58] simulation engine, and EUReCA relies on resistance–capacitance models. They both require highly granular time-resolved input (e.g., hourly internal gains, stratigraphy of envelope components, efficiencies of HVAC systems), but with some differences. For instance, Table 1 exemplifies the differences in the inputs needed regarding natural ventilation (NV) and infiltration. Not all variables are strictly necessary for energy analysis, and some empty variables can be filled with default values in some cases. Nevertheless, from the requested UMI inputs, it is evident that the structure is based on EnergyPlus; the inputs necessary for EUReCA are fewer and easier to collect. The URBEM data model was thus developed as a superset, capable of directly assessing or easily deducing from the information the input needs of both tools, and possibly all the other tools available so far, offering both detailed and aggregated fields as needed.
Overall, this framework provides a structured, multi-layered data environment enabling consistent data integration and standardized reference building creation. Its modular and extensible nature could promote future adaptability as soon as more refined source datasets become available. It positions it as a strong candidate for a harmonized UBEM database at the national and international levels.

4.2. Acquisition and Integration of Data Sources

The second phase of the URBEM project (Figure 1) focused on the systematic identification, review, and integration of a wide range of local, regional, and national data sources, aimed at supplying the necessary input variables for UBEM modeling. The effort combined bottom-up data gathering activities with structured cataloging, forming one of the largest data inventories ever compiled for the Italian building stock in the context of energy modeling (i.e., more than 180 data owners have been listed as potential sources of information).
The starting point of this activity was the construction of a database catalogue (Table 2), which classified over one hundred datasets based on source type (e.g., EPC database, technical standard, survey), level of accessibility, digitalization status, and data granularity. The catalogue was implemented in a Microsoft Excel format using a dropdown-based schema (e.g., open access vs. restricted, digital online vs. offline vs. paper, aggregated vs. disaggregated), ensuring consistency and comparability between entries. Sources were grouped based on their spatial resolution: databases at the building level (e.g., EPCs, thermal plant registers, social housing databases) provided disaggregated data on individual constructions, while those at the district level offered aggregated indicators on neighborhoods, municipalities, or larger zones. Table 2 summarizes the main macro-categories of databases analyzed in the URBEM project, focusing on source type, accessibility, digitalization level, and data granularity. EPC databases represent a significant share, mainly regional and disaggregated, with access through online registration. Climate and geographical databases are more heterogeneous, covering multiple spatial levels and access modes, often available as open data. Smaller categories, such as district heating and natural gas distributors, are limited in number and generally provide aggregated data with restricted access. Technical standards and EU-level databases are fully digitalized but typically offer aggregated information. Overall, the dataset landscape shows a substantial prevalence of regional and local data sources, widespread digital availability, and variable accessibility conditions.
The building-level databases were of primary interest, as they contained the highest resolution data relevant to UBEM inputs (e.g., geometry, year of construction, U-values, window ratios, heating and DHW systems, and EPC classification). The regional EPC databases of Lombardy (CENED) [59], Piedmont (SIPEE) [60], Valle d’Aosta (Beauclimat) [61], and other regions, along with CURIT (the thermal plant registry of Lombardy) [62], were particularly rich. However, it was unfortunately impossible for most Italian regions to access these structured datasets. This limitation resulted in a reduced and geographically unbalanced set of final scorecards, with several areas currently underrepresented in the reference buildings library. This limitation was partially overcome, thanks to other important disaggregated sources, including municipal archives (e.g., Florence, Milan, Catania), social housing agency datasets, and university-collected surveys.
Each dataset was first reviewed in terms of coverage and variable mapping, then assessed through a quality scoring protocol. This scoring was based on the adapted TIMEPAC methodology, as presented in Section 3.3. This allowed for the classification of each variable within a dataset according to its likely reliability and potential use in later UBEM processes. Integration of these sources required resolving multiple challenges: inconsistent data formats, lack of shared identifiers, different classifications of systems or building types, and variable spatial referencing. To overcome these difficulties, a multi-step integration protocol was developed, involving standardization of field names and units, semantic alignment of categorical entries (e.g., heating system types), and probabilistic record-matching based on compound identifiers (e.g., year, surface area, zone, usage type). Where unique matching was not possible, probabilistic linkage was used and flagged accordingly.
The output of this phase was a structured dataset, enriched with traceable metadata and uncertainty annotations, ready for harmonization and statistical processing. In total, more than 60 building-level sources and over 40 district-level sources were reviewed, of which approximately 60% were successfully incorporated into the core URBEM database. Each source was archived with bibliographic details and access notes. This phase significantly contributed to reducing the uncertainty associated with large-scale energy modeling in Italy, while creating a reusable knowledge base for future applications. A limitation of the current library is the geographical imbalance, as not all regions are equally accessible. For this reason, the scorecards should be seen as a living dataset, designed to be expanded and completed as new data becomes available. Moreover, the data classification and evaluation methodology developed in this phase set a precedent for future national or regional UBEM-oriented data consolidation projects.

4.3. Data Processing and Harmonization

The third phase of the URBEM project focused on transforming raw, heterogeneous datasets into a harmonized, integrated, clean, and analyzable database suitable for statistical processing and UBEM input generation. Given the fragmented nature of the original data sources, ranging from regional EPC registries to thermal plant databases and survey datasets, this task required a rigorous and multi-layered data processing workflow.
Following the cleaning phase, a standardization process was applied to variable formats, names, units, and nomenclatures. This ensured compatibility with the previously established data framework and harmonized the syntax of inputs across sources. For categorical variables, standard lists (derived from national classifications and URBEM codebooks) were used to remap original labels, especially for system typologies and energy carriers.
Once cleaned and standardized, the dataset underwent segmentation according to a matrix of key dimensions: building use type (i.e., residential buildings, offices, schools, commercial, and restaurant buildings), decade of construction, and climate zone [63]. This tripartite classification allowed for the grouping of buildings into statistically homogeneous subsets that would later serve as the foundation for reference buildings data extraction. In line with clustering guidelines, segmentation aimed to maximize internal coherence while maintaining a statistically sufficient sample size. For each subgroup, both numerical and categorical variables were summarized and stored in a harmonized master file.
The final datasets contained tens of thousands of entries, structured into a unified Excel environment, with full traceability of source, cleaning actions, and statistical summaries. This harmonized dataset provided the statistical foundation for the reference building identification phase and enabled the reproducibility and validation of the scorecard generation process. For example, Table 3 summarizes the dataset structure used to characterize office buildings constructed before 1930 in the Lombardy region. Each macro-category represents a key dimension of building information, from administrative identifiers and geometric parameters to technical system specifications and actual energy consumption data. The “Envelope” and “Heating, Cooling, and DHW Systems” sections provide critical input for energy modeling. At the same time, the “Intervention Scenarios” category outlines potential retrofit measures and their expected impact on energy savings. In this example of offices built before 1930 in climate zone E in Lombardy, information was collected for a sample of 30 office buildings. This structured approach ensures a comprehensive assessment of both the existing building stock and the opportunities for energy efficiency improvements.
This phase not only produced a simulation-ready dataset of input values but also laid the groundwork for scalable and repeatable UBEM workflows, since its architecture allows continuous updates as new data becomes available and ensures future compatibility with probabilistic models and dynamic simulation tools.

4.4. Statistical Analysis and Clustering of Building Data

The fourth phase of the methodological workflow (Figure 1) was dedicated to extracting representative reference buildings by analyzing the harmonized dataset previously produced through data acquisition, cleaning, and segmentation. The goal of this step was to define typical configurations for each combination of building use, construction period, and climate zone. In this way, the reference buildings could capture the statistical behavior of the real stock while still being practical for energy modeling.
The analysis was organized by variable type. For numerical data, common descriptors were calculated, such as the median, standard deviation, quartiles, and interquartile range. These covered both geometric and thermophysical features (for example gross heated area, height, window-to-wall ratio, surface-to-volume ratio, and U-values), as well as system capacities and internal loads like lighting or equipment density. To make results easier to compare across reference buildings, all outputs were displayed as boxplots with uniform scales.
Categorical variables were instead examined through frequency counts. Each category, such as heating system, fuel type, or terminal units, was reported whenever it occurred, with frequencies rounded to whole numbers. This method gave a full picture of variability while still making clear which options were most common. To consolidate these statistics into a single representative configuration per reference building, a decision logic was followed, as shown in Table 4:
This approach allowed the method to stay flexible, without losing statistical soundness or physical consistency. When both statistical results and expert judgment pointed to clear patterns, clustering techniques were applied. In all other cases, the selection of values relied on transparent, rule-based logic. Alongside this, every variable was linked back to its data sources. From the metadata of the harmonized database, the three most frequently used sources were identified for each reference building. Their shares were calculated as percentages and reported directly in the scorecard. All other sources were grouped under “Others,” with the full list available in the notes. This step strengthened both transparency and traceability, while also helping to highlight regional or typological biases in the data. The outputs, statistical summaries, and clustering results were collected in structured Excel templates, making them immediately ready for the formalization stage. These datasets form the quantitative core of each reference building, giving the scorecards a solid basis in evidence and reproducible logic.

4.5. Formalization of Reference Buildings in Scorecards

4.5.1. Overview of the Scorecard Set

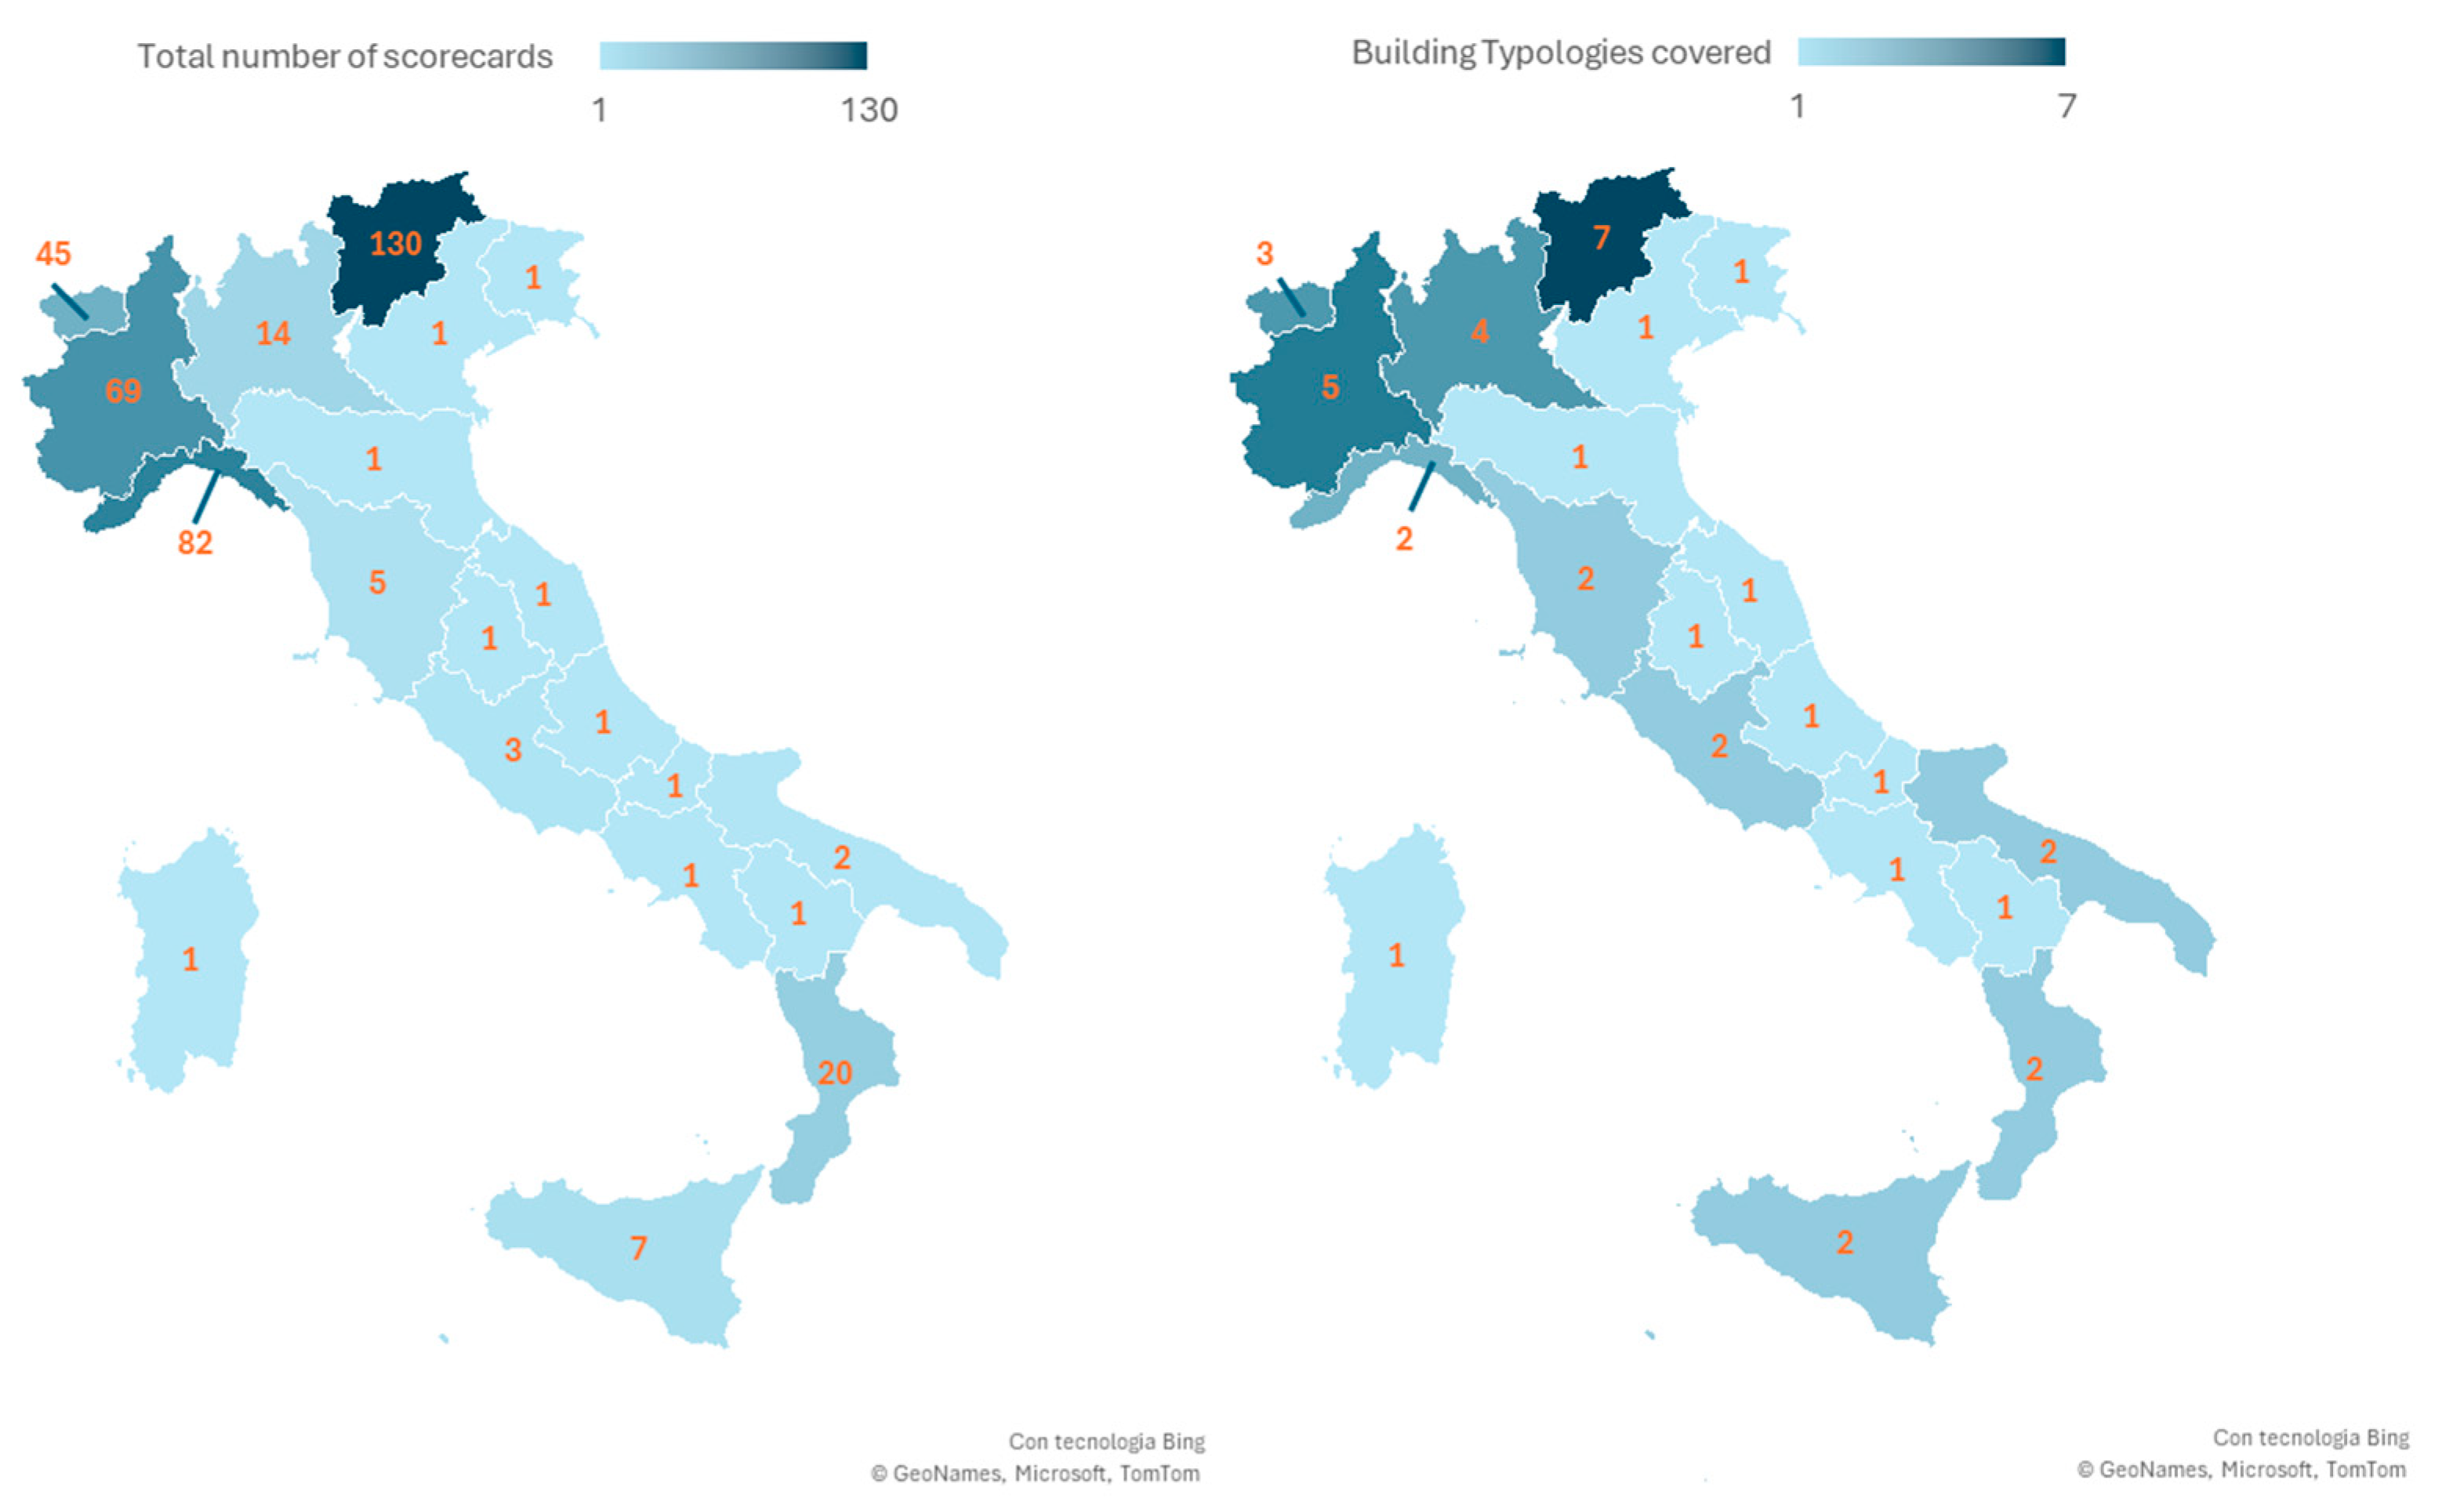
The final stage of the URBEM methodological workflow resulted in the creation of an extensive library of 380 reference building scorecards (some covering more than one subgroup), representing a wide typological and geographic spectrum of the Italian building stock (Figure 2). The dataset shows an under-representation of southern Italy, linked to current data availability, with future efforts expected to enhance regional balance. Each scorecard formalizes the statistical output from the clustering phase into a structured, standardized document, usable across Urban Building Energy Modeling (UBEM) tools.
The scorecards cover both residential and non-residential buildings, and are classified along four primary aspects:
  • Building use (i.e., residential divided into multi-family, single-family and temporary houses, office, school, commercial, and restaurant buildings);
  • Construction period (i.e., from pre-1930 to post-2011, segmented by decade or multi-decade range);
  • Climate zone (i.e., national classification [63]);
  • Geographical area, including specific regions (e.g., LOM for Lombardy, PIE for Piedmont) and grouped territories.
Each scorecard is uniquely identified by a five-part alphanumeric code, such as RES_APPBLOCK_1961-1975_E_LOM, indicating use, typology, construction period, climate zone, and region: Table 5 summarizes all codes that have been used.
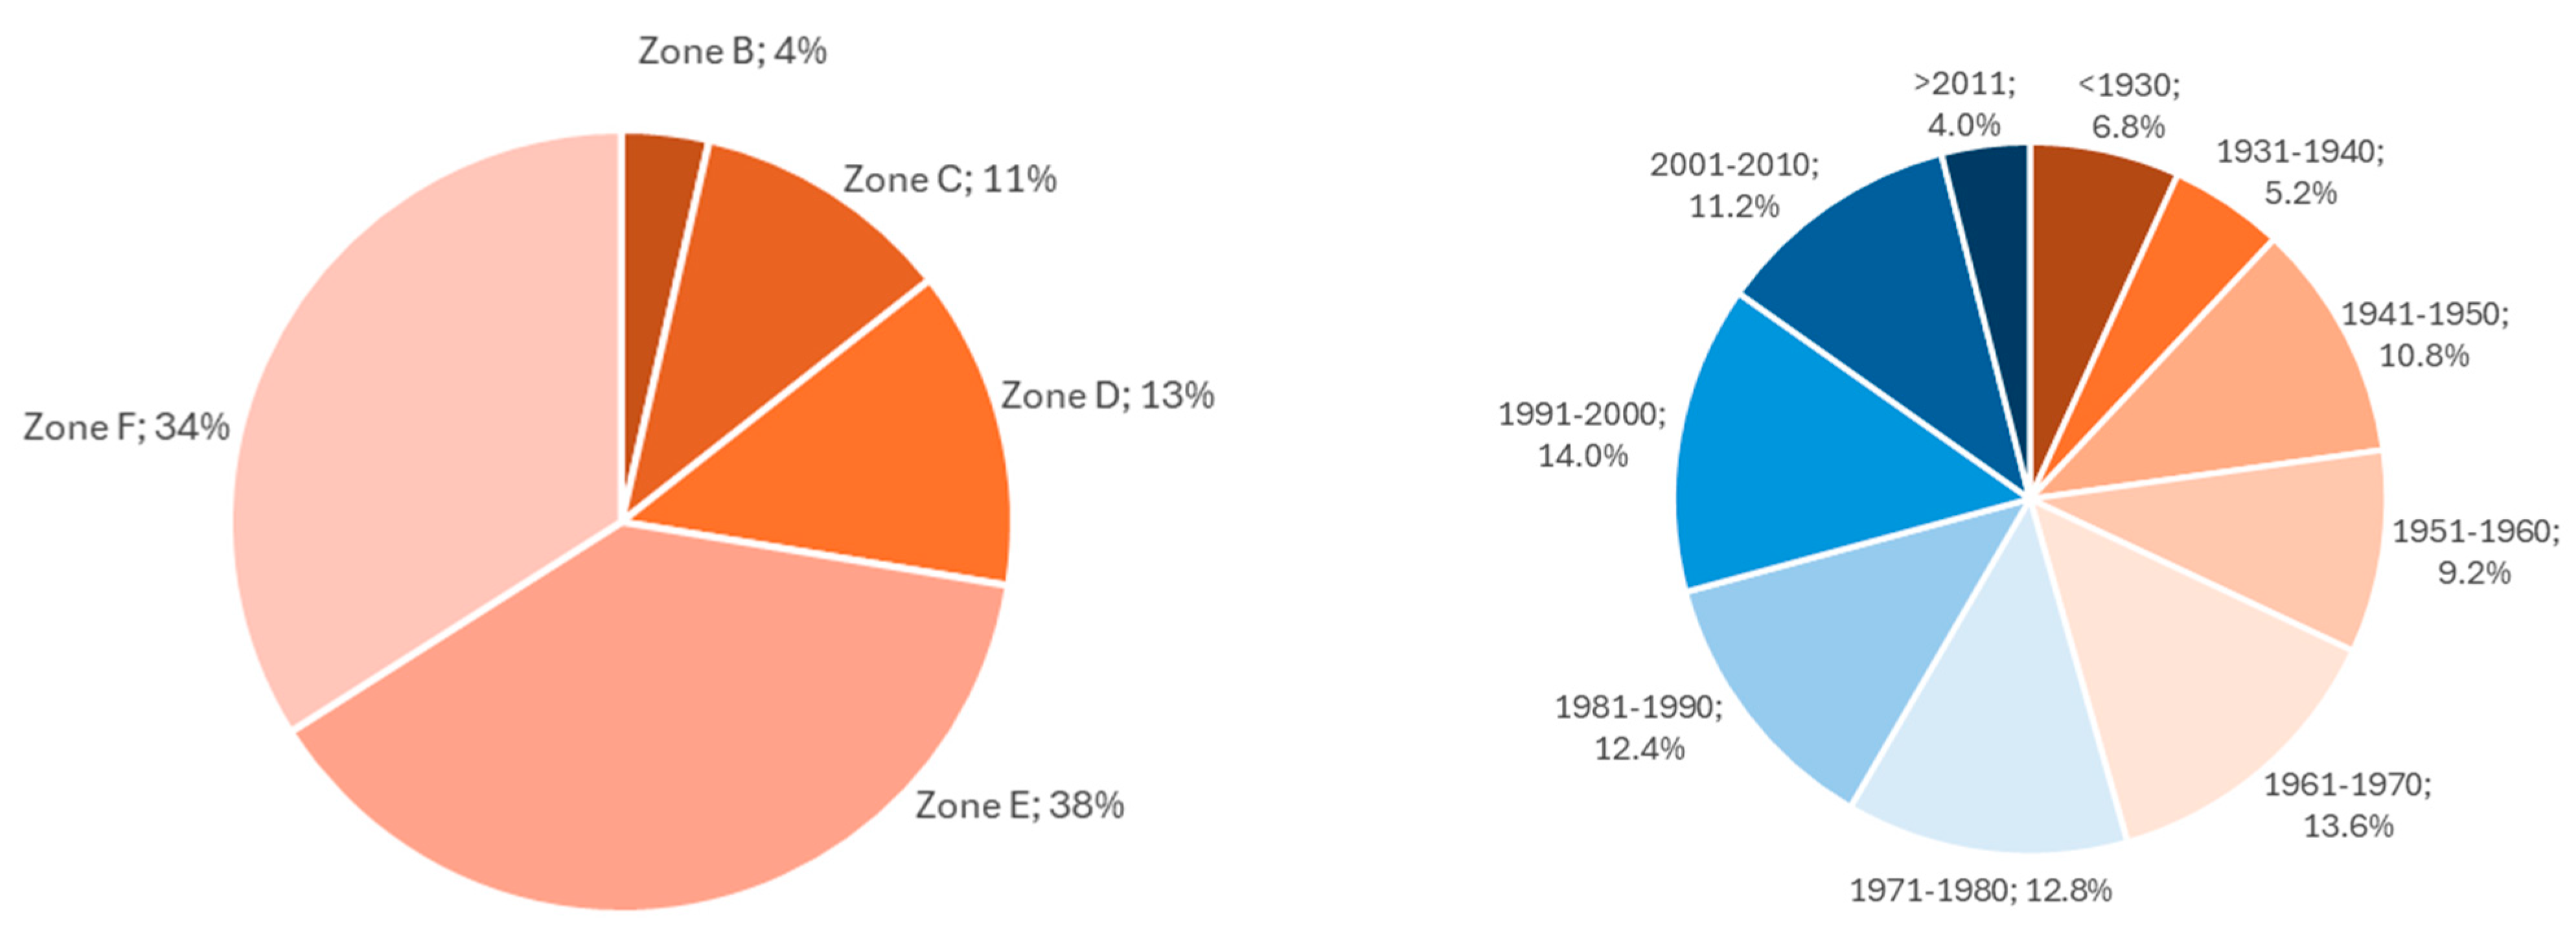
A summary of the final scorecard production by typology, climate zone, and period of construction is provided in Table 6 and Figure 3. The residential sector alone includes reference buildings for single-family houses, multi-family blocks, and buildings used for temporary accommodation. This final use comprises the highest number of scorecards, because more data were available; however, this is also in line with the overall distribution of building types in Italy, where of the total of about 14.5 million buildings, 12.2 million are residential buildings [6].
The result is a nationally harmonized reference library of reference buildings suitable for scenario analysis, energy policy design, and integration with dynamic simulation workflows.

4.5.2. Detailed Structure of a Representative Scorecard

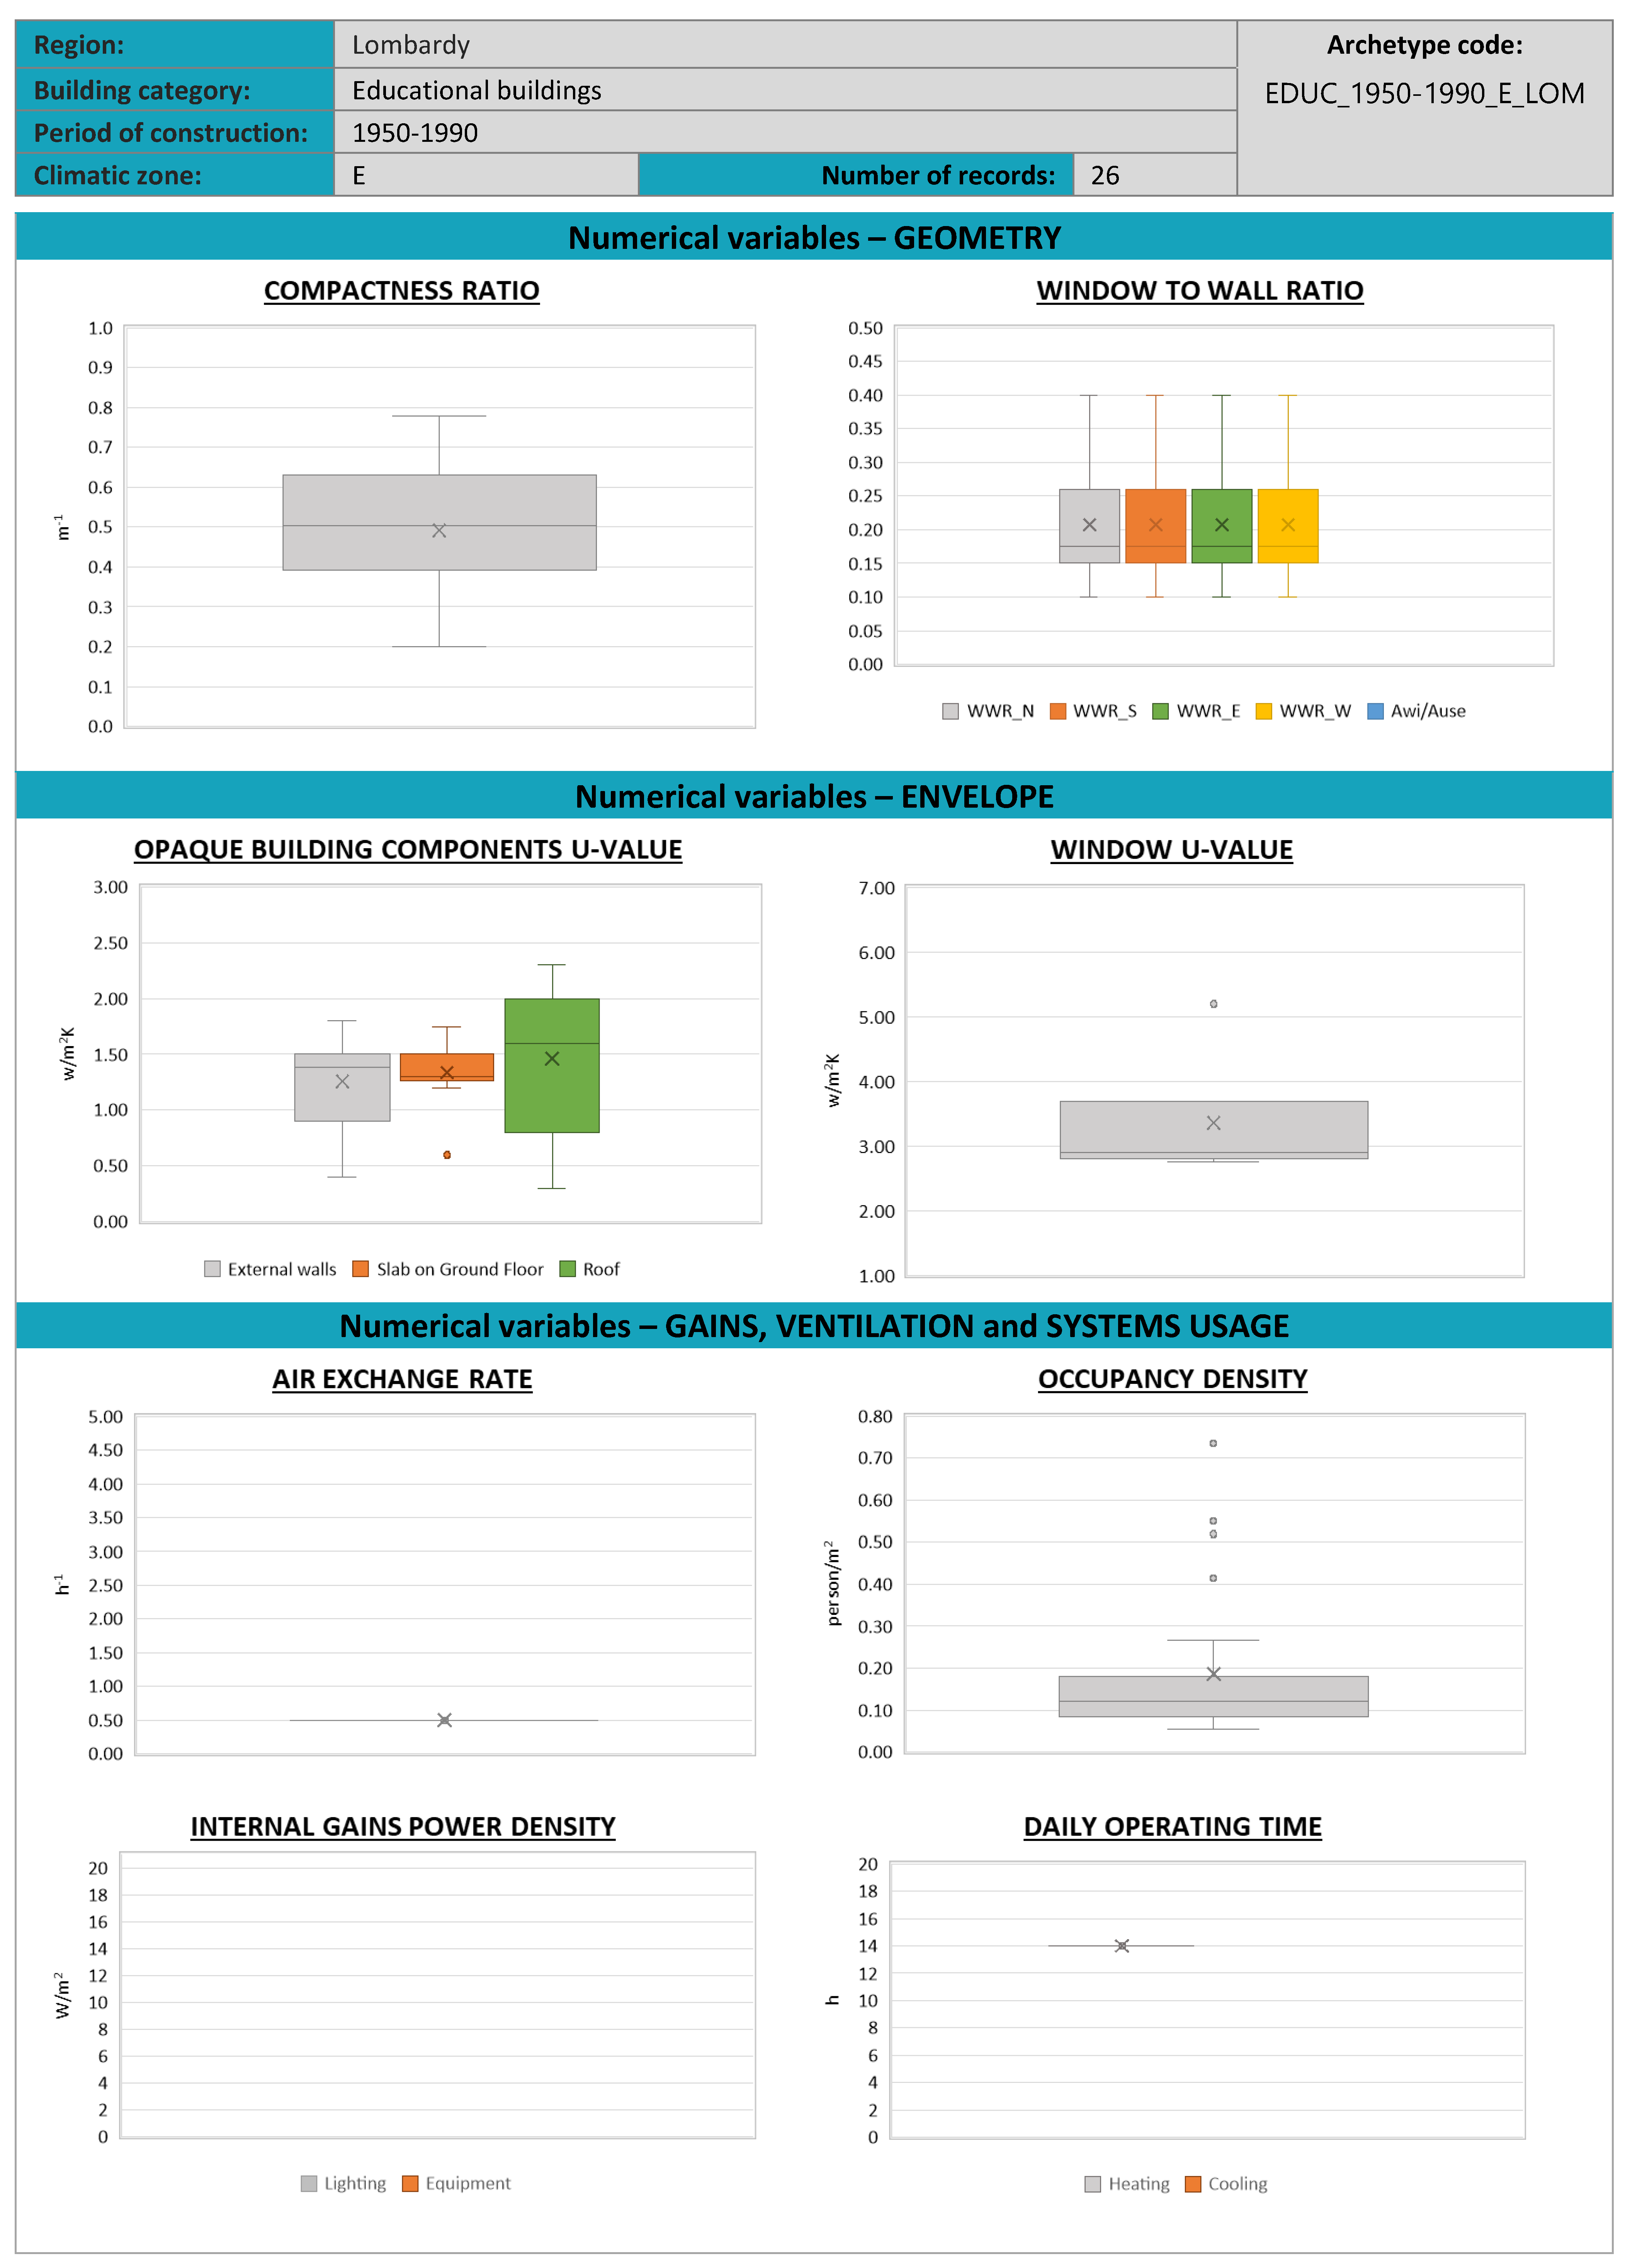
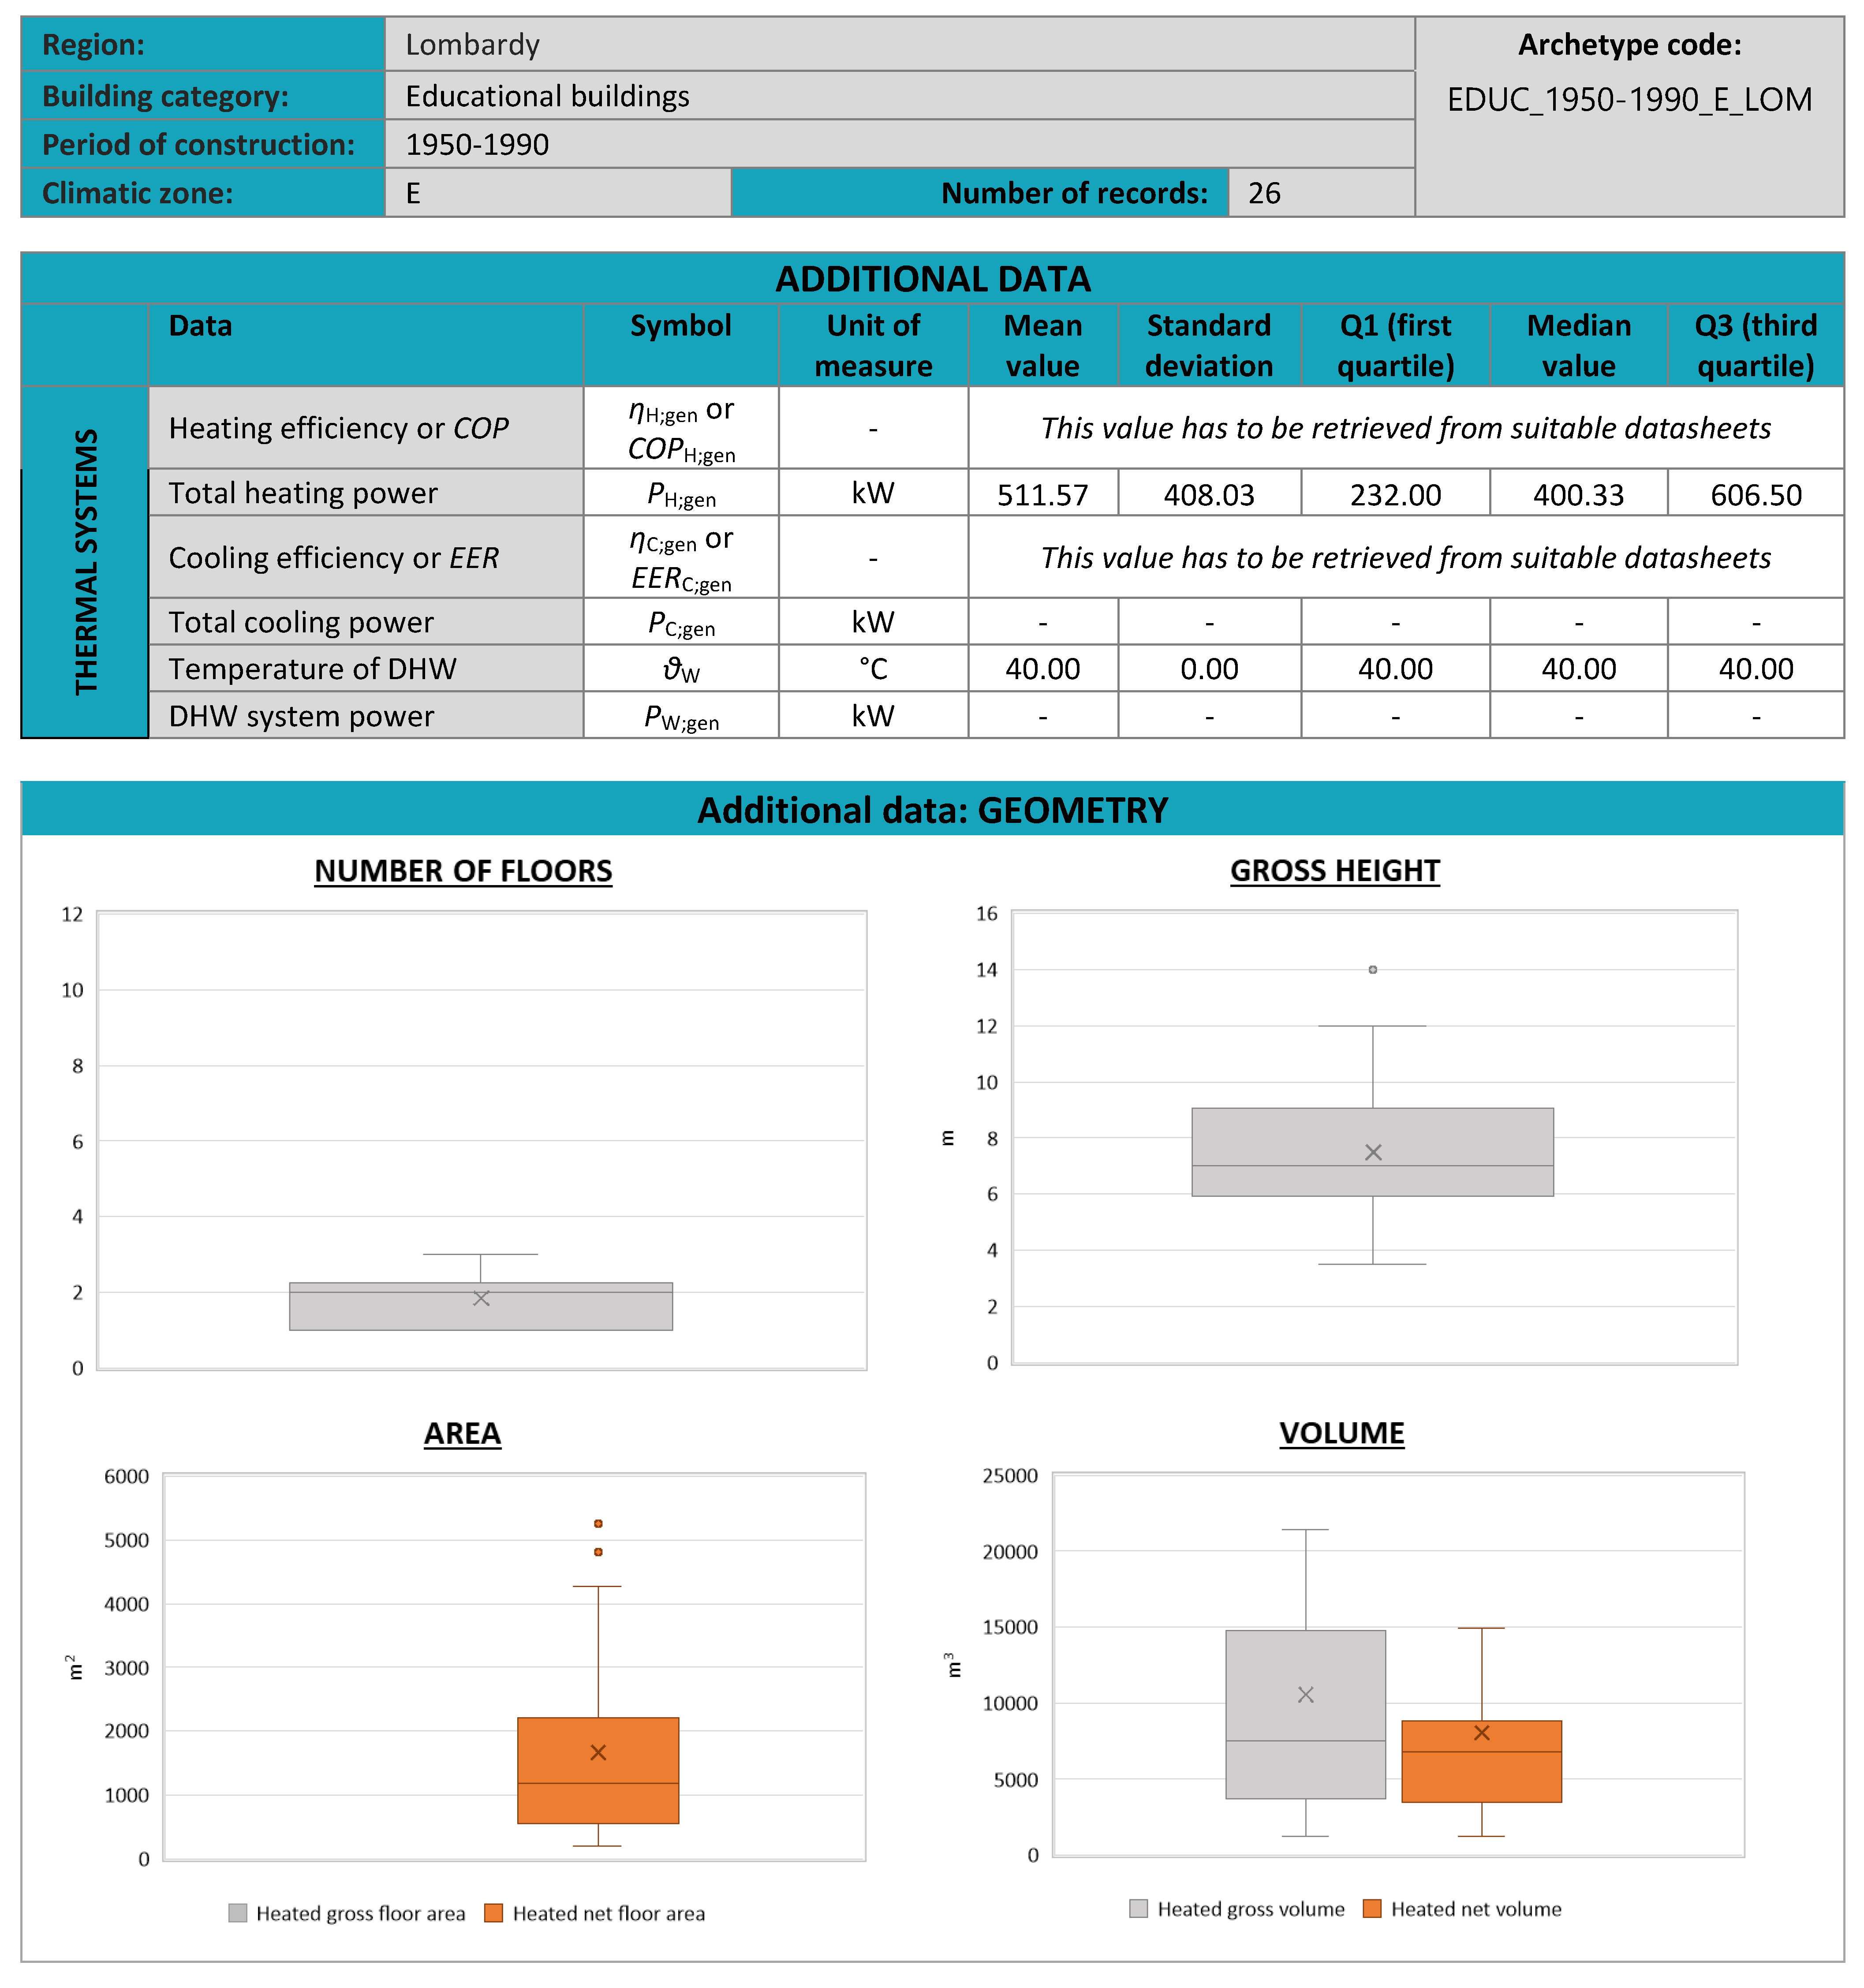
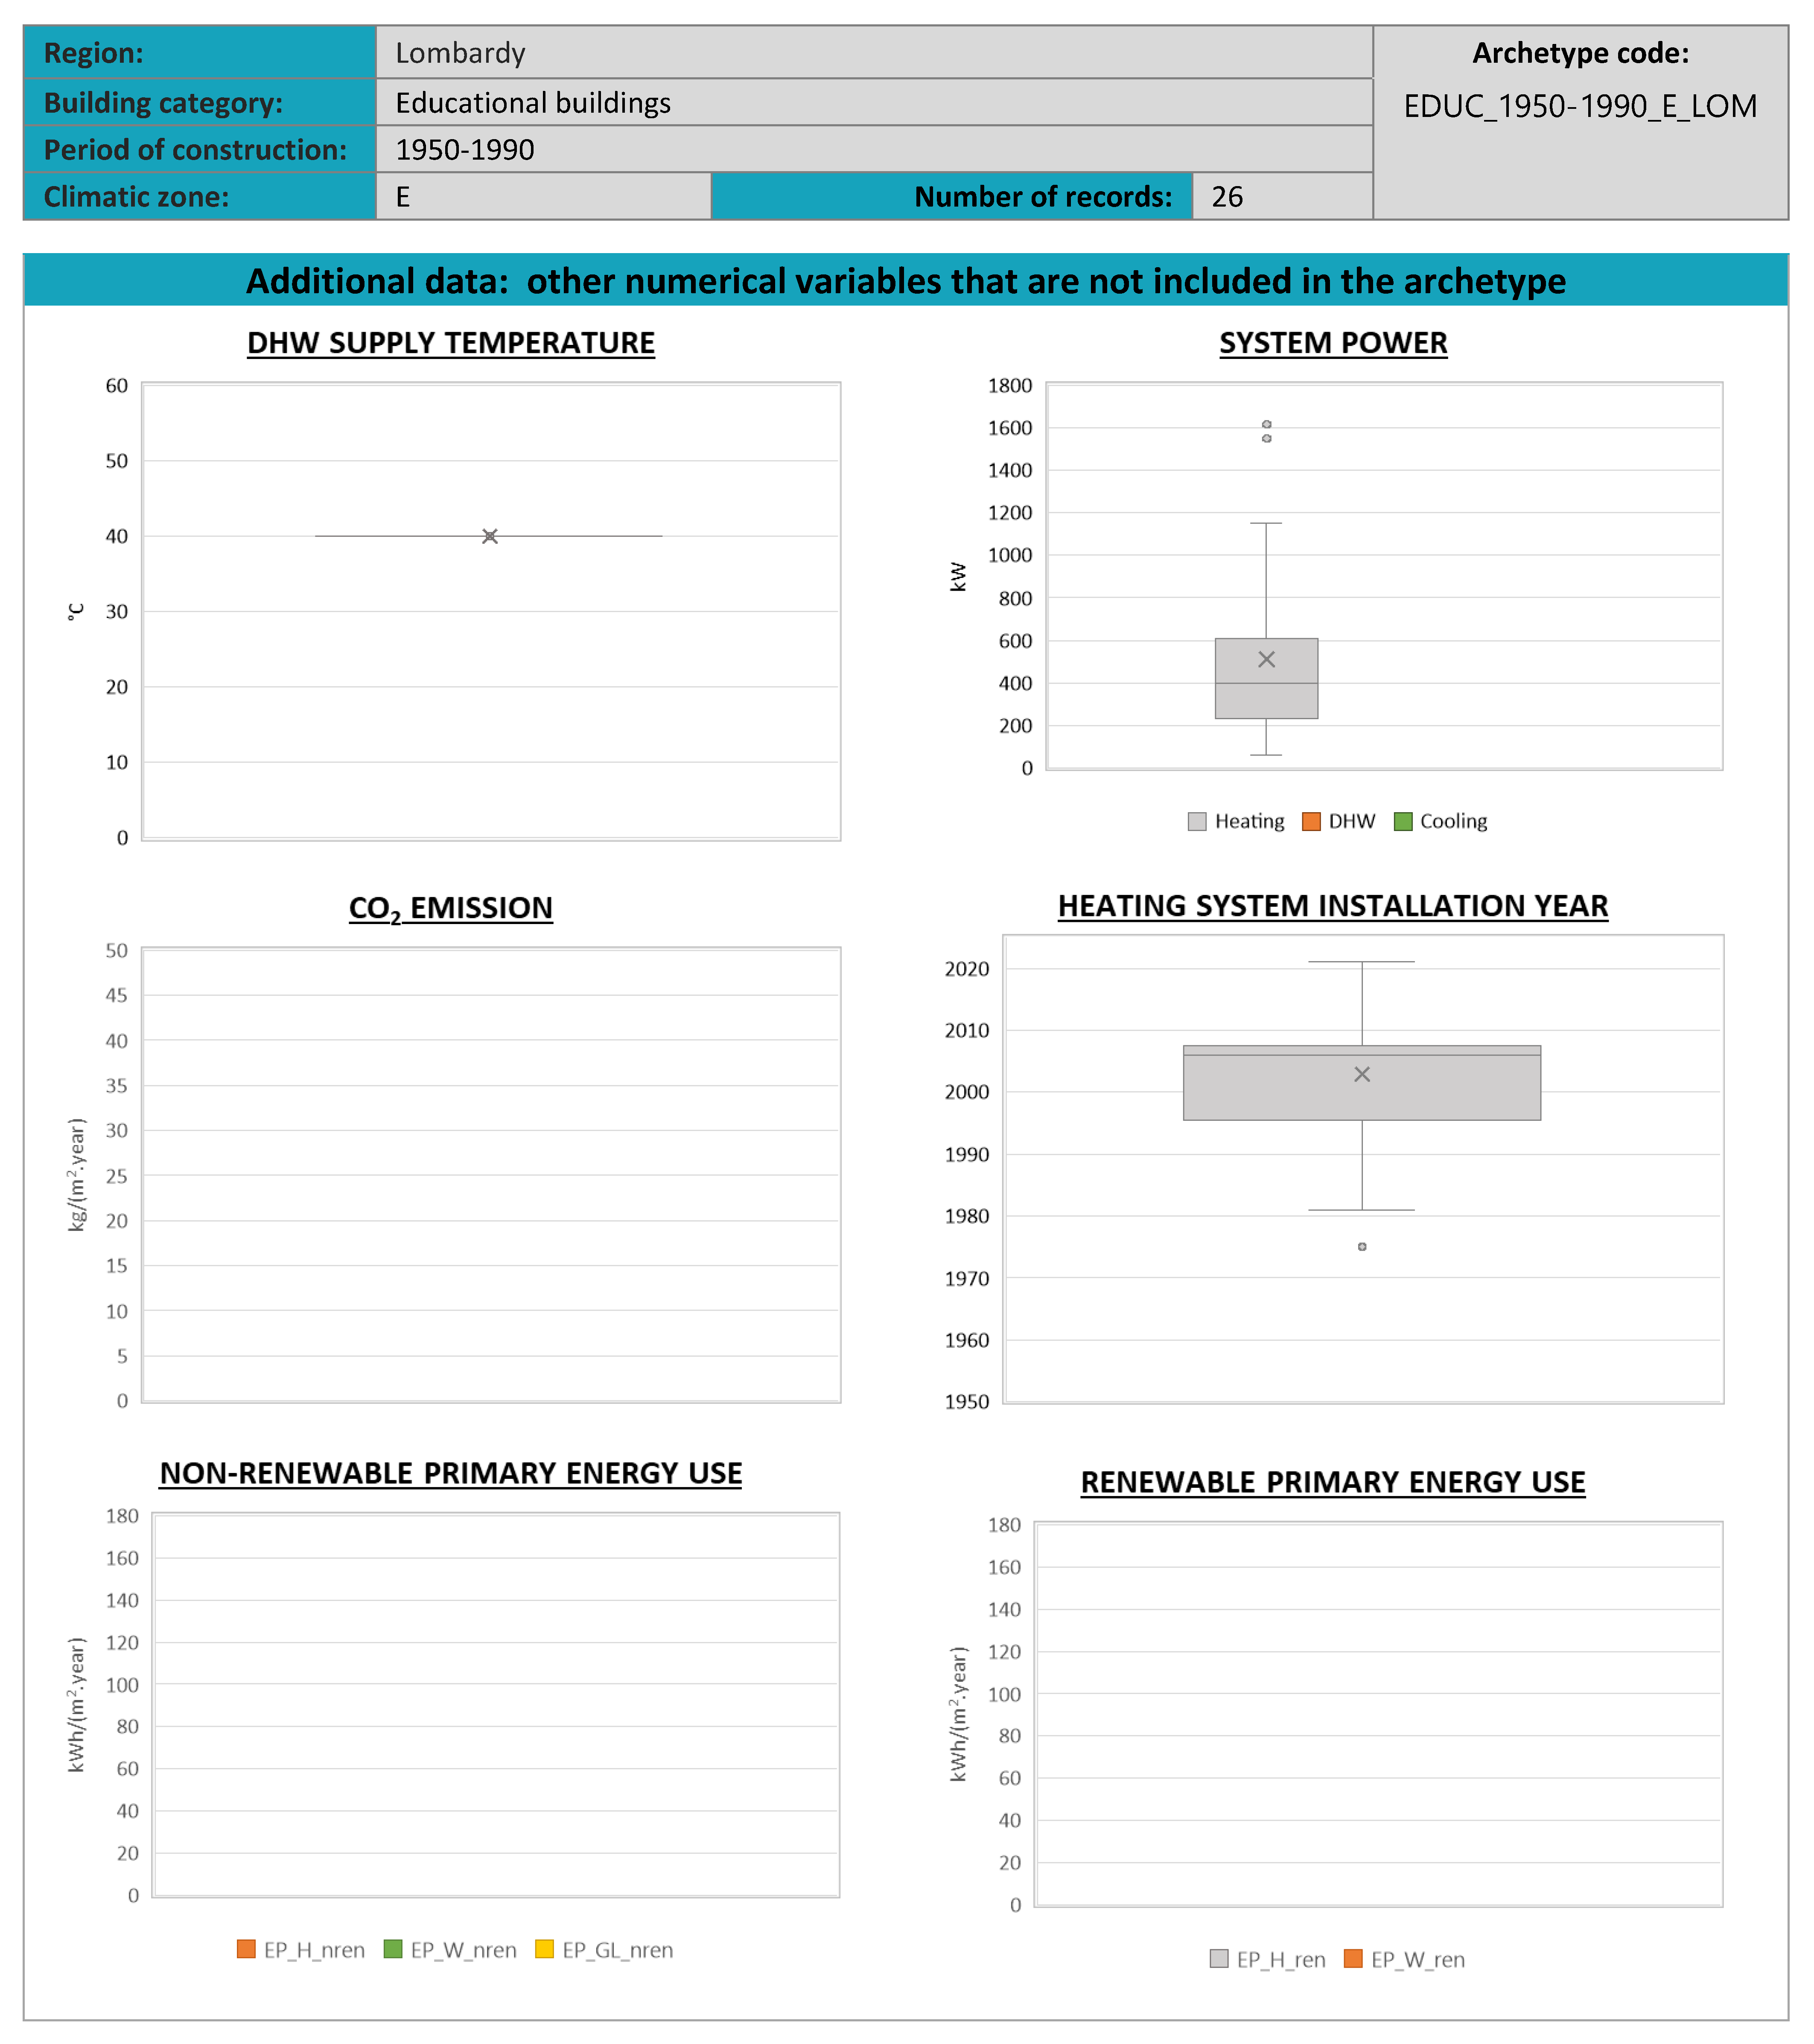
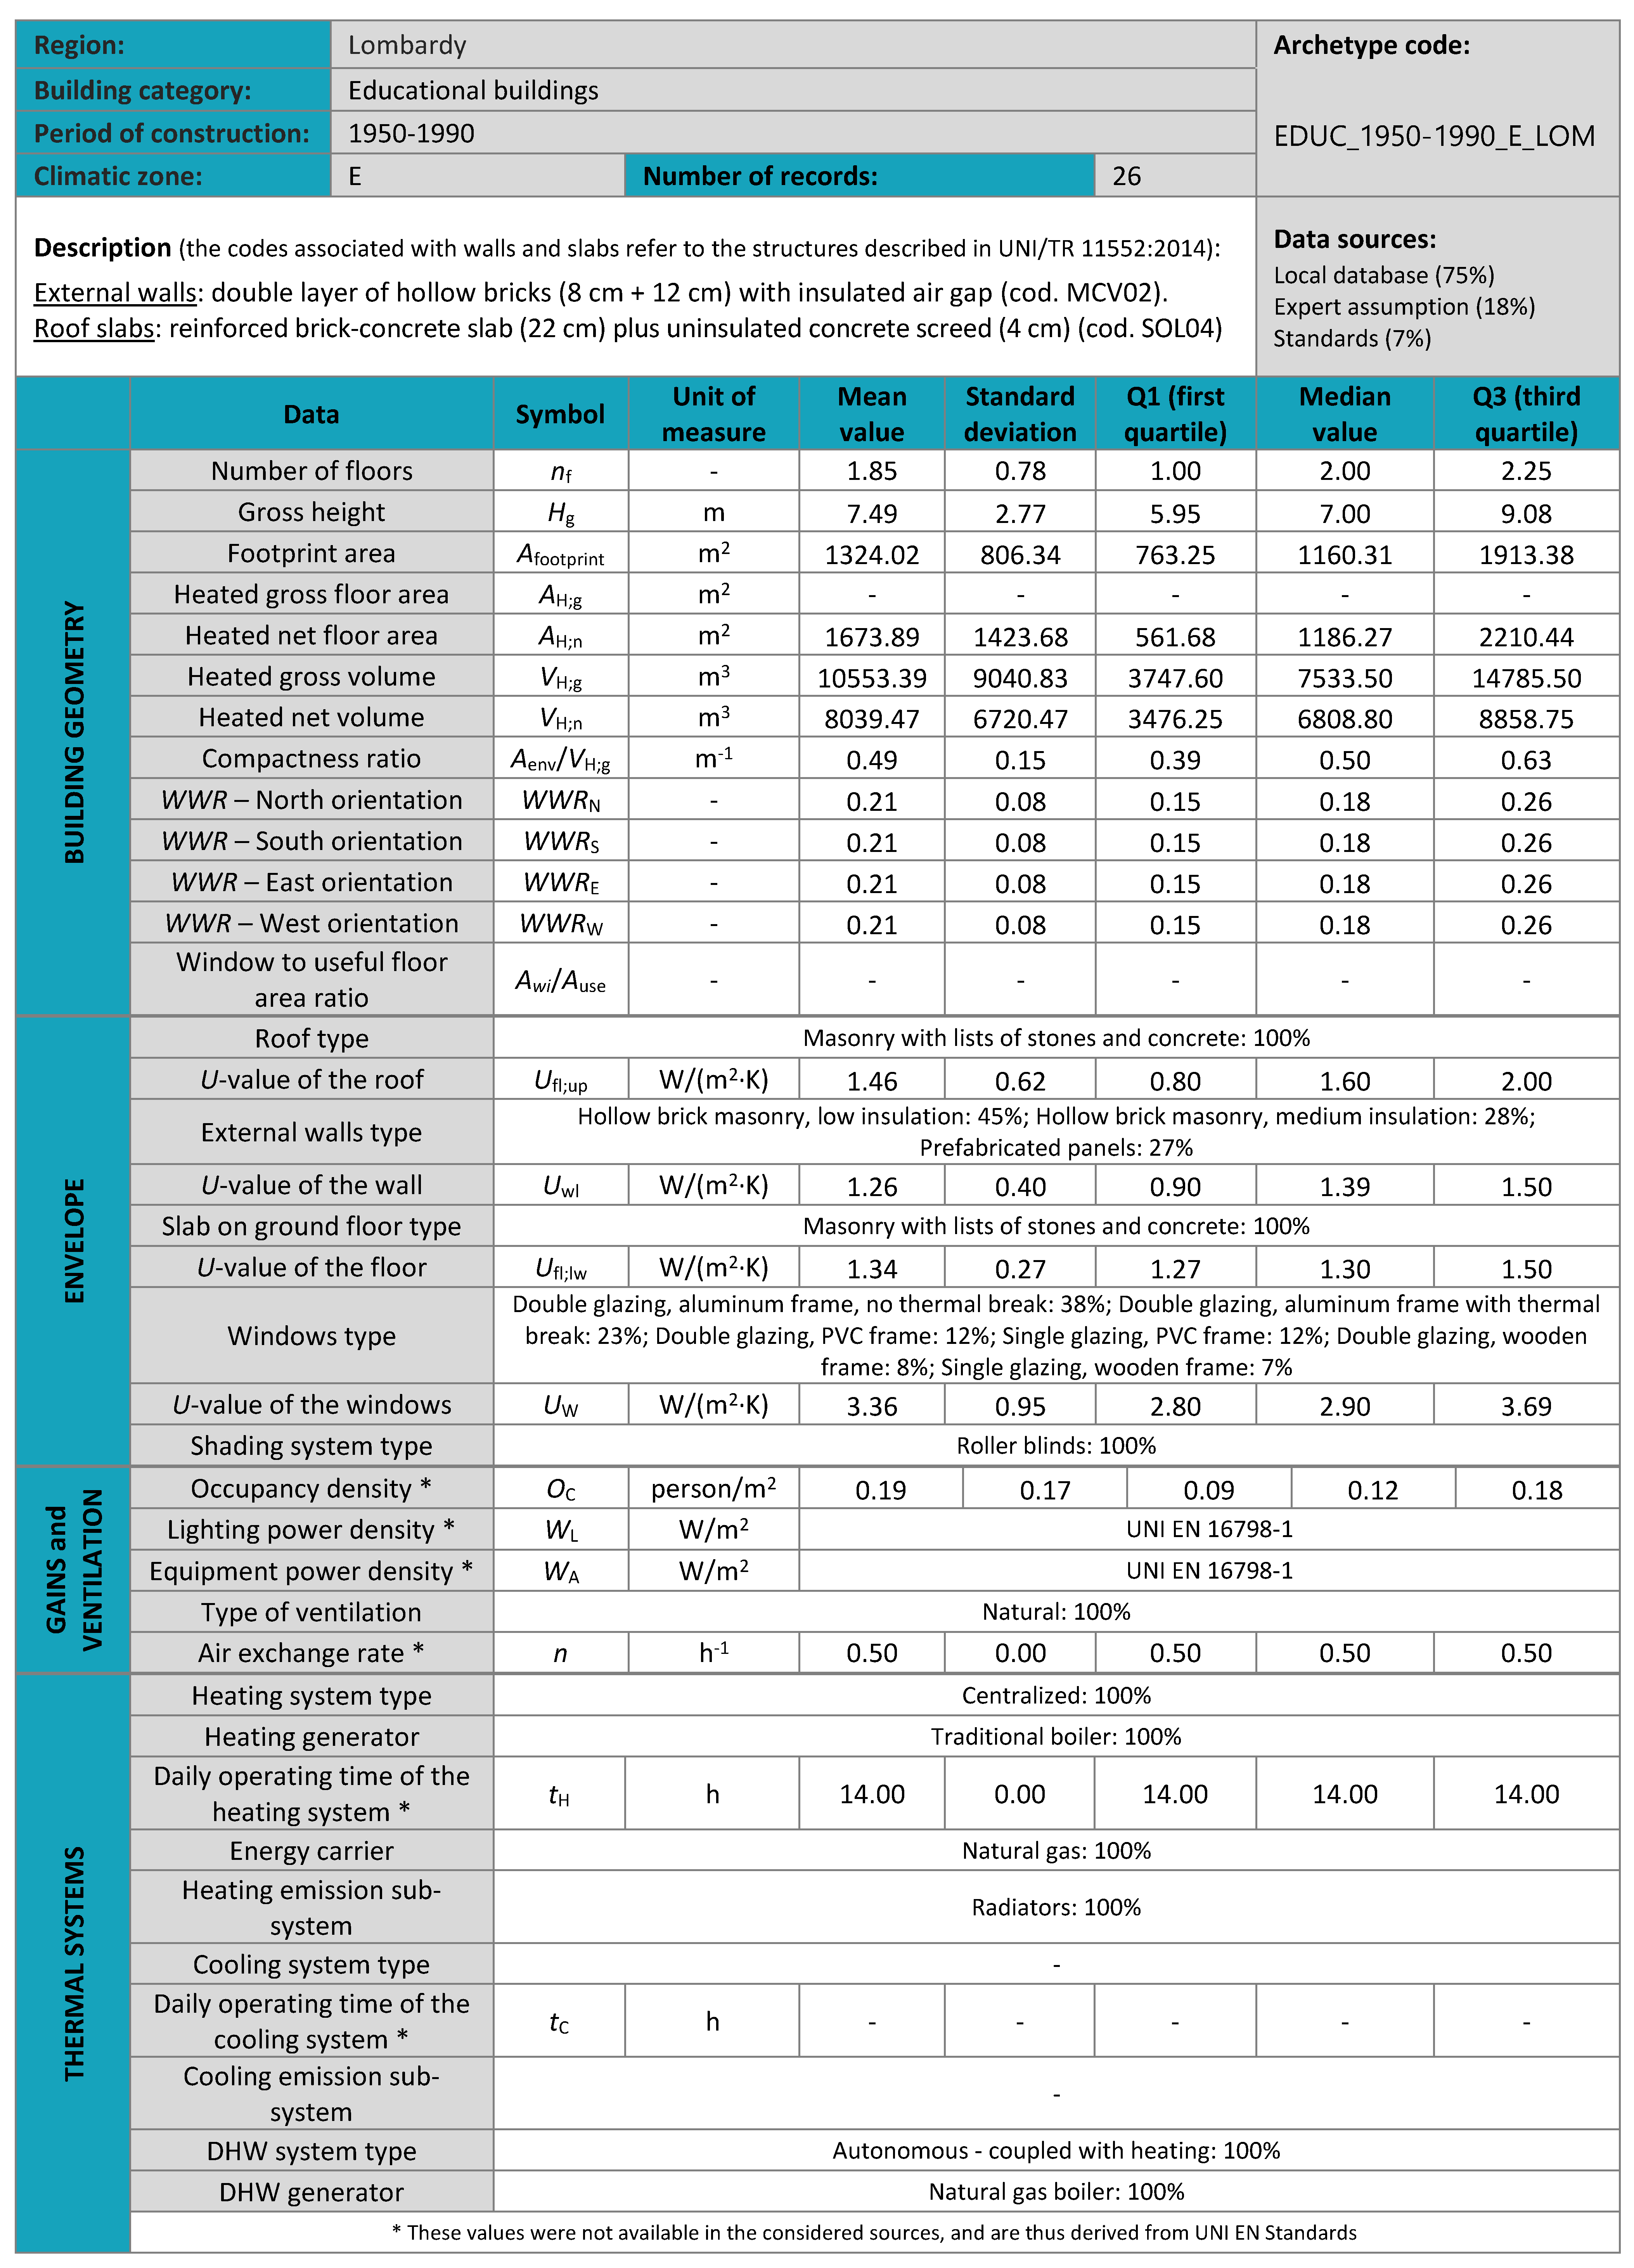
To illustrate the structure and content of the scorecards, Table 7 presents an excerpt from EDUC_1950-1990_E_LOM, a representative reference building for educational buildings in Lombardy, built between 1950 and 1990 in climate zone E. This archetype was constructed from 26 buildings and synthesizes statistical and typological data into a multi-section document.
This study does not further investigate occupancy and equipment usage schedules (e.g., appliances, occupants’ presence and actions, systems) across reference buildings, relying instead on standard schedules from normative references. These schedules are not strictly reference-building-dependent, but rather influenced by socio-economic and territorial factors, which may vary significantly even within the same building category. A possible future development is the creation of a schedule generator based on national socio-economic and geographic datasets. As a matter of fact, relevant approaches have been proposed in recent literature, including smart meter-based randomized scheduling for UBEMs [53] and occupant-centric profiles from national Time Use Surveys [64]. However, these approaches require dedicated data and methods that fall outside the scope of the present work.
The complete four-page version of this scorecard, with all the boxplots, can be found in Appendix A. The same format is used throughout the whole library of reference buildings, which makes the material clear and easy to compare. This structure also helps integrate the scorecards into planning processes, energy scenarios, and simulation platforms, while keeping every data source and normative assumption fully traceable.

4.6. Dissemination and Interoperability

The last step of the workflow dealt with sharing the results and improving the technical interoperability of the URBEM outputs. A key aim was to make sure that the reference building library could be used as a practical and accessible tool by researchers, planners, and public authorities working at different urban scales. Thus, all scorecards were made publicly available through the official project website (www.urbem.polimi.it) [4], where they can be freely consulted and downloaded in PDF format. Each scorecard presents the reference building in a fully formatted, structured document that includes statistical indicators, typological classifications, normative references, and graphical visualizations, offering a comprehensive, stand-alone resource for simulation and analysis.
The structure of the scorecards allows for straightforward manual integration into common UBEM tools. The reference buildings have been designed to be compatible with various simulation environments, such as UMI, and EUReCA, but also other well-known UBEM tools (e.g., CityBES [65], TEASER [66], CEA [67], etc.) while avoiding dependencies on proprietary formats or software.
Several case studies are currently under development across a diverse set of Italian regions and urban contexts to demonstrate the operability and real-world value of the reference buildings. These applications are being implemented using multiple modeling platforms, specifically to test the cross-platform interoperability of the scorecard data. The goal is to assess how the reference buildings perform in supporting simulations of urban energy demand, building retrofit scenarios, and energy infrastructure planning under different tools and assumptions. These ongoing case studies also aim to evaluate the practical accuracy, usability, and generalizability of the URBEM reference buildings when applied to real cities.
Rather than concluding the work of the project, the dissemination phase marks the beginning of its integration into further research and practice. The URBEM reference buildings library is intended as an evolving resource, designed for extension, continuous improvement, and to support the growing need for transparent, standardized inputs to energy modeling in cities. Through public accessibility, methodological transparency, and cross-platform adaptability, URBEM contributes to the foundation of a shared, data-driven culture in sustainable urban energy planning.

5. Conclusions and Future Outlooks

This paper has presented the URBEM project, highlighting both the methodological framework and the lessons learnt during its development. Following a six-stage process, from data classification to scorecard dissemination, the project has delivered a reproducible, transparent, and empirically grounded approach to reference buildings definition, suitable for a wide range of modeling and planning applications. The dataset brings together 380 scorecards. Each one represents a reference building that is statistically representative, described through its use, construction period, climate zone, and geographic region. Alongside numbers, the scorecards also contain categorical information, complemented with typological and regulatory references. Everything is organized in a clear and consistent layout to make the material easy to use. Together, they constitute the most comprehensive national-level reference buildings library in Italy, with immediate applicability to energy simulation environments, energy planning, and policy design. At the time of publication, the scorecards are accessible in PDF format through the official URBEM website (www.urbem.polimi.it (accessed on 11 November 2025)) [4], but the dataset structure was explicitly designed to support future digital deployment.
A crucial next step lies in applying the reference buildings in operational case studies comparing the simulation results with real energy consumption, currently underway in various Italian cities. One of the main objectives for future development is to expand coverage across all Italian regions and to complete the building use categories for each region, filling current geographical and functional gaps. It is also acknowledged that, in the current release, some parameters remain unavailable due to the limited completeness of existing databases. These attributes were deliberately left as “unknown” to ensure transparency, and the open, updatable structure of the scorecards will allow their progressive integration as new data sources become accessible. This effort will require collaboration with local authorities, regional energy agencies, and building stock operators and the collection of new data where existing databases are incomplete or inaccessible. Moreover, there is increasing interest in integrating the URBEM reference buildings with Life Cycle Assessment (LCA) data to support broader analyses of environmental impacts beyond operational energy use. The coupling of reference building-based energy simulations with embodied energy, material flows, and lifecycle emissions would allow a more comprehensive assessment of urban sustainability, aligned with circular economy, carbon neutrality, and net-zero objectives. Such integration would strengthen the ability of UBEM tools to inform decisions not only about energy performance but also about long-term environmental trade-offs and investment priorities. At present, the URBEM scorecards can support LCA applications only through coupling with external datasets, as detailed material information is available mainly for case-specific studies. Future expansions of the library may include these parameters directly to enable fully integrated environmental analyses.
In sum, the URBEM project delivers a methodology that can be replicated, a transparent data framework, and an open set of reference buildings. Together, these elements provide a solid base for developing data-driven and interoperable tools for urban energy modeling. With further refinement, testing, and broader coverage, this resource could become an important support for the transition toward climate-resilient, low-carbon, and resource-efficient cities in Italy and, potentially, across Europe. While this paper centers on the library itself, several case studies are already underway to test the scorecards within UBEM platforms. These applications will serve as validation of their reliability and as demonstrations of how they can be directly used in modeling workflows. It is important to note that validation in UBEM is particularly complex, especially with regard to reference buildings. The URBEM scorecards are descriptive constructs, derived from statistical summaries (i.e., medians, quartiles, frequency distributions) rather than deterministic models. As such, they are not validated per se: instead, they must be embedded in UBEM simulations, which are then subject to model validation against measured data. The transparency and level of detail provided in the methodology are precisely aimed at avoiding a ‘garbage-in, garbage-out’ risk, by ensuring that the reference buildings used as inputs have a demonstrable level of quality and representativeness. Ultimately, it is the modeler’s responsibility to position a given case study within the variability ranges provided by the scorecards.
In response to the RQ stated in the Introduction, the findings of this work demonstrate that: (RQ1) a harmonized methodological framework for national reference buildings can be designed through six structured phases (i.e., data classification, acquisition and integration, harmonization, statistical analysis and clustering, formalization into scorecards, and dissemination); this sequential process ensures that fragmented datasets are systematically transformed into statistically grounded and UBEM-ready reference buildings; (RQ2) the integration of heterogeneous data sources requires a clearly defined workflow combining quality assessment, cleaning, standardization, segmentation, and uncertainty labeling; these procedures enable a transparent evaluation of data provenance and ensure that only physically consistent and reliable records are used for reference building generation; (RQ3) the resulting reference building library improves transparency by providing fully traceable parameters, explicit data sources, and uncertainty labels; enhances interoperability through a standardized scorecard structure compatible with multiple UBEM tools; and strengthens scalability by enabling consistent energy analyses across different Italian regions and building uses; and (RQ4) the URBEM experience shows that developing national reference building databases requires institutional cooperation, transparent data harmonization, open-access dissemination, and methodological flexibility; these elements collectively ensure that future national and international initiatives can replicate, adapt, and expand the framework while maintaining comparability and quality across contexts.
Together, these outcomes establish a foundation for future research to expand the coverage and functionalities of reference building databases. Lessons learnt from the URBEM project can be summarized as follows:
  • Data harmonization is indispensable; fragmented and heterogeneous datasets can only become usable for UBEM if supported by transparent quality assessment protocols and systematic cleaning procedures;
  • Collaboration across institutions is crucial; universities, public agencies and local authorities must create partnerships to better integrate national, regional, and local data sources;
  • Open access enhances replicability; making the scorecards publicly available is not only an output of the project, but also a precondition for future adoption and adaptation in different contexts;
  • Flexibility is essential; methodological rules and clustering thresholds must combine statistical evidence with expert judgment, ensuring robustness and practical applicability.

Author Contributions

Conceptualization and methodology, all authors; data curation, formal analysis and investigation, M.F., A.B., M.P., L.C., N.B., M.D., F.N. and C.V.F.; funding acquisition and supervision, F.C., V.C., I.B., A.Z., G.E. and A.V.; project administration, resources and validation, M.F., F.C., V.C., I.B., A.Z., G.E. and A.V.; visualization, M.F. and G.E.; writing—original draft, M.F.; writing—review and editing, F.C., A.B., V.C., I.B., M.P., A.Z., L.C., N.B., G.E., M.D., F.N., A.V. and C.V.F. All authors have read and agreed to the published version of the manuscript.

Funding

The study was developed within the framework of the project URBEM (PRIN, code: 2020ZWKXKE), which has received funding from the Italian Ministry of University and Research (MUR). Website: www.urbem.polimi.it (accessed on 12 October 2025). Linkedin: www.linkedin.com/company/urbem-prin2020 (accessed on 12 October 2025).

Data Availability Statement

The data presented in this study are openly available in [URBEM] at [https://www.urbem.polimi.it/en/repository/], accessed on 1 August 2025.

Acknowledgments

We want to acknowledge the following persons and universities that contributed to the success of the project: Livio Mazzarella and Matilde Chierici of Politecnico di Milano; Fabio Sciurpi, Cristina Carletti and Leone Pierangioli from Università degli Studi di Firenze; Anna Magrini from Università degli Studi di Pavia; Antonino Di Bella and Enrico Prataviera from Università di Padova; Piercarlo Romagnoni and Lorenzo Teso from Università Iuav di Venezia; Francesco Nocera and Vincenzo Costanzo from Università di Catania; Sandra Corasaniti, Ivano Petracci and Gaia Gasparri from Università degli Studi di Roma ‘Tor Vergata’. Moreover, during the preparation of this manuscript, the authors used ChatGPT 5.1 for the purposes of improving the language. The authors have reviewed and edited the output and take full responsibility for the content of this publication.

Conflicts of Interest

The authors declare no conflicts of interest.

Appendix A. Full Scorecard EDUC_1950-1990_E_LOM
Energies 18 06026 i001
Energies 18 06026 i002
Energies 18 06026 i003
Energies 18 06026 i004

References

  1. United Nations About the Sustainable Development Goals—United Nations Sustainable Development. Available online: https://www.un.org/sustainabledevelopment/sustainable-development-goals/ (accessed on 4 March 2019).
  2. IEA. 2018 Global Status Report; IEA: Paris, France, 2018; ISBN 978-92-807-3729-5. [Google Scholar]
  3. Breda, M.A. La Tua Casa: Atlante Del Patrimonio Residenziale Pubblico del Comune di Milano; Spa, M., Ed.; Ufficio Comunicazione MM: Milano, Italy, 2016; ISBN 978-88-908224-1-4. [Google Scholar]
  4. Politecnico di Milano URBEM—Urban Reference Buildings for Energy Modelling. Available online: https://www.urbem.polimi.it/ (accessed on 7 January 2025).
  5. Corrado, V.; Ballarini, I.; Corgnati, S.P. Typology Approach for Building Stock: National Scientific Report on the TABULA Activities in Italy; Politecnico di Torino – Dipartimento Energia: Torino, Italy, 2012; ISBN 9788882020392. [Google Scholar]
  6. Istat Edifici. Available online: http://dati-censimentopopolazione.istat.it/Index.aspx?DataSetCode=DICA_EDIFICI1 (accessed on 20 May 2025).
  7. Ferrando, M.; Causone, F.; Hong, T.; Chen, Y. Urban Building Energy Modeling (UBEM) Tools: A State-of-the-Art Review of Bottom-up Physics-Based Approaches. Sustain. Cities Soc. 2020, 62, 102408. [Google Scholar] [CrossRef]
  8. Hong, T.; Chen, Y.; Luo, X.; Luo, N.; Lee, S.H. Ten Questions on Urban Building Energy Modeling. Build. Environ. 2020, 168, 106508. [Google Scholar] [CrossRef]
  9. Wang, C.; Ferrando, M.; Causone, F.; Jin, X.; Zhou, X.; Shi, X. Data Acquisition for Urban Building Energy Modeling: A Review. Build. Environ. 2022, 217, 109056. [Google Scholar] [CrossRef]
  10. Sood, D.; Alhindawi, I.; Ali, U.; Mcgrath, J.; Byrne, M.; Donnell, J.O. Development of Occupancy-Based Multi-Scale Building Archetypes. In Proceedings of the REHVA 14th HVAC World Congress, Rotterdam, The Netherlands, 22–25 May 2022; pp. 1–8. [Google Scholar]
  11. Kim, E.J.; Plessis, G.; Hubert, J.L.; Roux, J.J. Urban Energy Simulation: Simplification and Reduction of Building Envelope Models. Energy Build. 2014, 84, 193–202. [Google Scholar] [CrossRef]
  12. Chen, D.; Member, S.; Kalra, S.; Member, S.; Irwin, D.; Shenoy, P.; Albrecht, J. Preventing Occupancy Detection From Smart Meters. IEEE Trans. Smart Grid 2015, 6, 2426–2434. [Google Scholar] [CrossRef]
  13. Yi, C.Y.; Peng, C. An Archetype-in-Neighbourhood Framework for Modelling Cooling Energy Demand of a City’s Housing Stock. Energy Build. 2019, 196, 30–45. [Google Scholar] [CrossRef]
  14. Buttitta, G.; Turner, W.; Finn, D. Clustering of Household Occupancy Profiles for Archetype Building Models. Energy Procedia 2017, 111, 161–170. [Google Scholar] [CrossRef]
  15. Famuyibo, A.A.; Duffy, A.; Strachan, P. Developing Archetypes for Domestic Dwellings—An Irish Case Study. Energy Build. 2012, 50, 150–157. [Google Scholar] [CrossRef]
  16. Pasichnyi, O.; Wallin, J.; Kordas, O. Data-Driven Building Archetypes for Urban Building Energy Modelling. Energy 2019, 181, 360–377. [Google Scholar] [CrossRef]
  17. Monteiro, C.S.; Pina, A.; Cerezo, C.; Reinhart, C.; Ferrão, P. The Use of Multi-Detail Building Archetypes in Urban Energy Modelling. Energy Procedia 2017, 111, 817–825. [Google Scholar] [CrossRef]
  18. Corrado, V. Politecnico di Torino Welcome at TABULA. Available online: https://episcope.eu/building-typology/tabula-webtool/ (accessed on 3 December 2018).
  19. Stein, B. IEE Project EPISCOPE. Available online: http://episcope.eu/iee-project/episcope/ (accessed on 3 December 2018).
  20. Loga, T.; Stein, B.; Diefenbach, N. TABULA Building Typologies in 20 European Countries—Making Energy-Related Features of Residential Building Stocks Comparable. Energy Build. 2016, 132, 4–12. [Google Scholar] [CrossRef]
  21. Ballarini, I.; Corgnati, S.P.; Corrado, V. Use of Reference Buildings to Assess the Energy Saving Potentials of the Residential Building Stock: The Experience of TABULA Project. Energy Policy 2014, 68, 273–284. [Google Scholar] [CrossRef]
  22. Carnieletto, L.; Ferrando, M.; Teso, L.; Sun, K.; Zhang, W.; Causone, F.; Romagnoni, P.; Zarrella, A.; Hong, T. Italian Prototype Building Models for Urban Scale Building Performance Simulation. Build. Environ. 2021, 192, 107590. [Google Scholar] [CrossRef]
  23. UNI/TS 11300-1; Energy Performance of Buildings—Part 1: Evaluation of Energy Need for Space Heating and Cooling. UNI Ente Nazionale Italiano di Unificazione: Milano, Italy, 2014.
  24. UNI/TR 11552; Abaco Delle Strutture Costituenti l’involucro Opaco Degli Edifici Parametri Termofisici. UNI Ente Nazionale Italiano di Unificazione: Milano, Italy, 2014.
  25. Wolk, S.; Reinhart, C. Semantic Building Energy Modeling: Analysis across Geospatial Scales. Build. Environ. 2025, 276, 112883. [Google Scholar] [CrossRef]
  26. Li, X.; Yao, R.; Liu, M.; Costanzo, V.; Yu, W.; Wang, W.; Short, A.; Li, B. Developing Urban Residential Reference Buildings Using Clustering Analysis of Satellite Images. Energy Build. 2018, 169, 417–429. [Google Scholar] [CrossRef]
  27. Dahlström, L.; Johari, F.; Broström, T.; Widén, J. Identification of Representative Building Archetypes: A Novel Approach Using Multi-Parameter Cluster Analysis Applied to the Swedish Residential Building Stock. Energy Build. 2024, 303, 113823. [Google Scholar] [CrossRef]
  28. Energy Performance of Buildings Directive. Available online: https://energy.ec.europa.eu/topics/energy-efficiency/energy-performance-buildings/energy-performance-buildings-directive_en (accessed on 30 September 2025).
  29. Vimmr, T.; Loga, T.; Diefenbach, N.; Stein, B.; Bachová, L. Tabula-Residential Building Typologies in 12 European Countries-Good Practice Example from the Czech Republic. In Proceedings of the CESB 2013 PRAGUE—Central Europe Towards Sustainable Building 2013: Sustainable Building and Refurbishment for Next Generations, Prague, Czech Republic, 26–28 June 2013; pp. 813–816. [Google Scholar]
  30. Kazas, G.; Fabrizio, E.; Perino, M. Energy Demand Profile Generation with Detailed Time Resolution at an Urban District Scale: A Reference Building Approach and Case Study. Appl. Energy 2017, 193, 243–262. [Google Scholar] [CrossRef]
  31. Kristensen, M.H.; Hedegaard, R.E.; Petersen, S. Hierarchical Calibration of Archetypes for Urban Building Energy Modeling. Energy Build. 2018, 175, 219–234. [Google Scholar] [CrossRef]
  32. Kneifel, J.D. Prototype Residential Buildings for Energy and Sustainability Assessment; NIST Technical Note 1688; 2011. Available online: https://www.govinfo.gov/content/pkg/GOVPUB-C13-62e7b62cbfe928a5286489f58d284afb/pdf/GOVPUB-C13-62e7b62cbfe928a5286489f58d284afb.pdf (accessed on 1 August 2025).
  33. Le Hong, Z.; Berzolla, Z.; Reinhart, C. The More the Better? Archetype Segmentation in Urban Building Energy Modelling. J. Phys. Conf. Ser. 2023, 2600, 082004. [Google Scholar] [CrossRef]
  34. Molina, C.; Kent, M.; Hall, I.; Jones, B. A Data Analysis of the Chilean Housing Stock and the Development of Modelling Archetypes. Energy Build. 2020, 206, 109568. [Google Scholar] [CrossRef]
  35. U.S. Department of Energy Commercial Reference Buildings. Available online: https://www.energy.gov/eere/buildings/commercial-reference-buildings (accessed on 1 August 2025).
  36. GitHub—Canmet-Energy/Housing-Archetypes: Library of Canadian Housing Archetypes for Use in Energy Modelling. Available online: https://github.com/canmet-energy/housing-archetypes?utm_source=chatgpt.com (accessed on 23 October 2025).
  37. Huang, H.; Zhu, K.; Lin, X.; Asdrubali, F.; Huang, H.; Zhu, K.; Lin, X. Research on Formulating Energy Benchmarks for Various Types of Existing Residential Buildings from the Perspective of Typology: A Case Study of Chongqing, China. Buildings 2023, 13, 1346. [Google Scholar] [CrossRef]
  38. Construction Assemblies Used in 48 Building Archetypes Representing the Current Building Stock of the City of Melbourne, Australia. Available online: https://figshare.com/articles/dataset/Construction_assemblies_used_in_48_building_archetypes_representing_the_current_building_stock_of_the_City_of_Melbourne_Australia/3464096?utm_source=chatgpt.com&file=5449496 (accessed on 23 October 2025).
  39. Chen, Y.; Hong, T. Impacts of Building Geometry Modeling Methods on the Simulation Results of Urban Building Energy Models. Appl. Energy 2018, 215, 717–735. [Google Scholar] [CrossRef]
  40. Mastrucci, A.; Baume, O.; Stazi, F.; Leopold, U. Estimating Energy Savings for the Residential Building Stock of an Entire City: A GIS-Based Statistical Downscaling Approach Applied to Rotterdam. Energy Build. 2014, 75, 358–367. [Google Scholar] [CrossRef]
  41. Remmen, P.; Schäfer, J.; Müller, D. Refinement of Dynamic Non-Residential Building Archetypes Using Measurement Data and Bayesian Calibration. In Proceedings of the Building Simulation 2019: 16th Conference of IBPSA, Rome, Italy, 2–4 September 2019; Volume 16, pp. 4682–4689. [Google Scholar] [CrossRef]
  42. UNI/TS 11300-2; Energy Performance of Buildings—Part 2: Determination of Primary Energy Demand and Efficiencies for Space Heating, Domestic Hot Water Production, Ventilation and Lighting. UNI Ente Nazionale Italiano di Unificazione: Milano, Italy, 2014.
  43. UNI/TS 11300-3; Energy Performance of Buildings—Part 3: Determination of Primary Energy Demand and Efficiencies for Cooling Generation and Air Conditioning Systems. UNI Ente Nazionale Italiano di Unificazione: Milano, Italy, 2010.
  44. UNI/TS 11300-4; Energy Performance of Buildings—Part 4: Renewable Energy Generation and Other Generation Systems for Space Heating, Domestic Hot Water, Ventilation and Cooling. UNI Ente Nazionale Italiano di Unificazione: Milano, Italy, 2014.
  45. UNI EN ISO 52016-1; Prestazione Energetica Degli Edifici—Fabbisogni Energetici per Riscaldamento e Raffrescamento, Temperature Interne e Carichi Termici Sensibili e Latenti—Parte 1: Procedure Di Calcolo. UNI—Ente Italiano di Normazione: Milano, Italy, 2018.
  46. UNI EN ISO 6946; Componenti Ed Elementi per Edilizia—Resistenza Termica e Trasmittanza Termica—Metodi Di Calcolo. UNI—Ente Italiano di Normazione: Milano, Italy, 2018.
  47. Piro, M.; Bianco Mauthe Degerfeld, F.; Ballarini, I.; Corrado, V. The Challenges for a Holistic, Flexible and through-Life Updated Energy Performance Certificate. Sustain. Energy Technol. Assess. 2024, 69, 103922. [Google Scholar] [CrossRef]
  48. Ballarini, I.; Piro, M.; Tootkaboni, M.P. Procedures and Services to Undertake Large-Scale Statistical Analysis of EPCs Databases. 2023. Available online: https://timepac.eu/wp-content/uploads/2024/05/2024-05-03-TIMEPAC_Factsheet_TDS5.pdf (accessed on 1 August 2025).
  49. Piech Chris K Means. Available online: http://stanford.edu/~cpiech/cs221/handouts/kmeans.html (accessed on 1 July 2018).
  50. Nielsen, F. Chapter 8: Hierarchical Clustering. In Introduction to HPC with MPI for Data Science; Springer International Publishing: Berlin/Heidelberg, Germany, 2016; p. 282. ISBN 978-3-319-21902-8. [Google Scholar]
  51. Banfi, A.; Ferrando, M.; Li, P.; Shi, X.; Causone, F. Integrating Occupant Behaviour into Urban-Building Energy Modelling: A Review of Current Practices and Challenges. Energies 2024, 17, 4400. [Google Scholar] [CrossRef]
  52. Wang, C.; Ferrando, M.; Causone, F.; Jin, X.; Zhou, X.; Shi, X. An Innovative Method to Predict the Thermal Parameters of Construction Assemblies for Urban Building Energy Models. Build. Environ. 2022, 224, 109541. [Google Scholar] [CrossRef]
  53. Ferrando, M.; Ferroni, S.; Pelle, M.; Tatti, A.; Erba, S.; Shi, X.; Causone, F. UBEM’s Archetypes Improvement via Data-Driven Occupant-Related Schedules Randomly Distributed and Their Impact Assessment. Sustain. Cities Soc. 2022, 87, 104164. [Google Scholar] [CrossRef]
  54. Ferrando, M.; Nozza, D.; Hong, T.; Causone, F. Comparison of Different Clustering Approaches on Different Databases of Smart Meter Data. In Proceedings of the Building Simulation Conference Proceedings, Brisbane, Australia, 20–21 July 2022; pp. 1155–1162. [Google Scholar]
  55. BS EN 16798; Energy Performance of Buildings—Ventilation for Buildings—Part 1: Indoor Environmental Input Parameters for Design and Assessment of Energy Performance of Buildings Addressing Indoor Air Quality, Thermal Environment, Lighting and Acousti. European Committee for Standardization-CEN: Brussels, Belgium, 2019.
  56. Reinhart, C.F.; Dogan, T.; Jakubiec, A.J.; Rakha, T.; Sang, A. Umi—An Urban Simulation Environment for Building Energy Use, Daylighting and Walkability. In Proceedings of the BS2013, 13th Conference of International Building Performance Simulation Association, Chambéry, France, 26–28 August 2013; pp. 476–483. [Google Scholar] [CrossRef]
  57. Prataviera, E.; Romano, P.; Carnieletto, L.; Pirotti, F.; Vivian, J.; Zarrella, A. EUReCA: An Open-Source Urban Building Energy Modelling Tool for the Efficient Evaluation of Cities Energy Demand. Renew. Energy 2021, 173, 544–560. [Google Scholar] [CrossRef]
  58. U.S. Department of Energy’s. EnergyPlus. Available online: https://energyplus.net/ (accessed on 20 December 2018).
  59. Aria, S.p.A. CENED—Certificazione Energetica Degli Edifici. Available online: https://www.cened.it/ (accessed on 9 May 2025).
  60. Sistema Informativo per La Prestazione Energetica Degli Edifici (SIPEE)|Servizionline. Available online: https://servizi.regione.piemonte.it/catalogo/sistema-informativo-per-prestazione-energetica-degli-edifici-sipee (accessed on 9 May 2025).
  61. Regione Autonoma Valle d’Aosta Il Portale Beauclimat. Available online: https://www.regione.vda.it/energia/certificazioneenergetica/il_portale_beauclimat_i.aspx (accessed on 12 May 2025).
  62. Aria, S.p.A. CURIT—Catasto Impianti Termici Lombardia. Available online: https://www.curit.it/ (accessed on 9 May 2025).
  63. Presidente Della Repubblica Decreto Del Presidente Della Repubblica 26 Agosto 1993, n. 412 1993. Available online: https://www.gazzettaufficiale.it/eli/id/1993/10/14/093G0451/sg (accessed on 1 August 2025).
  64. Banfi, A.; Ferrando, M.; Malik, J.; Hong, T.; Causone, F. An Analysis of Building Occupancy Patterns Based on Time Use Survey Data. In Proceedings of the Lecture Notes in Civil Engineering; Springer: Berlin/Heidelberg, Germany, 2025; Volume 553, pp. 437–442. [Google Scholar]
  65. Hong, T.; Chen, Y.; Lee, S.H.; Piette, M.A. CityBES: A Web-Based Platform to Support City-Scale Building Energy Efficiency. Urban Comput. 2016, 14. Available online: https://www.researchgate.net/publication/304824985_CityBES_A_Web-based_Platform_to_Support_City-Scale_Building_Energy_Efficiency (accessed on 1 August 2025).
  66. Remmen, P.; Lauster, M.; Mans, M.; Fuchs, M.; Osterhage, T.; Müller, D. TEASER: An Open Tool for Urban Energy Modelling of Building Stocks. J. Build. Perform. Simul. 2018, 11, 84–98. [Google Scholar] [CrossRef]
  67. Fonseca, J.A.; Nguyen, T.-A.A.; Schlueter, A.; Marechal, F.F. City Energy Analyst (CEA): Integrated Framework for Analysis and Optimization of Building Energy Systems in Neighborhoods and City Districts. Energy Build. 2016, 113, 202–226. [Google Scholar] [CrossRef]
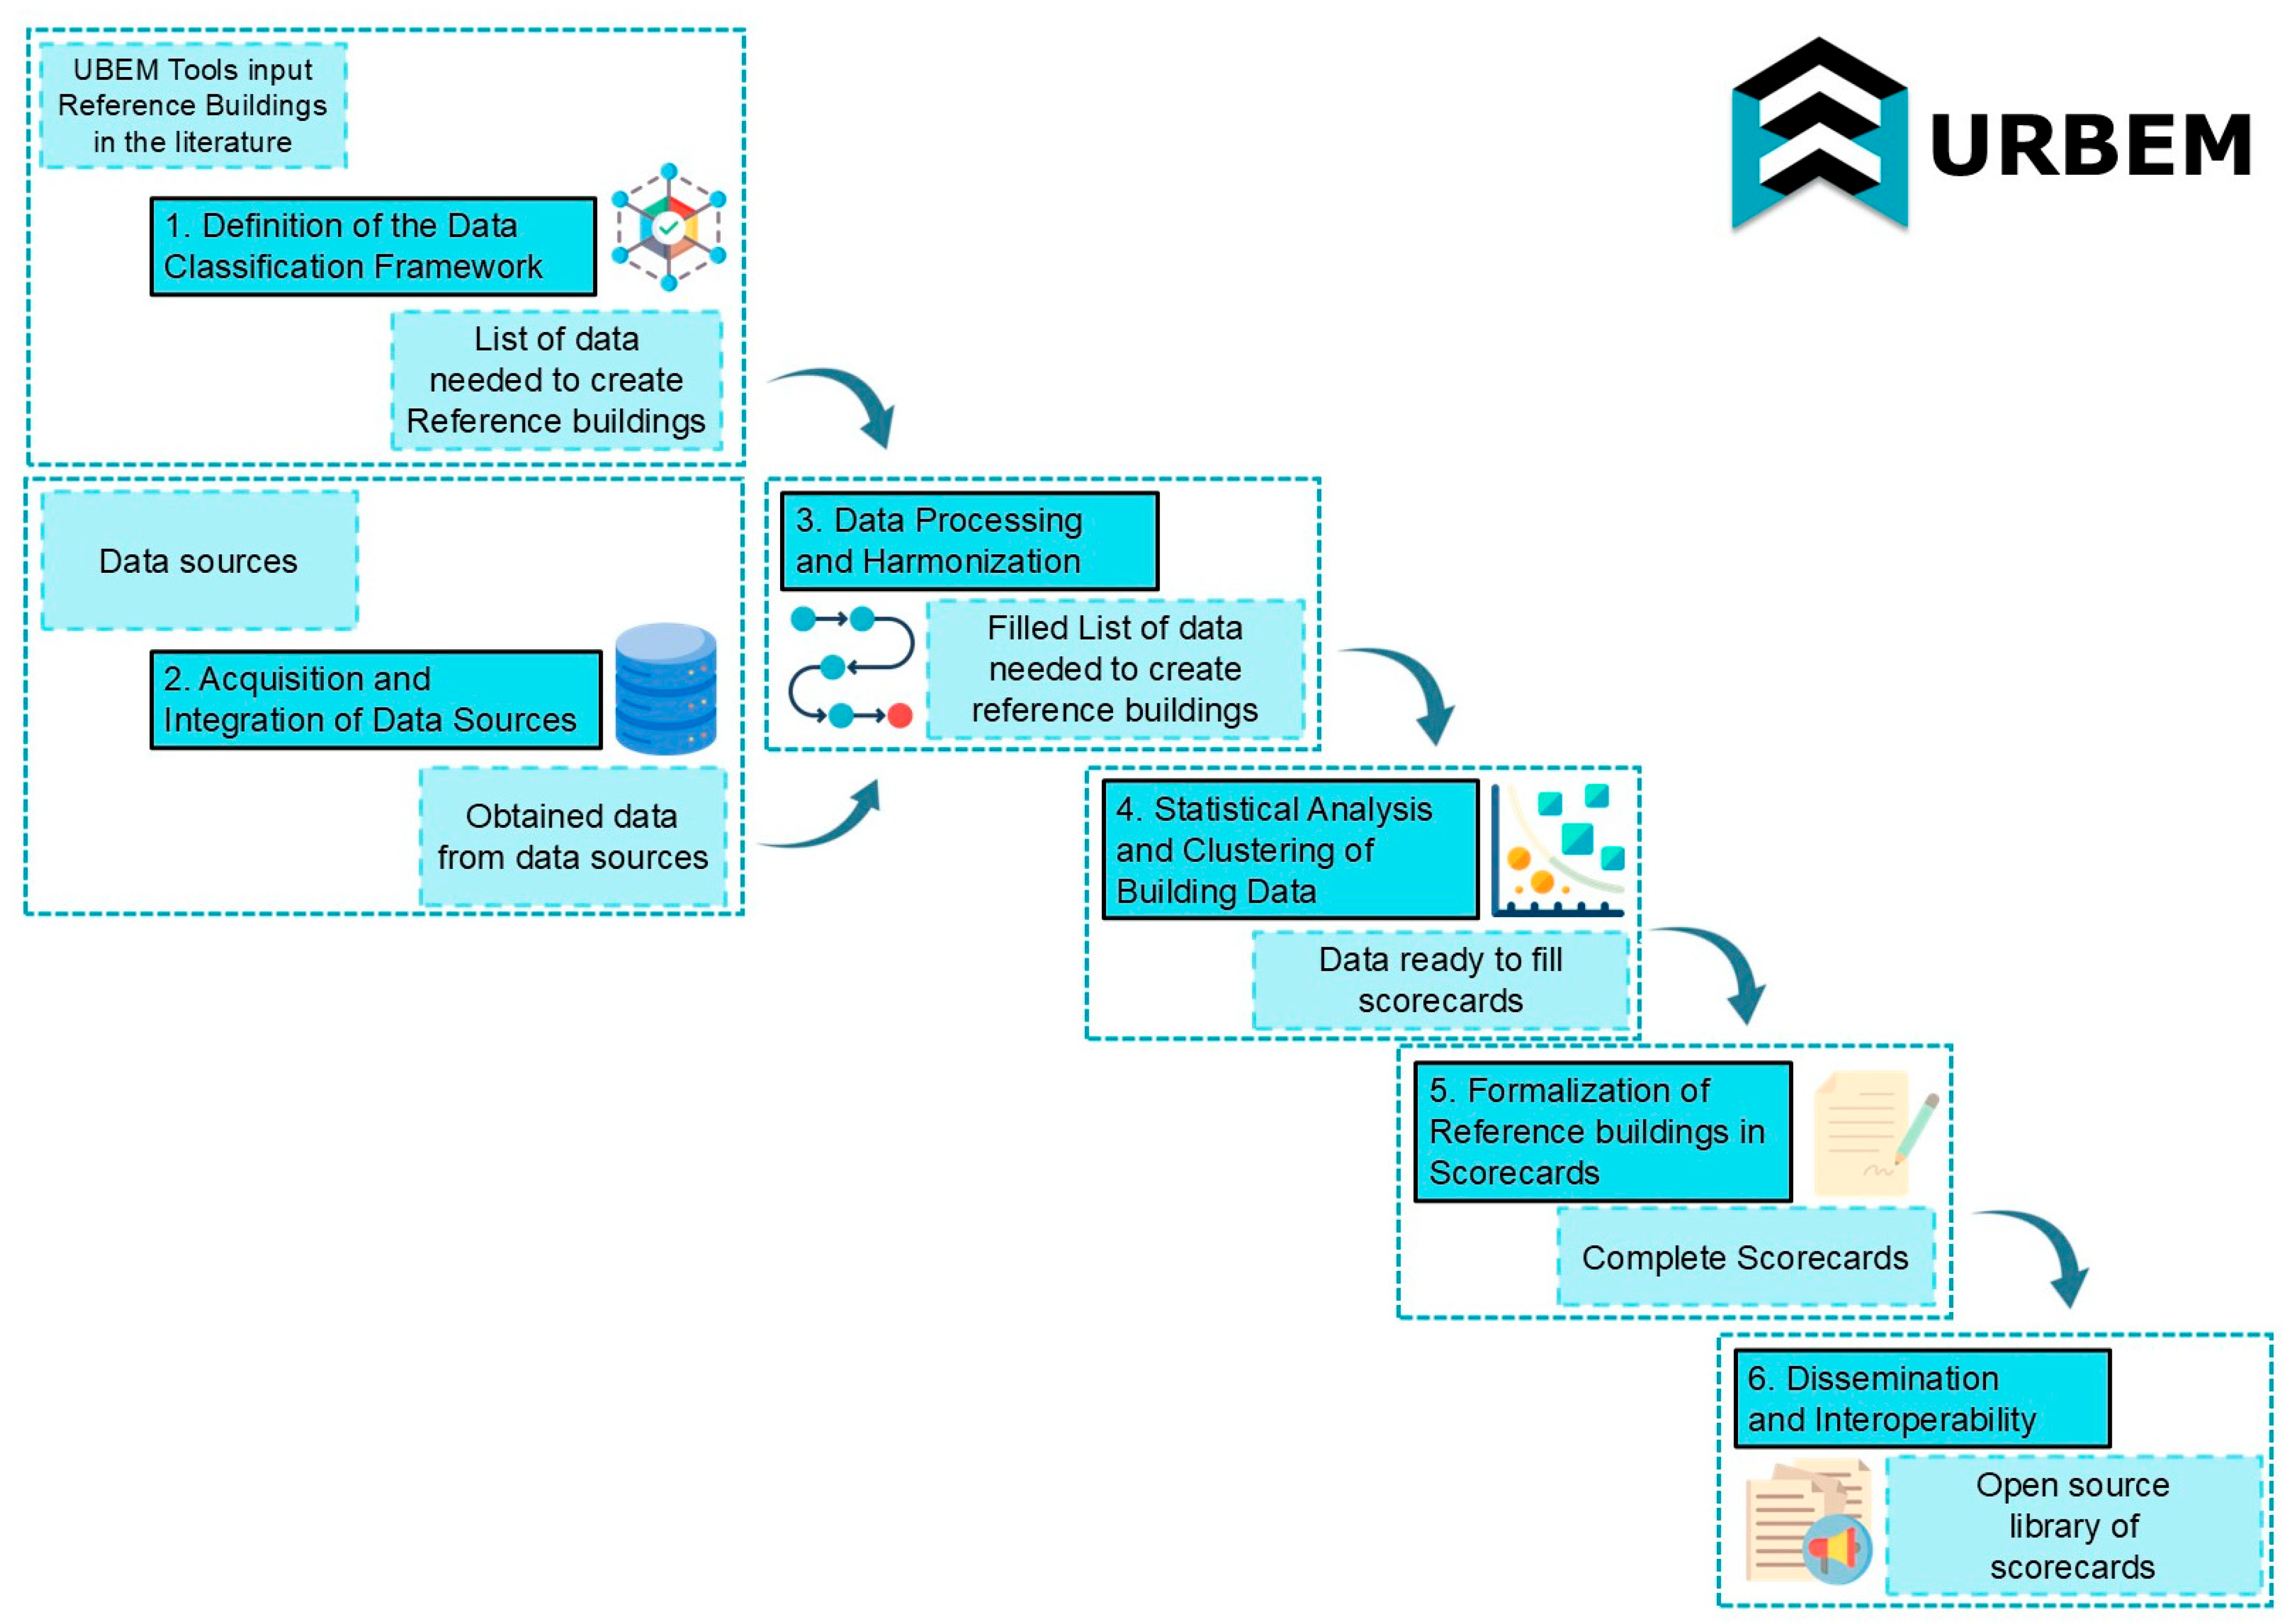
Figure 1. Schematic of the URBEM workflow.
Energies 18 06026 g001
Figure 2. Distribution of the total number of scorecards by region (left) and covered building typologies by region (right).
Energies 18 06026 g002
Figure 3. Percentage distribution of the entire set of scorecards by climate zone (left) and by period of construction (right).
Energies 18 06026 g003
Table 1. Comparison of UMI and EUReCA inputs regarding natural ventilation and infiltration.
VariableUMIEUReCAUnit of Measurement
Infiltration rateh−1
NV * minimum outdoor air temperature °C
NV * maximum outdoor air temperature °C
NV * maximum relative humidity -
NV * schedule-
NV * zone temperature setpoint °C
Scheduled ventilation ACH ** h−1
Ventilation rate schedule[-] (umi); [m3/(s m2)] (EUReCA)
Scheduled ventilation setpoint m3/(s m2)
Buoyancy
Wind
Airflow Network
* NV = Natural Ventilation. ** ACH = Air Change per Hour.
Table 2. Overview of database macro-categories analyzed within the URBEM project, summarizing the main characteristics in terms of source type, accessibility, digitalization level, and data granularity.
Macro-CategoryN° of DatabasesSource Type
Distribution *
Accessibility
Distribution **
Digitalization Level #Data Granularity ##
Buildings databases9LD: 87%; RD: 13%AR: 100%DOf: 78%; P: 22%D: 78%; A: 22%
Climate databases26RD: 83%; ND: 9%; LD: 8%OP: 83%; RN: 13%; AR: 4%DOn: 96%; DOf: 4%D: 92%; A: 8%
District heating1LD: 100%AR: 100%DOf: 100%A: 100%
EPC databases22RD: 90%; LD: 5%; ND: 5%RN: 57%; AR: 24%; OP: 19%DOn: 81%; DOf: 19%D: 86%; A: 14%
Geographical databases22RD: 91%; LD: 9%OP: 100%DOn: 100%D: 96%; A: 4%
Other databases83ND: 52%; LD: 42%; RD: 6%AR: 84%; OP: 11%; RN: 5%DOn: 68%; DOf: 21%; P: 11%D: 87%; A: 13%
Other EU databases3EUD: 67%; LD: 33%OP: 67%; AR: 33%DOn: 67%; DOf: 33%A: 67%; D: 33%
Other National databases1TS: 100%RN: 100%DOn: 100%A: 100%
Statistical databases1ND: 100%OP: 100%DOn: 100%A: 100%
Technical standards2TS: 100%RN: 100%DOn: 100%A: 100%
Thermal plant registers21RD: 95%; LD: 5%OP: 43%; RN: 38%; AR: 19%DOn: 81%; DOf: 19%D: 95%; A: 5%
* LD = Local Database, RD = Regional Database, ND = National Database, EUD = EU database, TS = Technical Standard. ** AR = Authorisation required, OP = Open Access, RN = Registration Needed. # DOf = Digital Offline, P = Paper, DOn = Digital Online. ## A = Aggregated, D = Disaggregated.
Table 3. Summary of data categories for office buildings in Lombardy built before 1930, including the number of data fields and their content description.
Macro-CategoryN° of FieldsDescriptionDetails
Non-geometric information22Identifiers, addresses, and administrative info (no sensitive data used).Includes building identifiers (e.g., Point of Delivery codes, street names, and administrative zoning).
Heating, cooling, and DHW systems21Technical details of heating, cooling, and domestic hot water systems.Describes types and efficiency of generators, emission systems, distribution networks, and the presence of renewable energy systems.
Envelope12Information on walls, windows, and thermal properties of the building envelope.Details on U-values, materials, window-to-wall ratio, shading devices, and insulation levels of building components.
Intervention Scenarios9Planned energy efficiency measures and estimated savings potential.Lists potential retrofit measures (e.g., insulation, HVAC upgrades, thermostatic valves), and estimates energy savings (i.e., energy performance index).
Geometric Data6Building footprint, surface areas, and volumetric data.Provides gross floor area, net heated area, building footprint, height, and volume information essential for energy performance calculations.
Consumption4Energy consumption data (e.g., electricity bills).Contains historical energy consumption data from electricity or gas bills, used for baseline assessments.
Table 4. Decision Logic for Selection of Representative Values.
ConditionStatistical ApproachOutcome
One category accounts for ≥70% of recordsDirect assignmentVariable assigned deterministically
No dominant value, but categories have similar numerical effectsUse of the most frequent and consistent configurationSelection favors technical realism (e.g., most used U-value)
Categorical or numerical heterogeneity is too highUnsupervised clustering (e.g., k-means, hierarchical)Sub-groups identified and validated through expert review
Adjacent decades with indistinguishable behaviorMerge into a unified construction periodThe reference building represents the merged segment
Distinct trends within a period (e.g., prefabricated vs. massive)Separate into multiple clustersMultiple reference buildings are defined for the same time range
Table 5. Structure of the five-part Alphanumeric Code for URBEM Scorecards.
CodeComponentDescriptionExamples
ID1Building UseMacro-category of use based on building functionRES = Residential
OFF = Office
EDUC = Educational
COMM = Commercial
CATR = Restaurant/Catering
ID2Typology specifications when neededType or structural configuration of the buildingSINGLE = Single-family
APPBLOCK = Apartment block
TEMP = Temporary housing
BLDGS = Entire building
DEPT = Department store
ID3Construction PeriodTime range during which the buildings in the category were constructed-1930 = Pre-1930, 1961–1970 = between 1961 and 1970, 2006- = Post-2006
ID4Climate ZoneItalian climate zone (from national zoning classification [63])B, C, D, E, F
ID5Geographical AreaRegion or territorial aggregationAPU = Apulia
CAL = Calabria
PIE = Piedmont
ITA = National territory
LAZ = Lazio
LIG = Liguria
LOM = Lombardy
SIC = Sicily
TN = Trentino-Alto Adige
TUS = Tuscany
VAL = Aosta Valley
Table 6. Distribution of URBEM Scorecards by Building Use.
Building UseNumber of Scorecards
Residential250 (65.8%)
Offices46 (12.1%)
Schools41 (10.8%)
Restaurants19 (5%)
Commercial (Retail)24 (6.3%)
Total380 (100%)
Table 7. Excerpt of the Scorecard EDUC_1950-1990_E_LOM.
CategoryVariableValue/Distribution
IdentificationReference building codeEDUC_1950-1990_E_LOM
Region/Zone/PeriodLombardy/Zone E/1950–1990
Number of records26
Main data sourcesLocal database (75%), Expert Assumption (18%), Standards (7%)
GeometryNumber of floors2.00 (median)
Heated net floor area1186.27 m2 (median)
Heated gross volume7533.50 m3 (median)
Compactness ratio0.50 m−1 (median)
WWR (all orientations)0.18 (median)
EnvelopeWall typesHollow brick (low ins.: 45%, medium: 28%), Panels: 27%
Wall U-value1.39 W/m2K (median)
Roof U-value1.60 W/m2K (median)
Windows U-value2.90 W/m2K (median)
Windows typeDouble glazing, mainly aluminum w/o thermal break (38%)
SystemsHeating system typeCentralized (100%)
Heating generatorTraditional boiler (100%)
DHW systemAutonomous, coupled with heating (100%)
Energy carrierNatural gas (100%)
VentilationNatural (100%)
Normative inputsOccupancy & loadsUNI EN 16798-1:2019
Disclaimer/Publisher’s Note: The statements, opinions and data contained in all publications are solely those of the individual author(s) and contributor(s) and not of MDPI and/or the editor(s). MDPI and/or the editor(s) disclaim responsibility for any injury to people or property resulting from any ideas, methods, instructions or products referred to in the content.