Article

Localization of Forced Oscillation Sources in Power Systems with Grid-Forming Wind Turbines Based on ICEEMDAN-ITEO

1
School of Electrical Engineering, Northeast Electric Power University, Jilin 132012, China
2
State Grid Jilin Electric Power Company Limited Electric Power Research Institute, Changchun 130021, China
*
Author to whom correspondence should be addressed.
Energies 2025, 18(22), 6025; https://doi.org/10.3390/en18226025
Submission received: 26 September 2025 / Revised: 12 November 2025 / Accepted: 15 November 2025 / Published: 18 November 2025

Abstract

The integration of grid-forming wind turbines introduces forced oscillations and harmonic/inter-harmonic interference, which degrades the accuracy of traditional energy-flow-based source localization methods. To address this issue, this paper proposes a novel method based on improved complete ensemble empirical mode decomposition with Adaptive Noise (ICEEMDAN) and an improved Teager energy operator (ITEO). The proposed method first employs ICEEMDAN to adaptively decompose wide-area measurement signals, effectively suppressing mode mixing and noise. Then, ITEO is utilized to extract the dominant oscillation components. By incorporating an adjustable computation window, ITEO enhances frequency selectivity, amplifying force oscillations while suppressing high-frequency noise, leading to robust energy estimation. Following this, the dissipative modal energy flow is calculated from the reconstructed time-domain waveforms. Ultimately, the disturbance source is precisely identified based on the dissipative energy flow theory. The method is validated through extensive simulations on a multi-bus test system with grid-forming wind turbines, considering disturbances from both synchronous generator excitations and wind turbine internal controls, as well as in high-noise environments. Additional validation using a real-world oscillation event from the ISO New England system confirms that the proposed method achieves superior accuracy and robustness compared to conventional methods.

1. Introduction

Driven by the global “Dual-Carbon” goals, the penetration rate of renewable energy generation equipment—primarily wind and photovoltaic power—is continuously increasing. The power system is undergoing a fundamental transformation from a traditional synchronous generator-dominated structure to one with a high penetration of power electronic devices. Grid-forming wind turbines emulate the inertia and damping characteristics of synchronous machines through the control loops of grid-connected converters. While this enhances grid stability, it also introduces new risks of forced oscillations. Internal controllers in these turbines may become sources of forced oscillations due to parameter perturbations, external disturbances, or nonlinear dynamics, exhibiting new features such as broadband oscillations, harmonic interference, and complex modal coupling. These characteristics significantly differ from oscillation modes triggered by traditional synchronous machines or load disturbances, posing severe challenges to existing localization methods [1,2,3]. If not accurately and promptly located, forced oscillations may excite inherent resonances in the system, leading to large-scale power fluctuations and seriously threatening grid security. Therefore, in light of the new disturbance scenarios brought about by the integration of grid-forming wind turbines, it is imperative to develop oscillation source localization methods that can adapt to their dynamic characteristics and exhibit strong robustness, in order to ensure the secure and stable operation of new power systems [4,5,6].
In current research on forced oscillation source localization, methods can be primarily categorized into model-based and data-driven approaches. Model-based methods—such as Prony identification [7], damping torque analysis [8], and stochastic subspace identification [9]—demonstrate strong localization performance under ideal modeling conditions. However, the effectiveness of these methods heavily relies on the accuracy of the system model and its parameters. Given the variable and nonlinear control characteristics of grid-forming wind turbines in practical systems, accurate modeling is challenging, which limits the applicability of such methods. On the other hand, the widespread deployment of wide-area measurement systems has promoted data-driven methods as a research hotspot. For example, one study adopted a two-stage deep transfer learning strategy for disturbance source localization: first, a pretrained convolutional neural network was used to extract features to enhance system-level localization performance, and then the learned knowledge was transferred to regional-level localization tasks [10]. Another study converted active power measurements of generators into time-frequency spectrograms via short-time Fourier transform and combined image recognition with transfer learning techniques to achieve regional-level oscillation source localization [11]. Although such artificial intelligence methods perform well in certain scenarios, their generalization capability under varying operating conditions remains limited, and they exhibit poor physical interpretability. Furthermore, other advanced data-driven strategies have emerged, such as combining energy functions with normal distribution identification to achieve fully data-driven localization [12]. While this method improves automation, it requires extended data accumulation time and suffers from low efficiency. Another approach integrates Kron reduction with maximum likelihood estimation, enabling the localization of disturbance sources at non-generator nodes and improving adaptability in partially PMU-covered scenarios. However, it still relies on prior network parameters and may be constrained in practical applications by the assumption of homogeneous node noise [13].
In contrast, energy function-based methods have garnered significant attention in recent years due to their clear physical concepts and high computational efficiency. Reference [14] first proposed the idea of disturbance source localization based on oscillatory energy flow. Reference [15] further introduced the theory of dissipative energy flow and developed its computational approach, explicitly stating that the device continuously injecting oscillatory energy is the disturbance source. This method relies solely on wide-area measurement information to achieve localization, demonstrating strong potential for engineering applications. However, actual measurement signals often contain not only forced oscillation components but also noise, power-frequency harmonics, and other electromechanical transient components. Failure to effectively extract the target oscillation mode can severely impact the accuracy of dissipative energy flow calculations [16]. To address this, researchers have introduced various signal processing techniques. For instance, band-pass filtering [17] is straightforward but exhibits poor noise resistance; continuous wavelet transform performs better but involves high computational complexity and strong dependence on wavelet basis selection [18]; empirical mode decomposition [19] is prone to mode mixing, leading to decomposition distortion. Although the complete ensemble empirical mode decomposition with adaptive noise effectively mitigates mode mixing and improves decomposition completeness [20], its robustness in high-noise environments remains limited, restricting its application in complex real-world scenarios. In recent years, more advanced signal processing techniques have continued to evolve. For example, the sparse identification of nonlinear dynamics (SINDy)-based approach can construct a unified oscillation tracing model for synchronous generators and inverter-based resources without requiring system parameters, but it has limited ability to distinguish internal sources in HVDC systems, demands high data quality, and is sensitive to noise [21]. The method based on cross-power spectral density and variational mode decomposition can effectively identify oscillation direction and source type, but it relies on long data windows, is prone to misjudgment in low-frequency scenarios due to phase inaccuracies and still requires manual intervention under low observability conditions [22]. Additionally, multivariate variational mode decomposition has been applied to dissipative energy flow calculations, improving accuracy in noisy environments but introducing higher computational complexity and sensitivity to parameter settings [23]. Overall, how to robustly and efficiently extract the dominant oscillation component from complex signals remains a common challenge.
It is particularly noteworthy that most existing localization strategies are primarily designed for and validated on disturbance scenarios involving conventional synchronous generators or load-side perturbations, leaving a significant research gap in addressing forced oscillations originating from the internal control loops of grid-forming wind turbine converters. The complex dynamic response and prominent multi-modal coupling effects of these inverter-based resources often degrade the performance of existing methods, resulting in unreliable localization within grid-forming wind turbine integrated systems. To bridge this gap, this paper proposes a robust forced oscillation source localization method based on ICEEMDAN-ITEO, specifically designed for novel oscillation scenarios introduced by grid-forming wind turbine integration. The proposed approach first establishes a dedicated signal-processing framework that employs ICEEMDAN to adaptively decompose wide-area measurement signals, thereby mitigating mode mixing caused by multi-scale oscillatory components from grid-forming wind turbines and suppressing switching noise. As a core contribution, the method further introduces the proposed ITEO, which incorporates an adjustable resolution parameter to extend the computation window, offering superior frequency selectivity that amplifies the energy of low-frequency electromechanical oscillations while inherently suppressing high-frequency interference from power electronic converters and enabling robust reconstruction of the dominant oscillatory waveform. On this basis, the theoretical foundation of localization is advanced by transposing the dissipative energy flow concept from the physical domain to the modal domain, which constructs a novel dissipative mode energy flow index to precisely isolate and track oscillation energy injected by the disturbance source under complex modal coupling inherent to grid-forming wind turbines’ control dynamics. The efficacy and robustness of the proposed approach are rigorously validated through extensive simulations under diverse grid-forming wind turbines-specific disturbance scenarios—including both synchronous generator excitations and internal control loops of grid-forming wind turbines—as well as in high-noise environments, consistently demonstrating high localization accuracy.

2. System Modeling

Theory and Modeling of Grid-Forming Doubly Fed Induction Generators

The typical grid-connected configuration of a grid-forming doubly fed induction generator (GFM-DFIG) is presented in Figure 1. The system architecture comprises a DFIG, a rotor-side converter (RSC) implementing the grid-forming control strategy to autonomously regulate the stator voltage, a grid-side converter (GSC) dedicated to DC-link voltage stabilization, and the interconnecting DC-link that facilitates bidirectional power exchange. A critical aspect of this structure, as shown, is the redefined role of the RSC from mere power control to a grid-voltage-forming unit, which is the cornerstone for its enhanced stability and inertial support capabilities compared to conventional grid-following counterparts [24].
The output voltage of the GFM-DFIG is connected to the grid through grid impedance. In this paper, the rotor voltage direction is set as the positive d-axis direction. Accordingly, the dq-axis expressions of the stator voltage and stator current can be derived as follows:
U s d = U g d + I s d R g I s q X g U s q = U g q + I s q R g + I s d X g
where U s d , q is the dq-axis component of the stator voltage; U g d , q is the dq-axis component of the grid voltage; I s d , q is the dq-axis component of the stator current. R g ,   X g represent the grid resistance and grid reactance.
The stator and rotor voltage and flux linkage equations of the doubly fed induction generator are given as follows:
U s d = R s I s d + p ψ s d ω s ψ s q U s q = R s I s q + p ψ s q + σ s ψ s d U r d = R r I r d + p ψ r d ( ω s ω r ) ψ r q U r q = R r I r q + p ψ r q + ( ω s ω r ) ψ r d
ψ s d = L s i s d + L m i r d ψ s q = L s i s q + L m i r q ψ r d = L m i s d + L r i r d ψ r q = L m i s q + L r i r q
where U r d , q is the dq-axis component of the rotor voltage; I r d , q is the dq-axis component of the rotor current; R r ,   R s represented, respectively, as rotor resistance and stator resistance; L r ,   L s ,   L m are, respectively, represented as rotor inductance, stator inductance and stator-rotor mutual inductance; ψ s d , q and ψ r d , q represent the dq-axis components of the stator and rotor magnetic fluxes, respectively; ω r and ω s respectively represent the rotor speed and the synchronous speed; p represents the differential operator.
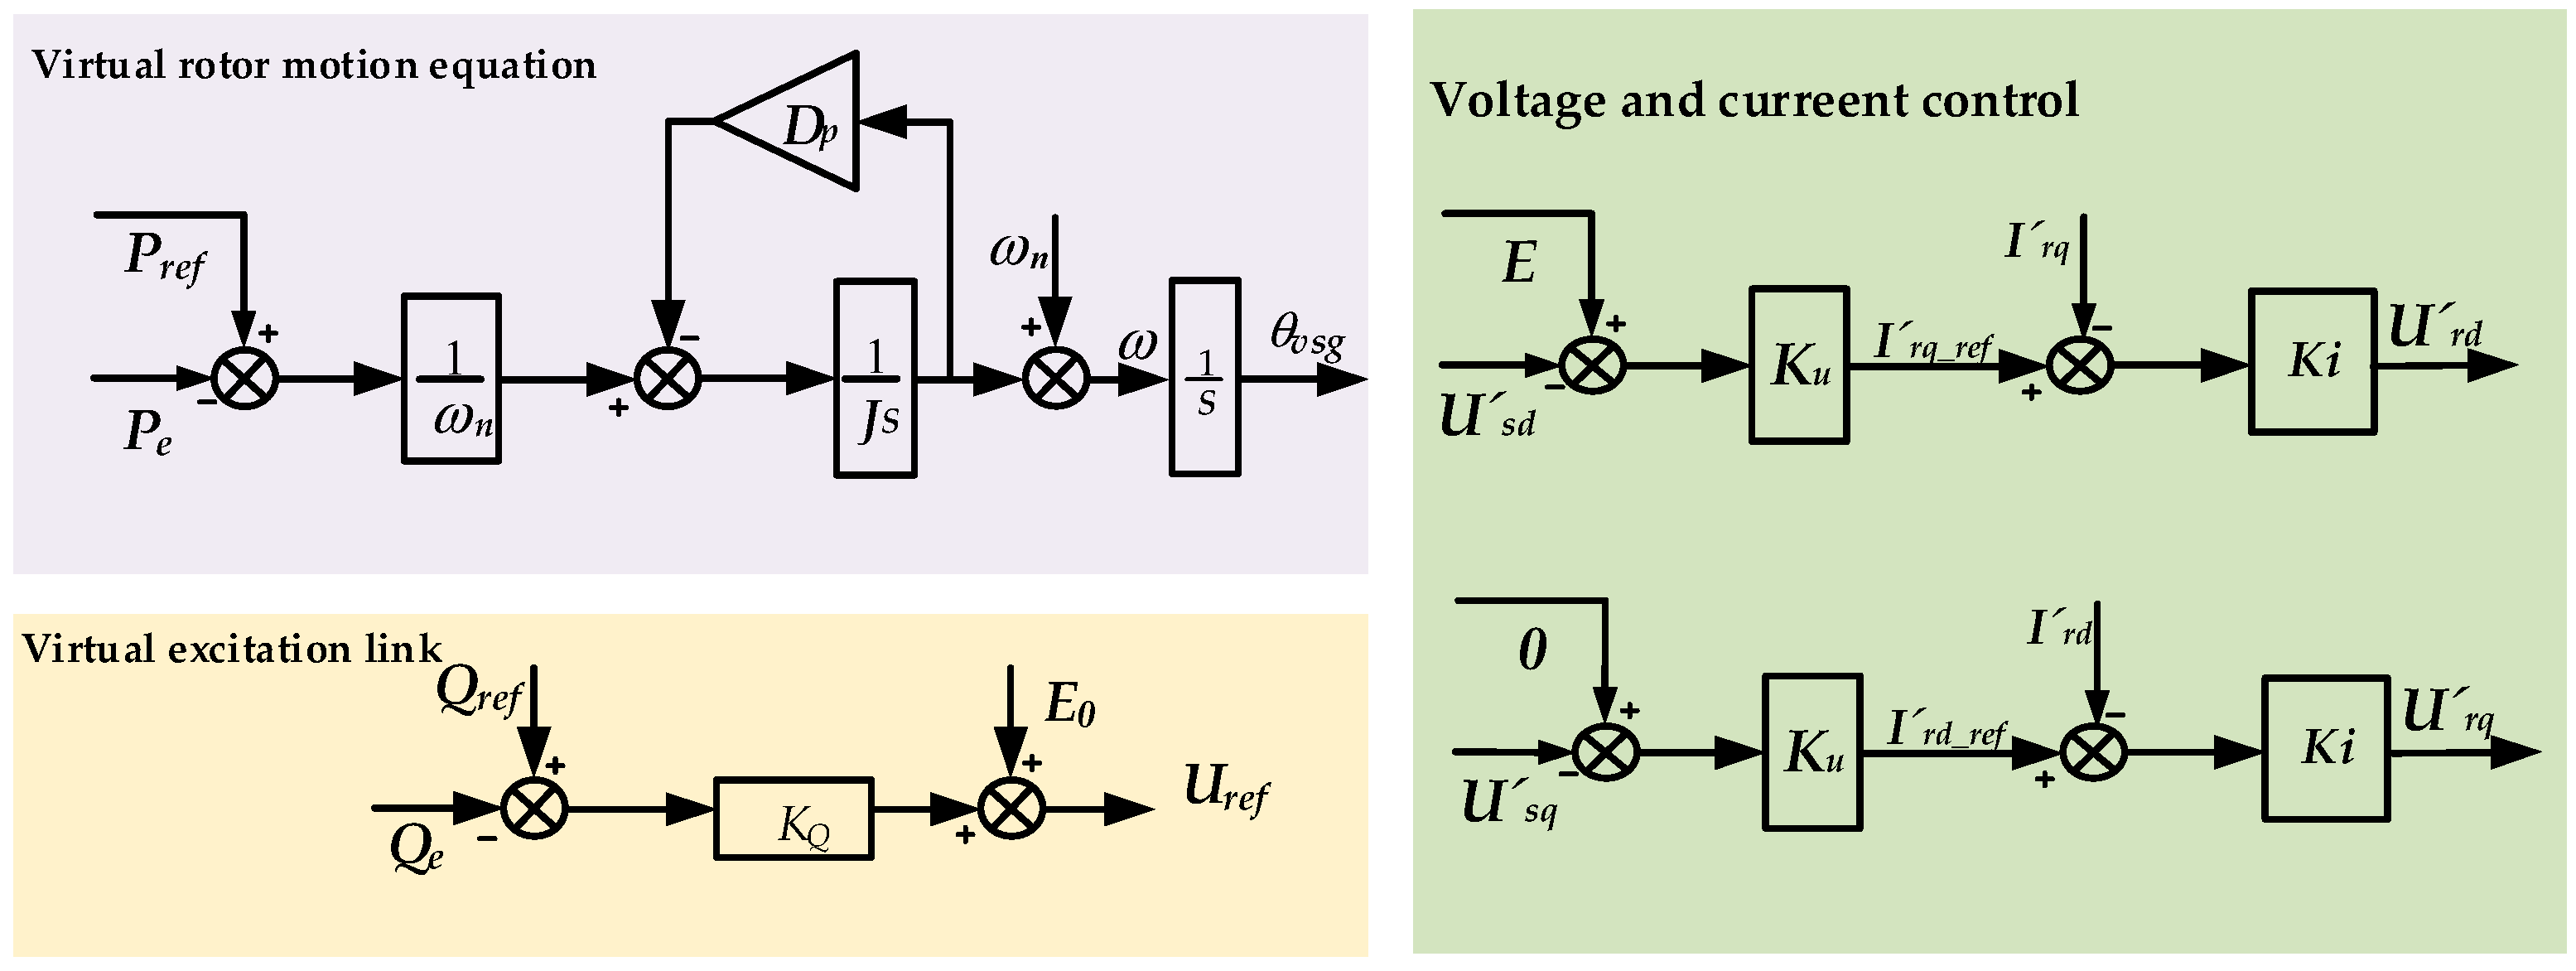
The primary distinction between grid-forming and grid-following doubly fed induction generators lies in the control strategy of the rotor-side converter. Unlike conventional DFIGs that employ oriented vector control, GFM-DFIGs achieve grid connection by regulating both the amplitude and phase of the output voltage. In this study, the grid-forming control strategy adopted for the GFM-DFIG is based on Virtual Synchronous Generator (VSG) strategy, with a detailed control block diagram presented in Figure 2.
The specific settings of the simulation parameters for the GFM-DFIG in this paper are shown in Table 1.
The VSG control outer loop comprises an active power loop and a reactive power loop. The active power loop emulates the rotor swing equation to provide inertial and damping characteristics for the system, expressed as follows:
J d ( ω ω n ) d t = P r e f P e D p ( ω ω n ) d θ v s g d t = ω ω n
where J and D, respectively represent the virtual inertia coefficient and the virtual damping coefficient of the active ring; ω , ω n respectively represent the actual angular frequency of the doubly fed wind turbine rotor and the rated angular frequency; θ v s g represents the reference phase of the output rotor voltage; Pref represents the reference value of active power; Pe represents the electromagnetic power of the grid-connected doubly fed wind turbine.
The expression of the reactive voltage loop controlled by VSG is as follows:
U r e f = K Q ( Q r e f Q e ) + E 0
where U r e f represents the reference value of the rotor voltage; E 0 represents the rated value of the rotor voltage; K Q represents the reactive power droop coefficient; Q r e f represents the reference value of reactive power; Q e represents the stator reactive power of the doubly fed wind turbine.
The inner voltage and current loops employ a stator-flux-oriented dual closed-loop control structure for both voltage and current. Given that the bandwidth of the current loop is significantly larger than that of the outer loop, the current loop controller can be neglected. The mathematical representation of the voltage loop model is as follows:
I r d _ r e f = K u E U s d I r q _ r e f = K u 0 U s q
where Ku is the gain of the voltage loop PI controller. Ird_ref and Irq_ref represent the reference values for the d and q axis rotor current components in the controller’s coordinate system; and Usd and Usq are the d and q axis components of the terminal voltage in the controller’s dq coordinate system.

3. Theoretical Analysis on Localization of Forced Power Oscillation Sources

When forced power oscillations occur in a power system, the disturbance source continuously injects oscillatory energy into the grid, while other devices absorb energy. Based on this physical mechanism, the accurate localization of the disturbance source can be achieved by analyzing the dissipative energy flow characteristics at the terminals of each generator. While conventional dissipative energy flow methods perform well in traditional systems dominated by synchronous generators, their application in power systems with a high penetration of grid-forming wind turbines faces significant challenges. Grid-forming wind turbines are integrated via power electronic converters, which exhibit fast control dynamics and a wide frequency bandwidth, often introducing broadband oscillatory components. Furthermore, the switching characteristics of power electronic devices introduce high-frequency noise and harmonics into the measured signals. These factors cause traditional methods—which compute energy flow directly from raw measurements—to be highly susceptible to interference from non-oscillatory modes and noise, leading to degraded localization performance and even misidentification [25]. Therefore, it is necessary to enhance traditional dissipative energy flow methods by incorporating more advanced signal processing and energy extraction strategies. Such improvements are essential to increase the localization accuracy and robustness of dissipative energy flow-based methods in systems integrated with grid-forming wind turbines.

3.1. The Theory of Forced Oscillation Based on Dissipative Energy Flow

Building on these characteristics, reference [15] utilized wide-area measurement data from the power system and proposed for the first time a method for locating forced oscillation sources based on dissipative energy flow. In this method, the dissipative energy flow transmitted from node i to generator j through branch Lij is defined as:
W i j = Δ P i j d Δ θ j + Δ Q i j d Δ ln U j = 2 π Δ P i j Δ f j d t + Δ Q i j d Δ ln U j
where ΔPij and ΔQij correspond to the changes in active and reactive power on branch Lij relative to the steady-state value; Δ θ j and Δfj represent the changes in the voltage phase angle and frequency of generator j relative to the steady-state value; ΔlnUj represents the change in the logarithm of the voltage amplitude of generator j relative to the steady-state value.
In this paper, the direction of dissipative energy flow into a generator is defined as positive. The identification of oscillation sources is performed by analyzing the variation trend of the dissipative energy flow curve calculated using Equation (7). If the slope of a generator’s energy flow curve is negative, it indicates that the generator is exporting oscillatory energy to the grid and is thus identified as an oscillation source; if the curve exhibits a rising or constant trend, the generator is classified as a non-oscillation source.

3.2. Modal Decomposition Based on ICEEMDAN

Based on the above analysis, when forced oscillations occur in a power system, the distribution of dissipative energy flow across system branches can be calculated using wide-area measurement data, enabling accurate localization of the disturbance source. However, in addition to the primary information related to forced oscillations, the measured data also contain substantial interference components, which can significantly degrade the localization accuracy of the dissipative energy flow method. Therefore, it is imperative to develop an effective approach for accurately extracting the dominant forced oscillation components from wide-area measurement information.
To address this, this paper introduces the ICEEMDAN algorithm to process wide-area measurement data through modal decomposition. Building upon Empirical Mode Decomposition (EMD) and Complete Ensemble Empirical Mode Decomposition with Adaptive Noise (CEEMDAN), this improved method incorporates Gaussian white noise decomposed by EMD and uses the local mean of the noise as the residual for the current iteration. The intrinsic mode functions (IMFs) are then derived from the differences between successive residuals. This mechanism significantly suppresses mode mixing and reduces residual noise, resulting in IMF components with greater physical clarity and stability, thereby enabling more accurate separation of distinct oscillatory modes [21]. Furthermore, ICEEMDAN retains the inherent advantages of EMD-based methods in processing nonlinear and non-stationary signals while achieving enhanced decomposition stability and accuracy, thereby providing a more reliable foundation for subsequent forced oscillation source localization.
The specific decomposition steps of ICEEMDAN for the measurement signal Pij(t) of the power system are as follows:
(1)
Introduce two operators: Ek(·) and A(·), where Ek(·) denotes the k-th IMF component obtained by applying EMD to Pij(t), and A(·) represents the local mean of the signal.
(2)
Add adaptively scaled Gaussian white noise (preprocessed via EMD) to the original signal Pij(t)to form the modified signal for branch Lij:
P i j     * t = P i j t + α k E k ( ω i ( t ) )
where ω i ( t ) is the i-th realization of Gaussian white noise, and α k controls the signal-to-noise ratio at the k-th stage.
(3)
Compute the first IMF component. Obtain the first residual r1 by averaging the local means of all noisy realizations, then subtract it from the original signal to extract IMF1.
r 1 = 1 Z i = 1 Z A { P i j t + α k E k [ ω i ( t ) ] } IMF 1 = P i j t r 1
where Z represents the number of white noise groups.
(4)
Calculate the second IMF component. Inject EMD-processed noise into the residual r1 compute the new local mean to obtain r2 and derive IMF2.
r 2 = 1 N i = 1 N A { r 1 ( t ) + α k E k [ ω i ( t ) ] } IMF 2 = r 1 r 2
(5)
Similarly, compute the k-th residual and the k-th IMF component iteratively:
r k = 1 N i = 1 N A { r k 1 ( t ) + α k E k [ ω i ( t ) ] } IMF k = r k 1 r k
(6)
Repeat Step 5 until the residual becomes monotonic or no more oscillatory components can be extracted.
(7)
Obtain all the eigenmode components of the active power Pij(t).

3.3. Extraction of the Key Mode Components of Forced Oscillation Based on ITEO

The ICEEMDAN algorithm adaptively decomposes the wide-area measurement signal into N IMF components, which contain oscillatory mode information at different time scales. However, aside from the key components representing the system’s dominant forced oscillations, the decomposition results often include noise, harmonics, and other non-dominant modal components. To achieve accurate localization of the forced oscillation source, it is essential to effectively identify and extract the IMF component corresponding to the dominant forced oscillation mode. Given that forced oscillations are essentially caused by the continuous injection of energy from an external disturbance, the associated IMF component typically exhibits a high energy level. Therefore, key modes can be screened based on an energy criterion [26].
The Teager Energy Operator (TEO) is a nonlinear operator capable of tracking instantaneous variations in the frequency and amplitude of a signal. It can accurately compute the energy of different oscillatory components, thereby demonstrating significant advantages in identifying and extracting oscillation features from measured signals [27]. For a continuous-time signal Δ P i j t , the TEO for its discrete sampled version Δ P i j n is defined as follows:
ψ d Δ P i j n = Δ P i j     2 n Δ P i j n 1 Δ P i j n + 1
The discrete form of the k-th IMF component obtained by decomposing the signal using ICEEMDAN can be expressed as:
Δ P i j ,   k n = A cos ω n + φ
where ω = 2πf0/fs; f0 represents the fundamental frequency, fs represents the sampling frequency, and φ represents the initial phase. By substituting these values into Equation (12) and calculating for three adjacent points, we can obtain:
Δ P i j ,   k ( n 1 ) = A cos [ ω ( n 1 ) + φ ] Δ P i j ,   k ( n ) = A cos [ ω ( n ) + φ ] Δ P i j ,   k ( n + 1 ) = A cos [ ω ( n + 1 ) + φ ]
By solving the system of Equation (13) simultaneously, we can obtain:
A 2 sin 2 ω = Δ P i j ,   k   2 n Δ P i j ,   k n 1 Δ P i j ,   k n + 1
When ω < π / 4 , then there is ω     sin ω . Therefore, the instantaneous energy value at the sampling point n can be expressed as:
ψ d Δ P i j n A 2 ω 2
As shown in Equation (16), the energy of a signal is influenced not only by its amplitude but also by its frequency.
However, the conventional TEO exhibits significant limitations in practical engineering applications. Real-world power system signals are often contaminated by noise, transient components, and nonlinear oscillations, which can severely distort energy estimation under high-noise conditions and consequently affect the correct selection of key IMF components.
To overcome these drawbacks, this paper introduces a resolution parameter i to extend the computation window, defined as follows:
ψ d [ P ( n ) ] = P 2 ( n ) P ( n i ) P ( n + i )
It can achieve selective processing of different frequency components by adjusting the parameter i. To clarify its frequency selection characteristics, for the signal, substitute ni, n, and n + i:
Similarly, by solving simultaneously, we obtain:
ψ d [ P ( n ) ] = A 2 sin 2 ( ω i )
This result indicates that the output of ITEO depends simultaneously on the amplitude A, angular frequency ω and parameters. For the typical forced oscillation in power systems, its value is relatively small and satisfies when ω i < π / 4 it is approximately equal to sin ( ω i )     ω i . Equation (18) can be expressed as:
ψ d [ P ( n ) ] ( A ω i ) 2
Under these circumstances, ITEO not only accurately characterizes the amplitude-frequency energy of the signal, but also explicitly enhances the low-frequency components through coefficient i2, thereby improving the detection sensitivity for forced oscillations. Similarly to the constraints of TEO, the upper limit of the value of i is derived as i < fs/8f0.
On the other hand, for the high-frequency noise components, since the value is relatively large, it oscillates within the range of [−1, 1]. This results in:
ψ d [ P ( n ) ] = A 2 sin 2 ( ω i ) A 2
Compared with the traditional TEO, ITEO effectively suppresses the energy contribution of high-frequency noise, thereby achieving significant frequency selection characteristics and anti-interference capabilities.
Based on this, the energy value of ITEO for each IMF component at all sampling points within the measurement window is calculated, and the results are summed up. The calculation formula is as follows:
E k = n = 1 M ψ d [ P ( n ) ]
where Ek represents the ITEO energy value of the kth IMF component; M is the total number of sampling points of this IMF component. After calculating the ITEO energy values of each IMF component, the dominant IMF component of forced oscillation is determined based on the size of its energy weight value. The definition of energy weight can be expressed as:
η = E k n = 1 N E n
where N represents the total number of IMF components obtained from the initial signal decomposition.
In this way, the extracted key IMF components can more reliably reflect the main characteristics of the forced oscillation in the power system and ultimately provide an effective basis for the location of the forced oscillation source.

4. Source Localization of Forced Oscillation Based on Dissipative Mode Energy Flow

4.1. The Calculation Method Based on the Dissipation Mode Energy Flow

In Section 2, the wide-area measurement signal is adaptively decomposed using the ICEEMDAN method to obtain a series of IMF components. The ITEO method is then applied to extract the dominant forced oscillation components. These components not only effectively suppress interference from noise and non-dominant modes but also retain the time-domain characteristics of the forced oscillation pattern, providing a high-purity and physically meaningful input signal for subsequent energy flow calculation.
Based on reference [28], to enhance the resolution of forced oscillation modes, this paper extends the dissipative energy flow to the modal level. Using the extracted dominant oscillation mode components, a dissipative mode energy flow (DMEF) method suitable for forced oscillation source localization is constructed. The essence of this method lies in determining whether a generator is an oscillation source by calculating the energy inflow/outflow of each generator under the dominant oscillation mode. The DMEF is defined as:
W i j , D M E F = Δ P i j , IMFz 2 π Δ f j , IMF z d t + Δ Q i j , IMF z d ( Δ ln U j , IMF z )
where IMFz represents the dominant mode component of the forced oscillation; Δ P i j , IMFz and Δ Q i j , IMFz , respectively, represent the dominant mode components of the corresponding forced oscillation in the changes in active and reactive power of branch Lij; Δ f j , IMFz is the dominant mode component of the corresponding forced oscillation in the frequency change in bus j; Δ ln U j , IMFz is the dominant mode component of the corresponding forced oscillation in the logarithmic change in bus j’s voltage amplitude.
This paper further performs a linear fitting on the calculated dissipation mode energy flow curves to extract the quantitative characteristics of their changing trends. Using the least squares method, a linear regression was conducted within the observation period, resulting in:
W i j , D M E F ( t ) = A i t + b
where Ai represents the slope of the fitted curve, which is a core quantitative indicator characterizing the trend of energy flow changes. If the fitted slope Ai is less than 0, it indicates an oscillation source; if Ai is greater than or equal to 0, it indicates a non-oscillation source.

4.2. The Forced Oscillation Source Location Process Based on the Dissipation Mode Energy Flow

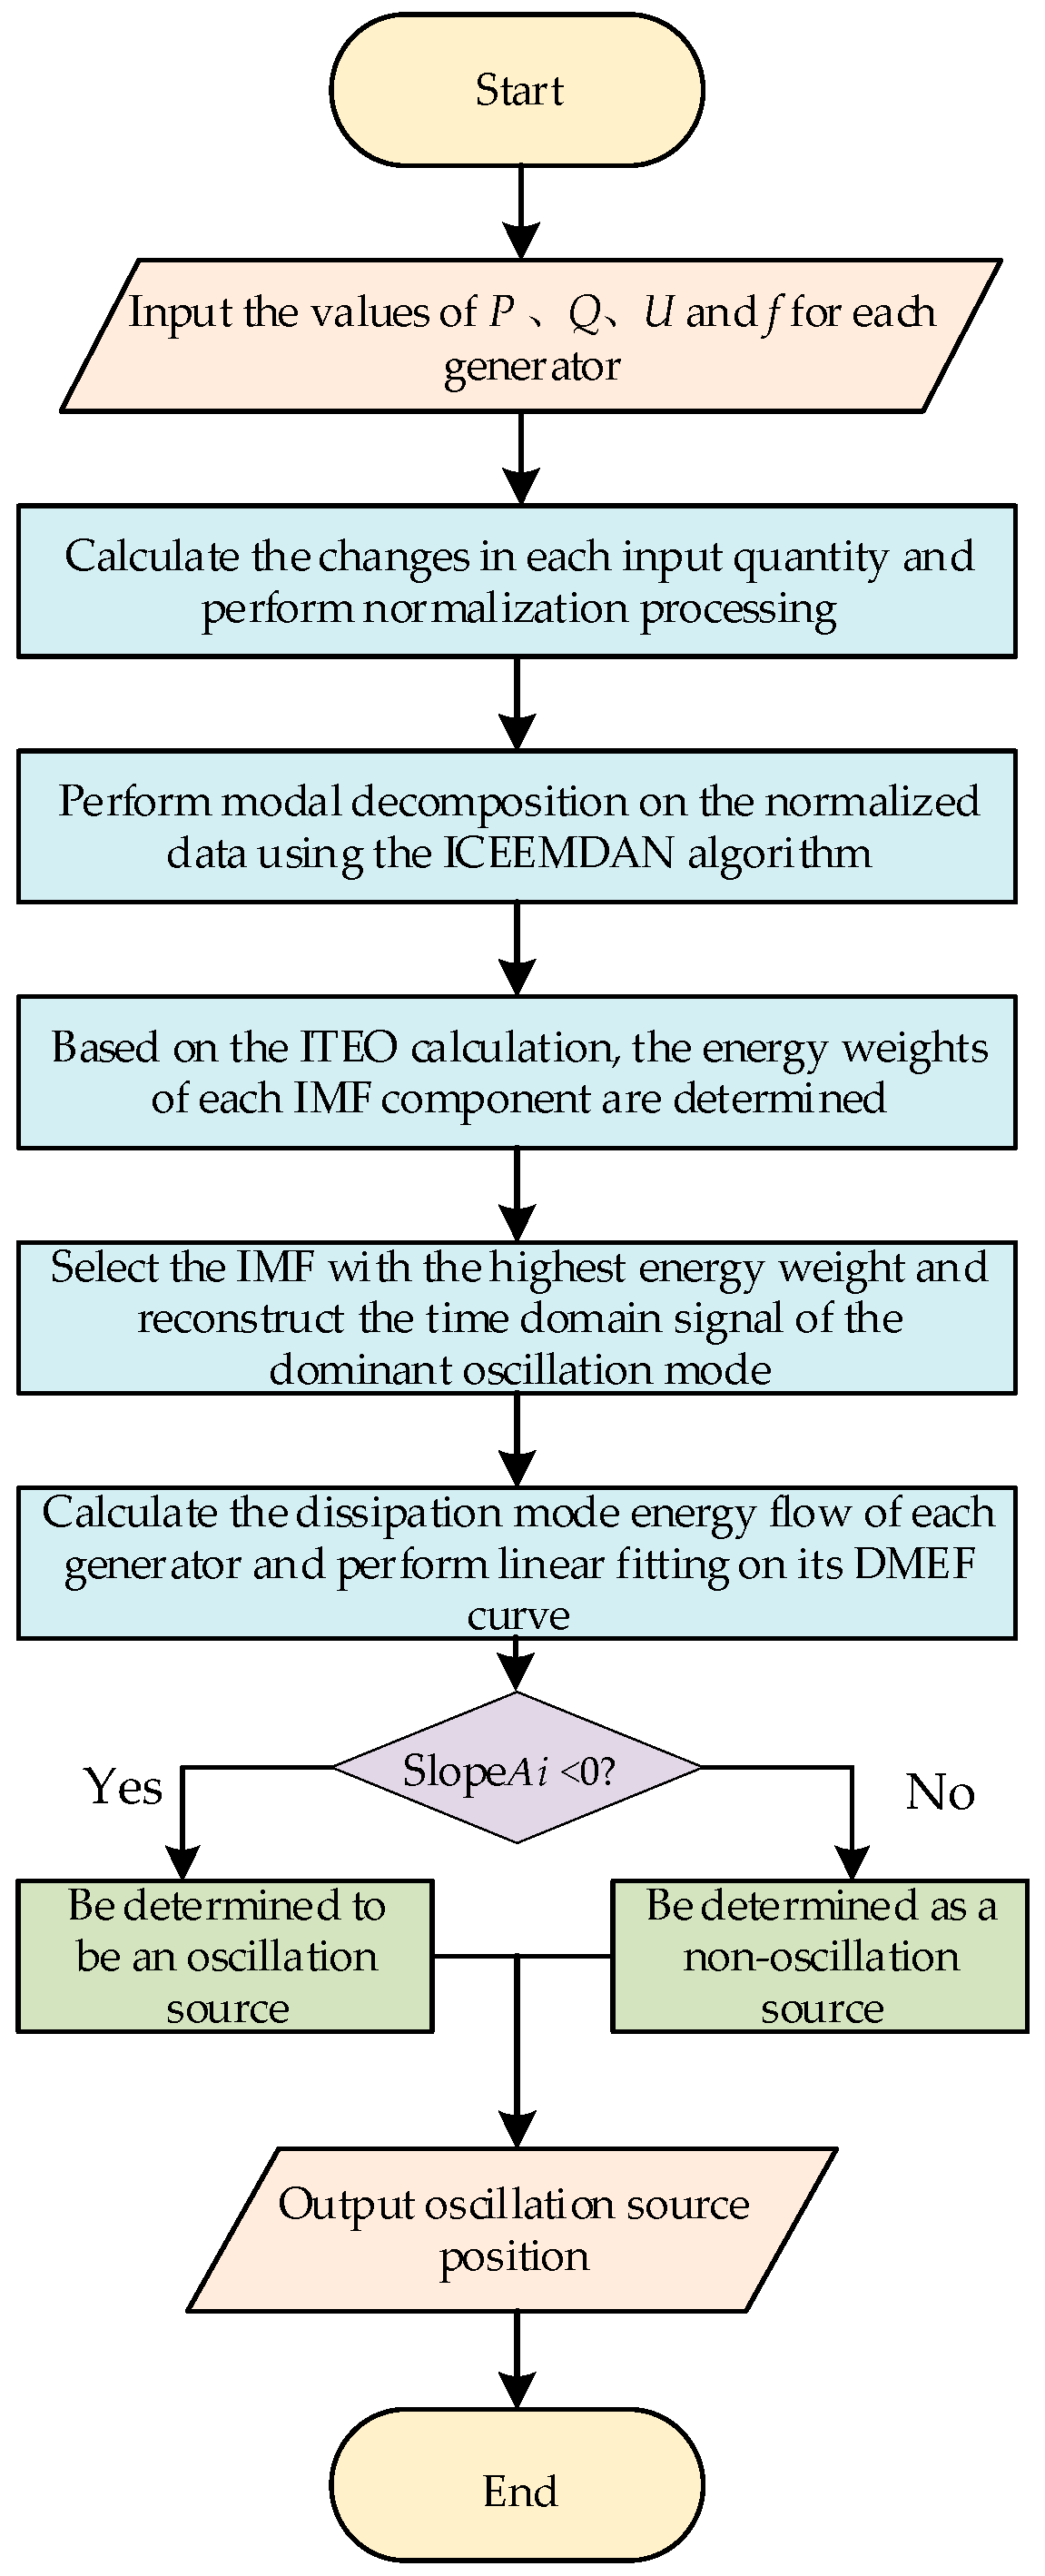
Based on the above, the oscillation source location calculation process of ICEEMDAN-ITEO in this paper can be shown in Figure 3.
The detailed implementation steps are as follows:
(1)
Perform forced oscillation simulation analysis on the test case and output the simulated data of active power (P), reactive power (Q), voltage (U), and frequency (f) for each generator;
(2)
Calculate the deviations of each electrical variable from their steady-state values and apply per-unit normalization;
(3)
Decompose the normalized simulation data using ICEEMDAN to obtain multiple IMF components;
(4)
Compute the energy weight values of each IMF component using the ITEO method and identify the dominant forced oscillation component;
(5)
Substitute the extracted dominant forced oscillation component into Equation (22) to calculate the DMEF curve for each generator;
(6)
Further compute the quantitative evaluation index Ai of the DMEF curve to determine the source of the forced power oscillation.
In summary, the forced oscillation source localization method proposed in this paper, based on ICEEMDAN-ITEO and dissipative energy flow methodology, forms a complete computational process that does not rely on an accurate system model. By leveraging advanced signal processing techniques, this method effectively extracts the dominant forced oscillation mode, providing high-purity input signals for the subsequent energy flow calculation. To comprehensively validate the effectiveness, accuracy, and robustness of the proposed method, case studies will be conducted sequentially in the modified IEEE 4-machine 2-area system, the 10-machine 39-bus system, and using real-world grid oscillation events.

5. Case Study

To validate the accuracy of the proposed ICEEMDAN-ITEO method, a detailed analysis of its effectiveness and robustness is first conducted using an IEEE 4-machine 2-area system integrated with GFM-DFIGs. Further validation is carried out on a 10-machine 39-bus system with GFM-DFIG integration to examine the method’s accuracy in complex grid scenarios. Finally, the proposed method is applied to a real-world forced oscillation event from the ISO New England power grid to verify its practical effectiveness in actual power systems.

5.1. Modified IEEE 4-Machine 2-Area System

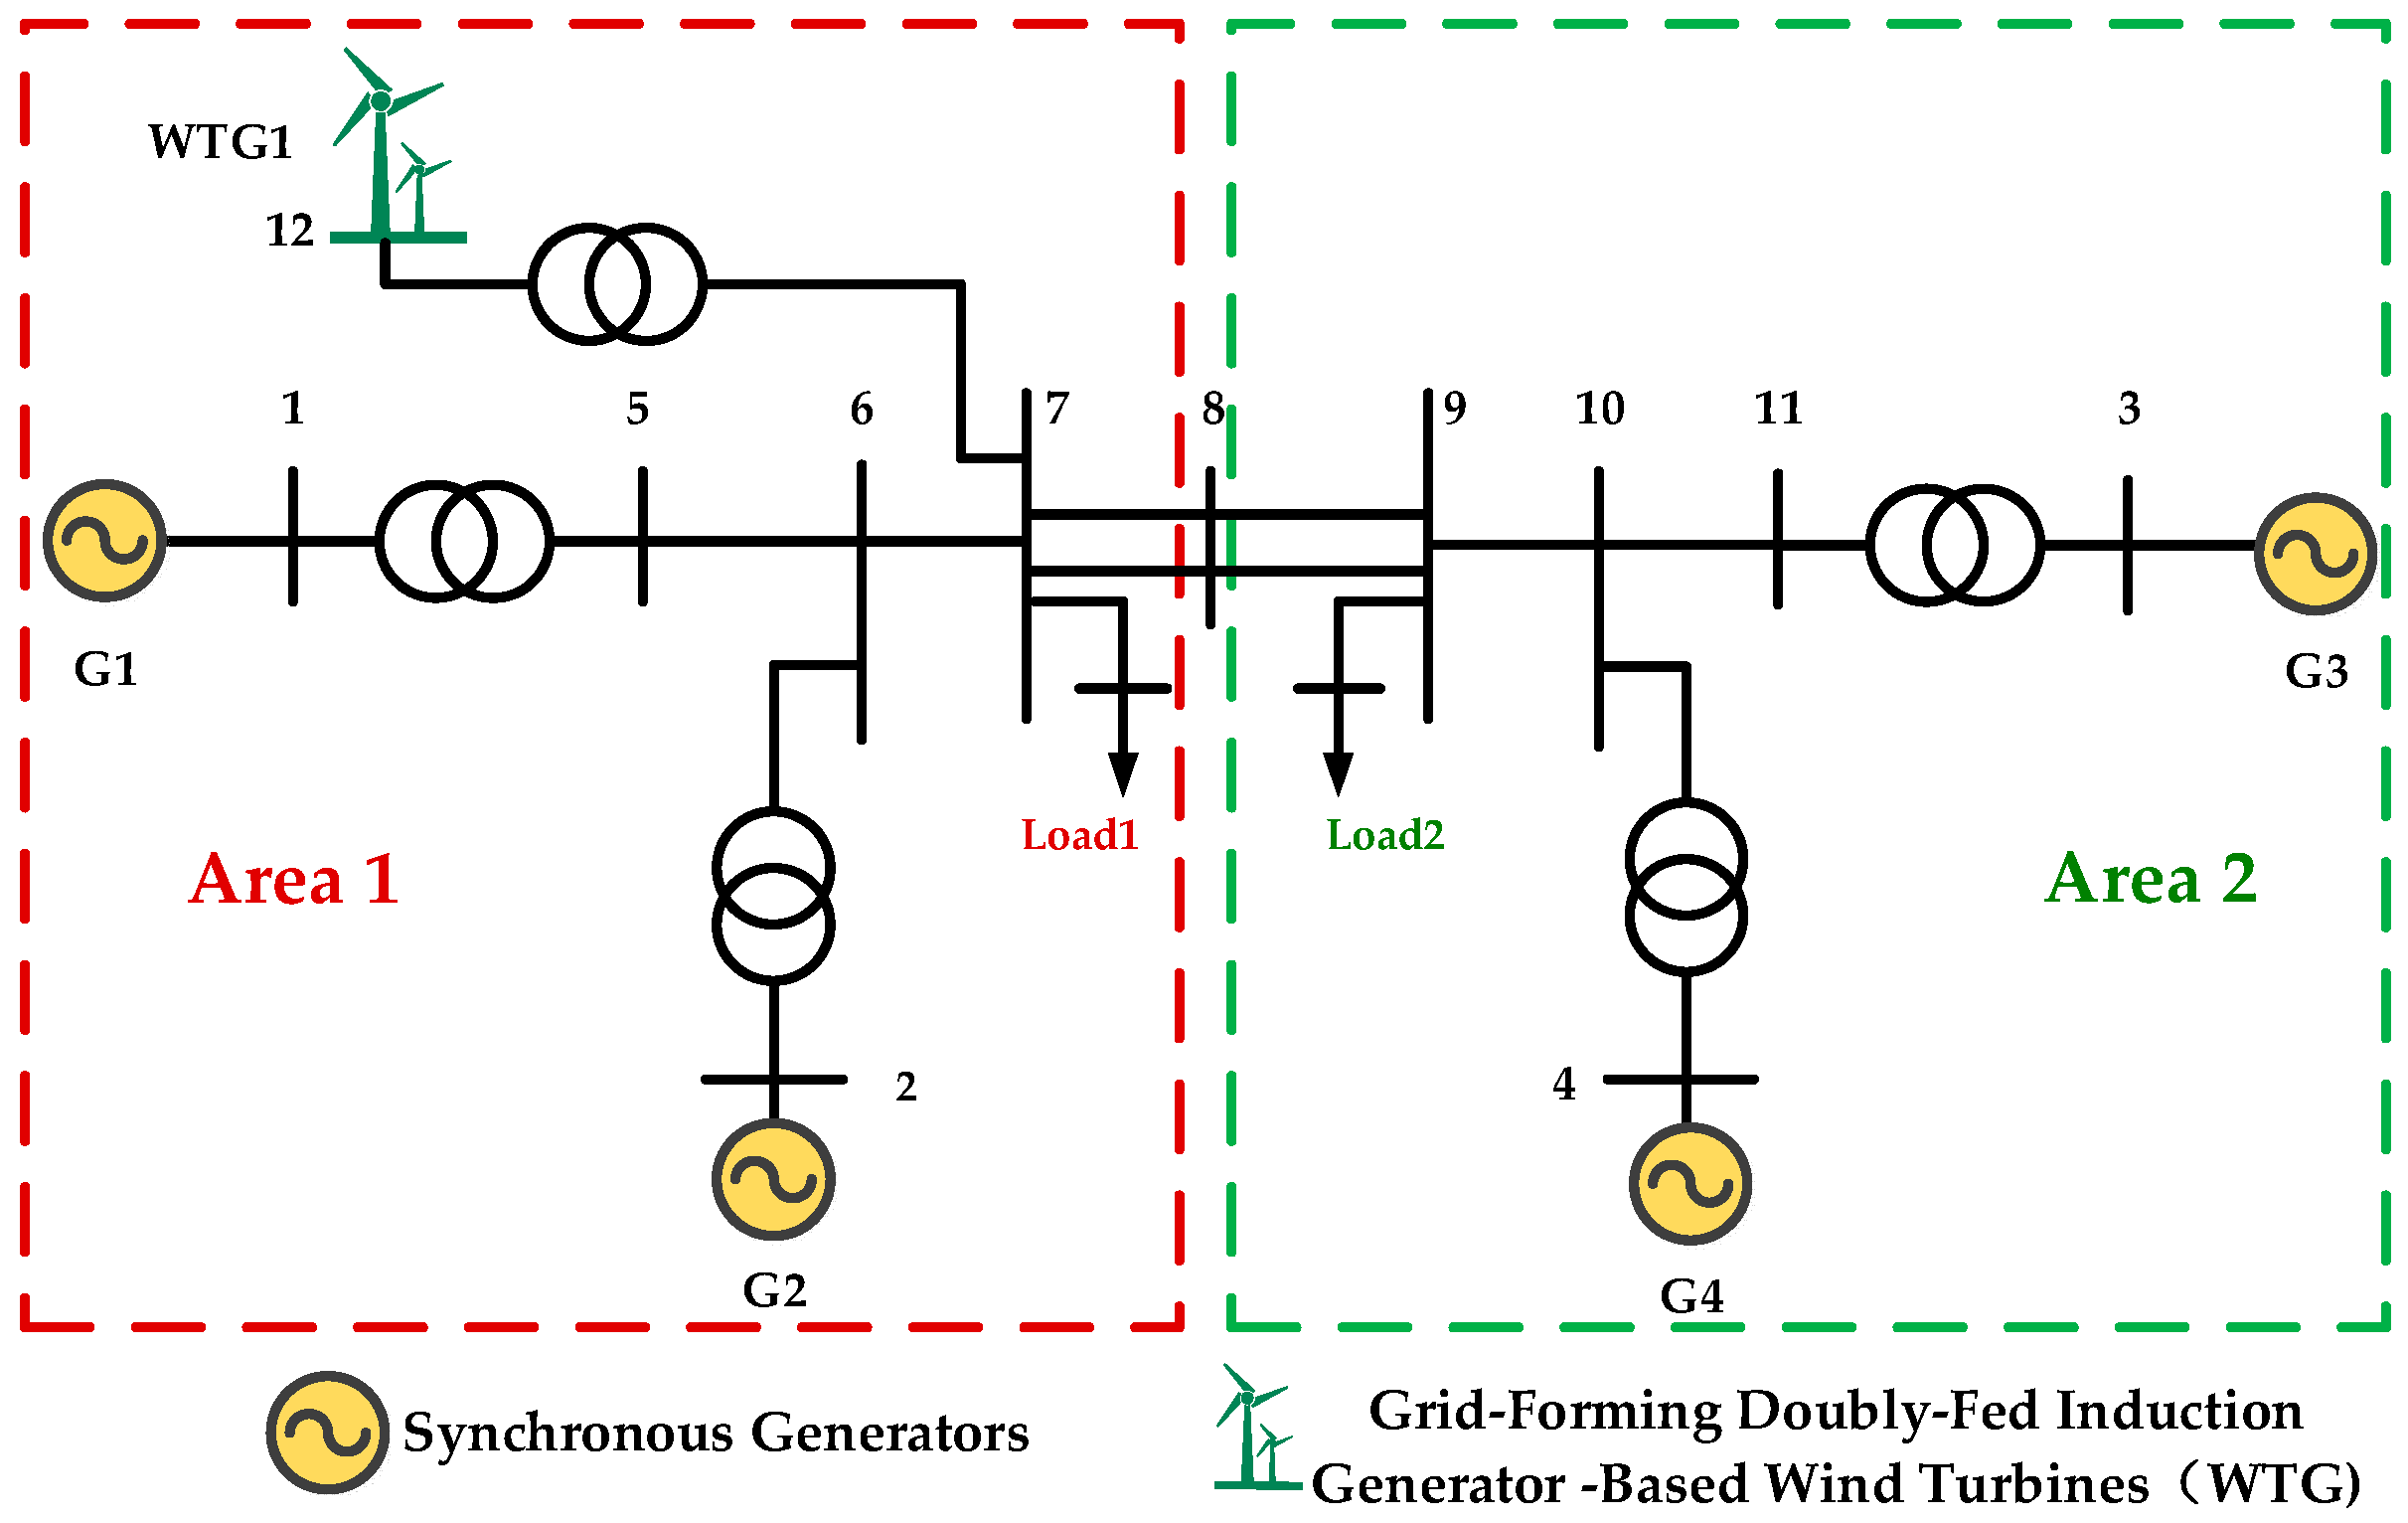
Based on the Power Factory/DIgSILENT (version 15.2) simulation platform, a modified IEEE 4-machine 2-area system was constructed for simulation tests, as illustrated in Figure 4. This benchmark system consists of two distinct areas, each containing two synchronous generators, connected by relatively long tie-lines which are prone to inter-area oscillations. The key modification to the standard model is the integration of 500 MVA Grid-Forming Doubly Fed Induction Generators at Bus 7. The detailed parameters of the network lines and the generators are provided in Appendix A Table A1 and Table A2.
To fully verify the effectiveness, robustness and accuracy of the method proposed in this paper for different types of disturbance sources, this section sets up three simulation scenarios, including: forced oscillation disturbance sources located in the excitation link of the synchronous machine, the internal control link of VSG in GFM-DFIG, and noise robustness test. Through the verification of different simulation scenarios, the correctness of the theoretical analysis is further confirmed.

5.1.1. The Disturbance Source Is Located in the Excitation Loop of the Synchronous Machine

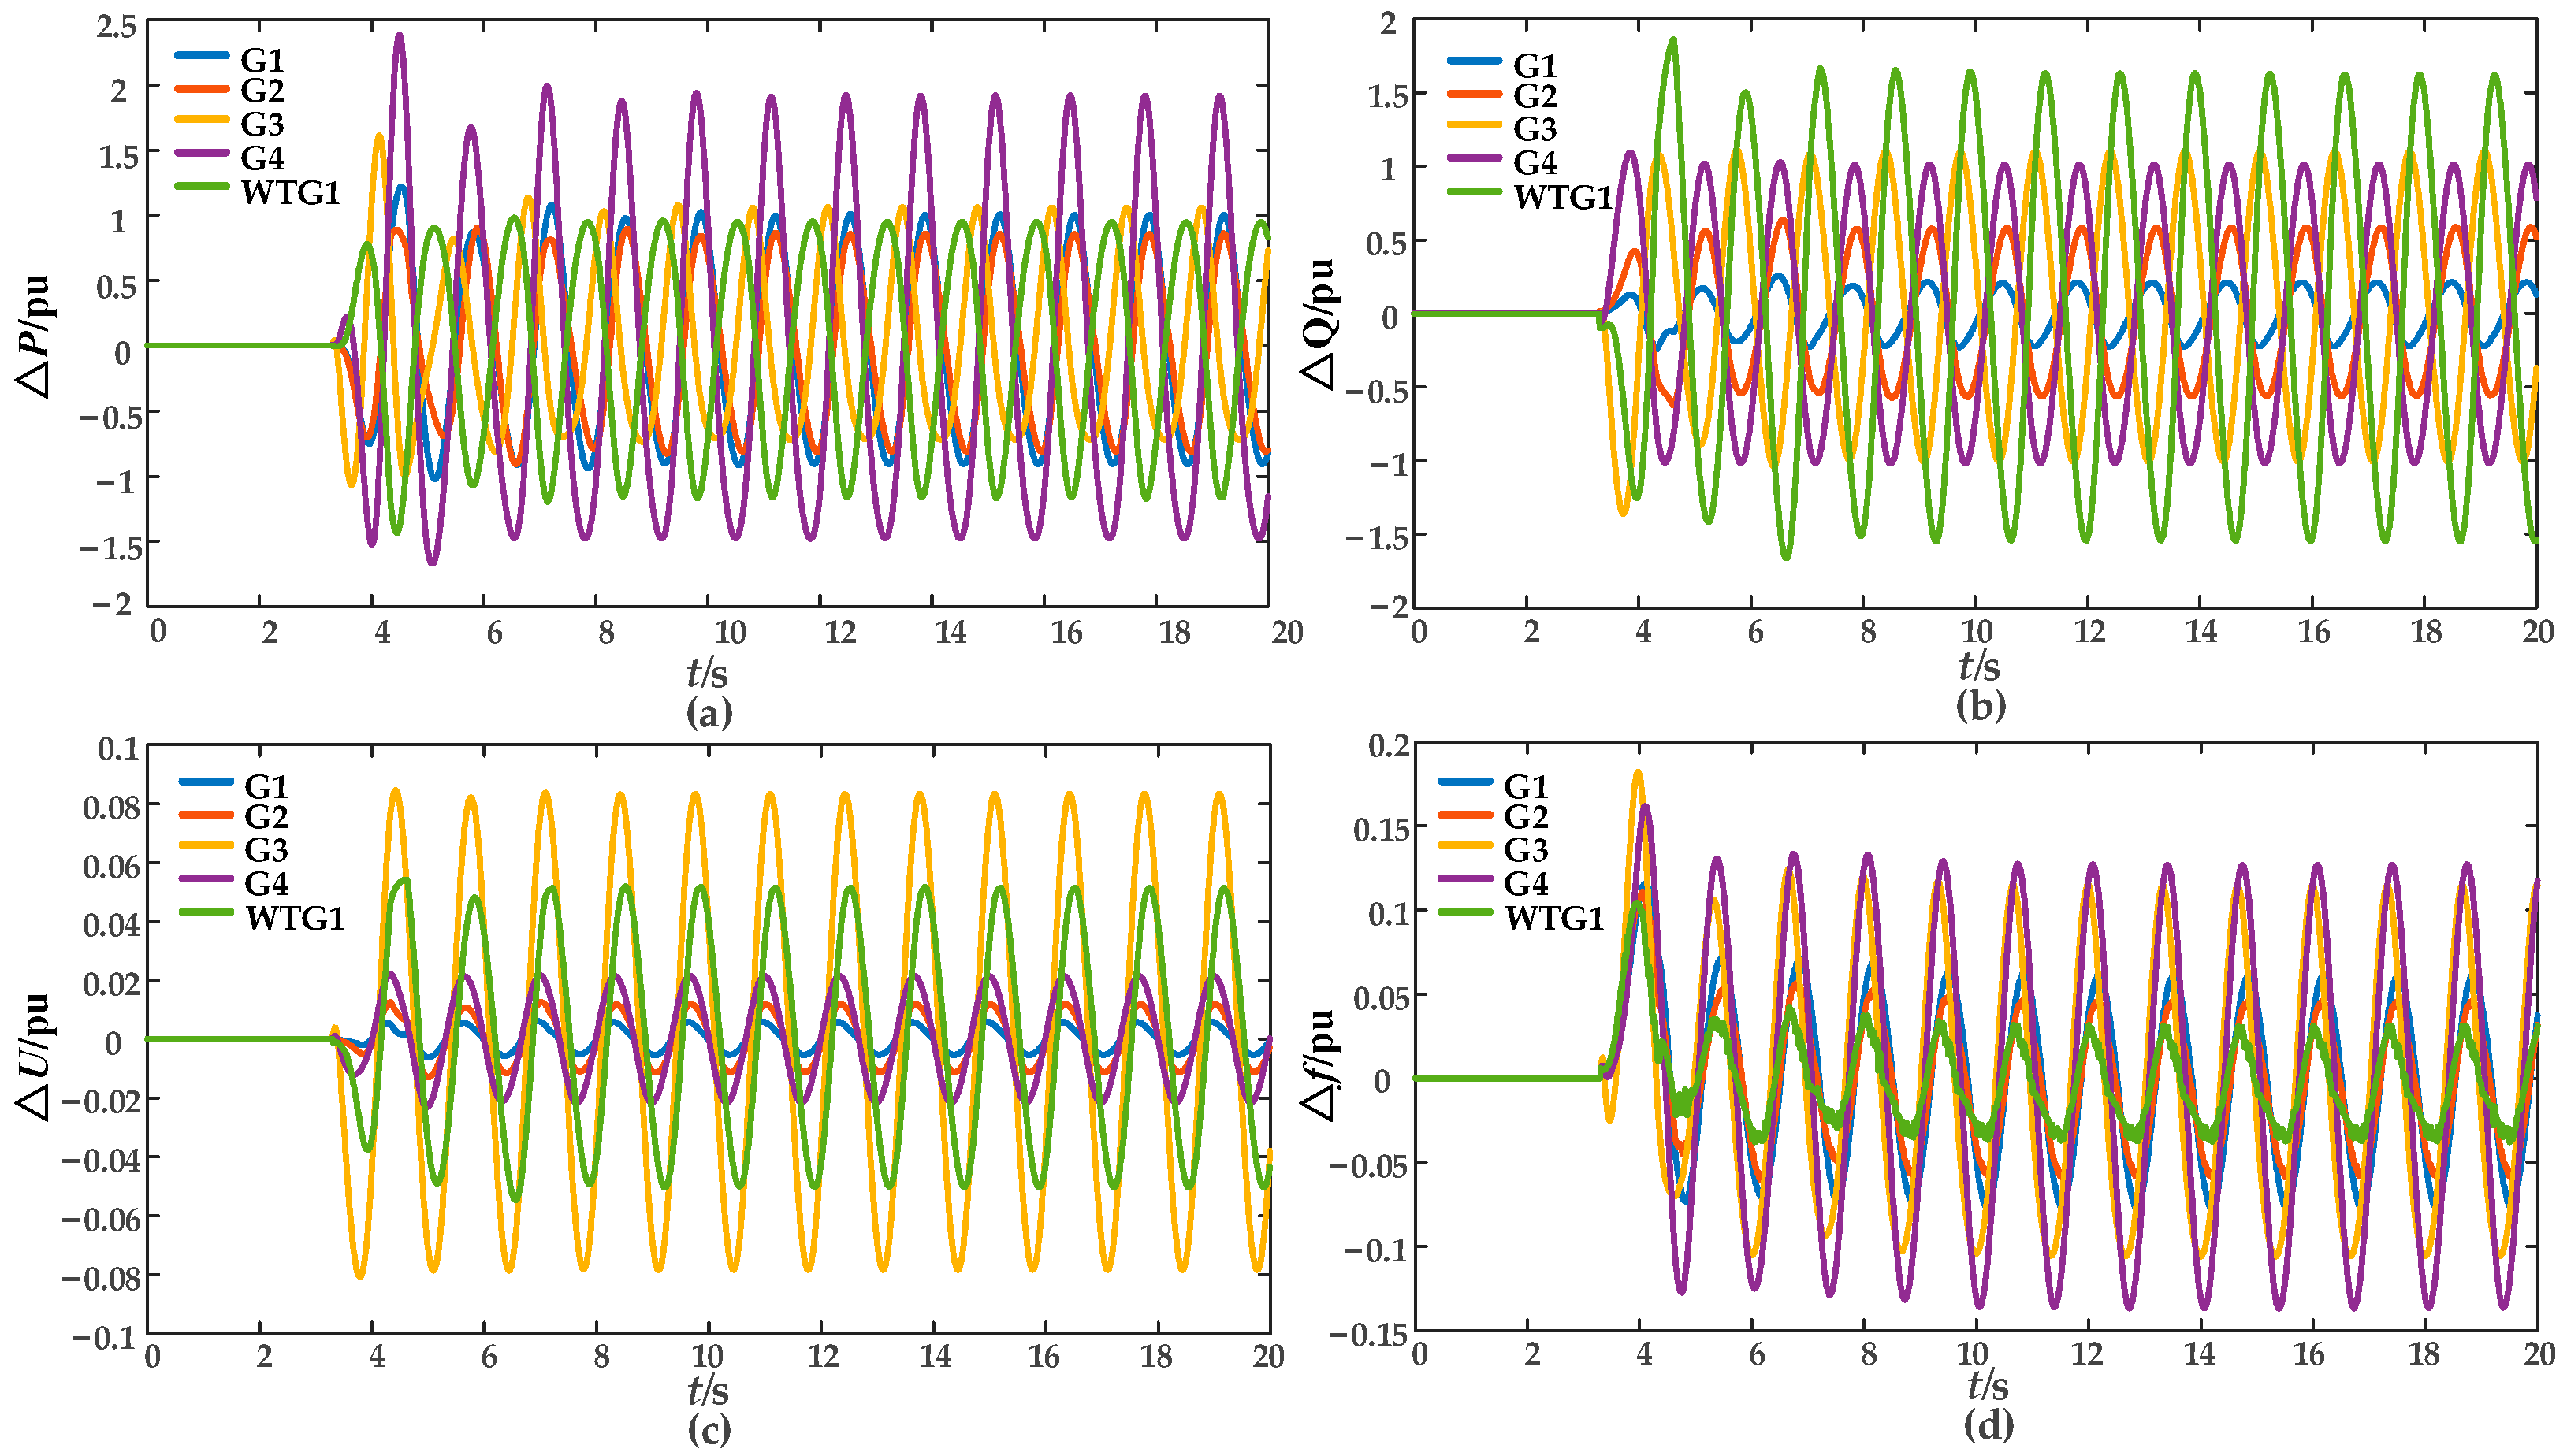
To validate the effectiveness of the proposed method in renewable-energy-integrated scenarios when a synchronous generator acts as the source of forced oscillations, this section introduces a continuous periodic disturbance signal into the excitation system of Generator G3. At simulation time t = 3.3 s, a sustained periodic disturbance with amplitude A = 0.1 p.u. and frequency f = 0.75 Hz is injected into its excitation circuit to induce forced power oscillations in the system. The mathematical expression of the disturbance is given as follows:
V ref = V ref + A sin ( 2 π f t )
where V ref represents the reference voltage of the excitation link; A is the amplitude of the periodic disturbance; f is the frequency of the disturbance signal.
During the simulation, the electrical variations (ΔP, ΔQ, ΔU, Δf) of each generator within the system were calculated, and the changes in related electrical variables of each generator were obtained, as shown in Figure 5.
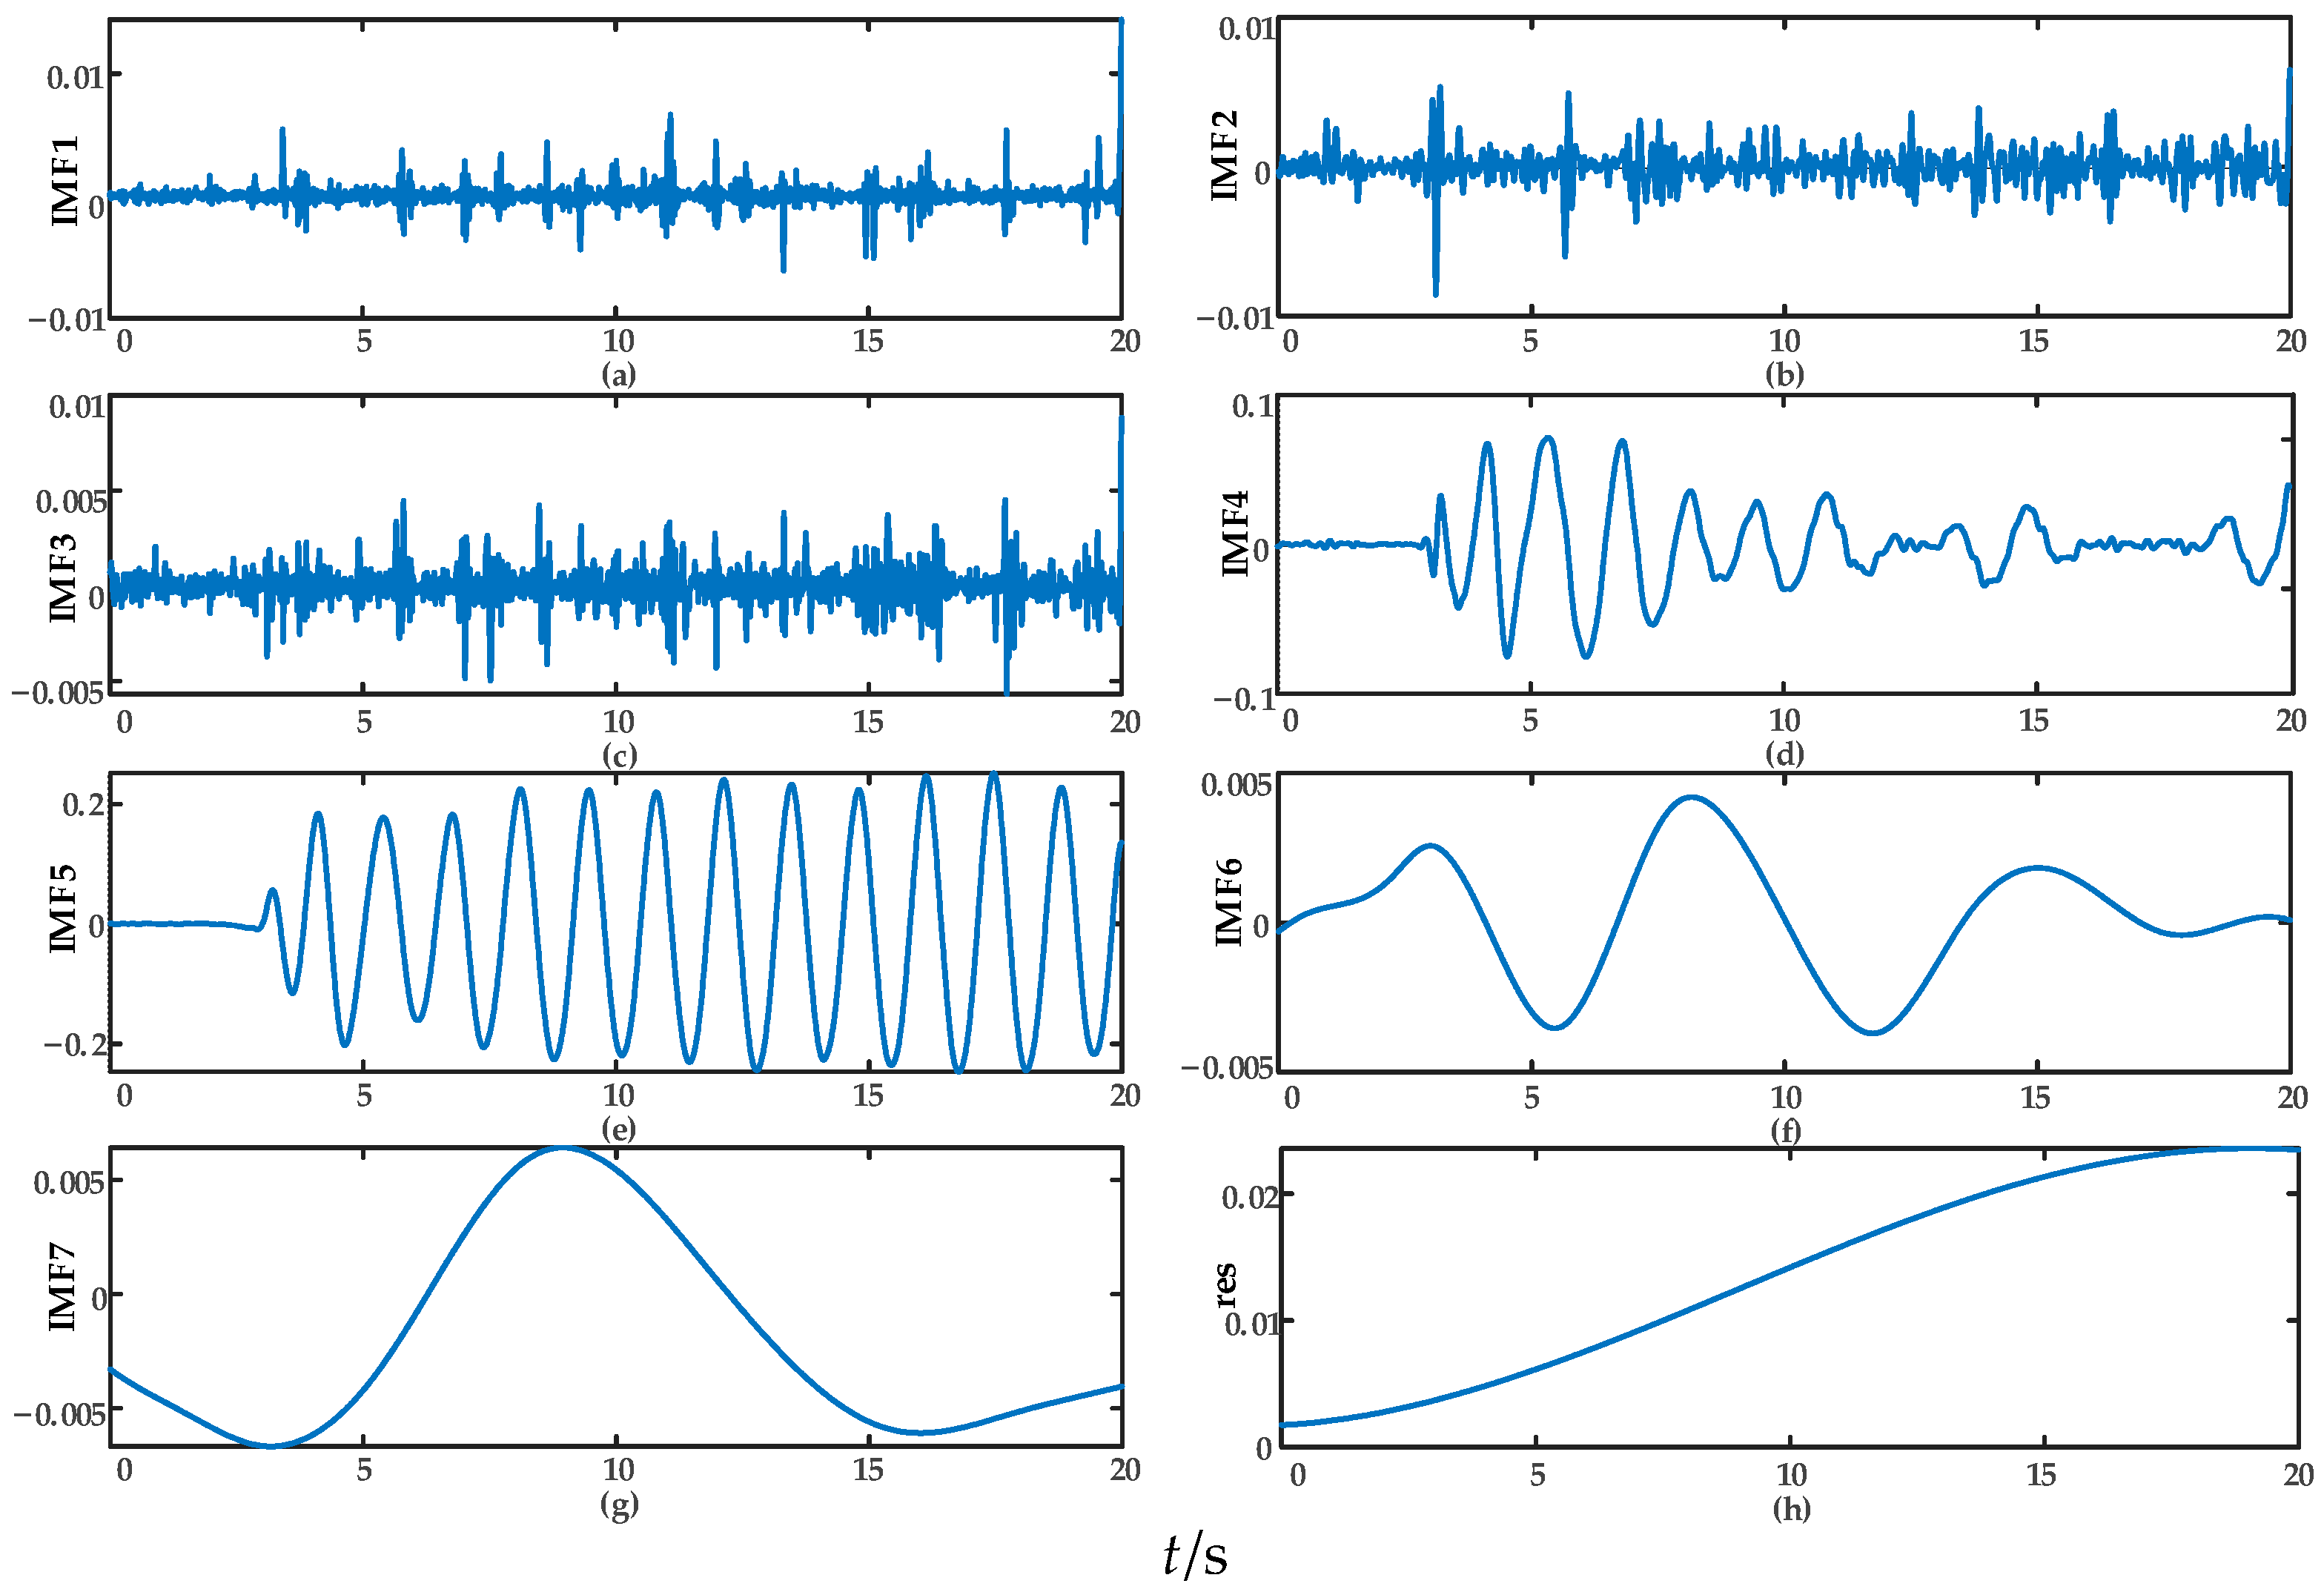
Furthermore, considering that differences in data magnitude may affect the computational results, all electrical quantities are normalized using a per-unit system. Based on the normalized results, ICEEMDAN decomposition is performed. Taking the active power variation in Generator G3 as an example, the results after ICEEMDAN modal decomposition are shown in Figure 6.
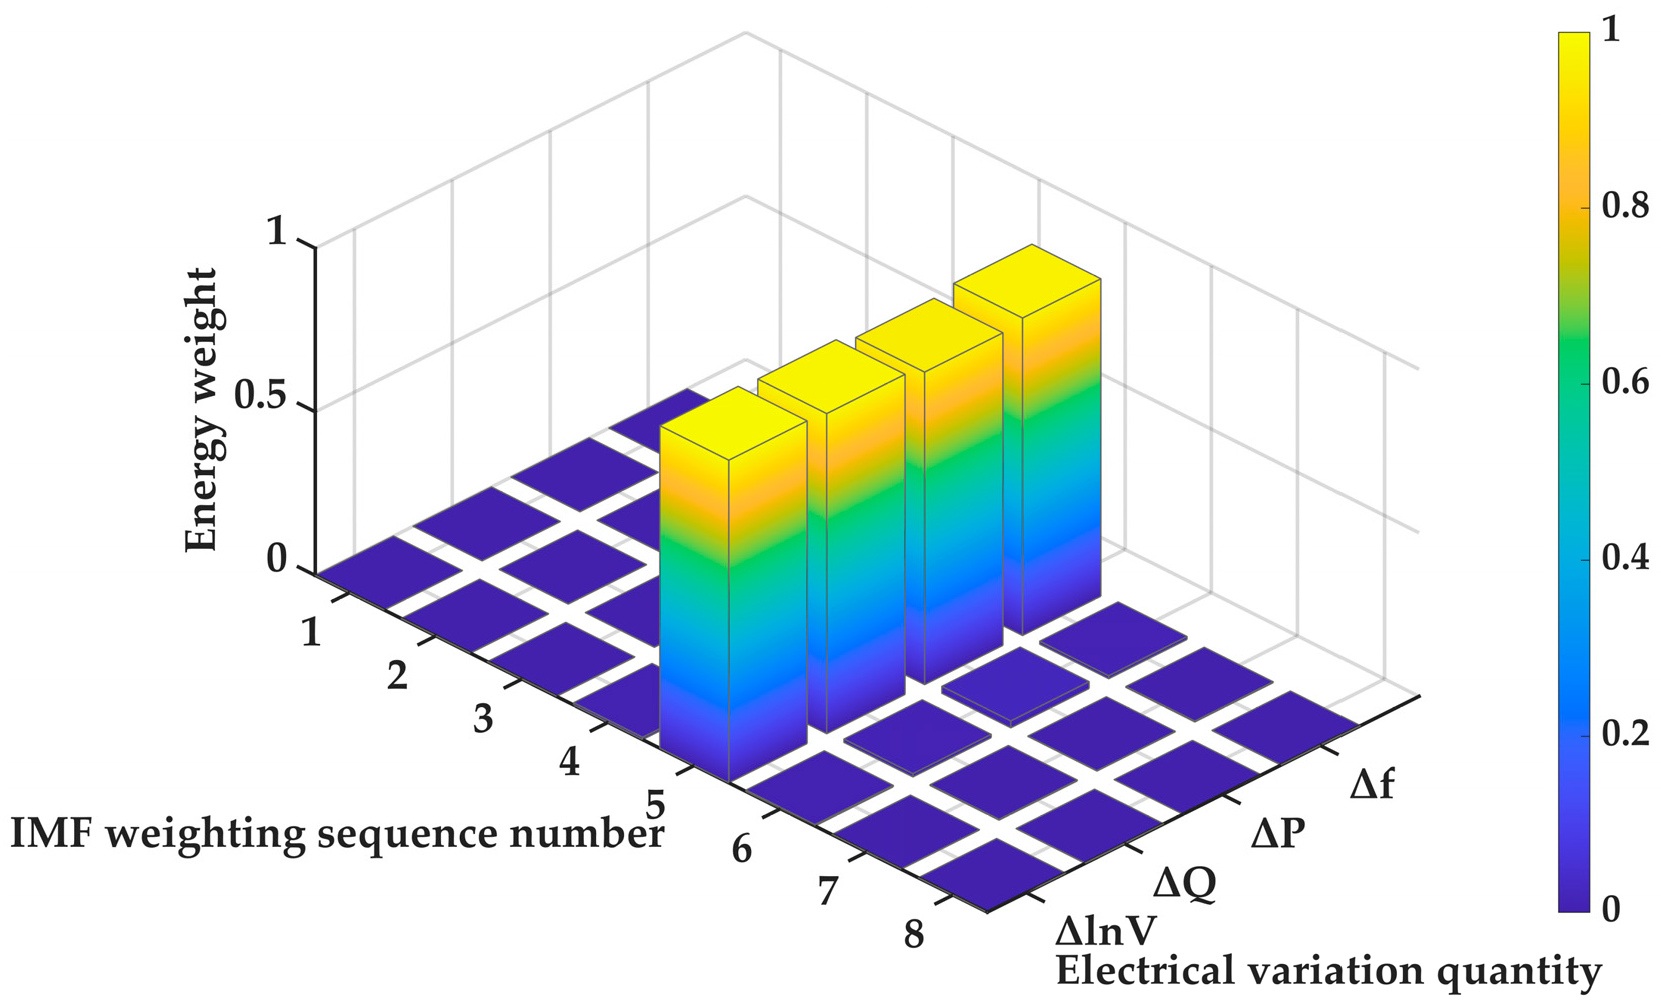
As shown in Figure 6, based on the variation in active power of Generator G3, the ICEEMDAN method decomposes the ΔP signal into seven IMF components and one residual component, which represent distinct oscillation modes. To further identify the dominant mode of the forced oscillation, each IMF component obtained from the ICEEMDAN decomposition is first substituted into Equations (21) and (22) to calculate the corresponding ITEO energy and its associated weight value. Subsequently, based on the computed energy weights, the key IMF component representing the forced oscillation is determined. The heatmap illustrating the ITEO energy weights of the IMF components for the electrical variations in G3 is shown in Figure 7.
As shown in Figure 7, the energy weight of the IMF5 component significantly exceeds those of the other IMF components, indicating that IMF5 represents the dominant oscillatory mode of G3. Similarly, the energy weights of the IMF components for the other generators in the system are calculated to identify their respective dominant oscillation modes. The corresponding time-domain signals are then reconstructed based on these dominant components. The reconstructed signals are substituted into Equation (23) for further computation, and the results are presented in Figure 8.
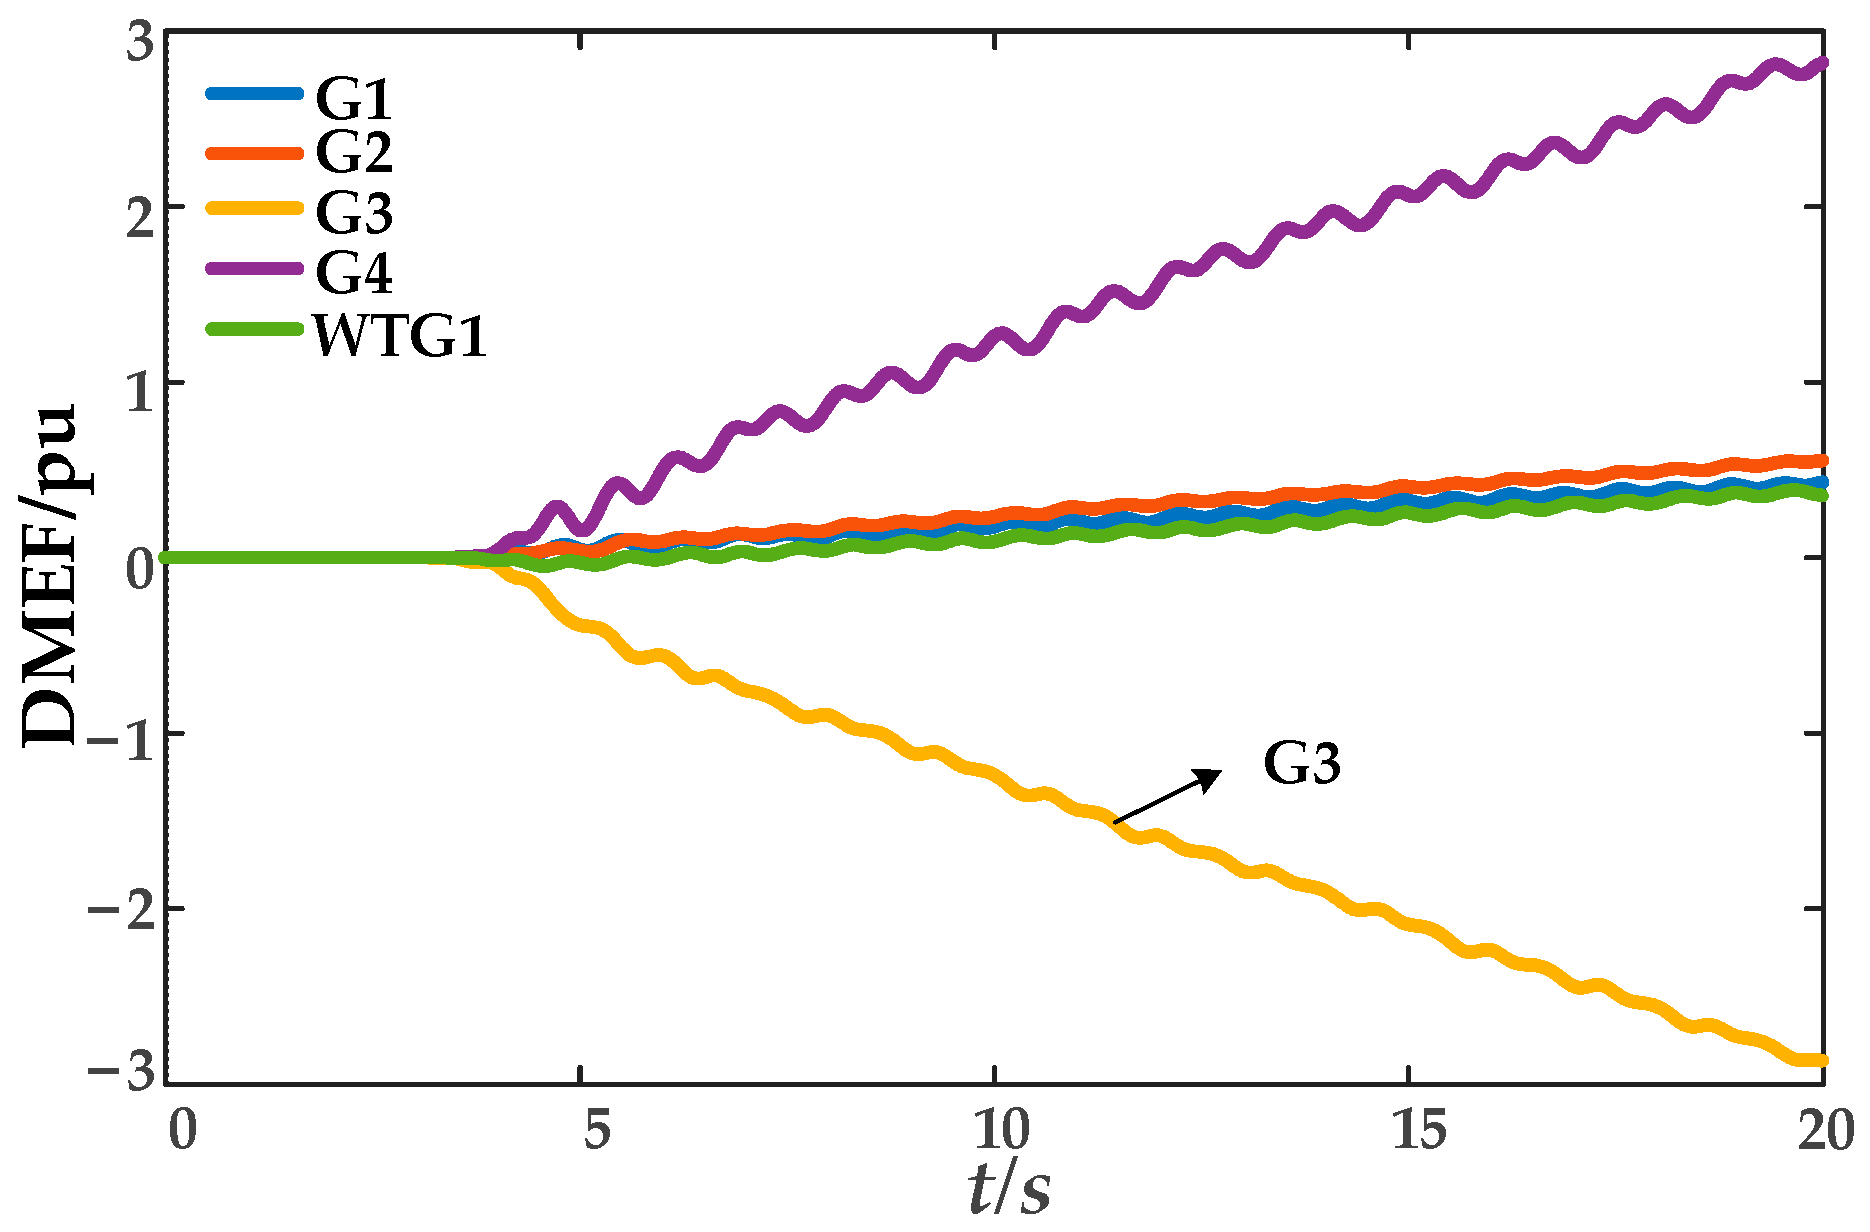
As indicated by the DMEF calculation results in Figure 8, the DMEF curve of Generator G3 exhibits a negative slope with a consistently decreasing trend, while the curves of the other generators show positive slopes or relatively stable variations. In accordance with the criterion established earlier, G3 is identified as the source of the forced power oscillation. This result demonstrates the ability of the proposed method to accurately locate the oscillation source under this scenario.
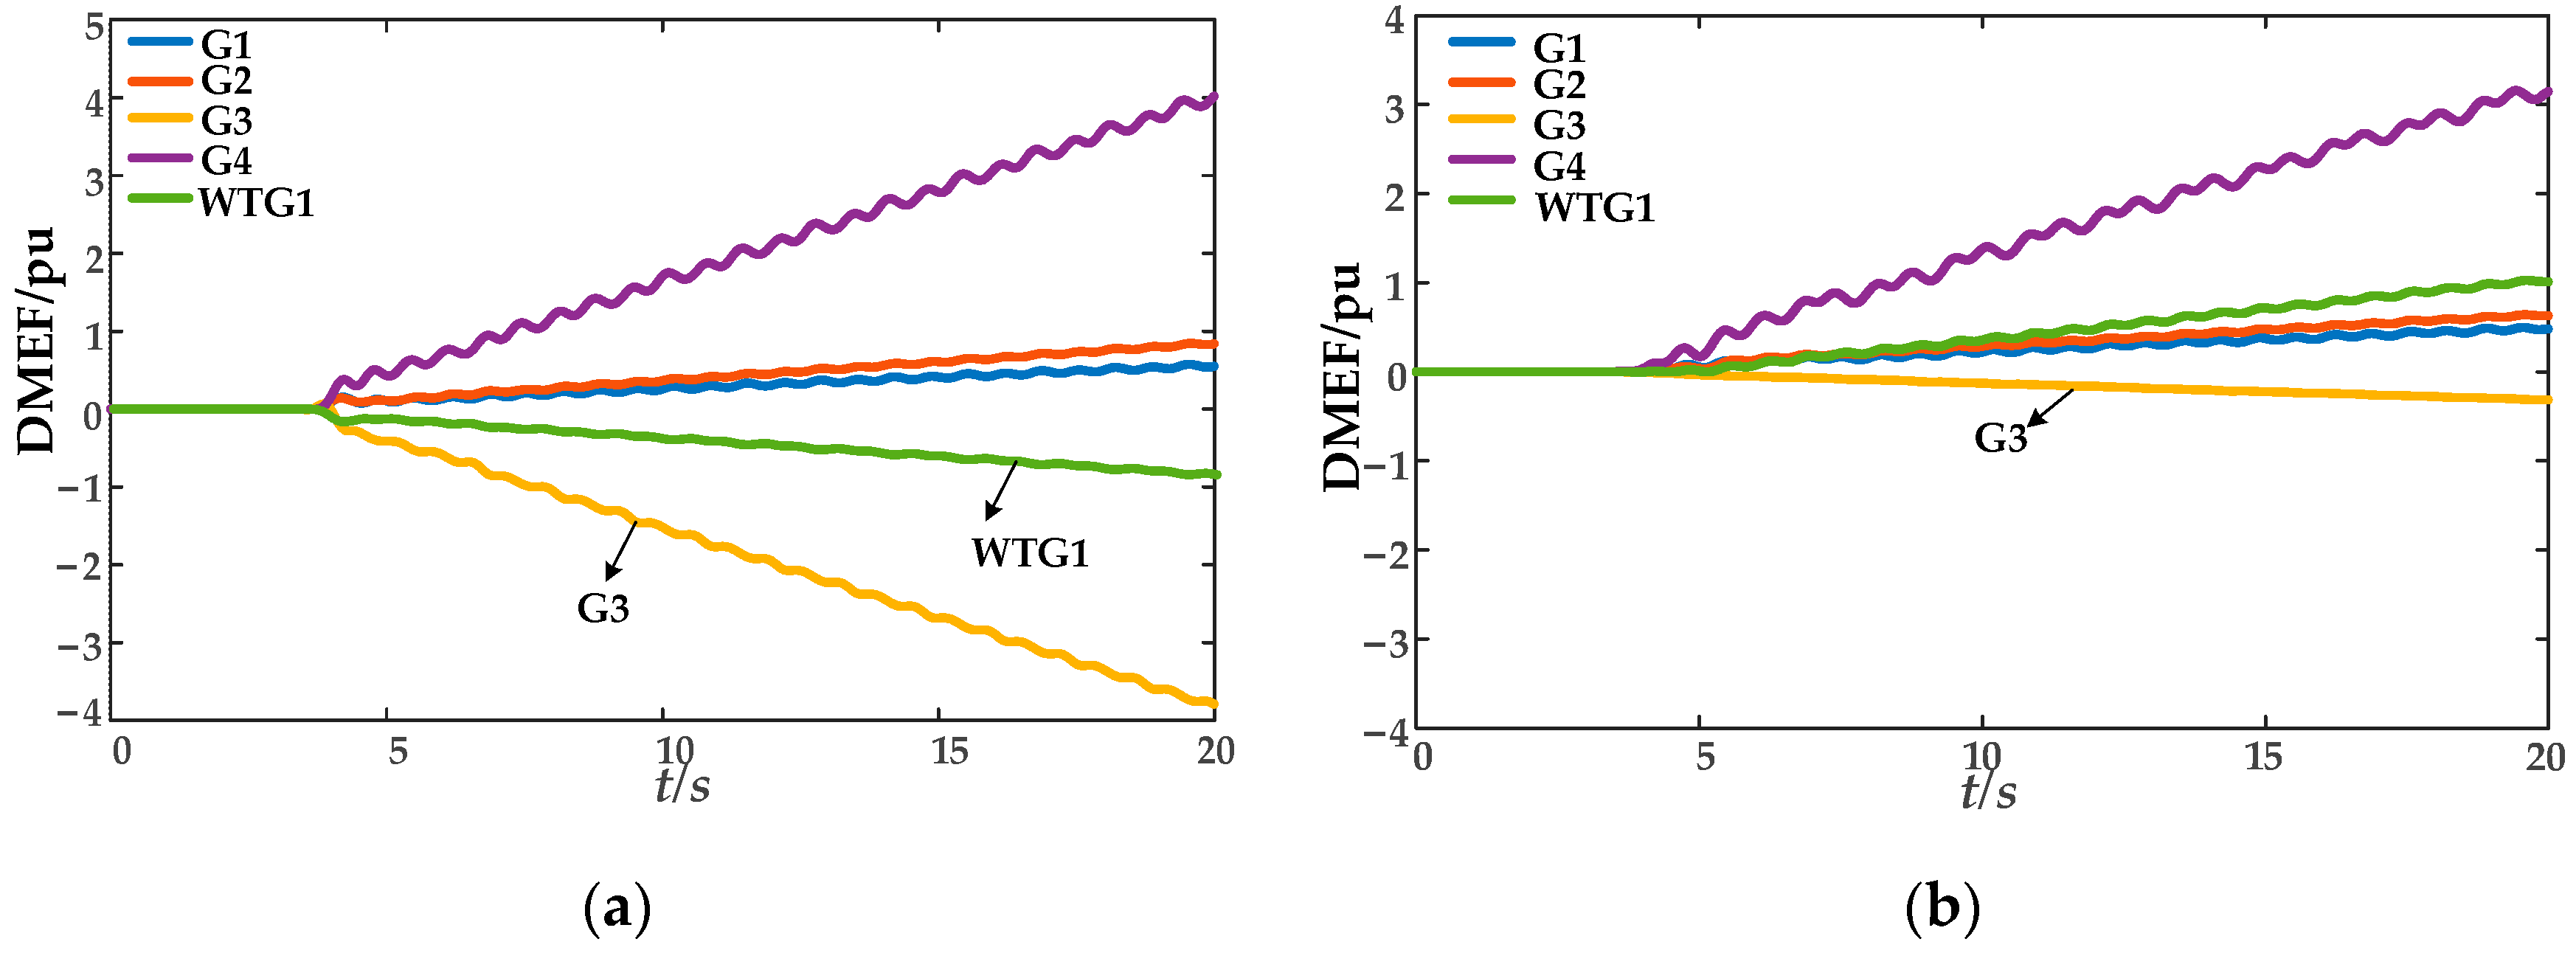
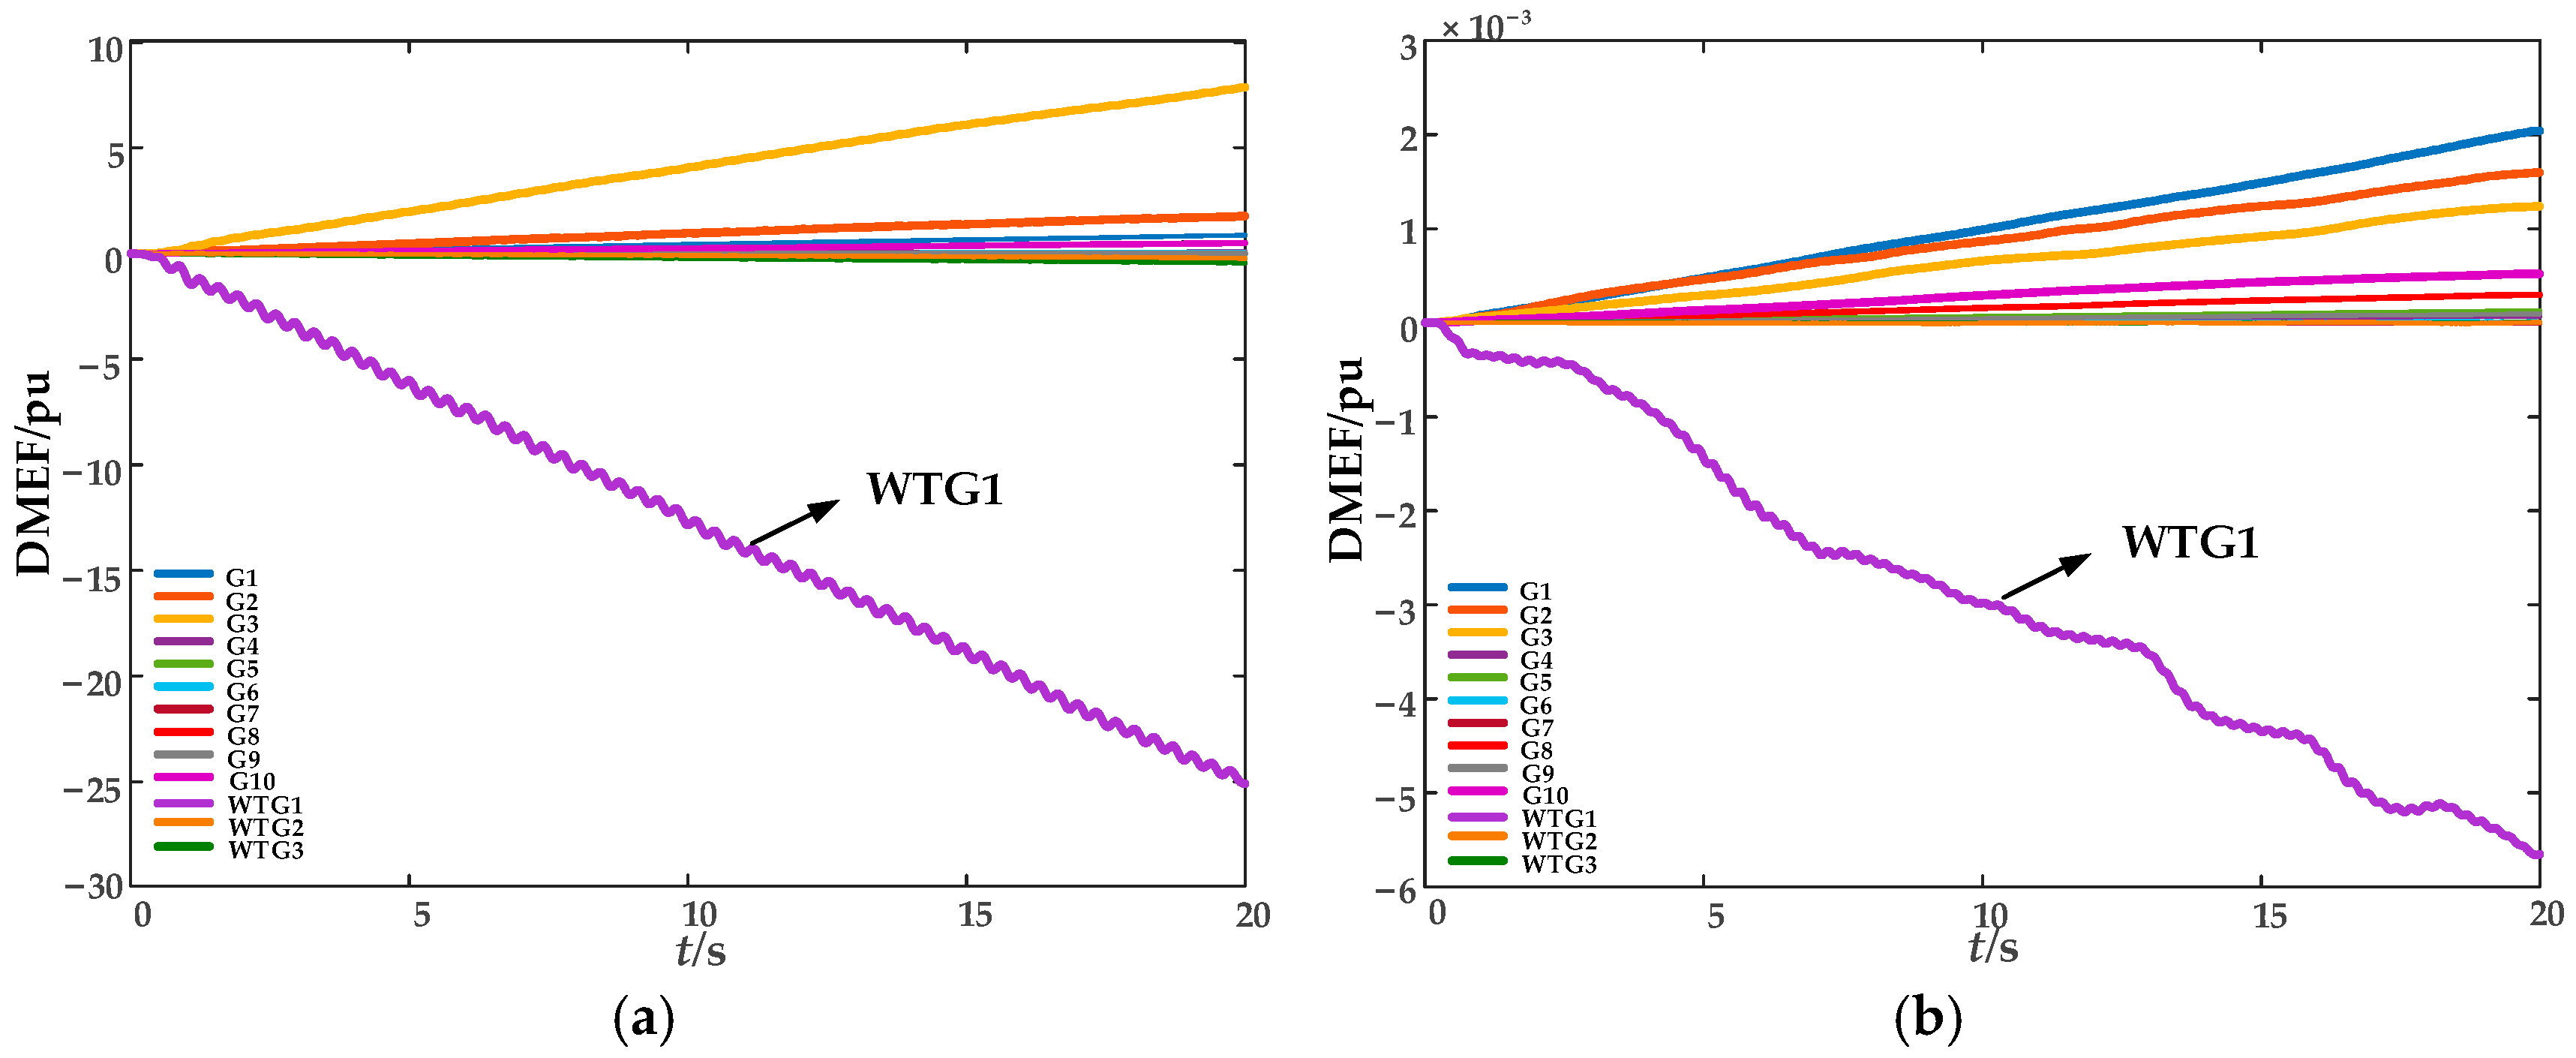
For further comparison, this section references the traditional dissipative energy flow-based localization method from [17], along with the MEMD-based approach introduced in [16]. The results obtained using these methods are presented in Figure 9. As shown in the figure, both Generator G3 and the wind turbine WTG1 display negative slopes in their dissipative energy flow curves according to the traditional method. According to the traditional criterion, both would be misidentified as oscillation sources. For the MEMD-based method, calculations indicate that although the dissipative energy flow of Generator G3 is negative and exhibits a declining trend, the rate of decline is relatively slow. The dissipative energy flows of the remaining generators are positive with no declining trends, correctly identifying them as non-oscillation sources. The localization result is consistent with the applied disturbance. However, compared with the proposed method, the MEMD-based approach struggles to effectively handle the prominent mode mixing caused by multi-scale oscillatory components from GFM-DFIGs and fails to adequately suppress switching noise interference, leading to incomplete extraction of the dominant oscillation mode and distortion in energy estimation, which results in an indistinct declining trend in the energy flow curve of Generator G3, thereby interfering with the accurate localization of the forced oscillation source.
This misjudgment highlights a critical limitation of the conventional and some improved methods when applied to modern power systems with grid-forming wind integration: due to their inability to effectively suppress harmonic interference and decouple multi-mode oscillations, these approaches introduce substantial redundant information during energy flow computation. Especially in systems with high penetration of renewable generation, the fast power electronic responses of wind turbines differ significantly from the dynamics of traditional synchronous generators. Without a mechanism to filter out non-dominant modes and noise, such methods are prone to inaccuracies in energy calculation, ultimately leading to faulty localization.

5.1.2. Comparison of Computational Efficiency

Table 2 provides a further comparison of the computational efficiency among the ICEEMDAN-ITEO method, MEMD-TEO method, and the traditional dissipative energy flow (DEF) method (the hardware configuration of the computing platform is: CPU Intel Core i5-1035G1 (Intel Corporation, Santa Clara, CA, USA), base frequency 1.0 GHz, memory 16 GB). As shown in Table 2, the computation time required by the traditional DEF method is 14.541 s, that of the MEMD-TEO method is 10.354 s, and that of the proposed ICEEMDAN-ITEO method is 7.272 s. These results indicate that the proposed method can effectively achieve higher computational efficiency in oscillation source localization.

5.1.3. The Disturbance Source Is Located in the Internal Control Section of the GFM-DFIG

While existing research has primarily focused on forced oscillations caused by periodic disturbances from synchronous machines or loads, there has been limited attention to oscillations originating from the internal control loops of renewable energy equipment such as GFM-DFIGs. In practice, the VSG control strategy employed by grid-forming doubly fed wind turbines—including virtual inertia control, droop control, and power outer loops—may also become a source of forced oscillations under parameter perturbations or external disturbances [29]. Such oscillations differ fundamentally from those triggered by traditional synchronous generators, exhibiting more complex modal coupling mechanisms, for instance. To address this issue, this section establishes two test cases, a continuous periodic disturbance with amplitude A = 0.1 p.u. and frequency f = 0.75 Hz is injected into the active power reference Pref of WTG1 and the voltage reference Uref of the reactive voltage control loop, respectively, at simulation time t = 2.7 s to excite forced oscillations. The mathematical form of the disturbance is given as follows:
P r e f = P r e f + A sin ( 2 π f t )
U r e f = U r e f + A sin ( 2 π f t )
The computational procedure is similar to that described earlier. Under the disturbance conditions applied at the Pref and Qref points, respectively, the heatmaps of the ITEO energy weights for the IMF components of the electrical variations in WTG1 are shown in Figure 10a,b.
As can be seen from Figure 10, in both cases, the IMF5 component of WTG1’s electrical variations exhibits the highest energy weight, indicating that IMF5 is the dominant oscillatory mode component for WTG1 under both disturbance scenarios. The time-domain signals were reconstructed accordingly based on this component. Similarly, the modal energy weights for the other generators in the system were calculated to identify their dominant oscillatory mode components. These components were then used to reconstruct the time-domain signals, which were subsequently substituted into Equation (23) for further computation. The results are presented in Figure 11.
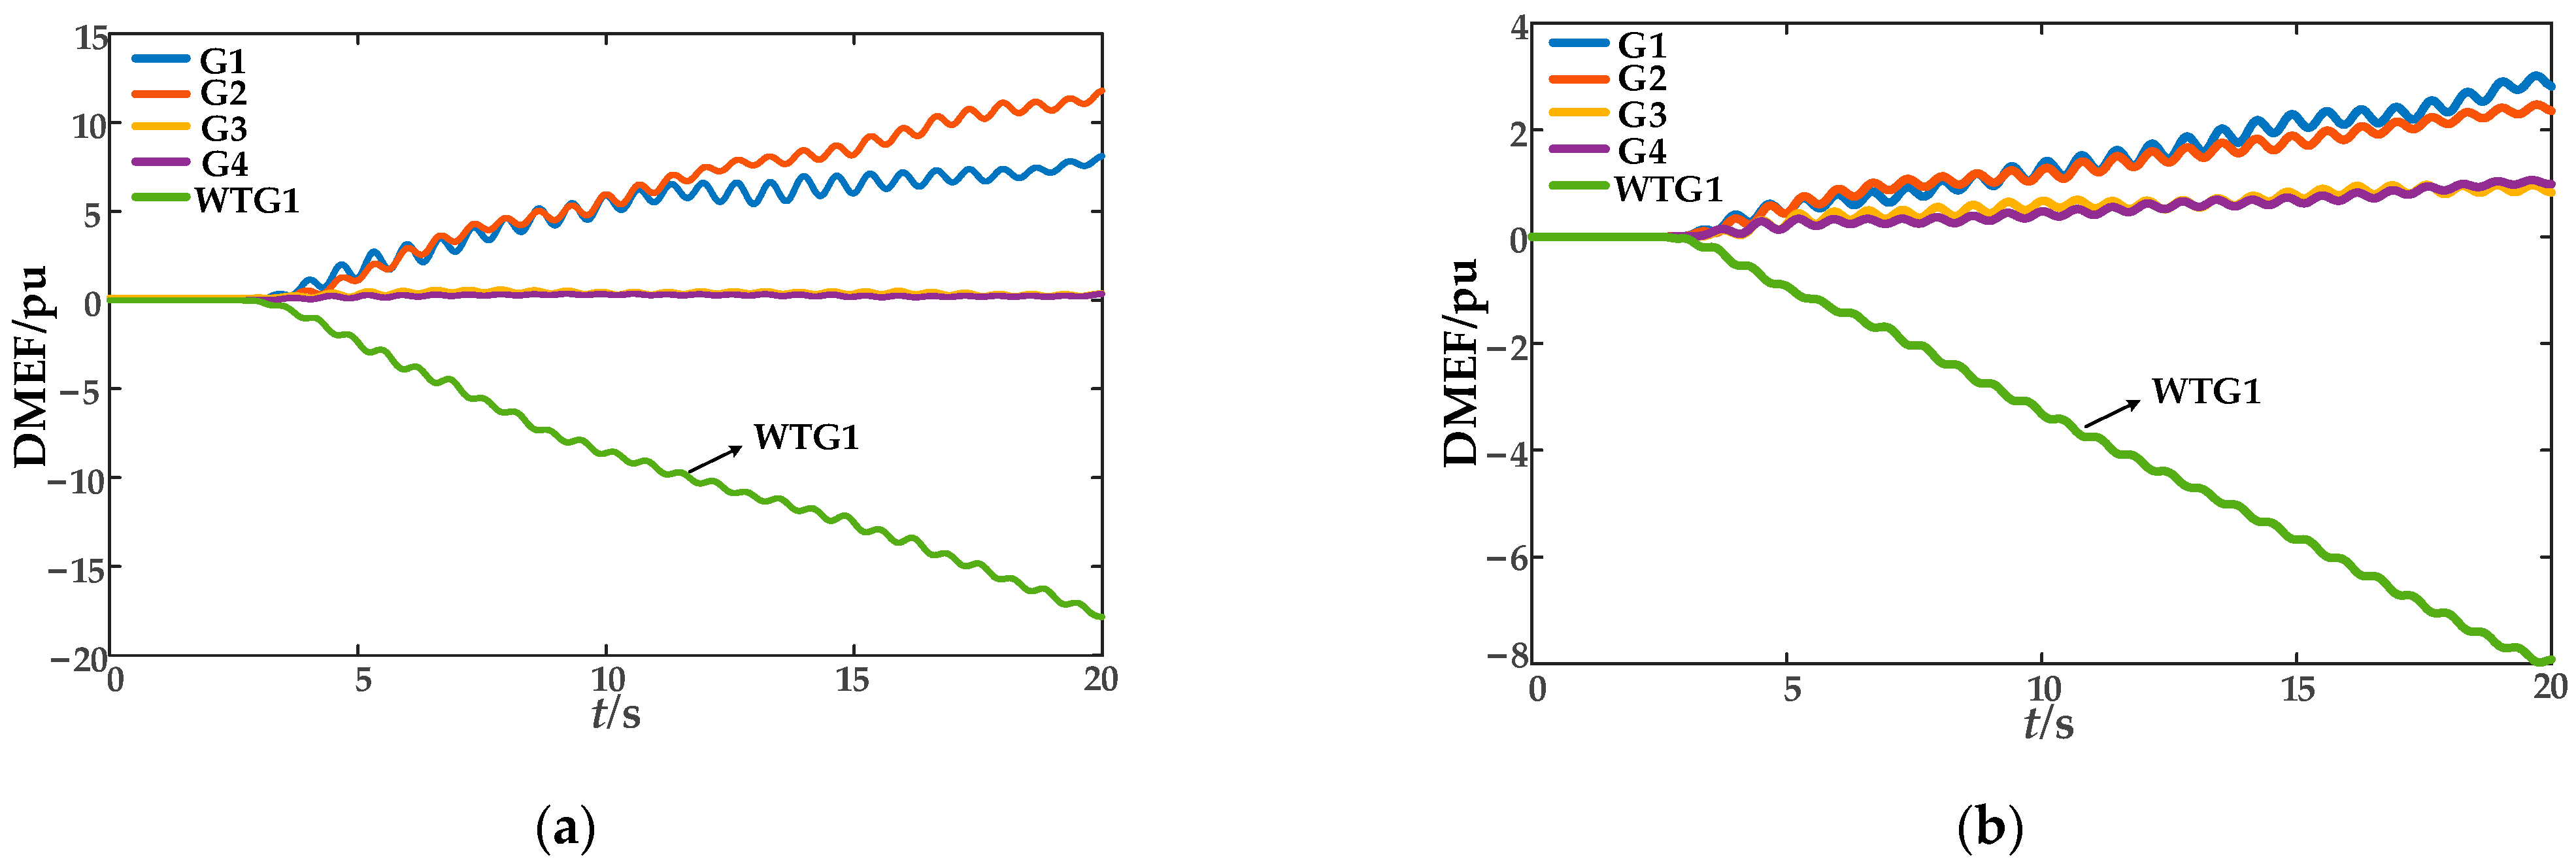
As shown in Figure 11, under both disturbance conditions, the dissipative energy flow curve of WTG1 shows a negative slope with a consistently decreasing trend. According to the oscillation source localization criterion, WTG1 is correctly identified as the oscillation source, which is consistent with the predefined disturbance location. These results demonstrate that the proposed method can accurately identify disturbance sources originating from internal control loops of wind turbines, confirming its effectiveness in such scenarios.

5.1.4. Noise Robustness Verification

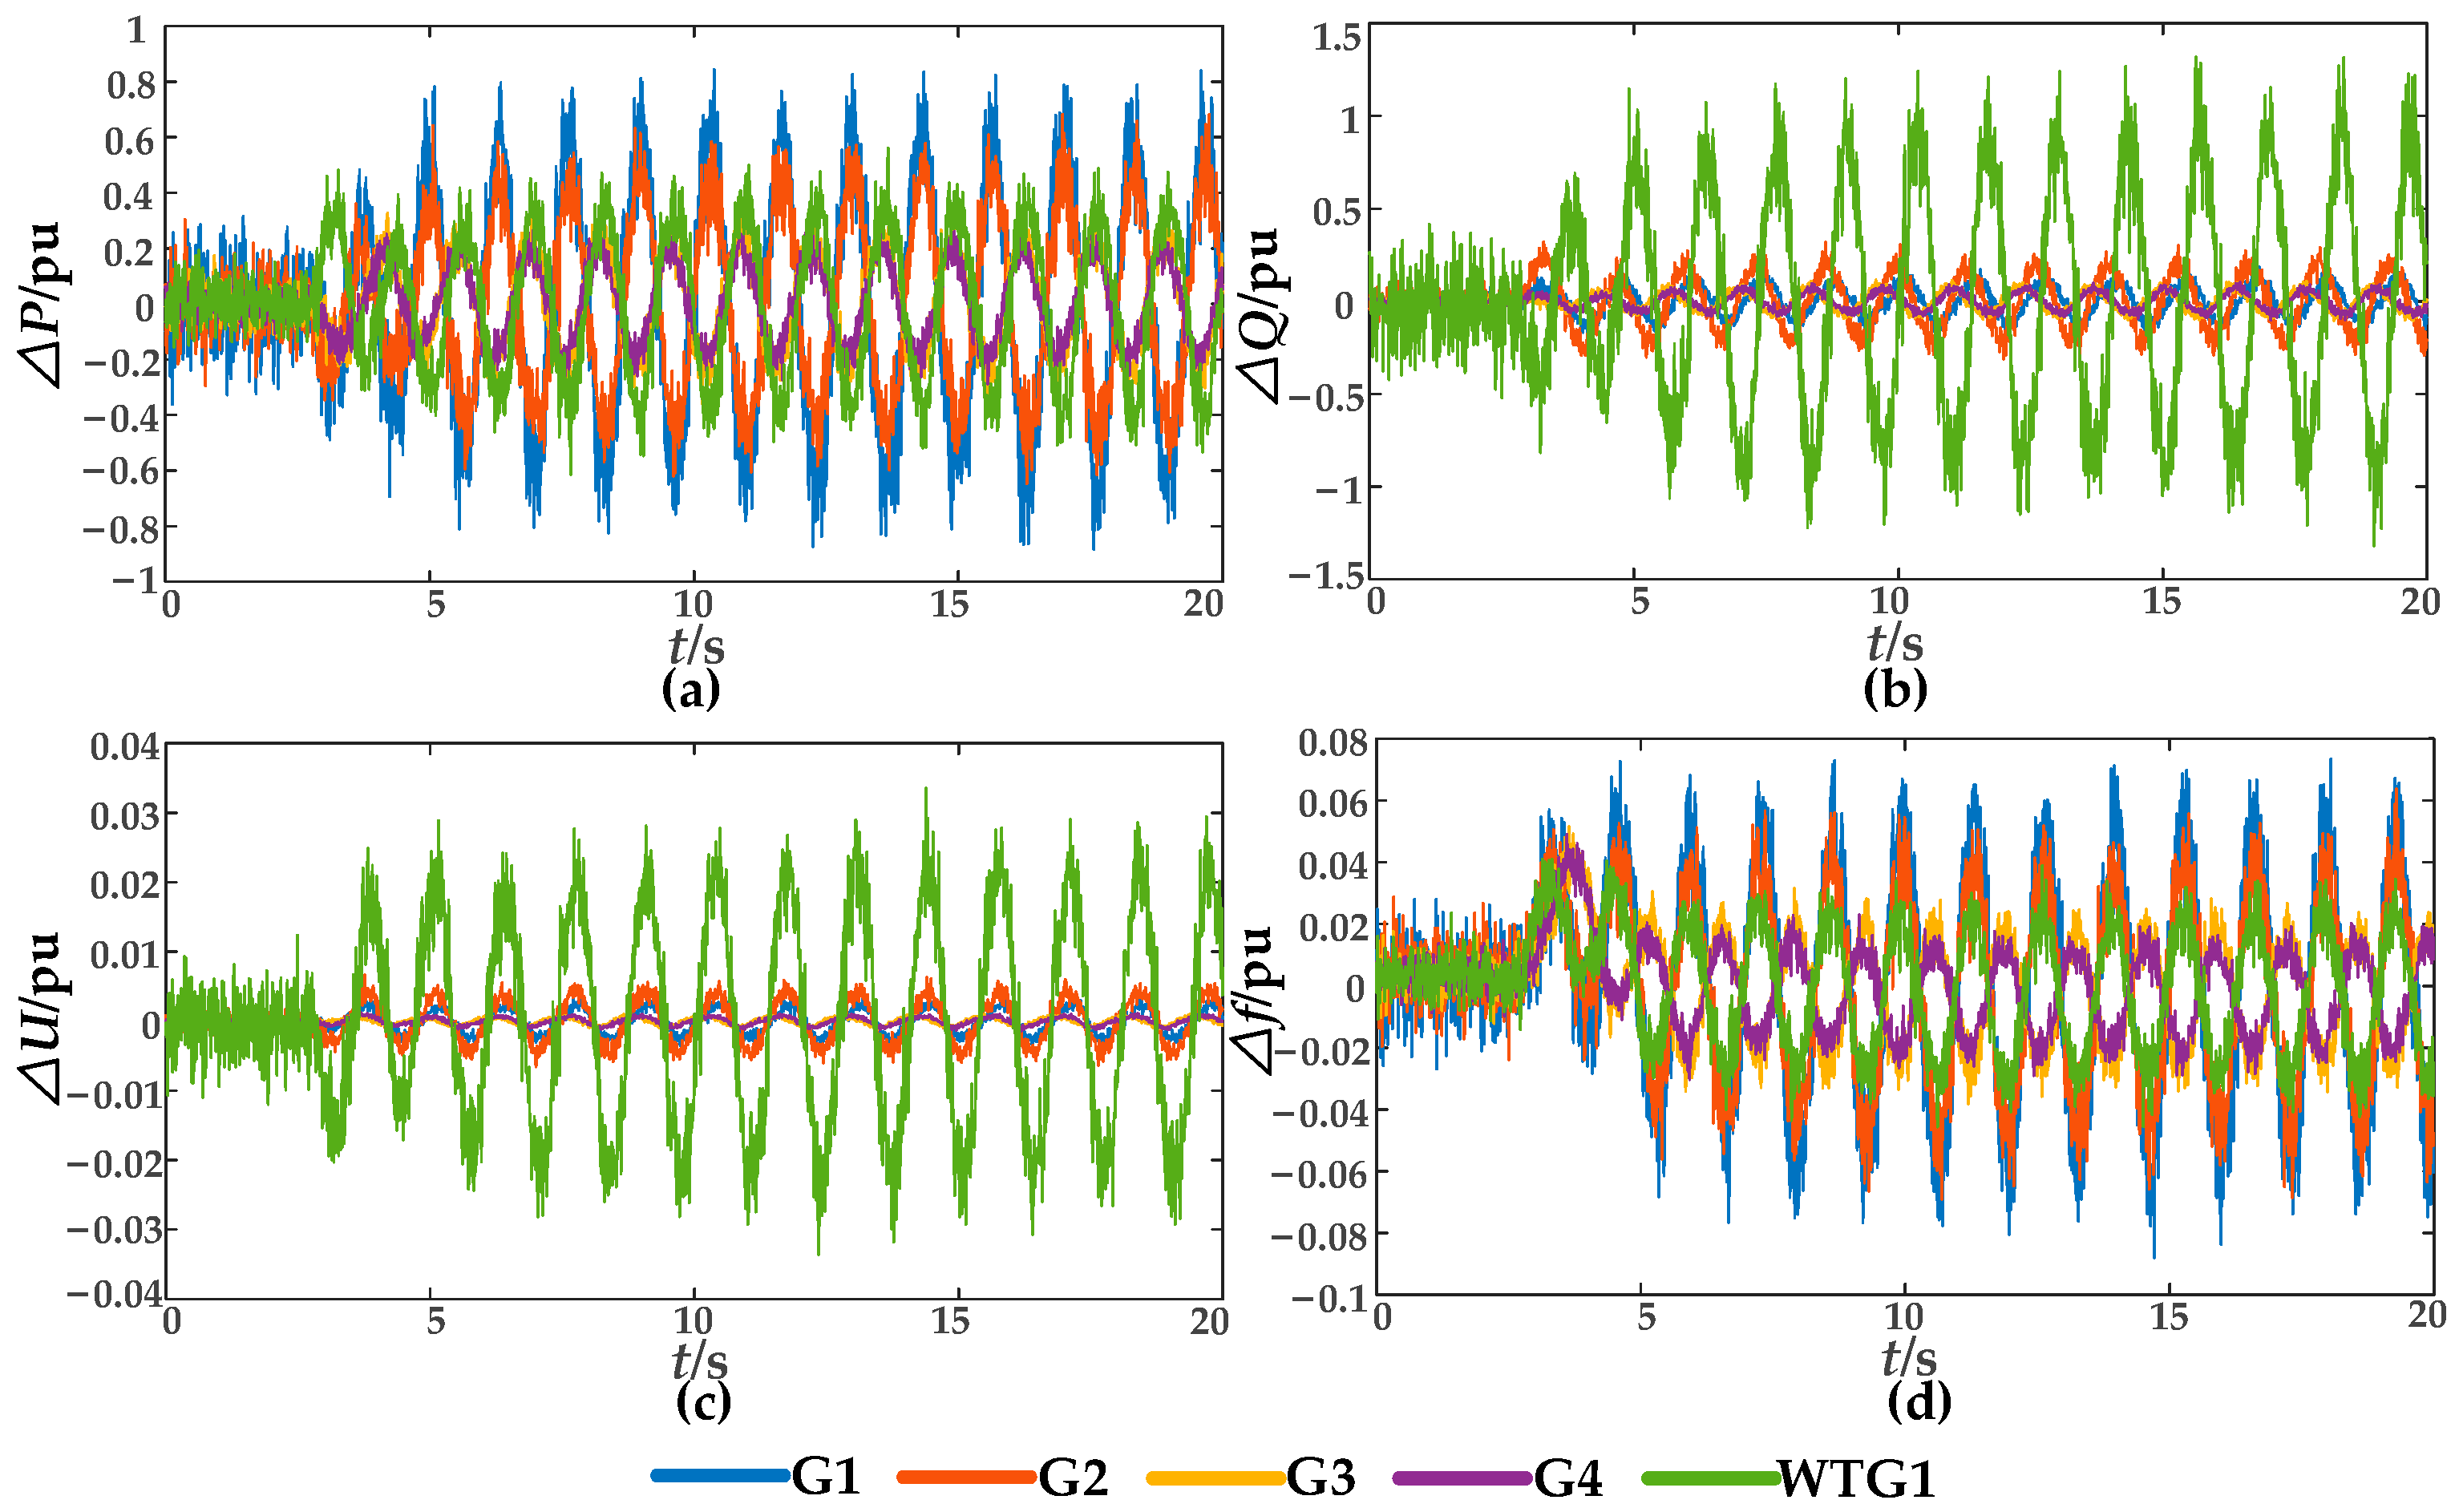
To validate the noise robustness of the proposed ICEEMDAN-ITEO method, this section introduces additive white Gaussian noise with a signal-to-noise ratio (SNR) of 10 dB into the simulation data where the disturbance is applied at the active power reference Pref of the GFM-DFIG. The proposed ICEEMDAN-ITEO method is then employed to locate the forced oscillation source under these noisy conditions. The variation signals of each generator under noise are shown in Figure 12.
These noisy electrical variation signals are decomposed using ICEEMDAN, and the dominant oscillation mode is identified and selected. The reconstructed signals corresponding to this mode are substituted into Equation (23) to compute the DMEF. The resulting DMEF curves are presented in Figure 13.
As observed in Figure 13, the proposed ICEEMDAN-ITEO method successfully identifies WTG1 as the disturbance source even under strong noise conditions (SNR = 10 dB), demonstrating its strong robustness in accurately locating oscillation sources in renewable-energy-integrated power systems.

5.2. A 10-Machine 39-Bus System with a Hub-and-Spoke Type Wind Turbine

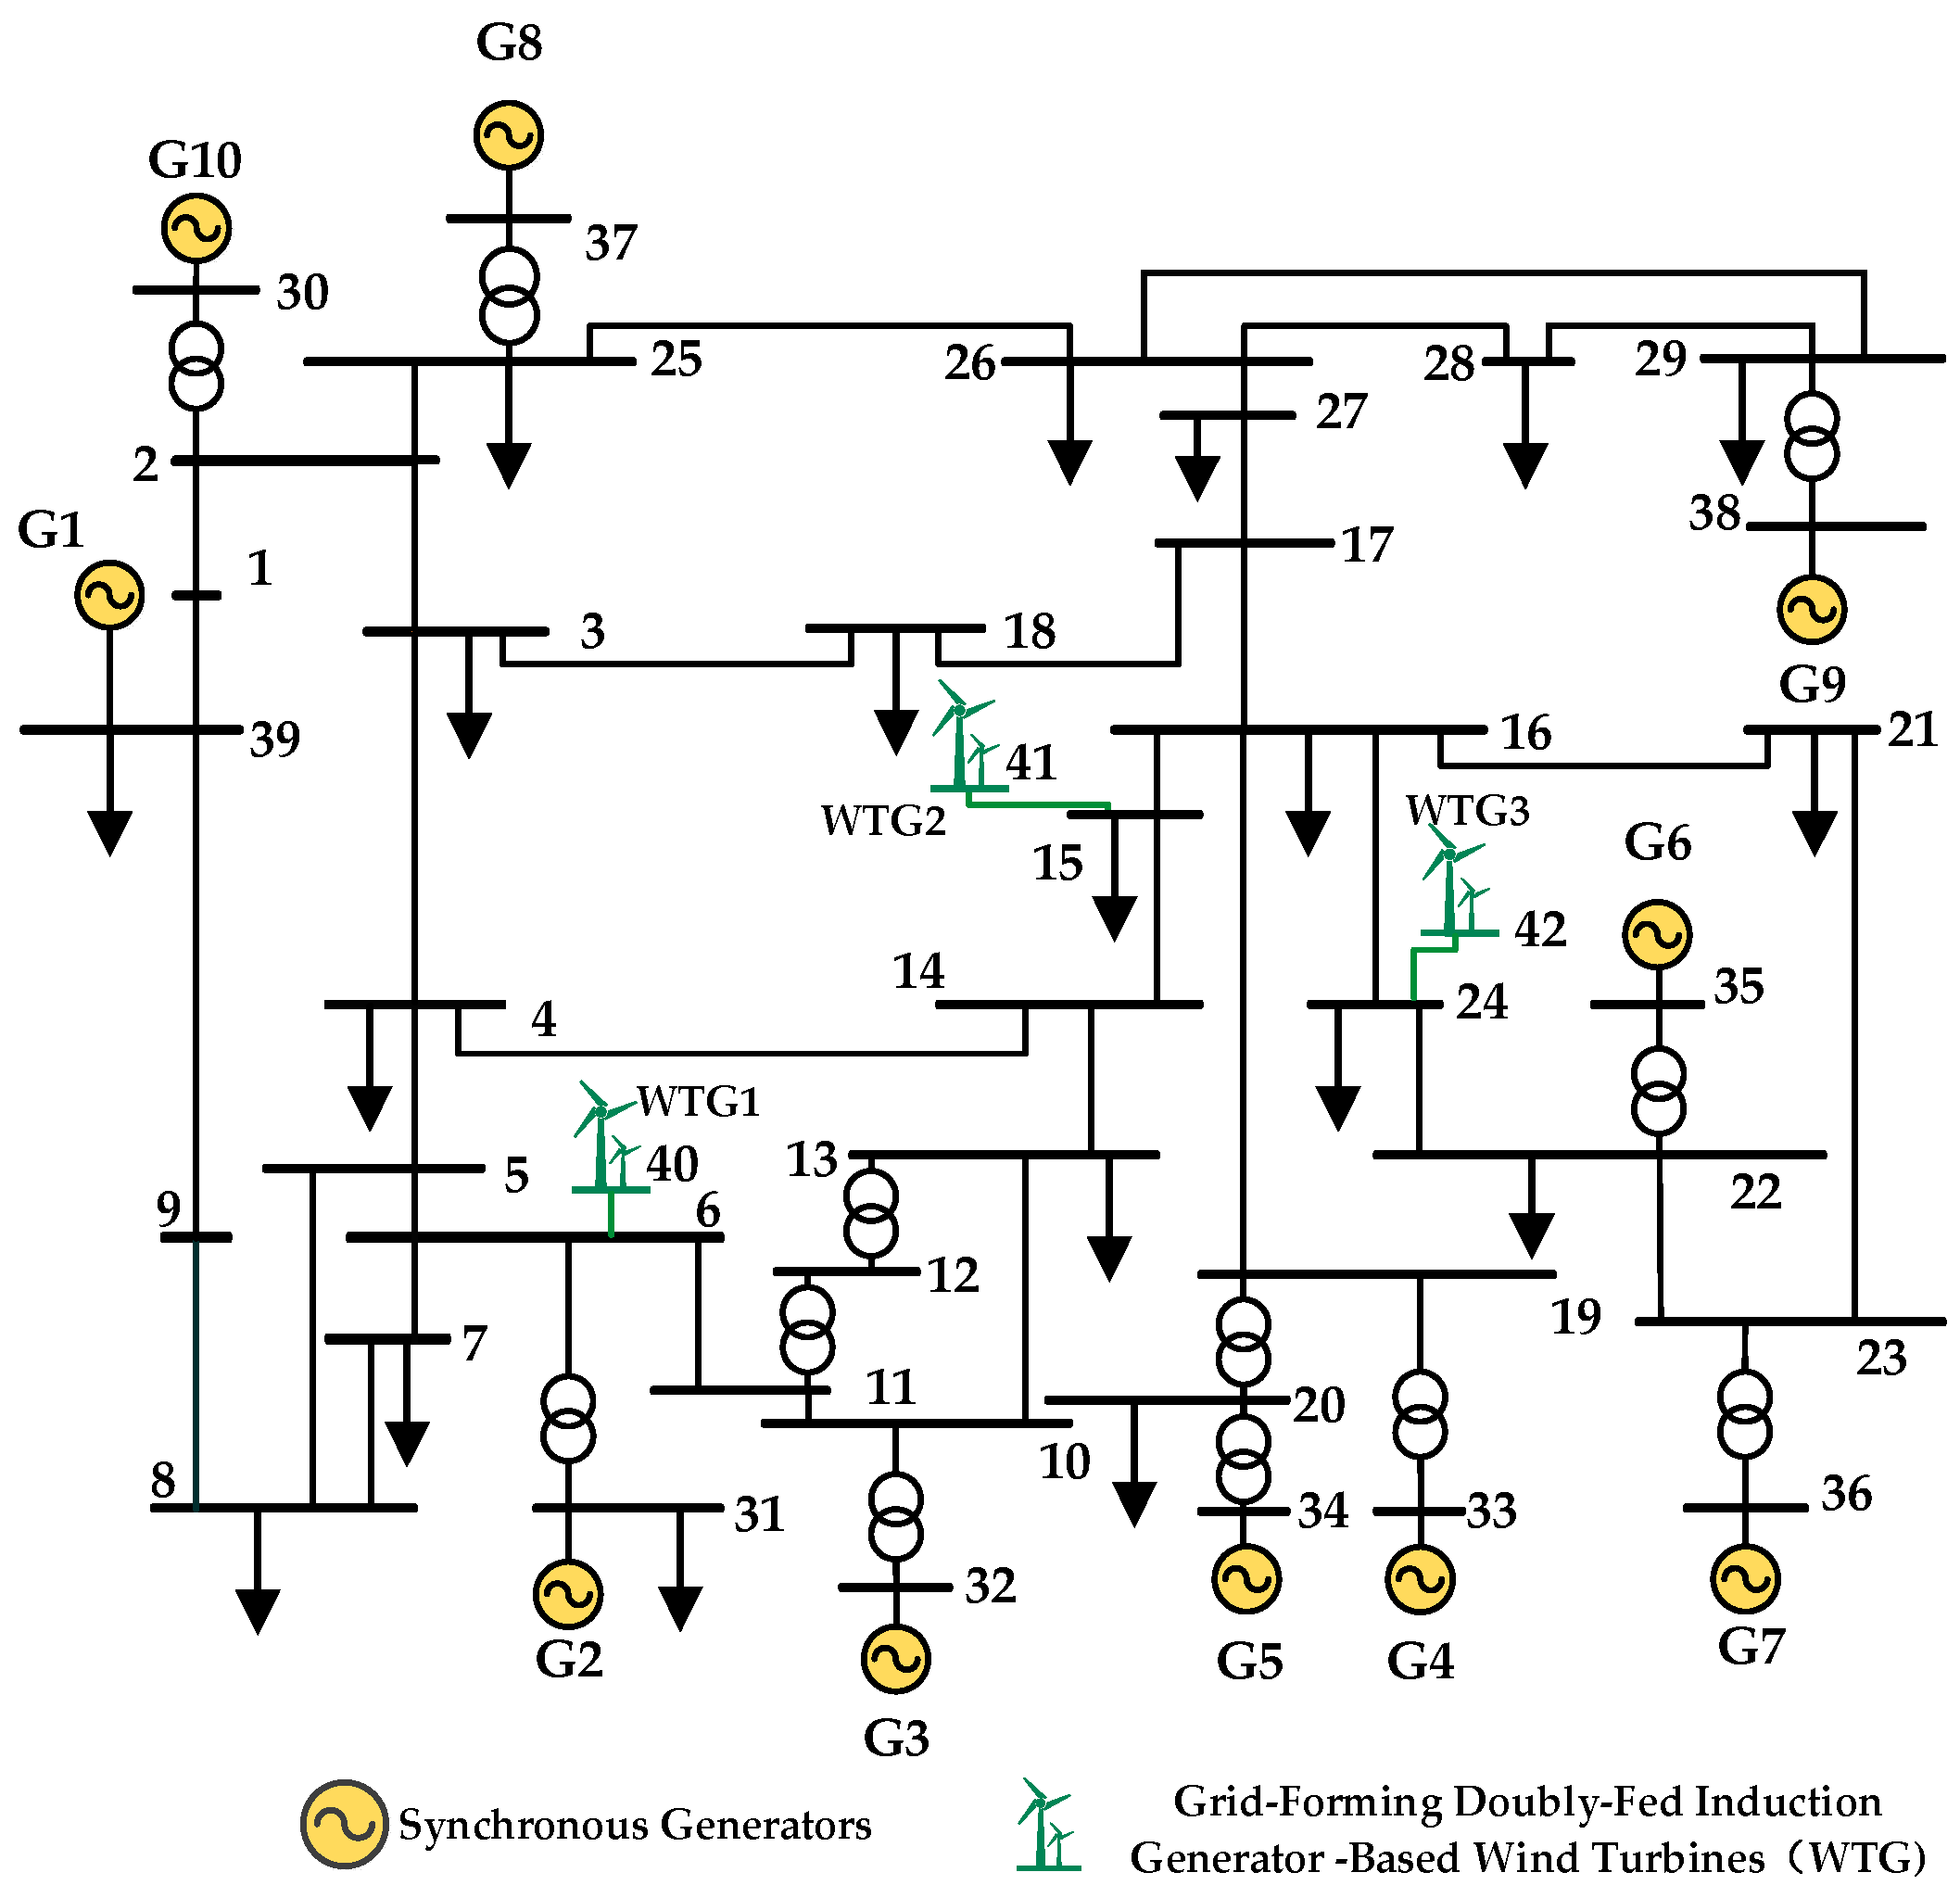
To further validate the effectiveness of the ICEEMDAN-ITEO method in complex grid scenarios, the proposed approach is applied to an IEEE 10-machine 39-bus system integrated with grid-forming wind turbines, with its complete network and generator parameters provided in Appendix A Table A3 and Table A4, respectively. Two simulation scenarios are designed to comprehensively evaluate its performance, where the disturbance sources are set in the excitation system of a synchronous generator and the internal control loops of a wind turbine, respectively. The topology of this system is shown in Figure 14, with GFM-DFIGs connected at Buses 6, 15, and 24, each with a capacity of 500 MVA.

5.2.1. The Disturbance Source Is Located in the Excitation System of a Synchronous Generator

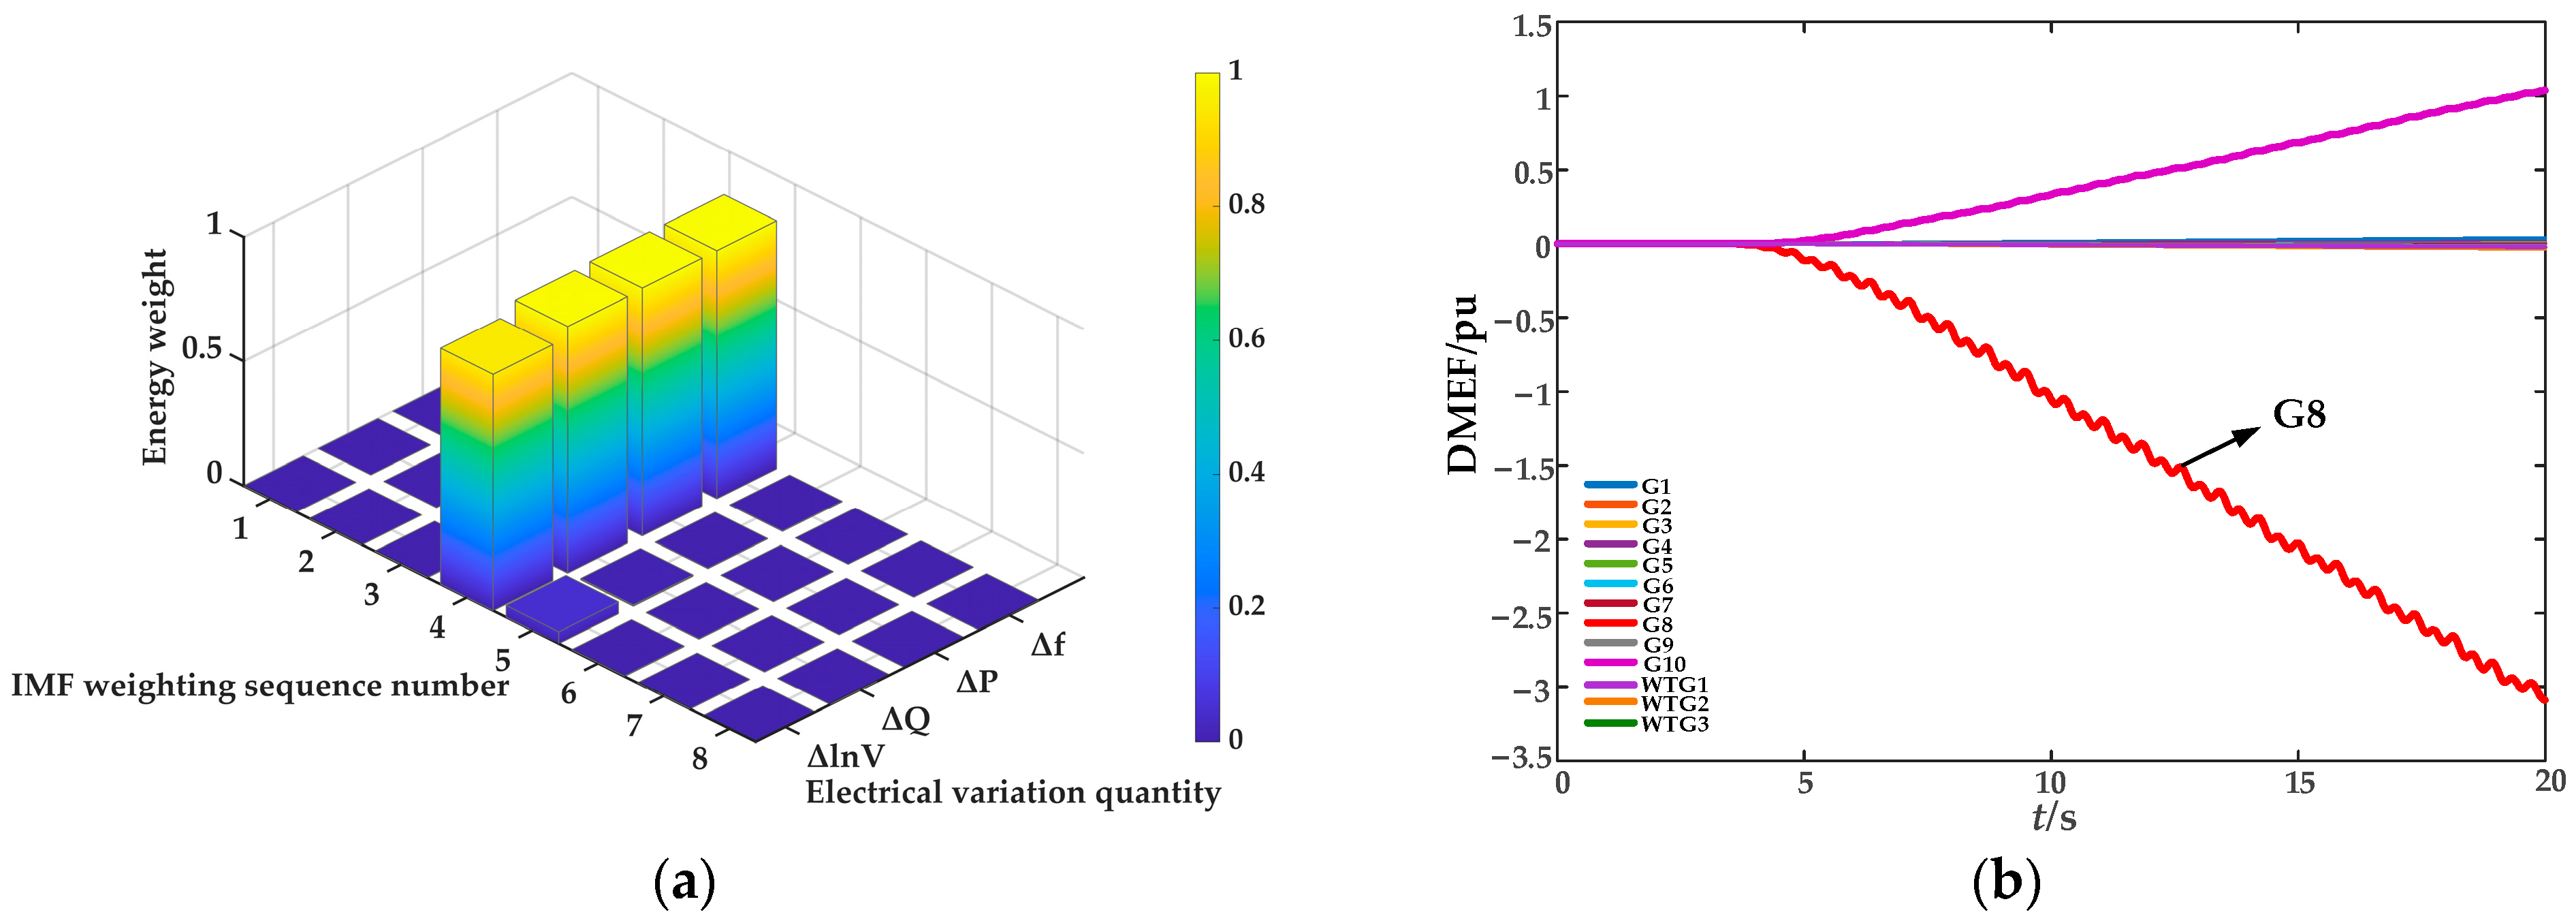
In this section, a continuous periodic disturbance is applied to the excitation system of synchronous generator G8 to induce forced oscillations in the system. Specifically, a sinusoidal periodic disturbance signal with an amplitude A = 0.1 p.u. and a frequency f = 1.27 Hz is injected at t = 3 s after the simulation starts, following the form given in Equation (25). The measured signals representing electrical variations at the terminals of each generator are normalized and then decomposed using ICEEMDAN. The ITEO method is employed to identify the dominant oscillation mode. Taking synchronous generator G8 as an example, the resulting heatmap of the energy weights for its electrical variations is shown in Figure 15a.
As shown in Figure 15a, the electrical variations in Generator G8 exhibit the highest energy weight in IMF4 across all measured quantities. Similarly, the modal energy weights of the remaining generators in the system were calculated to identify their dominant oscillation modes. The corresponding time-domain signals were reconstructed and substituted into Equation (23) to compute the dissipative mode energy flow. The results are presented in Figure 15b.
It can be observed from Figure 15b that the dissipative mode energy flow curve of synchronous generator G8 shows a negative slope with a consistently decreasing trend. According to the forced oscillation source criterion, G8 is correctly identified as the disturbance source. This result validates the effectiveness of the proposed method in locating oscillation sources in complex power system scenarios, even when the disturbance originates from synchronous generators.

5.2.2. The Disturbance Source Is Located in the Internal Control Loop of the GFM-DFIG

This section investigates the effectiveness of the proposed method when the forced oscillation source is located within the VSG control loop of the GFM-DFIG. To simulate this scenario, continuous periodic disturbances with an amplitude A = 0.1 p.u. and a frequency f = 1.96 Hz are injected into the active power reference Pref of WTG1 and the voltage reference Uref in the reactive voltage control loop, respectively, at simulation time t = 0.2 s to excite forced oscillations. The specific forms of the disturbances are implemented according to Equations (26) and (27).
The calculated energy weights of various oscillation modes for the grid-forming wind turbine WTG1 are presented in Figure 16.
Analysis reveals that under both operating conditions, IMF4 constitutes the dominant oscillatory mode component of WTG1. Similarly, the energy weights of the remaining generators in the system were computed, and the corresponding dominant oscillation mode components were extracted. The time-domain signals were reconstructed accordingly and used to calculate the dissipative mode energy flow. The results obtained using the proposed method are shown in Figure 17.
As shown in Figure 17, the dissipative mode energy flow curve of WTG1 exhibits a consistently decreasing trend, confirming it as the oscillation source and validating the effectiveness of the proposed method under this scenario.
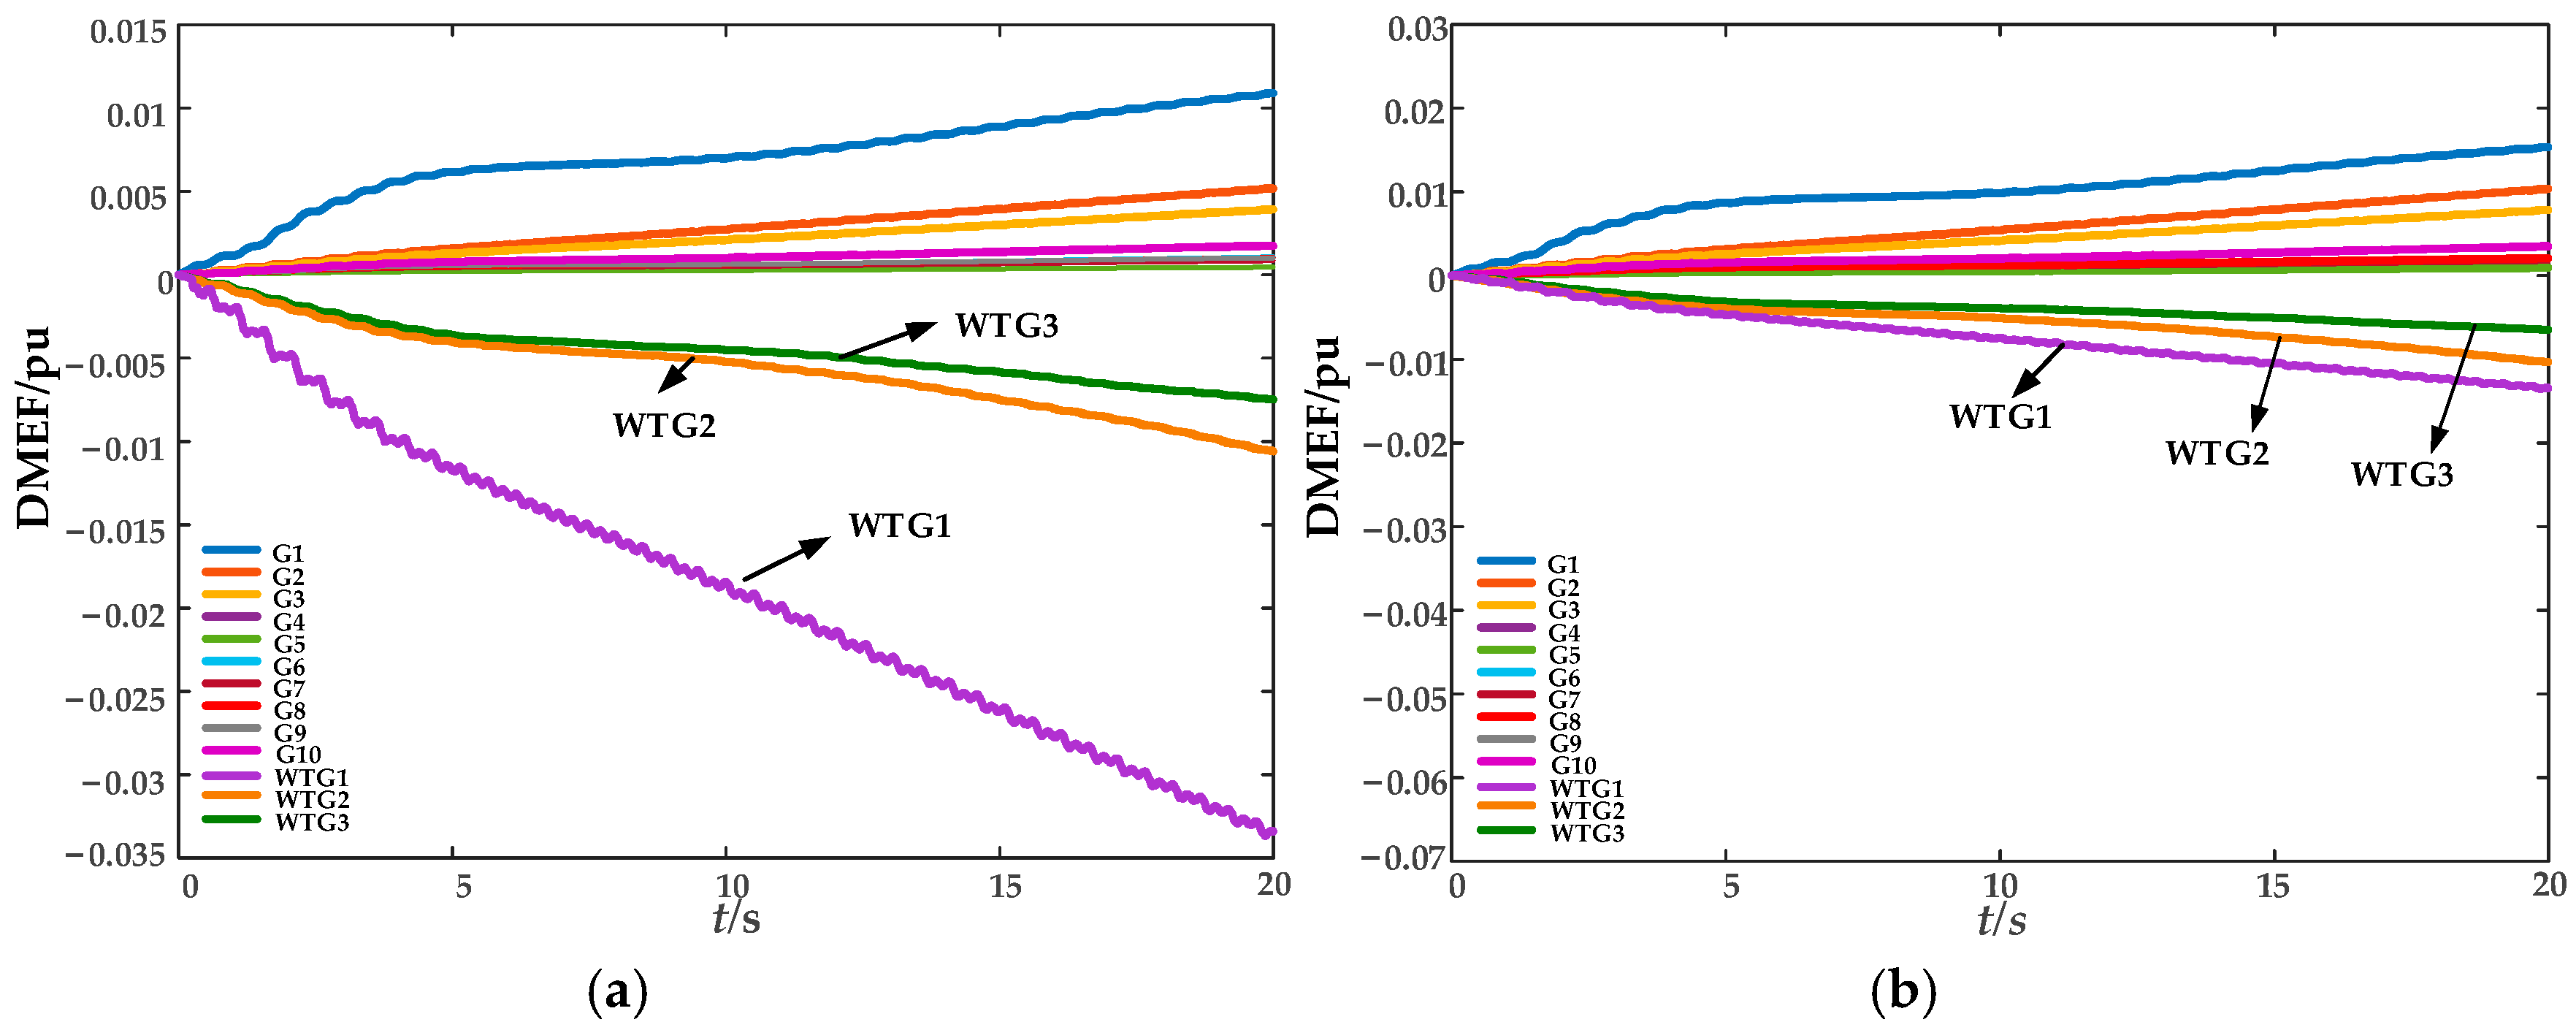
For further comparison, both the conventional dissipative energy flow method from reference [17] and the MEMD-based approach from [16] are applied to the simulation data under the disturbance condition at the reactive power control reference Uref. The results are presented in Figure 18.
As observed, the dissipative energy flow curves of WTG1, WTG2, and WTG3 all exhibit a decreasing trend under both the conventional and the MEMD-based methods, leading to their collective misidentification as oscillation sources. This outcome contradicts the actual scenario in which only WTG1 is the true disturbance source.
Such consistent misjudgment underscores the inherent limitations of these existing methods when applied to power systems with high penetration of renewable generation. On one hand, the harmonic interference and multi-modal coupling introduced by the control loops of multiple grid-forming wind turbines cause the measured signals to contain substantial non-oscillatory modal components. On the other hand, the absence of adaptive modal decomposition and noise suppression mechanisms in the signal preprocessing stage of such methods results in inadequate filtering of redundant response information during energy flow computation. This issue becomes particularly pronounced in multi-machine systems, where such residual information amplifies energy calculation errors and leads to faulty identification.
In contrast, the ICEEMDAN-ITEO method proposed in this paper significantly enhances the accuracy and robustness of oscillation source identification by precisely extracting the dominant oscillation mode and reconstructing the time-domain waveform.

5.3. The Actual Power Grid of ISO New England

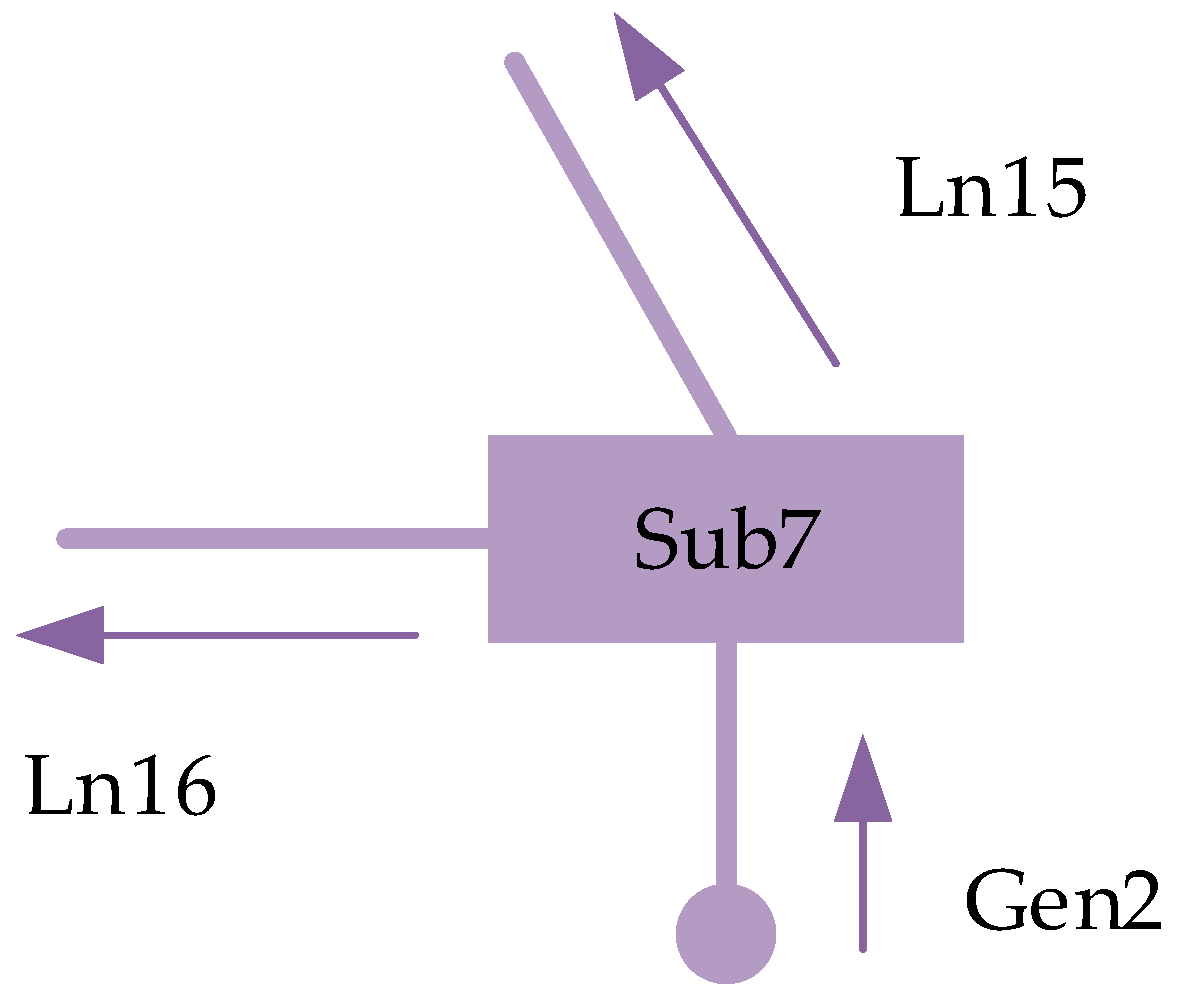
To validate the effectiveness of the proposed method in a real-world power grid, this section employs actual event data from the ISO New England system for oscillation source localization research. On 29 January 2018, a forced power oscillation event with a frequency of 1.57 Hz occurred in the Gen2 generator within the Sub7 area of this grid. The topology of the regional grid is shown in Figure 19.
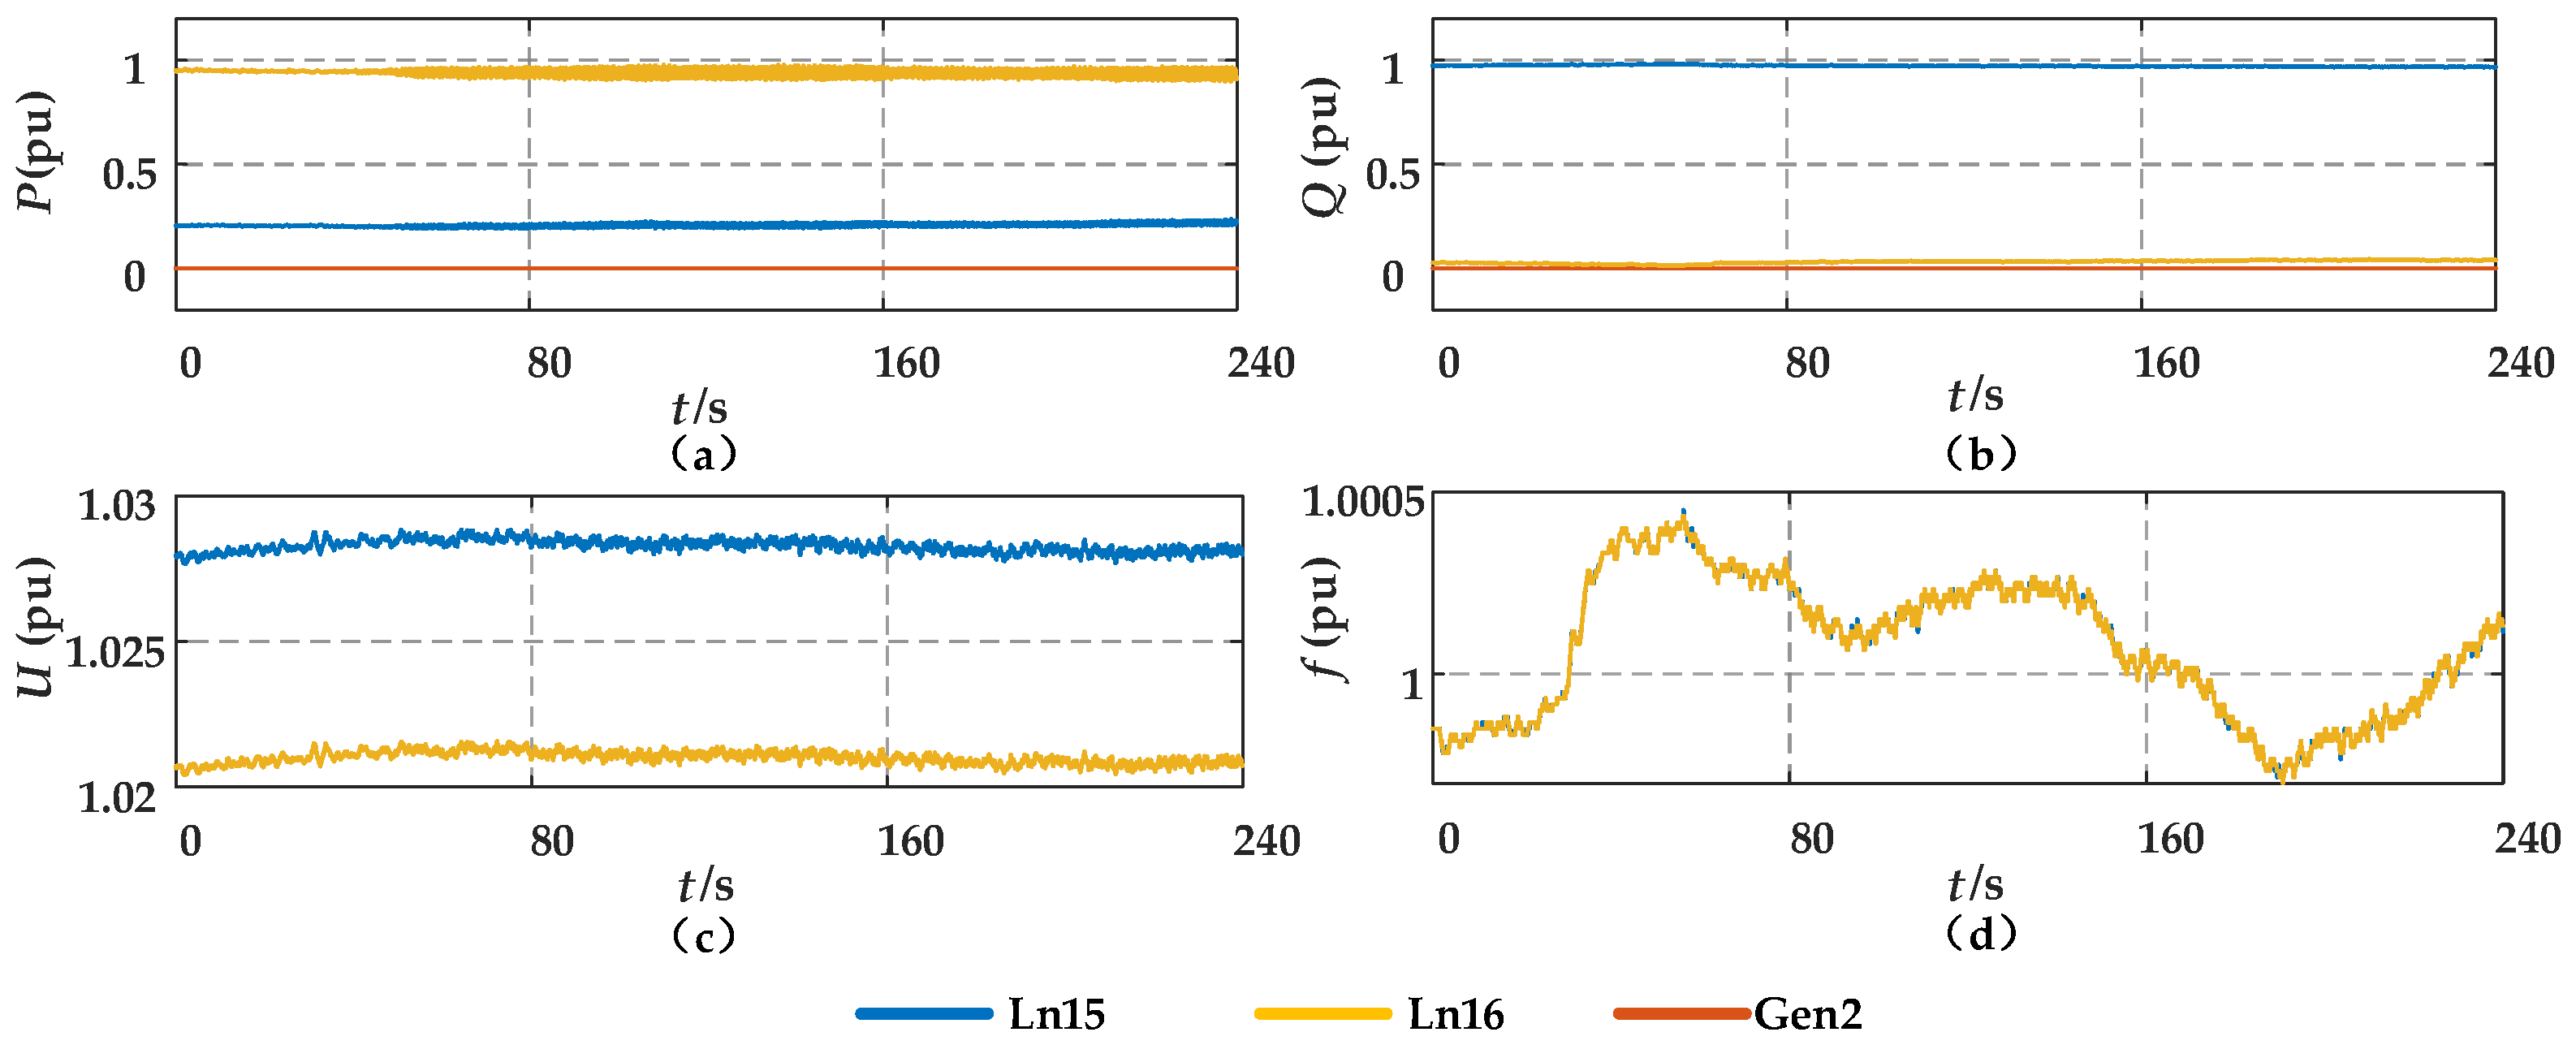
During the fault, the response curves of various electrical quantities in the three tie lines connected to this area are shown in Figure 20.
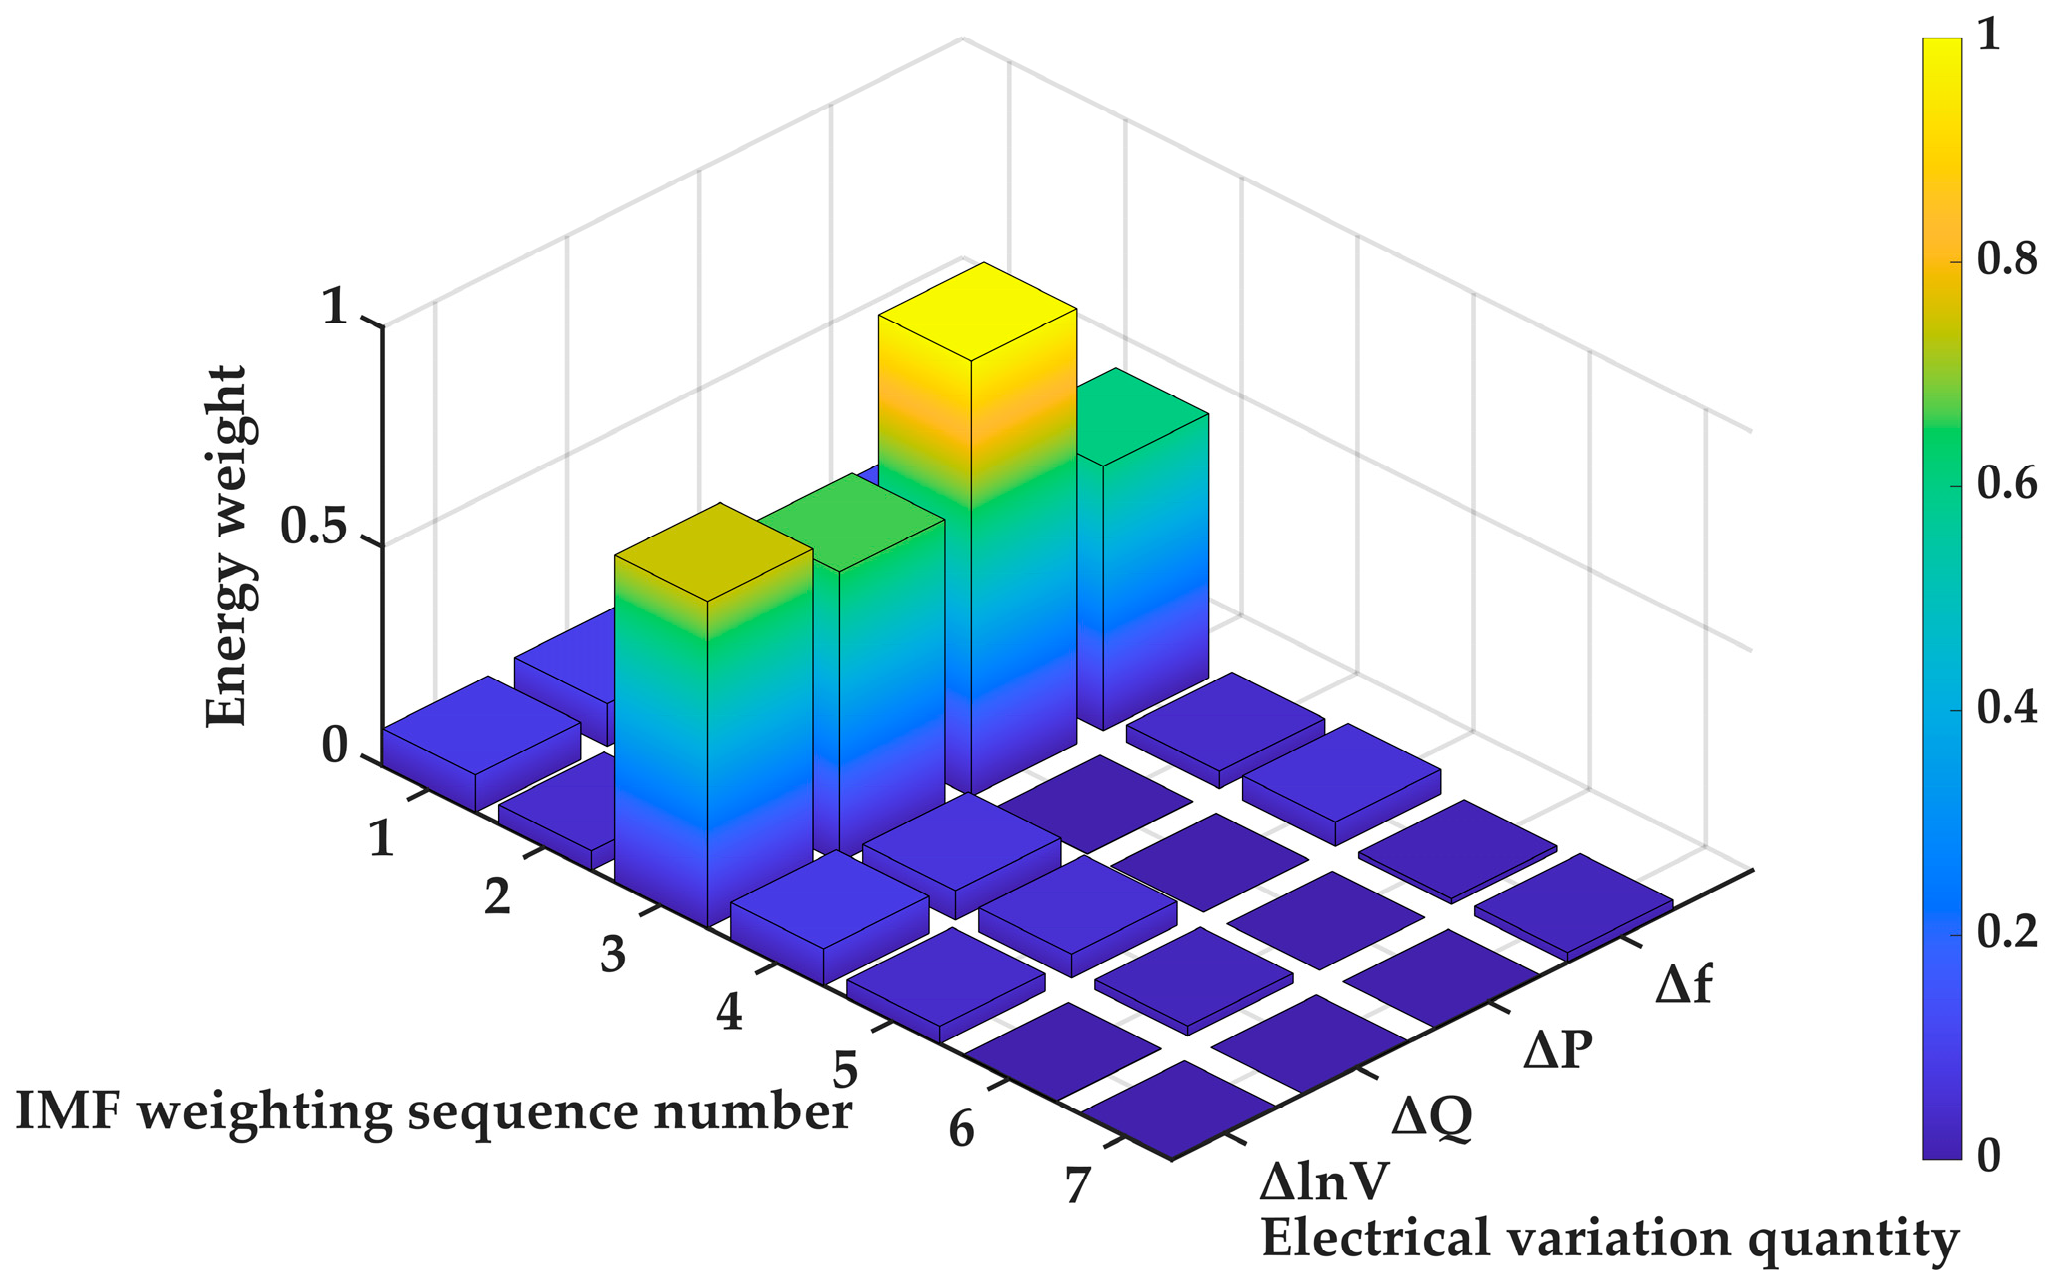
First, the acquired measurement data from the actual grid are normalized using a per-unit system, and their deviations from steady-state values are calculated. The data are then decomposed via ICEEMDAN to obtain the IMF components of each electrical quantity. Subsequently, the ITEO method is applied to compute the energy weights of each IMF component and extract the dominant oscillation mode. The energy weight calculation results for the electrical variations in Gen2 are presented in Figure 21.
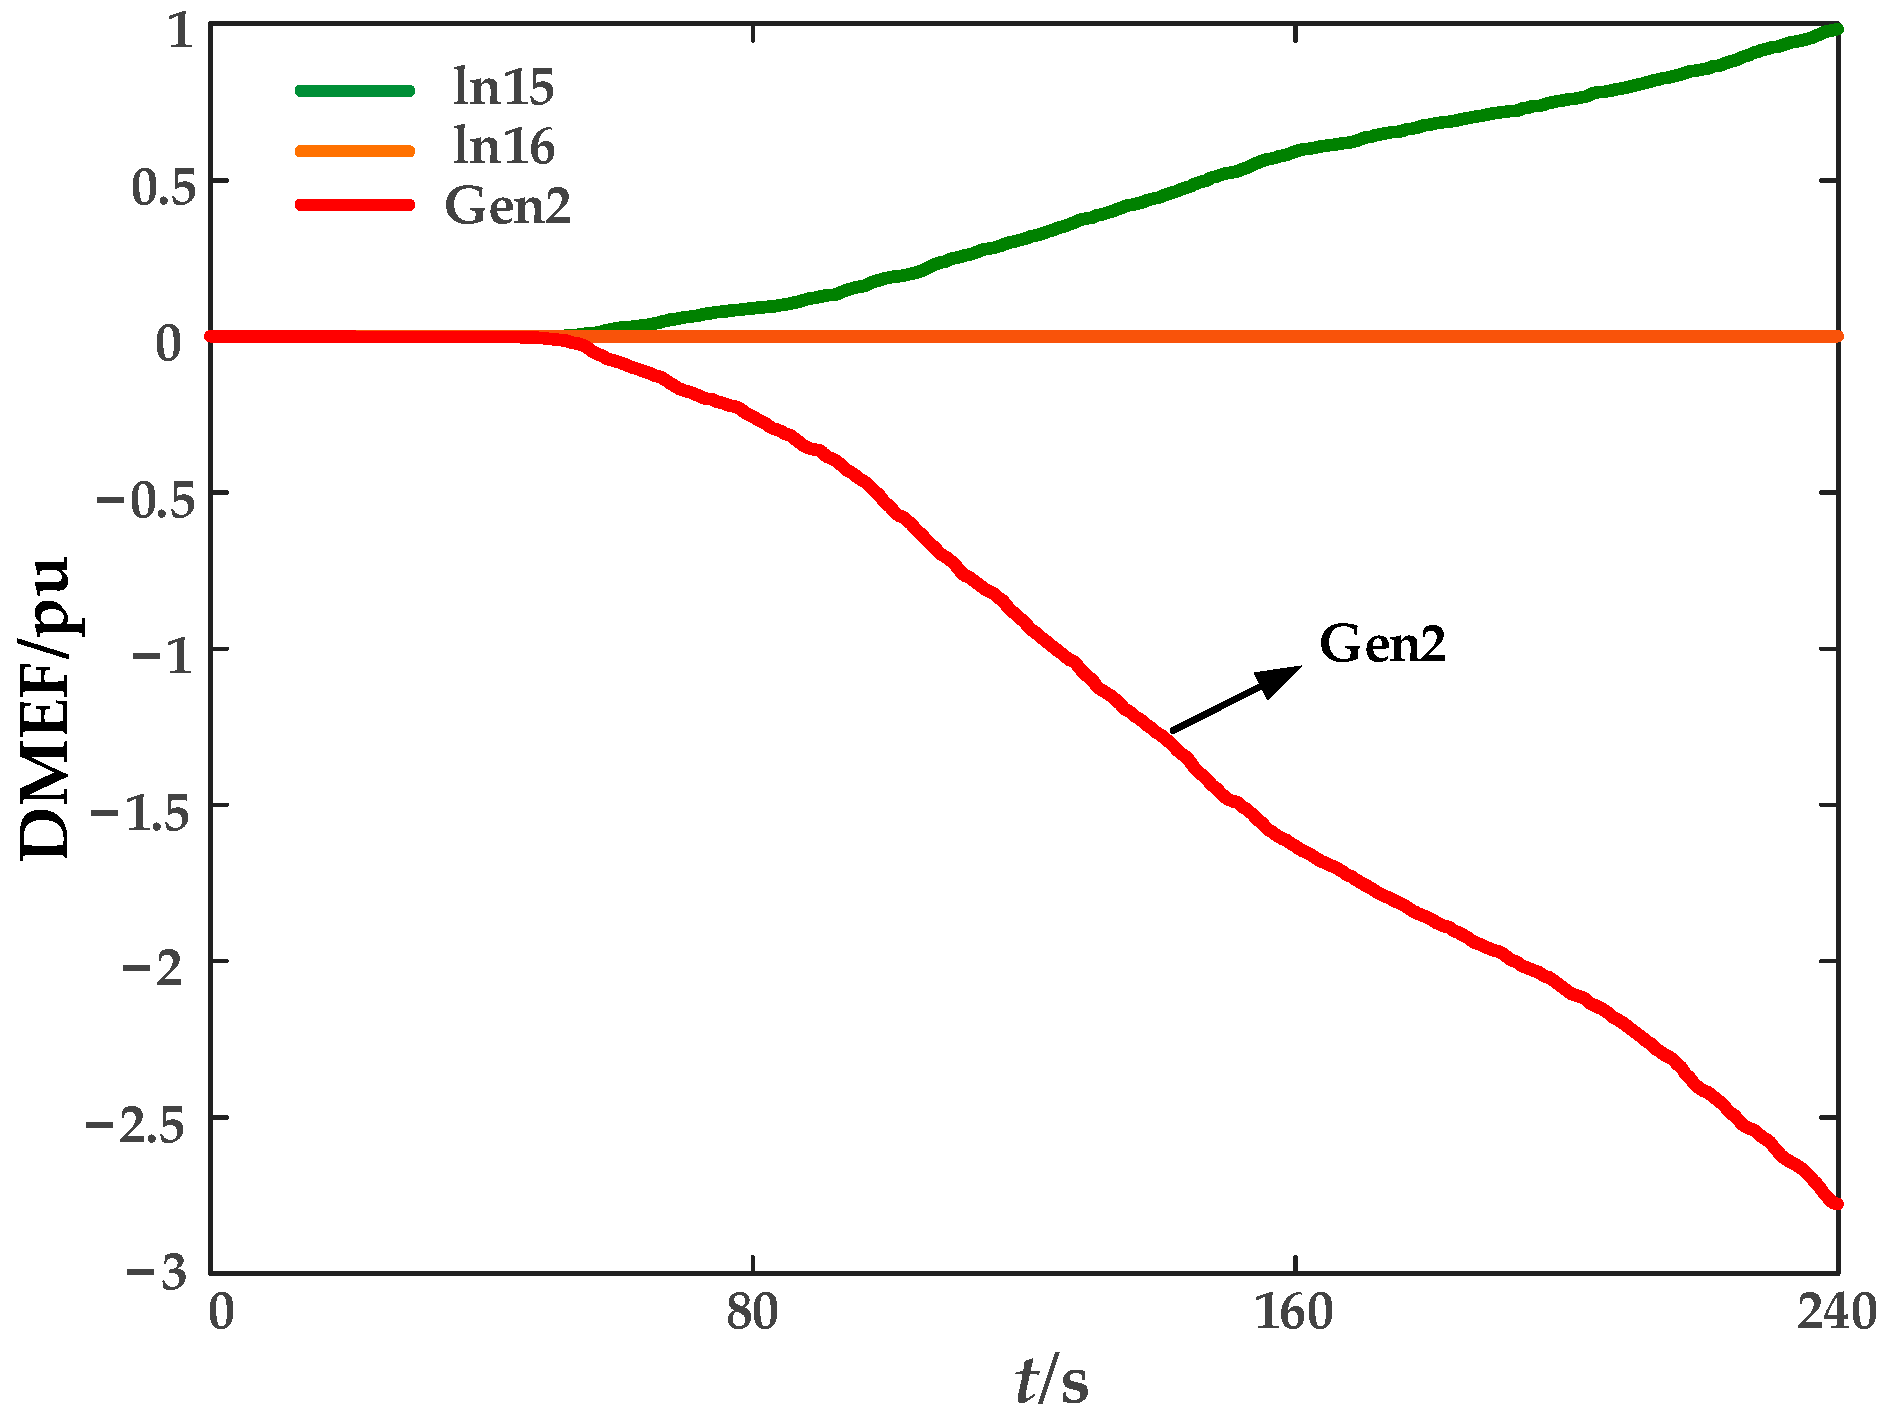
As shown in Figure 21, IMF3 is identified as the dominant oscillatory mode component of Gen2. The dominant oscillatory mode components of other branches in the system were further calculated and reconstructed. Finally, the results were computed using Equation (23), as shown in Figure 22.
Analysis of Figure 22 indicates that during the fault, the dissipative mode energy flow curve of the branch connected to Gen2 shows a consistently decreasing trend, while the corresponding curves for lines Ln15 and Ln16 exhibit rising and relatively stable characteristics, respectively. According to the dissipative energy flow criterion, Gen2 is identified as the disturbance source, which matches the actual oscillation source location. This result confirms the effectiveness of the proposed method when applied to real-world power systems.

6. Conclusions

This paper addresses the challenges of locating forced oscillation sources and the inadequacy of traditional methods in power systems integrated with grid-forming wind turbines. An innovative forced oscillation source localization method integrating ICEEMDAN and an ITEO is proposed. By combining high-precision modal decomposition, noise-robust energy extraction, and dissipative energy flow localization mechanisms, this method significantly enhances localization accuracy and robustness in complex renewable energy integration scenarios. The main conclusions are as follows:
(1)
The proposed ICEEMDAN-ITEO forced oscillation source localization method does not rely on accurate power system model parameters. It achieves accurate and effective oscillation source identification solely through wide-area generator measurement data, overcoming the dependence of traditional model-based methods on model precision.
(2)
The introduction of the improved Teager energy operator, through expanded calculation windows and enhanced frequency selectivity, significantly improves the detection sensitivity for typical forced oscillation components while effectively suppressing high-frequency noise interference. Consequently, it enhances the energy identification accuracy of the dominant forced oscillation mode component. This method can robustly extract and reconstruct high-energy IMF components, overcoming the issues of energy estimation distortion and missed detection of key modes by the traditional Teager Energy Operator under low signal-to-noise ratio conditions.
(3)
Validation experiments were conducted in the modified IEEE 4-machine 2-area system, the 10-machine 39-bus system, and the practical ISO New England grid under multiple disturbance types and high noise levels. The results demonstrate that the proposed method can accurately identify oscillation sources across diverse scenarios. Moreover, compared with traditional dissipative energy flow methods, it effectively suppresses interference from redundant modes in measurement signals and significantly enhances the accuracy of disturbance source localization.
The proposed forced oscillation disturbance source location method in this paper can accurately locate to the unit where the disturbance source is located, but it is difficult to achieve precise equipment-level positioning. Future work will focus on the equipment-level positioning method for the disturbance source.

Author Contributions

The authors confirm their contribution to the paper as follows: Conceptualization: R.L. and Y.Z. Methodology: R.L., Y.Z. and J.C.; Software: R.L., D.L. and S.G.; Validation: R.L., C.L. and R.T. Resources: C.L. Data curation: R.L. and J.C.; Writing—original draft preparation: R.L. and R.T. Writing—review and editing: R.L., Y.S. and R.T.; Supervision: C.L., R.T. and Y.S. Funding acquisition: C.L. All authors have read and agreed to the published version of the manuscript.

Funding

The authors declare that this study received funding from the project ‘State Grid Jilin Electric Power Co., Ltd. Electric Power Research Institute: Quantitative Evaluation Technology Research on Safety and Stability Margin of Jilin Power Grid in 2024–2025’ (SGJLDK00DWJS2400192). The funder had the following involvement with the study: the collection, analysis, or interpretation of data.

Data Availability Statement

The data presented in this study are available on request from the corresponding author. The data are not publicly available due to that the project involved in the manuscript is not yet completed and is not in the public stage.

Conflicts of Interest

Authors Yifu Zhang, Song Gao, Dexin Li were employed by State Grid Jilin Electric Power Company Limited Electric Power Research Institute. The remaining authors declare that the research was conducted in the absence of any commercial or financial relationships that could be construed as a potential conflict of interest.

Abbreviations

The following abbreviations are used in this manuscript:
ICEEMDANImproved Complete Ensemble Empirical Mode Decomposition with Adaptive Noise
ITEOImprovement of the Teager Energy Operator
GFM-DFIGGrid-Forming Doubly Fed Induction Generator
VSGVirtual Synchronous Generator
IMFIntrinsic Mode Function
DMEFDissipative Mode Energy Flow

Appendix A

Table A1. Line parameters of the modified IEEE 4-machine 2-area System.
Sending-End BusReceiving-End BusResistance/p.u.Reactance/p.u.
150.00000.01667
260.00000.01667
3110.00000.01667
4100.00000.01667
560.00250.0250
670.00100.0100
780.01100.1100
780.01100.1100
7120.00000.01667
980.01100.1100
980.01100.1100
9100.00100.0175
10110.00250.0250
Table A2. Generator parameter configuration of the modified IEEE 4-machine 2-area System.
Generator UnitG1G2G3G4
Td0′/s8888
M/s131312.3512.35
D/p.u.0000
Xd/p.u.1.81.81.81.8
Xd′/p.u.0.30.30.30.3
Xq/p.u.1.81.81.81.8
Table A3. Line parameters of the modified IEEE 10-machine 39-bus system.
Sending-End BusReceiving-End BusResistance/p.u.Reactance/p.u.
120.00350.0411
190.00100.0250
230.00130.0151
2250.00700.0086
2300.00000.0181
340.00130.0213
3180.00110.0133
450.00080.0128
4140.00080.0129
560.00020.0026
580.00080.0112
670.00060.0092
6110.00070.0082
6310.00000.0250
6400.00000.0250
780.00040.0046
890.00230.0363
9390.00100.0250
10110.00040.0043
10130.00040.0043
10320.00000.0200
12110.00160.0435
12130.00160.0435
13140.00090.0101
14150.00180.0217
15160.00090.0094
15410.00000.0250
16170.00070.0089
16190.00160.0195
16210.00080.0135
16240.00030.0059
17180.00070.0082
17270.00130.0173
19200.00070.0138
19330.00070.0142
20340.00090.0180
21220.00080.0140
22230.00060.0096
22350.00000.0143
23240.00220.0350
24430.00000.0250
25260.00050.0272
25370.00320.0323
26270.00060.0232
26280.00140.0147
26290.00430.0474
28290.00570.0625
29380.00140.0151
Table A4. Generator parameter configuration of the modified IEEE 10-machine 39-bus system.
Generator UnitG1G2G3G4G5G6G7G8G9G10
Td0′/s10.26.565.75.695.47.35.666.74.797
M/s8460.671.657.25269.652.848.6691000
D/p.u.0000000000
Xd/p.u.0.10.2950.24950.2620.670.2540.2950.290.21060.02
Xd′/p.u.0.0310.05970.05310.04360.0320.050.0490.0570.0570.006
Xq/p.u.0.0690.2820.2370.2580.620.2410.2920.280.2050.019

References

  1. Gu, Y.J.; Green, T.C. Power System Stability with a High penetration of inverter-based resources. Proc. IEEE 2023, 111, 832–853. [Google Scholar] [CrossRef]
  2. Ghorbaniparvar, M. Survey on forced oscillations in power system. J. Mod. Power Syst. Clean Energy 2017, 5, 671–682. [Google Scholar] [CrossRef]
  3. Ye, H.; Liu, Y.T.; Zhang, P.; Du, Z.C. Analysis and Detection of forced oscillation in power system. IEEE Trans. Power Syst. 2017, 32, 1149–1160. [Google Scholar] [CrossRef]
  4. Yan, X.; Chang, W.; Cui, S.; Rasool, A.; Jia, J.; Sun, Y. Recurrence of sub-synchronous oscillation accident of Hornsea Wind Farm in UK and its suppression strategy. Energies 2021, 14, 7685. [Google Scholar] [CrossRef]
  5. Wang, B.; Sun, K. Location methods of oscillation sources in power systems: A survey. J. Mod. Power Syst. Clean Energy 2017, 5, 151–159. [Google Scholar] [CrossRef]
  6. Estevez, P.G.; Marchi, P.; Galarza, C.; Elizondo, M. Complex dissipating energy flow method for forced oscillation source location. IEEE Trans. Power Syst. 2022, 37, 4141–4144. [Google Scholar] [CrossRef]
  7. Gao, Y.; Liu, D.C.; Huang, G.B.; Shi, Q.Y. Locating method of disturbance source of forced power oscillation based on prony anyasis. In Proceedings of the 2012 China International Conference on Electricity Distribution, Shanghai, China, 10–14 September 2012. [Google Scholar]
  8. Xu, Y.H.; Gu, Z.; Sun, K. Location and mechanism analysis of oscillation source in power plant. IEEE Access 2020, 8, 97452–97461. [Google Scholar] [CrossRef]
  9. Sarmadi, S.A.N.; Venkatasubramanian, V. Inter-area resonance in power systems from forced oscillations. IEEE Trans. Power Syst. 2016, 31, 378–386. [Google Scholar] [CrossRef]
  10. Feng, S.; Chen, J.N.; Ye, Y.; Wu, X.; Cui, H.; Tang, Y.; Lei, J.X. A two-stage deep transfer learning for localisation of forced oscillations disturbance source. Int. J. Electr. Power Energy Syst. 2022, 135, 107577. [Google Scholar] [CrossRef]
  11. Feng, S.; Peng, X.J.; Chen, J.N. Forced oscillation localization and propagation prediction based on spatiotemporal graph convolutional neural network. Proc. CSEE 2024, 44, 1298–1310. [Google Scholar] [CrossRef]
  12. Guo, S.J.; Liu, X.; Jiang, C.; Cong, J. Power Oscillation Source Location Based on the Combination of Energy Function and Normal Distribution in a Fully Data-Driven Approach. Energies 2024, 17, 5237. [Google Scholar] [CrossRef]
  13. Tyloo, M.; Vuffray, M.; Lokhov, A.Y. Forced Oscillation Source Localization from Generator Measurements. IEEE Trans. Power Syst. 2025. early access. [Google Scholar] [CrossRef]
  14. Chen, L.; Min, Y.; Hu, W. Low-frequency oscillation analysis and oscillation source localization based on oscillation energy (Part 1): Theoretical foundation and energy flow calculation. Autom. Electr. Power Syst. 2012, 36, 22–27, 86. [Google Scholar]
  15. Chen, L.; Min, Y.; Hu, W. An energy-based method for location of power system oscillation source. IEEE Trans. Power Syst. 2013, 28, 828–836. [Google Scholar] [CrossRef]
  16. Jiang, T.; Liu, B.H.; Li, X. Forced oscillation source location in power systems based on multivariate empirical mode decomposition. Proc. CSEE 2022, 42, 8063–8075. [Google Scholar] [CrossRef]
  17. Chen, L.; Sun, M.; Min, Y.; Xu, X.L.; Xi, J.H.; Li, Y. Online monitoring of generator damping using dissipation energy flow computed from ambient data. IET Gener. Transm. Distrib. 2017, 11, 4430–4435. [Google Scholar] [CrossRef]
  18. Cai, G.W.; Xuan, L.; Sun, Z.L.; Chao, J.; Belikov, J.; Levron, Y. Ambient data-based online identification and location of frequency oscillations. Int. J. Electr. Power Energy Syst. 2024, 157, 109843. [Google Scholar] [CrossRef]
  19. Zuhaib, M.; Rihan, M.; Saeed, M.T. A novel method for locating the source of sustained oscillation in power system using synchro phasors data. Prot. Control. Mod. Power Syst. 2020, 5, 1–12. [Google Scholar] [CrossRef]
  20. Yang, X.; Liu, B.; Wang, J. Research on Forced Oscillation Source Location Method of New Power System Using Complete EEMD with Adaptive Noise. In Proceedings of the 2022 9th International Forum on Electrical Engineering and Automation (IFEEA), Zhuhai, China, 4–6 November 2022; pp. 421–425. [Google Scholar]
  21. Cai, Y.; Pierrou, G.; Wang, X. A Data-Driven Forced Oscillation Locating Method for Power Systems with Inverter-Based Resources. IEEE Trans. Power Syst. 2025. early access. [Google Scholar] [CrossRef]
  22. Osipov, D.; Konstantinopoulos, S.; Chow, J.H. A Cross-Power Spectral Density Method for Locating Oscillation Sources Using Synchrophasor Measurements. IEEE Trans. Power Syst. 2023, 38, 5526–5534. [Google Scholar] [CrossRef]
  23. Jiang, T.; Liu, B.; Li, X. Sub synchronous Oscillation Source Location in Power System with High Penetration of Wind Power Using Multivariate Variational Mode Decomposition. IEEE Trans. Power Syst. 2025, 40, 4971–4983. [Google Scholar] [CrossRef]
  24. Li, M.J.; Xie, Z.; Xu, S.; Yang, S.Y.; Zhang, X. Electromechanical oscillation analysis and suppression of grid forming DFIG-based wind turbines under weak grid. IEEE Trans. Energy Convers. 2025, 40, 1365–1377. [Google Scholar] [CrossRef]
  25. Abhinav, K.; Rai, P.; Prakash, A.; Parida, S.K. A data-driven online approach for detection and localization of forced oscillation in wind turbine integrated power system. Electr. Power Syst. Res. 2024, 233, 110512. [Google Scholar] [CrossRef]
  26. Zhang, X.; Ye, J.; Gao, L.T.; Ma, S.B.; Xie, Q.M.; Huang, H. Short-term wind power prediction based on ICEEMDAN decomposition and BITCN-BIGRU-multi-head self-attention model. Electr. Eng. 2025, 107, 2645–2662. [Google Scholar] [CrossRef]
  27. Xu, B.; Zhou, F.X.; Li, H.P.; Yan, B.K.; Liu, Y. Early fault feature extraction of bearings based on Teager energy operator and optimal VMD. ISA Trans. 2019, 86, 249–265. [Google Scholar] [CrossRef]
  28. Liu, C.; Han, Z.Y.; Diao, S.; Zhang, Y.C. Small-disturbance stability sensitivity analysis and application of photovoltaic grid based on branch mode energy. Electr. Power Autom. Equip. 2025, 45, 99–105+114. [Google Scholar]
  29. Gong, Z.; Xie, X.; Liu, C. Investigation of the forced oscillation in a VSG-based PV System. In Proceedings of the 2024 lEEE PES 16th Asia-Pacific Power and Energy Engineering Conference, Nanjing, China, 25–27 October 2024. [Google Scholar]
Figure 1. Grid-connected structure diagram of GFM-DFIG.
Energies 18 06025 g001
Figure 2. Control block diagram of the GFM-DFIG grid-connected system.
Energies 18 06025 g002
Figure 3. Flowchart of the forced oscillation source location method based on ICEEMDAN.
Energies 18 06025 g003
Figure 4. Modified IEEE 4-machine 2-area system model with GFM-DFIG.
Energies 18 06025 g004
Figure 5. The changes in various electrical variables of each generator (a) Variations in active power output of each generator; (b) Variations in reactive power output of each generator; (c) Variations in bus voltage of each generator (d) Variations in frequency of each generator.
Energies 18 06025 g005
Figure 6. The breakdown of the variation in active power output of G3 (a) IMF1; (b) IMF2; (c) IMF3; (d) IMF4; (e) IMF5; (f) IMF6; (g) IMF7; (h) res.
Energies 18 06025 g006
Figure 7. Heatmap of energy weights for each electrical quantity of G3.
Energies 18 06025 g007
Figure 8. Energy flow of the dissipative mode in the method proposed in this paper.
Energies 18 06025 g008
Figure 9. Dissipative energy flow based on other methods in the modified IEEE 4-machine 2-area system (a) DEF; (b) MEMD-TEO.
Energies 18 06025 g009
Figure 10. Energy weight heat map of each electrical quantity of WTG1 (a) The disturbance source is located in the active power outer loop Pref; (b) The disturbance source is located in the reactive voltage loop Uref.
Energies 18 06025 g010
Figure 11. Energy flow of each generator’s dissipation mode when the disturbance source is located in the VSG control loop (a) The disturbance source is located in the active power outer loop Pref; (b) The disturbance source is located in the reactive voltage loop Uref.
Energies 18 06025 g011
Figure 12. Electrical variation in each generator under 10 dB noise level. (a) Variations in active power output of each generator under 10 dB noise; (b) Variations in reactive power output of each generator under 10 dB noise; (c) Variations in bus voltage of each generator under 10 dB noise (d) Variations in frequency of each generator under 10 dB noise.
Energies 18 06025 g012
Figure 13. Dissipation mode energy flow calculated by the proposed method under 10 dB noise level.
Energies 18 06025 g013
Figure 14. Modified IEEE 10-machine 39-bus system model of the GFM-DFIG.
Energies 18 06025 g014
Figure 15. The disturbance source is located in the calculation result of the G8 excitation link (a) Heat map of energy weights for various electrical quantities of the G8; (b) Energy flow diagrams of each generator’s dissipation mode.
Energies 18 06025 g015
Figure 16. Heatmap of energy weights for each electrical quantity of WTG1 (a) The disturbance source is located in the active power outer loop Pref; (b) The disturbance source is located in the reactive voltage loop Uref.
Energies 18 06025 g016
Figure 17. Energy flow diagrams of each generator’s dissipation mode for the method proposed in this paper (a) The disturbance source is located in the active power outer loop Pref; (b) The disturbance source is located in the reactive voltage loop Uref.
Energies 18 06025 g017
Figure 18. Dissipative energy flow based on other methods in the modified IEEE 10-machine 39-bus system (a) DEF; (b) MEMD-TEO.
Energies 18 06025 g018
Figure 19. Partial topology map of ISO New England.
Energies 18 06025 g019
Figure 20. Measured electrical quantity signals of ISO New England. (a) Active power output of each generator; (b) Reactive power output of each generator; (c) Bus voltage of each generator (d) Frequency of each generator.
Energies 18 06025 g020
Figure 21. Heat map of energy weights for each electrical quantity in Gen2.
Energies 18 06025 g021
Figure 22. Energy flow of dissipation mode in the ISO New England System.
Energies 18 06025 g022
Table 1. Parameters of GFM-DFIG.
ParametersSymbolValue
Active power referencePref5 MW
Reactive power referenceQref0
Virtual inertia coefficientJ5
Virtual damping coefficientDp100
Droop coefficientKQ0.02
Voltage controlKu_d, Ku_q4, 4
Current controlKi_d, Ki_q0.0496, 0.0496
Stator inductanceLs0.01
Rotor inductanceLr0.1
Table 2. Comparison of computational efficiency between the proposed method and other methods.
MethodComputation TimeComputational Efficiency Improvement
DEF14.541 s
MEMD-TEO10.354 s28.79%
ICEEMDAN-ITEO7.272 s49.99%
Disclaimer/Publisher’s Note: The statements, opinions and data contained in all publications are solely those of the individual author(s) and contributor(s) and not of MDPI and/or the editor(s). MDPI and/or the editor(s) disclaim responsibility for any injury to people or property resulting from any ideas, methods, instructions or products referred to in the content.