Article

Modelling the Impact of Hard Coal Mining Reduction on the Structure Energy Mix and Economy in an Inter-Industry Approach—A Case Study of Poland

by
Monika Pepłowska
1,
Stanisław Tokarski
2 and
Piotr Olczak
1,*
1
Mineral and Energy Economy Research Institute of the Polish Academy of Sciences, 31-261 Kraków, Poland
2
Central Mining Institute, 40-166 Katowice, Poland
*
Author to whom correspondence should be addressed.
Energies 2025, 18(22), 6021; https://doi.org/10.3390/en18226021
Submission received: 30 August 2025 / Revised: 4 November 2025 / Accepted: 11 November 2025 / Published: 18 November 2025

Abstract

In Poland, the gradual reduction in hard coal mining represents a cornerstone of the energy transition and economic restructuring strategy, with all mines scheduled to close by 2049 under the Social Agreement. Given Poland’s strong reliance on coal, this process has far-reaching implications for energy security, employment, regional development, and macroeconomic stability. The aim of this study is to assess the role and scale of the hard coal mining sector’s contribution to GDP and to examine the consequences of its gradual decline for the national energy mix. In the input–output framework, a reduction in domestic hard coal supply is modelled as a shock to the output of the disaggregated hard coal sector, affecting both intermediate demand and value added through inter-industry linkages. The analysis applies an inter-industry input–output framework based on a decomposed Input–Output Table of Poland, where the aggregated “hard coal and lignite” branch was disaggregated into thermal hard coal, coking coal, and lignite. Reduction Variants (WR25%, WR50%, WR75%, and WR100%) were combined with Substitution Variant WS2, which assumes replacement of domestic hard coal with imported coal, natural gas, and electricity under varying price scenarios (−40% to +40% relative to reference levels). The Migration Variant was also included to account for labour market effects. This approach generated a set of 100 scenarios, reflecting possible pathways of Poland’s energy transition. The results demonstrate that in every scenario, reducing domestic hard coal supply leads to a decline in GDP. Losses range from −0.175% to −0.25% under WR25% scenarios to between −0.775% and −1.1% under WR100%, depending on the relative prices of imported substitutes. Substitution patterns are highly sensitive to price dynamics: under low natural gas prices, gas dominates the replacement mix (over 57% share), while under high gas prices, imported coal prevails (70–90%). Electricity imports consistently remain marginal. These outcomes highlight Poland’s structural dependence on coal, the vulnerability of GDP to external price shocks, and the limitations of substitution options. This study concludes that the reduction in domestic coal mining, though inevitable in the context of the EU climate policy, will not be economically neutral. It requires careful management of substitution pathways, diversification of the energy mix, and socio-economic support for coal regions. The input–output framework used in this research offers a robust tool for quantifying both direct and indirect effects of the coal phase-out, supporting evidence-based policy for a just and sustainable energy transition.

1. Introduction

In Poland, the gradual reduction in hard coal mining has become a central element of the national energy and economic transformation strategy. In accordance with the Social Agreement signed in 2021, coal mines are to be successively closed down by 2049, which marks a fundamental shift in the country’s energy mix and industrial structure (Figure 1) [1]. This process, while aligned with the European climate policy and global decarbonisation trends, creates far-reaching challenges for the national economy, especially for coal-dependent regions. Poland remains one of the most coal-dependent countries in the European Union, which makes the pace and scale of the transition particularly significant in shaping both energy security and socio-economic stability.
From the macroeconomic perspective, evaluating the consequences of reducing hard coal extraction is essential not only for the security of the energy sector but also for the stability of the entire economy. Hard coal mining in Poland has historically been intertwined with industrial production, regional development, and employment. Therefore, its decline may affect a broad range of economic activities through inter-industry linkages. The most appropriate measure of the overall economic effect is Gross Domestic Product (GDP), which reflects both direct and indirect impacts on national income.
The relationship between hard coal mining and GDP is multidimensional and has been highlighted in numerous studies. Pepłowska and Olczak (2024) [2] provide a comprehensive review of the literature, structuring their analysis around five key research areas: (i) the impact of economic sectors on national economic growth and GDP dynamics, (ii) identification of key sectors using the input–output method, (iii) the contribution of coal mining and extractive industries to Poland’s GDP, (iv) analyses of structural changes in the Polish economy, and (v) the application of input–output models to assess the effects of sectoral supply reduction. This body of work demonstrates the complexity of capturing both direct and indirect contributions of coal mining to GDP, as well as the structural vulnerabilities resulting from its gradual decline [2].
International literature also reinforces this perspective. Studies on energy transitions and resource dependence point to structural vulnerabilities in economies reliant on coal [3,4]. Research emphasises uneven regional outcomes, where coal-dependent areas often lag behind in terms of per capita GDP and diversification opportunities, leading to the so-called “coal lock-in” [5]. Moreover, phase-out processes are associated with labour market shocks, job losses, and the necessity of significant investment in retraining and economic diversification [6,7]. At the same time, environmental degradation caused by coal mining undermines public health and productivity, further amplifying long-term economic risks [8].
In addition to importing fossil fuels and natural gas, effective transformation requires the development of domestic low-carbon technologies, such as hybrid renewable energy installations using waste gasification [9], the modernisation of coal-fired power units to increase flexibility in a system dominated by renewable energy sources [10], and the implementation of nuclear energy—both in the form of large power reactors (AP1000) and small modular reactors (SMR) [11]. Globally, García-Casals et al. (2019) project that global GDP may rise by 1.5% by 2031 and 1.0% by 2050 when energy transitions include robust just transition measures and a shift to renewables [12]. Patrizio et al. report that, compared with business-as-usual scenarios, gross value added could grow by as much as 50% when decarbonization strategies incorporate policies such as job guarantees, retraining, and social protection [13]. In contrast, studies focused on fossil-fuel-dependent regions—such as Bohlmann et al. (2023) for Mpumalanga and Pollin (2023) for West Virginia—detail short-term GDP declines (around 1% or costs equivalent to 0.2% of GDP) and job losses that are partly offset by new opportunities in renewable sectors [14,15].
Taken together, these findings underscore that the decline of coal mining has implications well beyond the sector itself: it affects energy-intensive industries, labour markets, regional development, fiscal stability, and environmental sustainability.
For these reasons, understanding the systemic role of hard coal mining in Poland requires analytical tools capable of capturing both direct and indirect interactions across sectors. The input–output (I–O) framework provides such an instrument, enabling the identification of inter-industry linkages and the measurement of sectoral contributions to GDP. Its application is particularly valuable in modelling scenarios of mining reduction combined with substitution by imported resources or alternative energy carriers.
In the input–output framework, a reduction in domestic hard coal supply is modelled as a shock to the output of the disaggregated thermal hard coal sector, affecting both intermediate demand and value added through inter-industry linkages.
This study employs a decomposed input–output model to quantify direct and indirect effects of hard coal supply reduction on GDP and the energy mix, with scenario analysis detailed in Section 2.

2. Materials and Methods

The methodological framework of this study is designed to quantify the economic impact of reducing domestic hard coal mining and to assess the associated changes in the national energy mix. To achieve this, the research applies an inter-industry modelling approach based on the input–output (I–O) method. The analysis involves three key steps: (i) the use of input–output analysis to capture sectoral linkages and multipliers, (ii) the decomposition of the official Polish input–output tables to separate thermal hard coal from other coal-related branches, and (iii) the construction of reduction and substitution scenarios reflecting different levels of coal mining decline, resource price dynamics, and labour migration. This section first presents the theoretical basis of the I–O method (Section 2.1), followed by its application to GDP modelling (Section 2.2), and finally the design of reduction and substitution scenarios (Section 2.3).

2.1. Input-Output Method

The study applies the input–output (I–O) method, originally developed by Wassily Leontief, which is widely used to analyse inter-industry linkages and to assess the role of individual sectors in economic growth. The I–O framework is based on input–output tables that describe flows of goods and services between sectors within the economy. By manipulating these tables, it is possible to determine how changes in the output of one sector—in this case, hard coal mining—affect the production, value added, and final demand in other sectors. This property makes the I–O method particularly suitable for quantifying both direct and indirect effects of coal mining reduction on GDP.
In this subsection, the Leontief inter-industry flow method is presented, together with the calculation scheme applied under the input–output approach. According to Klein (1982), an economic model is a schematic simplification that omits non-essential aspects in order to explain the internal functioning, form, or structure of a more complex mechanism [16]. Within the field of research devoted to the modelling of economic interrelationships, input–output analysis occupies a special place. In Polish literature it is also referred to as input–output analysis, inter-industry flow analysis, or input–output relations analysis. As Plich (2002) points out, it is probably the most widely used research method in this context [17].
The inter-industry flow model (input–output) is an economic model that reflects the dependencies between sectors of the economy and is regarded as the most transparent model of supplier–buyer relations [18]. This model shows how the output of one sector becomes the input of another sector, and how changes in demand or supply affect the economy as a whole. This feature provides wide opportunities for application. The input–output model was proposed by Wassily W. Leontief, inspired by the works of François Quesnay and Léon Walras [19,20,21,22,23]. Leontief’s input–output model was originally intended to increase the functionality of Walras’s general equilibrium model and its interdependencies [24]. Leontief’s inter-industry flow method refers to the national economy as a whole [25].
Leontief’s input–output model is based on matrices of inter-sectoral dependencies. These matrices present input and output tables of production for each sector of the economy, and a scheme of such a table is shown below (Table 1).
In the input–output table, three parts are distinguished (sometimes four—part IV is devoted to the distribution of gross national income) [26]:
Part I—the intermediate consumption matrix (ICM) (blue color), also called the transaction matrix, which includes mutual transactions between sectors. The rows present the flow of intermediate demand, i.e., purchases of products (services) intended for further processing. The columns, in turn, are interpreted as the structure of impersonal costs of individual sectors.
Part II—the final demand matrix (FDM) (pink colour), which consists of consumption in the household sector, in the sector of non-profit institutions serving households, and in the government and local government sector; gross fixed capital formation; changes in inventories and valuables; and exports.
Part III—the gross value added matrix (GVAM) (gold colour), which consists of employment-related costs; other taxes less subsidies on production; depreciation; net operating surplus/mixed income; and gross operating surplus/gross mixed income.
In the input–output table for a given year, for each sector/branch of the economy (i = 1, …, n), the output X i , is distinguished, which is divided into intermediate consumption in the branch x i , j and into final demand Y i by households, the government sector, as well as accumulation and exports. Accordingly, the total output for the i-industry (sector) of the economy is calculated as follows: [27,28,29,30]:
X i =   x i , 1 + x i , 2 + +   x i , j + + x i , n + Y i   for   i , j   =   1 , 2 n
where
  • i —product/product supplier/branch of the economy from which the product originates,
  • j —product recipient/branch of the economy to which the product is delivered,
  • X i —total output of branch i ,
  • x i , j —intermediate consumption of products from branch i by branch j , (intermediate demand),
  • Y i —final consumption of products from branch i , (final demand).
The fundamental assumption in input–output analysis is that the flow of products from branch i to branch j depends solely on the level of total output of branch j. In practice, this means that the greater the output of a branch, the higher its demand for raw materials. By analyzing a specific case, we are able to determine the proportion in which inputs are related to total output. The coefficient a i , j , which describes the share of inputs and total output value in a given branch j, is called the technical coefficient or the direct input coefficient, the product intensity coefficient, or the input–output coefficient. It should be noted that production and product flows are expressed in monetary units, and the coefficient a i , j , is interpreted as the value of inputs required for production in branch j. The values of the coefficients a i , j , characterizing the share of input from branch i in the total (global) output value of branch j, are determined by the following formula:
a i , j = x i , j X j
Hence the equation:
X j = i = 1 n x i , j + Y
can be written in the form:
X 1 = a 1,1 x 1 + a 1,2 x 2 + + a 1 , n x n + y 1 X 2 = a 2,1 x 1 + a 2,2 x 2 + + a 2 , n x n + y 2 . X n = a n , 1 x 1 + a n , 2 x 2 + + a n , n x n + y n
Leontief’s input-output model describes the structure of the economy for all branches in a given year, and the equation describing this model is written in the following form:
X = I A 1 Y =   L 1 Y
where
  • X —the vector (n × 1) output in all sectors from X 1 to X n ;
  • I —the unit matrix;
  • A —the matrix (n × n) product intensity ratios ( a i , j );
  • Y —the vector (n ×1) final consumption in all branches.
A = a i , j = x i , j X j = x 1,1 X 1 x 1 , n X n x n , 1 X 1 x n , n X n
The expression I A 1 , called the Leontief inverse matrix ( L 1 ), is the matrix of material intensity coefficients. The values in this matrix show by how much the output of each branch i must increase in order to enable an increase of one unit in the output of sector j, when final demand for the products of branch j rises by one unit. In other words, the elements of this matrix express how much production in each sector must grow to increase the output of sector j by one unit.
In summary, the input–output table is constructed on the basis of information relating to a specific economic area, which may be the national economy. These data refer to a specific period, most often one year.
The Leontief model is linear, and thus additive and homogeneous. Consequently, the Leontief model can be applied to incremental analysis, i.e., changes in total (final) output, which can be expressed as follows:
Δ Y = L Δ X
The interpretation of the elements of the Leontief matrix describes the increase in final output in branch i resulting from a one-unit increase in total output in branch j. The Leontief matrix is used to model the relationships between different sectors of the economy. The inverse of the Leontief matrix (L−1 is applied to invert these relationships and makes it possible to consider the impact of changes in the output of one sector on the entire economy. In practice, it can be used for calculations in analyzing the impact of final demand on economic production. The interpretation of the elements of the inverse Leontief matrix (L−1) is that this matrix describes what increase in total output in branch i will be caused by a one-unit increase in final output in branch j.
Leontief’s input–output model is a tool for short-term forecasting of the future value of the final or total output vector, provided that the assumption of constant production technology—i.e., time-invariant values of the elements of matrix a—is valid [26].
If, based on the model I A X = Y , the vector of final output is determined for a given future vector of total output, we refer to this as a first-type forecast. When the desired future vector of final output is specified, then on the basis of I A 1 Y = X the vector of total output is determined that will allow the achievement of final output at the expected level; such a forecast is referred to as a second-type forecast. The last type of forecast determined using the Leontief model is a mixed forecast, which involves forecasting selected elements of the vectors of total and final output when the remaining elements of both vectors are already specified.
In summary, the following forecasts are used in the Leontief model:
The first type of forecasts: known X (or Δ X ) and unknown Y (or ΔY):
L X   =   Y
The second type of forecasts: known Y (or Δ Y ) and unknown X (or Δ X ):
L 1 Y   =   X
Mixed forecasts also occur. As shown in the literature review (Section 2), in most previous studies the essence of applying the input–output model in macroeconomic analyses has been to examine the impact of changes in elements of final demand, treated as exogenous in the model. The key elements in this analysis are those of the matrix I A 1 . Based on these elements, certain measures are constructed, known as input–output multipliers, which in a synthetic way make it possible to determine the impact of exogenous changes in final demand on the output of a given branch, and through it on changes such as the growth of consumer spending, production increases, employment, or import requirements.
When constructing the input–output table, in addition to assuming the branch structure of the economic system, we also take the following into account [31]:
The system is closed; i.e., for each branch, the means of production are products generated within this system;
The system is static; i.e., the inputs for production in a given period are products produced in the same period;
Production is non-substitutable; i.e., the products of a given branch cannot be replaced by the products of other branches.
The value of goods and services produced during the year in an enterprise is referred to as the total output of a given branch. It can be divided into two parts: the portion intended for the production purposes of the system—so-called inter-enterprise flows—and the remaining portion, i.e., final output. Total output is the sum of transferred value (raw materials, semi-finished products, fuel, and energy purchased externally and consumed in production) and value added (the sum of newly created value in the enterprise, including depreciation). The total output of all entities in a branch of the national economy constitutes the total product of the sector, while the sum of total outputs across all branches represents the global product of the national economy. Total output forms the basis for calculating both final output and value added. Value added in each sector is calculated by subtracting from total output the sum of material inputs incurred, originating from different sectors of the national economy. The process of generating value added in each sector does not coincide with the process of generating final output, although in the entire national economy the sum of value added equals the sum of final value produced. By summing the global product values of all branches expressed through distribution equations and then through cost equations, and comparing both sums, we obtain the general equilibrium equation.
Using quantitative input–output models, it is possible to formulate statements regarding direct and indirect effects based on exogenous changes in demand. However, these must be interpreted against the background of their limitations and assumptions, such as time independence and the omission of feedback effects (income and price effects). Although several decades have passed since the formulation of Leontief’s input–output model, modifications still appear, and the applicability and interpretation of input–output multipliers remain a subject of debate [32].

2.2. Calculating the Impact of Coal Mining on GDP Development

The most important advantage of using the input–output framework is the possibility to trace how changes in individual sectors translate into the overall value of GDP.
For the purpose of calculating the impact of reduced thermal hard coal production—resulting from mine closures—on GDP, the official Input–Output Table (TPM) prepared by Statistics Poland (GUS) was decomposed [33]. In this process, the aggregated branch “Hard coal and lignite” was disaggregated into three separate coal-related branches: thermal hard coal, coking coal, and lignite. The aggregated ‘hard coal and lignite’ sector was disaggregated into thermal hard coal, coking coal, and lignite using production and consumption shares from GUS (2015) and energy balance data additionally enriched with expert analysis [2].
The aim of this section is to present the methodology applied to assess the impact of coal mining on GDP by means of inter-industry linkages. Since the modelling process is complex and requires careful selection of methodological steps in order to eliminate potential errors at each stage [34,35,36], the study adopts a mathematical modelling approach widely applied in economics [37].

2.3. Reduction Variants of Domestic Hard Coal Supply and Substitution Scenarios

In the scenarios, various reduction variants of domestic hard coal supply were adopted to reflect potential changes in the coal mining sector in Poland. Each variant considers both the decrease in coal production and the possible employment effects within the mining sector. A reduction in coal output results in mine closures, which consequently leads to a reduction in employment in the industry.
The proposed reduction variants are as follows:
WR25%—reflecting the operation of the hard coal mining sector after a reduction of approximately 25% in domestic coal supply with a corresponding reduction in employment;
WR50%—reflecting a reduction of approximately 50% in domestic coal supply with a corresponding reduction in employment;
WR75%—reflecting a reduction of approximately 75% in domestic coal supply with a corresponding reduction in employment;
WR100%—reflecting the complete elimination of domestic hard coal production with a corresponding reduction in employment.
Implementation of these reduction variants results in a new domestic coal supply structure, which affects inter-industry flows within the economy. In the Decomposed Input–Output Table (TPMD), both direct effects in the coal sector and indirect effects in other economic sectors are reflected.
Due to the reduction in domestic hard coal supply, it may become necessary to substitute coal with imported resources or alternative energy sources (Substitution Variants, WS). The substitution variant considers the use of imported hard coal, imported natural gas, and imported electricity, taking into account the prices of each resource. Specifically, the Substitution Variant WS2 considers the replacement of domestic coal with imported hard coal, imported natural gas, and imported electricity, with their respective prices denoted as P n g I ,   P c I , and P e I . In assessing GDP changes, both coal production reduction and possible labor migration, as well as the impact of prices of alternative energy sources, are considered.
It is important to show the change in GDP as a function of the reduction in thermal coal extraction and the possible migration of workers, both of which have been incorporated into the Reduction Variants (WR), while also accounting for the prices of alternative energy sources, according to the function:
Δ G D P = f ( W R i , P n g I ,   P c I ,   P e I )
where
  • W R i —Reduction Variant;
  • P n g I —imported natural gas price [thousand PLN];
  • P c I —imported hard coal price [thousand PLN];
  • P e I —imported electricity price [thousand PLN].
The diversity of imported energy source (fuel) prices adopted in the article results from a number of factors, such as demand elasticity, production costs, market competition, and import capacity. An analysis of historical data shows significant volatility in commodity prices, which can have a substantial impact on the economy. Therefore, in order to take this complexity into account, a wide price range was adopted in the article, covering possible price changes within the interval from −40% to +40% (formulas 11, 12), variable price of imported natural gas and imported hard coal. Electricity import price P e I is held constant due to short-term import capacity and transmission constraints. It was found that such an approach enables a comprehensive analysis of the impact of fuel price changes on GDP by considering the diversity of factors affecting these changes. In particular, by focusing on the volatility of imported commodity prices, the study can indicate potential consequences for the economy, taking into account both the positive and negative aspects associated with such price fluctuations.
P n g I = + 40 % P n g I R E F + 20 % P n g I R E F P n g I R E F 20 % P n g I R E F 40 % P n g I R E F
P c I = + 40 % P c I R E F + 20 % P c I R E F P c I R E F 20 % P c I R E F 40 % P c I R E F
where
  • P n g I R E F —imported natural gas reference price [thousand PLN];
  • P c I R E F —imported hard coal reference price [thousand PLN];
In terms of substitution, the prices of raw materials were taken into account, considering, among other things, import capacity constraints for raw materials and the costs of technological change. Substitution possibilities were considered separately for the supply side and the demand side, due to their specific characteristics. Thus, substitution possibilities of flows in enterprises (Part I of the input–output table) were analyzed, as well as substitution possibilities of flows on the demand side in the input–output table (Part II of the input–output table). In addition, Part III of the input–output table was recalculated. The details of the substitution carried out on the DTPM are presented in a separate scientific article. Similarly to the case of labor migration, migration variants (WM) were described in Pepłowska (2024) [7]. Substitution flows in ICM and FDM were recalculated proportionally to energy content and price ratios, with import capacity constraints applied [7]. Based on these assumptions, it is possible to develop and analyze alternative scenarios for Poland’s economic system, allowing for an assessment of the impact on GDP, sectoral production, and the structure of the national economy. In the case of the Substitution Variant based on changes in the prices of imported raw materials (WS2), a total of 100 research scenario combinations are possible, namely: 4 reduction variants and 25 substitution variants (various combinations of imported coal, natural gas, and electricity prices), in accordance with Formula (13).
N s c = n W R   n W S
where
  • n W R —number of Reduction Variants;
  • n W S —number of Substitution Variants.
The results of the above analyses are presented for each of the designated sub-sites in the following subsections.
In summary, the methodological framework combines reduction variants (WR), substitution scenarios (WS), and migration variants (WM), resulting in a comprehensive set of possible research scenarios. These scenarios allow for the evaluation of the systemic consequences of hard coal mining decline on Poland’s economy and energy mix. The next section presents the results of these analyses, focusing on the impact on GDP, sectoral production, and the structure of the national economy.

3. Results of Analyses

This section presents the results of the modelling exercise based on the reduction, substitution, and migration variants introduced in the methodological section. The analyses focus on quantifying the impact of different coal reduction pathways on GDP, while also considering structural changes in the energy mix and sectoral production. The results are organised into subsections: first, the overall relationship between economic sectors and GDP (Section 3.1), followed by the outcomes of specific research scenarios with varying resource prices and reduction levels (Section 3.2). This structure makes it possible to highlight both the aggregate economic effects and the detailed dynamics of substitution under Poland’s ongoing energy transition.

3.1. The Impact of Economic Sectors on the Country’s Economic Growth (GDP)

In this subsection, the results of calculations for the individual research scenarios are presented. The combination of Reduction Variants, Substitution Variants, and the introduction of the Migration Variant made it possible to prepare combinations of variants for research scenarios that may occur within the framework of the energy transition process being implemented in Poland.
The GDP values were calculated on the basis of the input–output table according to the following formula:
G D P   =   T O T A L   O U T P U T     I N T E R M E D I A T E   C O N S U M P T I O N   +   T A X E S   O N   P R O D U C T S   M I N U S   S U B S I D I E S   O N   P R O D U C T S
In order to verify the correctness of the preparation of the Decomposed Input–Output Table, the column balance was checked against the row balance in the table (also taking into account the changes introduced due to the reduction, substitution, and migration variants).
The verification of the decomposed input–output table confirmed the internal consistency of the model, ensuring that the applied framework is robust for scenario analysis. On this basis, the study proceeds to assess specific combinations of reduction and substitution variants, with particular attention to the role of resource price dynamics and migration effects. The following Section 3.2 presents the results for the Substitution Variant WS2, which assumes the replacement of domestic hard coal with imported coal, natural gas, and electricity, across different price scenarios.

3.2. Results of Research Scenarios—Substitution Variant WS2

3.2.1. Natural Gas Price 40% Lower

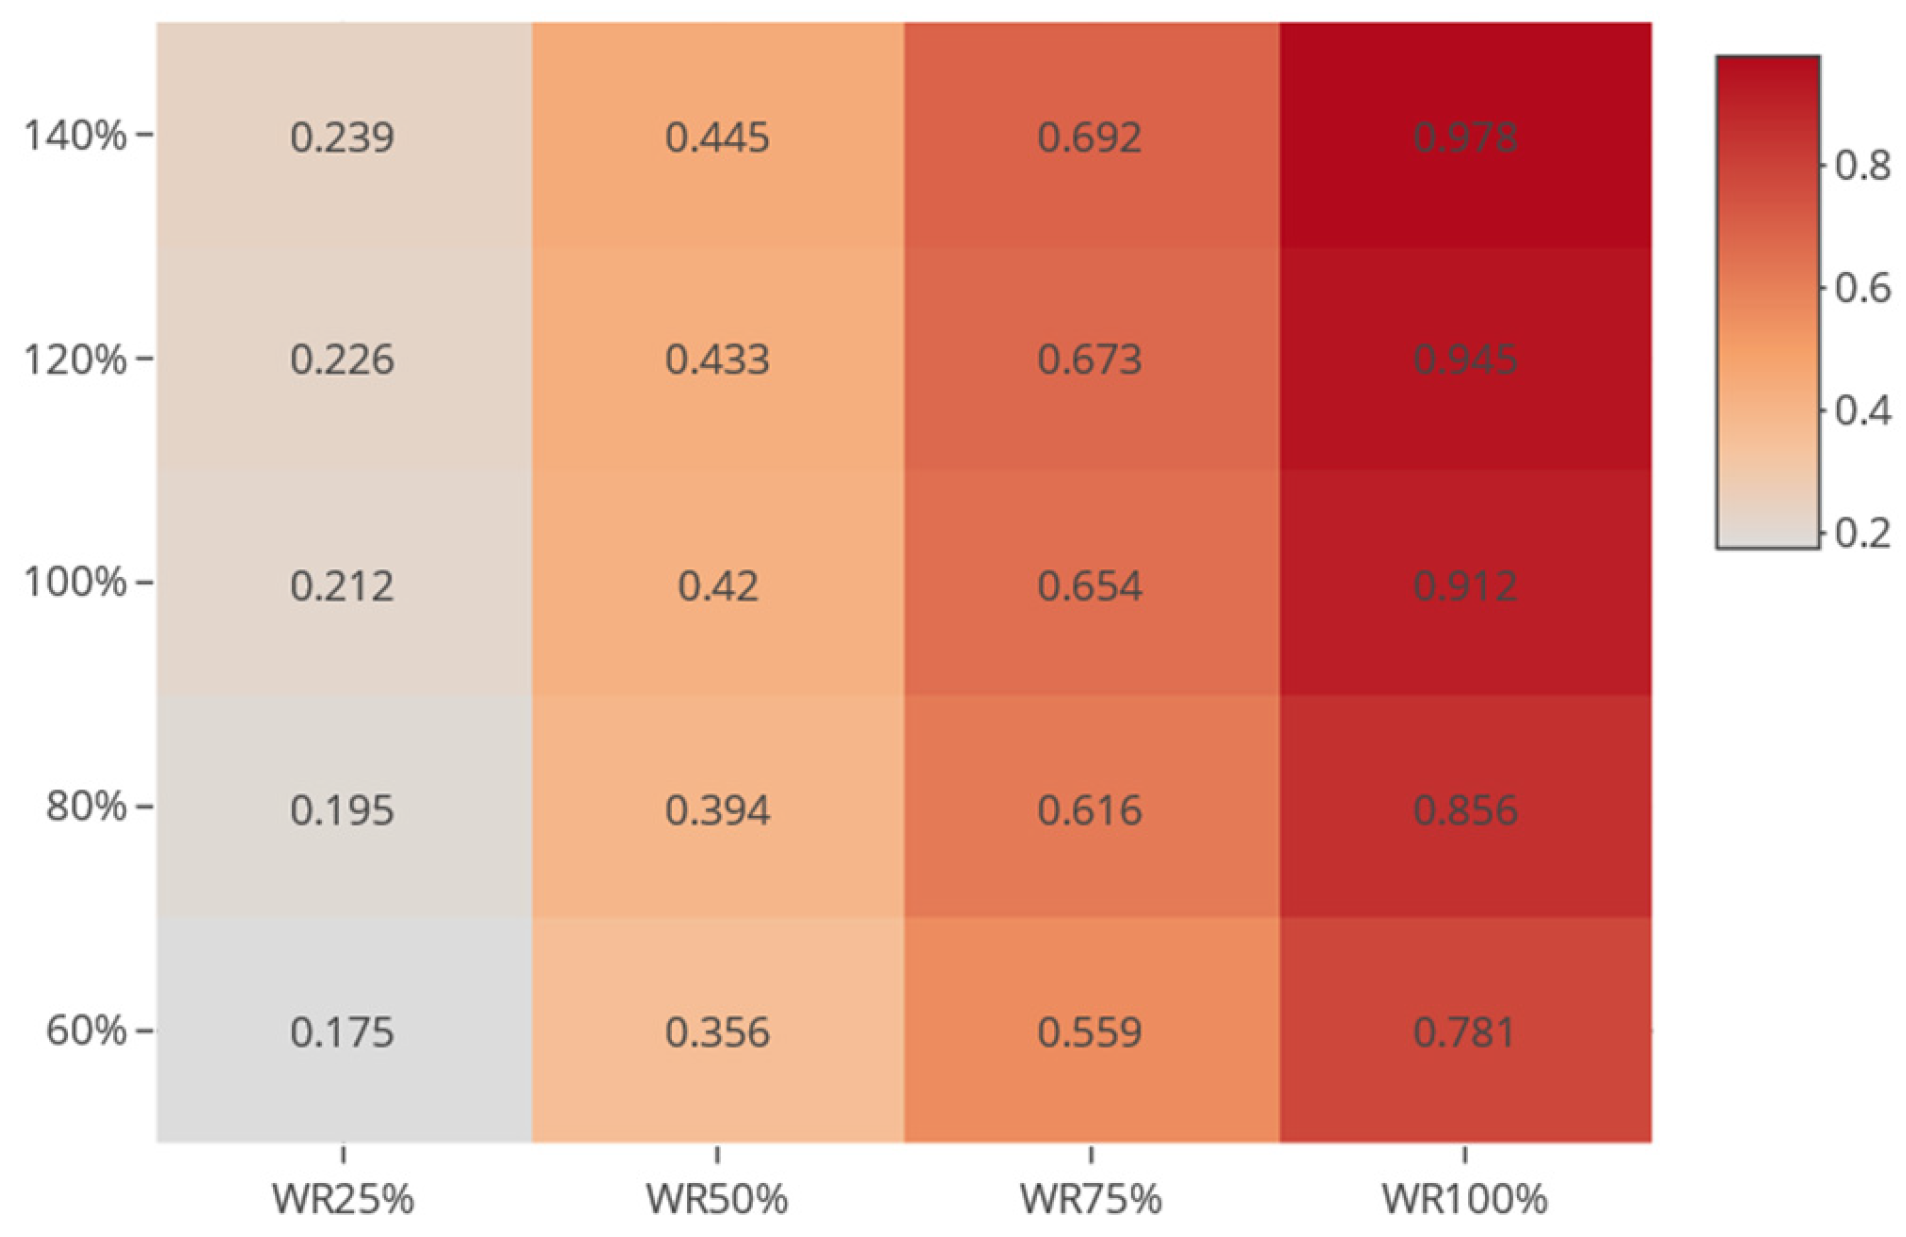
If the total demand for domestic hard coal for energy purposes is substituted with a mix of imported resources, namely imported hard coal, imported natural gas, and imported electricity (WS2), and the price of imported natural gas is 40% lower than the reference price (reference price of imported natural gas—PLN 0.7/m3), and we include Migration, while reducing domestic coal mining by 25% (Reduction Variant WR25%), and if the price of imported coal is equal to the price of domestic coal, GDP decreases by 0.212%. However, if the price of imported coal is 40% lower than the price of domestic coal, GDP decreases by 0.175%, and if the price of imported coal is 20% lower than the price of domestic coal, GDP decreases by 0.195%. On the other hand, if the price of imported coal is 20% higher than the price of domestic coal, GDP decreases by 0.226%, while if it is higher by 40%, it decreases by 0.239%.
In the case of a 100% reduction (Reduction Variant WR100%), and if the price of imported coal is equal to the price of domestic coal, GDP decreases by 0.912%. However, if the price of imported coal is 40% lower than the price of domestic coal, GDP decreases by 0.781%, and if the price of imported coal is 20% lower than the price of domestic coal, GDP decreases by 0.856%. On the other hand, if the price of imported coal is 20% higher than the price of domestic coal, GDP decreases by 0.945%, while if it is higher by 40%, the GDP decreases by 0.978%.
The results for different percentage values of the reference coal price and different Reduction Variants of mining, assuming a 40% decrease in the price of natural gas, are presented in the chart in the form of a heat map (Figure 2).
With the increase in the possible reduction in hard coal mining for energy purposes (from WR25% to WR100%), in the case when substitution occurs with a mix of resources, namely imported hard coal, imported natural gas, and imported electricity, and when the price of natural gas is 40% lower than the reference price and the price of imported hard coal is equal to the price of domestic coal, the decline in GDP value ranges from 0.175% to 0.781%. However, when the price of imported coal changes and coal prices increase by 40%, the decline in GDP value ranges from 0.239% to 0.978% (this is the largest decline in GDP value for such an assumed combination of Reduction, Substitution, and Migration Variants). On the other hand, when the prices of imported resources are lower than domestic prices, for example, by 40%, the decline in GDP values also falls within the range from 0.239% to 0.978%.
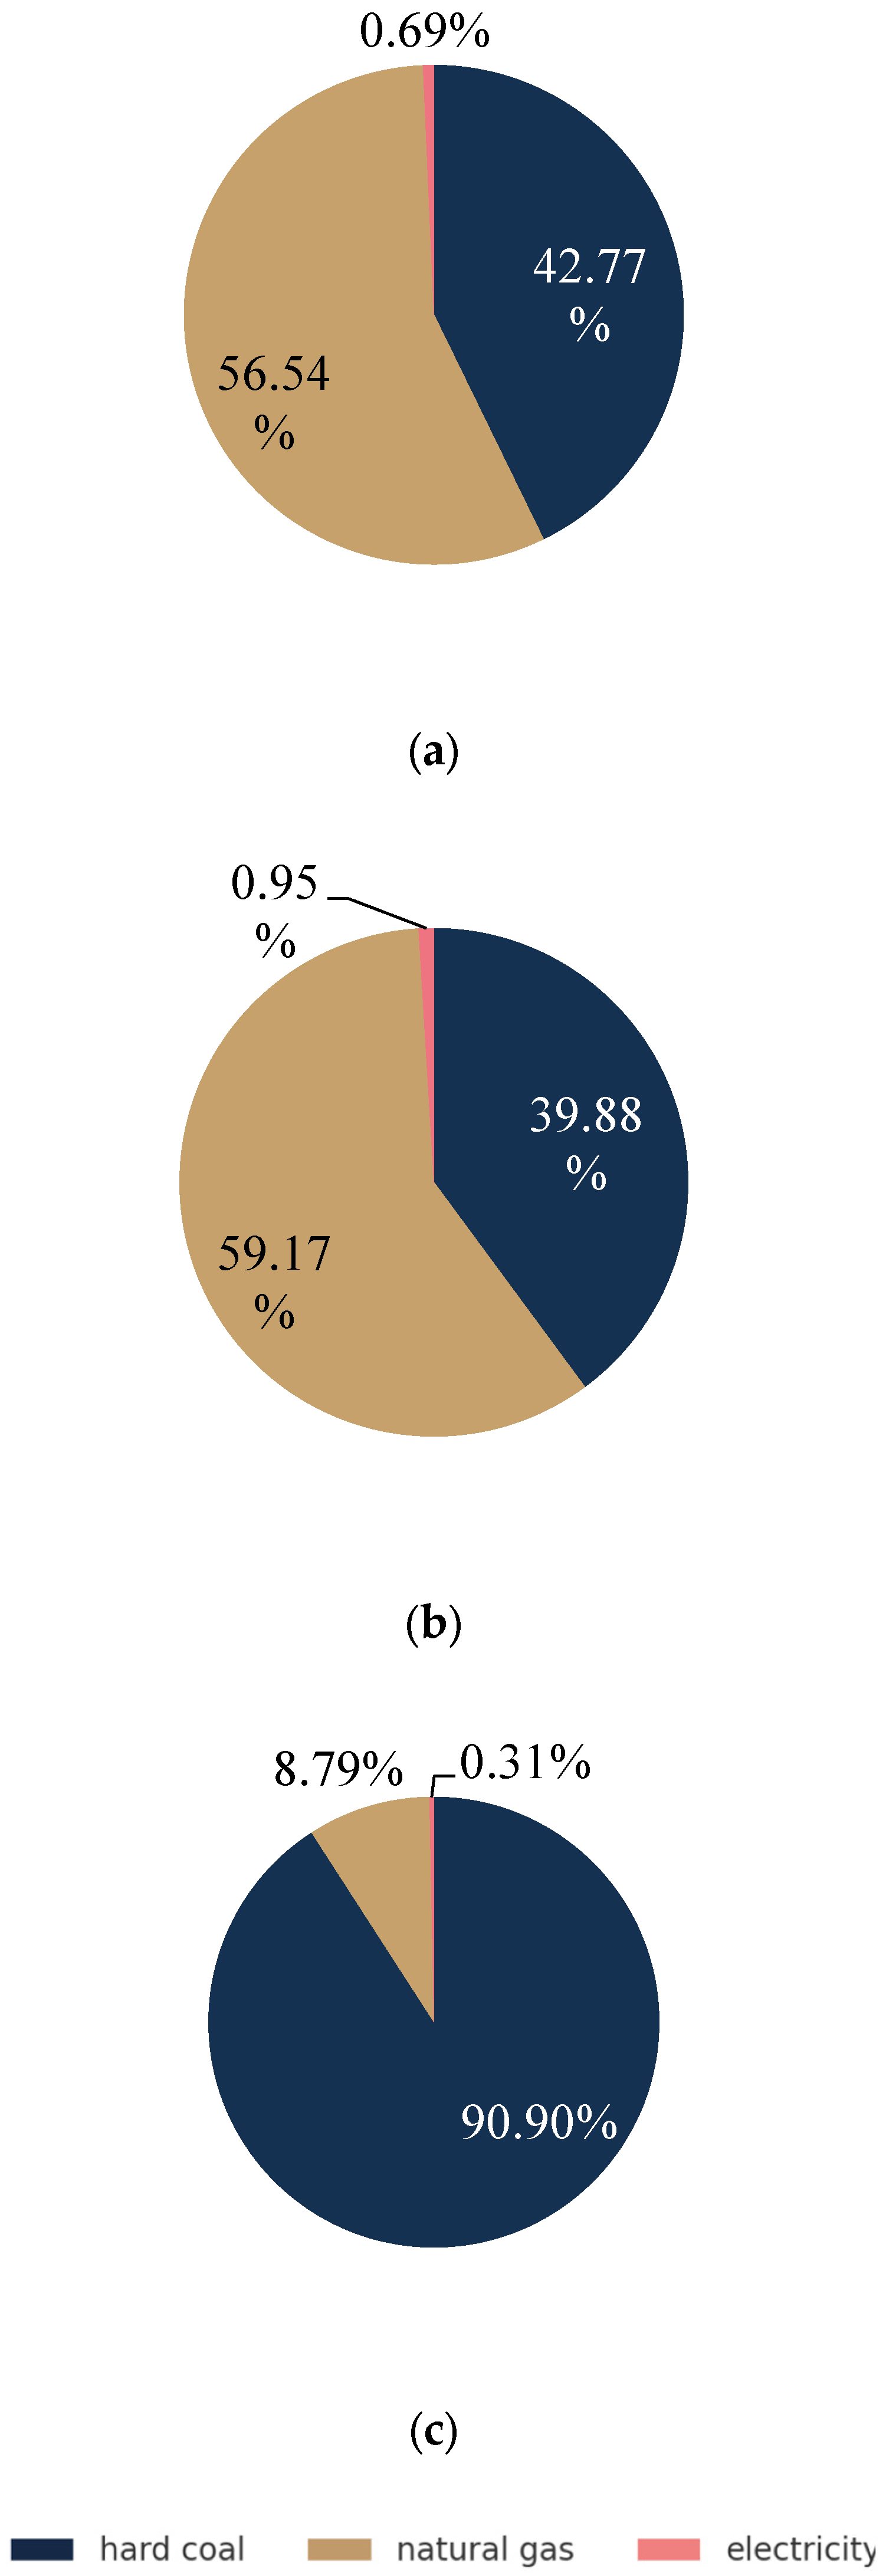
In the case where the total demand for domestic hard coal for energy purposes is substituted with a mix of imported resources, namely imported hard coal, imported natural gas, and imported electricity (WS2), and the price of natural gas is 40% lower than the reference price (reference price of imported natural gas—PLN 0.7/m3), and we include Migration and completely cease domestic hard coal mining (WR100%), while the price of imported hard coal equals the price of domestic hard coal, the result of the Substitution model indicates the following structure of resource imports (Figure 3a). In this case, the most significant component is imported natural gas, accounting for more than 56%, imported hard coal accounts for 42.77% of the replaced energy, and the share of imported electricity in the structure is small.
However, if the total demand for hard coal in the country is substituted with a mix of imported resources, namely imported hard coal, imported natural gas, and imported electricity (WS2), and the price of natural gas is 40% lower than the reference price (reference price of imported natural gas—PLN 0.7/m3), and we include Migration and completely cease domestic hard coal mining (WR100%), while the price of imported hard coal is 40% higher than the price of domestic hard coal, the result of the Substitution model indicates the following structure of resource imports (Figure 3b). In this case, the share of imported hard coal is still lower than that of natural gas and amounts to just under 40% of the replaced energy, while imported natural gas accounts for almost 60%, and the share of imported electricity in the structure remains small.
In the situation where the total demand for domestic hard coal for energy purposes is substituted with a mix of imported resources, namely imported hard coal, imported natural gas, and imported electricity (WS2), and the price of natural gas is 40% lower than the reference price (reference price of imported natural gas—PLN 0.7/m3), and we include Migration and completely cease domestic hard coal mining (WR100%), while the price of imported hard coal is 40% lower than the price of domestic hard coal, the result of the Substitution model indicates the following structure of resource imports (Figure 3c). In this case, almost the entire import structure consists of imported hard coal, which accounts for nearly 91% of total imports.

3.2.2. Natural Gas Price 20% Lower

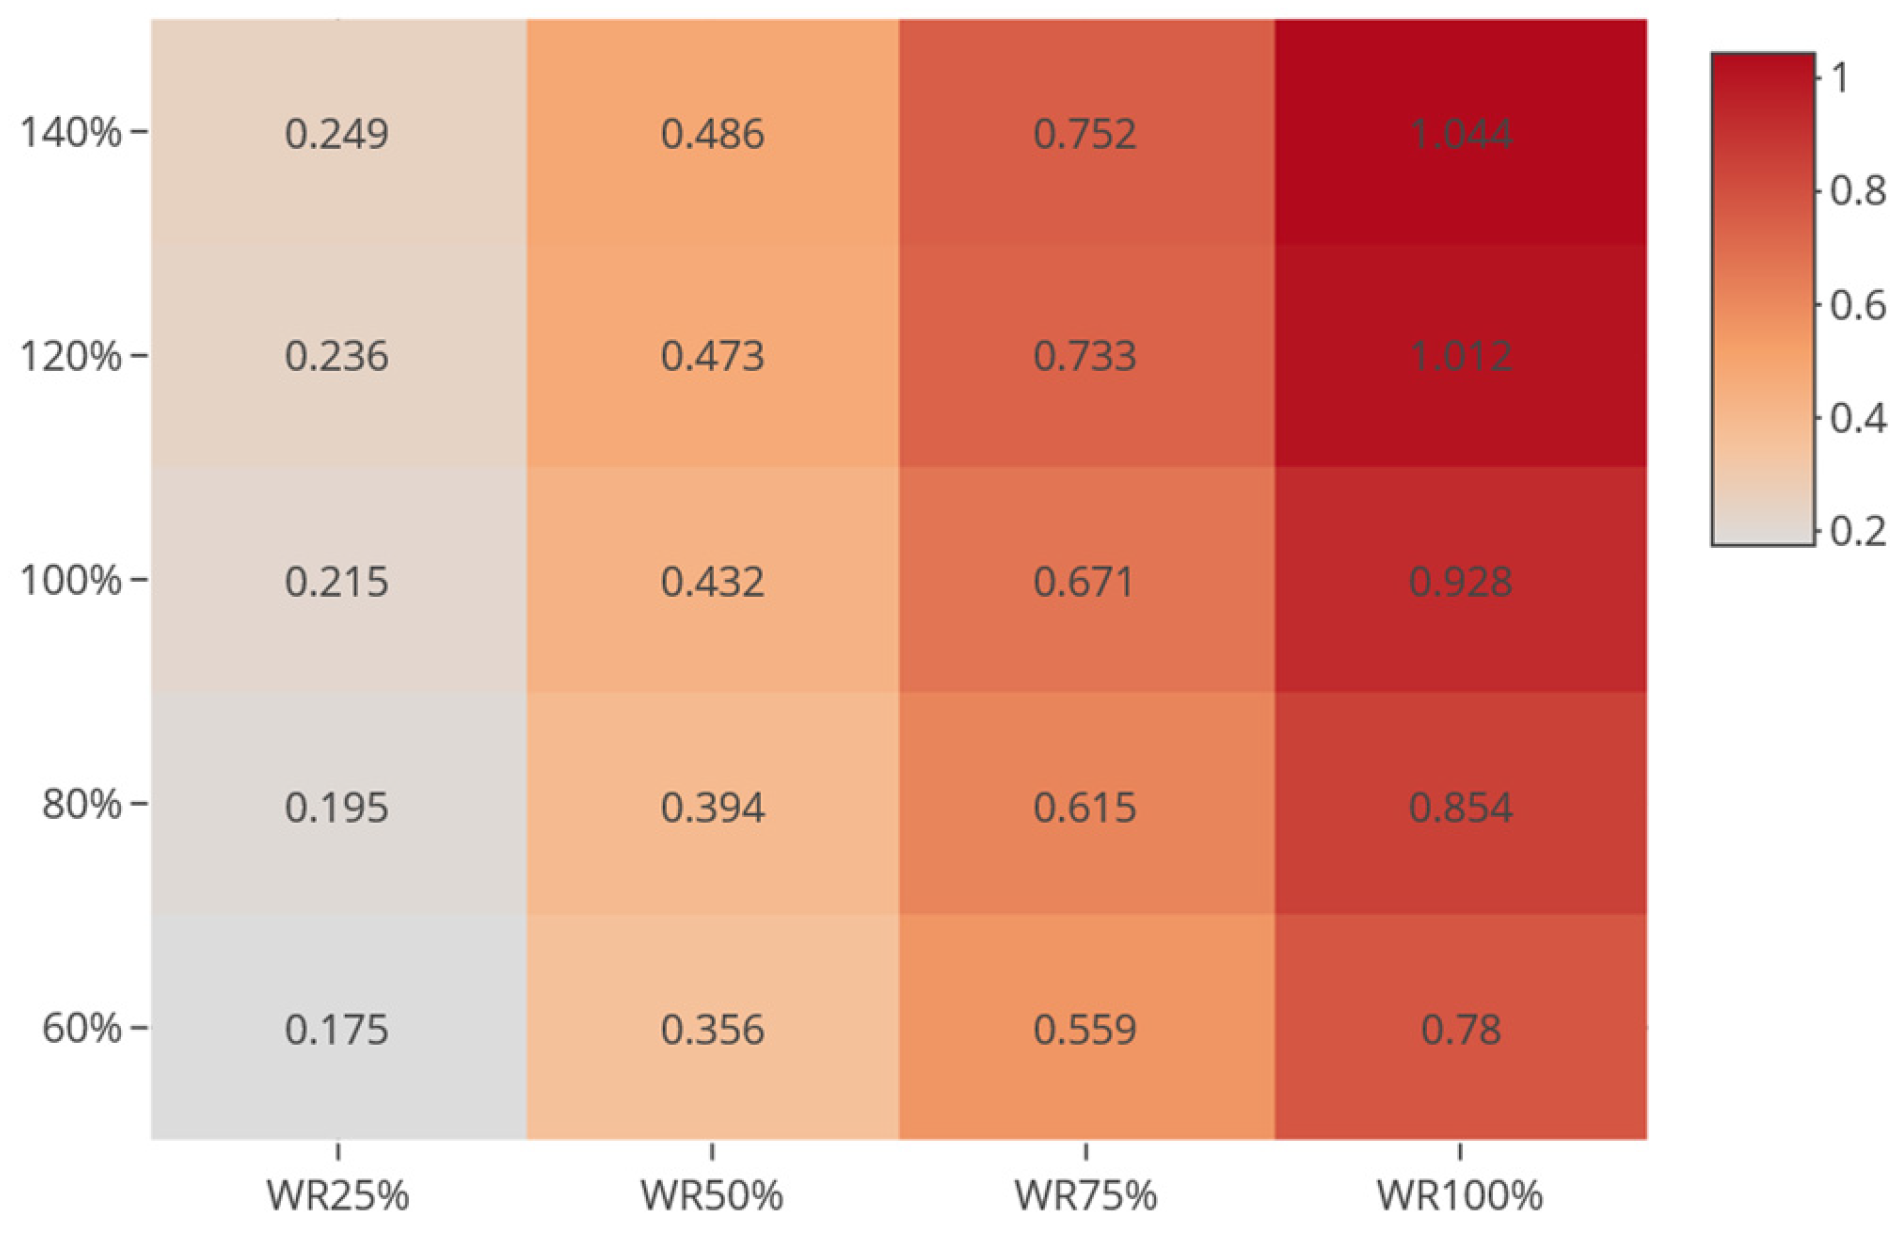
In the case where the total demand for domestic hard coal for energy purposes is substituted with a mix of imported resources, namely imported hard coal, imported natural gas, and imported electricity (WS2), and the price of natural gas is 20% lower than the reference price (reference price of imported natural gas—PLN 0.7/m3), and we include Migration while reducing domestic coal mining by 25% (Reduction Variant WR25%), and if the price of imported coal is equal to the price of domestic coal, GDP decreases by 0.215%. However, if the price of imported coal is 40% lower than the price of domestic coal, GDP decreases by 0.175%, and if the price of imported coal is 20% lower than the price of domestic coal, GDP decreases by 0.195%. On the other hand, if the price of imported coal is 20% higher than the price of domestic coal, GDP decreases by 0.236%, while if it is higher by 40%, it decreases by 0.249%.
In the case of a 100% reduction (Reduction Variant WR100%), and if the price of imported coal is equal to the price of domestic coal, GDP decreases by 0.928%. However, if the price of imported coal is 40% lower than the price of domestic coal, GDP decreases by 0.78%, and if the price of imported coal is 20% lower than the price of domestic coal, GDP decreases by 0.854%. On the other hand, if the price of imported coal is 20% higher than the price of domestic coal, GDP decreases by 1.012%, while if it is higher by 40%, GDP decreases by 1.044%. The above is presented in the chart (Figure 4).
With the increase in the possible reduction in hard coal mining for energy purposes (from WR25% to WR100%), in the case when substitution occurs with a mix of resources, namely imported hard coal, imported natural gas, and imported electricity, and when the price of natural gas is 20% lower than the reference price and the price of imported hard coal is equal to the price of domestic coal, the decline in GDP value ranges from 0.215% to 0.928%. However, when the price of imported coal changes and coal prices increase by 40%, the decline in GDP value ranges from 0.249% to 1.044% (this is the largest decline in GDP value for such an assumed combination of Reduction, Substitution, and Migration Variants). On the other hand, when the prices of imported resources are lower than domestic prices, for example, by 40%, the decline in GDP values ranges from 0.175% to 0.78%

3.2.3. Natural Gas Price Equal to the Reference Price

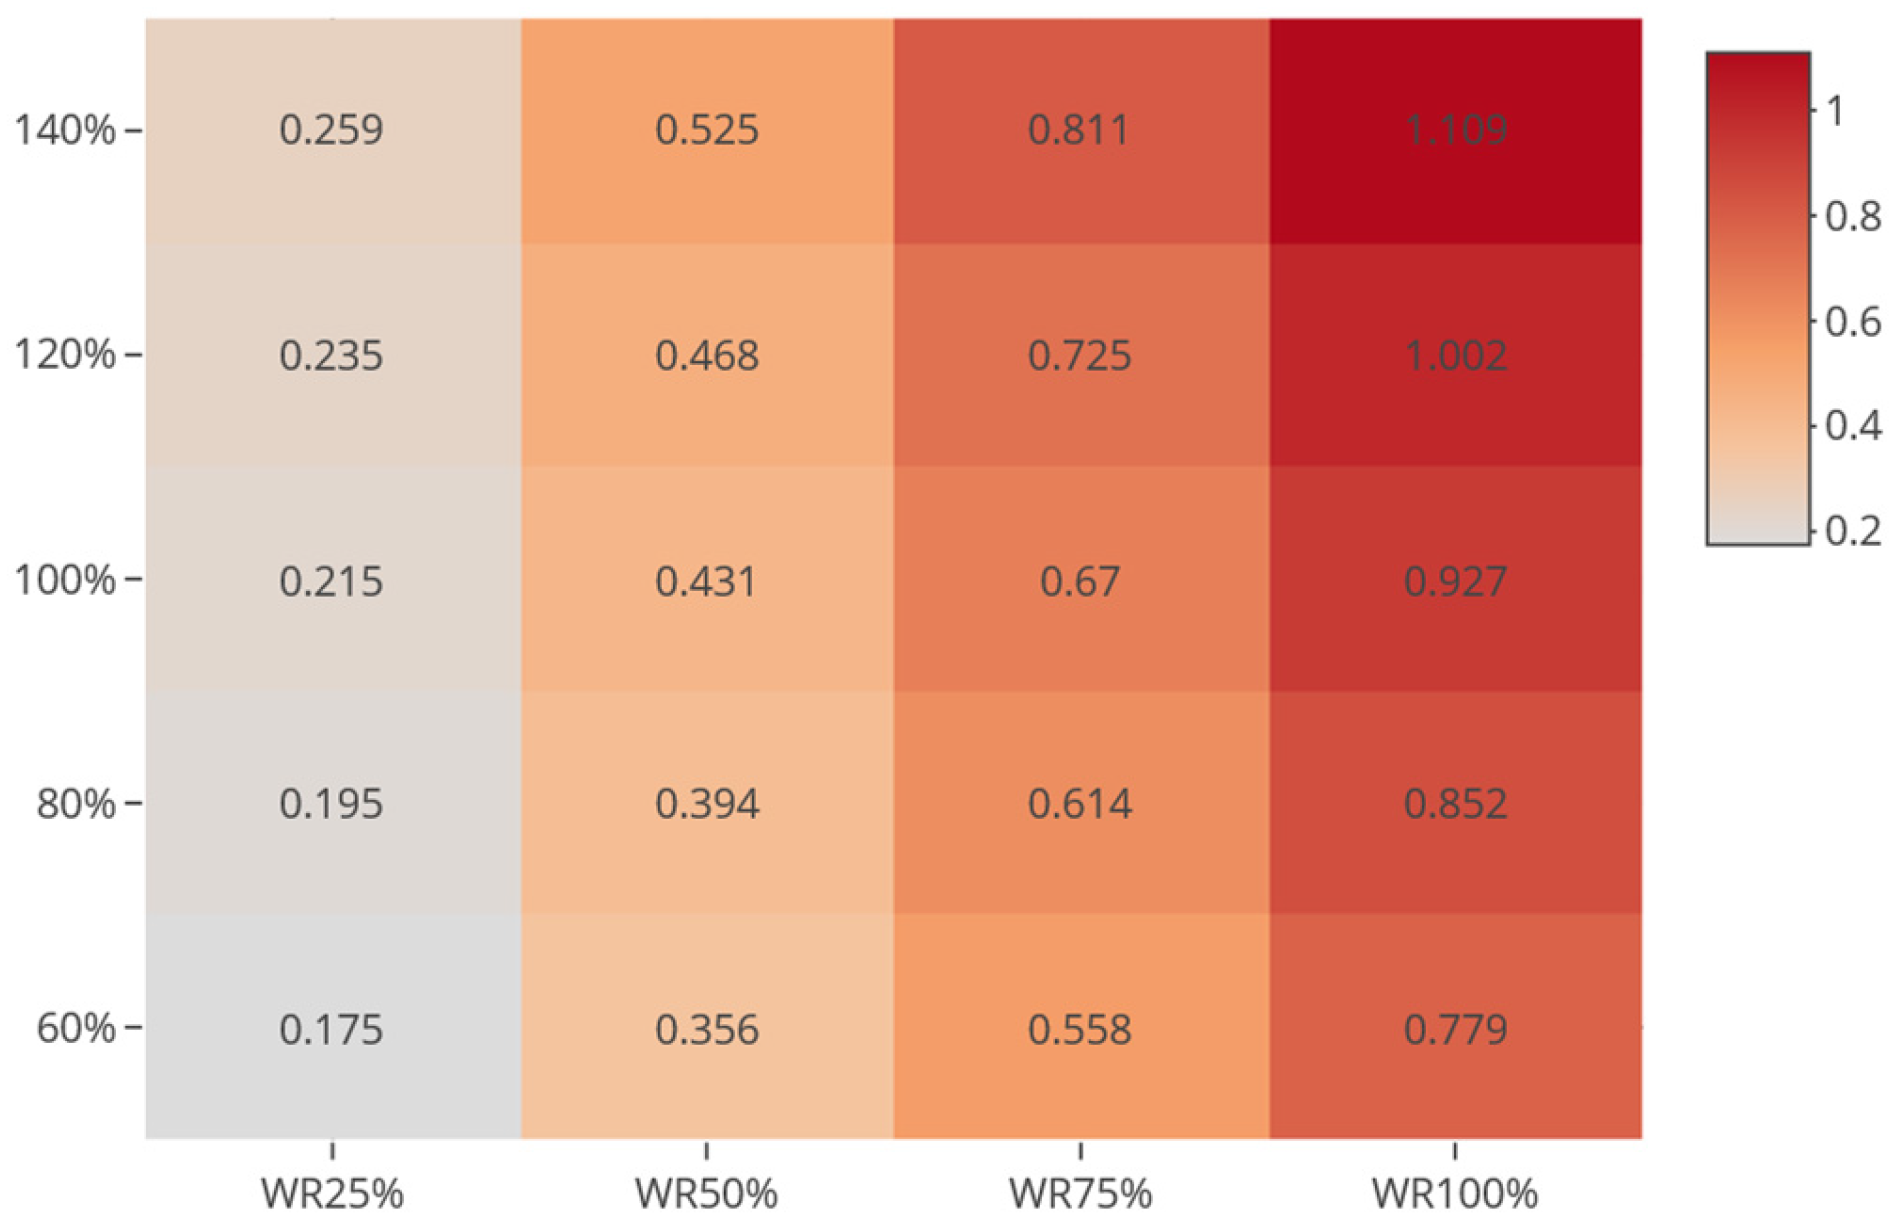
In the case where the total demand for domestic hard coal for energy purposes is substituted with a mix of imported resources, namely imported hard coal, imported natural gas, and imported electricity (WS2), and the price of natural gas is equal to the baseline price (reference price of imported natural gas—PLN 0.7/m3), and we include Migration while reducing domestic coal mining by 25% (Reduction Variant WR25%), and if the price of imported coal is equal to the price of domestic coal, GDP decreases by 0.215%. However, if the price of imported coal is 40% lower than the price of domestic coal, GDP decreases by 0.175%, and if the price of imported coal is 20% lower than the price of domestic coal, GDP decreases by 0.195%. On the other hand, if the price of imported coal is 20% higher than the price of domestic coal, GDP decreases by 0.235%, while if it is 40% higher, GDP decreases by 0.259%.
In the case of a 100% reduction (Reduction Variant WR100%), and if the price of imported coal is equal to the price of domestic coal, GDP decreases by 0.927%. However, if the price of imported coal is 40% lower than the price of domestic coal, GDP decreases by 0.779%, and if the price of imported coal is 20% lower than the price of domestic coal, GDP decreases by 0.852%. On the other hand, if the price of imported coal is 20% higher than the price of domestic coal, GDP decreases by 1.002%, while if it is 40% higher, GDP decreases by 1.109%.
The comprehensive results are presented in the chart (Figure 5) in the form of a heat map.
With the increase in the possible reduction in hard coal mining for energy purposes (from WR25% to WR100%), in the case when substitution occurs with a mix of resources, namely imported hard coal, imported natural gas, and imported electricity, and when the price of natural gas is equal to the reference price and the price of imported hard coal is equal to the price of domestic coal, the decline in GDP value ranges from 0.215% to 0.927%. However, when the price of imported coal changes and coal prices increase by 40%, the decline in GDP value ranges from 0.259% to 1.109% (this is the largest decline in GDP value for such an assumed combination of Reduction, Substitution, and Migration Variants). On the other hand, when the prices of imported resources are lower than domestic prices, for example, by 40%, the decline in GDP values ranges from 0.175% to 0.779%.

3.2.4. Natural Gas Price 20% Higher

In the case where the total demand for domestic hard coal for energy purposes is substituted with a mix of imported resources, namely imported hard coal, imported natural gas, and imported electricity (WS2), and the price of natural gas is 20% higher than the reference price (reference price of imported natural gas—PLN 0.7/m3), and we include Migration while reducing domestic coal mining by 25% (Reduction Variant WR25%), and if the price of imported coal is equal to the price of domestic coal, GDP decreases by 0.215%. However, if the price of imported coal is 40% lower than the price of domestic coal, GDP decreases by 0.175%, and if the price of imported coal is 20% lower than the price of domestic coal, GDP decreases by 0.195%. On the other hand, if the price of imported coal is 20% higher than the price of domestic coal, GDP decreases by 0.235%, while if it is higher by 40%, GDP decreases by 0.254%.
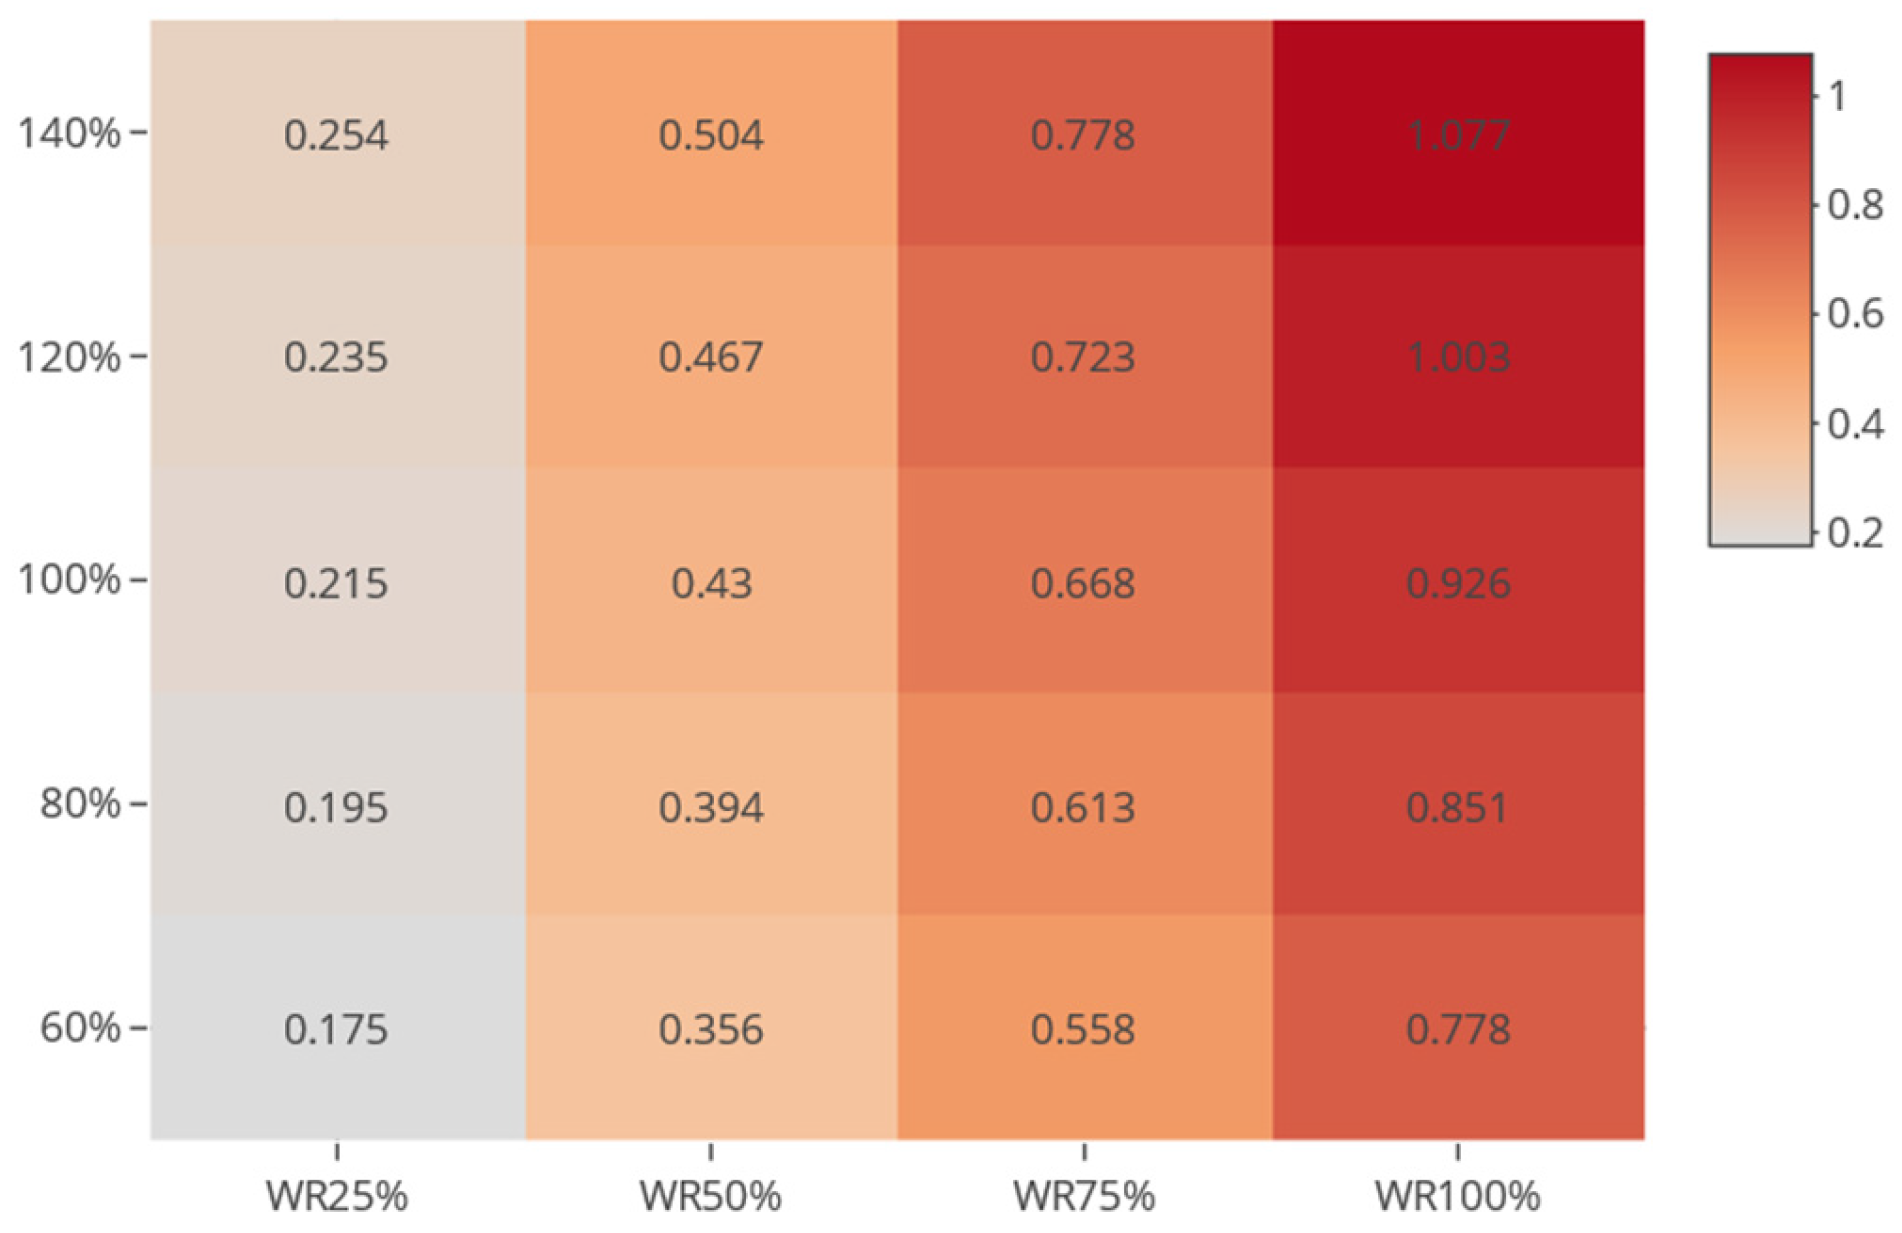
In the case of a 100% reduction (Reduction Variant WR100%), and if the price of imported coal is equal to the price of domestic coal, GDP decreases by 0.926%. However, if the price of imported coal is 40% lower than the price of domestic coal, GDP decreases by 0.778%, and if the price of imported coal is 20% lower than the price of domestic coal, GDP decreases by 0.851%. On the other hand, if the price of imported coal is 20% higher than the price of domestic coal, GDP decreases by 1.003%, while if it is 40% higher, GDP decreases by 1.077%.
The percentage decrease in GDP value as a function of Reduction Variants of coal mining and the percentage-based price of imported coal; taking into account Substitution Variant WS2, a 20% increase in the price of natural gas, and the Migration Variant, is presented in the chart (Figure 6).
With the increase in the possible reduction in hard coal mining for energy purposes (from WR25% to WR100%), in the case when substitution occurs with a mix of resources, namely imported hard coal, imported natural gas, and imported electricity, and when the price of natural gas is 20% higher than the reference price and the price of imported hard coal is equal to the price of domestic coal, the decline in GDP value ranges from 0.215% to 0.926%. However, when the price of imported coal changes and coal prices increase by 40%, the decline in GDP value ranges from 0.254% to 1.077% (this is the largest decline in GDP value for such an assumed combination of Reduction, Substitution, and Migration Variants). On the other hand, when the prices of imported resources are lower than domestic prices, for example, by 40%, the decline in GDP values ranges from 0.175% to 0.778%.

3.2.5. Natural Gas Price 40% Higher

In the case where the total demand for domestic hard coal for energy purposes is substituted with a mix of imported resources, namely imported hard coal, imported natural gas, and imported electricity (WS2), and the price of natural gas is 40% higher than the reference price (reference price of imported natural gas—PLN 0.7/m3), and we include Migration while reducing domestic coal mining by 25% (Reduction Variant WR25%), and if the price of imported coal is equal to the price of domestic coal, GDP decreases by 0.215%. However, if the price of imported coal is 40% lower than the price of domestic coal, GDP decreases by 0.175%, and if the price of imported coal is 20% lower than the price of domestic coal, GDP decreases by 0.195%. On the other hand, if the price of imported coal is 20% higher than the price of domestic coal, GDP decreases by 0.235%, while if it is 40% higher, GDP decreases by 0.254%.
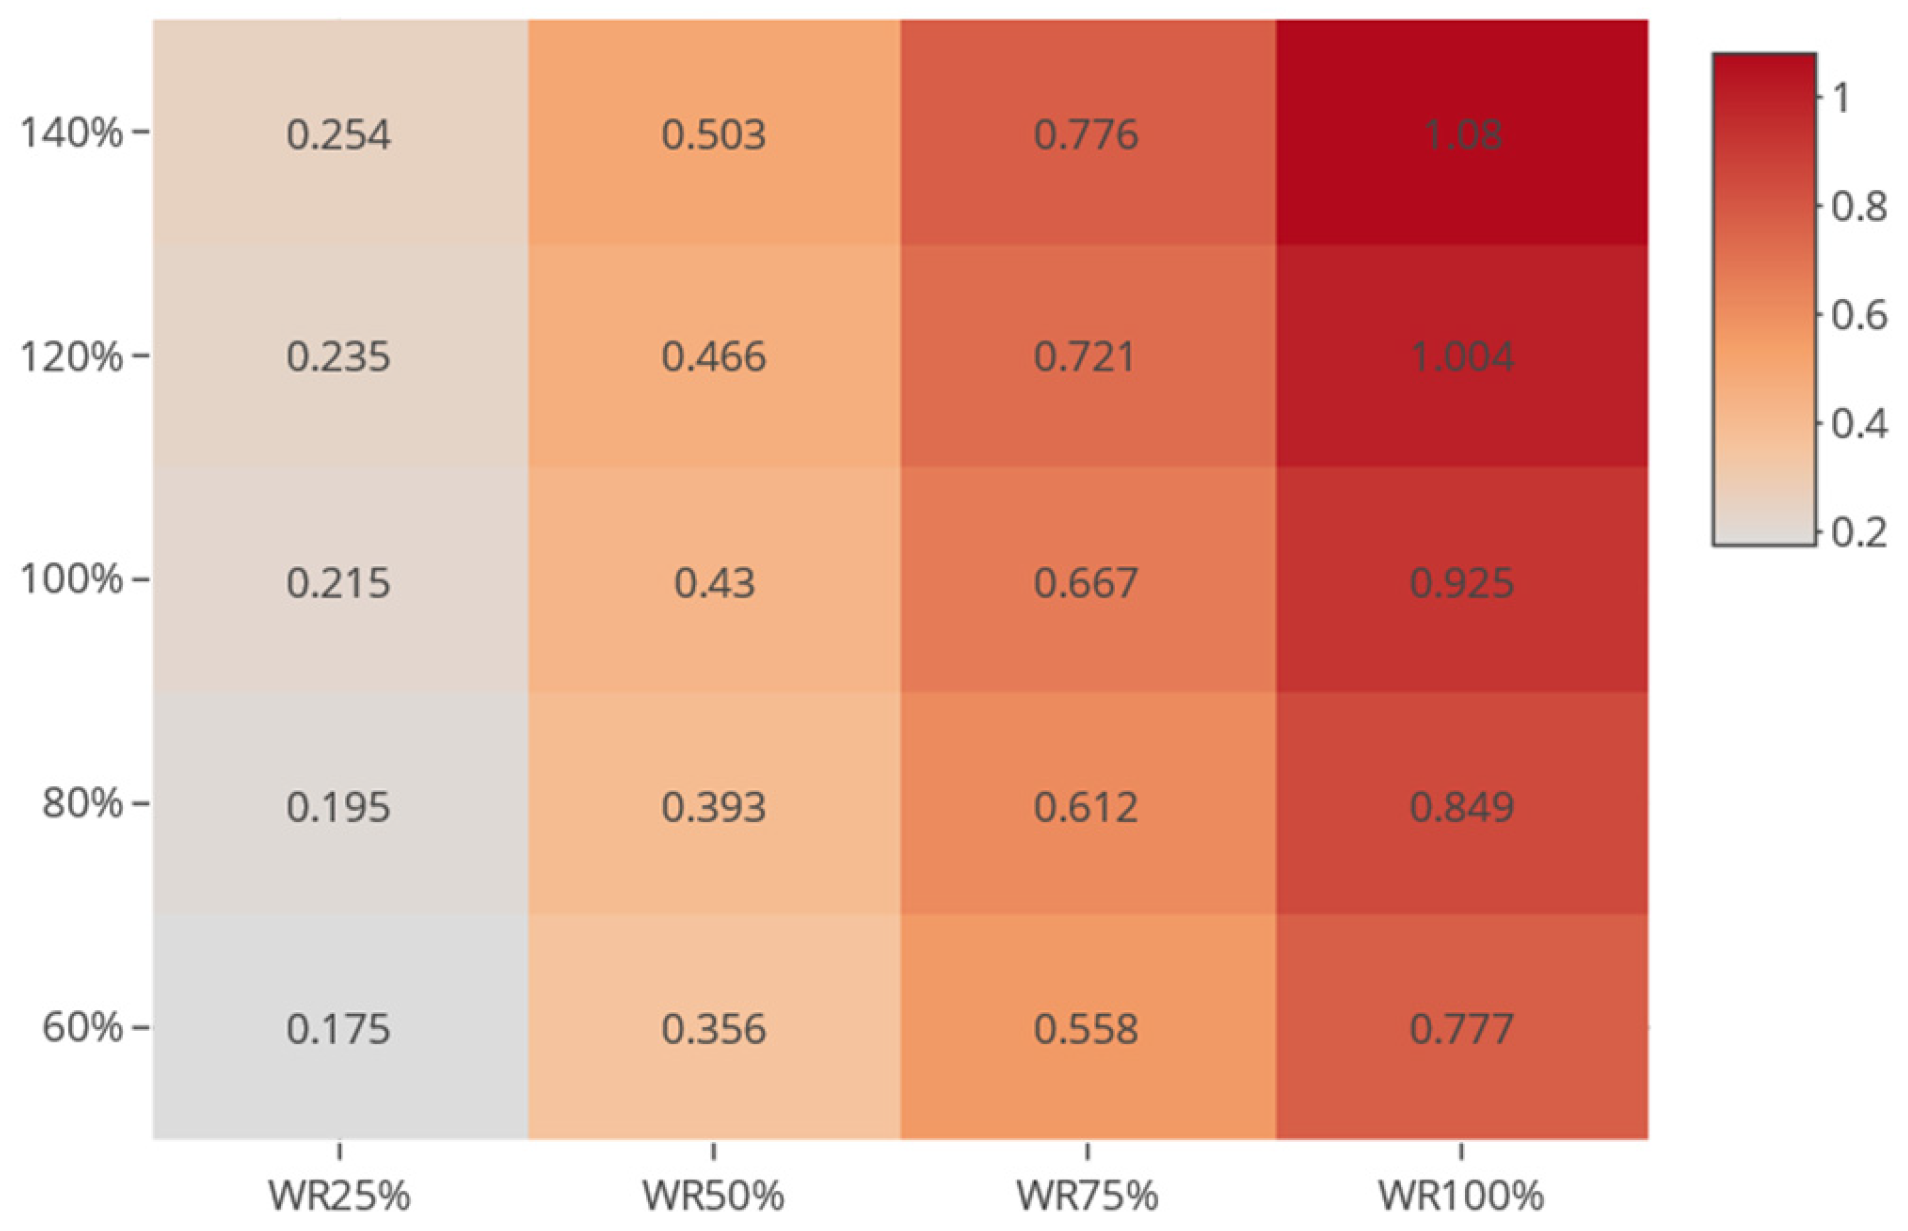
In the case of a 100% reduction (Reduction Variant WR100%), and if the price of imported coal is equal to the price of domestic coal, GDP decreases by 0.925%. However, if the price of imported coal is 40% lower than the price of domestic coal, GDP decreases by 0.777%, and if the price of imported coal is 20% lower than the price of domestic coal, GDP decreases by 0.849%. On the other hand, if the price of imported coal is 20% higher than the price of domestic coal, GDP decreases by 1.004%, while if it is 40% higher, GDP decreases by 1.08%.
The percentage decrease in GDP value as a function of Reduction Variants of coal mining and the percentage-based price of imported coal; taking into account Substitution Variant WS2, a 40% increase in the price of natural gas, and the Migration Variant, is presented in the chart (Figure 7).
With the increase in the level of reduction in hard coal mining for energy purposes (from WR25% to WR100%), and in the case when substitution occurs with imported hard coal, imported natural gas, and imported electricity, and when the price of natural gas is 40% higher than the reference price and the price of domestic hard coal is equal to the price of imported coal, the decline in GDP value ranges from 0.215% to 0.925%. However, when the price of imported coal changes and coal prices increase by 40%, the decline in GDP value ranges from 0.254% to 1.08% (this is the largest decline in GDP value for such a combination of Reduction, Substitution, and Migration Variants). On the other hand, when the prices of imported resources are lower than domestic prices, for example, by 40%, the decline in GDP values ranges from 0.175% to 0.777%.
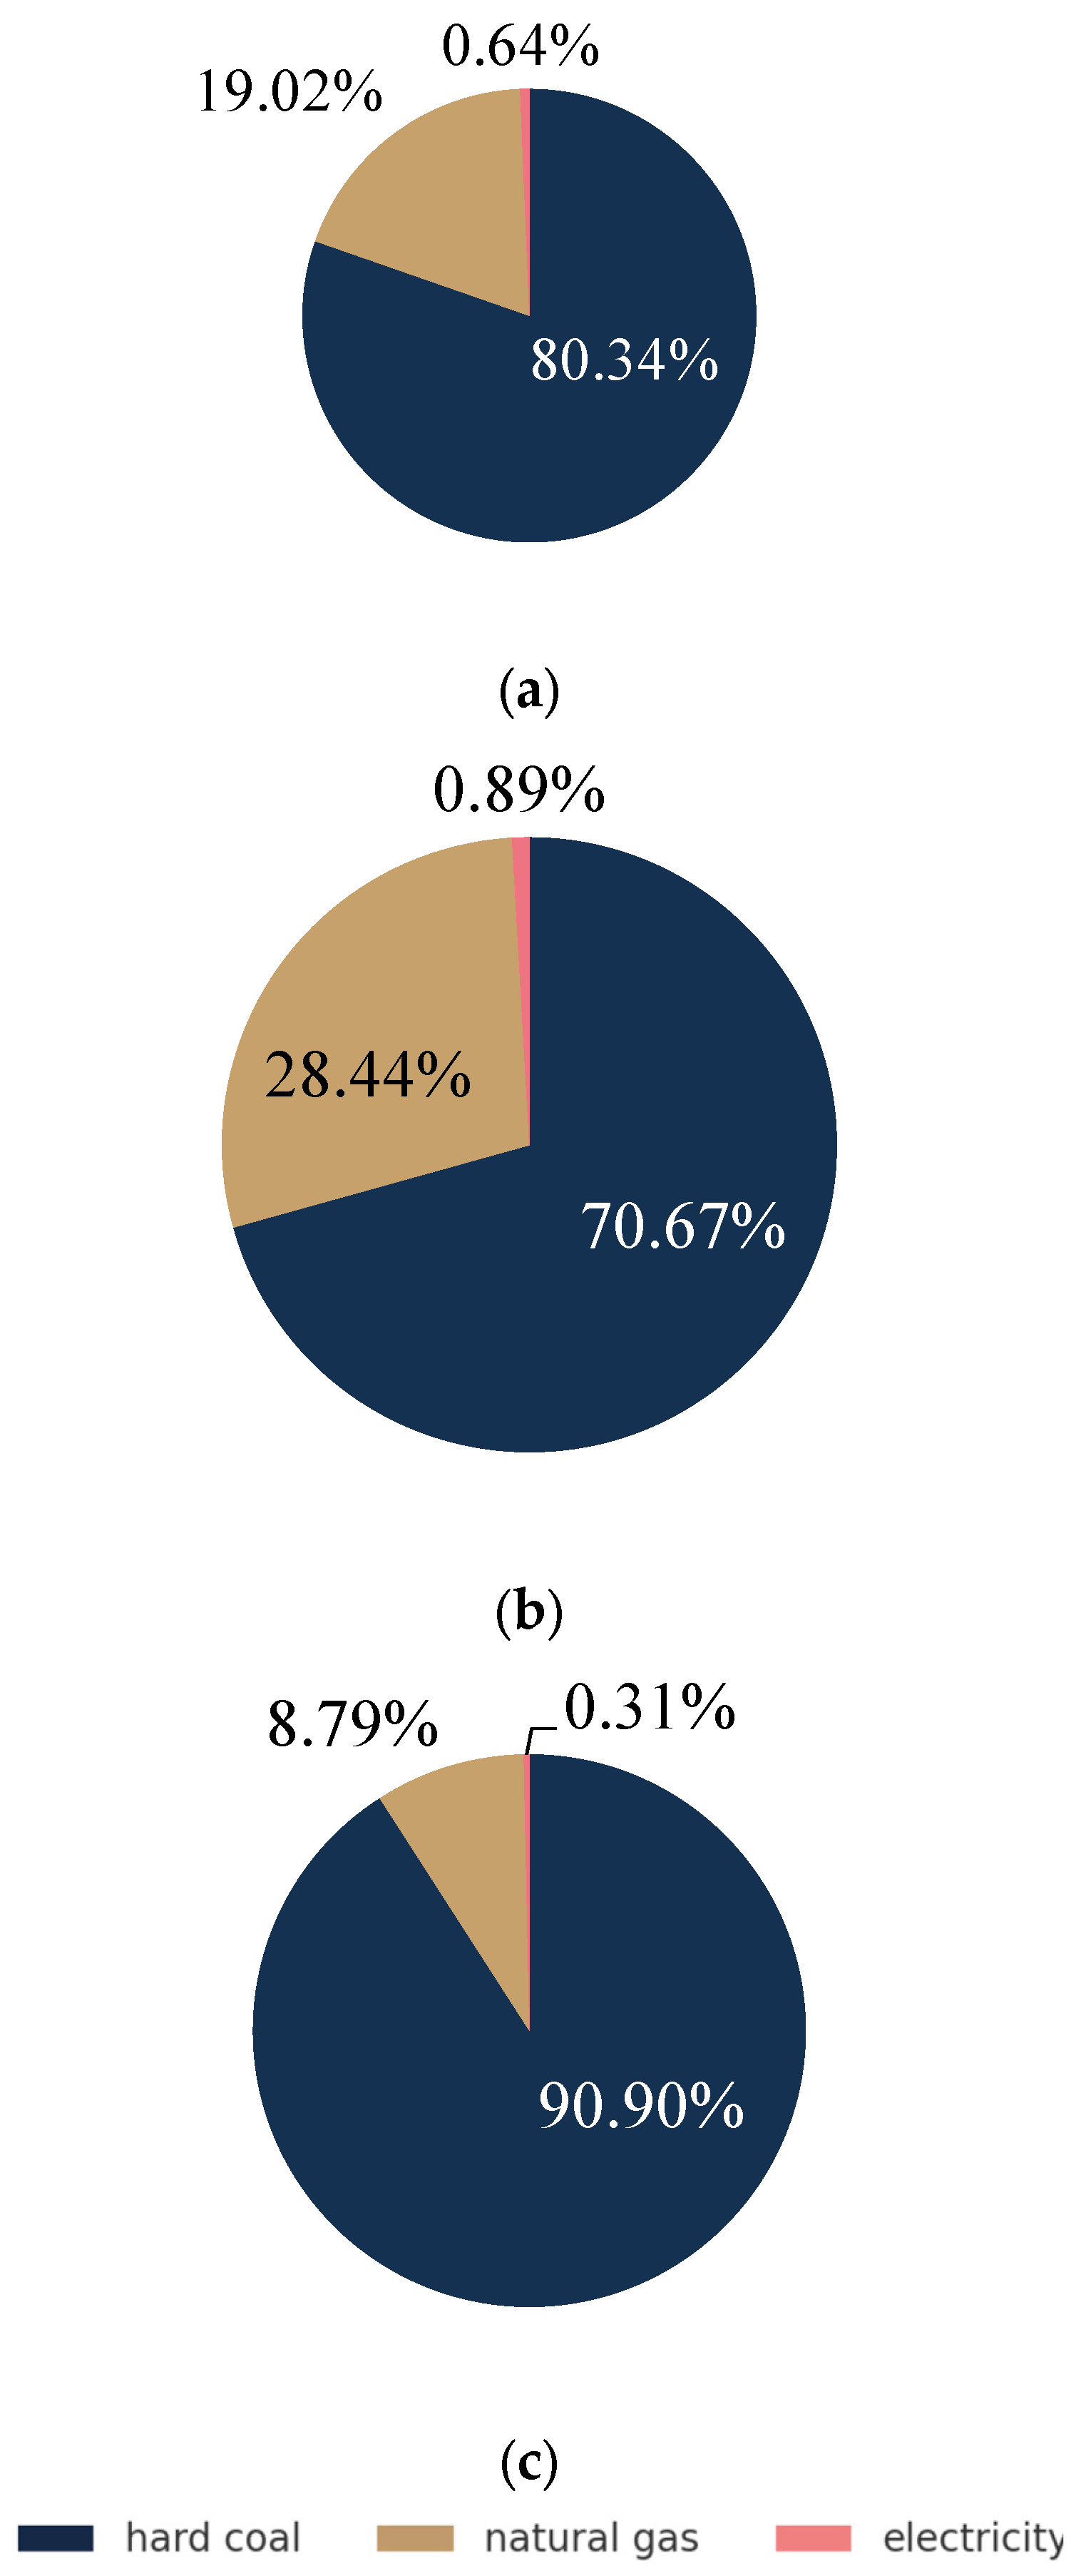
In the case where the total demand for domestic hard coal for energy purposes is substituted with a mix of imported resources, namely imported hard coal, imported natural gas, and imported electricity (WS2), and the price of natural gas is 40% higher than the reference price, and we include Migration while completely ceasing domestic hard coal mining (WR100%), and the price of imported hard coal equals the price of domestic hard coal, the result of the Substitution model indicates the structure of resource imports presented in the chart (Figure 8a). Significant is the import of hard coal, along with more than 19% of natural gas imports, with a small share of imported electricity.
In the case where the total demand for domestic hard coal for energy purposes is substituted with a mix of imported resources, namely imported hard coal, imported natural gas, and imported electricity (WS2), and the price of natural gas is 40% higher than the reference price, and we include Migration while completely ceasing domestic hard coal mining (WR100%), and the price of imported hard coal is 40% higher than the reference price of domestic hard coal, the result of the Substitution model indicates the structure of resource imports presented in the chart (Figure 8b). The import of natural gas is visible at almost 30%, and imported hard coal accounts for over 70%, while electricity imports remain at a low level.
In the case where the total demand for domestic hard coal for energy purposes is substituted with a mix of imported resources, namely imported hard coal, imported natural gas, and imported electricity (WS2), and the price of natural gas is 40% higher than the reference price, and we include Migration while completely ceasing domestic hard coal mining (WR100%), and the price of imported hard coal is 40% lower than the reference price of domestic hard coal, the result of the Substitution model indicates the structure of resource imports presented in the chart (Figure 8c). In this case, almost the entire demand is covered by imported hard coal.

4. Conclusions

The main objective of this study was to indicate the role and scale of the hard coal mining sector’s contribution to GDP while also exploring the consequences of its gradual decline for the structure of the national energy mix in Poland. The results clearly demonstrate that the reduction in domestic hard coal mining, under all substitution scenarios considered, leads to a decline in GDP. The scale of this decline varies depending on the depth of reduction and relative prices of imported substitutes, but the direction is consistently negative. This confirms the structural importance of coal mining for the Polish economy and the risks associated with its rapid phase-out.
The accelerated phase-out of hard coal mining negatively affects Poland’s GDP, as confirmed by all analyzed reduction scenarios. Even moderate reductions lead to a GDP decline of around 0.18–0.25%, while full sector closure results in losses of 0.8–1.1%. This reflects the structural importance of the coal industry for the national economy and its role in maintaining the balance of the power system. Coal remains essential for ensuring the continuity of the national electricity system, at least until the commissioning of a nuclear power plant, which would realistically occur around 2040. Given Poland’s limited domestic gas resources and supply risks, a full transition to natural gas is not justified from an energy security perspective. The KPEiK (National Energy and Climate Plan) outlines the expected transformation of the national energy mix and its economic effects, indicating that a well-designed energy transition—supported by an adequate investment program—can mitigate the negative economic effects of coal sector closure and even generate a positive impact on GDP through new industrial development. The authors emphasize the need to coordinate restructuring processes with the development of low-emission technologies, workforce migration, and the use of human and infrastructural potential from closed mines and power plants—for example, by repurposing them for the production of components for new low-emission power units. It is recommended that the energy transition be carried out at a pace aligned with the country’s economic and infrastructural capacities to minimize GDP losses and maintain energy security until new-generation sources are fully implemented.

Author Contributions

M.P.: conceptualization, methodology, formal analysis, writing (original draft), and visualization. S.T.: supervision, validation, and writing—review and editing. P.O.: data curation, software, investigation, and project administration. All authors have read and agreed to the published version of the manuscript.

Funding

This research received no external funding.

Data Availability Statement

Data are contained within the article.

Conflicts of Interest

The authors declare no conflicts of interest.

References

  1. Social Agreement—Umowa Społeczna—Umowa Społeczna Dotycząca Transformacji Sektora Górnictwa Węgla Kamiennego Oraz Wybranych Procesów Transformacji Województwa Śląskiego. 2021. Available online: https://www.gov.pl/web/aktywa-panstwowe/umowa-spoleczna-dla-gornictwa-podpisana (accessed on 19 February 2025).
  2. Pepłowska, M.; Olczak, P. Review of Research on the Impact of Changes Resulting from the Hard Coal Mining Sector in Poland on the GDP Value. Energies 2024, 17, 1477. [Google Scholar] [CrossRef]
  3. Fankhauser, S.; Jotzo, F. Economic growth and development with low-carbon energy. Wiley Interdiscip. Rev. Clim. Change 2018, 9, e495. [Google Scholar] [CrossRef]
  4. Wang, Q.; Li, X.; Li, R. The impact of political, financial, and economic risks on energy transition: The role of natural resource rents. Humanit. Soc. Sci. Commun. 2025, 12, 75. [Google Scholar] [CrossRef]
  5. Esposito, E.; Abramson, S. The European Coal Curse. J. Econ. Growth 2021, 26, 77–112. [Google Scholar] [CrossRef]
  6. Afkarina, K.; Wardana, S.; Damayanti, P. Coal mining sector contribution to environmental conditions and human development index in east kalimantan province. J. Environ. Sci. Sustain. Dev. 2019, 2, 192–207. [Google Scholar] [CrossRef]
  7. Pepłowska, M. The effect of coal mine closures on worker migration in Poland: An input-output analysis. Gospod. Surowcami Miner. 2024, 40, 147–159. [Google Scholar] [CrossRef]
  8. Hendryx, M.; Higginbotham, N.; Ewald, B.; Connor, L. Air quality in association with rural coal mining and combustion in new south wales australia. J. Rural. Health 2019, 35, 518–527. [Google Scholar] [CrossRef] [PubMed]
  9. Roman, J.; Ceran, B.; Wróblewski, R. Dobór mocy układu zgazowarka odpadów–silnik gazowy w hybrydowej instalacji OZE. Rynek Energii 2025, 179, 47–55. [Google Scholar]
  10. Polski, C.; Polski, T.; Roman, J.; Wróblewski, R.; Bartoszewicz, J.; Ceran, B. A novel concept to improve the flexibility of steam power plants using an electric feedwater heater. Appl. Therm. Eng. 2024, 236, 121661. [Google Scholar] [CrossRef]
  11. Kasińska, N.; Mielcarek, A.; Sierchuła, J.; Szczerbowski, R.; Ceran, B. Technical and Economic Comparative Analysis of Nuclear Power Plants: AP1000 and SMR. Energies 2025, 18, 4749. [Google Scholar] [CrossRef]
  12. García-Casals, X.; Ferroukhi, R.; Parajuli, B. Global Energy Transformation: A Roadmap to 2050; International Renewable Energy Agency (IRENA): Abu Dhabi, United Arab Emirates, 2019. [Google Scholar]
  13. Patrizio, P.; Pratama, Y.W.; Mac Dowell, N. Socially Equitable Energy System Transitions. Joule 2020, 4, 1609–1625. [Google Scholar] [CrossRef]
  14. Bohlmann, H.R.; Bohlmann, J.A.; Chitiga-Mabugu, M.; Inglesi-Lotz, R. Just Energy Transition of South Africa in a Post-COVID Era. Sustainability 2023, 15, 10854. [Google Scholar] [CrossRef]
  15. Pollin, R.; Callaci, B. The just transition needs a hard hat. New Left Rev. 2023, 139, 69–94. [Google Scholar]
  16. Klein, L.R. Wykłady z Ekonometrii; Państwowe Wydawnictwo Ekonomiczne: Warsaw, Poland, 1982. [Google Scholar]
  17. Plich, M. Budowa i Zastosowanie Wielosektorowych Modeli Ekonomiczno-Ekologicznych; Wydawnictwo Uniwersytetu Łódzkiego: Łódź, Poland, 2002. [Google Scholar]
  18. Lach, Ł. Tracing Key Sectors and Important Input-Output Coefficients: Methods and Applications Preface; Wydawnictwo CH Beck: Warsaw, Poland, 2020. [Google Scholar]
  19. Clark, D.L. Planning and the real origins of input-output analysis. J. Contemp. Asia 1984, 14, 408–429. [Google Scholar] [CrossRef]
  20. Schachter, G. Francois Quesnay: Interpreters and Critics Revisited. Am. J. Econ. Sociol. 1991, 50, 313–322. [Google Scholar] [CrossRef]
  21. Ormazabal, K. Quesnay and Leontief on Capital and Income; No. 1134-8984; Departamento de Economía Aplicada III (Econometría y Estadística), Universidad del País Vasco: Santsoena, Spain, 2002. [Google Scholar]
  22. Steenge, A.E.; Van Den Berg, R. Transcribing the Tableau conomique: Input-output analysis à la Quesnay. J. Hist. Econ. Thought 2007, 29, 331–358. [Google Scholar] [CrossRef]
  23. Akhabbar, A.; Lallement, J. Wassily Leontief and Léon Walras: The Production as a Circular Flow. MPRA Paper No. 30207. 2010. Available online: https://mpra.ub.uni-muenchen.de/30207/ (accessed on 9 September 2025).
  24. Miernyk, W.H. The Elements of Input-Output Analysis; Web Book of Regional Science, Ed.; Regional Research Institute, West Virginia University: Morgantown, WV, USA, 2020. [Google Scholar]
  25. Kopeć, S.; Lach, Ł.; Spirydowicz, A. Wpływ rozbudowy infrastruktury fotowoltaicznej na rozwój gospodarczy w Polsce—Prognoza do 2040 r. Energetyka Rozproszona 2022, 7, 29–53. [Google Scholar] [CrossRef]
  26. Thlon, M. Wykorzystanie Modelu Leontiefa Jako Narzędzia Analizy Potencjału Rozwojowego Regionalnych Specjalizacji, Rzeszów. 2019. Available online: https://www.google.com/url?sa=t&source=web&rct=j&opi=89978449&url=https://min-pan.krakow.pl/dzialalnosc-naukowa/wp-content/uploads/sites/7/2024/06/Wplyw-gornictwa-weglowego-na-ksztaltowanie-sie-PKB-z-wykorzystaniem-przeplywow-miedzygaleziowych.pdf&ved=2ahUKEwiz2rLs-eaQAxXhafUHHZloBScQFnoECBoQAQ&usg=AOvVaw2RHcZc90lS4DpL-PXMexIV (accessed on 9 September 2025).
  27. Czechowski, T. Wstęp Matematyczny do Analizy Przepływów Międzygałęziowych; PWG: Warsaw, Poland, 1958. [Google Scholar]
  28. Kudrycka, I.; Górska, G. Wykorzystanie Przepływów Międzygałęziowych do Analizy Zmian w Strukturze Gospodarki Polski; Główny Urząd Statystyczny, Zakład Badań Statystyczno-Ekonomicznych Wykorzystanie: Warsaw, Poland, 1983. [Google Scholar]
  29. Tomaszewicz, Ł. Metody Analizy Input-Output Warszawa; Państwowe Wydawnictwo Ekonomiczne: Warsaw, Poland, 1994. [Google Scholar]
  30. Mućk, J. Przepływy Międzygałęziowe. Model Leontiefa; Szkoła Główna Handlowa w Warszawie: Warsaw, Poland, 2016. [Google Scholar]
  31. Kacprzak, D. Input-Output Model Based on Ordered Fuzzy Numbers. Theory and Applications of Ordered Fuzzy Numbers: A Tribute to Professor Witold Kosiński. 2017. Available online: http://www.springer.com/series/2941%0Ahttp://link.springer.com/10.1007/978-3-319-59614-3 (accessed on 26 November 2023).
  32. Lach, Ł.; Marcin, S.; Kusa, R.; Duda, J. Forecasting the economic impact of a vacuum tube high-speed transport system in Poland: An input-output approach. Manag. Econ. 2021, 22, 113–142. [Google Scholar] [CrossRef]
  33. GUS 2019—Główny Urząd Statystyczny. Bilans Przepływów Międzygałęziowych w Bieżących Cenach Bazowych w 2015 r; Główny Urząd Statystyczny: Warsaw, Poland, 2019. [Google Scholar]
  34. Kryzia, D. Analiza struktury wytwarzania energii elektrycznej z wykorzystaniem metod analizy portfelowej. Polityka Energetyczna—Energy Policy J. 2010, 13, 293–310. [Google Scholar]
  35. Kryzia, D.; Kaliski, M. Znaczenie technologii wytwarzania energii elektrycznej bazujących na gazie ziemnym dla przedsiębiorstwa energetycznego w kontekście dywersyfikacji jego struktury produkcyjnej. AGH Drill. Oil Gas 2012, 29, 241–251. [Google Scholar]
  36. Kryzia, D. Wybór Technologii Wytwarzania Energii Elektrycznej w Warunkach Ryzyka; Wydawnictwo Instytutu Gospodarki Surowcami Mineralnymi i Energią PAN: Kraków, Poland, 2015. [Google Scholar]
  37. Trzaskalik, T. Matematyka w Ekonomii; Prace Naukowe AE w Katowicach: Katowice, Poland, 2004. [Google Scholar]
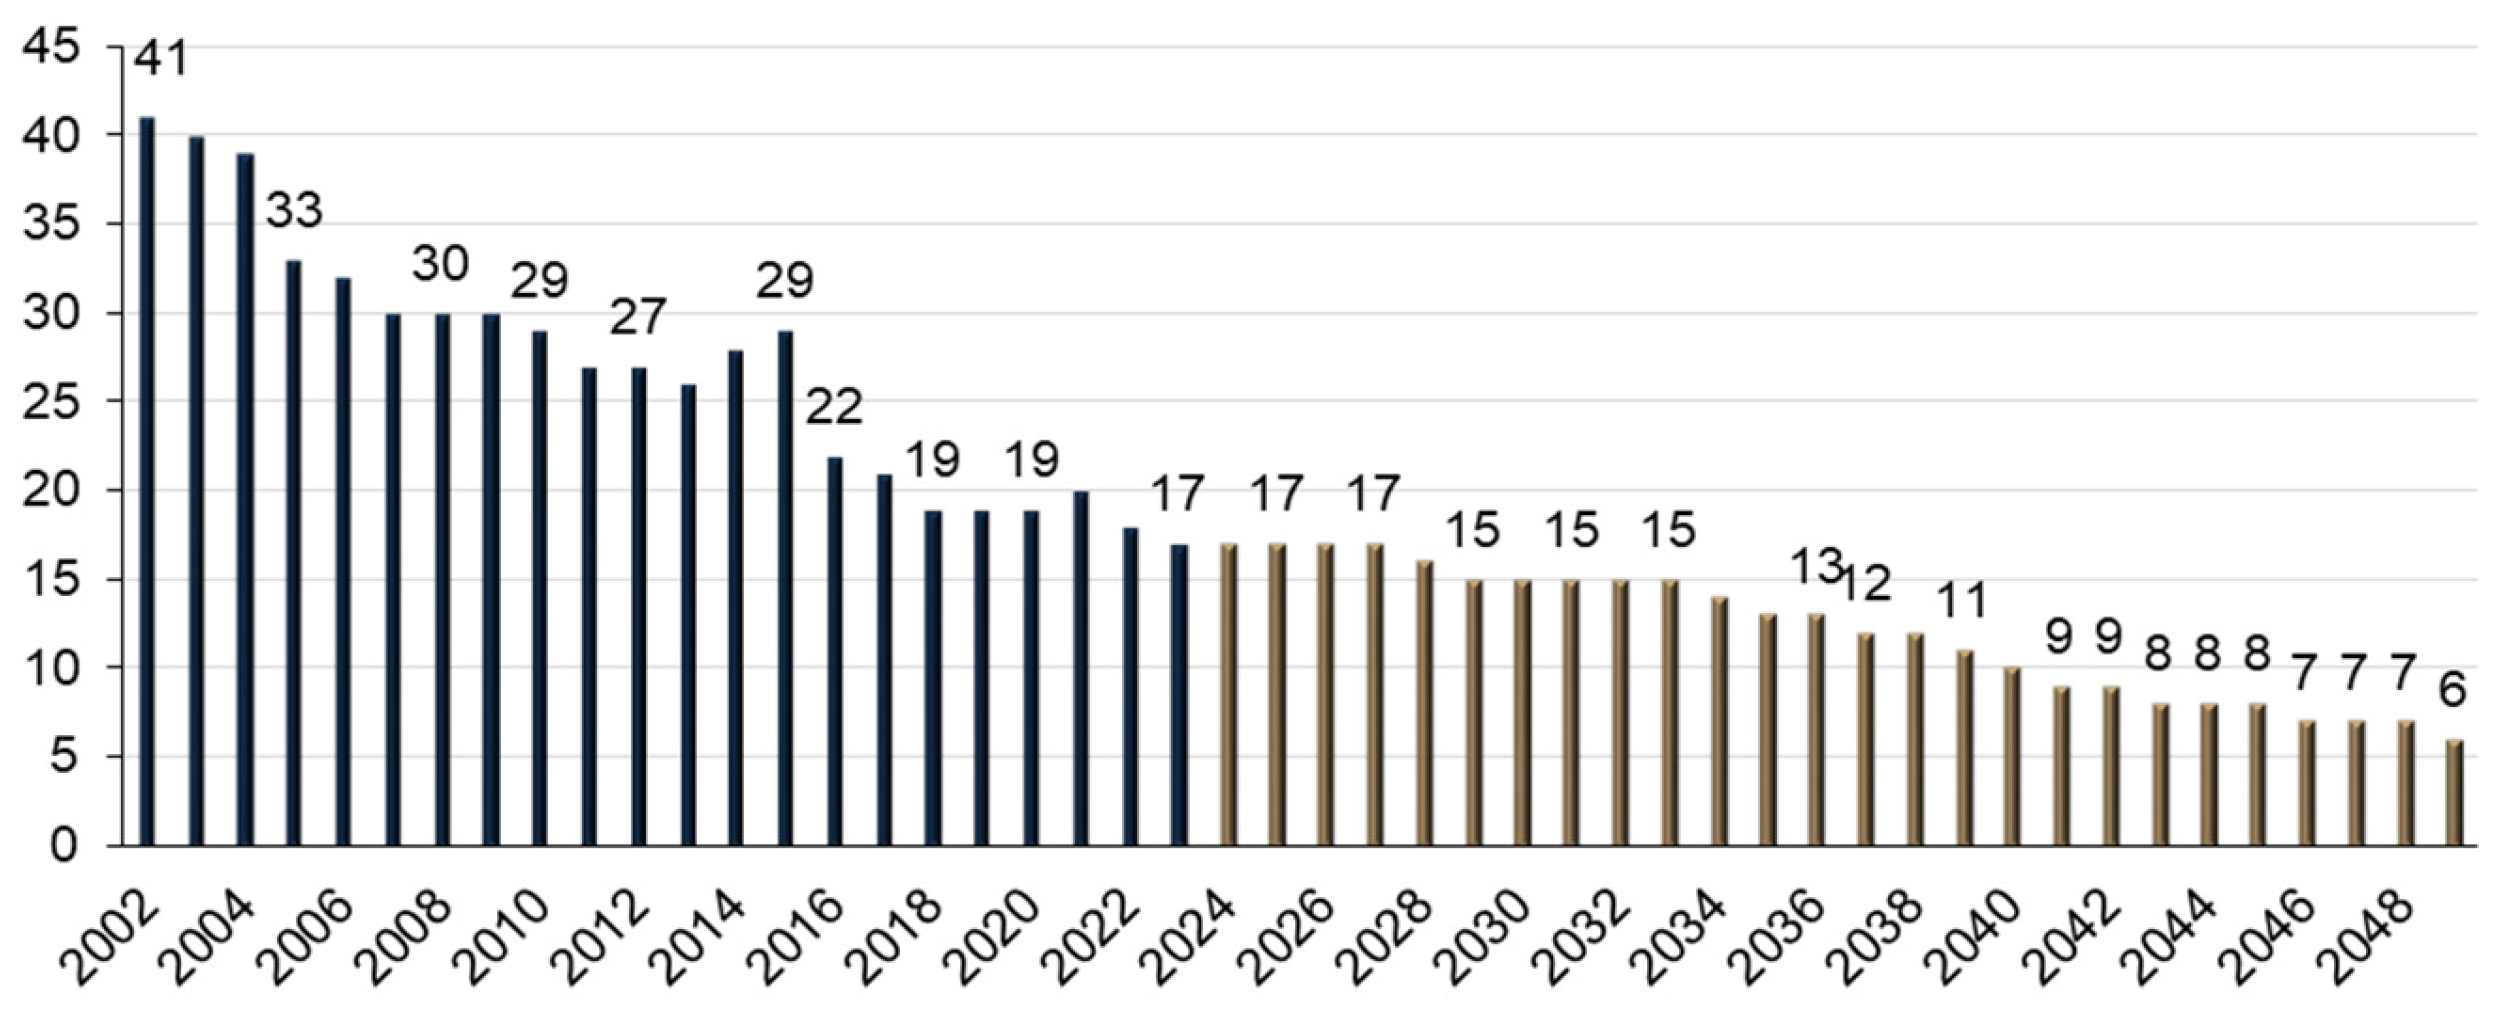
Figure 1. The number of mines in line with the forecast for the transformation schedule of the coal mining sector in Poland. Source: The authors’ own elaboration based on [1].
Energies 18 06021 g001
Figure 2. Percentage decrease in GDP value as a function of Reduction Variants of coal mining and the percentage-based price of imported coal; taking into account Substitution Variant WS2, a 40% decrease in the price of natural gas, and the Migration Variant, based on 2015 data. Source: Author’s own elaboration.
Energies 18 06021 g002
Figure 3. Percentage share of replacing energy from domestic hard coal for Reduction Variant WR100%, Migration Variant, and Substitution Variant WS2: (a). 40% decrease in the price of natural gas, imported coal price equal to the reference price (cwr); (b). 40% decrease in the price of natural gas, imported coal price 40% higher than the reference price; (c). 40% decrease in the price of natural gas, imported coal price 40% lower than the reference price. Source: Author’s own elaboration.
Energies 18 06021 g003
Figure 4. Percentage decrease in GDP value as a function of Reduction Variants of coal mining and the percentage-based price of imported coal; taking into account Substitution Variant WS2, a 20% decrease in the price of natural gas, and the Migration Variant, based on 2015 data. Source: Author’s own elaboration.
Energies 18 06021 g004
Figure 5. Percentage decrease in GDP value as a function of Reduction Variants of coal mining and the percentage-based price of imported coal; taking into account Substitution Variant WS2, the natural gas price equal to the reference value, and the Migration Variant, based on 2015 data. Source: Author’s own elaboration.
Energies 18 06021 g005
Figure 6. Percentage decrease in GDP value as a function of Reduction Variants of coal mining and the percentage-based price of imported coal; taking into account Substitution Variant WS2, a 20% increase in the price of natural gas, and the Migration Variant, based on 2015 data. Source: Author’s own elaboration.
Energies 18 06021 g006
Figure 7. Percentage decrease in GDP value as a function of Reduction Variants of coal mining and the percentage-based price of imported coal; taking into account Substitution Variant WS2, a 40% increase in the price of natural gas, and the Migration Variant, based on 2015 data. Source: Author’s own elaboration.
Energies 18 06021 g007
Figure 8. Percentage share of replacing energy from domestic hard coal for Reduction Variant WR100%, Migration Variant, and Substitution Variant WS2. (a). 40% increase in the price of natural gas, imported coal price equal to the reference price; (b). 40% increase in the price of natural gas, imported coal price 40% higher than the reference price; (c). 40% increase in the price of natural gas, imported coal price 40% lower than the reference price; Source: Author’s own elaboration.
Energies 18 06021 g008
Table 1. Input–Output Table Scheme.
Direction of UseDestinationGlobal Product
Indirect ConsumptionFinal Consumption
Sectors (Economic Branches)Categories
Products 12nIndividual ConsumptionGovernment ExpenditureInwestmentsExportZmiany Zapasów
Place of originSecondary factorsSectors
(economic branches)
1 x 11 x 12 x 1 n C 1 G 1 J 1 E 1 R 1 X 1
2 x 21 x 22 x 2 n C 2 G 2 J 2 E 2 R 2 X 2
n x n 1 x n 2 x n n C n G n J n E n R n X n
Added valueTaxes T 1 T 2 T n
Remuneration W 1 W 2 W n
Profit Z 1 Z 2 Z n
Source: Own elaboration based on [17].
Disclaimer/Publisher’s Note: The statements, opinions and data contained in all publications are solely those of the individual author(s) and contributor(s) and not of MDPI and/or the editor(s). MDPI and/or the editor(s) disclaim responsibility for any injury to people or property resulting from any ideas, methods, instructions or products referred to in the content.