Article

Novel GBest–Lévy Adaptive Differential Ant Bee Colony Optimization for Optimal Allocation of Electric Vehicle Charging Stations and Distributed Generators in Smart Distribution Systems

by
Aadel Mohammed Alatwi
1,2,
Hani Albalawi
1,2,*,
Abdul Wadood
1,2,*,
Ibrahem E. Atawi
2 and
Khaled Saleem S. Alatawi
2
1
Renewable Energy and Environmental Technology Center, University of Tabuk, Tabuk 47913, Saudi Arabia
2
Electrical Engineering Department, Faculty of Engineering, University of Tabuk, Tabuk 47913, Saudi Arabia
*
Authors to whom correspondence should be addressed.
Energies 2025, 18(22), 6018; https://doi.org/10.3390/en18226018
Submission received: 14 September 2025 / Revised: 13 November 2025 / Accepted: 15 November 2025 / Published: 17 November 2025

Abstract

The transition to electric vehicles (EVs) is pivotal for decarbonizing transport, yet the siting of EV charging stations (EVCSs) can load radial distribution networks with higher losses and more pronounced voltage drops. This study formulates the joint siting and sizing of EVCSs and distributed generators (DGs) as a constrained optimization that minimizes real and reactive losses and voltage deviation with integer bus location decisions. A novel version of the Artificial Bee Colony (ABC) algorithm known as GBest–Lévy Adaptive Differential ABC (GLAD-ABC) is introduced, combining global best guidance, differential perturbations, adaptive step sizes, Lévy-flight scouting, and periodic local refinement for finding the global optimum solution and avoiding local optima. The optimizer is coupled with a backward–forward sweep load flow and a EVCS power demand model. Validation on the IEEE-33 and IEEE-69 feeders across multiple scenarios shows that EVCS-only deployment degrades network performance, whereas optimizing EVCS and DG allocation via GLAD-ABC markedly improves voltage profiles and reduces both real and reactive losses. The proposed optimizer shows superior performance compared with other optimization algorithms reported in the literature, delivering consistently lower active losses alongside fast, stable convergence, indicating strong suitability for utility planning in EV-rich grids.

1. Introduction

Over the past few decades, continuous advancements in the transportation sector have accelerated the growth of the automotive industry. Rising oil prices, increasing environmental concerns, carbon dioxide (CO2) emissions, and the global push for sustainability have made EVs an attractive alternative in modern transportation. Usage of EVCSs is accountable for reducing CO2 emissions and promoting the transition to cleaner mobility. The adoption of EVs has several advantages, including cleaner air, fossil fuel dependency reduction, and economic sustainability in the long run. Battery-based transport systems have already been adopted in many countries to mitigate pollution [1].
Globally, EV penetration has recorded impressive growth with the growth rate at 6.5% in the Netherlands, 28.8% in Norway, and 1.5% in China. In addition to this, certain governments are promoting policies for EVs as the mainstream mode of mobility aggressively. The global EV fleet was approximated to be nearly 40 million vehicles by the end of 2023 [2]. However, the rapid acceleration of EV adoption poses huge challenges to power distribution company operators, foremost among which is ensuring secure and sustainable delivery of charging services to growing customer bases.
Of particular importance here is the environmental sustainability of transport through EVs, which is highly dependent on the sources and reliability of the electrical power used to charge [3]. The charging load increasingly puts a significant pressure on distribution networks, reducing both substations’ reserve capacity and feeders’ load transfer capacity. In refurbishment of systems with nonconventional feeders, there is a need for a constant transfer of load in a bid to prevent sudden impacts on the grid. However, when charging is based on conventional energy sources, environmental benefits of EVs are lost. In contrast, sourcing charging loads from solar or wind power doubles the sustainability of EV deployment. The need for EV charging imposes modifications on the network, i.e., consumer infrastructure and DGs, of the distribution system operators pursuant to European Union energy directives [4]. A significant amount of electricity is currently being fed by conventional gas- or heat-powered plants, and the injected charging load can destabilize the power grid. In an attempt to offset the imbalance issue, DGs are scattered in the distribution system. Nonetheless, the fast increase in power demand creates enormous challenges for planning engineers to integrate high numbers of EVs into current grids.
The siting of EVCSs is therefore a critical factor throughout their whole life cycle, since it strongly affects both the efficiency of operation and quality of service. The initial planning choices, namely location and size, directly influence costs of installation, energy loss, and voltage stability. Inadequate siting may cause nominal voltage oscillations and increased operating expenses. In addition, as EV batteries get charged while parked at charging stations, the selection of the best EVCS locations is of vital importance for ensuring economic feasibility and utilitarian efficiency. The EVCS location and capacity govern the operation of the power system. Random or controlled placement may lead to current and voltage limit violations and reduce the network’s reliability to a level where long-term planning is no longer appropriate. Road infrastructures for transport networks also play an important role in determining the best locations of EVCSs, which need simultaneous consideration of transport and distribution infrastructure [5]. While charging, critical parameters such as bus voltage profiles and losses need to be examined properly to ensure system operation that is as stable as possible as well as efficient.
The proposed work is structured as follows:
  • Objective Function Formulation. The voltage profile, voltage deviation, and power losses are evaluated using the computationally efficient backward–forward sweep (BFS) load-flow method. This approach ensures an accurate and reliable assessment of distribution network performance.
  • Optimization Technique. The GLAD-ABC algorithm is employed to determine the optimal allocation of EVCSs and DGs in the IEEE-33 and 69 bus distribution system. The proposed method evaluates the effectiveness of the distribution network and demonstrates its superiority over conventional techniques.
  • The enhanced performance of the proposed optimizer is validated by comparing it with other up-to-date algorithms cited in the literature, delivering consistently lower active power losses alongside fast, stable convergence, indicating strong suitability for utility planning in EV-rich grids.
The remainder of this paper is organized as follows: Section 2 surveys the literature on the optimal placement of EVCSs and DGs, while Section 3 describe the mathematical modeling and problem formulation. Section 4 outlines the suggested optimization methodology and the corresponding load-flow study. Section 5 discusses the simulation results and their implications. Section 6 outlines the discussion and analysis while Section 7 concludes with final insights and remarks.

2. Literature Review

The research in [6] investigates EV charging and discharging control and optimization with the goal of analyzing the influence of EVs on distribution systems. Its conclusions, however, cannot be applied in reality because no case studies are presented. Similarly, optimal siting of EVCSs has been investigated in [7], where various solution approaches are used to derive efficient siting strategies. This work does not give a profound interpretation of the results, or an open comparison of the advantages, disadvantages, and practical implications of different strategies. The effect of electric drive vehicles (EDVs) on power system reliability is analyzed in [8] based on optimization models varying with EDV battery characteristics like loss of load expectation and expected energy not served. While helpful, the study is marred by the lack of immediate real-world validation and data-driven analysis. Meanwhile, the authors in [9] approach the issue of peak demand owing to concurrent charging of multiple EVs on electric vehicle supply equipment.
They recommend an electric vehicle supply equipment selection pattern coupled with a peak load management model, using a time-of-use pricing (TOUP) approach to recover revenue from surplus stored battery energy. The proposal demonstrates improvements in grid stability and cost effectiveness. Demand-side management (DSM) has been recognized as an enabling factor for the shift from fossil fuels toward renewable energy. The article in [10] offers an exhaustive overview of applications of DSM in modern power systems, clustering the present approaches and suggesting practical recommendations to improve reasoning in subsequent studies. Moreover, the research in [11] analyzes the impacts of integration of EVCSs on IEEE-33 bus systems based on reliability indices, voltage stability, and power loss, but it lacks key information such as system reliability, network expansion planning requirements, and traffic, which are still research open areas for the future.
The research in [12] applies the whale optimization algorithm (WOA) and grey wolf optimization (GWO) to EVCS allocation in radial distribution networks, partitioning services into three different zones. Although the strategy identifies trade-offs between network performance and consumer convenience, it falls short of a clear-cut framework. In addition, the lack of complete verification through extensive simulation studies or field data compromises the true reliability of the solution presented. The study in [13] examines the impact of locating EVCSs strategically in distribution networks spanning residential zones, road infrastructures, and business hubs such as supermarkets. Increasing charging needs impose more loads on the distribution network, and thus analysis of various placement choices for EVCS deployment is needed.
For addressing uncertainties in EV value expectations, the two-moment (2m) point estimation approach is used, and optimization is done using the Harris hawks optimization (HHO) algorithm integrated with differential evolution (DE) methods [14]. In Beijing, the EVCS placement issue is formulated as a bi-objective optimization model, considering both cost increases and reductions. With increasing loads at charging points, Geographic Information Systems (GISs) are utilized to identify other locations for placement of the stations to reduce power loss and system expenses [15]. An allocation study of EVCSs in Guwahati, India also indicates significant impacts on the distribution system regarding power loss, voltage stability, reliability indices, and accessibility for electric vehicle users [16]. This research utilizes a multi-objective optimization strategy in which the siting issue is optimized utilizing advanced algorithms such as chicken swarm optimization (CSO), Pareto-dominance hybrid algorithm, and teaching–learning-based optimization (TLBO). The analysis is performed on a 25-node road network integrated with an IEEE RDS, providing a holistic evaluation of EVCS siting strategies.
Coordination of EVs and DN networks highlights bi-level complexity in the allocation of EVCSs and DGs. The k++ clustering algorithm has hence been employed to explore daily wind and photovoltaic load patterns, while a novel harmony-particle swarm optimization (PSO) method has been proposed to address bi-level programming problems [17]. Parallel to this, numerous studies have been performed to mitigate the ill effects of large-scale EV integration. Most notably, voltage profile improvements and reductions in power losses in radial distribution networks have been achieved by judicious DG integration. One such study applies a mixed-integer non-linear programming (MINLP) approach to optimize DG placement and enhance system performance [18]. In [19], the genetic algorithm (GA) has been shown to reduce power losses in distribution networks under varying load conditions. Similarly, a new variant of the cuckoo search algorithm known as ORCSA combined with a fuzzy-based approach has been employed to identify optimal DG locations and sizes, with analyses conducted on 15, 33, and 69 bus test systems [20]. In [21], power loss minimization is achieved through the joint integration of shunt capacitors and DGs.
The placement of these components is determined using the Power Loss Index (PLI) for capacitor allocation and the Index Vector Method (IVM) for DG positioning, while their respective sizes are optimized using an enhanced version of ABC algorithm, a population-based meta-heuristic technique. In addition to DG and capacitor placement, challenges also arise from the simultaneous charging of multiple plug-in electric vehicles (PEVs), which can exacerbate grid stress by increasing power losses, voltage instability, and feeder overloading. To address these issues, the Real-Time Smart Load Management (RT-SLM) control strategy has been proposed, effectively mitigating energy losses and reducing generation costs [22]. Several studies have analyzed the impact of EVs on distribution networks, addressing issues such as voltage instability, power losses, and feeder overloading under peak load conditions. Methods including reactive power compensators [23], GA [24], PSO [25], hybrid grey wolf optimizers (HGWO) [26], modified primal–dual interior-point methods [27], and photovoltaic (PV) integration with PSO and bacterial foraging optimization algorithm (BFOA) [28] have been applied to DG and EVCS placement, while adaptive shuffled frog leaping algorithms have been employed for joint DG allocation and network reconfiguration [29]. In [30], for combing placement EVCSs and DGs, a PSO is recalled. In [31,32], an analytical two-stage approach and firework optimization has been used to solve the optimum placement problem. Various meta-heuristics optimizations were applied in [33], including modified teaching-based optimization (MTLBO) and JAYA for the placement of DGs. In [34], an advanced version of coyote optimization (COA), known as enhanced (ECOA), was used for optimum DG placement to further refine the solution. For DG placement problems, some other approaches like quasi-oppositional swine influenza model-based optimization with quarantine (QOSIMBO-Q) [35], analytical approach (AA) [36], HHO [37], arithmetic optimization algorithm [38], and moth flame optimization [39]. These approaches demonstrate improvements in energy efficiency, voltage profiles, and loss minimization; however, they often lack comprehensive comparisons, detailed methodological descriptions, and real-world validations.
To overcome these limitations, this study proposes a novel GLAD-ABC algorithm leveraging the idea of combining global best guidance, differential perturbations, adaptive step sizes, Lévy-flight scouting, and periodic local refinement for the optimal placement of EVCSs and DGs in the IEEE-33 and 69 bus distribution system, offering a robust and computationally efficient solution to mitigate voltage degradation and power loss from EVCS integration.

3. Problem Formulation

3.1. Objective Function

A key objective of the current research is to reduce real power loss in the distribution system as well as voltage deviation. This objective is mathematically described as
m i n i m i z e P loss = F = i = 1 N b I i 2 R i
V D = i = 1 N b V i 1
where F represents the total power loss within the system. The variable Nb denotes the total number of branches present. Additionally, Ii and Ri correspond to the current and resistance associated with the ith branch, respectively. V D is the total voltage deviation representing the cumulative deviation of all bus voltages from the ideal value of 1 per unit (p.u), where V i 1 is the absolute deviation of the ith bus voltage from the nominal voltage.

3.2. Operational Constraints

The constraints associated with Equation (1) are defined as follows, ensuring that the operational and physical limits of the distribution network are satisfied. In the distribution network, the generation and consumption of active and reactive power are balanced at each bus.

3.2.1. Equality Constraint

At each bus in the distribution system, active and reactive power generation equals the corresponding consumption.
P substation + k = 1 N bus P D G ( k ) + k = 1 N bus P E V C S ( k ) = k = 1 N bus P D ( k ) + j = 1 N branch P loss ( j )
Q substation + k = 1 N buss Q D G ( k ) + k = 1 N bus Q E V C S ( k ) = k = 1 N bus Q D ( k ) + j = 1 N branch Q loss ( j )
P substation and Q substation denote active and reactive power supplied by the grid. P D G k , and Q D G ( k ) are the real and reactive power injected by DG units at bus k. P E V C S ( k ) and Q E V C S k are real and reactive power drawn/injected by EV charging stations. P D ( k ) and Q D ( k ) denote the active and reactive power demands while P loss ( j ) and Q loss j   a r e   a c t i v e   a n d   r e a c t i v e   l o s s e s   o n   b r a n c h   j .

3.2.2. Inequality Constraints

  • DG injection limits: The output of active and reactive power from distributed generation units is restricted to defined ranges.
P D G , k m i n P D G , k P D G , k m a x
Q D G , k m i n Q D G , k Q D G , k m a x
b.
Voltage constraint: Maintain each bus voltage between 0.95 and 1.05 p.u. to preserve system stability.
V m i n , k V k V m i x , k k = 1 , 2 , 3 , ,   Nbus
c.
Current limit: No transmission or distribution line should carry a current exceeding its rated capacity.
I j I j m a x j = 1 , 2 , 3 ,   Nbranch
where V m i n , k and V m i x , k specify the lower and upper voltage levels at each bus within the system to ensure voltage stability. P D G , k m i n and P D G , k m a x represent the lower and upper active power level at the kth DG while Q D G , k m i n and Q D G , k m a x denote the minimum and maximum reactive power of the kth DG and I j and I j m a x represent the actual and maximum limit of the current in the jth branch. The load-flow analysis is utilized to calculate the objective function.

3.3. Load-Flow Analysis

Load-flow analysis is the basic methodology for analyzing the static performance of electrical distribution networks. To obtain accurate information about the operating characteristics of the system, it essentially requires two inputs: line data and load data. From the voltage profile at the generators, loads, and buses, real/reactive power losses and branch currents are computed. Figure 1 illustrates the single-line diagram, where the power flows are obtained using Equations (9) and (10). In this work, load-flow studies are conducted on the IEEE-33 and 69 bus distribution system, focusing particularly on investigating its voltage profile and corresponding power losses. The main objective here remains to develop an appropriate model for representing the system flow.
P k + 1 = P k P L o s s , k P L k + 1
Q k + 1 = Q k Q L o s s , k Q L k + 1
At bus k, P k and Q k stand for the real and reactive power flowing outward. The subsequent bus, k + 1, carries a load represented by P k + 1 , denoting the real power and Q k + 1 for reactive power.
P l o s s ( k , k + 1 ) = R k P k 2 + Q k 2 V k 2
Q l o s s ( k , k + 1 ) = X k P k 2 + Q k 2 V k 2
The buses k and k + 1 are interconnected by the line section, and the power loss within this section is determined using Equations (3) and (4). P l o s s ( k , k + 1 ) and Q l o s s k , k + 1 denote the real and reactive power losses, respectively.
P T ,   loss   ( k , k + 1 ) = k = 1 n P loss ( k , k + 1 )
Q T ,   loss   ( k , k + 1 ) = k = 1 n Q loss ( k , k + 1 )
In a similar manner, total system losses are obtained by adding the power losses of each line section as defined in Equations (6) and (7). In these equations, P T ,   loss   ( k , k + 1 ) and Q T ,   loss   ( k , k + 1 ) represent the total real and reactive power losses within the specified line section.
This study applies the BFS method to conduct load-flow analysis on the IEEE-33 and 69 bus distribution system as shown in Figure 2. The BFS method is widely preferred due to its rapid convergence, computational efficiency, and adaptability, making it particularly effective for small- to medium-scale networks characterized by high R/XR ratios, parameter uncertainties, and frequent load variations [40,41]. Unlike conventional techniques such as the Newton–Raphson method, BFS scales linearly with network size and guarantees robust performance under practical distribution conditions. The iterative process consists of two stages: a backward sweep to compute branch currents and power flows, and a forward sweep to update the nodal voltages. This results in accurate estimates of the bus voltages, real power losses, and reactive power losses. The EVCS power demand is modeled explicitly with the aim of representing realistic EV charging behavior while simplifying the analysis. Assumptions for the EVCS load model are summarized in Table 1.
The aggregated EVCS power demand is therefore calculated as
P E V C S s = D f × P p e a k
where P p e a k represents the peak power of the EVCSs and D f is the diversity factor. This modeling method can guarantee that the actual load utilized in the BFS study represents a typical EV charging pattern and is consistent with the assumptions for the optimal placement of EVCSs and DGs. Based on these results, the optimal position of EVCSs and DGs is determined by using the GLAD-ABC algorithm.

4. Design Methodology for EVCS and DG Placement

To enhance the overall performance of the distribution system, objective criteria are defined within the proposed framework. The approach employs a novel variant of the ABC algorithm, known as the GLAD-ABC. This modified optimization technique is designed to address multi-objective problems in power system planning. The primary objectives are
(i)
To maximize the voltage profile improvement of the network
(ii)
To minimize overall real and reactive power losses.
In this paper, the GLAD-ABC algorithm is employed for the optimal placement and sizing of EVCSs and DGs in smart distribution systems by formulating a comprehensive multi-objective function. The novelty of the present study is in its problem-specific adaptation and integration with the GLAD-ABC algorithm using a BFS load-flow model to capture the network behavior under the integration of EVCSs and DGs. The optimization technique incorporates global best learning, a Lévy flight strategy, and Adaptive Differential operators, allowing it to effectively explore and exploit the search space. These are further customized for dealing with mixed continuous–discrete decision variables concerning location and capacity, and satisfying network equality and inequality constraints. This is so the optimizer would be in direct contact with system power flow equations while improving solution realism and convergence robustness. The proposed framework is highly suitable for modern distribution networks featuring load variability, high R/X ratios, and parameter uncertainties, as the active and reactive power losses can be minimized and the voltage profile can be improved effectively.

4.1. Artificial Bee Colony Optimization (ABC)

The ABC algorithm, introduced by Karaboga [42,43] is inspired by the natural foraging behavior of honeybees in search of nectar. It begins by randomly generating initial candidate solutions, which represent food sources [44]. These solutions are progressively refined through iterative updates, and the process continues until the predefined termination condition is satisfied. The working steps of the ABC algorithm are given below.

4.1.1. Initialization

At this stage, the bus data of the distribution grid, referred to as food sources in the optimization process, are randomly initialized. The generated dataset specifies the potential locations, capacities, and number of EVCSs and DGs to be deployed, as illustrated in Figure 2. Each candidate solution (food source) is represented by a decision vector
X = P D G 1 , . , P D G n , B u s D G 1 , . , B u s D G n , P E V C S 1 , , P E V C S n , B u s E V C S 1 , . , B u s E V C S 1
where P D G i and B u s D G i denote the size and location of the ith DG and P E V C S i   B u s E V C S i and denote the size and location of the EVCSs. Candidate locations are selected randomly from within the range of available buses (1→Bnum) in the distribution system. Likewise, the capacities of EVCSs and DGs are initialized with random values, while the number of installations is randomly chosen between 1_dnum where dnum denotes the upper limit on the number of EVCSs and DGs that can be integrated into the system.

4.1.2. Worker Bee Phase

In this stage, the fitness values of the initial food sources are determined. The fitness function is formulated to capture two primary objectives: minimizing real power losses and improving the overall voltage profile of the system. To ensure scale-independent optimization, the objective function was reformulated as a normalized weighted sum.
Fit = w 1 P L P base + w 2 V D V D base , w 1 + w 2 = 1 .
Here, PL represents the total real power losses and P base is the reference power loss in the distribution network, while VD corresponds to the total voltage deviation in per unit. V D base is the reference voltage deviation from the base case used to normalize the current voltage deviation, while w 1 and w 2 are the weighting coefficients assigned to each objective. In the proposed framework, normalization is performed dynamically using the minimum and maximum range of each objective in the evolving population, allowing adaptive scaling of losses and voltage deviation terms without the need for fixed weights. Once the fitness of the initial data is calculated, the iteration counter is initialized and set to 1, marking the beginning of the optimization process. The worker bees then proceed to explore and update solutions for the placement of EVCSs and DGs based on the evaluated fitness values.

4.1.3. Onlooker Bee Phase

In this phase, onlooker bees select the most promising food sources, representing candidate EVCS and DG placements, based on their fitness values. The aim is to reinforce solutions that minimize power losses and enhance voltage profiles. New candidate solutions are generated using
V m 0 = X m 0 + Φ m 0 X m 0 X n 0
where X n 0 is a randomly chosen solution (m ≠ n) and Φ m 0 is a random number in [−1,1]. A greedy selection strategy ensures that only the fitter solution is retained. This process accelerates convergence towards optimal EVCS and DG allocation in the IEEE-33 and 69 bus system.

4.1.4. Selection

In this phase, candidate solutions representing EVCS and DG placements are selected based on their fitness values. Solutions with lower power losses and improved voltage profiles have a higher probability of survival, defined as
Probability i = fit i i = 1 n f i t i

4.2. GBest–Lévy Adaptive Differential Artificial Bee Colony (GLAD-ABC)

When the onlooker bee step fails to improve any food source for limited consecutive trials, the algorithm abandons those sources and generates scout solutions using the GLAD mechanisms (GBest guidance + Lévy flights + Adaptive Differential update). This preserves diversity and escapes local minima.

4.2.1. Initialization

Set the GLAD-scout parameters: population of scouts ns, differential scale F, crossover rate CR, global best weight c, Lévy step scale α, Lévy stability index β ∈ (1,2] (typically 1.5), discovery probability P σ (abandonment rate), and termination criterion (maximum generations or no-improvement threshold.

4.2.2. Generation of Initial Scout Sources

Abandoned sources are reinitialized around the global best using a Lévy displacement (rather than uniform random resets):
x i ( 0 ) = Π Ω g t + α L e v y β ( D ) , i = 1 , , n s ,
where g t is the current global best, Π Ω projects to the feasible bounds, and L e v y β ( D ) is a D -dimensional Lévy vector.

4.2.3. Lévy Step Construction (Mantegna)

The Lévy step is formed by Mantegna’s scheme
l = u | v | 1 / β , u N 0 , σ u 2 , v N ( 0,1 )
σ u = Γ 1 + β sin π β 2 Γ 1 + β 2 β 2 β 1 2 1 β and   the   vector   Lévy   step   is   L = l z   with   z N 0 , I D .
ℓ denotes the scalar Lévy step length, L is the vector Lévy step, u, v are independent random variables used to generate the step, and β is stability index of the Lévy distribution (usually 1 < β ≤ 2). The notation N 0 , σ u 2 refers to a Gaussian random variable characterized by a mean of zero and a variance of σ u 2 , N ( 0,1 ) indicates the standard Gaussian distribution, having zero mean and unit variance. u is drawn from a Gaussian with variance σ u 2 while v is drawn from a standard Gaussian. σ u denotes the scaling factor for the Lévy distribution depending on β parameter while Γ is the gamma function, and sin π β 2 ensures correct scaling of the distribution.

4.2.4. GLAD Scout Step Size

For each scout, form a composite GLAD step that couples exploration (Lévy), exploitation toward the best (GBest), and differential variation:
S i = α L + c g t x i ( k ) + F x r 1 ( k ) x r 2 ( k )
where Si denotes the new candidate solution (or step vector) for the ith individual at iteration k. α is the scaling factor for the Lévy step (controls its influence). c is the learning or acceleration coefficient (weights the effect of global guidance). gt is global best solution found so far at iteration t. xi(k) is the current position, and F denotes the mutation scaling factor (as used in differential evolution). xr1(k), xr2(k) are randomly chosen solutions (distinct from i) at iteration k. (xr1(k)xr2(k)) is the differential variation vector that introduces diversity.

4.2.5. Generation of a New Scout Solution

A trial vector is produced using binomial crossover, followed by greedy replacement.
v i , j ( k ) = x i , j ( k ) + S i , j ,   if   rand   j C R   or   j = j r a n d x i , j ( k ) ,   otherwise
x i ( k + 1 ) = Π Ω v i ( k ) , f v i ( k ) f x i ( k ) x i ( k ) ,   otherwise
Here, C R ( 0,1 ) is the crossover rate; r a n d j U ( 0,1 ) ; j rand is a randomly chosen dimension to ensure at least one update; S i , j is the GLAD step component; Π Ω ( ) projects onto the feasible domain Ω ; and f ( ) is the objective function. The greedy rule retains the fitter vector between the parent x i ( k ) and trial v i ( k ) .

4.2.6. Discovery/Abandonment Rule

With probability P a , a scout may abandon its current position and be reseeded near g t by a fresh Lévy jump:
x i ( k + 1 ) Π Ω g t + α L e v y β ( D )   if   rand   P a

4.2.7. Ending of GLAD-Scout Process

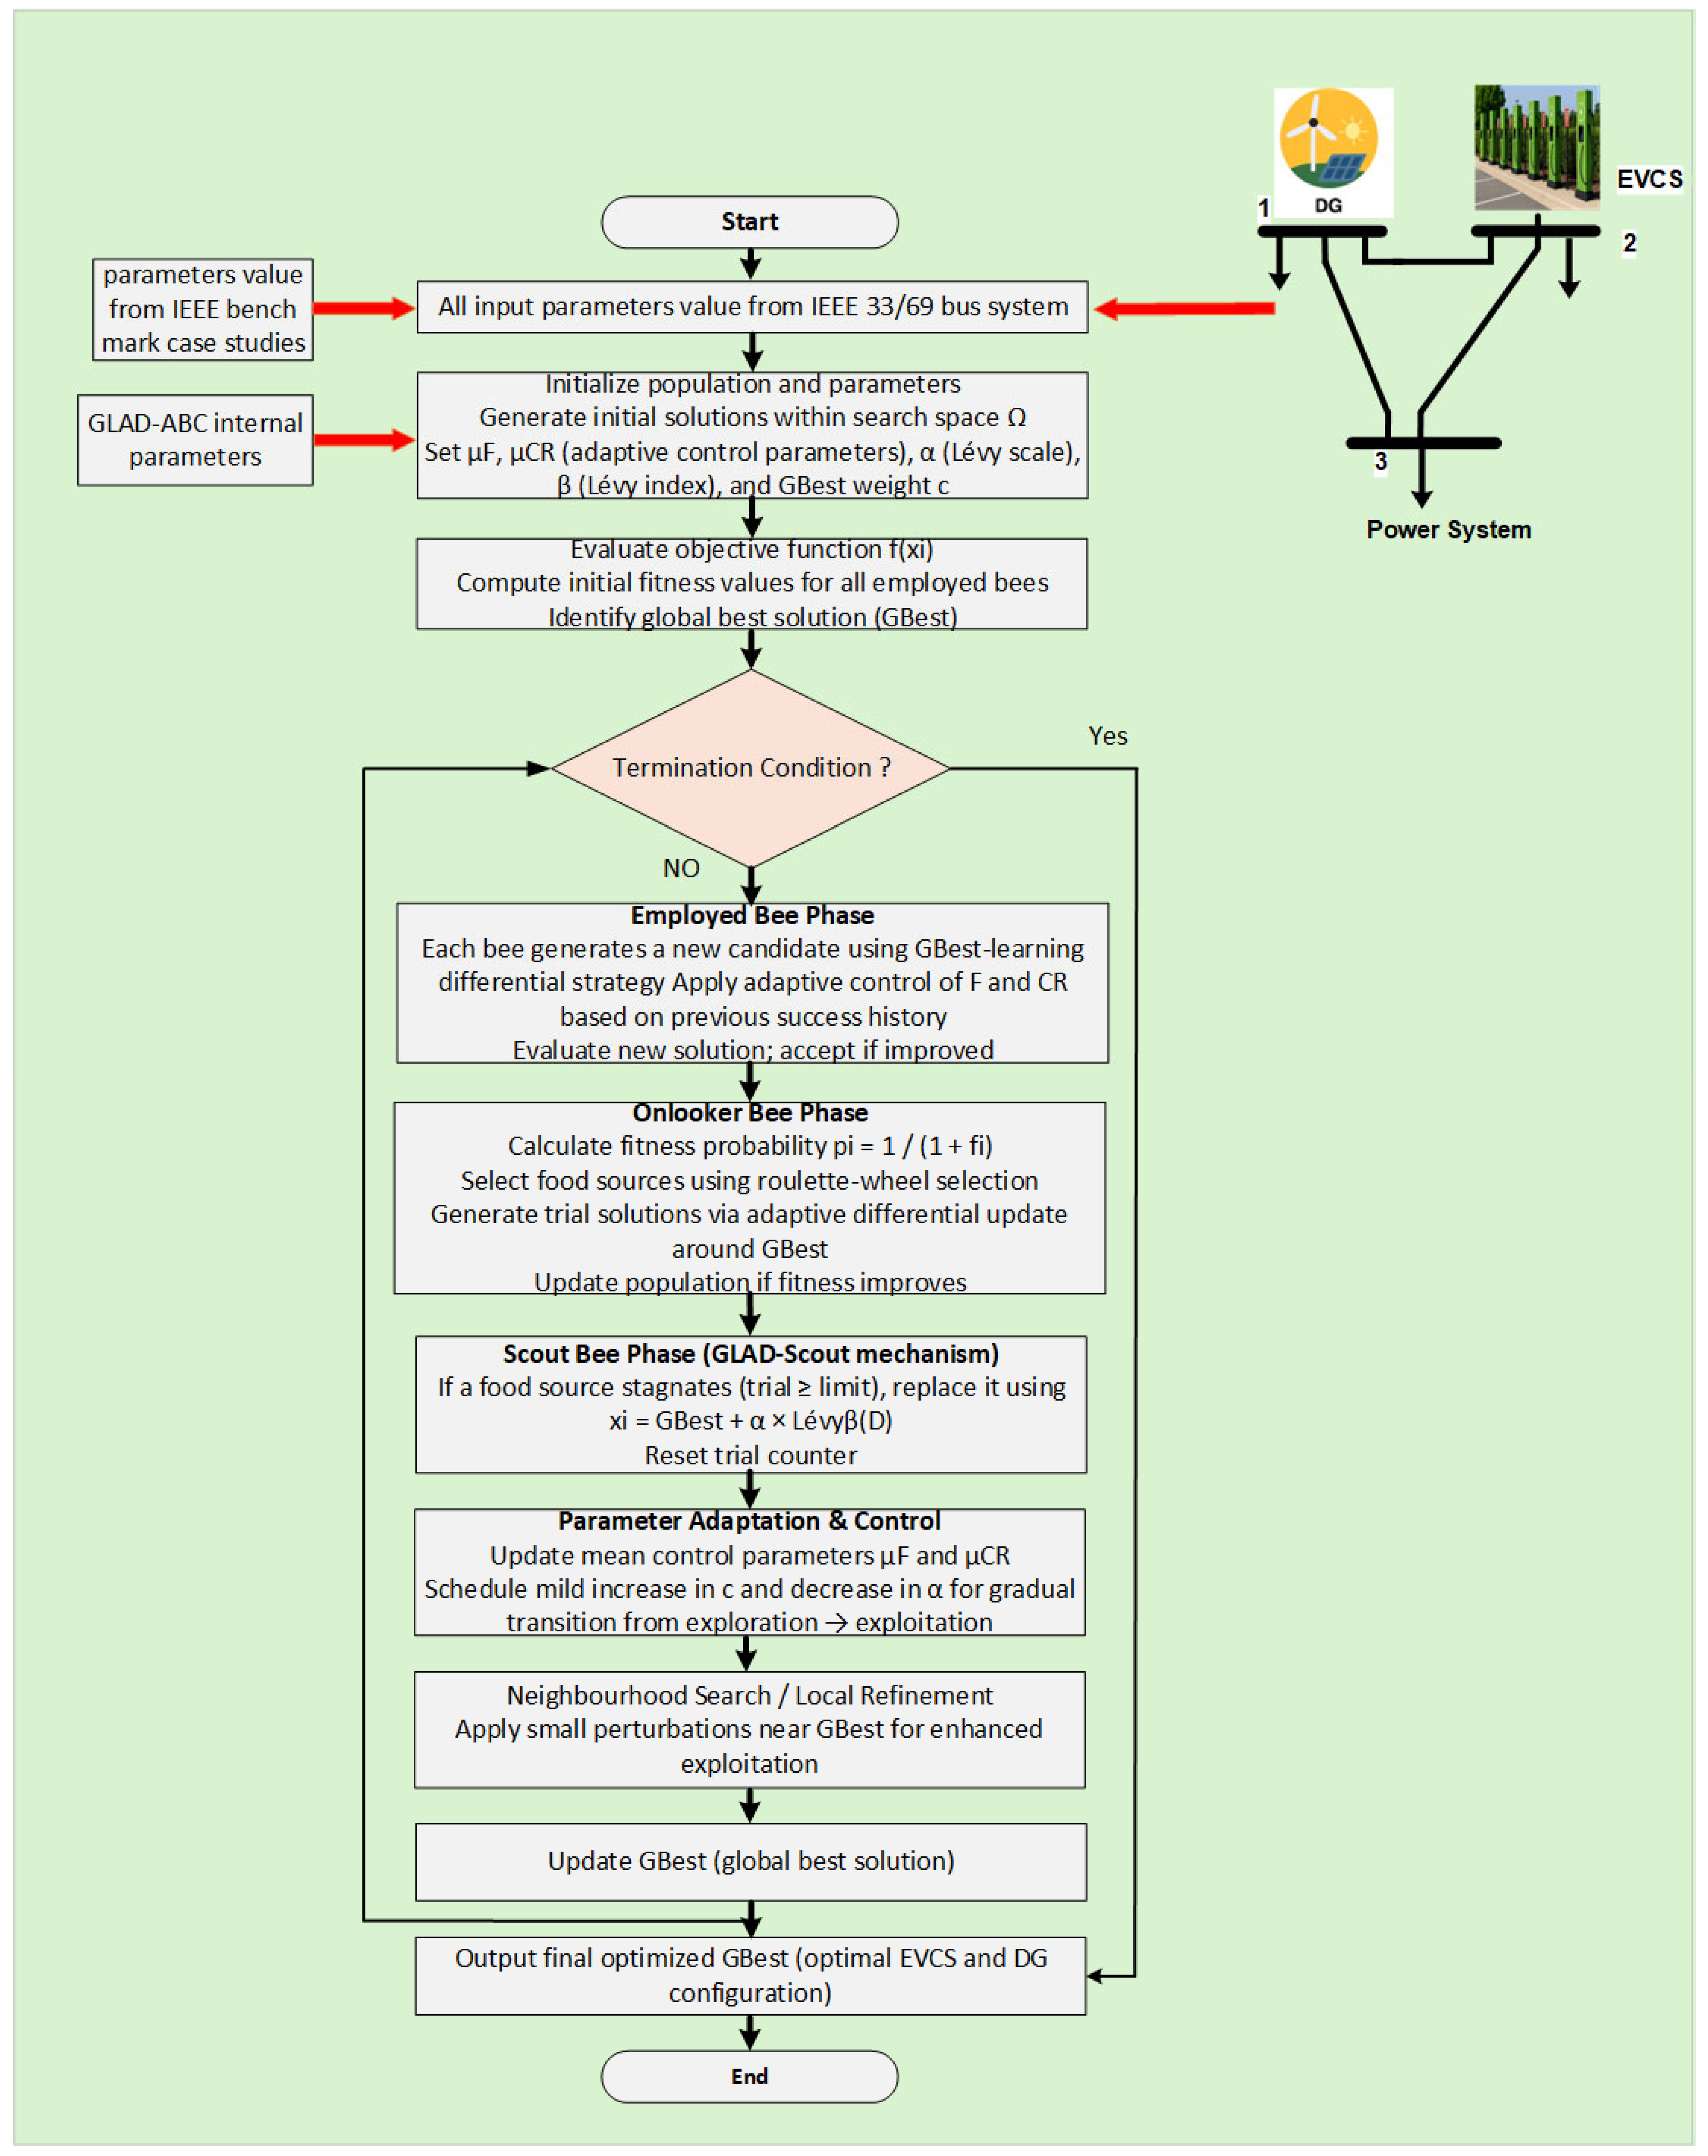
Repeat steps (18)–(26) as shown in the pseudocode for the scout sub-process until the scout termination criterion is met (fixed scout generations or no improvement), then merge the improved scout solutions back into the main population and update the global best gt+1. During each GLAD-ABC iteration, both EVCS scheduling and DG dispatch variables are evaluated simultaneously within a single fitness function, ensuring that the optimization inherently captures the interactive effects of generation placement and charging-demand satisfaction. The pseudocode and graphical flow of the proposed GLAD-ABC are shown in Algorithm 1 and Figure 3.
Figure 3. Graphical abstract of the proposed methodology.
Energies 18 06018 g003
Algorithm 1 Pseudocode of the GLAD-ABC.
Input: Objective f(·), bounds Ω, population size N, maxIter
limit (trial counter threshold), β (Lévy index),
initial params μF, μCR, c (GBest weight), α (Lévy scale)
Output: Best solution gbest

1:  Initialize population {xi}i = 1…N ~ Uniform(Ω)
2:  Evaluate fi ← f(xi); gbest ← argmin fi
3:  Set trial_i ← 0 for all i
4:  for t = 1 … maxIter do
5:  for i = 1 … N do
6:     vi ← GLADStep (xi, gbest, μF, μCR, c, α, β, Ω)
7:     if f(vi) ≤ f(xi) then xi ← ΠΩ (vi); trial_i ← 0; record (F, CR) success
8:     else trial_i ← trial_i + 1
9:   end if
10:  end for
11:  Update gbest ← argmin_i f(xi)
12:  # -------- Onlooker-bee phase --------
13:  Compute fitness fit_i = 1/(1 + f(xi))
14:  Compute selection probabilities pi = fit_i/Σk fit_k
15:  for k = 1 … N do
16:    Select index i~Categorical({pi})
17:    vi ← GLADStep(xi, gbest, μF, μCR, c, α, β, Ω)
18:    if f(vi) ≤ f(xi) then xi ← ΠΩ(vi); trial_i ← 0; record (F, CR) success
19:    else trial_i ← trial_i + 1
20:    end if
21:  end for
22:  Update gbest ← argmin_i f(xi)
23:  # -------- Scout-bee phase (GLAD-scout) --------
24:  for i = 1 … N do
25:    if trial_i ≥ limit then
26:      xi ← ΠΩ (gbest + α · Levyβ(D))
27:      trial_i ← 0
28:    end if
29:  end for
30:  Update μF, μCR from successful (F, CR) used this iteration
31:  Optionally schedule c ↑ (mildly) and α ↓ (mildly) over t
32: end for
33: return gbest

5. Result and Discussion

5.1. Results of IEEE-33 RDS

To assess the effectiveness of the proposed approach, simulations are carried out on the IEEE-33 bus radial distribution system (RDS), depicted in Figure 4. Comprehensive descriptions of the system are available in [30,38]. The test system includes 33 buses and 32 distribution lines, operating at a base voltage of 12.66 kV and a base power capacity of 100 MVA. The total system load corresponds to 3715 kW of real power demand and 2300 kVar of reactive power demand. A direct load-flow analysis is carried out to evaluate the voltage profile and power losses. From the initial evaluation, it has been found that the system suffers from a real power loss of 202.303 kW and a reactive power loss of 134.641 kVar. The minimum bus voltage is 0.91337 p.u. at bus 18, while the maximum is 1 p.u. at bus 1 and voltage deviation of 11.640 p.u. In order to capture the impact of EVCSs and DGs, six different operational cases are analyzed.
  • Operational case 1. Load-flow analysis of base case for the existing load in IEEE-33 bus RDS.
  • Operational case 2. Optimum allocation of three EVCSs within IEEE-33 bus RDS.
  • Operational case 3. Optimum allocation of five EVCSs within IEEE-33 bus RDS.
  • Operational case 4. Optimum placement of one DG within IEEE-33 bus RDS.
  • Operational case 5. Optimum placement of two DGs within IEEE-33 bus RDS.
  • Operational case 6. Optimum allocation of three DGs within IEEE-33 bus RDS.
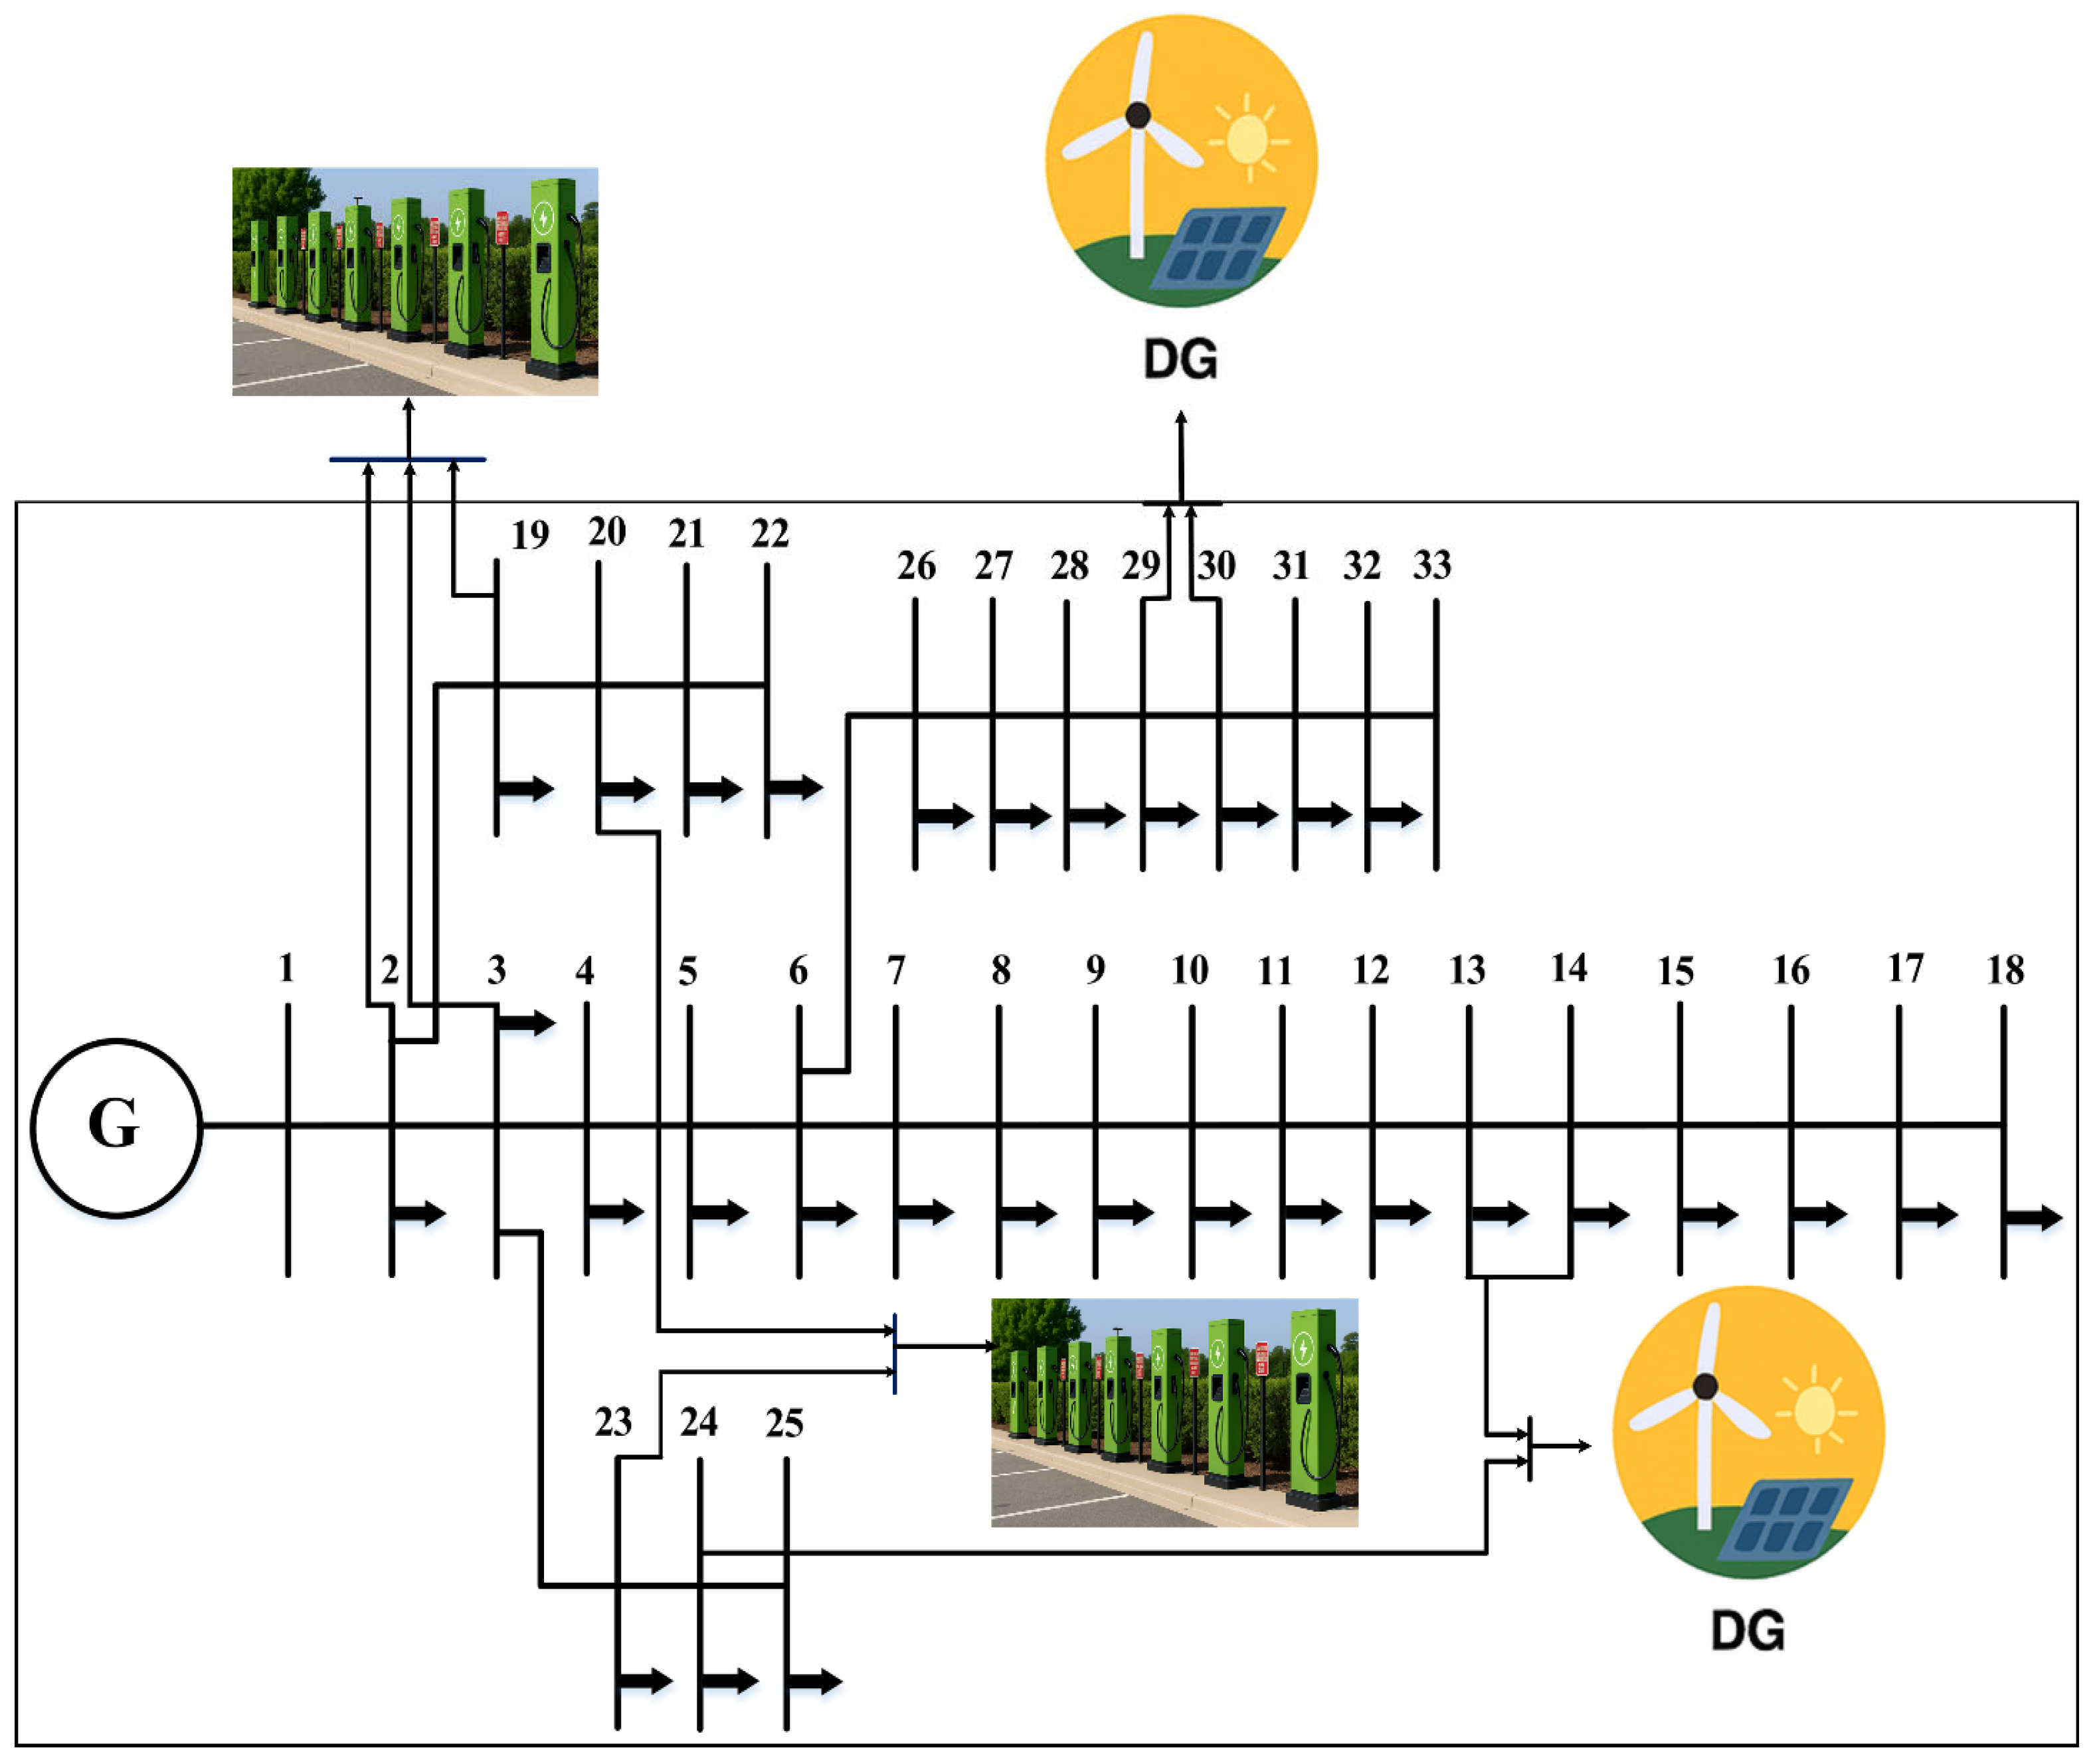
The optimal sitting of EVCSs within the IEEE-33 bus system indicates that although their integration is essential for serving the charging demand, it highly increases the network’s power losses. In order to overcome this situation, DGs are strategically located to compensate for those extra losses and to reinforce voltage stability. The proposed GLAD-ABC algorithm achieves the joint optimal placement of EVCSs and DGs units, which ensures enhanced voltage regulation and reduces system losses in comparison to the base case scenario.
Figure 4. IEEE-33 bus radial distribution system.
Energies 18 06018 g004

5.1.1. Impact of EVCSs and DGs on the Voltage Profile of IEEE-33 RDS

The integration of EVCSs significantly affects the voltage profile of the IEEE-33 bus system as shown in Figure 5. As EVCSs are installed at various nodes, the charging demand increases, leading to a noticeable reduction in system voltage. For instance, with three EVCSs installed at buses 2, 20, and 19, the voltage declines; this reduction becomes more severe when five EVCSs are placed at buses 3, 20, 23, 2 and 19.
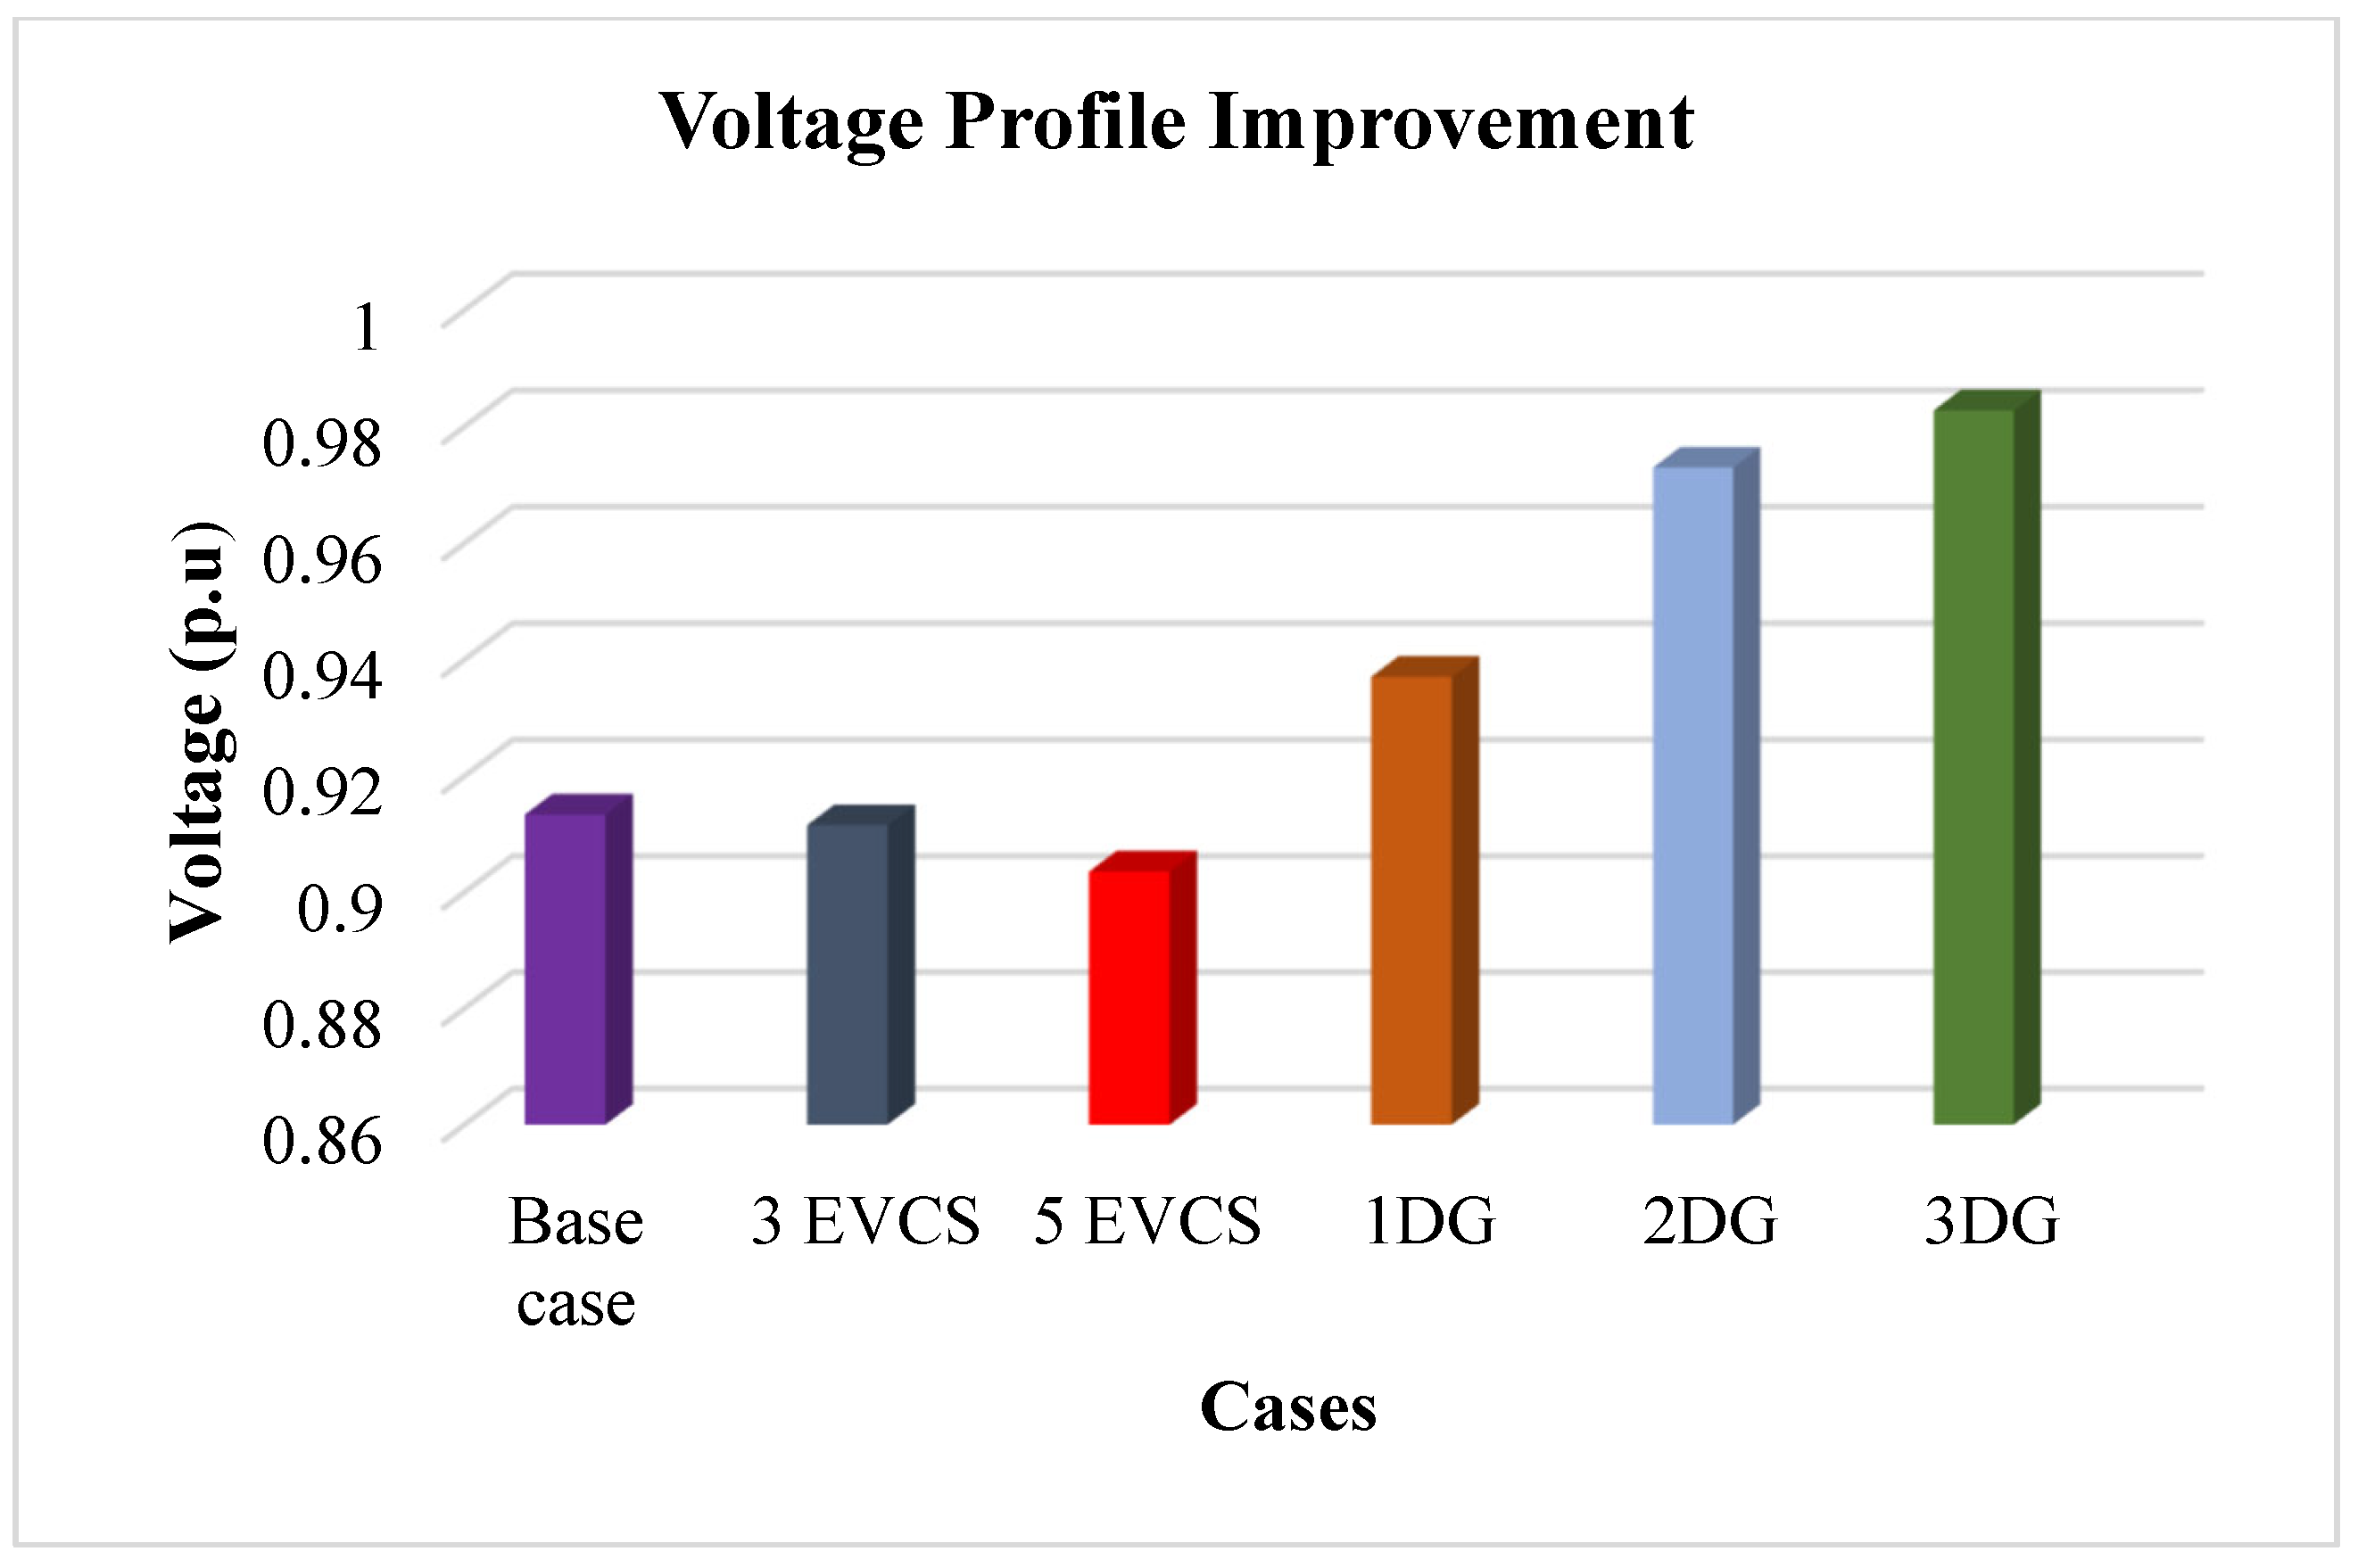
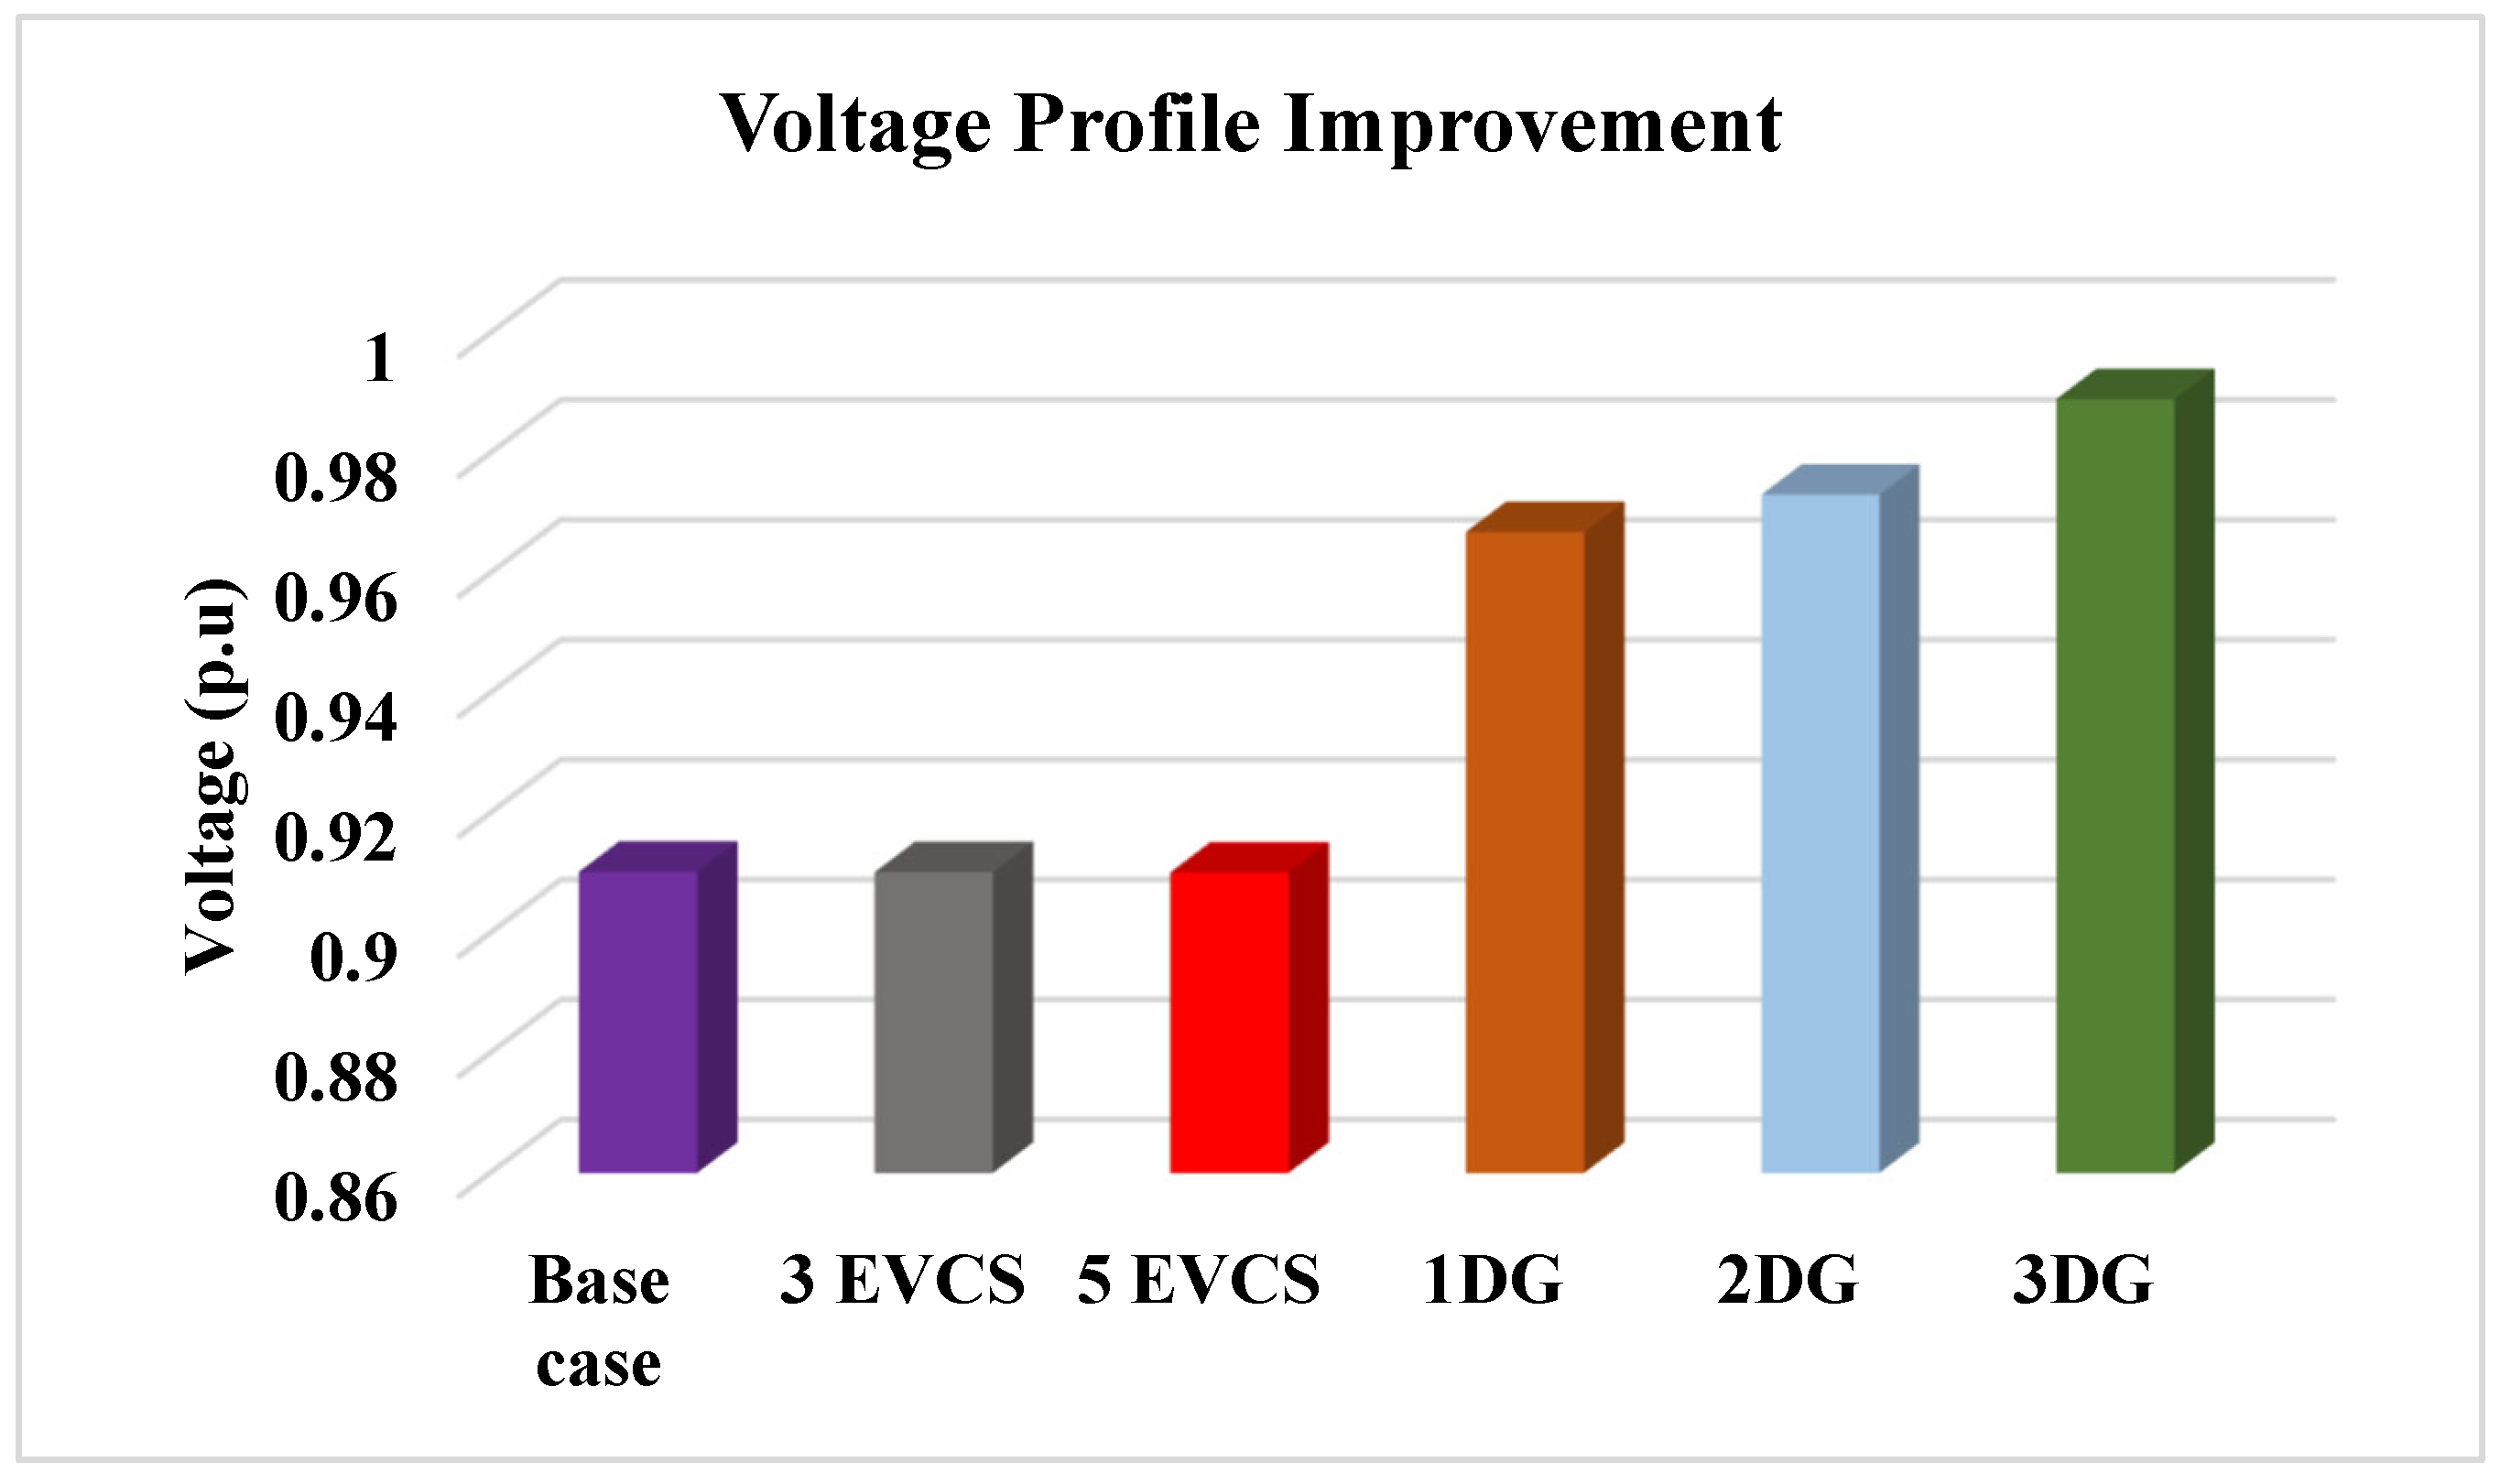
To mitigate this impact, DGs are introduced, which enhance the voltage profile by compensating for additional demand as depicted in Figure 5. The installation of a single and two DGs improves the minimum bus voltage to 0.93705 p.u. and 0.97296 at bus 18, while three DGs further raise it to 0.98276 p.u. Increasing the number of DGs continues to strengthen the system voltage, as power losses are reduced. These results confirm that the coordinated placement of EVCSs and DGs effectively maintains voltage profile and minimizes adverse impacts on the radial distribution system.

5.1.2. Impact of EVCSs and DGs on the Power Losses of IEEE-33 RDS

When a large number of EVs are simultaneously charged at a station, the load on the charging infrastructure rises significantly, causing disturbances in the distribution network. This results in a decline in system voltage and an increase in overall power losses. Therefore, the placement of EVCSs must be carefully planned ideally at locations that not only offer accessibility for users but also minimize additional network losses. The findings of the proposed work indicate that as the number of EVCSs grows, the power losses of the distribution system also escalate. While previous studies have primarily reduced losses by mitigating I2R effects, the present approach achieves loss reduction through the optimal allocation of DGs.
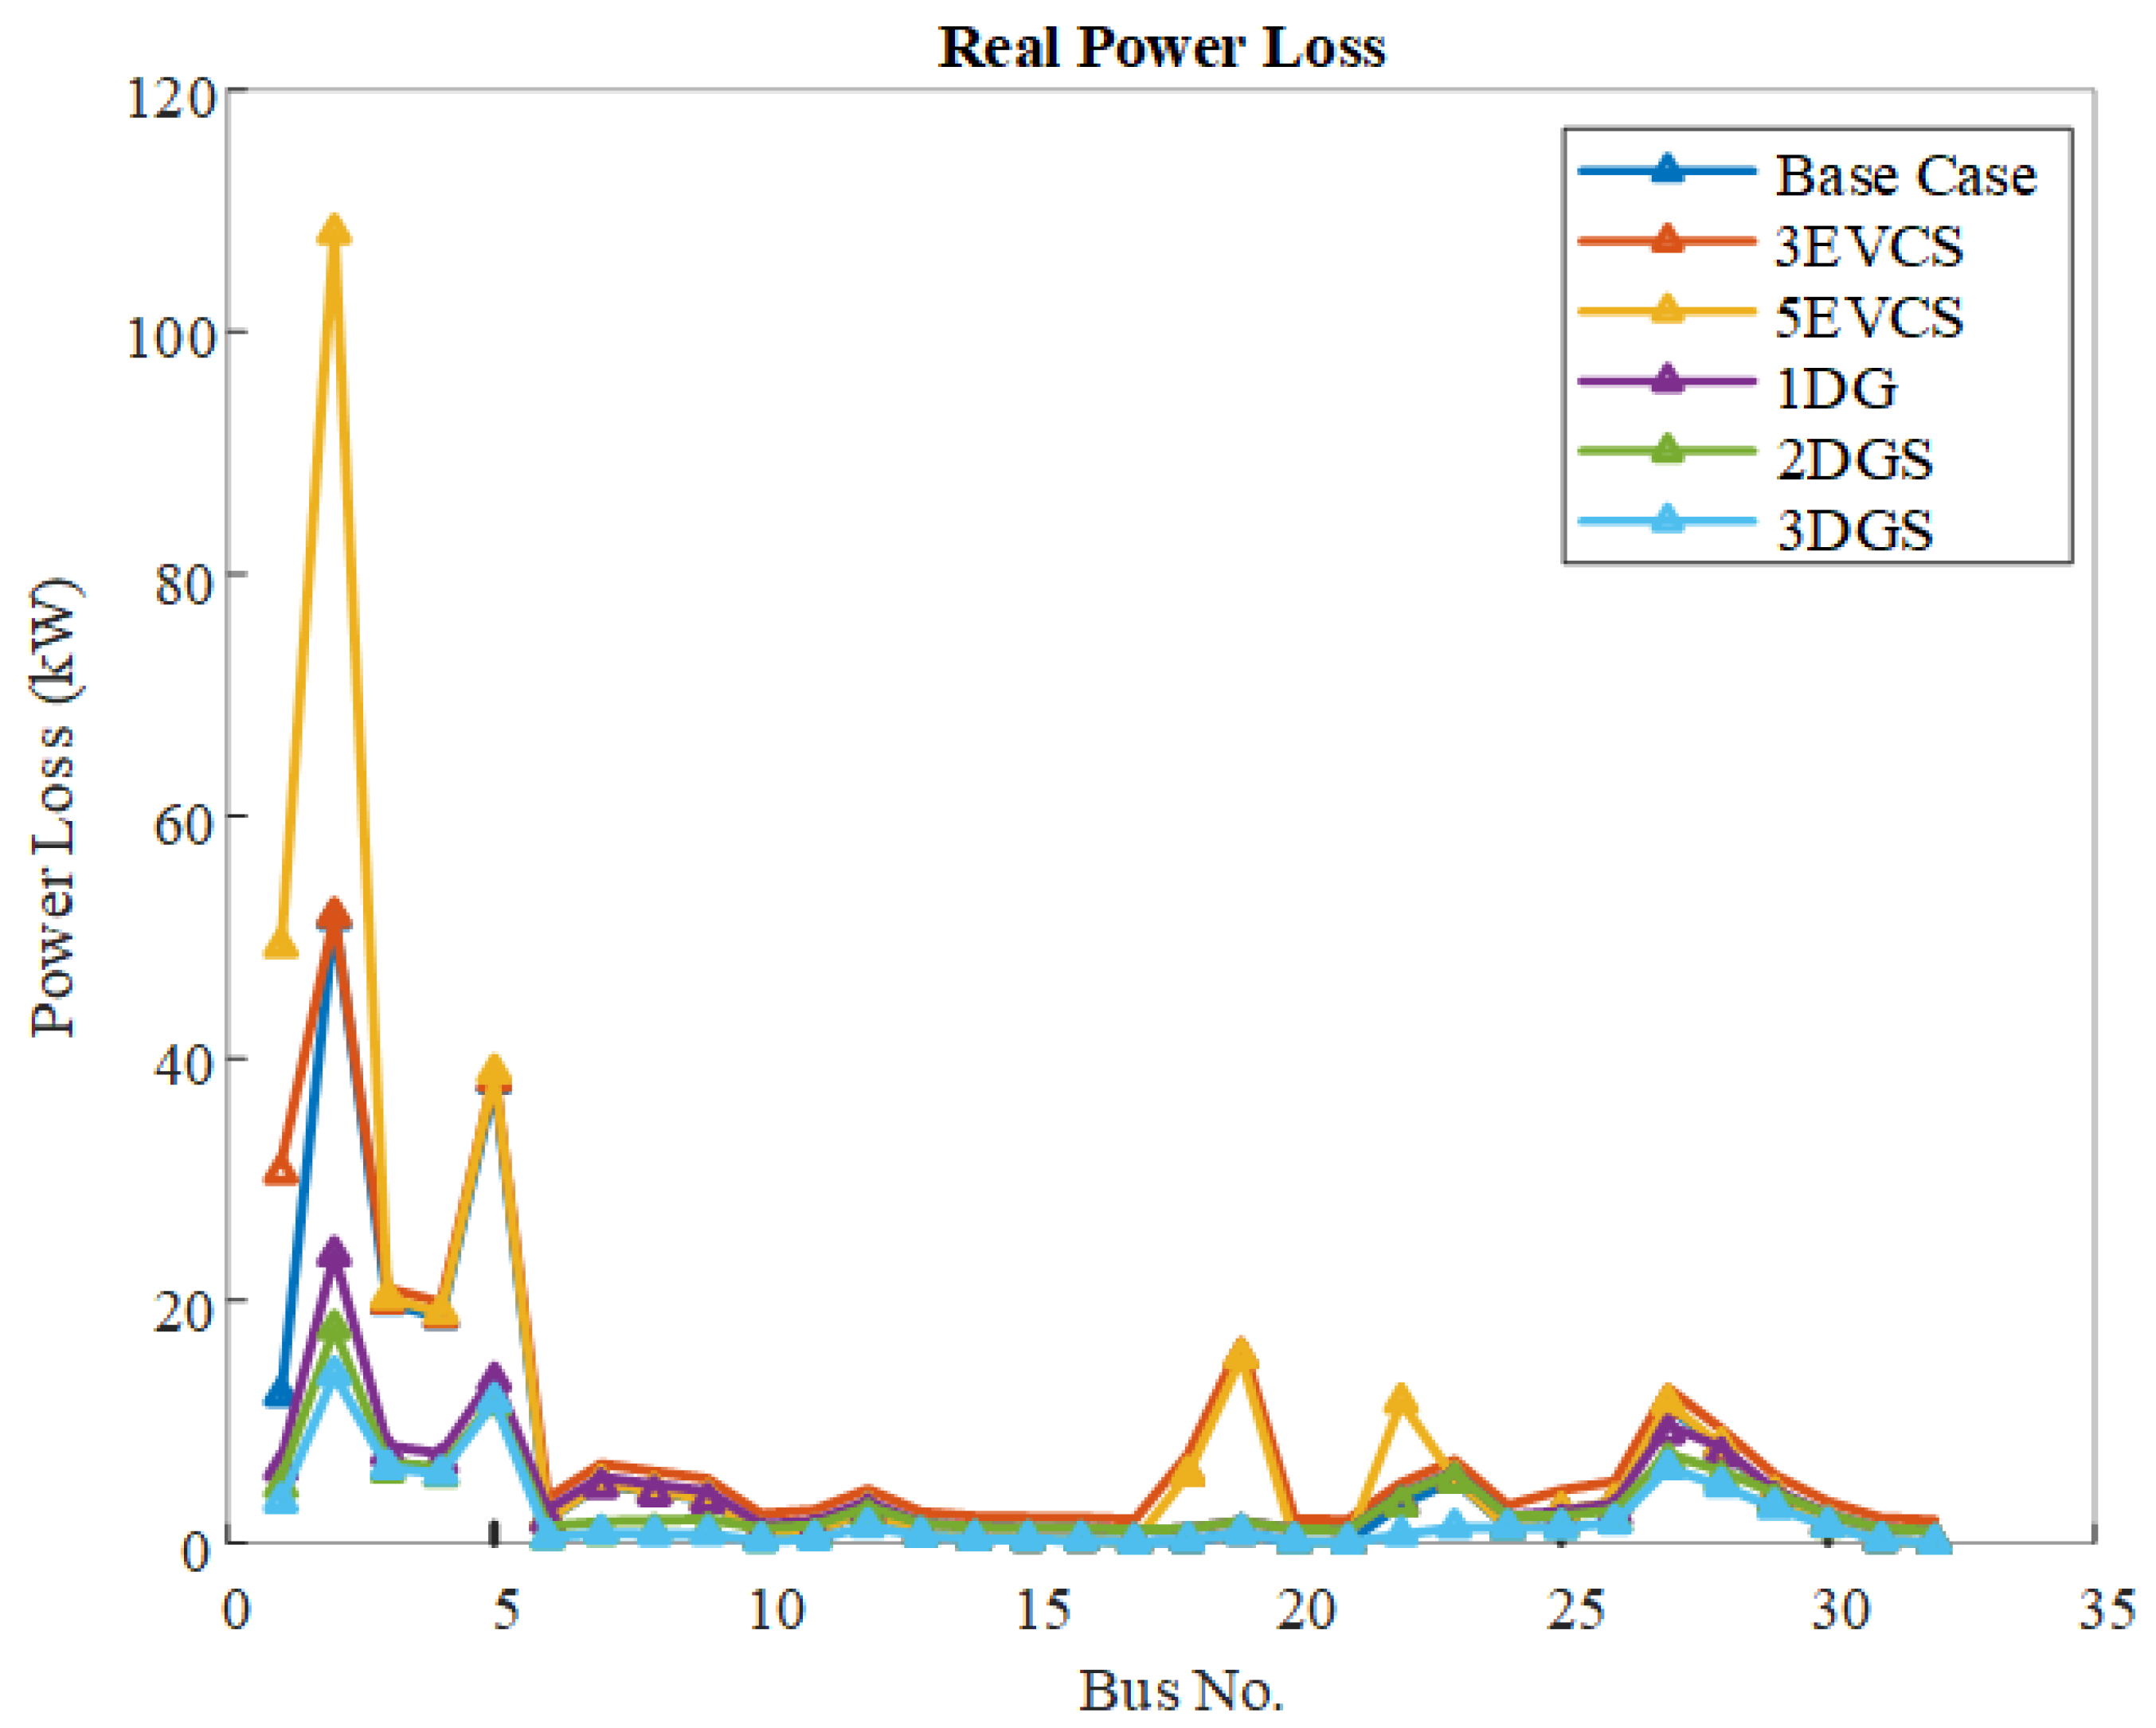
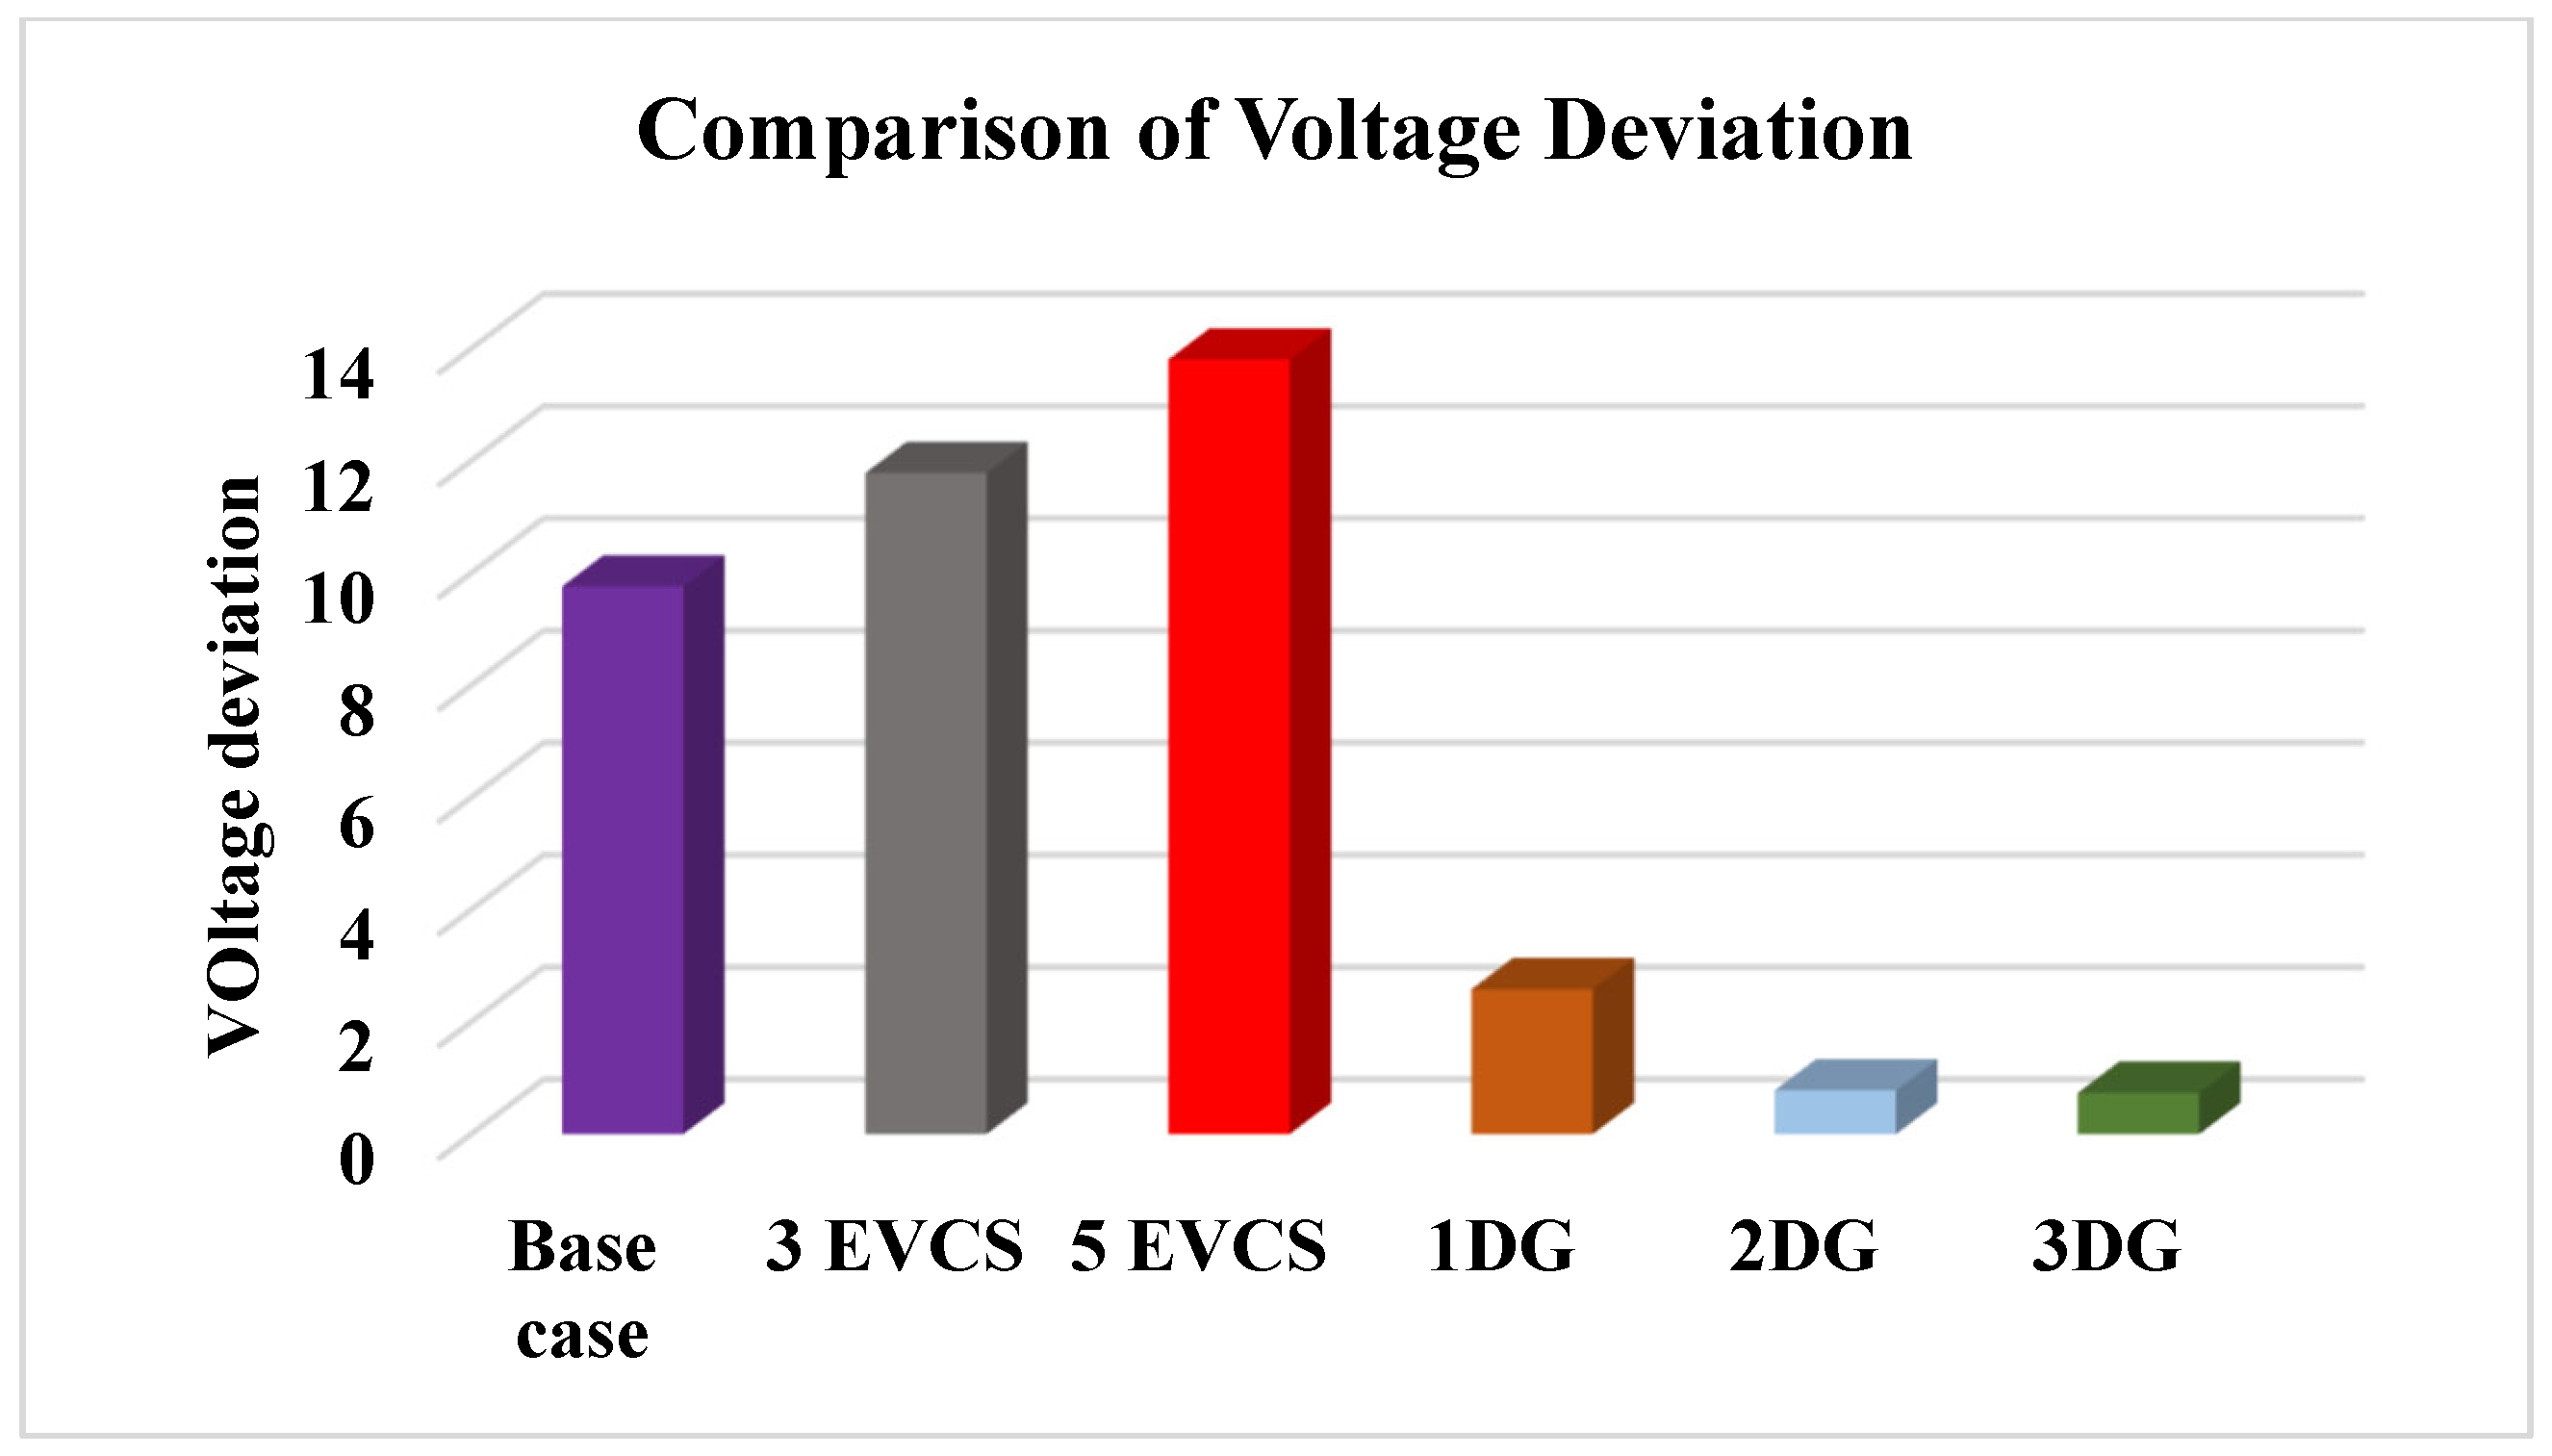
The integration of DGs at optimal locations enhances system voltage profile and reduces overall power losses. In contrast, the deployment of three fixed-capacity EVCSs at buses 2, 20, and 19 within the IEEE-33 bus distribution network results in an increase in real power losses to 240 kW, along with a corresponding rise in voltage deviation of12.376 p.u as illustrated in Figure 6. With the installation of five EVCSs at buses 3, 20, 23, 2, and 19, the real power losses further escalate to 326.911 kW, highlighting the additional stress imposed by increased charging demand with a voltage deviation of 15.338 p.u. To mitigate these losses, a single DG rated at 1500 kW is optimally placed at bus 29, reducing the losses to 112.523 kW and with a reduction in voltage deviation of 4.213 p.u is observed. Further improvement is achieved when two DGs are allocated one of 873 kW at bus 13 and another of 1212 kW at bus 30 resulting in a significant reduction in real power losses to 82.948 kW and a reduction of 1.083 p.u in voltage deviation. For three DGs optimally allocated at bus 30, 14, and 24 having sizes of 1094 KW, 771 KW, and 1096 KW, a further reduction in power losses is observed of 69.397 KW with a high reduction in voltage deviation of 1.013 p.u. These findings emphasize the critical role of coordinated DG placement in counteracting the adverse effects of EVCS integration on distribution network efficiency.
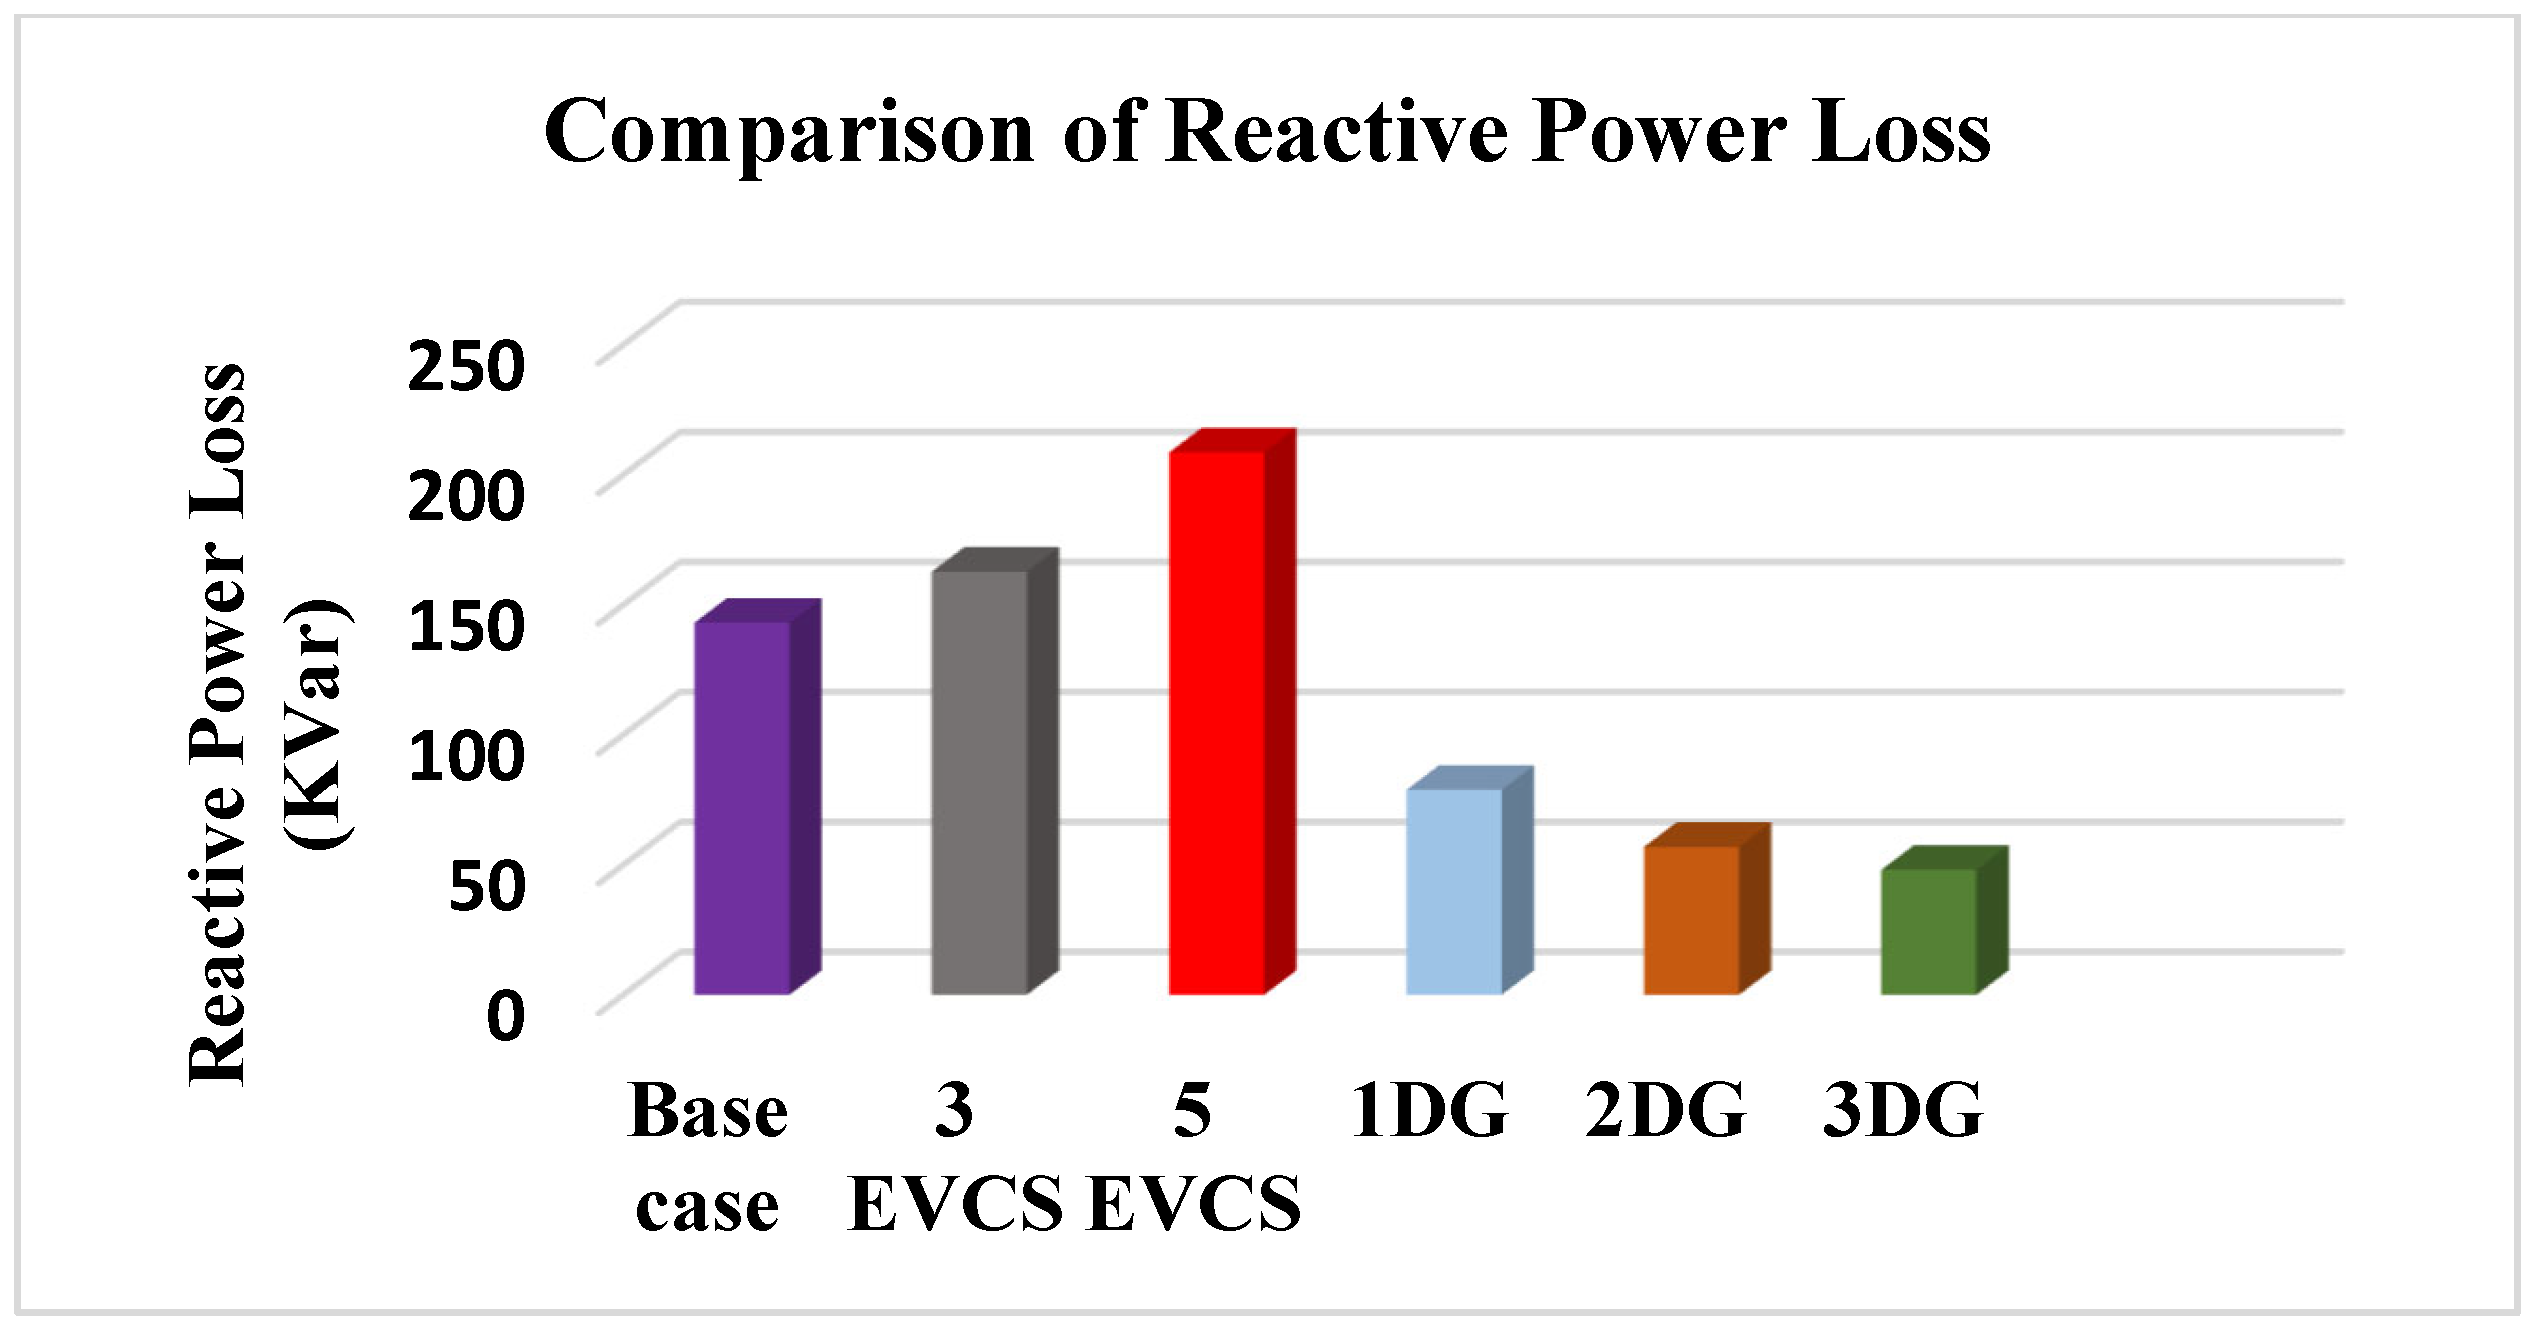
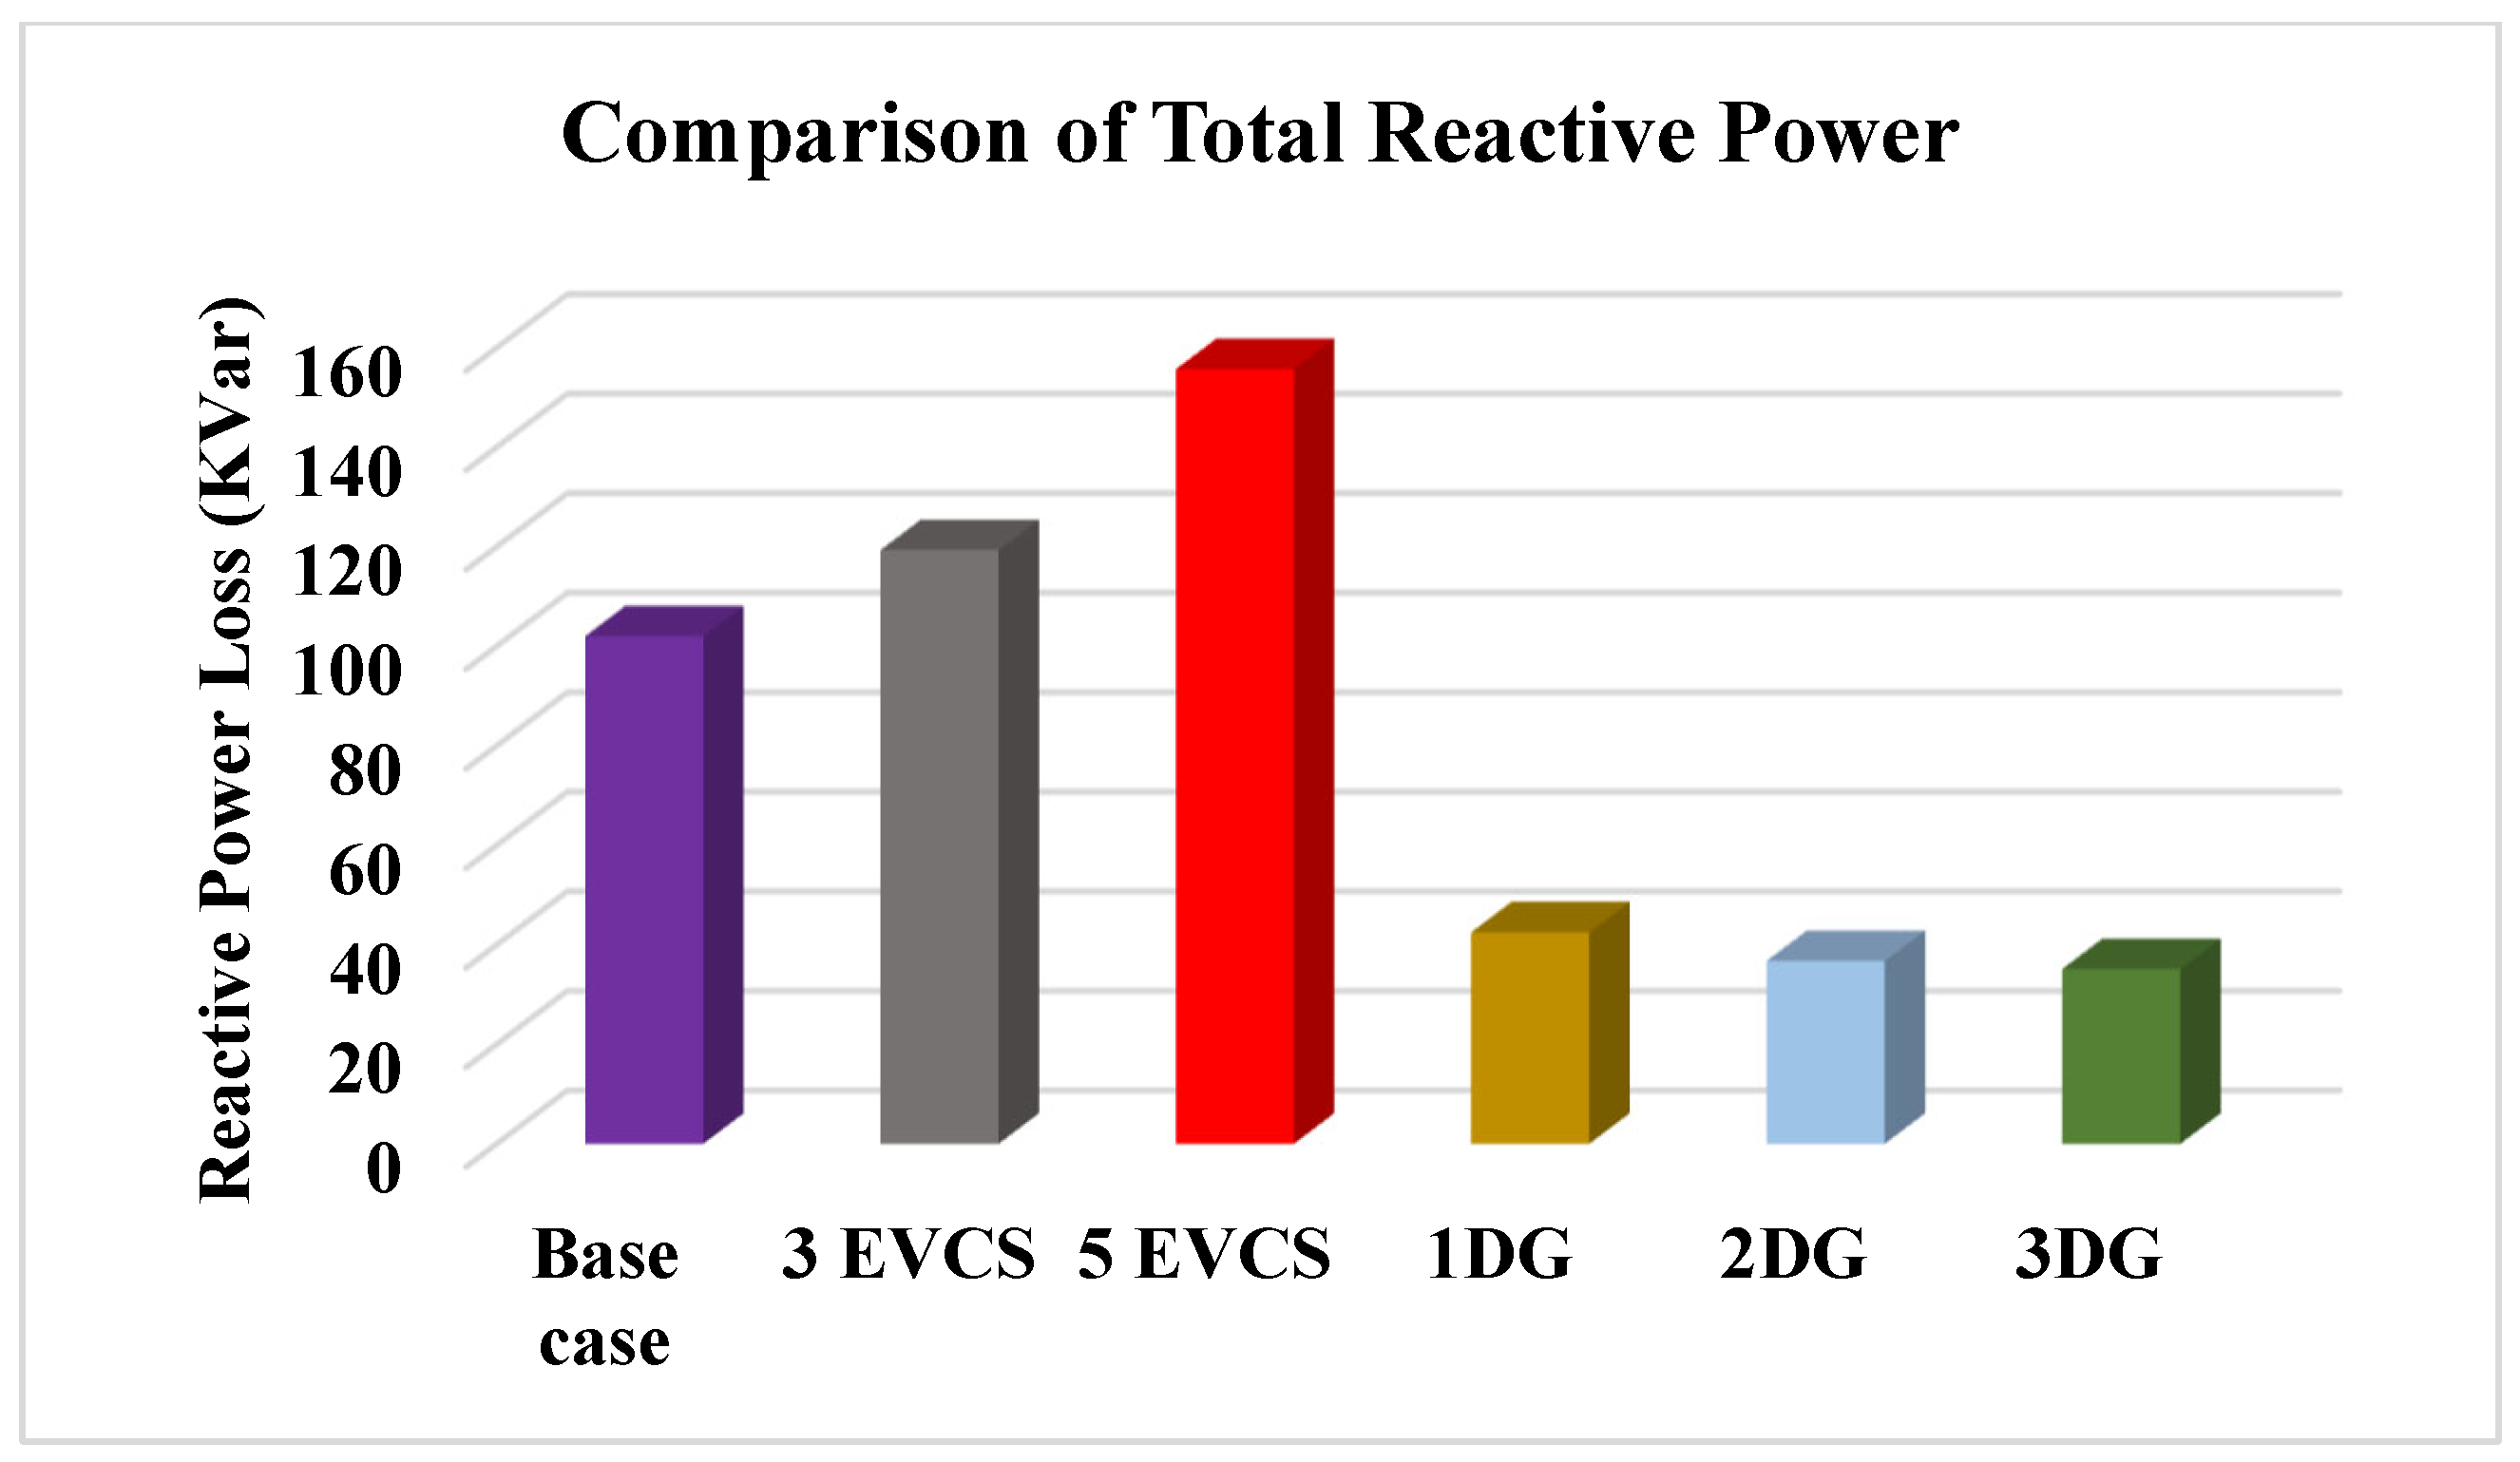
In the IEEE-33 bus distribution network, reactive power losses increase to 162.782 kVar when EVCSs are optimally placed at buses 2, 20, and 19. When the number of EVCSs rises to five, located at buses 3, 20, 23, 2, and 19, reactive power losses further increase to 208.602 kVar. To mitigate these losses and ensure smooth charging for electric vehicle users, DGs are introduced in the network.
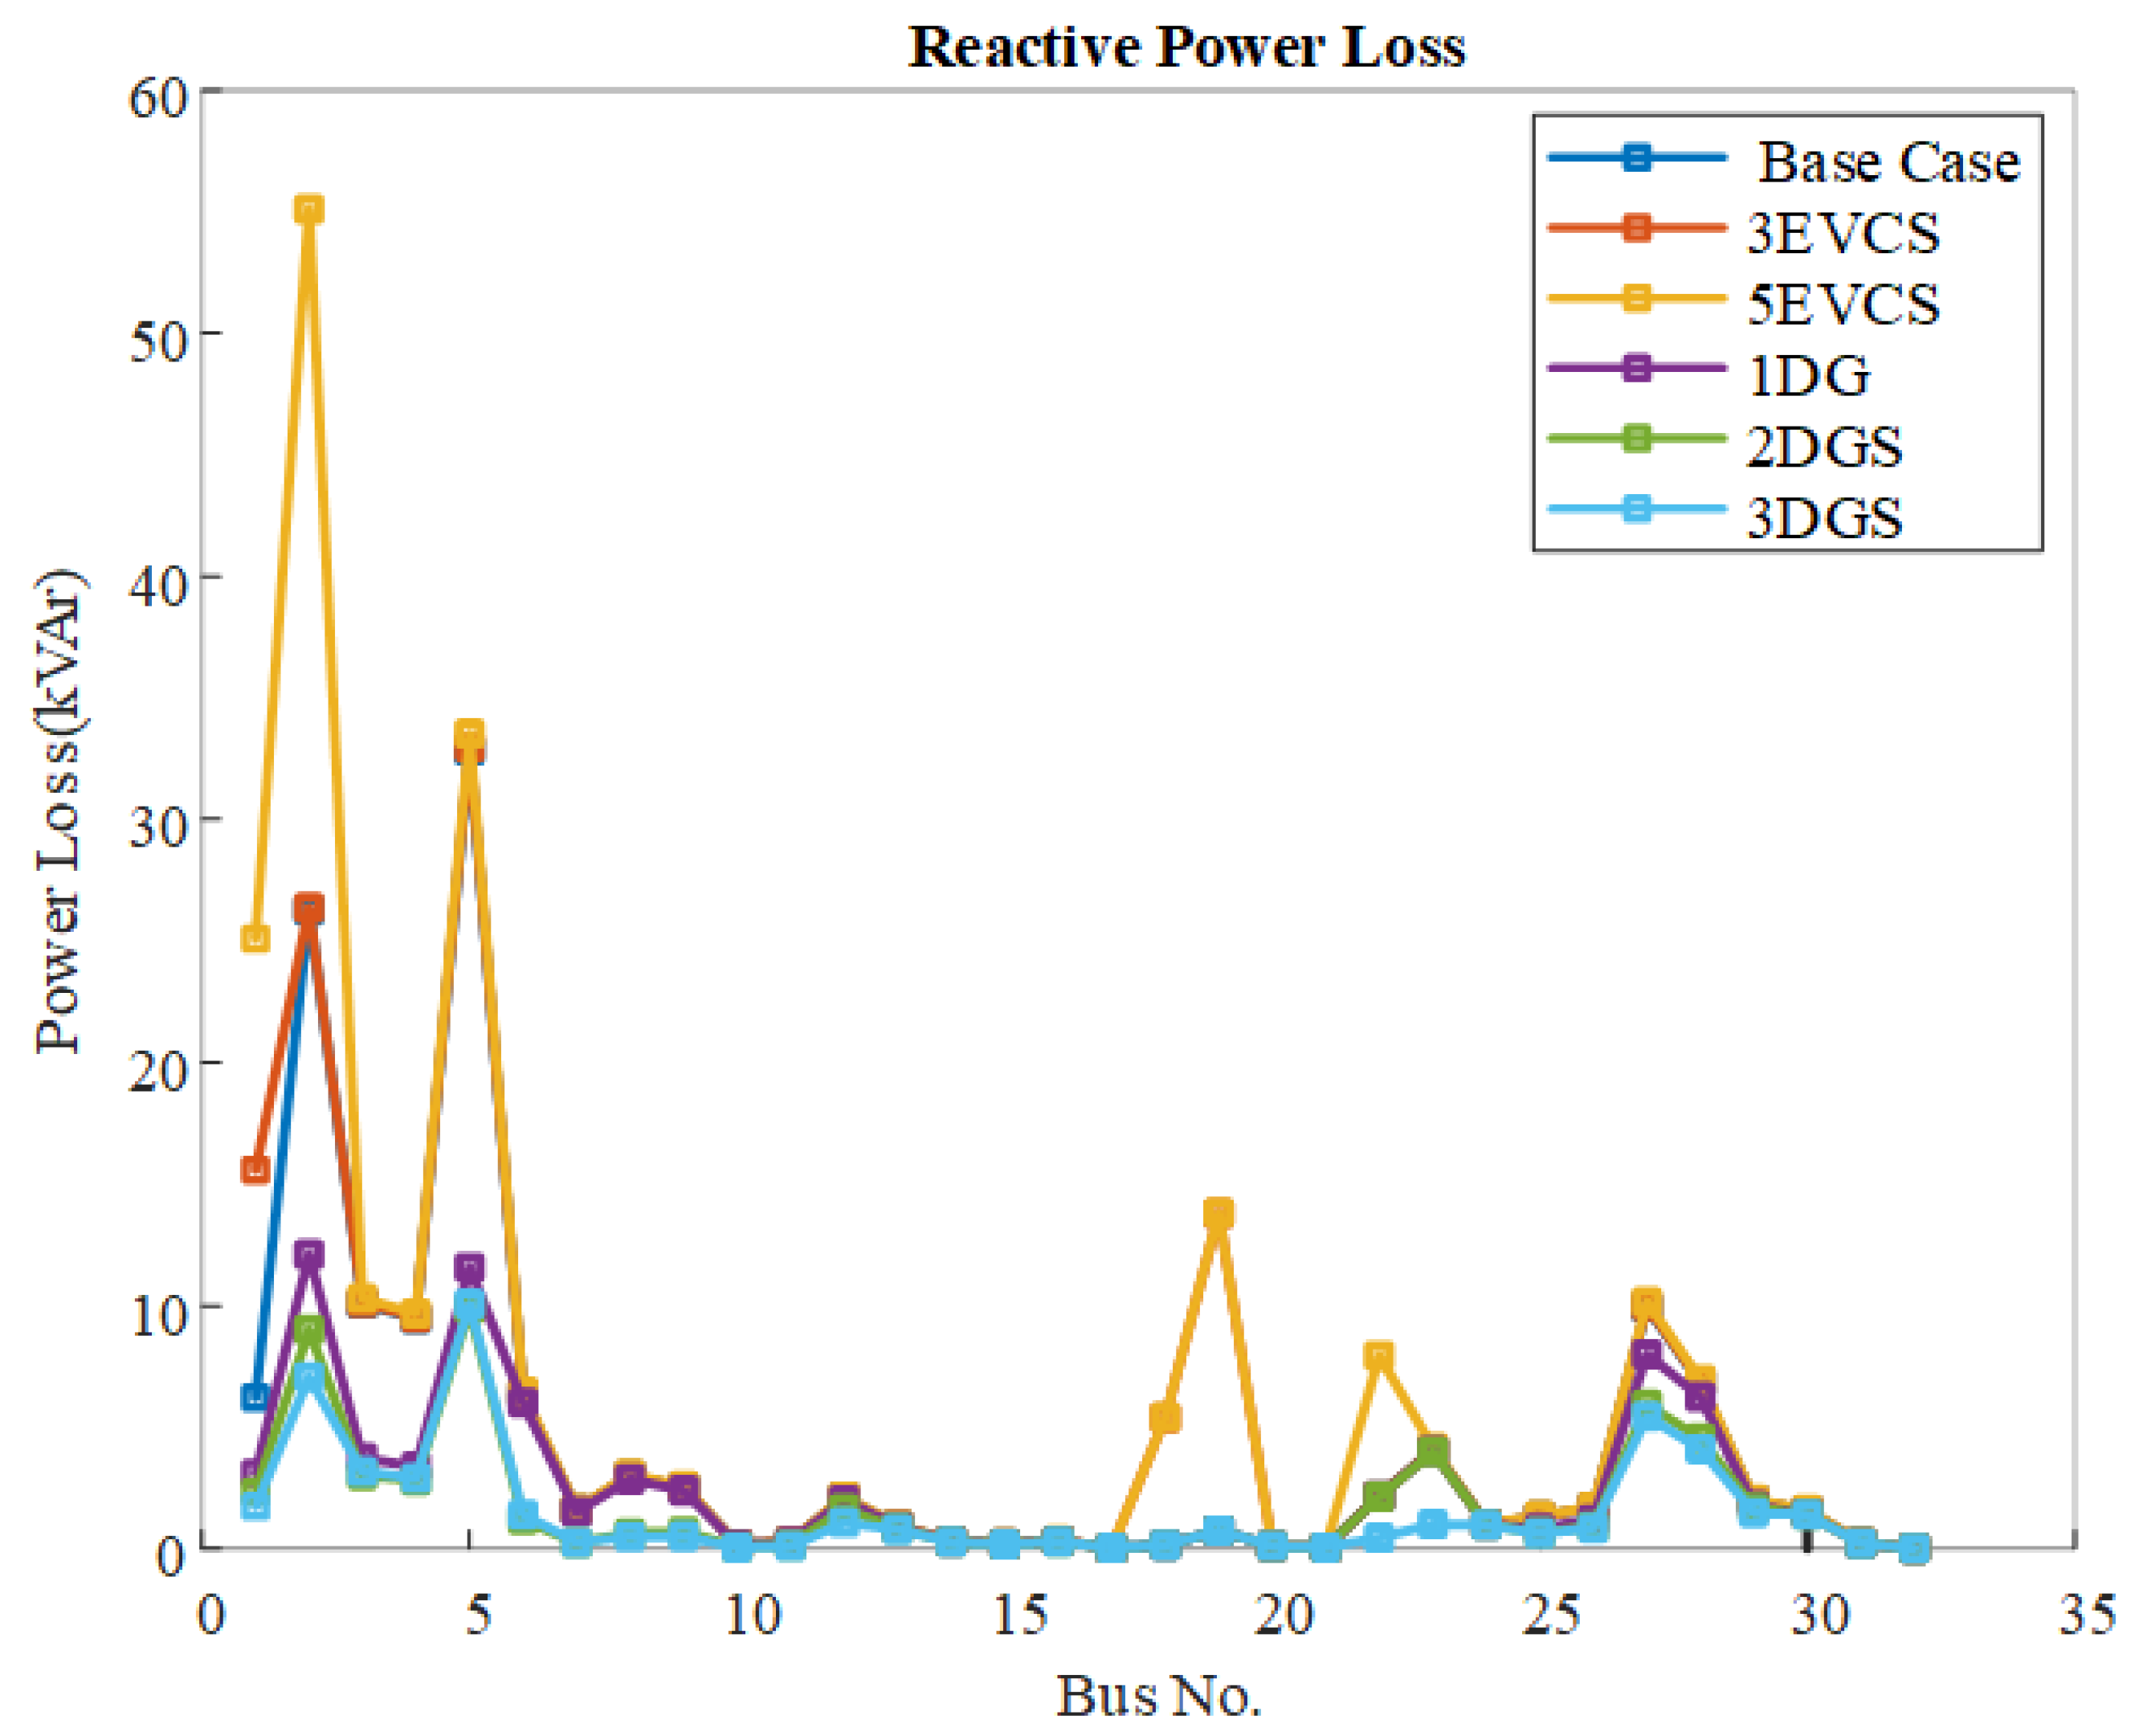
Installing one DG at bus 29 with a capacity of 1500 kW reduces reactive power losses to 78.861 kVar. Alternatively, placing two DGs with capacities of 873 kW and 1212 kW at buses 13 and 30, respectively, further decreases the reactive power losses to 56.902 kVar while placing three DGs with the capacities of 1094 KW, 770 KW, and 1096 KW at bus 30, 14, and 24 further reduces reactive power losses by up to 48.086 Kvar as shown in Figure 7.
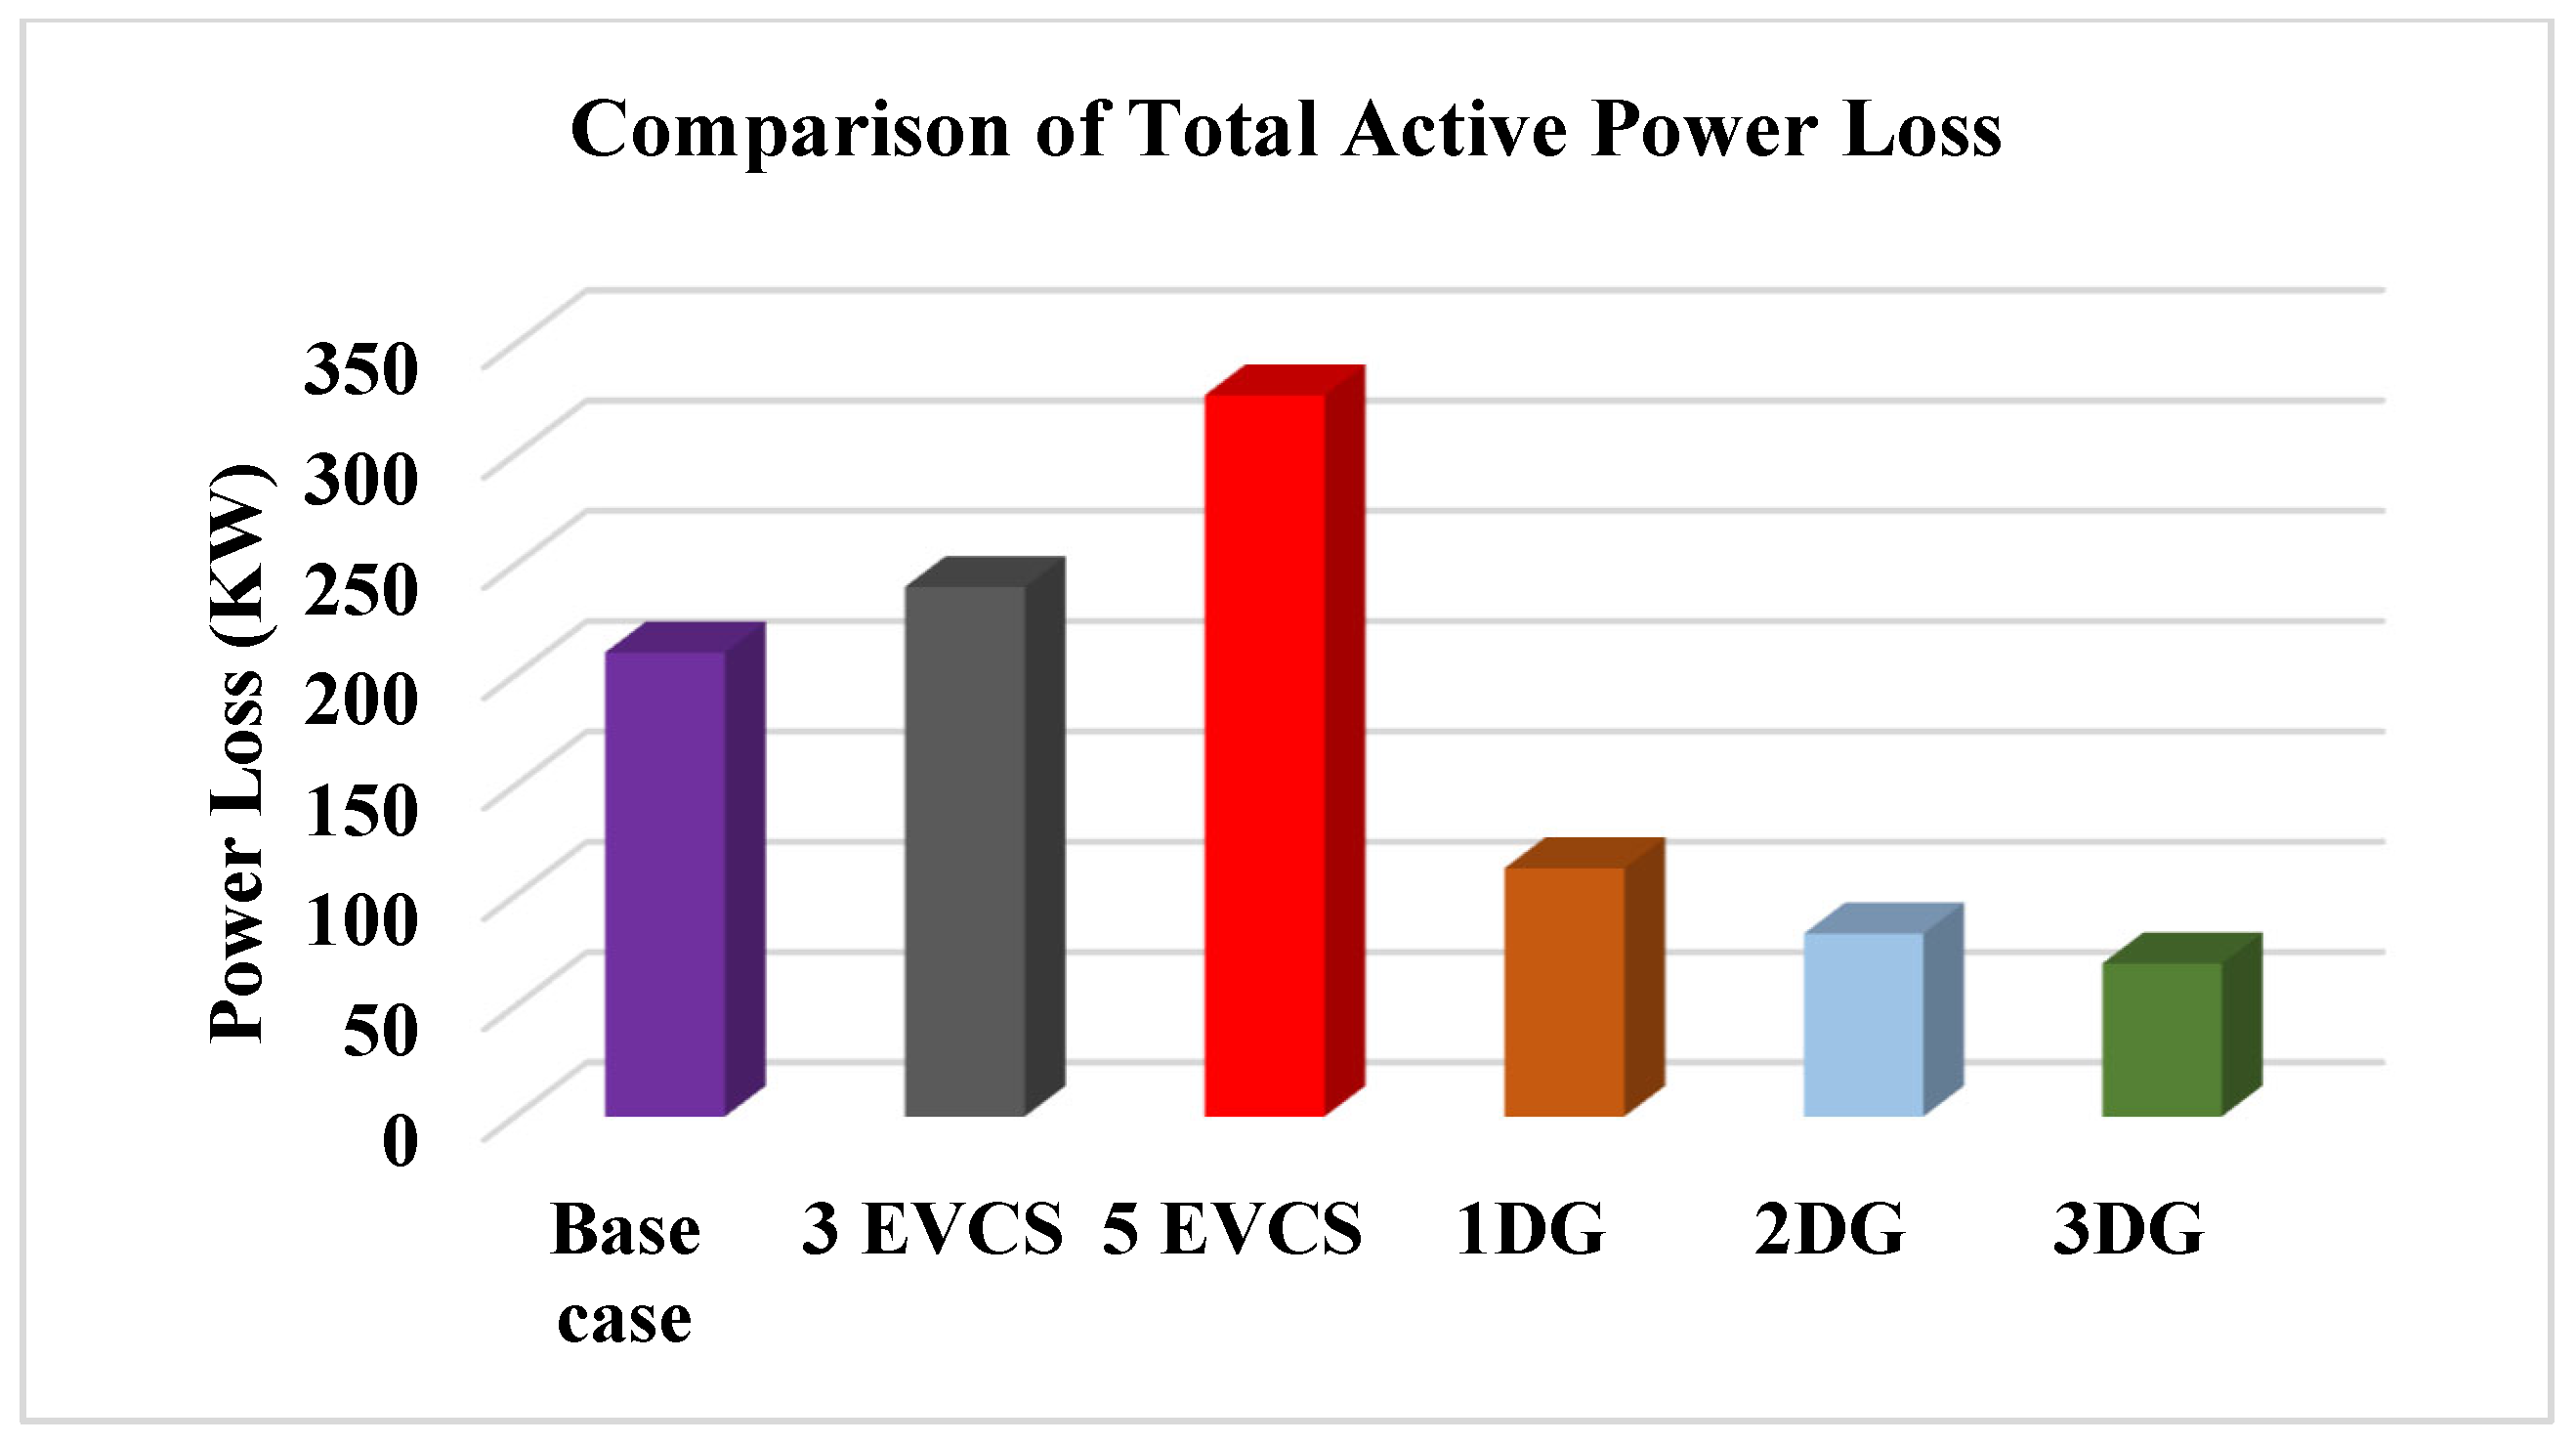
Table 2 illustrates the real and reactive power losses in the IEEE-33 bus distribution network following the optimal placement of EVCSs and DGs. The data shows that active power losses rise to 326.911 kW and reactive power losses to 208.602 kVar after optimally allocating EVCSs.
However, after incorporating DGs, the active power losses decrease to 69.397 kW, and reactive power losses drop to 48.086 kVar. Figure 8, Figure 9 and Figure 10 show the comparison and variation in power losses and voltage deviation obtained during the course of the simulation by optimally placing the EVCSs and DGs in RDS. The reported voltage deviation (VD) values represent the cumulative sum of per-unit deviations (∑|Vi − 1|) across all buses; hence, they are dimensionless aggregate indices rather than individual bus voltage magnitudes. Figure 11 shows the voltage improvement following the ideal placement of EVCSs and DGs.
According to the proposed methodology, optimally placing one DG reduces real and reactive power losses by 46.4948% and 44.9064, respectively. Deploying two DGs further decreases real and reactive power losses by 60.5579% and 60.2473, while in case of three DGs, reduces the real and reactive power losses by 67.0014% and 66.4063%.
Table 3 presents a comparative analysis of power loss reductions achieved through GLAD-ABC versus other optimization methods, including genetic algorithm (GA), simulated annealing (SA), fireworks algorithm (FWA), modified teaching–learning-based optimization (MTLBO), JAYA, grey wolf optimization (GWO), coyote and enhanced optimization algorithm (COA and ECOA), modified version influenza model-based optimization (SIMBO-Q), analytical algorithm (AA), Harris hawks optimization (HHO), and arithmetic optimization (AA). The results indicate that GLAD-ABC achieves a power loss reduction from 210.303 KW to 69.397 KW. The lowest power loss is obtained with GLAD-ABC as compared to other optimization algorithms as mentioned in the literature.
Additionally, GLAD-ABC demonstrates superior computational efficiency, requiring less processing time and offering greater flexibility compared to the other optimization techniques. In percentage terms, the proposed GLAD-ABC achieves the following improvements: 12.06% over GA; 61.07% over SA; 22.46% over AM; 21.74% over FWA; 13.49% over MTLBO; 9.47% over JAYA; 6.34 over GWO; 8.68% over COA; 6.97% over ECOA; 5.45% over SIMBO-Q; 4.79% over AA; 4.67% over HHO; and 4.66% over SPBO and AOA.
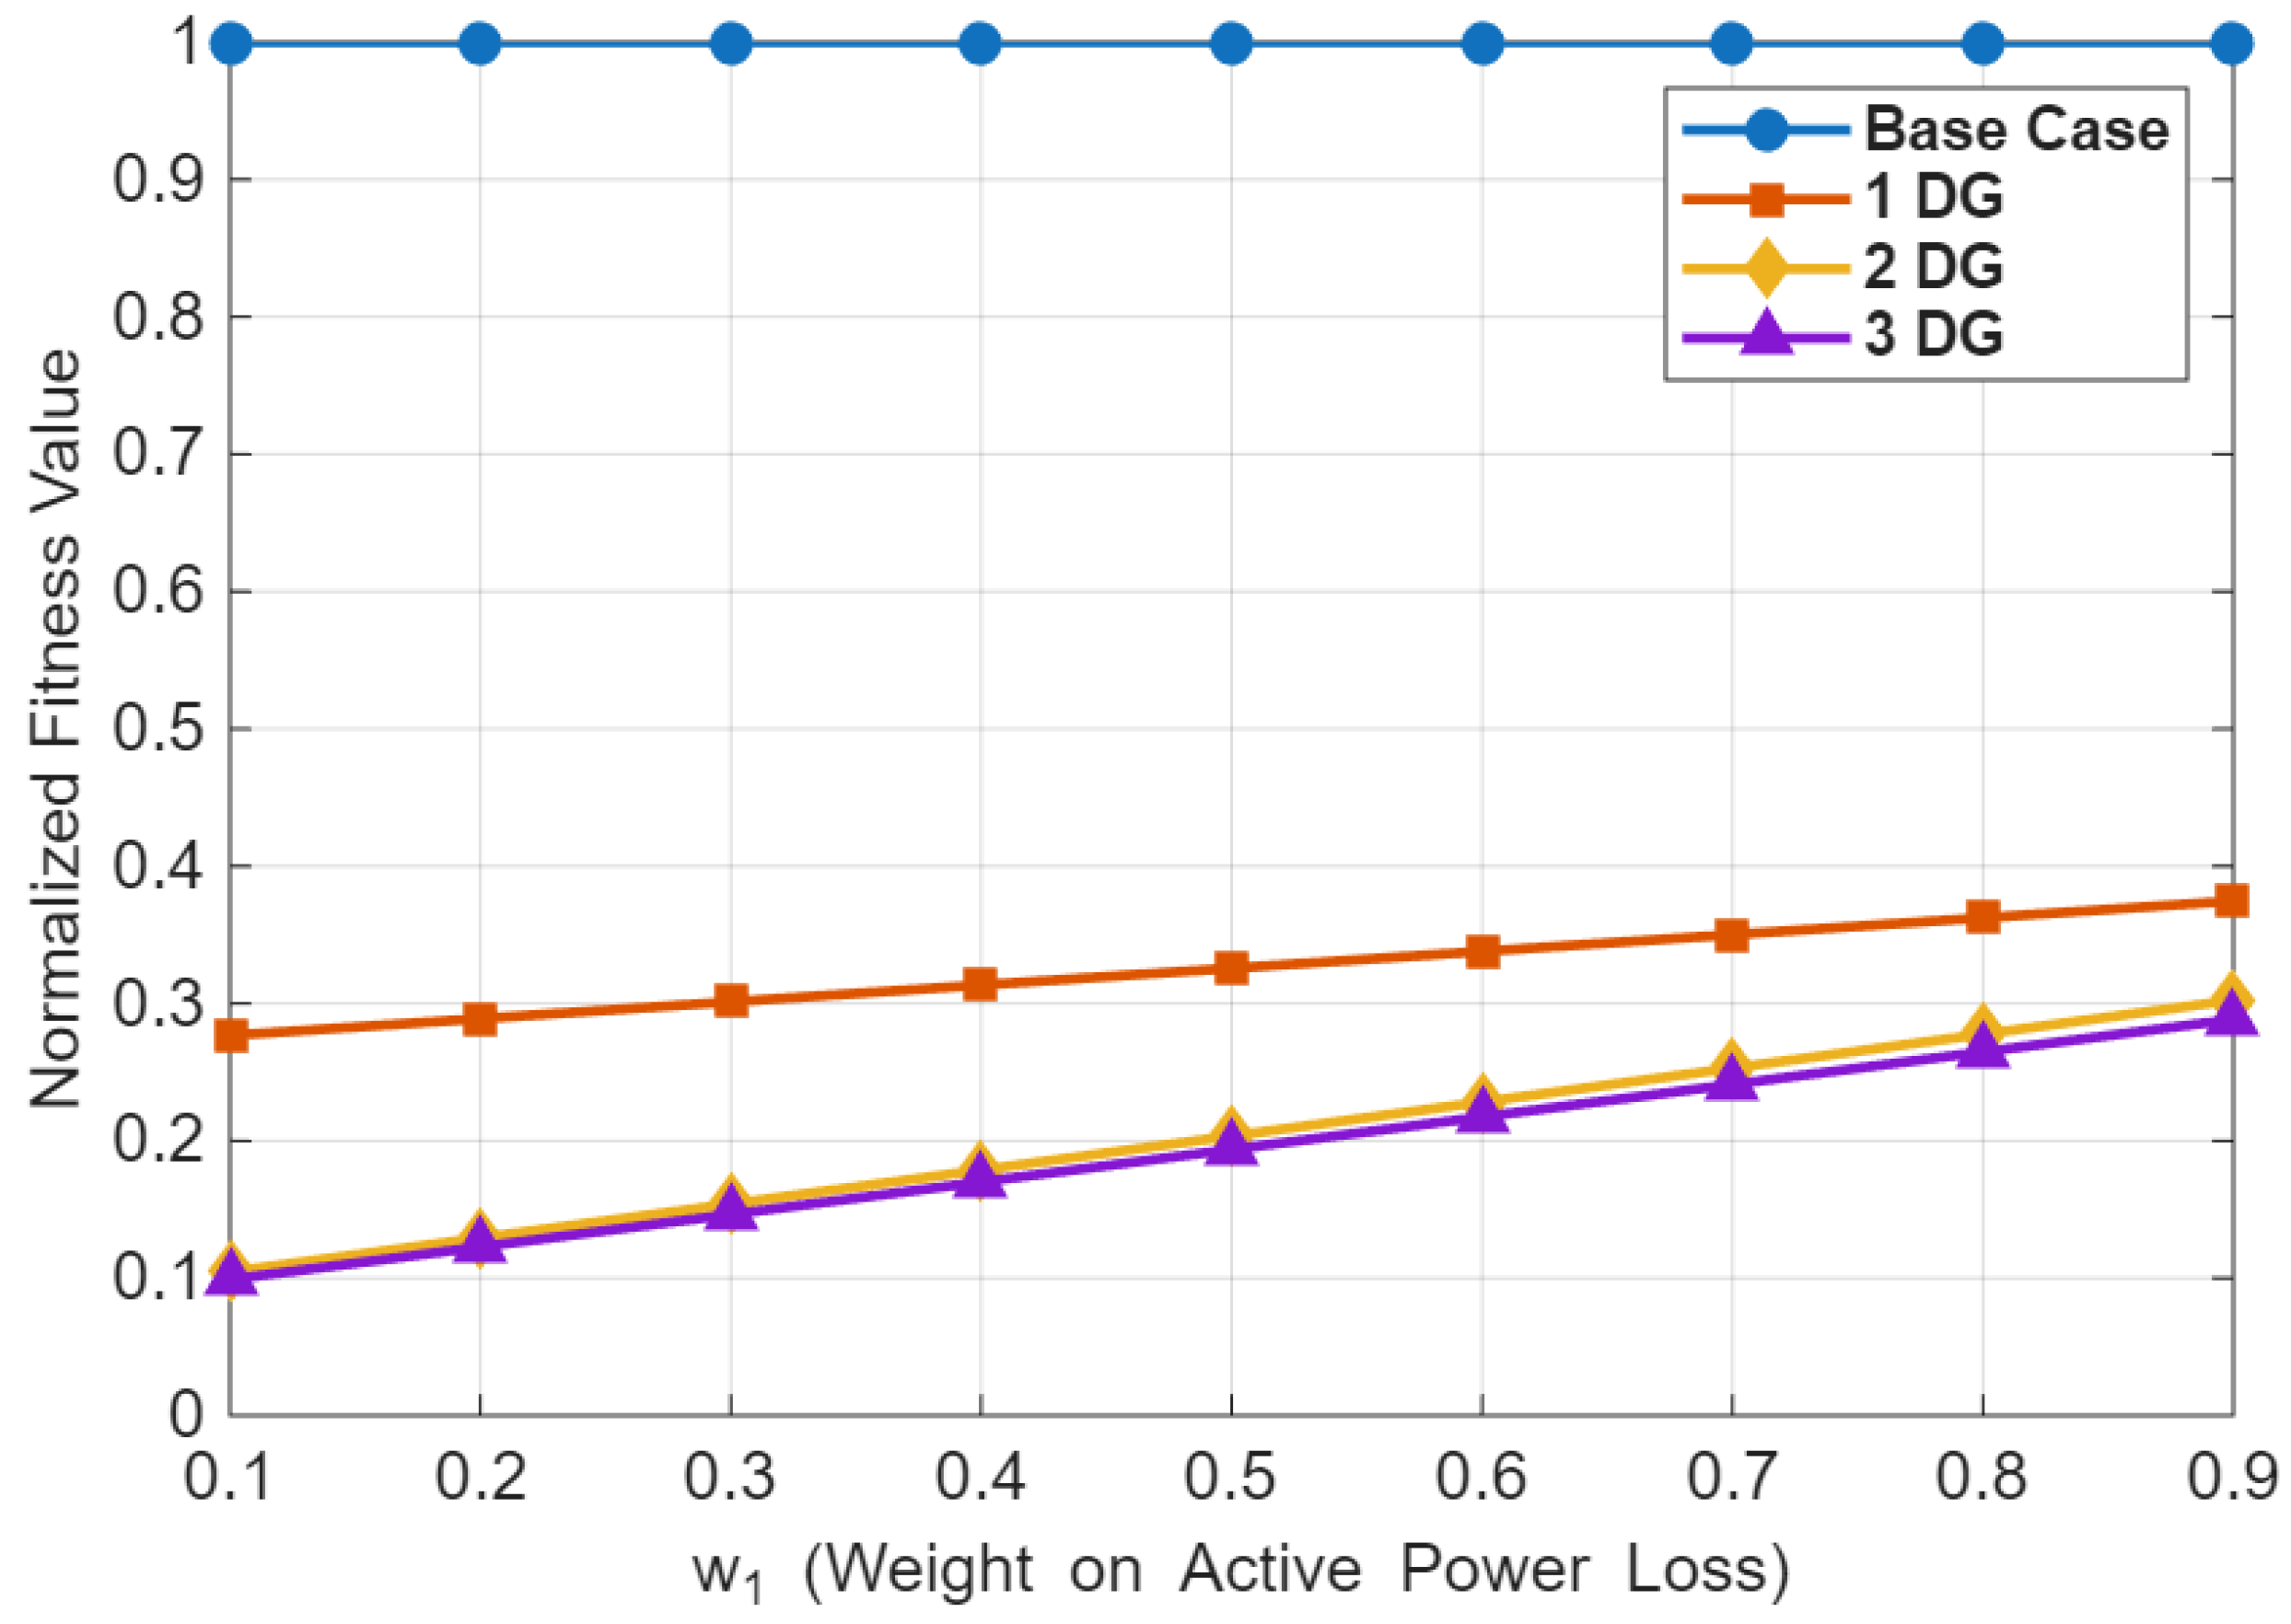
To further assess robustness, a sensitivity analysis was performed for the weighting w1 factor varying from 0.1 to 0.9. The results shown in Figure 12 demonstrate that the normalized fitness value decreases consistently as the number of DGs increases.
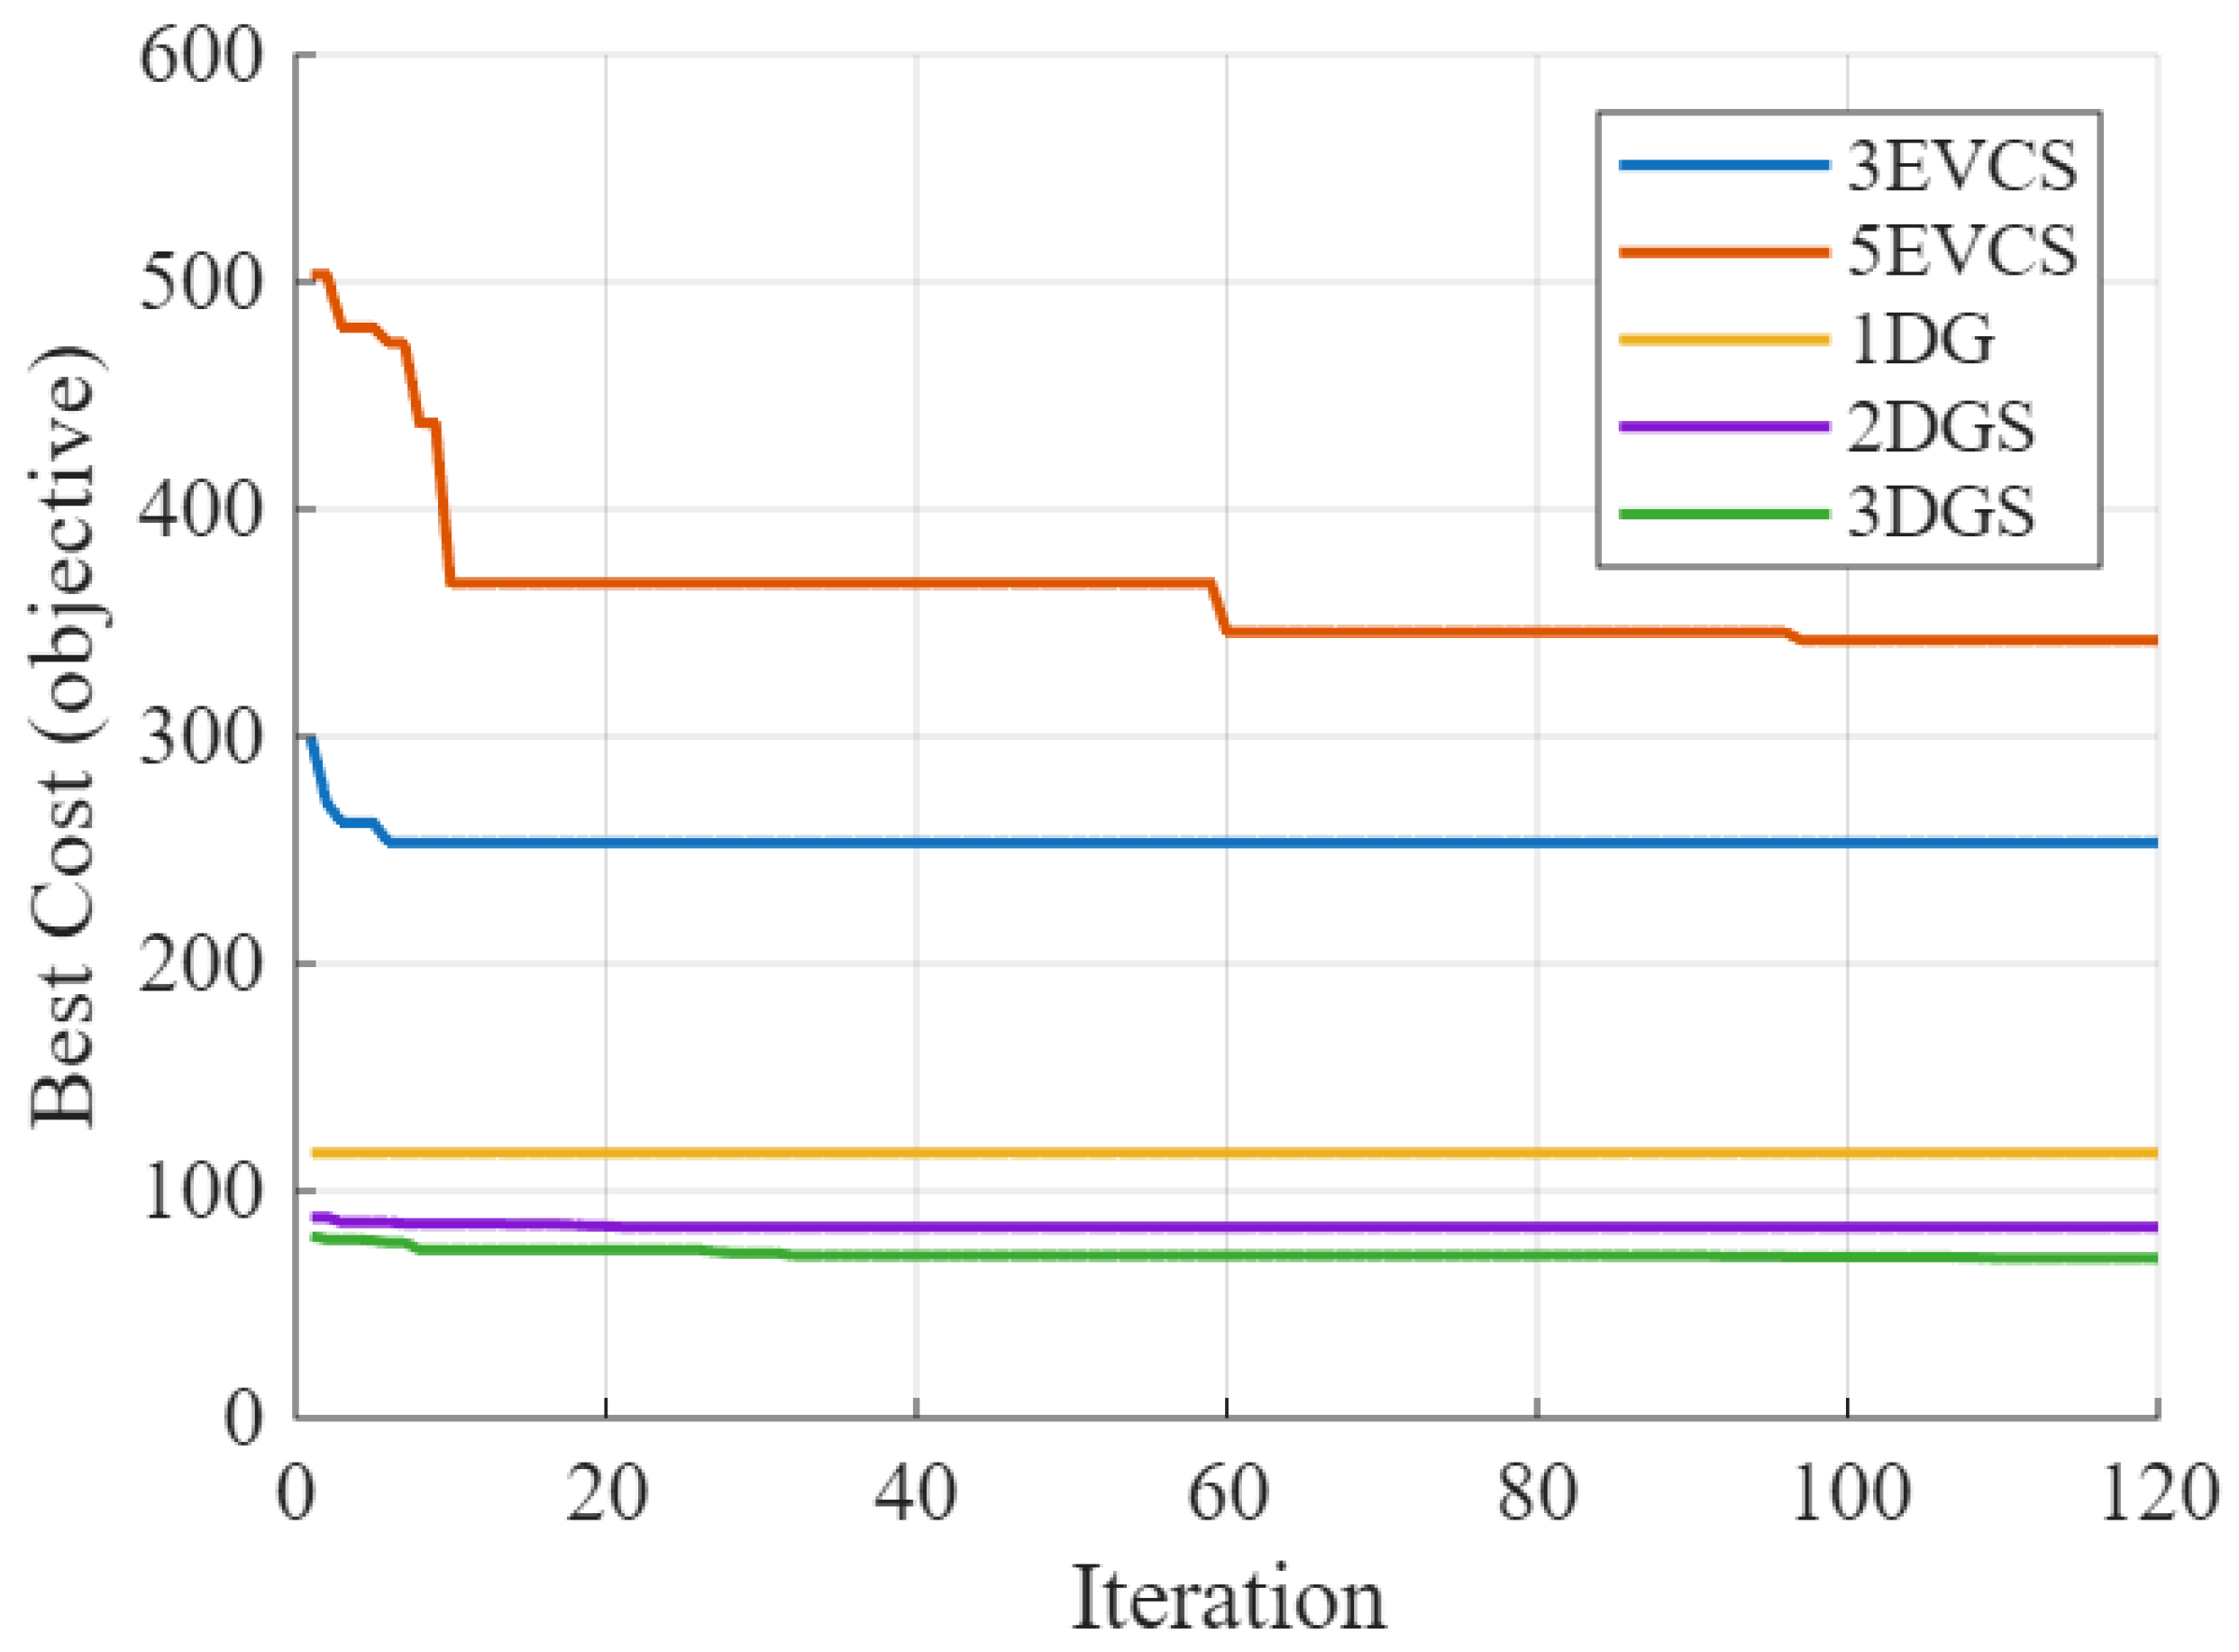
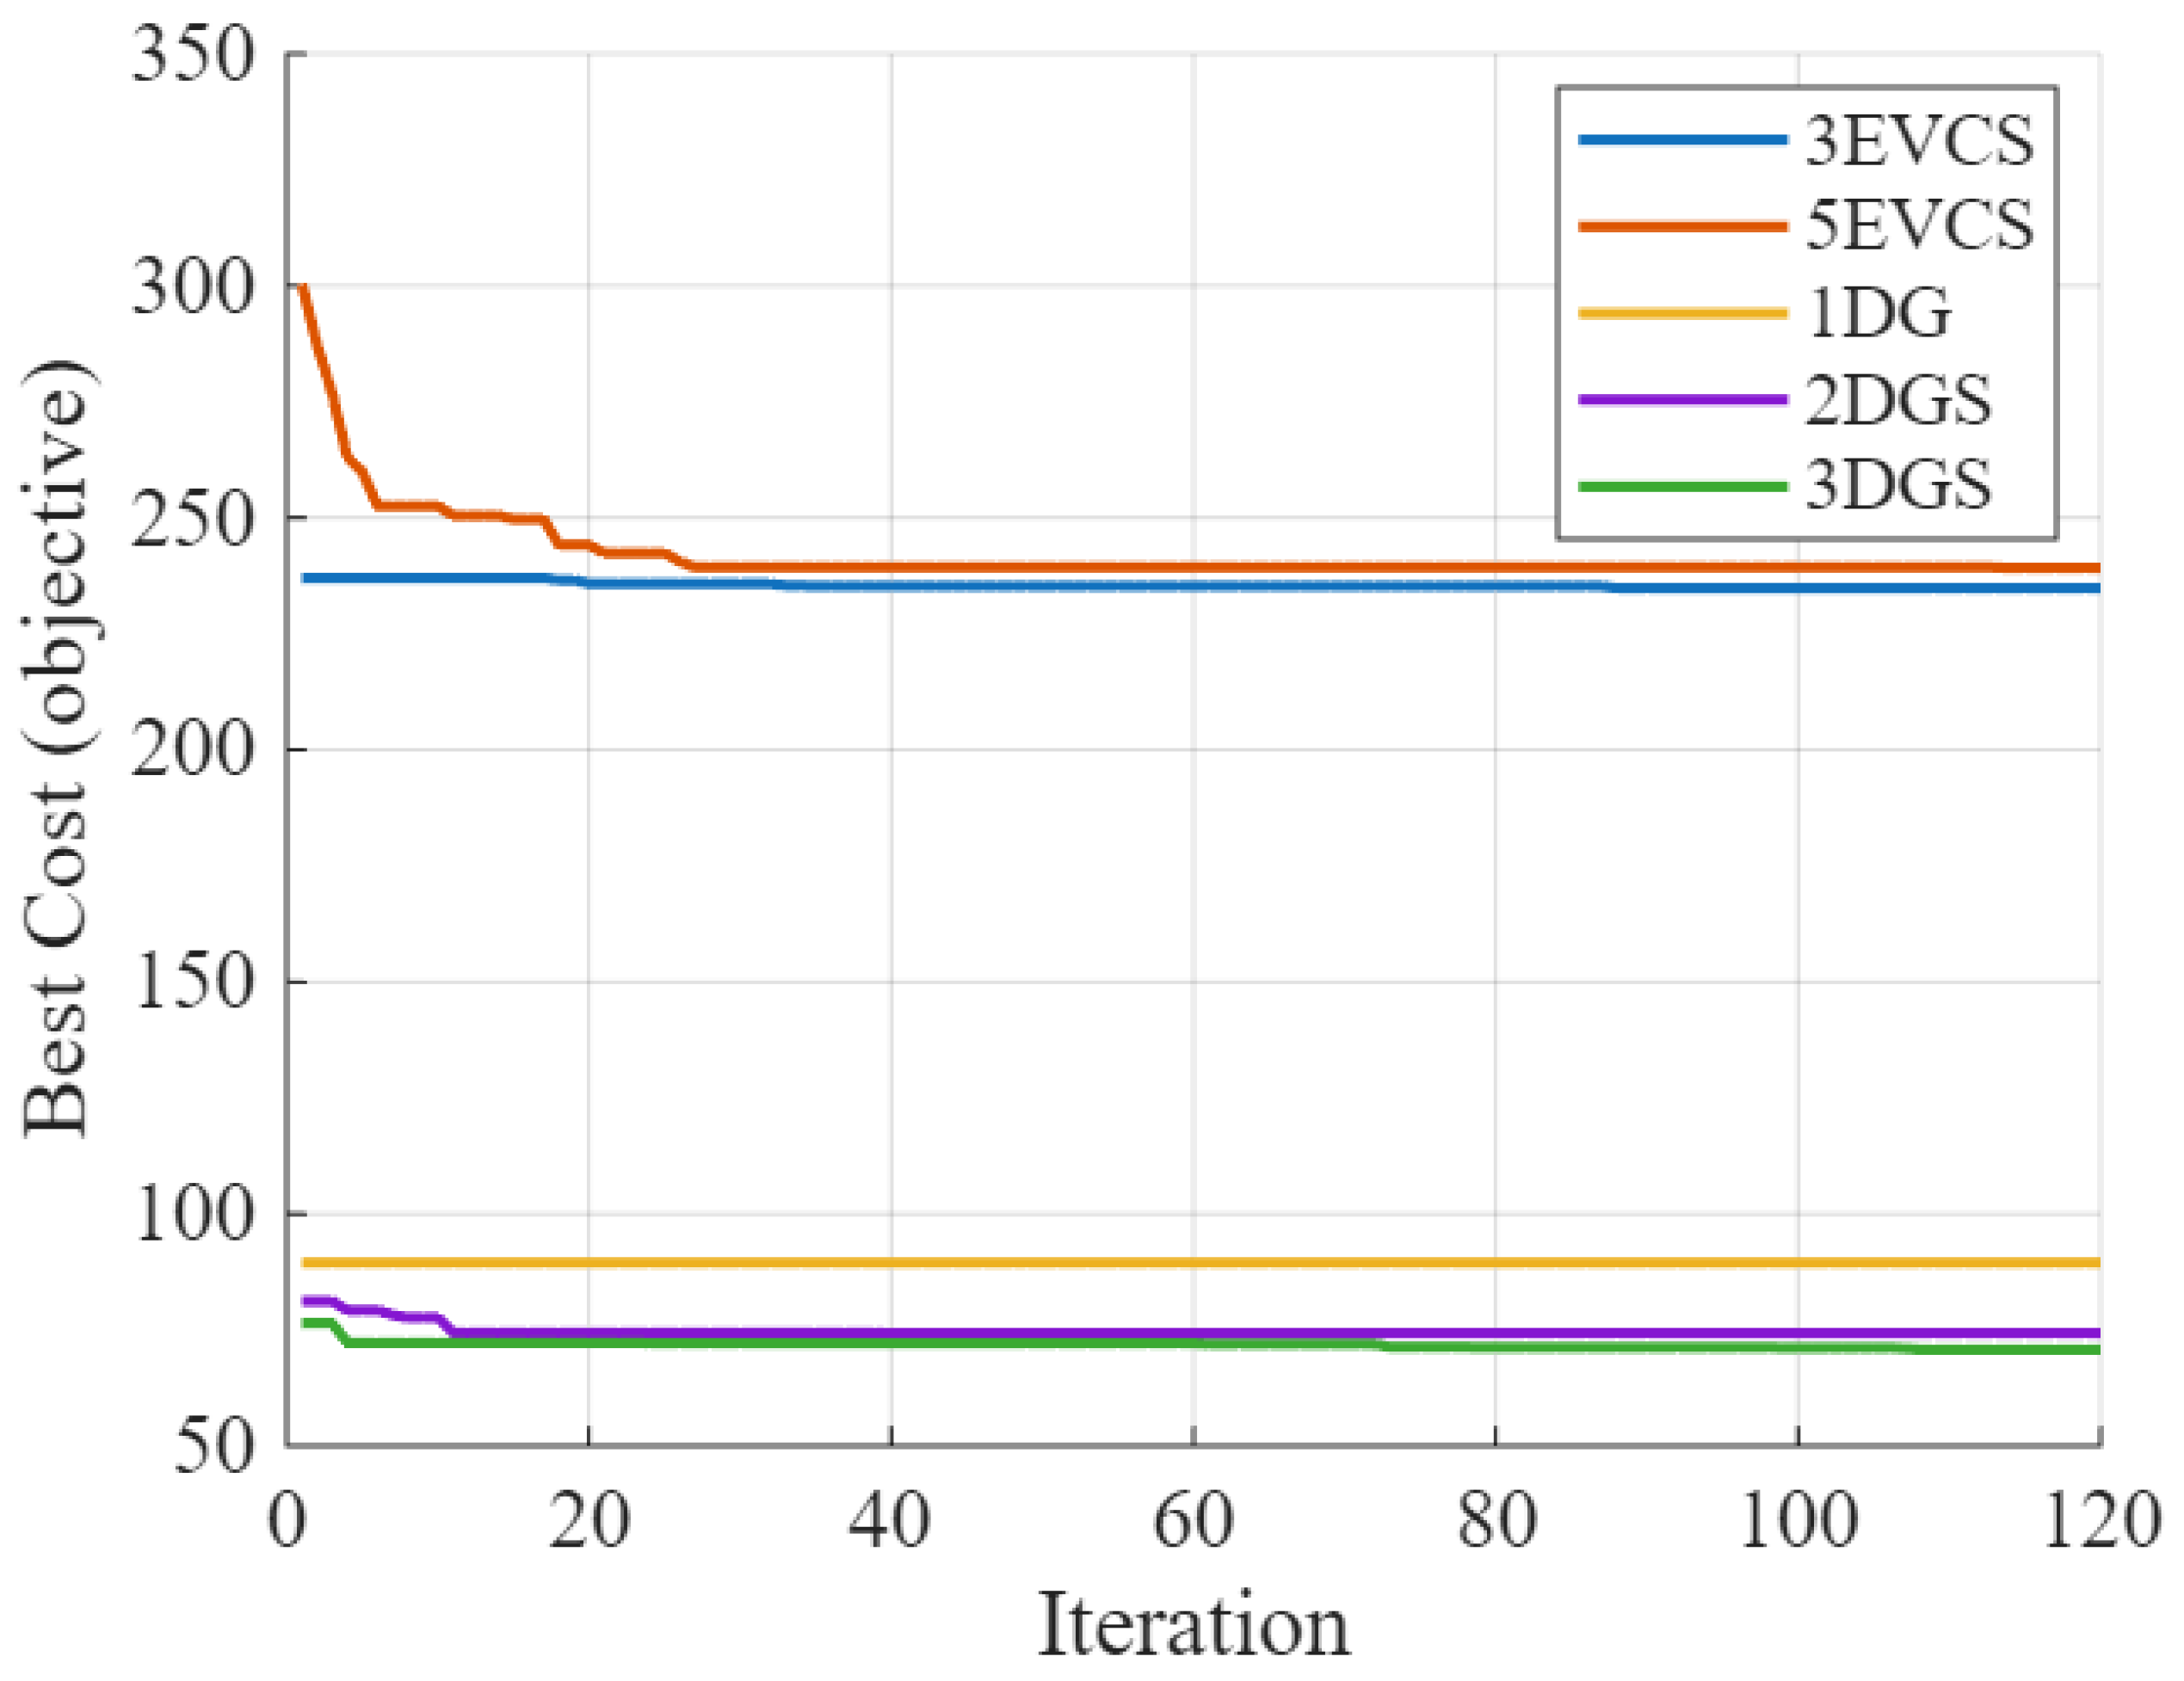
The base case exhibits the highest normalized fitness (1.0), followed by 1-DG (0.38), 2-DG (0.19), and 3-DG (0.12) configurations. This corresponds to an ≈88% improvement over the base configuration and confirms the robustness of the GLAD-ABC approach in maintaining optimal performance under varying trade-off priorities between active power loss and voltage deviation. The convergence graphs obtained for all six operational case studies are presented in Figure 13.
It is observed that the proposed algorithm achieves the lowest (best) cost value in the case with two DGs followed by the case with two DGs, and subsequently by the remaining scenarios. The three DG configuration not only attains the minimum objective value but also demonstrates faster and more stable convergence behavior, indicating a better exploration–exploitation balance and higher overall optimization efficiency.

5.2. Results of IEEE-69 RDS

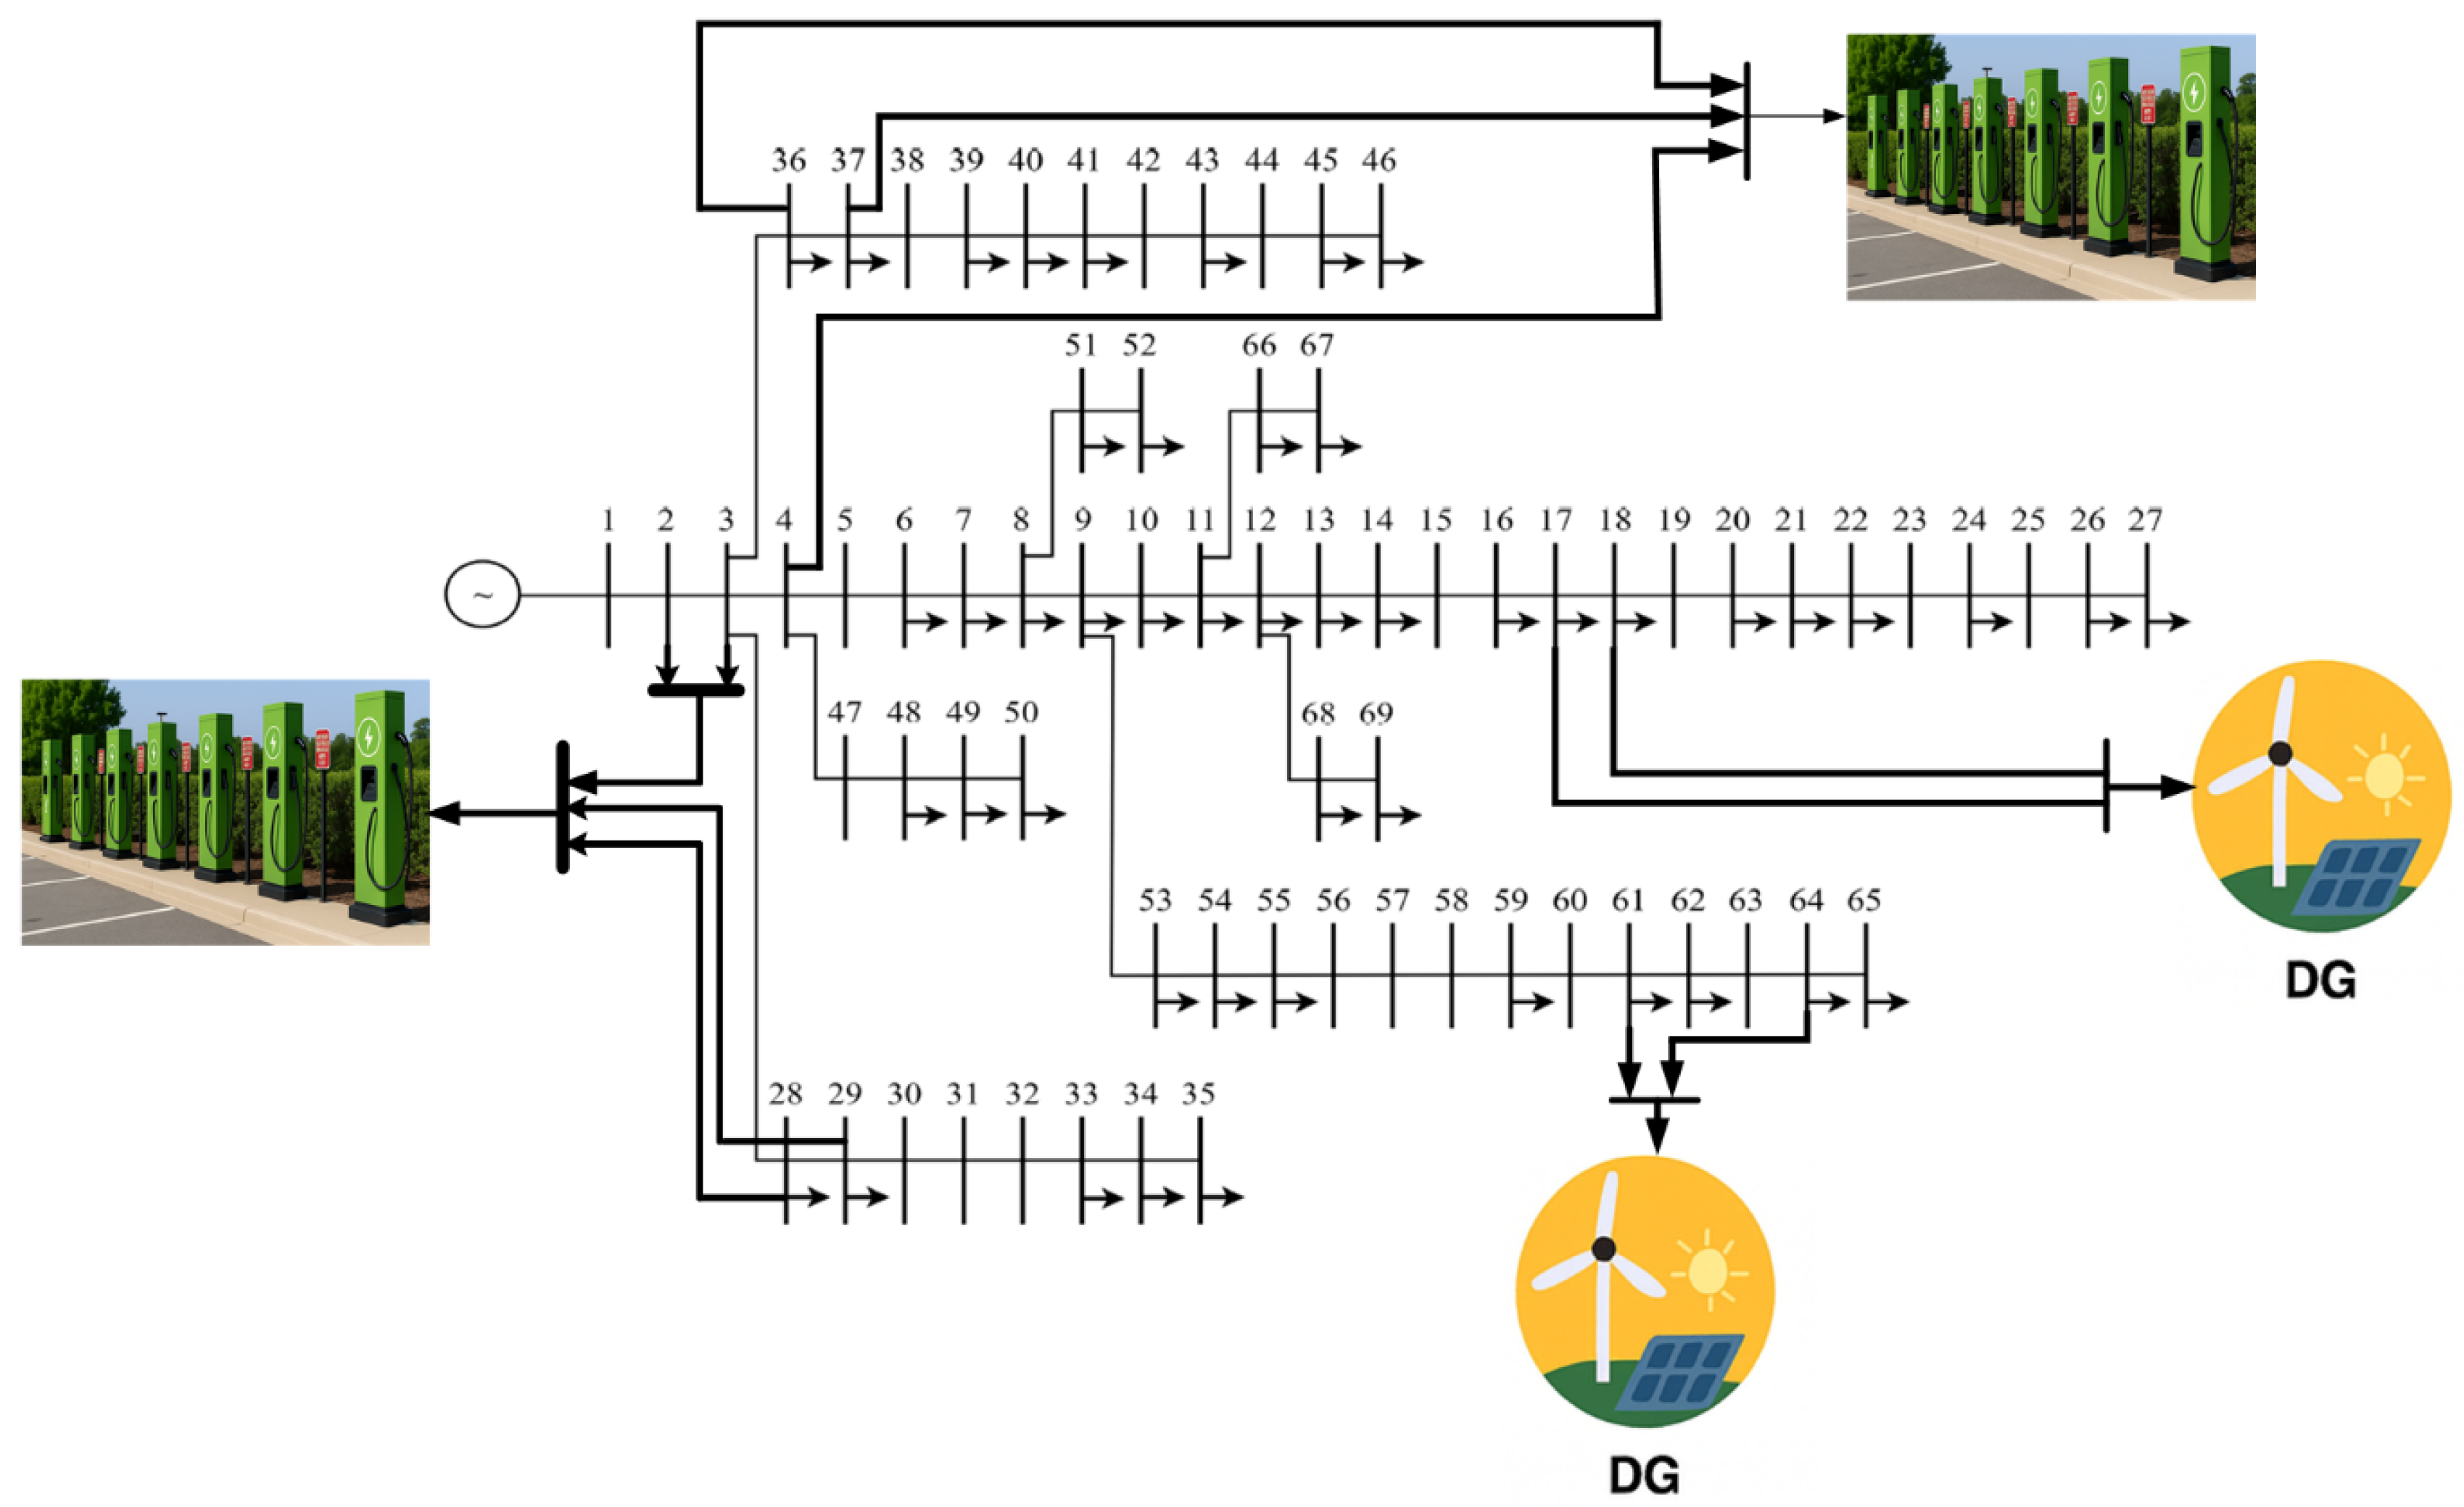
To further substantiate the approach, it is deployed in the complex IEEE-69 bus radial feeder. The single-line layout is shown in Figure 14. The line and load data (68 branches, 69 buses) are taken from [38]. A direct BFS load-flow establishes the benchmark. The total active and reactive losses of 224.553 kW and 102.01 kVAr, respectively, have voltages that span from 1.0 p.u. at the slack (bus 1) down to 0.91018 p.u. at bus 65, giving a voltage deviation of 9.762. Using this baseline, we evaluate the same six study cases as before in IEEE-33 bus system: EVCS only with three and five sites, and DG only with one, two, and three units. Consistent with expectations, installing EV charging stations alone raises feeder loading and exacerbates voltage depressions. To counter these effects, the proposed GLAD-ABC algorithm is used to co-optimize EVCS siting with DG placement and sizing. The coordinated plan offsets the added charging demand, leading to improved voltage regulation and lower real/reactive losses relative to both the base case and the EV-only scenarios.

5.2.1. Impact of EVCSs and DGs on the Voltage Profile of IEEE-69 RDS

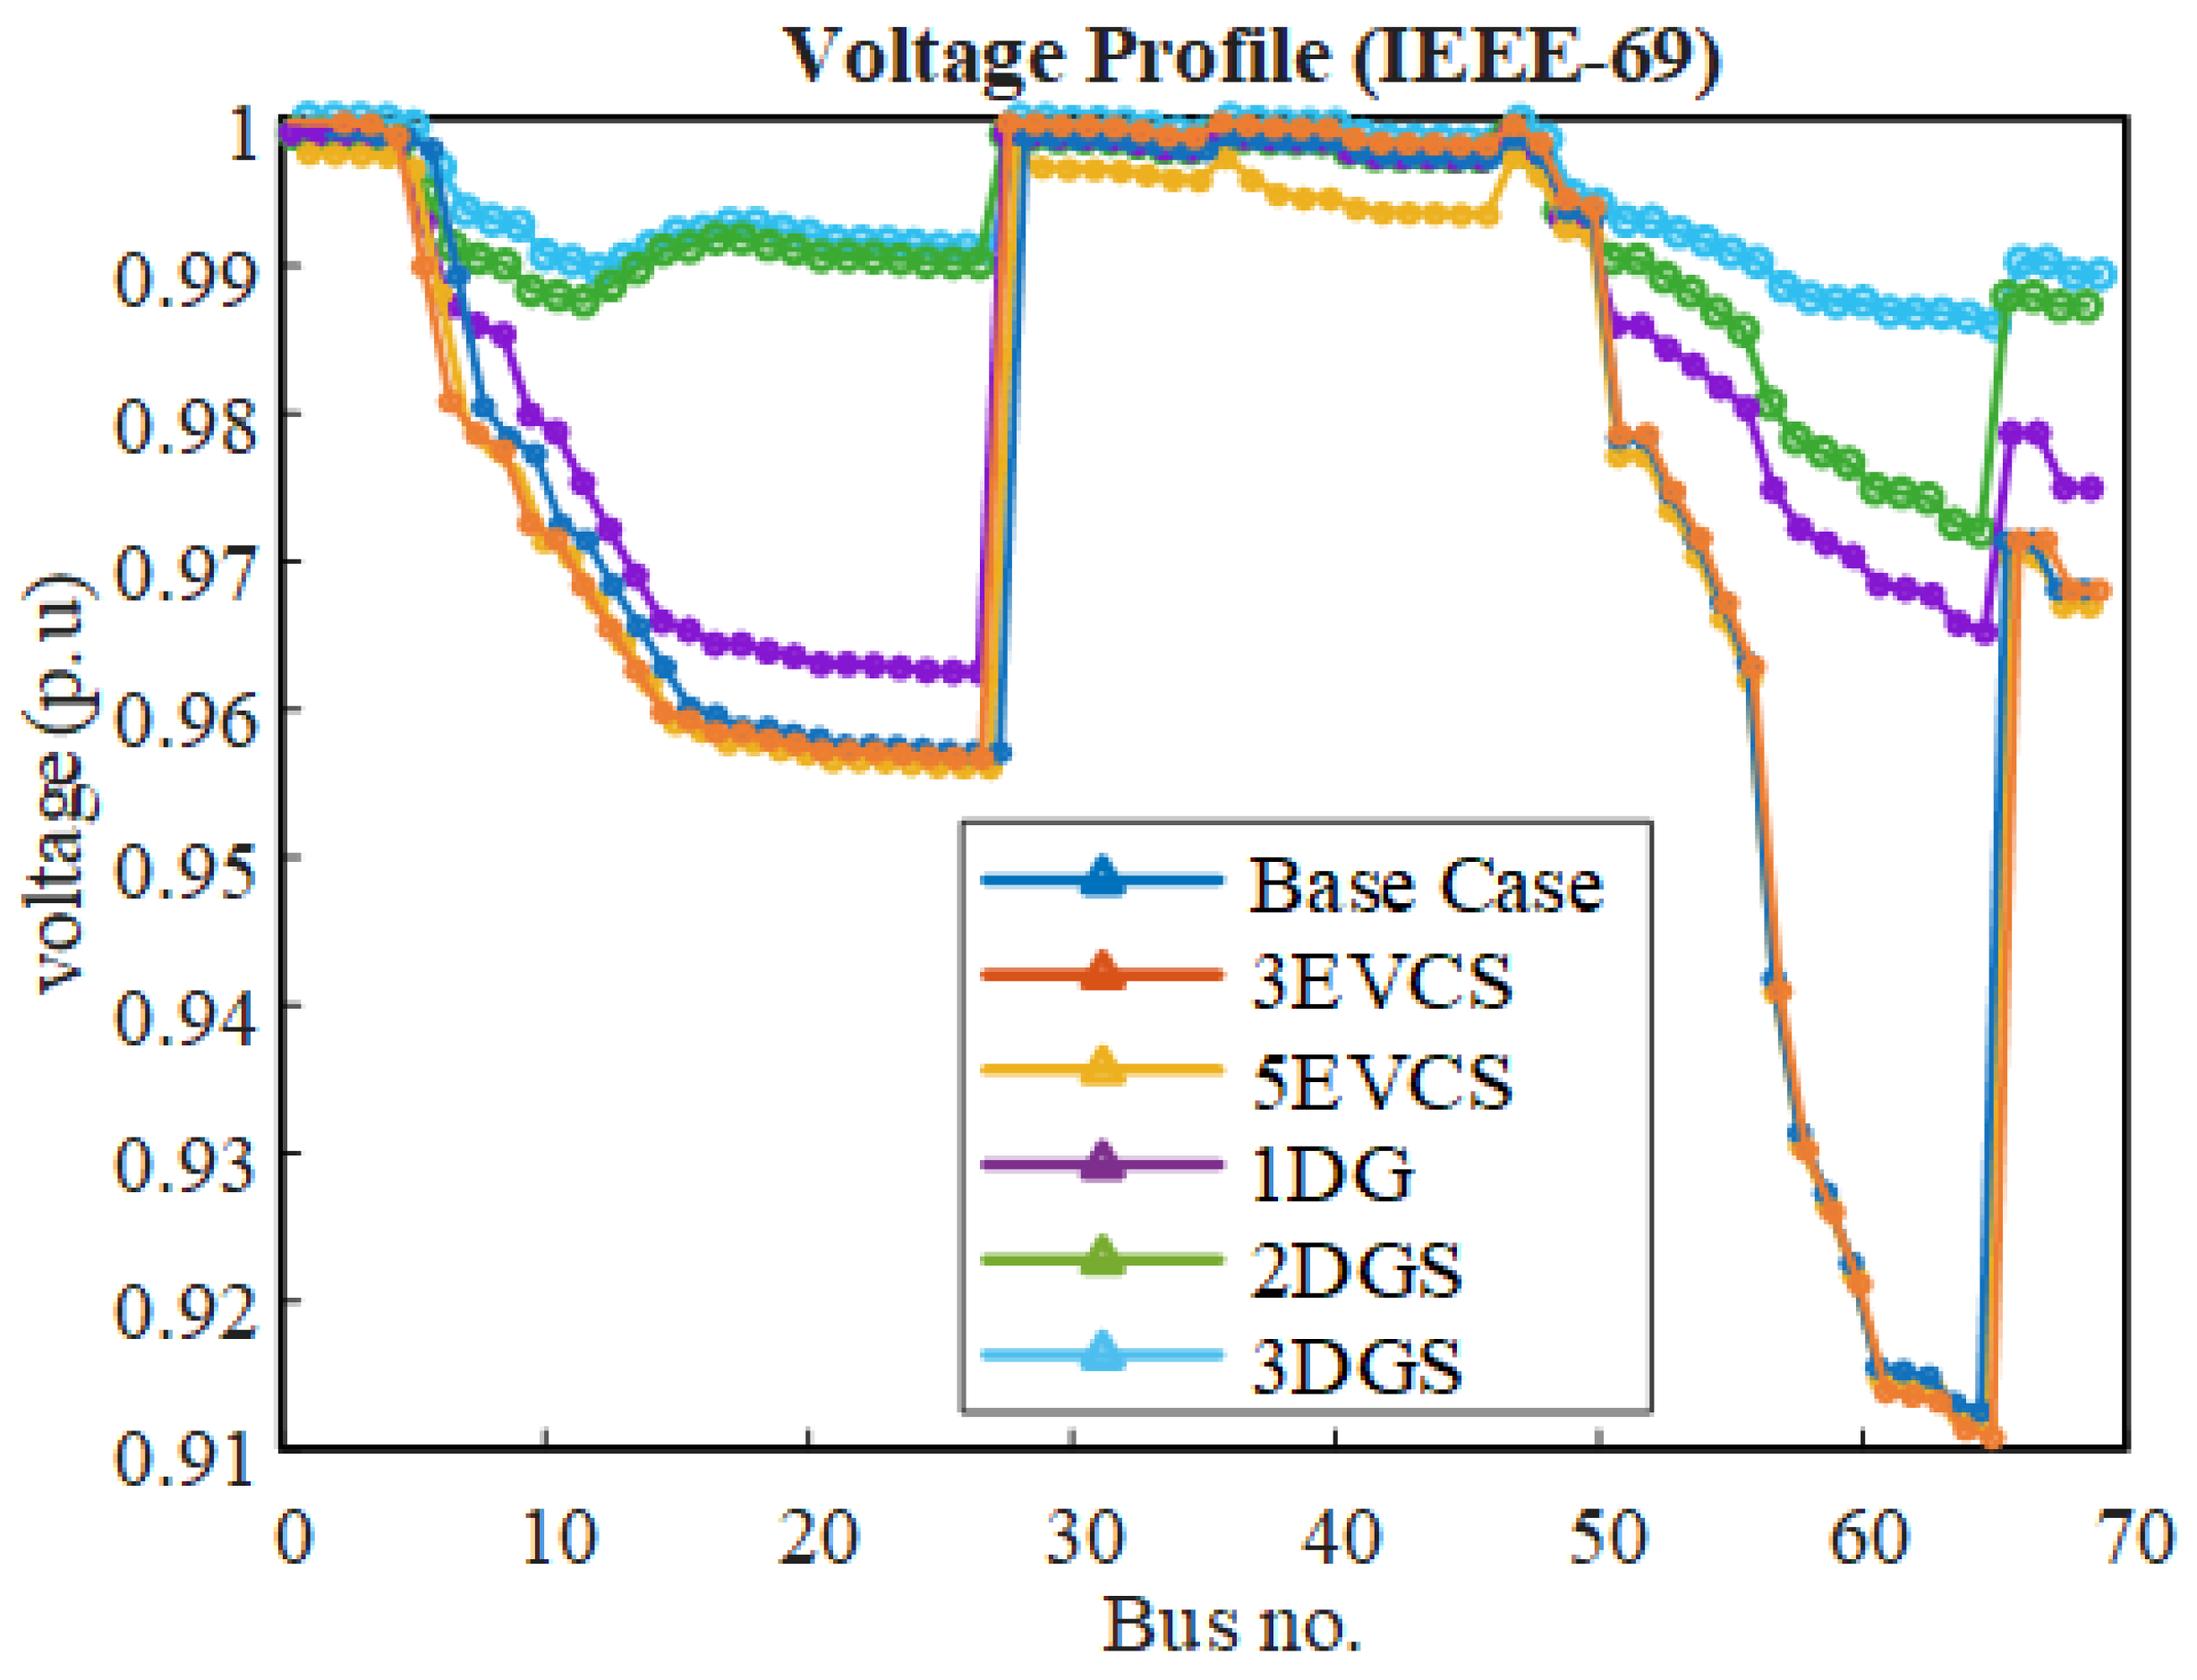
Figure 15 shows the sensitivity of the IEEE-69 bus feeder to EVCS siting. Adding charging stations raises local demand and depresses voltages: with three EVCSs at buses 28, 36 and 47, the voltage profile drops, and the effect is amplified when five EVCSs are installed at buses 28, 36, 40, 47, and 48. Voltage support is restored by deploying DG at optimized locations. Relative to the EV-only case, a significant reduction in voltage drop was observed, this issue was overcome by optimally placement of DGs in RDS system. The minimum bus voltage drops to 0.96686 p.u with one DG and to 0.97308 p.u. with two DGs, and rises further to 0.98902 p.u. with three DGs. Greater DG penetration also reduces feeder losses, yielding a stronger overall profile. Collectively, these results demonstrate that co-optimizing EVCS and DG placement is an effective strategy for preserving voltage security and limiting the adverse impacts of large-scale EV charging in radial distribution networks.

5.2.2. Impact of EVCSs and DGs on the Power Losses of IEEE-69 RDS

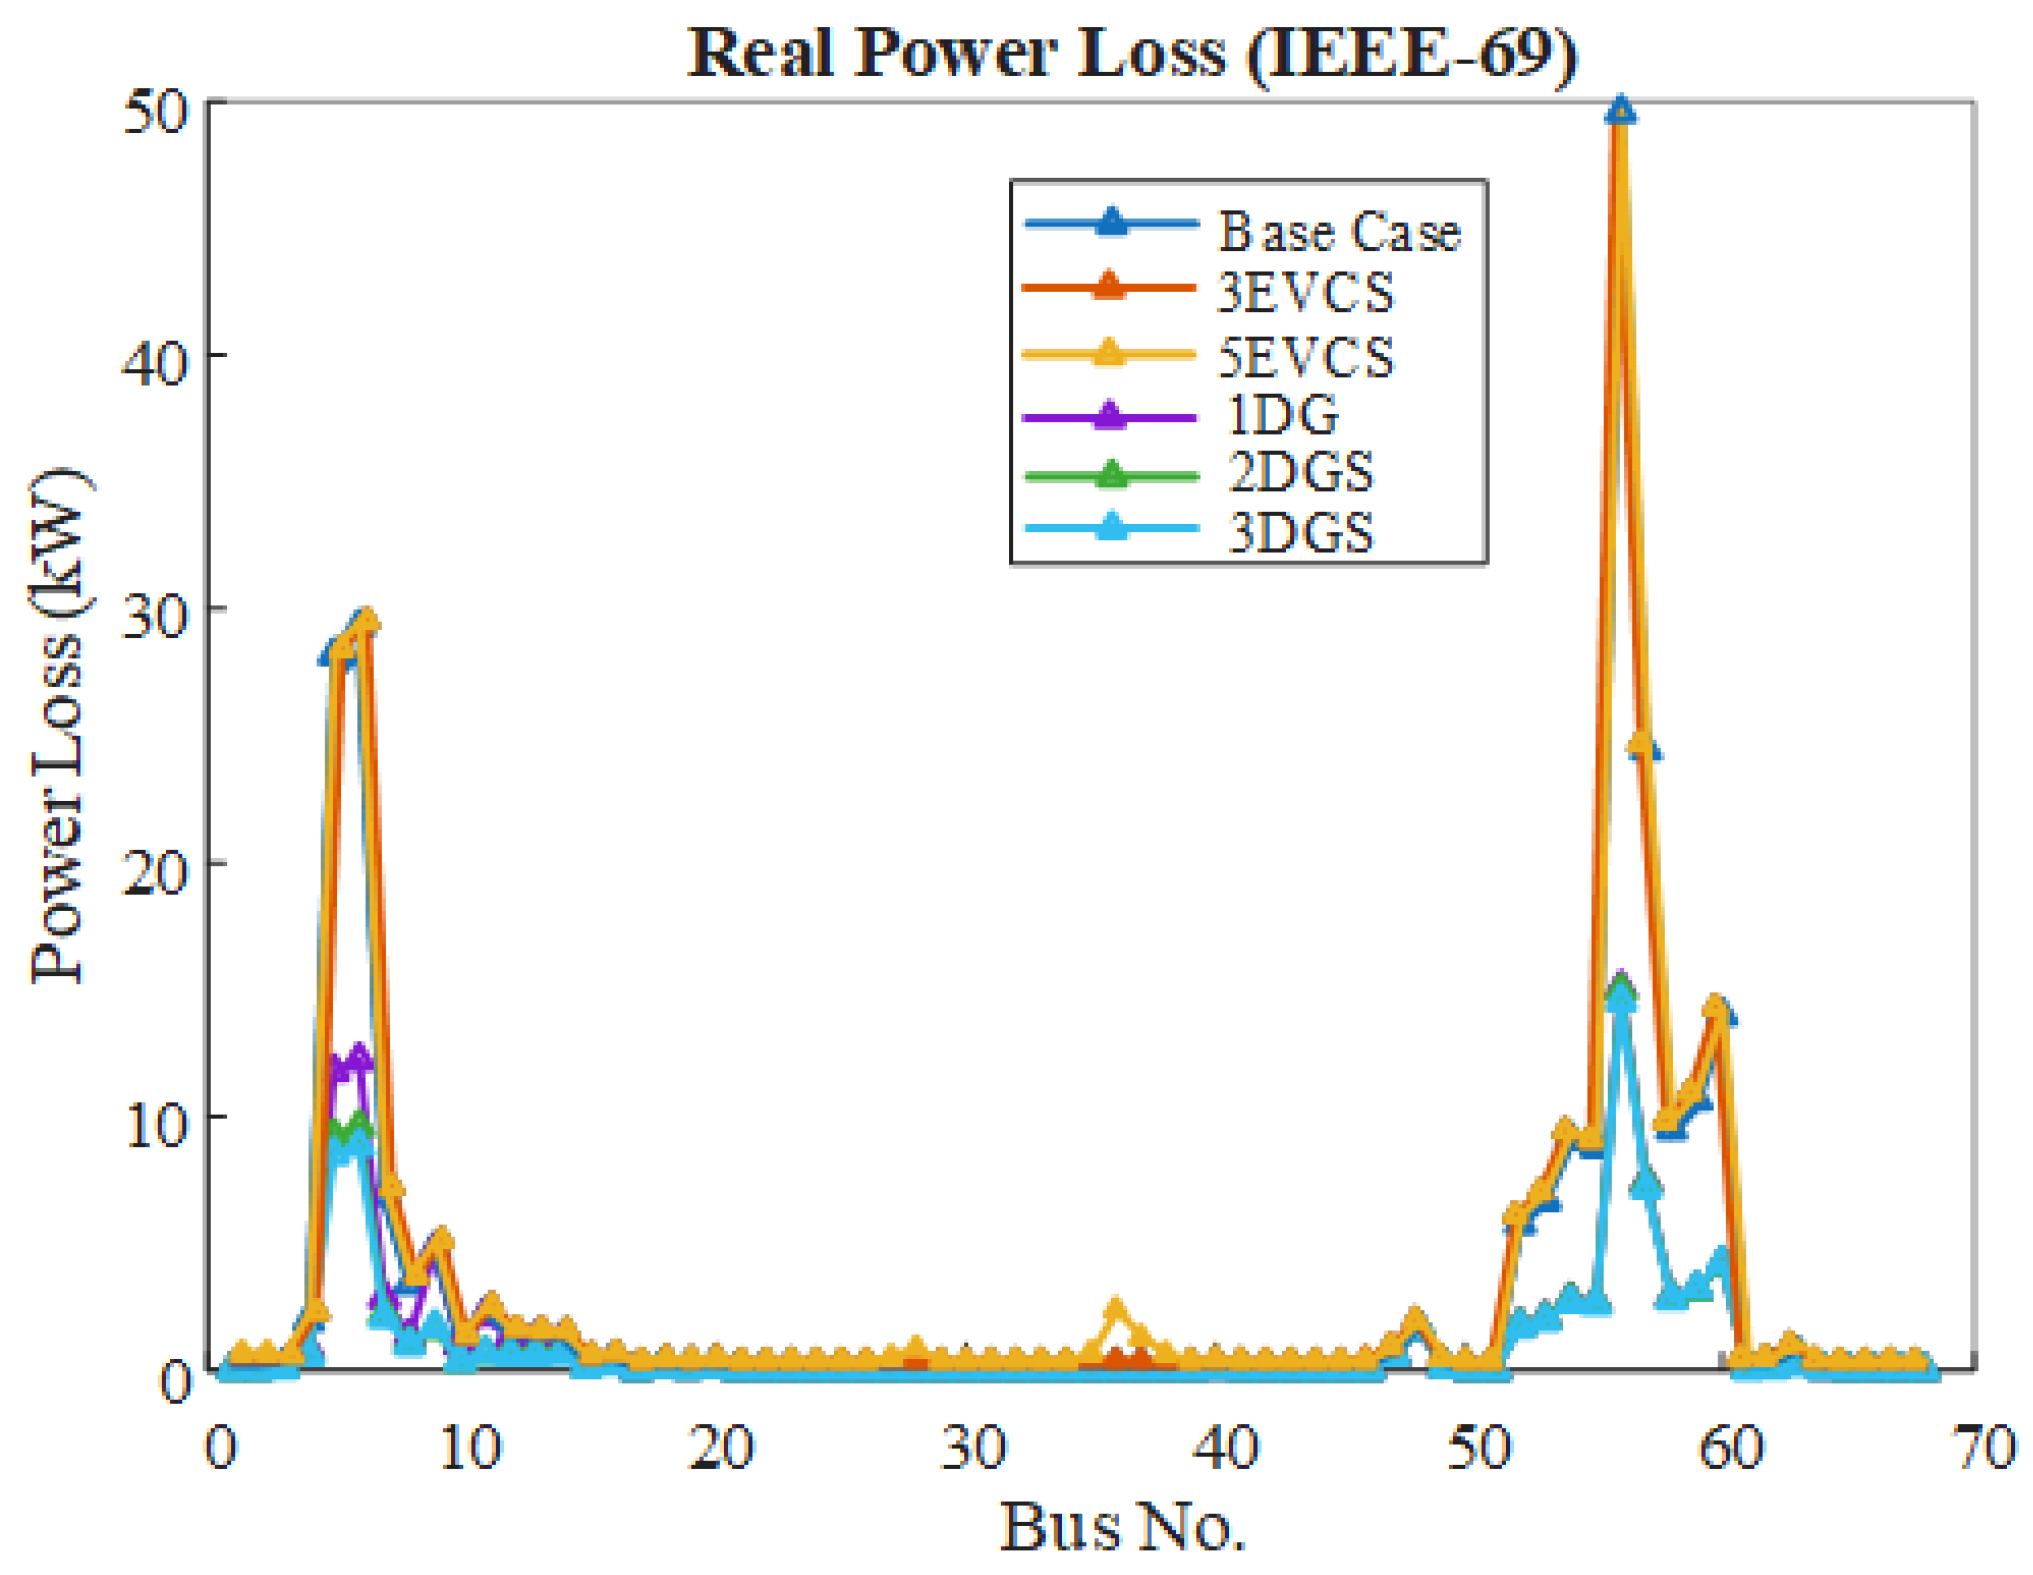
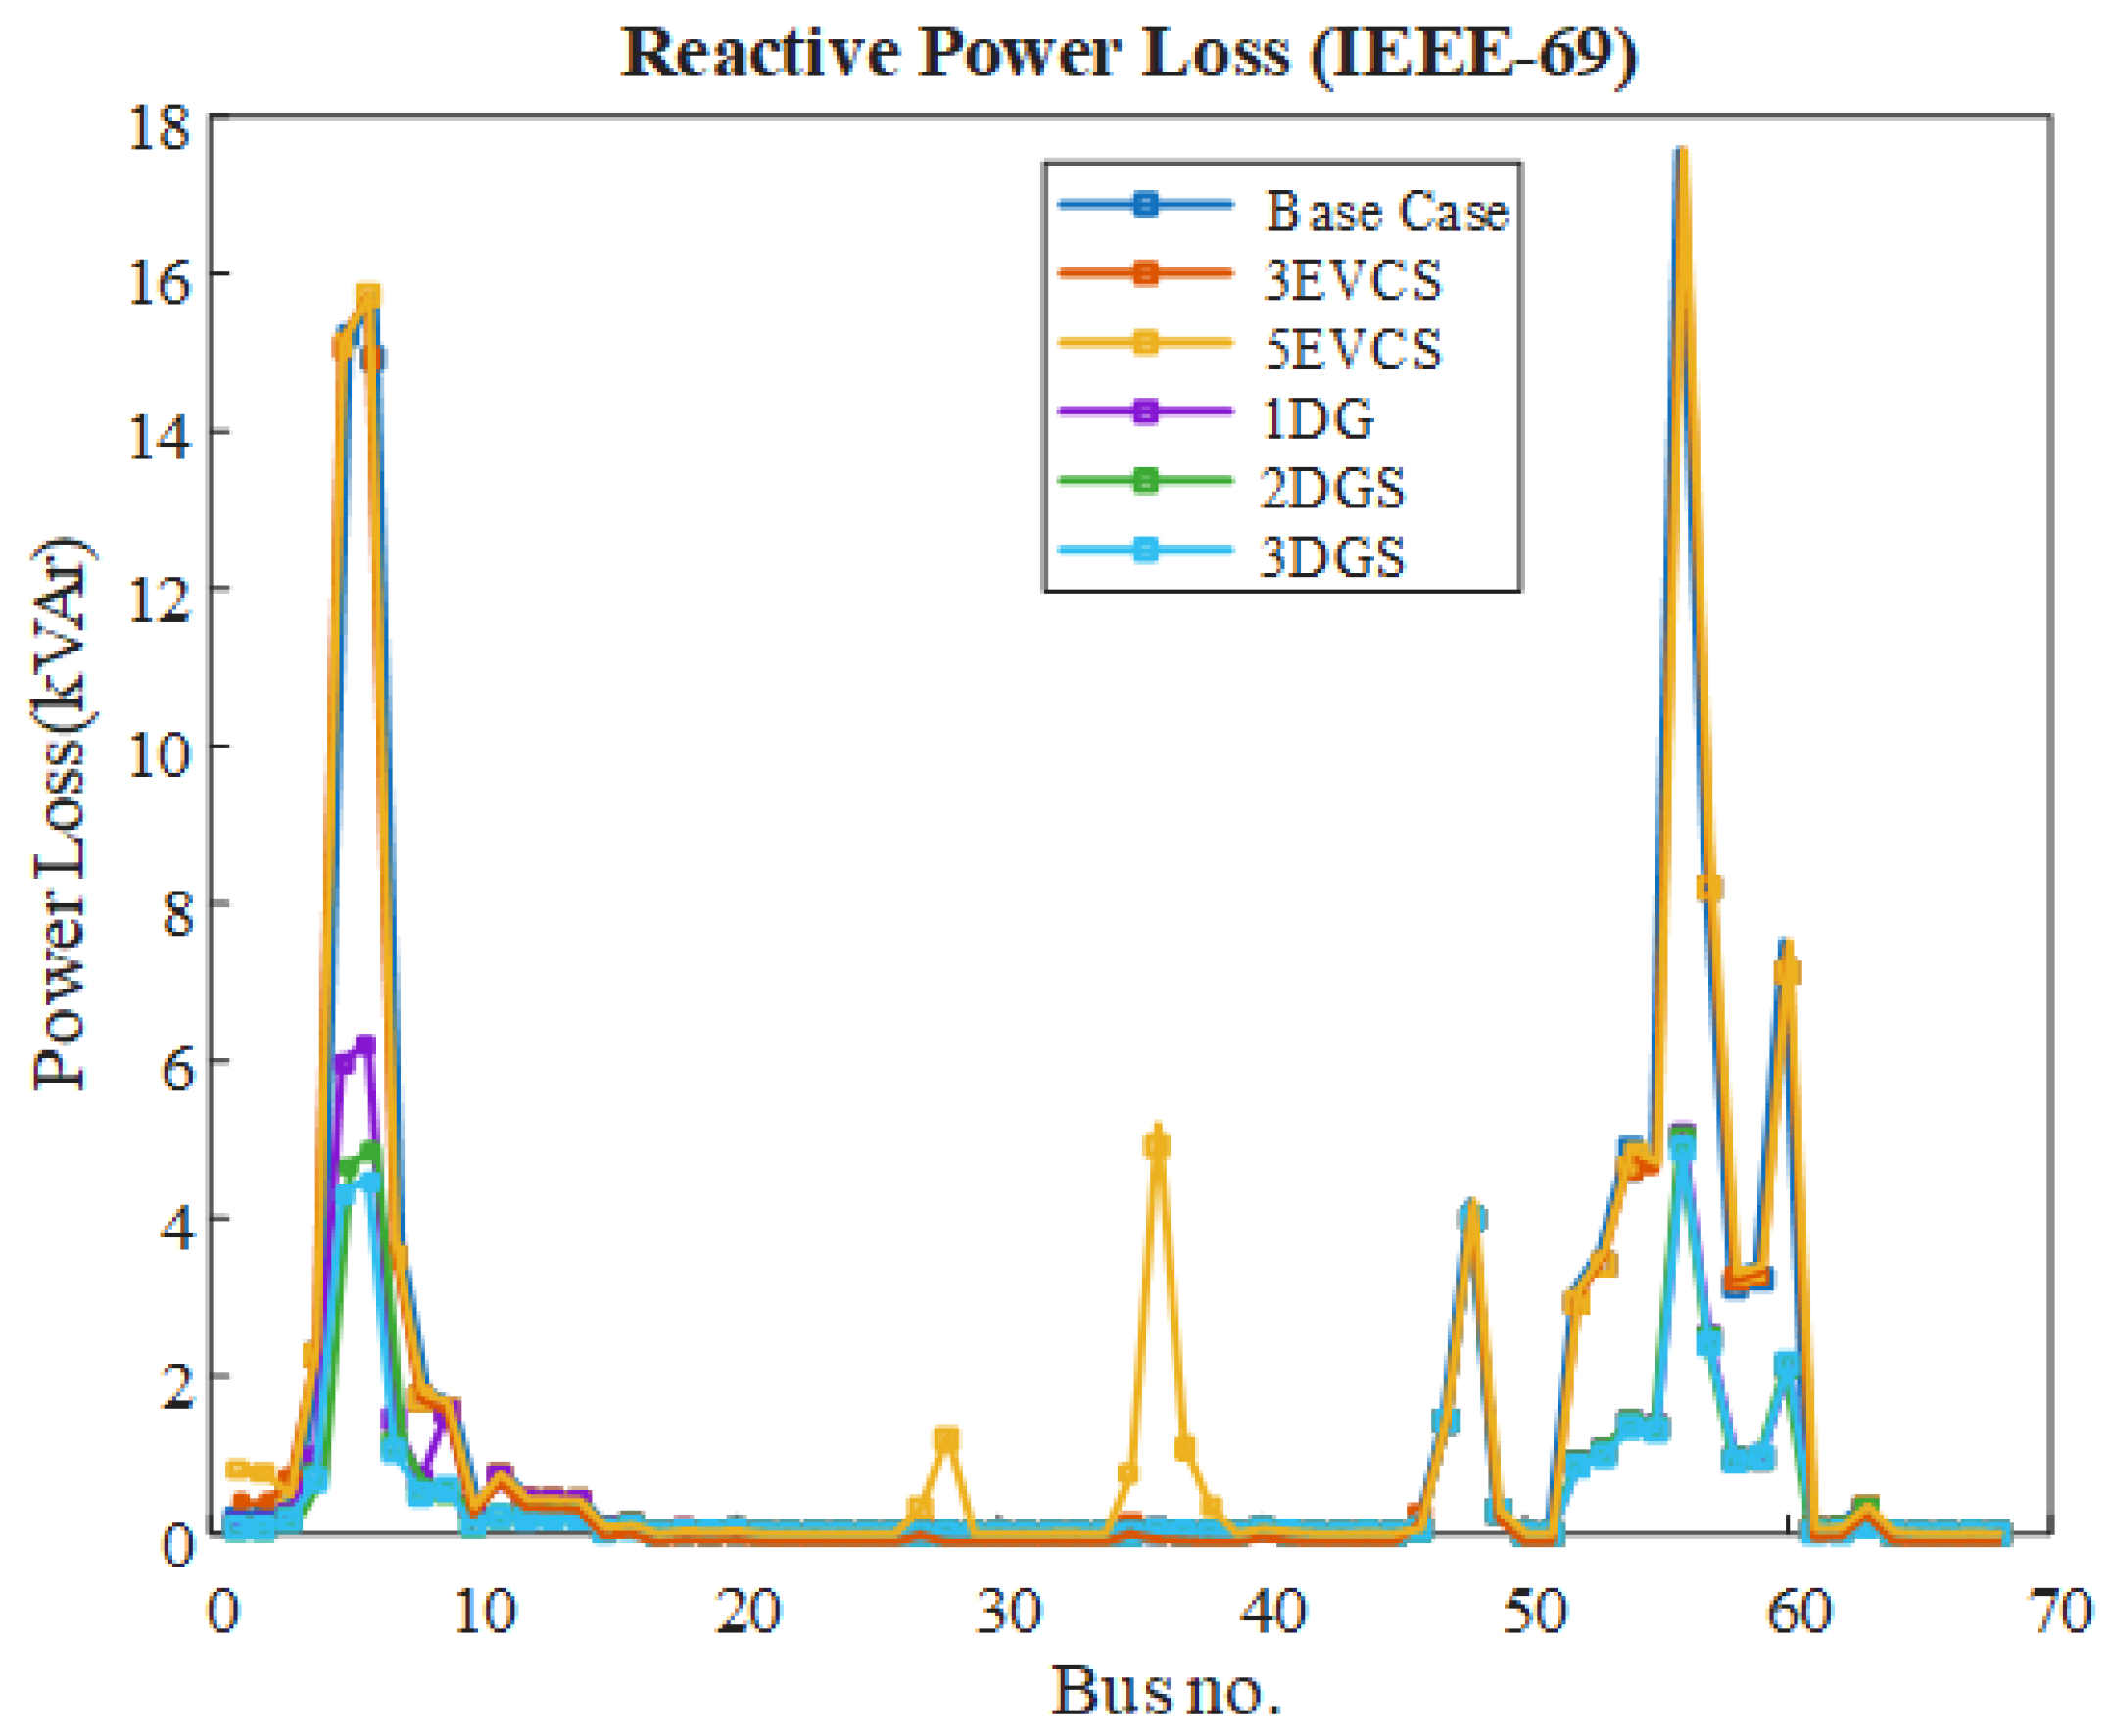
High coincident charging at EVCS sites imposes additional demand on the IEEE-69 bus feeder, producing measurable voltage depression and higher power losses as shown in Figure 16 and Figure 17 accordingly, EVCS siting should balance user accessibility with network operability, prioritizing locations that limit incremental losses and voltage drops. When three EVCSs units are placed at buses at 28, 36, 47 real power losses rise to 244.8367 kW with a voltage deviation of 11.782 p.u. Expanding to five EVCSs at buses 28, 36, 40, 47, 48 further increases losses to 304.6742 kW and elevates deviation to 13.807 p.u, reflecting the added stress from greater charging demand.
To counter these impacts, optimally placed DGs are introduced. A single DG of 1500 kW at bus 61 reduces real power losses to 86.865 kW and brings the voltage deviation down to 2.582 p.u. With two DGs sized 589 kW and 1500 kW at buses 17 and 61, losses fall further to 73.465 kW. Deploying three DGs 548 kW, 1491 kW, 296 kW at buses 15, 61, 64 achieves a minimum loss of 70.078 kW and reduces deviation to 0.436 p.u, indicating progressive reinforcement of the voltage profile as DG penetration increases. reactive power behavior follows the same trend as shown in Figure 17.
With three EVCSs at 28, 36, 47, reactive losses reach 119.331 kVAr, and with five EVCSs at 28, 36, 40, 47, 48, they increase to 155.6731 kVAr. Introducing one DG at bus 61 of size 1500 KW lowers reactive losses to 42.500 kVAr; two DGs at 17 and 61 of size 589 KW, 1500 KW reduce them to 36.744 kVAr; and three DGs at bus 15, 61, 64 of size 548 KW, 1491 KW and 296 KW achieve 35.111 kVAr.
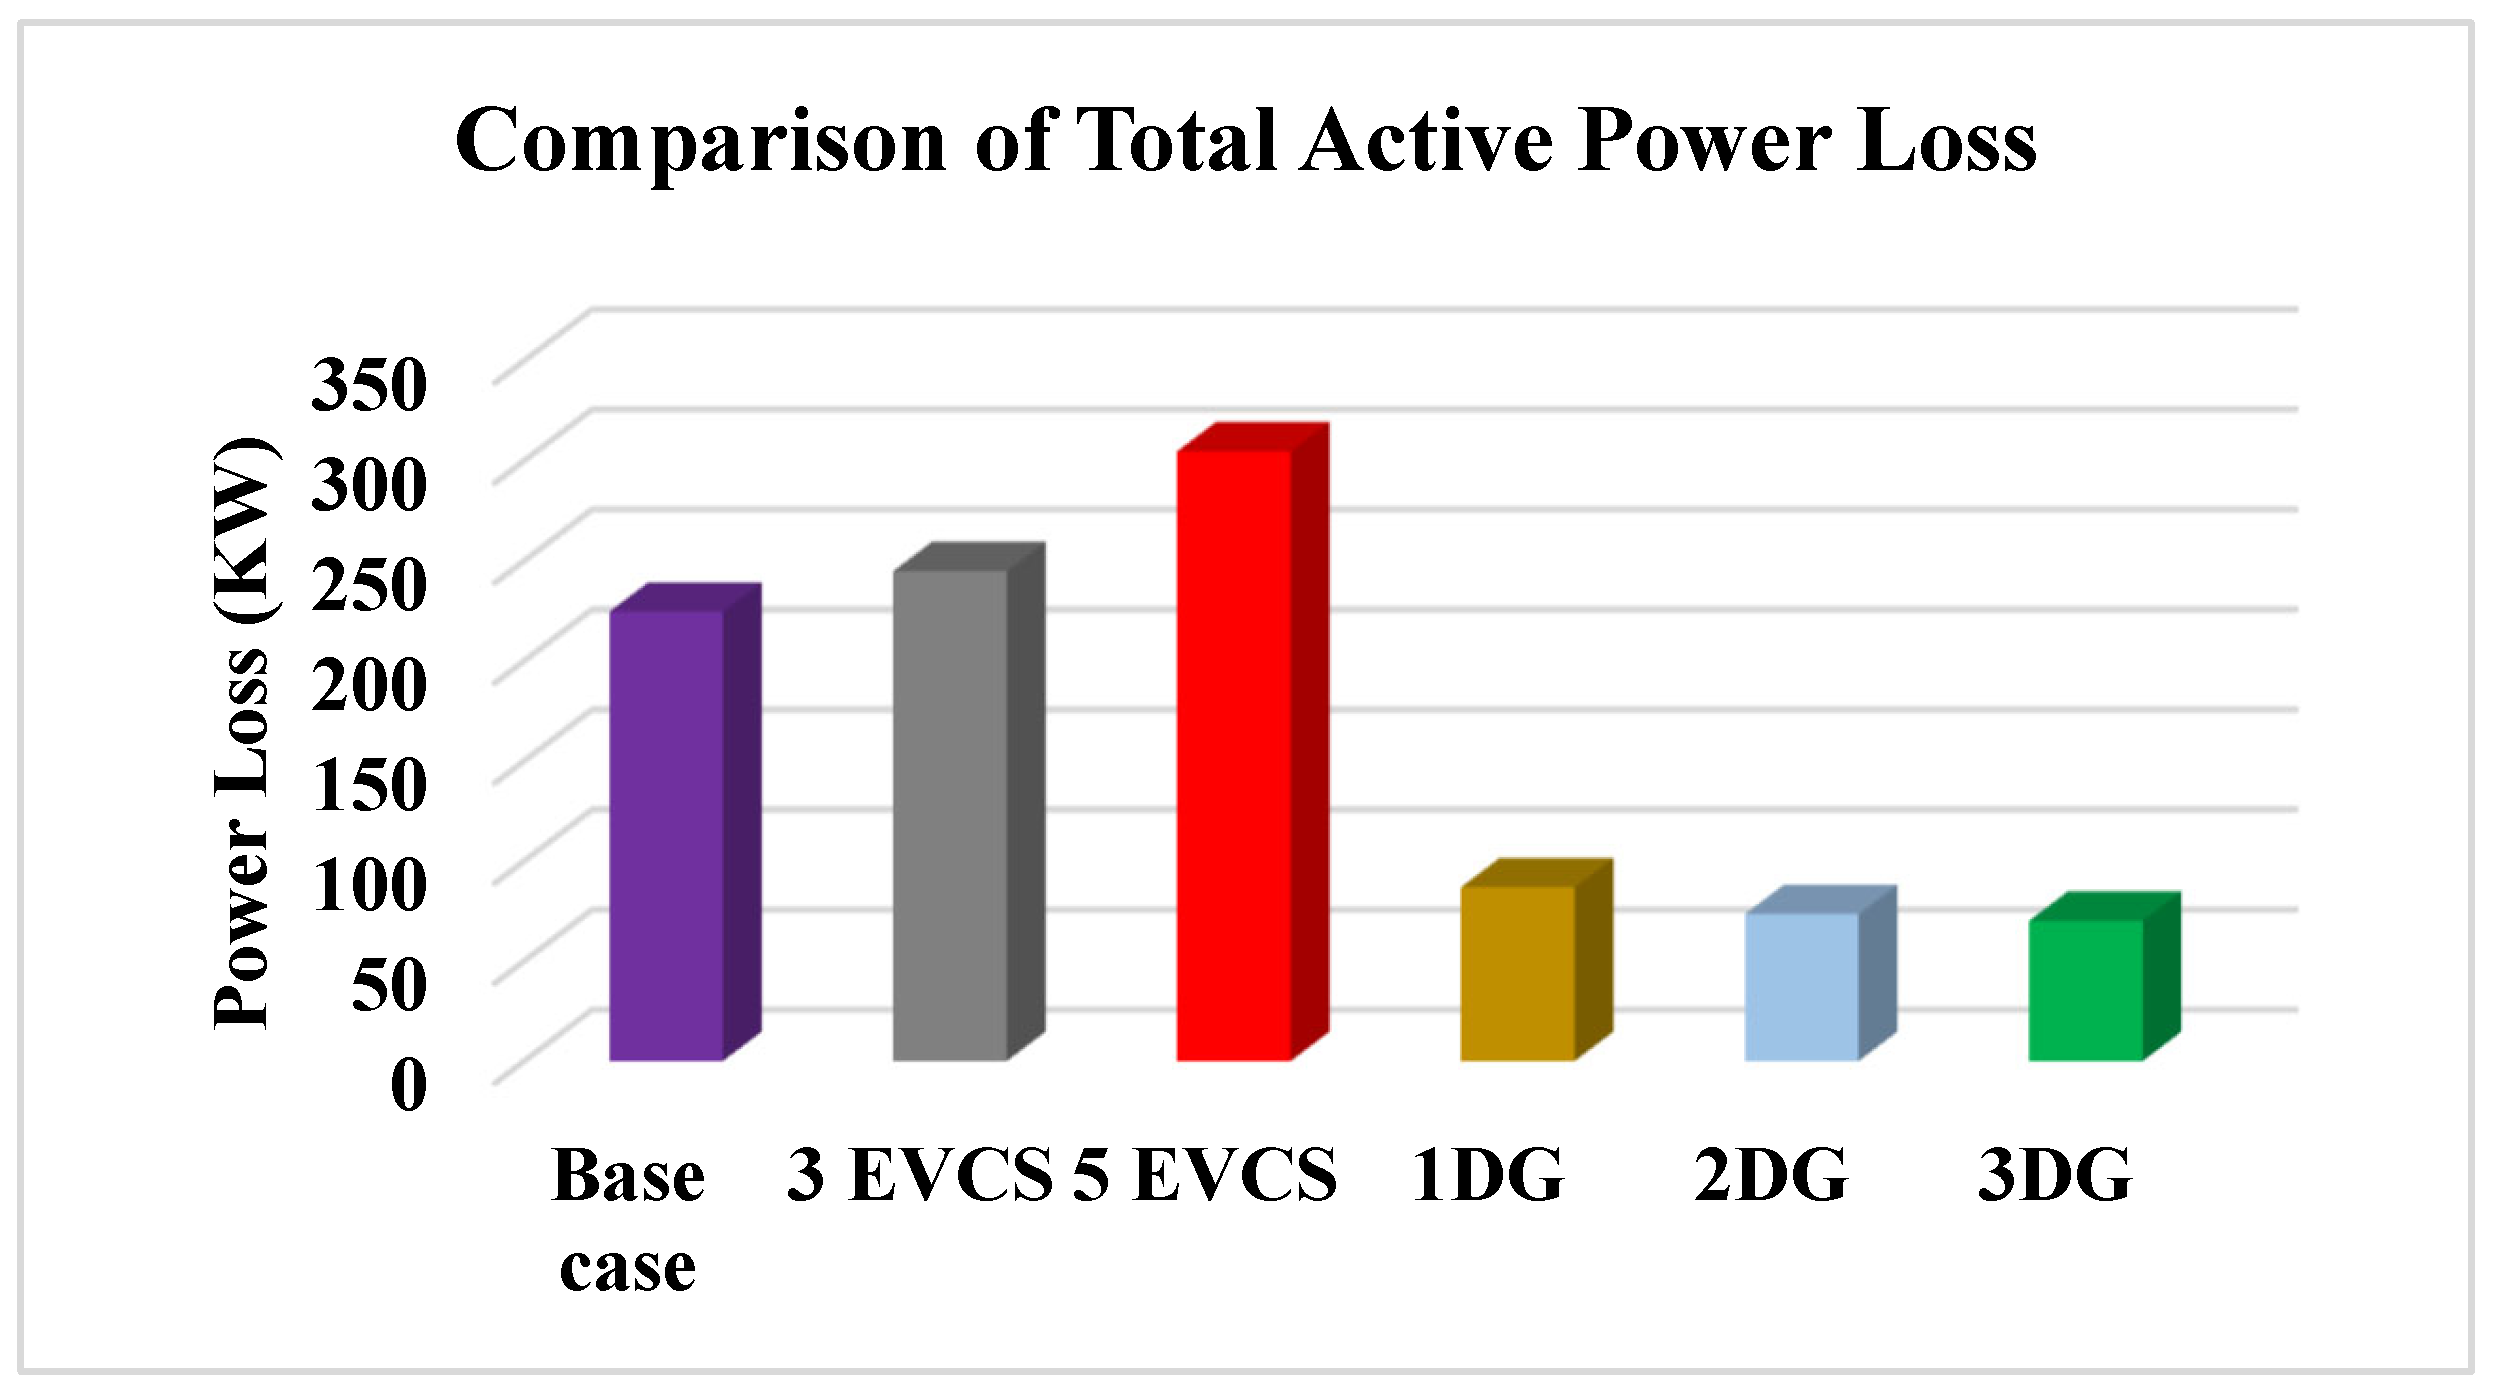
A consolidated comparison is provided in Table 4, EVCS deployment alone increases both active and reactive losses to 304.6742 kW and 155.6731 kVAr, respectively, whereas coordinated DG placement reduces them to 70.078 kW and 35.111 kVAr. Overall, the results underscore that co-optimizing EVCSs and DGs siting effectively preserves voltage adequacy and curtails losses in radial distribution networks.
The real and reactive power losses for the IEEE-69 bus test system are summarized in Table 3 under optimal DG and EVCS allocation. The results show that active power losses increase to 304.674 kW, whereas reactive power losses climb to 155.673 kVar after EVCS deployment.
Figure 18, Figure 19 and Figure 20 shows the comparison and variation in power losses and voltage deviation obtained during the course of simulation by optimally place the EVCSs and DGs in RDS.
While Figure 21 show the voltage improvement following the ideal placement of EVCSs and DGs. Under the proposed approach, optimal DGs siting progressively curtails network losses. With a single DG, real and reactive losses drop by 61.316% and 58.3374%, respectively. Deploying two DGs deepens the reductions to 67.2835% and 63.98%, With three DGs, the loss reductions reach 68.7918% and 65.5808%, confirming the monotonic benefit of coordinated multi-DG placement.
Table 5 benchmarks the proposed GLAD-ABC against published optimizers on the IEEE-69 feeder. GLAD-ABC delivers the lowest active power loss of 70.08 kW, outperforming FWA (77.85 kW), MTLBO (77.36 kW), JAYA (75.83 kW), GWO (73.43 kW), SIMBO-O (71.30 kW), QOSIMBO-Q (71.00 kW), HHO (74.14 kW), WOA (70.19 kW). In relative terms, GLAD-ABC reduces active loss by 9.98% (FWA), 9.41% (MTLBO), 7.58% (JAYA), 5.51% (HHO), 4.56% (GWO), 1.711% (SIMBO-O),1.30% (QOSIMBO-Q) and 0.156% (WOA and DA). These results confirm GLAD-ABC’s superiority among the reported methods for IEEE-69 in terms of active-loss minimization.
The sensitivity analysis of the normalized fitness function under various DGs configurations in the IEEE-69 bus system using the GLAD-ABC is shown in Figure 22. The fitness function is evaluated for weight factors w1 ∈ [0.1, 0.9].
The results reveal that the 3-DG configuration consistently yields the lowest normalized fitness value (minimum ≈ 0.0991), followed by 2-DG (≈0.1046) and 1-DG (≈0.2767), confirming improved power loss reduction and voltage profile with increasing DG penetration. The smooth and monotonic decline in the fitness trend further validates the robustness of the GLAD-ABC algorithm in achieving optimal trade-offs under multi-objective conditions. The convergence graphs for the six operational cases of the IEEE-69 distribution network are shown in Figure 23.
Among all scenarios, the configuration with three DGs achieved the minimum cost and the most efficient performance. This case converged faster and more smoothly than others, showing that the proposed algorithm performs well even in the larger and more complex 69 bus system.

6. Discussion

The experimental findings demonstrate that the proposed GLAD-ABC algorithm achieves superior performance in minimizing network losses and improving voltage profiles under simultaneous EVCS and DG integration. In the case of the IEEE-33 bus system, the GLAD-ABC algorithm delivers outstanding optimization capability compared to state-of-the-art methods, as evidenced in Table 3. Specifically, GLAD-ABC achieves significant improvements in active power loss minimization, with percentage gains of 12.06% over GA, 61.07% over SA, 22.46% over AM, 21.74% over FWA, 13.49% over MTLBO, 9.47% over JAYA, 6.34% over GWO, 8.68% over COA, 6.97% over ECOA, 5.45% over SIMBO-Q, 4.79% over AA, 4.67% over HHO, and 4.66% over SPBO and AOA. Moreover, GLAD-ABC demonstrates superior computational efficiency, requiring less processing time and offering greater convergence stability compared with other optimization techniques. Similarly, for the IEEE-69 bus test system, the proposed GLAD-ABC exhibits robust and consistent performance against published optimizers. It achieves the lowest active power loss of 70.08 kW, outperforming FWA (77.85 kW), MTLBO (77.36 kW), JAYA (75.83 kW), GWO (73.43 kW), SIMBO-O (71.30 kW), QOSIMBO-Q (71.00 kW), HHO (74.14 kW), and WOA (70.19 kW). In relative terms, GLAD-ABC reduces active losses by 9.98% (FWA), 9.41% (MTLBO), 7.58% (JAYA), 5.51% (HHO), 4.56% (GWO), 1.71% (SIMBO-O), 1.30% (QOSIMBO-Q), and 0.156% (WOA and DA). These findings confirm that GLAD-ABC provides a consistent and superior trade-off between loss reductions, voltage improvements, and computational efficiency across both standard test networks. These outcomes also align with the findings of recent EV integration studies such as [45], which emphasize the importance of intelligent charging resource allocation and adaptive optimization frameworks for enhancing EV penetration and minimizing network stress. Beyond the numerical superiority, the overall interpretation of the results indicates that the hybrid GLAD-ABC framework is not only effective in reducing losses but also more capable of maintaining stable network performance under high penetration of EVCSs and DGs. The improved convergence stability and balanced exploration–exploitation behavior explain why the algorithm consistently achieves better grid conditions across both test systems. From a practical utility-planning perspective, the results suggest that adopting GLAD-ABC for coordinated EVCS–DG allocation can support utilities in delaying feeder reinforcement, improving bus-voltage quality, and reducing operational losses without requiring costly infrastructure upgrades. The algorithm can serve as a decision-support tool for determining optimal charging station siting, planning DG integration, and assessing different deployment scenarios under increasing EV adoption. Such insights are particularly valuable for utilities dealing with rapid electrification, as the method provides quantifiable benefits in terms of power quality, capacity utilization, and overall system resilience. However, this study has certain limitations. The optimization framework is deterministic and does not explicitly consider uncertainties such as stochastic EV charging behavior, renewable generation variability, or time-varying load fluctuations. These factors may influence real-world performance, especially under dynamic operating conditions. Additionally, the validation relies on benchmark test systems rather than actual feeder data, meaning that geographical, regulatory, and economic constraints were not modeled.

7. Conclusions

A coordinated planning framework based on a novel ABC variant (GLAD-ABC) has been presented for optimizing EVCS siting/sizing and DG allocation in radial feeders, integrated with a BFS solver and a practical EV load model. Across IEEE-33 and IEEE-69 systems and multiple scenarios, EVCS only deployment was found to increase losses and degrade voltages, whereas optimizing EVCS and DG allocation via GLAD-ABC consistently improved voltage profiles and minimized real/reactive losses with fast, stable convergence. In relation to the existing literature, which primarily employs conventional meta-heuristics or limited EV integration models, this work demonstrates a more adaptive and reliable optimization pathway for coordinated EVCS–DG planning. These outcomes reinforce recent findings that highlight the need for intelligent, data-driven allocation of charging and distributed resources in modern distribution networks.
In active-loss percentage improvement comparisons, the proposed GLAD-ABC recorded improvements of 12.06% over GA; 61.07% over SA; 22.46% over AM; 21.74% over FWA; 13.49% over MTLBO; 9.47% over JAYA; 6.34 over GWO; 8.68% over COA; 6.97% over ECOA; 5.45% over SIMBO-Q; 4.79% over AA; 4.67% over HHO; and 4.66% over SPBO and AOA in the case of the IEEE-33 bus RDS.
In the case of the IEEE-69 bus, the RDS achieved gains of 9.98% (FWA), 9.41% (MTLBO), 7.58% (JAYA), 5.51% (HHO), 4.56% (GWO), 1.711% (SIMBO-O), 1.30% (QOSIMBO-Q), and 0.156% (WOA and DA). These results substantiate GLAD-ABC’s superiority among representative meta-heuristics and highlight its suitability for utility planning. The novelty of this work lies in its application-oriented and problem-specific adaptation of the GLAD-ABC mechanism, allowing enhanced exploration and stability tailored specifically to EVCS–DG coordination in distribution feeders. Furthermore, the framework provides practical guidance for real-world implementation by helping utilities identify cost-effective EVCS/DG placements, reduce feeder stress, and support planning decisions under growing EV adoption
Future work will extend the GLAD-ABC algorithm to address multi-objective cost–emission trade-offs, feeder reconfiguration, and Volt–VAR support under charging-demand uncertainty. Explicit stability indices (L-index and VSI) will be incorporated to assess system resilience using real-time and digital-twin validations. The framework will also integrate detailed EVCS demand modeling with TOU tariffs, stochastic arrivals, and bi-directional V2G scheduling to capture dynamic DG–EVCS interactions more effectively.

Author Contributions

Conceptualization, A.M.A., H.A., A.W., I.E.A. and K.S.S.A.; Methodology, A.M.A., H.A., A.W. and I.E.A.; Software, K.S.S.A.; Validation, A.M.A., H.A., A.W. and K.S.S.A.; Formal analysis, K.S.S.A.; Investigation, A.M.A., H.A., A.W., I.E.A. and K.S.S.A.; Resources, A.M.A., I.E.A. and K.S.S.A.; Data curation, I.E.A. and K.S.S.A.; Writing—original draft, A.M.A. and H.A.; Writing—review & editing, A.M.A., H.A. and A.W.; Visualization, H.A. and A.W.; Supervision, H.A.; Project administration, I.E.A.; Funding acquisition, H.A. All authors have read and agreed to the published version of the manuscript.

Funding

This article is derived from a research grant funded by the Research, Development, and Innovation Authority (RDIA)—Kingdom of Saudi Arabia—with grant number (13385-Tabuk-2023-UT-R-3-1-SE).

Data Availability Statement

The original contributions presented in this study are included in the article. Further inquiries can be directed to the corresponding author.

Acknowledgments

The authors extend their appreciation to the Research, Development, and Innovation Authority (RDIA), Saudi Arabia for funding this work through Grant number (13385-Tabuk-2023-UT-R-3-1-SE).

Conflicts of Interest

The authors declare no conflicts of interest.

References

  1. Golla, N.k.; Sudabattula, S.K.; Suresh, V. Optimal Placement of Electric Vehicle Charging Station in Distribution System Using Meta-Heuristic Techniques. Math. Model. Eng. Probl. 2022, 9, 60–66. [Google Scholar] [CrossRef]
  2. Lei, X.; Yu, H.; Zhong, J.; Jia, Y.; Shao, Z.; Jian, L. Exploring electric vehicle’s potential as capacity reservation through V2G operation to compensate load deviation in distribution systems. J. Clean. Prod. 2024, 451, 141997. [Google Scholar] [CrossRef]
  3. Bilal, M.; Rizwan, M. Coordinated optimal planning of electric vehicle charging stations and capacitors in distribution systems with vehicle-to-grid facility. Preprint 2021. [Google Scholar] [CrossRef]
  4. Tomasov, M.; Motyka, D.; Kajanova, M.; Bracinik, P. Modelling effects of the distributed generation supporting e-mobility on the operation of the distribution power network. Transp. Res. Procedia 2019, 40, 556–563. [Google Scholar] [CrossRef]
  5. Waseem, M.; Huang, J.; Wong, C.-N.; Lee, C.K.M. Data-driven GWO-BRNN-based SOH estimation of lithium-ion batteries in EVs for their prognostics and health management. Mathematics 2023, 11, 4263. [Google Scholar] [CrossRef]
  6. Faddel, S.; Al-Awami, A.T.; Mohammed, O.A. Charge control and operation of electric vehicles in power grids: A review. Energies 2018, 11, 701. [Google Scholar] [CrossRef]
  7. Ahmad, F.; Iqbal, A.; Ashraf, I.; Marzband, M. Optimal location of electric vehicle charging station and its impact on distribution network: A review. Energy Rep. 2022, 8, 2314–2333. [Google Scholar] [CrossRef]
  8. Waseem, M.; Lin, Z.; Liu, S.; Sajjad, I.A.; Aziz, T. Optimal GWCSO-based home appliances scheduling for demand response considering end-users comfort. Electr. Power Syst. Res. 2020, 187, 106477. [Google Scholar] [CrossRef]
  9. Said, D.; Mouftah, H.T. A novel electric vehicles charging/discharging management protocol based on queuing model. IEEE Trans. Intell. Veh. 2019, 5, 100–111. [Google Scholar] [CrossRef]
  10. Said, D. A survey on information communication technologies in modern demand-side management for smart grids: Challenges, solutions, and opportunities. IEEE Eng. Manag. Rev. 2022, 51, 76–107. [Google Scholar] [CrossRef]
  11. Deb, S.; Tammi, K.; Kalita, K.; Mahanta, P. Impact of electric vehicle charging station load on distribution network. Energies 2018, 11, 178. [Google Scholar] [CrossRef]
  12. Pal, A.; Bhattacharya, A.; Chakraborty, A.K. Allocation of EV fast charging station with V2G facility in distribution network. In Proceedings of the 2019 8th International Conference on Power Systems (ICPS), Jaipur, India, 20–22 December 2019; pp. 1–6. [Google Scholar]
  13. Wang, X.; Karki, R. Exploiting PHEV to augment power system reliability. IEEE Trans. Smart Grid 2016, 8, 2100–2108. [Google Scholar] [CrossRef]
  14. Pal, A.; Bhattacharya, A.; Chakraborty, A.K. Allocation of electric vehicle charging station considering uncertainties. Sustain. Energy Grids Netw. 2021, 25, 100422. [Google Scholar] [CrossRef]
  15. Zhang, Y.; Zhang, Q.; Farnoosh, A.; Chen, S.; Li, Y. GIS-based multi-objective particle swarm optimization of charging stations for electric vehicles. Energy 2019, 169, 844–853. [Google Scholar] [CrossRef]
  16. Deb, S.; Tammi, K.; Kalita, K.; Mahanta, P. Charging station placement for electric vehicles: A case study of Guwahati city, India. IEEE Access 2019, 7, 100270–100282. [Google Scholar] [CrossRef]
  17. Liu, L.; Xie, F.; Huang, Z.; Wang, M. Multi-objective coordinated optimal allocation of DG and EVCSs based on the V2G mode. Processes 2020, 9, 18. [Google Scholar] [CrossRef]
  18. Alam, A.; Gupta, A.; Bindal, P.; Siddiqui, A.; Zaid, M. Power loss minimization in a radial distribution system with distributed generation. In Proceedings of the 2018 International Conference on Power, Energy, Control and Transmission Systems (ICPECTS), Chennai, India, 22–23 February 2018; pp. 21–25. [Google Scholar]
  19. Singh, D.; Singh, D.; Verma, K.S. GA based energy loss minimization approach for optimal sizing & placement of distributed generation. Int. J. Knowl.-Based Intell. Eng. Syst. 2008, 12, 147–156. [Google Scholar]
  20. Suresh, M.C.V.; Edward, B.J. Optimal placement of DG units for loss reduction in distribution systems using one rank cuckoo search algorithm. Int. J. Grid Distrib. Comput. 2018, 11, 37–44. [Google Scholar] [CrossRef]
  21. Rizwan, M.; Waseem, M.; Liaqat, R.; Sajjad, I.A.; Dampage, U.; Salmen, S.H.; Al Obaid, S.; Mohamed, M.A.; Annuk, A. SPSO based optimal integration of DGs in local distribution systems under extreme load growth for smart cities. Electronics 2021, 10, 2542. [Google Scholar] [CrossRef]
  22. Deilami, S.; Masoum, A.S.; Moses, P.S.; Masoum, M.A.S. Real-time coordination of plug-in electric vehicle charging in smart grids to minimize power losses and improve voltage profile. IEEE Trans. Smart Grid 2011, 2, 456–467. [Google Scholar] [CrossRef]
  23. Yong, J.Y.; Ramachandaramurthy, V.K.; Tan, K.M.; Mithulananthan, N. Bi-directional electric vehicle fast charging station with novel reactive power compensation for voltage regulation. Int. J. Electr. Power Energy Syst. 2015, 64, 300–310. [Google Scholar] [CrossRef]
  24. Shaaban, M.F.; Atwa, Y.M.; El-Saadany, E.F. PEVs modeling and impacts mitigation in distribution networks. IEEE Trans. Power Syst. 2012, 28, 1122–1131. [Google Scholar] [CrossRef]
  25. Reddy, M.S.K.; Selvajyothi, K. Optimal placement of electric vehicle charging station for unbalanced radial distribution systems. Energy Sources Part A Recovery Util. Environ. Eff. 2025, 47, 1731017. [Google Scholar] [CrossRef]
  26. Sanjay, R.; Jayabarathi, T.; Raghunathan, T.; Ramesh, V.; Mithulananthan, N. Optimal allocation of distributed generation using hybrid grey wolf optimizer. IEEE Access 2017, 5, 14807–14818. [Google Scholar] [CrossRef]
  27. Liu, Z.; Wen, F.; Ledwich, G. Optimal planning of electric-vehicle charging stations in distribution systems. IEEE Trans. Power Deliv. 2012, 28, 102–110. [Google Scholar] [CrossRef]
  28. Fokui, W.S.T.; Saulo, M.J.; Ngoo, L. Optimal placement of electric vehicle charging stations in a distribution network with randomly distributed rooftop photovoltaic systems. IEEE Access 2021, 9, 132397–132411. [Google Scholar] [CrossRef]
  29. Onlam, A.; Yodphet, D.; Chatthaworn, R.; Surawanitkun, C.; Siritaratiwat, A.; Khunkitti, P. Power loss minimization and voltage stability improvement in electrical distribution system via network reconfiguration and distributed generation placement using novel adaptive shuffled frogs leaping algorithm. Energies 2019, 12, 553. [Google Scholar] [CrossRef]
  30. Altaf, M.; Yousif, M.; Ijaz, H.; Rashid, M.; Abbas, N.; Khan, M.A.; Waseem, M.; Saleh, A.M. PSO-based optimal placement of electric vehicle charging stations in a distribution network in smart grid environment incorporating backward forward sweep method. IET Renew. Power Gener. 2024, 18, 3173–3187. [Google Scholar] [CrossRef]
  31. Kayal, P.; Chanda, S.; Chanda, C.K. An analytical approach for allocation and sizing of distributed generations in radial distribution network. Int. Trans. Electr. Energy Syst. 2017, 27, e2322. [Google Scholar] [CrossRef]
  32. Imran, A.M.; Kowsalya, M.; Kothari, D.P. A novel integration technique for optimal network reconfiguration and distributed generation placement in power distribution networks. Int. J. Electr. Power Energy Syst. 2014, 63, 461–472. [Google Scholar] [CrossRef]
  33. Nagaballi, S.; Kale, V.S. Pareto optimality and game theory approach for optimal deployment of DG in radial distribution system to improve techno-economic benefits. Appl. Soft Comput. 2020, 92, 106234. [Google Scholar] [CrossRef]
  34. Pham, T.D.; Nguyen, T.T.; Dinh, B.H. Find optimal capacity and location of distributed generation units in radial distribution networks by using enhanced coyote optimization algorithm. Neural Comput. Appl. 2021, 33, 4343–4371. [Google Scholar] [CrossRef]
  35. Sharma, S.; Bhattacharjee, S.; Bhattacharya, A. Quasi-Oppositional Swine Influenza Model Based Optimization with Quarantine for optimal allocation of DG in radial distribution network. Int. J. Electr. Power Energy Syst. 2016, 74, 348–373. [Google Scholar] [CrossRef]
  36. Kamel, S.; Amin, A.; Selim, A.; Ahmed, M.H. Optimal placement of DG and capacitor in radial distribution systems considering load variation. In Proceedings of the 2019 International Conference on Computer, Control, Electrical, and Electronics Engineering (ICCCEEE), Khartoum, Sudan, 21–23 September 2019; pp. 1–6. [Google Scholar]
  37. Balu, K.; Mukherjee, V. Optimal siting and sizing of distributed generation in radial distribution system using a novel student psychology-based optimization algorithm. Neural Comput. Appl. 2021, 33, 15639–15667. [Google Scholar] [CrossRef]
  38. Pamuk, N.; Uzun, U.E. Optimal allocation of distributed generations and capacitor banks in distribution systems using arithmetic optimization algorithm. Appl. Sci. 2024, 14, 831. [Google Scholar] [CrossRef]
  39. Saleh, A.A.; Mohamed, A.-A.A.; Hemeida, A.M.; Ibrahim, A.A. Comparison of different optimization techniques for optimal allocation of multiple distribution generation. In Proceedings of the 2018 International Conference on Innovative Trends in Computer Engineering (ITCE), Aswan, Egypt, 19–21 February 2018; pp. 317–323. [Google Scholar]
  40. McAsey, M.; Mou, L.; Han, W. Convergence of the forward-backward sweep method in optimal control. Comput. Optim. Appl. 2012, 53, 207–226. [Google Scholar] [CrossRef]
  41. Chang, G.W.; Chu, S.Y.; Wang, H.L. A simplified forward and backward sweep approach for distribution system load flow analysis. In Proceedings of the 2006 International Conference on Power System Technology, Chongqing, China, 22–26 October 2006; pp. 1–5. [Google Scholar]
  42. Karaboga, D. An Idea Based On Honey Bee Swarm for Numerical Optimization; Technical Report-TR06; Computer Engineering Department, Erciyes University: Kayseri, Turkey, 2005; pp. 1–10. [Google Scholar]
  43. Karaboga, D.; Basturk, B. A powerful and efficient algorithm for numerical function optimization: Artificial bee colony (ABC) algorithm. J. Glob. Optim. 2007, 39, 459–471. [Google Scholar] [CrossRef]
  44. Basturk, B. An artificial bee colony (ABC) algorithm for numeric function optimization. In Proceedings of the IEEE Swarm Intelligence Symposium, Indianapolis, IN, USA, 12–14 May 2006; Volume 2006, p. 12. [Google Scholar]
  45. Tu, J.; Yu, H.; Zhong, J.; Jian, L. User-needs-oriented shared DC charging resources optimal configuration and operation for improving EV penetration in old residential communities. Sustain. Cities Soc. 2024, 114, 105796. [Google Scholar] [CrossRef]
Figure 1. Single line diagram of distribution system.
Energies 18 06018 g001
Figure 2. BFS flow chart for load-flow analysis.
Energies 18 06018 g002
Figure 5. Voltage profile after optimal placement of EVCSs and DGs for IEEE-33 RDS.
Energies 18 06018 g005
Figure 6. Real power loss after optimal placement of EVCSs and DGs of IEEE-33 RDS.
Energies 18 06018 g006
Figure 7. Reactive power loss after optimal placement of EVCSs and DGs in IEEE-33 RDS.
Energies 18 06018 g007
Figure 8. Comparison of total active power loss after EVCSs and DGs in IEEE-33 RDS.
Energies 18 06018 g008
Figure 9. Comparison of total reactive power loss after EVCSs and DGs in IEEE-33 RDS.
Energies 18 06018 g009
Figure 10. Comparison voltage deviation after EVCSs and DGs in IEEE-33 RDS.
Energies 18 06018 g010
Figure 11. Voltage improvement following the ideal placement of EVCSs and DGs in IEEE-33 RDS.
Energies 18 06018 g011
Figure 12. Sensitivity performance of the proposed GLAD-ABC-based optimization across multiple DGs for IEEE-33 RDS.
Energies 18 06018 g012
Figure 13. Convergence characteristic graph of GLAD-ABC for all operational case studies for IEEE RDS.
Energies 18 06018 g013
Figure 14. IEEE-69 bus radial distribution system.
Energies 18 06018 g014
Figure 15. Voltage profile after optimal placement of EVCSs and DGs for IEEE-69 RDS.
Energies 18 06018 g015
Figure 16. Real power loss after optimal placement of EVCSs and DGs of IEEE-69 RDS.
Energies 18 06018 g016
Figure 17. Reactive power loss after optimal placement of EVCSs and DGs of IEEE-69 RDS.
Energies 18 06018 g017
Figure 18. Comparison of Total active power loss after EVCSs and DGs in IEEE-69 RDS.
Energies 18 06018 g018
Figure 19. Comparison of Total reactive power loss after EVCSs and DGs in IEEE-69 RDS.
Energies 18 06018 g019
Figure 20. Comparison of voltage variation after EVCSs and DGs in IEEE-69 RDS.
Energies 18 06018 g020
Figure 21. Voltage improvement following the ideal placement of EVCSs and DGs in IEEE-69 RDS.
Energies 18 06018 g021
Figure 22. Sensitivity performance of the proposed GLAD-ABC-based optimization across multiple DGs for IEEE-69 RDS.
Energies 18 06018 g022
Figure 23. Convergence characteristic graph of GLAD-ABC for all operational case studies for IEEE-69 bus RDS.
Energies 18 06018 g023
Table 1. EVCS load modeling assumptions.
AssumptionDescription
Constant-PowerEach EVCS is modeled as a constant-power load during charging periods
Peak DemandMaximum simultaneous charging of all connected EVs represents peak demand
Diversity FactorA factor D f < 1 is applied to reflect stochastic arrival/departure of EVs.
Steady-StateSteady-state assumption is used for distribution-level planning analysis
Table 2. Real and reactive power losses with respective locations after integration of EVCSs and DGs in IEEE—33 RDS using GLAD-ABC.
CasesBus No.Real Power Loss (KW)Reactive Power Loss (Kvar)Voltage
Deviation
(p.u)
Base case-210.303143.14011.640
3 EVCSs2, 20, 19240162.78212.376
5 EVCSs3, 20, 23, 2, 19326.911208.60215.338
1 DG29112.52378.8614.213
2 DGs13, 3082.94856.9021.083
3 DGs30, 14, 2469.39748.0861.013
Table 3. Comparison of power losses reduction with other optimizations for IEEE-33 RDS.
TechniquesDG LocationDG Size (MW)Active Power
Loss in KW with DG
Power Loss
(Reduction %)
GA [30]29, 8, 32, 160.5, 0.5, 0.5, 0.578.92062.52
SA [30]30, 130.079, 0.445, 0.096178.2810.45
AM [31]13, 29, 311.121, 1.027, 0.12689.557.28
FWA [32]14, 18, 320.5897, 0.1895, 1.014688.6856.24
MTLBO [33]23, 32, 151.066, 0.847, 0.88580.2262
JAYA [33]29, 25, 120.921, 0.795, 1.11076.6663.6
GWO [33]12, 25, 300.955, 0.889, 1.03774.1064.88
COA [34]14, 25, 300.7096, 0.5954, 0.99727663.98
ECOA [34]14, 25, 300.7376, 0.6518, 1.070574.664.64
SIMBO-Q [35]14, 24, 290.7638, 1.0415, 1.135273.465.20
AA [36]13, 24, 300.79, 1.07, 1.01272.8965.45
HHO [37]13, 24, 300.8173, 1.0829, 1.046572.8065.4956
SPBO [37]14, 24, 300.7723, 1.1059, 1.068572.7965.5003
AOA [38]14, 24, 300.7764, 1.0990, 1.070272.7965.50
Proposed GLAD-ABC14, 24, 300.771, 1.094, 1.09669.39767.0014
Table 4. Real and reactive power losses with respective location after integration of EVCS and DGs in IEEE—69 RDS using GLAD-ABC.
CasesBus NumberReal Power (KW)Reactive Power Loss (Kvar)Voltage
Deviation
Base case-224.55102.019.762
3 EVCSs28, 36, 47244.836119.33111.782
5 EVCSs28, 36, 40, 47, 48304.674155.67313.807
1 DG6186.86542.5002.582
2 DGs17, 6173.46536.7440.780
3 DGs15, 61, 6470.07835.1110.736
Table 5. Comparison of power losses reduction with other optimizations for IEEE-69 RDS.
TechniquesDG LocationDG Size (MW)Active Power Loss in KW with DGPower Loss
(Reduction %)
FWA [32]65, 61, 270.4085, 1.1986, 0.225877.8565.39
MTLBO [33]20, 62, 570.079, 0.445, 0.09677.3665.61
JAYA [33]61, 50, 122.000, 0.100, 1.01675.8366.29
GWO [33]61, 50, 122.000, 0.586, 0.79273.4367.36
SIMBO-Q [35]61, 9, 171.500, 0.6189, 0.529771.368.3
QOSIMBO-Q [35]9, 18, 610.8336, 0.4511, 1.50071.068.43
HHO [37]12, 61, 620.7341, 1.1912, 0.762374.1467.046
WOA [39]49, 18, 610.84046, 0.53352, 1.808470.1968.40
DA [39]66, 14, 610.84046, 0.533352, 1.808471.1068.40
Proposed GLAD-ABC15, 61, 640.548, 1.491, 0.29670.0868.7918
Disclaimer/Publisher’s Note: The statements, opinions and data contained in all publications are solely those of the individual author(s) and contributor(s) and not of MDPI and/or the editor(s). MDPI and/or the editor(s) disclaim responsibility for any injury to people or property resulting from any ideas, methods, instructions or products referred to in the content.