Abstract
Rapid evolution in electrified transportation and, in general, sustainability of electrical and electronic assets is turning the traditional power supply and utilization into something more complex and less known. This transition involves increasing operating voltage and specific power, as well as various types of power supply sources, from AC sinusoidal to DC and power electronics. This revolution, beneficial for asset efficiency and resilience, does come at the cost of increased risk of failure for electrical insulation systems. Intrinsic and extrinsic aging mechanisms are not completely known under DC and power electronics, and the risk of inception of partial discharges, PD, which is the most harmful extrinsic aging factor for electrical insulation, is as high, or even higher, compared with AC. To complicate the picture, electrical and electronic components can be used at different pressure levels, such as in aerospace, and it is known that partial discharge inception voltage, PDIV, drops down, and PD magnitude increases, lowering pressure. Models to predict PDIV for surface and internal discharges, as function of pressure, have been proposed recently, but they cannot be applied straightforwardly on practical asset components where type and locations of defects generating PD is unknown. This paper wants to close this application gap. Derivation and validation of an approximate, heuristic model able to predict PDIV at various pressure levels below and above the standard atmospheric pressure, SAP, are dealt with in this paper, referring to typical asset components such as cables, motors, printed circuit-boards, PCB, and under sinusoidal AC voltage. The good capability of the model to predict PDIV and any investigated pressure, from 3 to 0.05 bar, is validated by PD measurements performed using an innovative, automatic PD analytics software able to identify the typology of defect generating PD, i.e., whether surface or internal.
1. Introduction
Sustainability of electrical and electronic components involves fast and inevitable transition to electrification of transportation and industrial assets. In this context, design of electrical insulation systems or electrical asset components is becoming critical for a series of factors that range from voltage waveform (more DC and power electronics, less AC sinusoidal) to increased specific power (thus voltage, electric field, and temperature). With power electronics and DC waveforms, we may lose some of those assessed insulation design criteria developed in many decades of experience and field returns gained from AC sinusoidal. As in AC, intrinsic and extrinsic aging mechanisms are active in DC and modulated AC supply [1,2,3,4,5,6], often (especially for the latter) including the presence of partial discharges, PD [7,8,9,10,11,12,13], but in less predictable and understood ways. Reliability can be compromised, and component life can become much shorter than expected and specified. Also, safety issues can become an increasing issue.
A further factor is pressure. Pressures lower than SAP are involved in aircraft and aerospace applications (vehicles and installations) [14,15], but also operation at pressure higher than SAP can be expected for electrical components, such as cables and motors (e.g., in gas-insulated switchgear, GIS, and lines, GIL). As is known from the literature [16,17,18], partial discharge inception voltage, PDIV, of an insulation system varies with pressure, decreasing when pressure diminishes. This means that designing insulation systems of electronics and electrical apparatus cannot rely upon SAP consolidated practice. For example, inception of PD can occur during aircraft cruise, even if at low altitude or on ground aircraft the electrical asset is PD-free.
Considering that PD are a major source of insulation system premature failure, PD-free operation is a must for any electrical and electronic component, especially in aviation and aerospace where reliability is a critical property.
On the other hand, it is not always possible to experimentally determine the PDIV of real-size insulation systems at variable pressure, e.g., for a matter of availability of large pressure chambers, and, in general, to be able to have fast feedback in evaluating design solutions for insulation systems. This is particularly important in cases where full-size insulation systems or equipment must be tested in their integrated operational configuration, as system-level interactions or geometry can significantly influence the electric field distribution and, consequently, the PD behavior.
This paper tries to give an answer to such a challenge. A new heuristic model for the estimation of the PDIV of an insulation system at pressures above and below SAP, in cases where size/location of a defect and the corresponding electric field distribution are not known, is proposed and validated through PD measurements carried out, under sinusoidal AC, by an innovative software that allows identification of the type of defect generating either surface or internal PD. Specifically, the heuristic model allows non-linear extrapolation of PDIV estimates to low (and high) pressure levels upon knowing PDIV (and the typology of PD) at SAP. Test objects are electrical and electronic asset components of, e.g., electrified transportation assets, namely motors, cables, and PCB planar transformers. Specifically, Section 2 describes the heuristic PDIV estimation model, while Section 3 reports the comparison between measurements and model estimates on different electrical asset components, with and without artificial defects.
2. Partial Discharge Inception Model Generation
Design conceptuality of insulation systems has been reformulated recently through the “three leg-approach” [19], which provides both compliance to reliability specifications that generally refer to intrinsic insulation aging (life at given failure probability) and the goal of partial discharge-free design (avoiding extrinsic aging that will cause premature insulation failure).
This new design framework can be exploited for the estimation of bulk, surface, or interface PDIV of an insulation system. This approach is valid for both AC and DC systems, and it is based on three steps (the “legs”), which are as follows:
- Electric field (and temperature distribution) simulation of the insulation system/object under study;
- Modeling of the PD inception field and voltage, PDIE and PDIV, respectively;
- Perform PD measurements to validate the results predicted by leg 2.
Specifically, the voltage at which the maximum (in the following 95% of the peak value) electric field in an insulation system (calculated at leg 1) matches the PD inception field estimated by the model at leg 2 is the partial discharge inception voltage, PDIV. Eventually, the experimental PDIV value determined from leg 3 can validate the estimated PDIV obtained from legs 1 and 2 upon having available a tool which is able to identify PD typology, that is, whether internal or surface [20]. This can be achieved by human experts (but only under sinusoidal AC voltage supply) or by the type of automatic analytic software mentioned above.
The need for PD source identification comes from the difference in the PD inception field model parameter values when applied to internal or surface discharges, which is originated by the different mechanisms involved in internal (small cavities) or surface discharges. The generalized partial discharge inception field model, leg 2, can be expressed as follows [21,22]:
where p is gas pressure; , , and are empirical (physics-based) parameters related to the discharge process; l is distance between HV and LV electrodes (creepage for surface insulation sub-systems); and is a scale factor that localizes PD inception probability around the volume/surface where electric field is maximum (e.g., triple points). In the case of internal discharges, l = d, i.e., the height of a cylindrical cavity filled with air (or, approximately, the diameter of a spherical cavity) and = 1 (electric field is mostly uniform inside the cavity). is generally ≤1 for surface discharges (=1 when field is uniform). However, as mentioned, model parameter values change with the type of discharges, whether internal or surface, according to Table 1.

Table 1.
Parameter values of the generalized partial discharge model, (1), [19,21,22], for insulation systems in air.
As can be seen, pressure is an explicit parameter of the model, thus in principle it can be applied to pressure levels below and above SAP. Therefore, this model can be used to estimate PDIE in any component of an electrical asset, knowing electric field distribution (leg 1) and model parameter values. In this way, PD-free insulation system design can be achieved, which does not simply rely upon concepts that, such as creepage and clearance, are based on the risk of destructive discharges (flashover).
There is, however, a significant limitation for the application of model (1) to complex electrical asset components, that is, the knowledge of electric field profile at defect location, which is step one of the three-leg approach, is needed. The best information that we have available is, indeed, measurement of PDIV (leg 3), but we need to use a PD analysis software which will allow the type of PD to be known (as described in [20]), or, otherwise, the support of an expert (which might be, often, unavailable). Another constraint is that in most cases PDIV can be measured only at SAP and not at the real operation pressure (due, e.g., to lack of pressure chamber of adequate dimensions).
Therefore, a more practical, even if approximate, model should be developed to be able to manage electrical asset components, such as cables, motors, laminated busbars, and transformers, where it is often impossible to know the location, shape, and size of defects generating PD, and thus leg 1 cannot be applied successfully. To this purpose, the following simple transformation applies to Equation (1).
Multiplying by , a rough estimation of PDIV for internal and surface discharges ( and ) can be obtained from the following (1):
where PDIV = for = d.
Model parameters are known and given in Table 1. The unknowns are d and for internal and surface PD inception models, respectively. Such parameters can be estimated through fitting to PD measurements at any pressure level, generally SAP, of the new approximate (named heuristic in the following) model of Equation (2), referring to the type of PD as identified by the PD detection and analysis system (or expert).
PD detection tools like that described in [20], which allow automatic, unsupervised measurement to be performed together with related analytics, can be successfully used to determine whether the internal or surface version of model (2) should be fitted to experimental PD measurements. The innovative PD software used here provides PD typology (internal, surface, or corona), associated with a likelihood (based on fuzzy logic engine), so that choice of internal, surface, or an envelope obtained using both models (when identification provides equivalent likelihood of internal and surface discharges), is made possible [20].
In summary, having chosen the model and relevant parameters from Table 1 (based on PD measurement output), the value of in the case of surface discharges and d in the case of internal discharges is varied such that the calculated PDIV at SAP coincides with the measured PDIV at SAP. This will enable PDIV estimation at different pressure levels. To summarize, the whole procedure is based on one measurement (e.g., at SAP) and the identification of the type of defect generating PD.
3. Estimation of PDIV for Various Electrical Asset Components and Validation
Electrical and electronic asset components can operate at low or high pressure and maximum electrical field values able to generate PD. It must be highlighted that even for LV components electrical field can be large enough to incept PD. This can occur, e.g., on the insulation surface, where electric field profile can display large gradients and thus high field values, near to triple points, or in taped thin films/bulk defects (depending on defect size and insulating material permittivity, for AC or conductivity, for DC). For example, typical LV motors can be possibly affected by PD above a few hundred volts.
In the following, PDIV is measured at SAP, as well as lower and higher pressures, in order to validate model (2) for motors, planar transformers with PCB used in power electronics, and cables. The common feature is that the approximate (heuristic model) is applied to estimate PDIV at variable pressure, after model fitting of the latter at SAP, for both unknown and known defects.
3.1. LV Motor
PDIV investigation on motors was carried out considering manufacturing defects and artificial defects, the latter having the purpose of generating surface or internal discharges.
3.1.1. Motor with Manufacturing/Unknown Defects
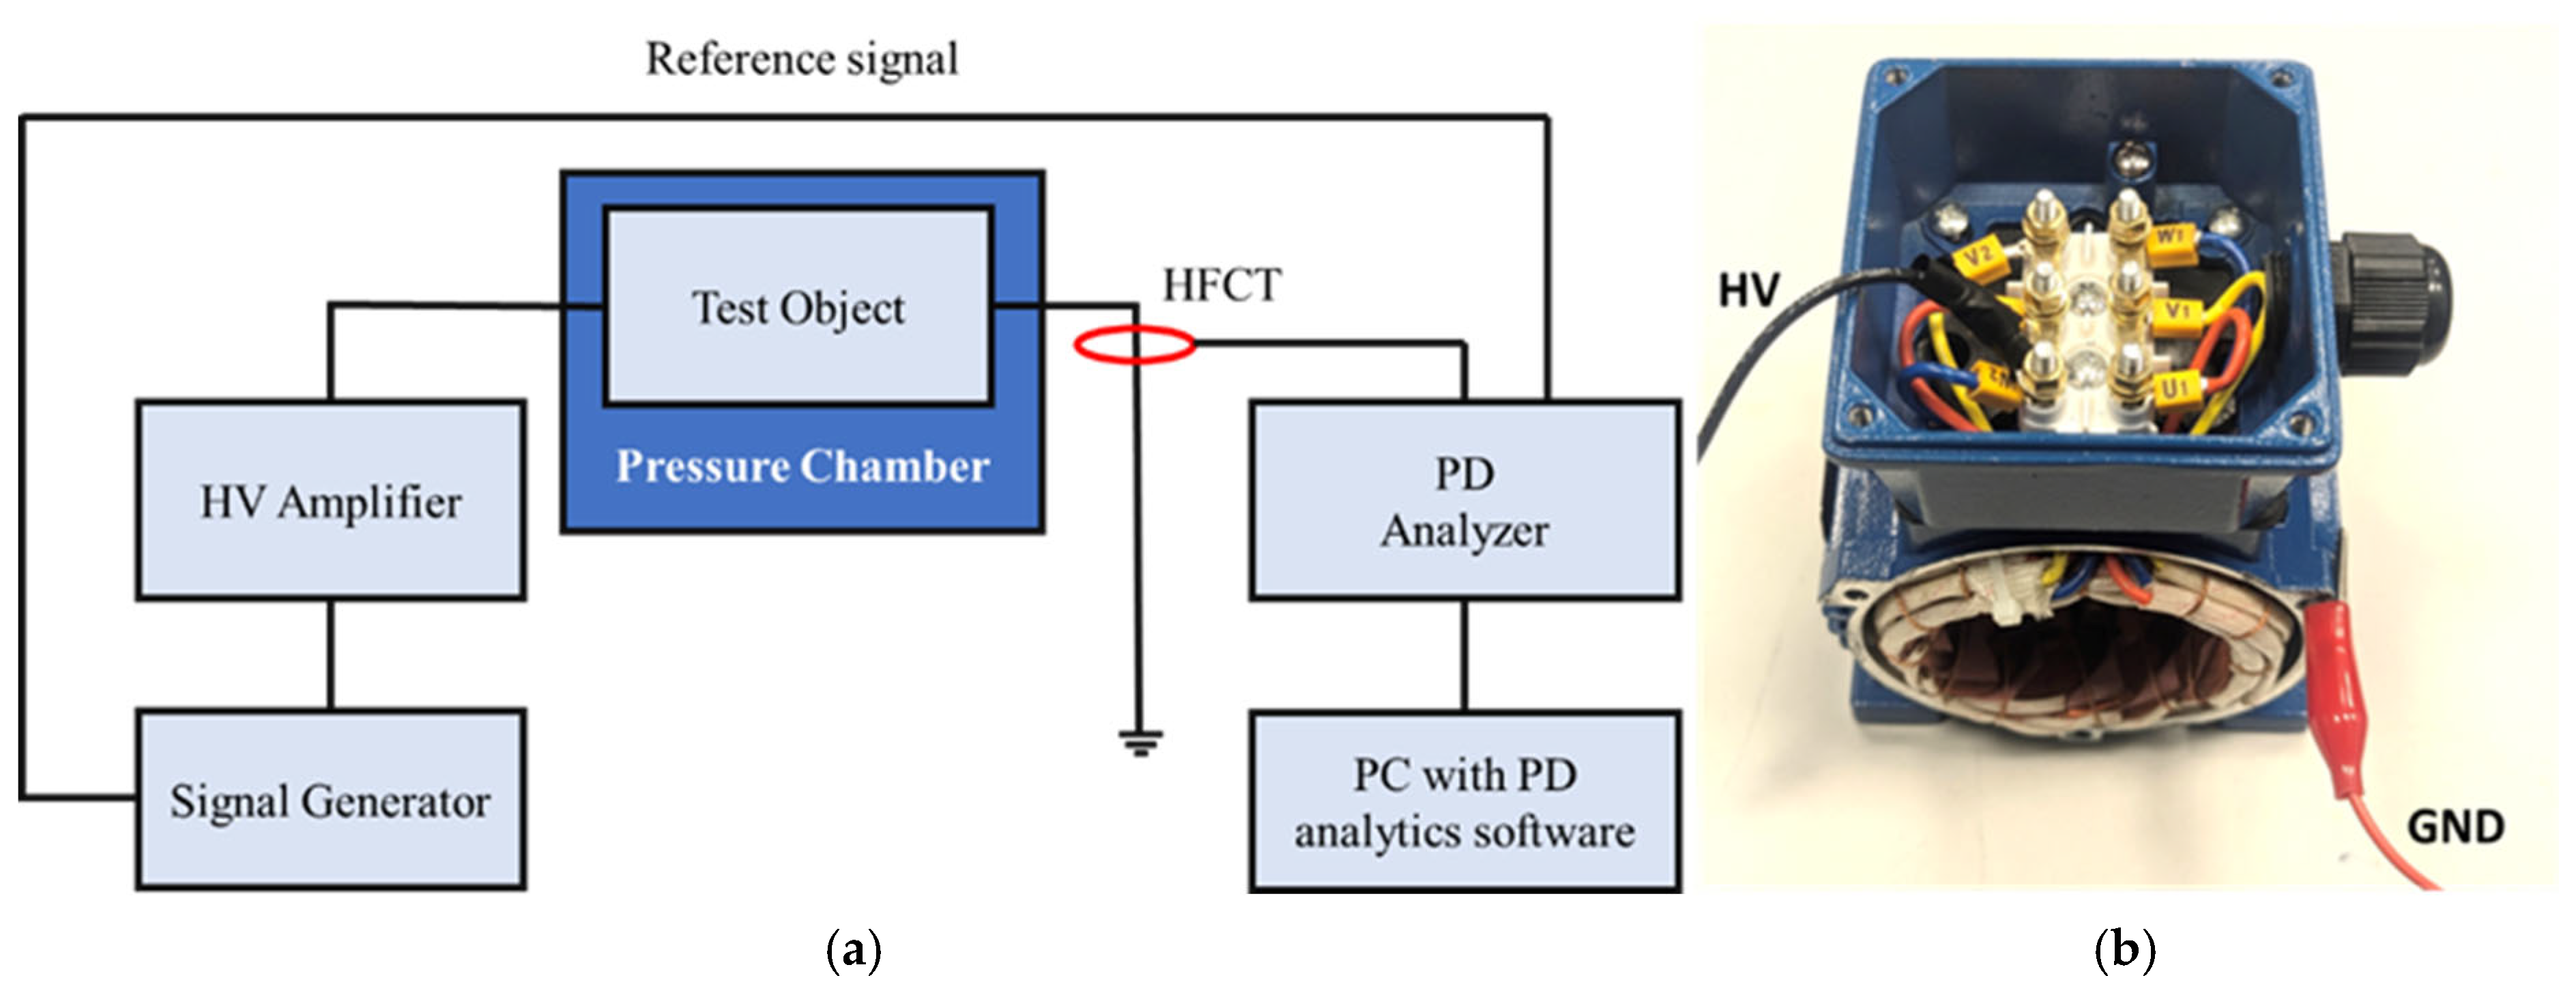
AC PD measurements on the stator insulation of a LV 3-phase AC motor (120 V, 0.12 kW) were performed at different pressure levels (3, 2, 1, 0.5, 0.2 and 0.05 bar), employing the test circuit configuration depicted in Figure 1a. Applied voltage was sinusoidal AC, raised by steps of 50 V lasting 30 s each, till PD inception (repetitive occurrence of PD according to IEC 60270, [8]). The above-mentioned innovative PD detection system, endowed with software (version: 1.5.3-M; Seiktron, Weston, FL, USA) able to acquire and analyze automatically PD pulses (after noise rejection) and output the likelihood of PD typology, was used, with high frequency current transformers (HFCT) as the PD sensor. The stator windings of the three phases of the motor were shorted at the end terminal and high voltage was applied across it, as shown in Figure 1b. The body of the motor was connected to the ground. Tests at low pressure (specifically 0.5, 0.2 and 0.05 bar) were performed in a pressure chamber that can reach 0.01 bar, 180 °C, with variable humidity and up to 50 kV. Tests at high pressure (2 and 3 bar) were carried out in a pressure chamber which can be able to reach 10 bar.
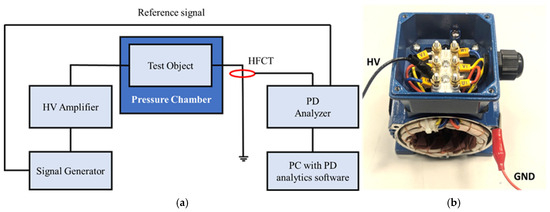
Figure 1.
(a) Schematic of PD measurement setup. (b) Motor with stator windings corresponding to three phases shorted and end terminals connected to HV. The body of the motor is grounded.
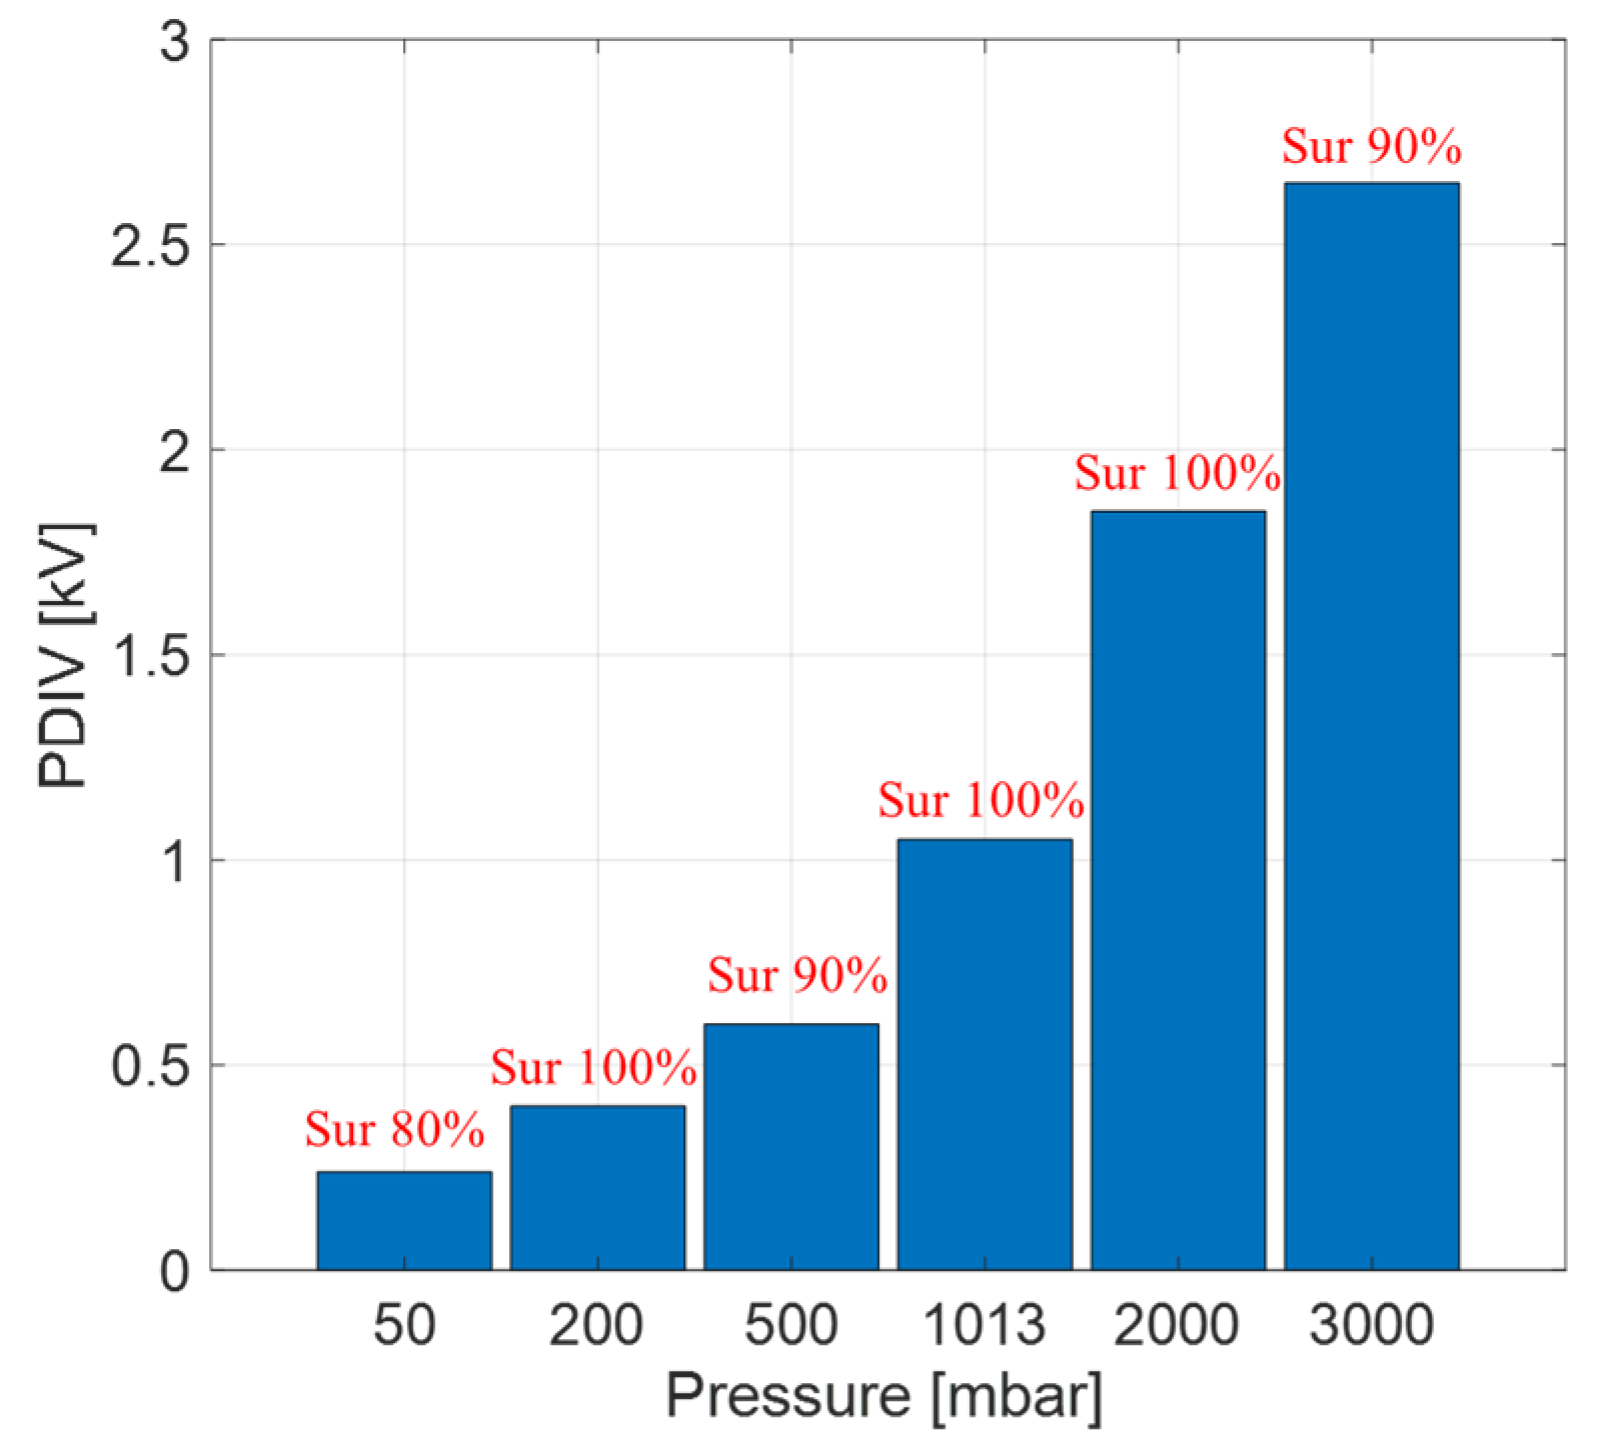
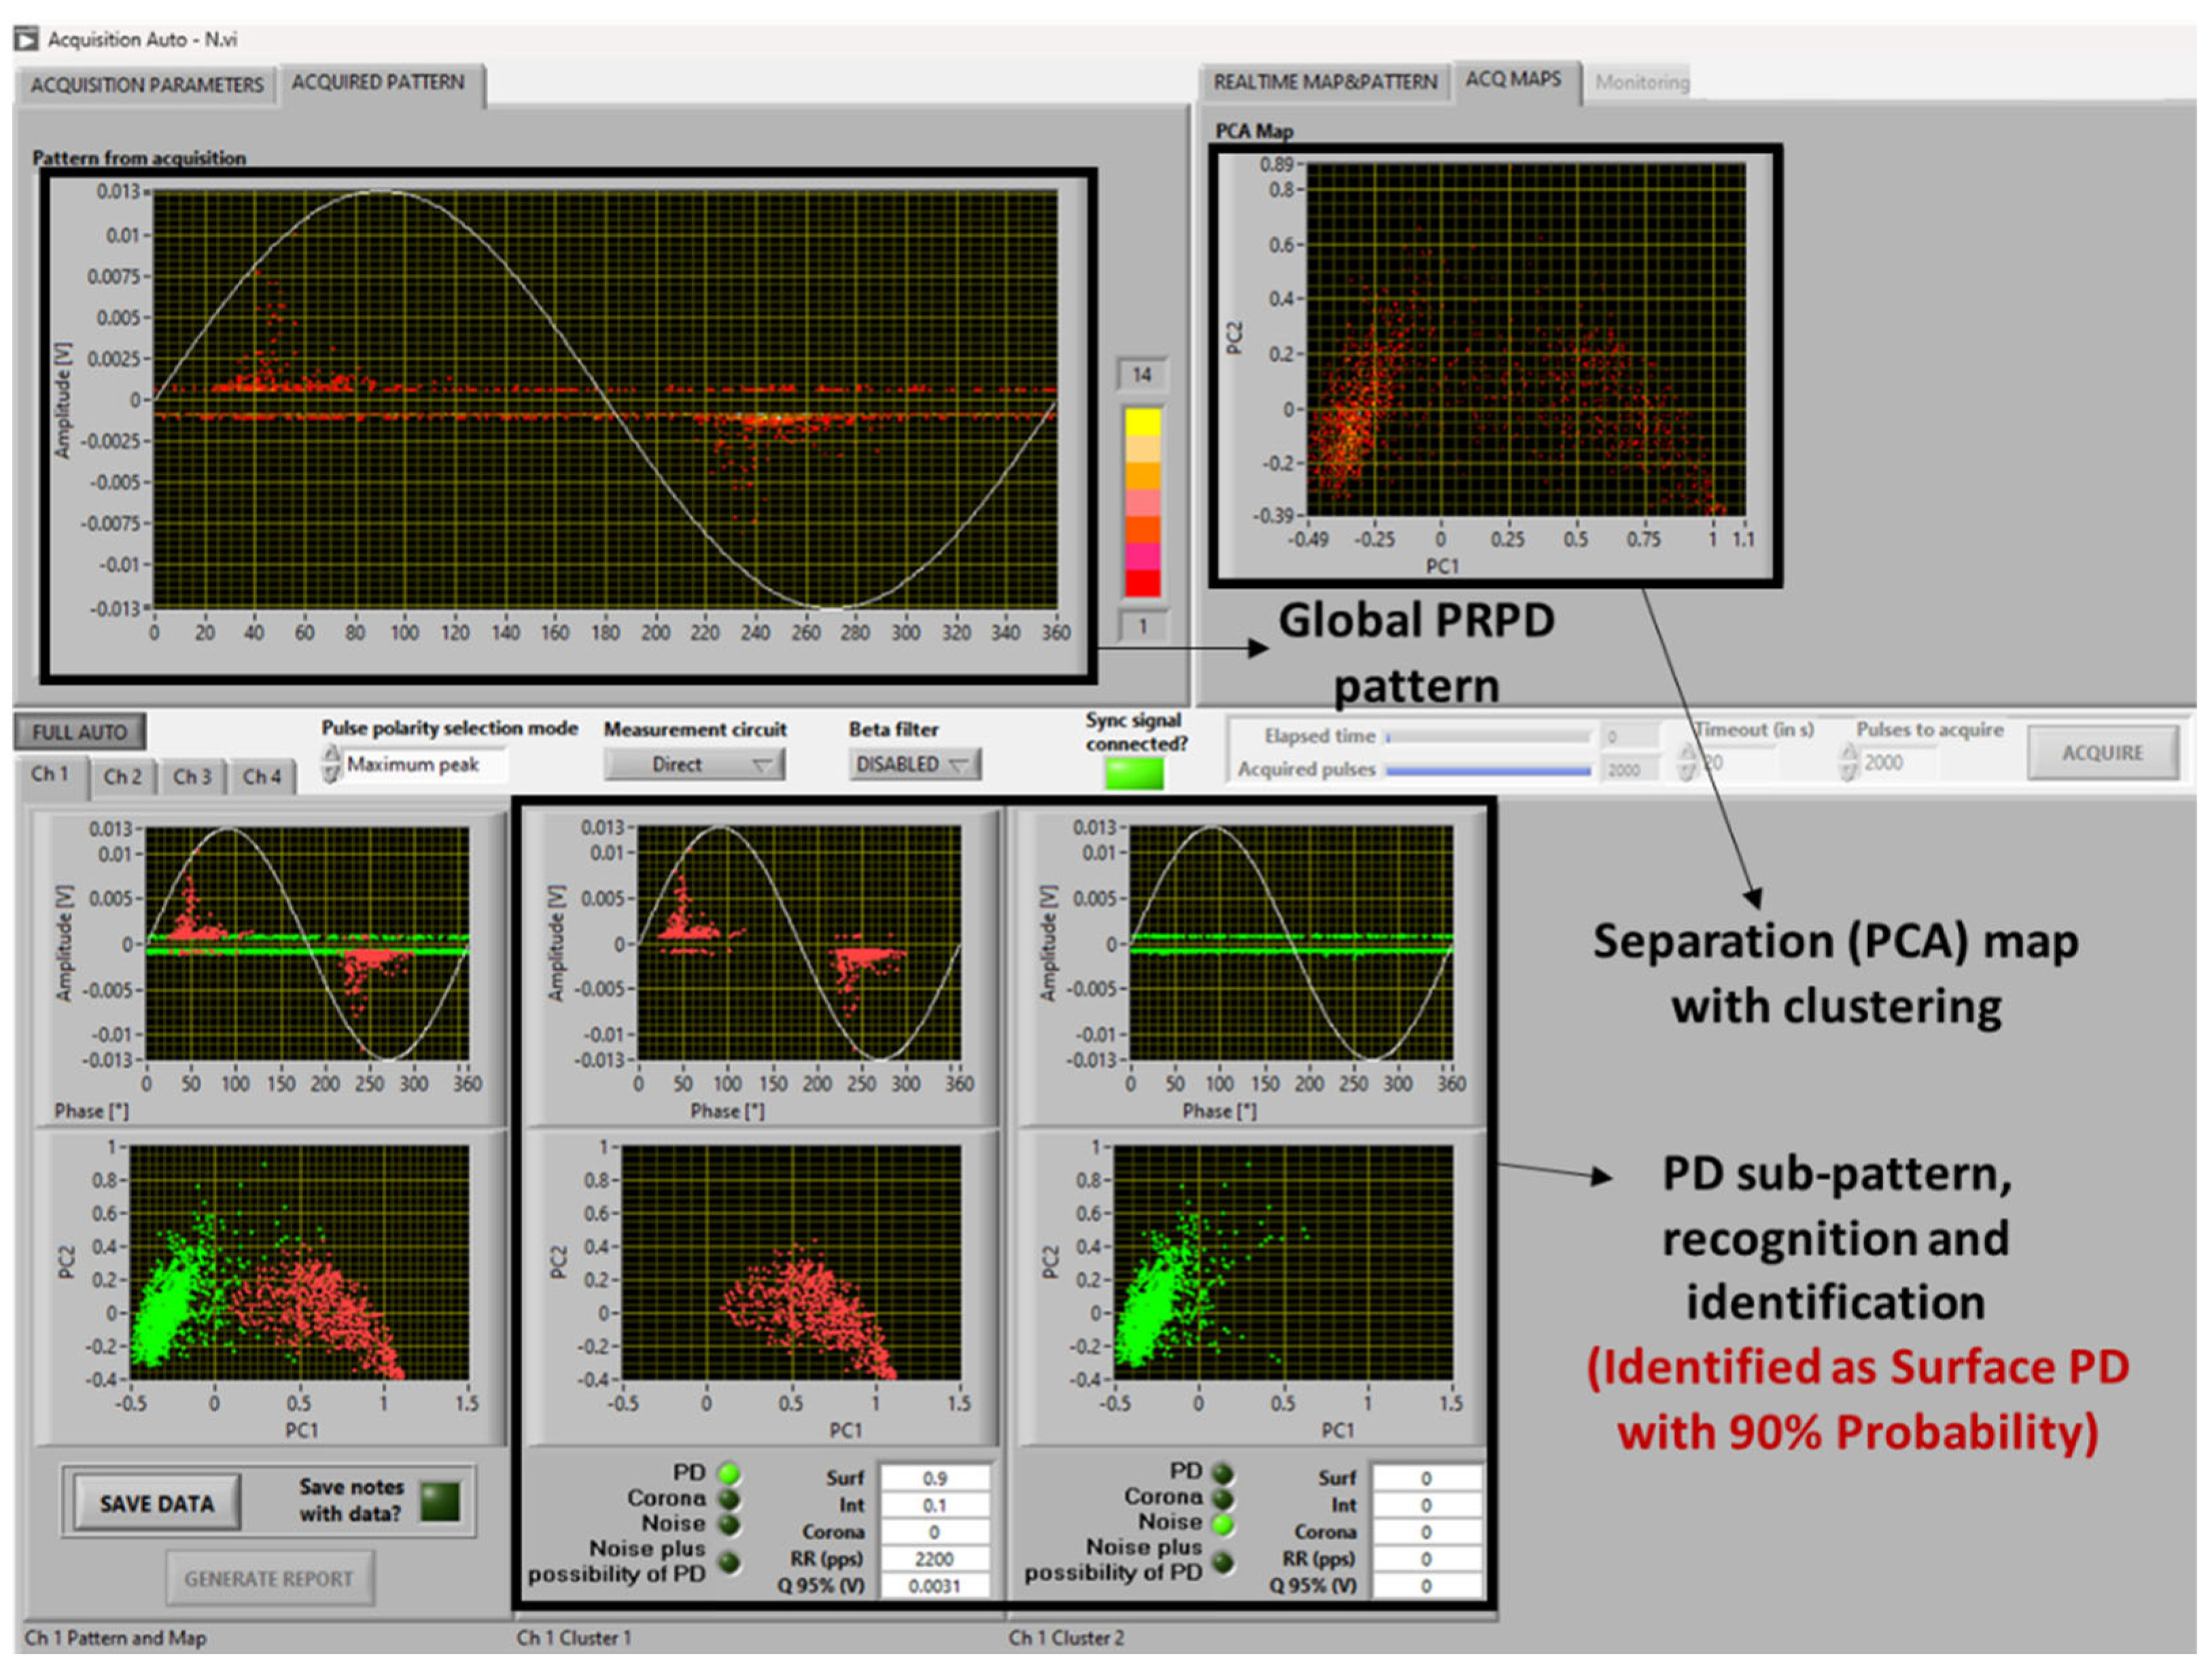
Figure 2 displays mean measured PDIV as a function of pressure, together with the output of the identification software. The PD identification at PDIV was predominately surface at all the pressure levels ranging from 3 to 0.05 bar. Figure 3 depicts the screenshot of the PD analytics for the test object shown in Figure 1 at 3 bar pressure, obtained by using the automatic PD analysis software based on fuzzy logic, thus providing the likelihood of the identification, as shown in Figure 2 [20].
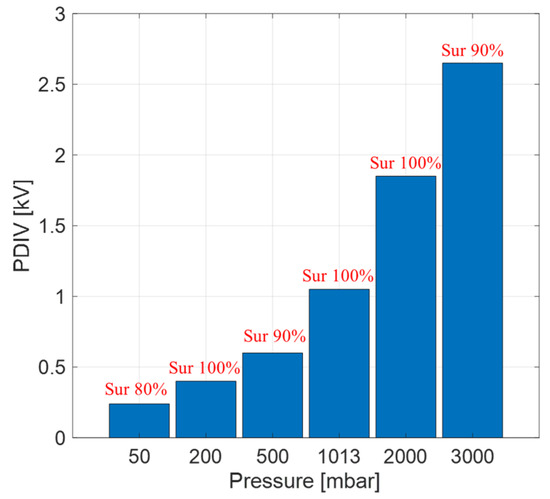
Figure 2.
Mean value of measured PDIV values for the tested motor of Figure 1 at different pressure levels and identification (ID) of defect typology (internal or surface) from the analytics software (with relevant likelihood: for example, Sur 80% means that PD are mostly of surface origin, but there might be a contribution of internal discharge of 20%).
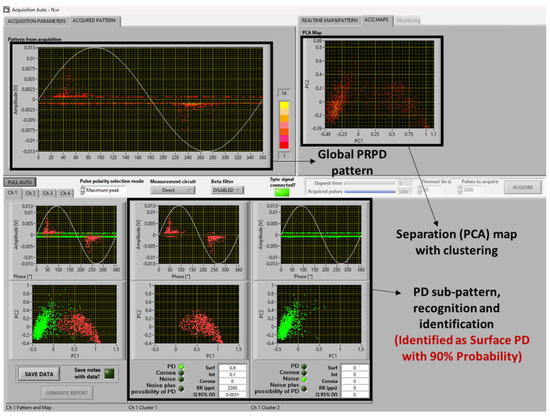
Figure 3.
Screenshot of PD analytics software corresponding to test object as in Figure 1, at 3 bar pressure.
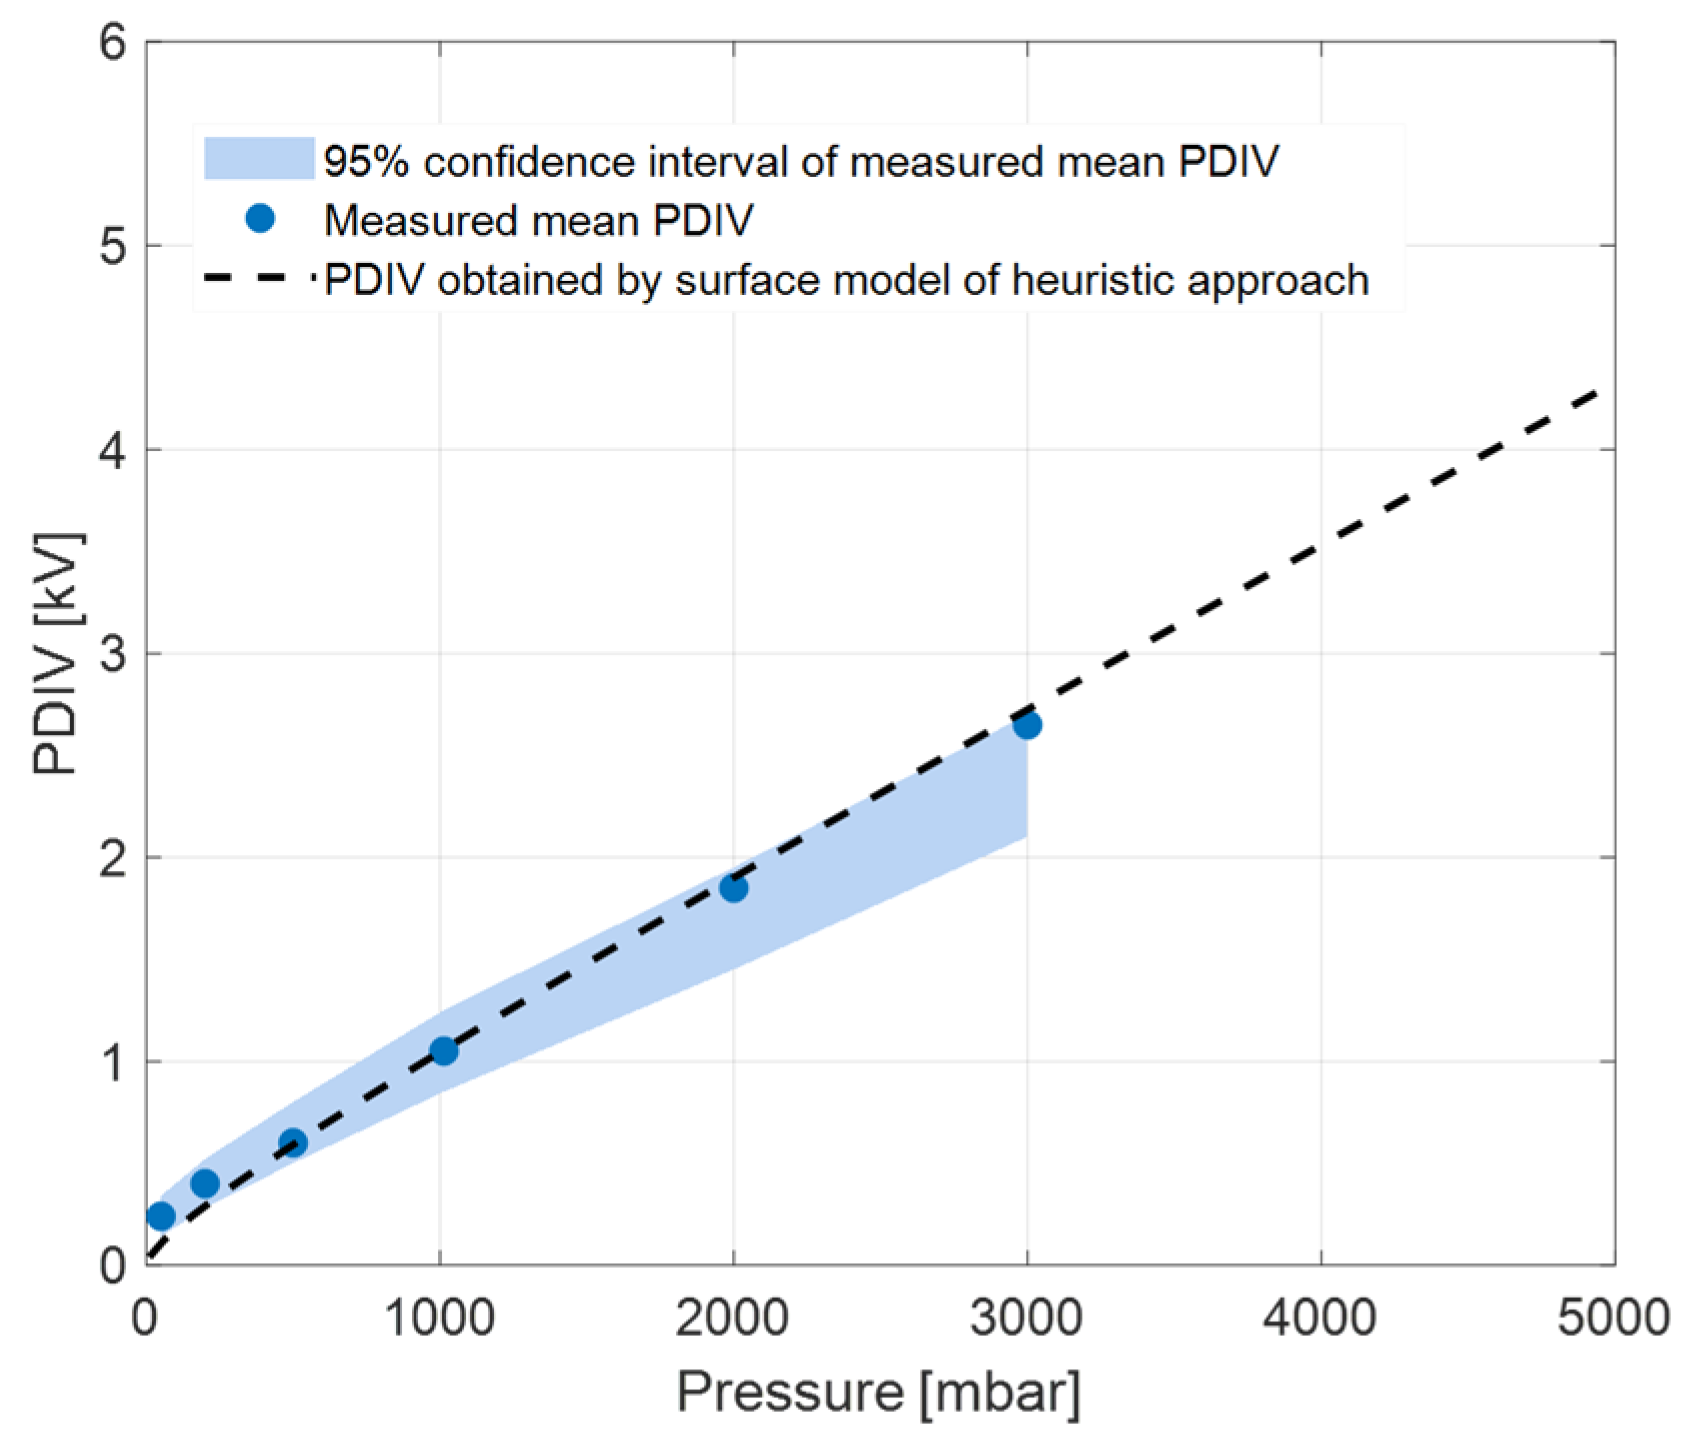
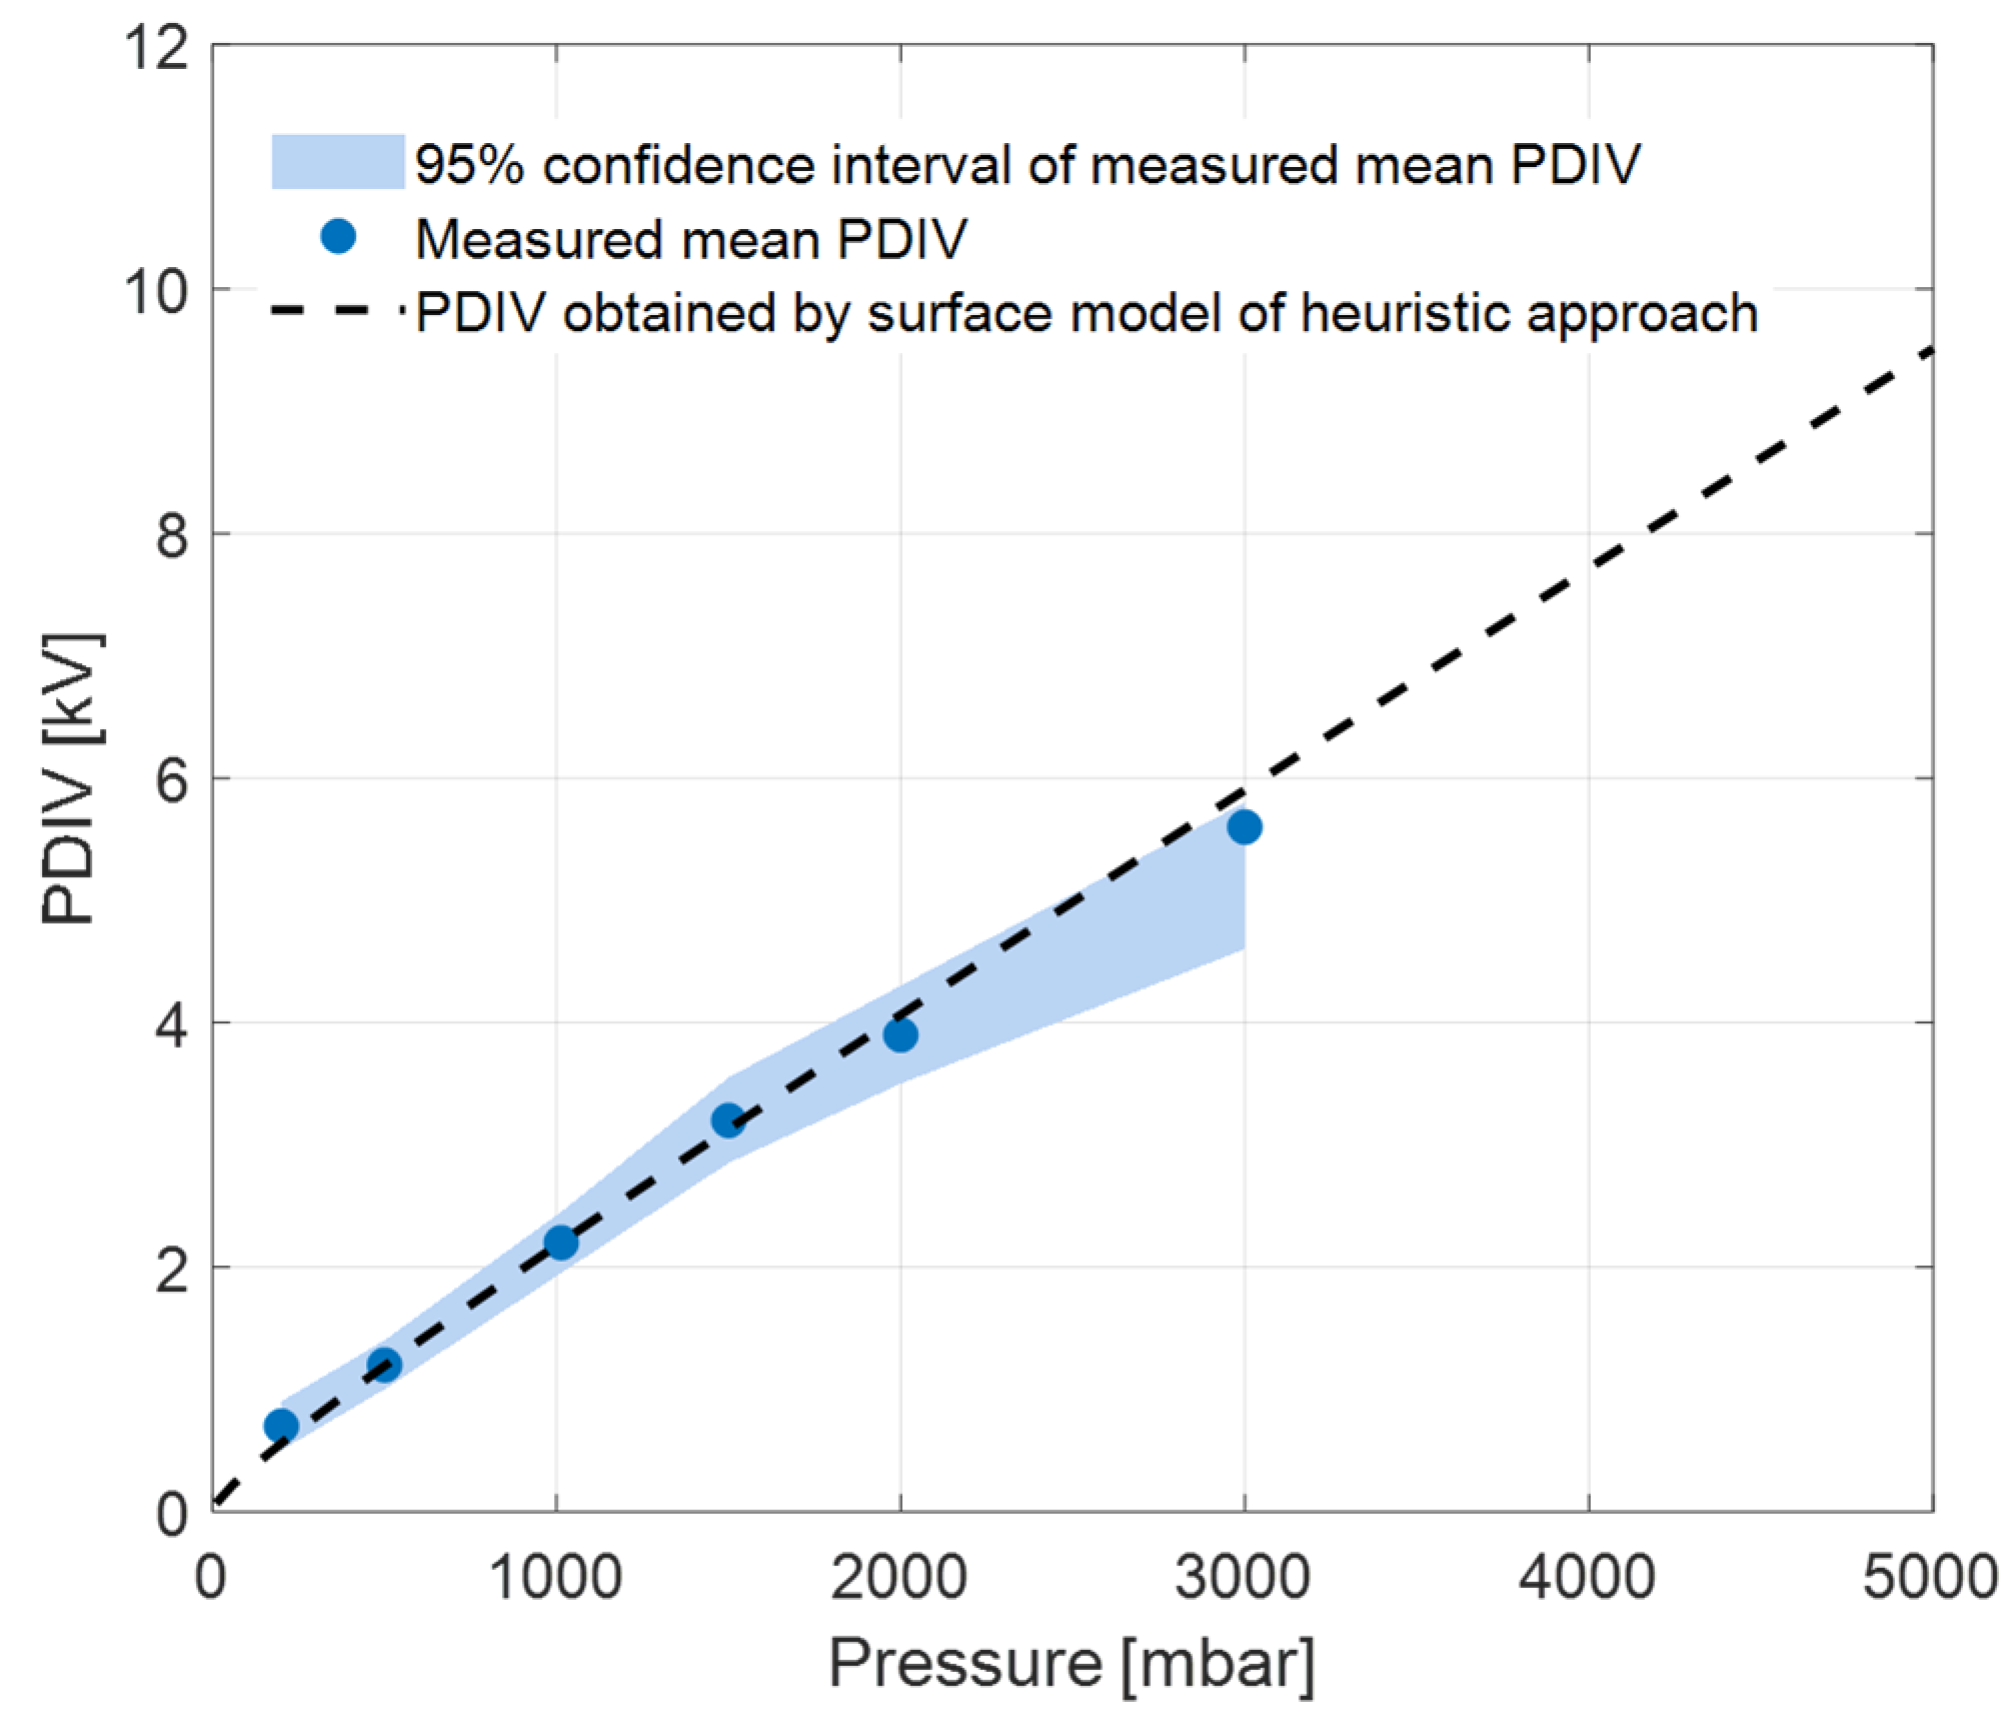
Since the PD typology is predominately surface, the surface version of the heuristic model is applied to estimate PDIV of stator insulation as a function of pressure. At mm, the heuristic model fits to the measured mean PDIV at SAP. Figure 4 reports mean experimental PDIV values with 95% confidence intervals and model fitting. The estimated PDIV line is obtained by fitting to the mean experimental value at SAP and applying model (1) with surface parameter values (Table 1). It is shown that the PDIV values estimated using the heuristic approach are close to those measured in the whole pressure range. Indeed, PDIV values at pressures lower and higher than SAP are noticed to be within the 95% confidence intervals of measured mean PDIV.
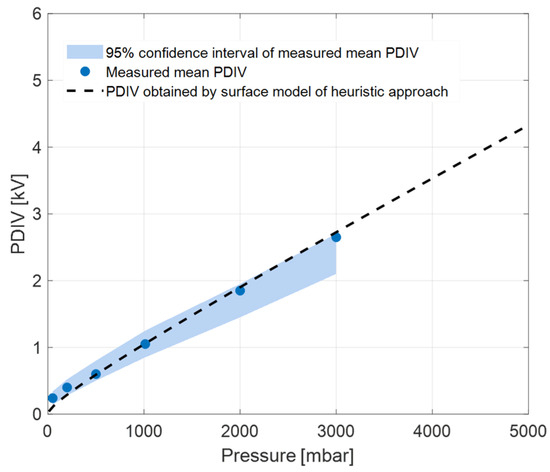
Figure 4.
Estimated surface PDIV values of stator insulation using the heuristic model (with surface discharge parameter values), along with measured mean PDIV and its 95% confidence interval, at different pressure levels.
It is noteworthy that this is a typical case where the exact model of Equation (1) cannot be applied since size and location of defect affected by PD is not known.
3.1.2. Motor with Artificially Developed Defects
Two types of artificial defects were manufactured in order to generate either surface or internal discharges.
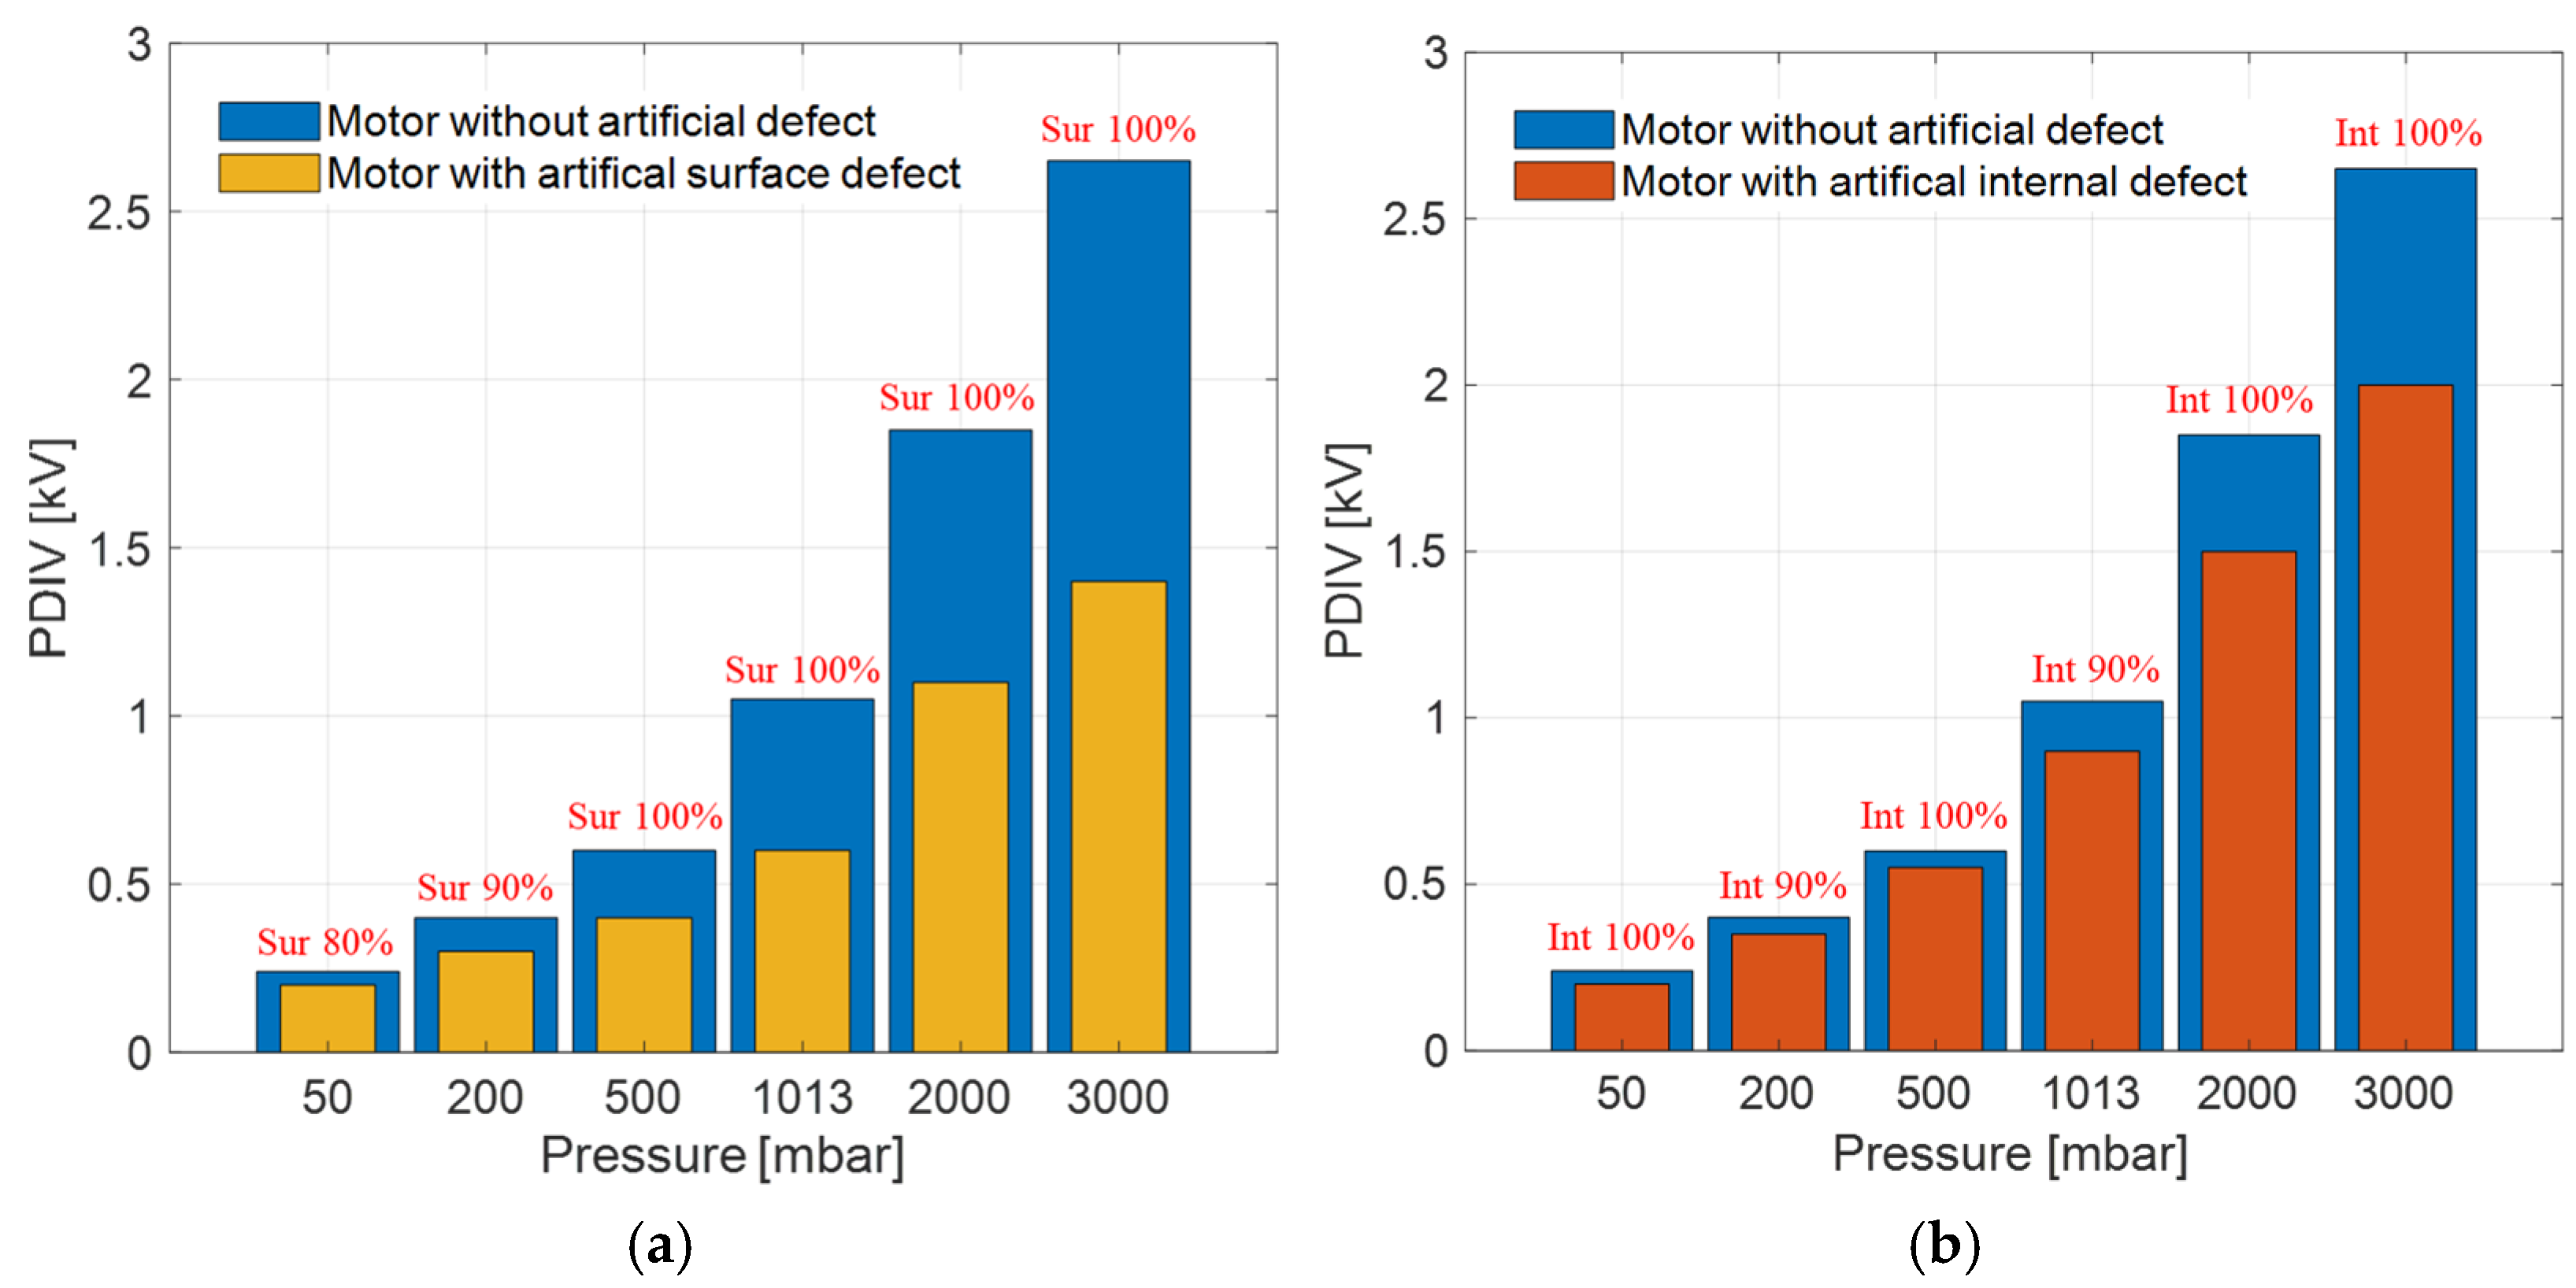
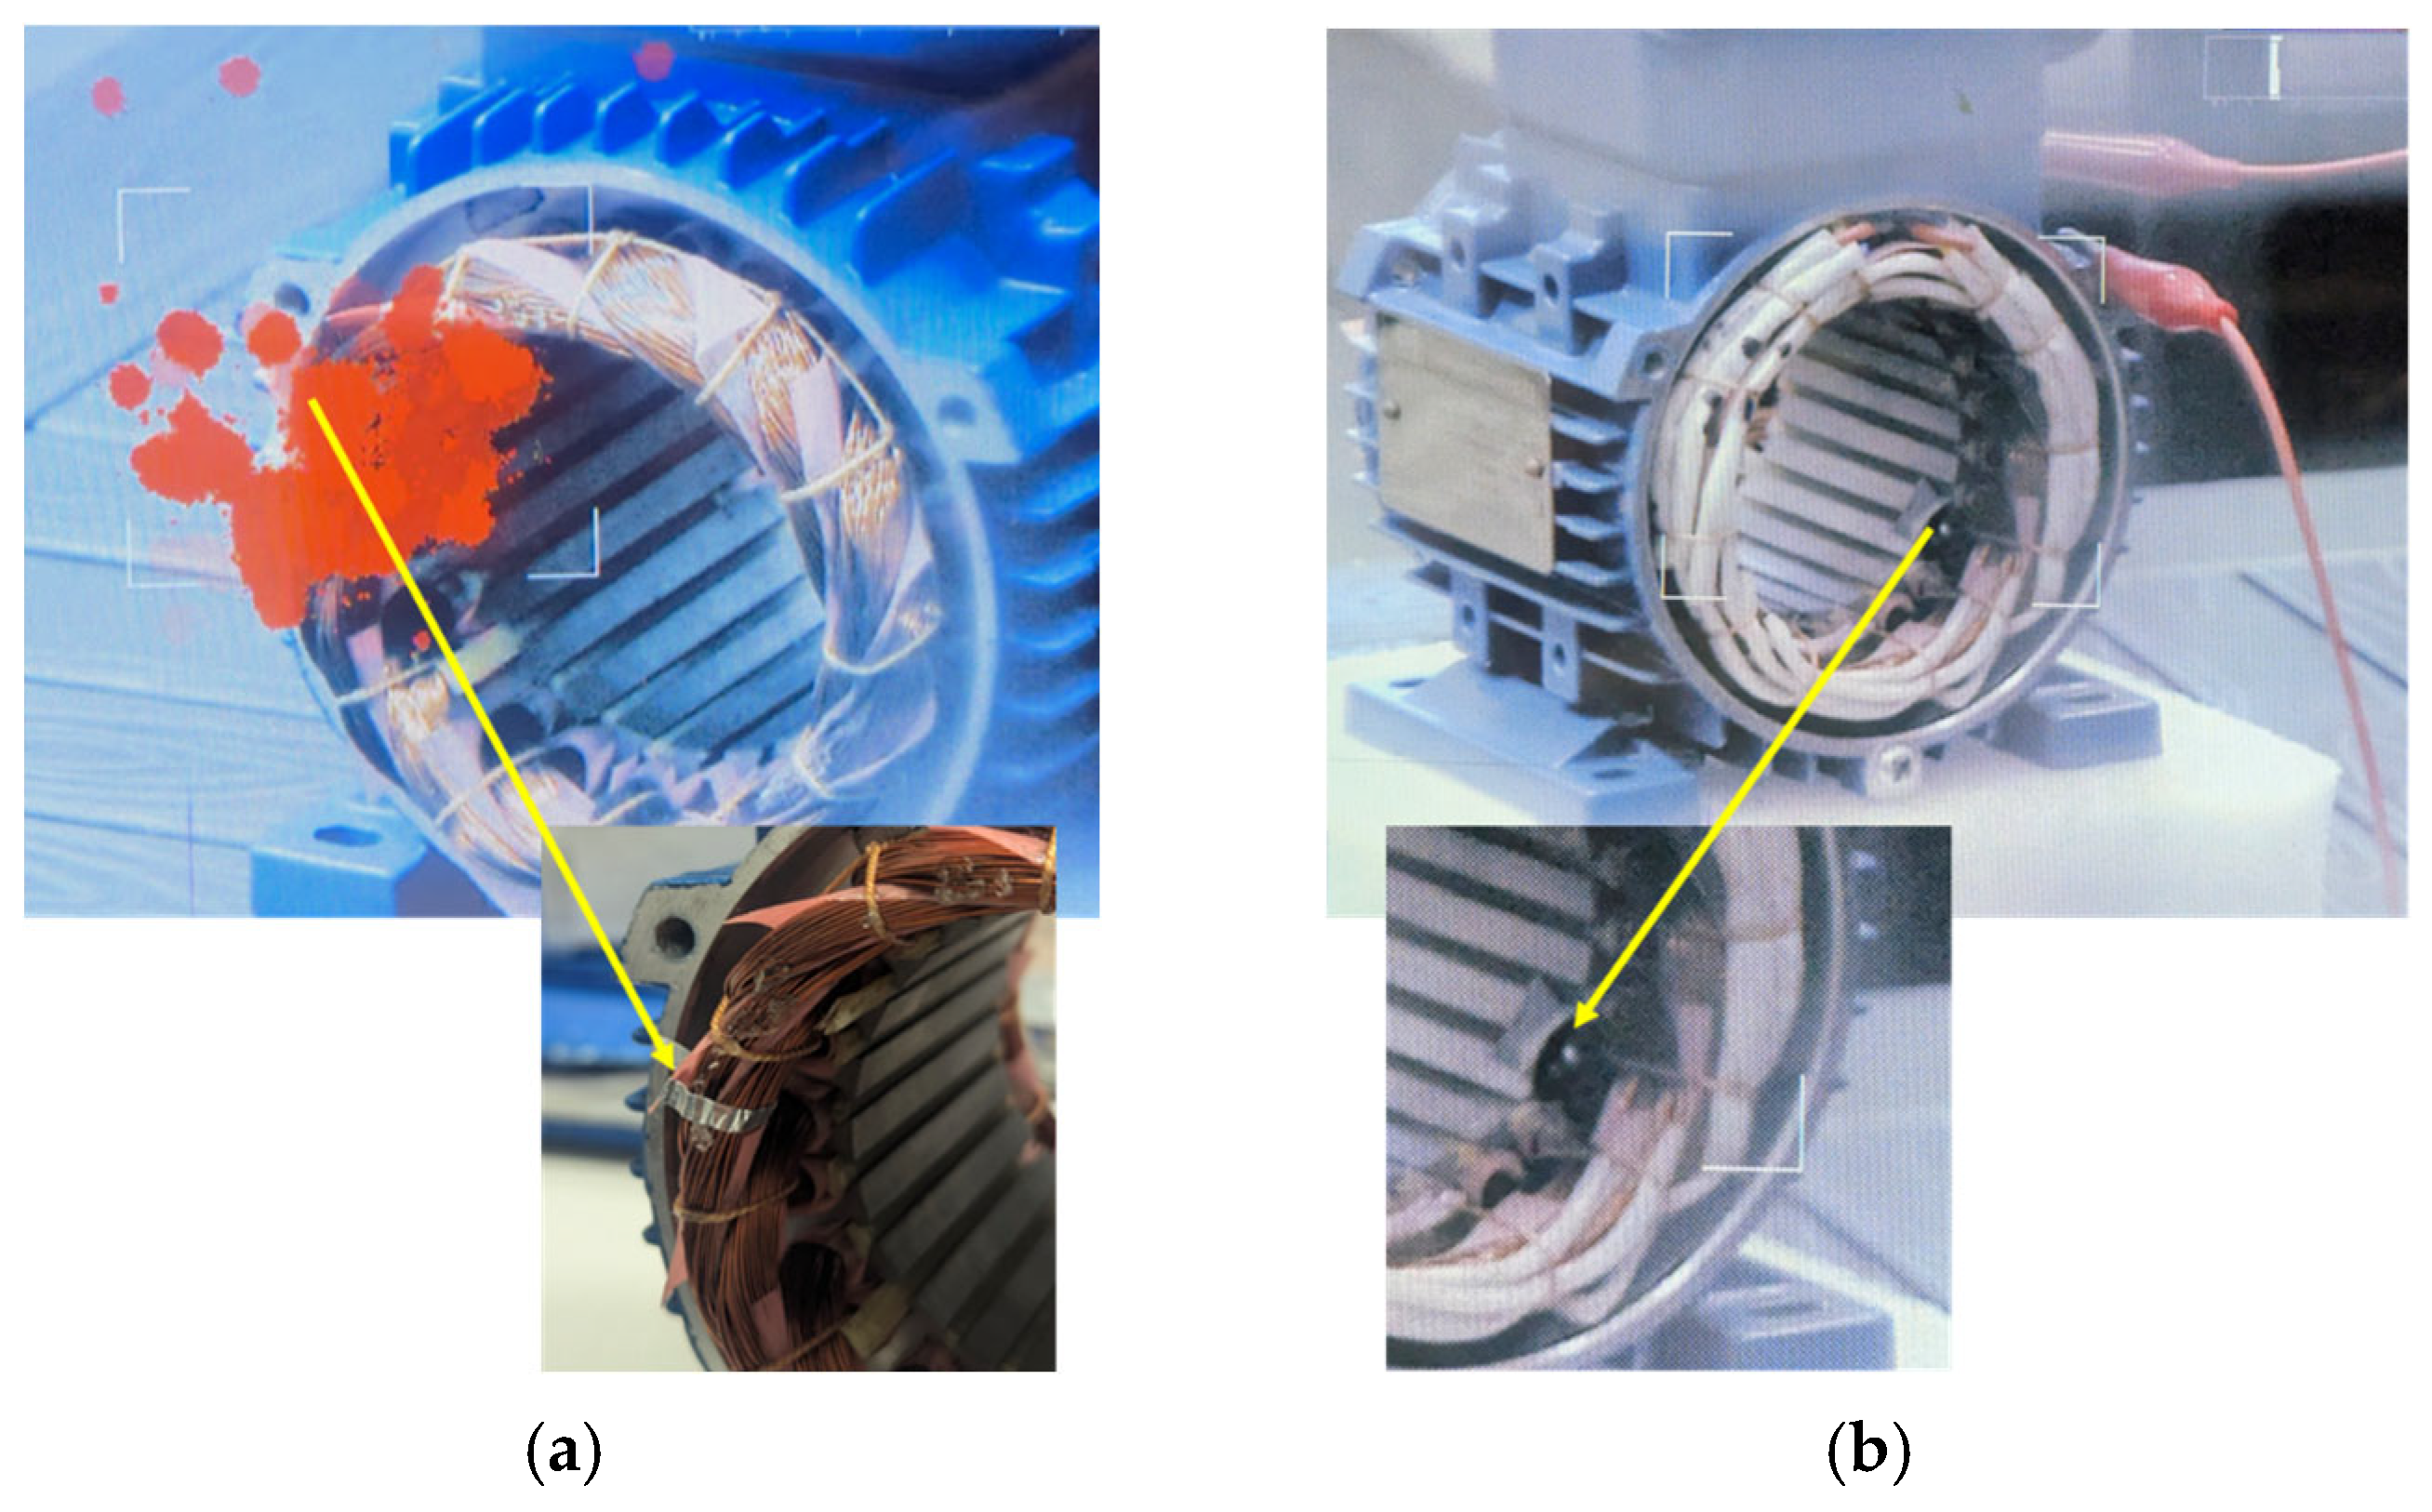
An aluminum tape was used to partially bridge the stator coil insulation to the body of the motor in order to develop an artificial surface defect on the test object shown in Figure 1. This could simulate issues such as contamination or manufacturing/assembling defects. The artificial defect shortens the effective creepage distance, resulting in the reduction in PDIV, as reported in Figure 5a. The occurrence of surface type PD was also confirmed by a UV camera, as shown in Figure 6a, where the presence of red dots (corresponding to stable PD events) can be noticed around the surface defect.
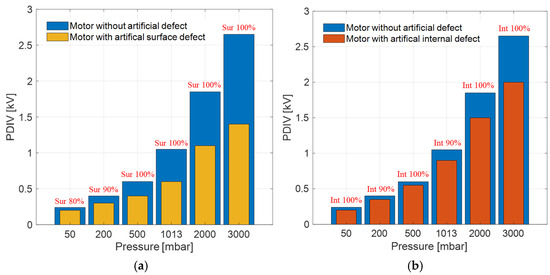
Figure 5.
Mean value of measured PDIV values of defective motor at different pressure levels and identification (ID) of defect typology (surface or internal) from the analytics software for both (a) surface and (b) internal artificial defects. PDIV values of the motor without artificial defect are also displayed for comparison. As an example, Int 80% refers to 80% likelihood of internal PD.
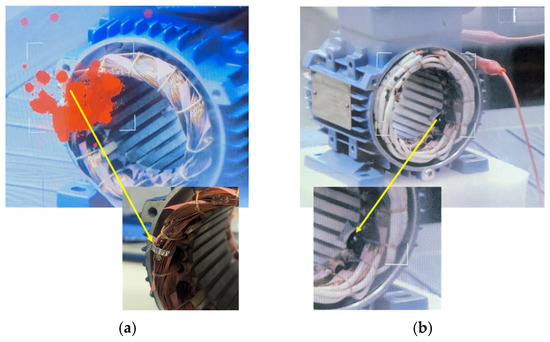
Figure 6.
Photos of motors with artificial defects and PD observation by UV camera (red dots): (a) surface and (b) internal defect. No PD are observable in the case of internal defects, as expected (being located inside the slot, thus invisible to UV camera).
An internal defect was developed artificially by removing a part of the Nomex-mica paper insulation present in between the stator coil insulation and stator core of the motor and replacing it with a semiconducting material, as shown in Figure 6b. This simulates a reduction in ground (slot) insulation capability which could trigger PD in slot air gaps, as shown in Figure 5b. The semiconducting material used to develop the artificial internal defect is taken from semi-conducting ethylene propylene rubber (EPR)-based high-voltage tape with a volume resistivity of 103 ohm.cm.
Figure 5a,b report the mean measured PDIV values at different pressure levels, together with PD identification, (ID), for surface and internal artificial defects, respectively. As can be seen, PDIV increases with pressure for both types of defects, and identification is able to pinpoint the type of defect generating PD with high likelihood.
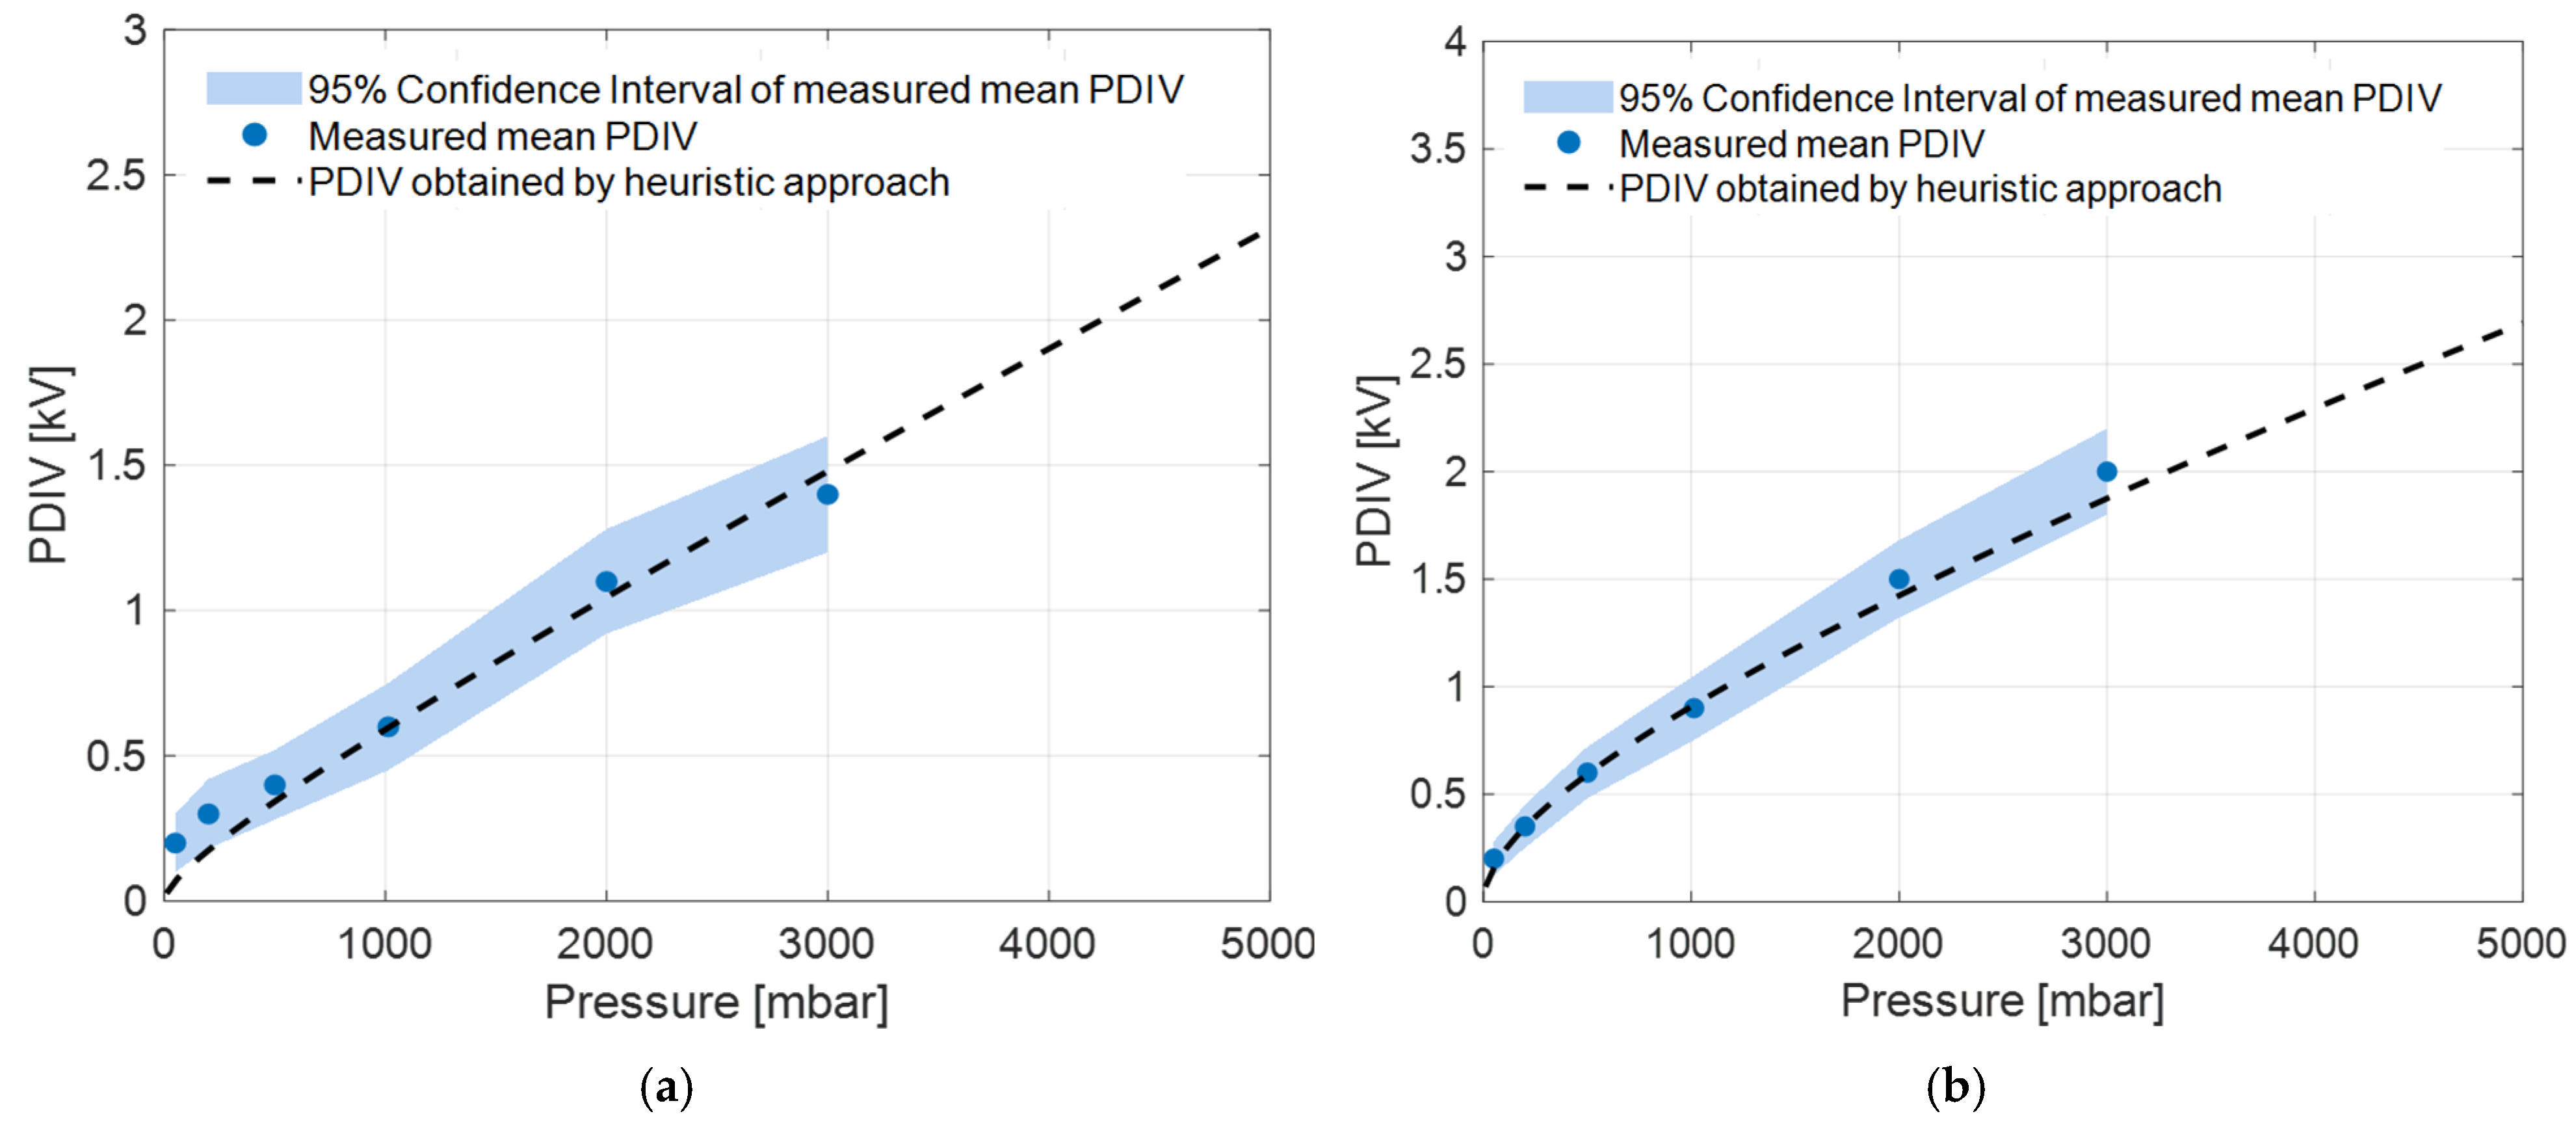
Figure 7 eventually shows how the heuristic model fits to experimental results (mean values of PDIV with 95% confidence intervals) going from high to low pressures. or d in model (2) are calculated at SAP using the parameter values of Table 1 for surface or internal discharges, respectively. As can be seen, PDIVsur values estimated using the heuristic approach (with mm) are close to the measured mean PDIV values at pressures lower and higher than SAP, lying within the 95% confidence intervals of measured mean PDIV. The same occurs for PDIVint (with mm).
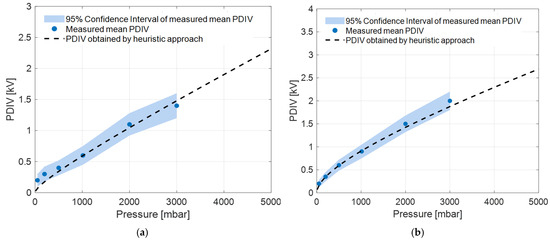
Figure 7.
Estimated surface PDIV values of defective motor using the heuristic model, along with measured mean PDIV and its 95% confidence interval, at different pressure levels. Model fitting curves and experimental values for (a) surface and (b) internal-type defects.
3.2. MV Cable
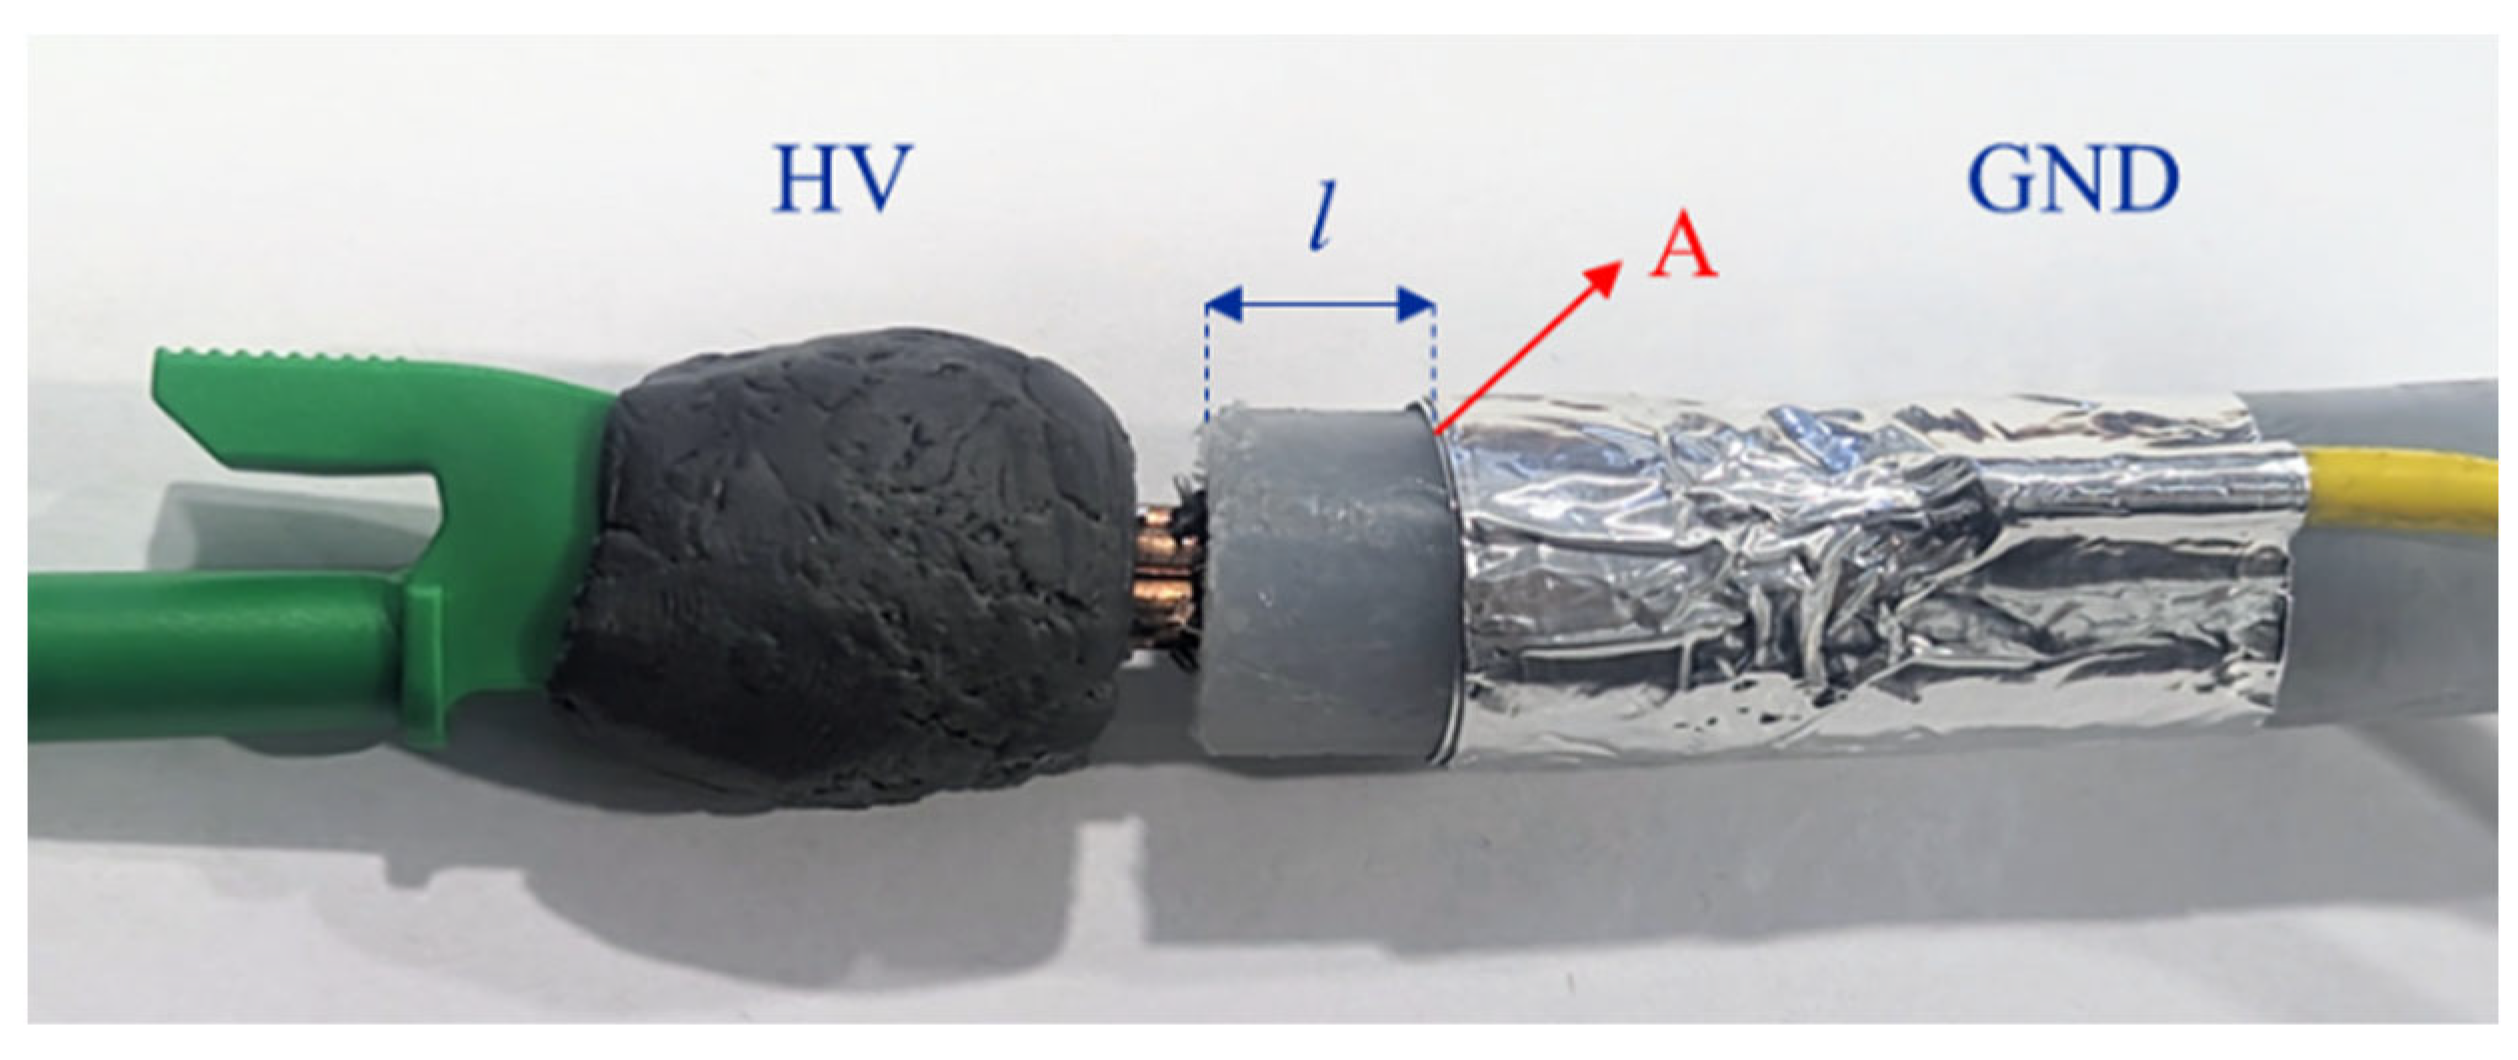
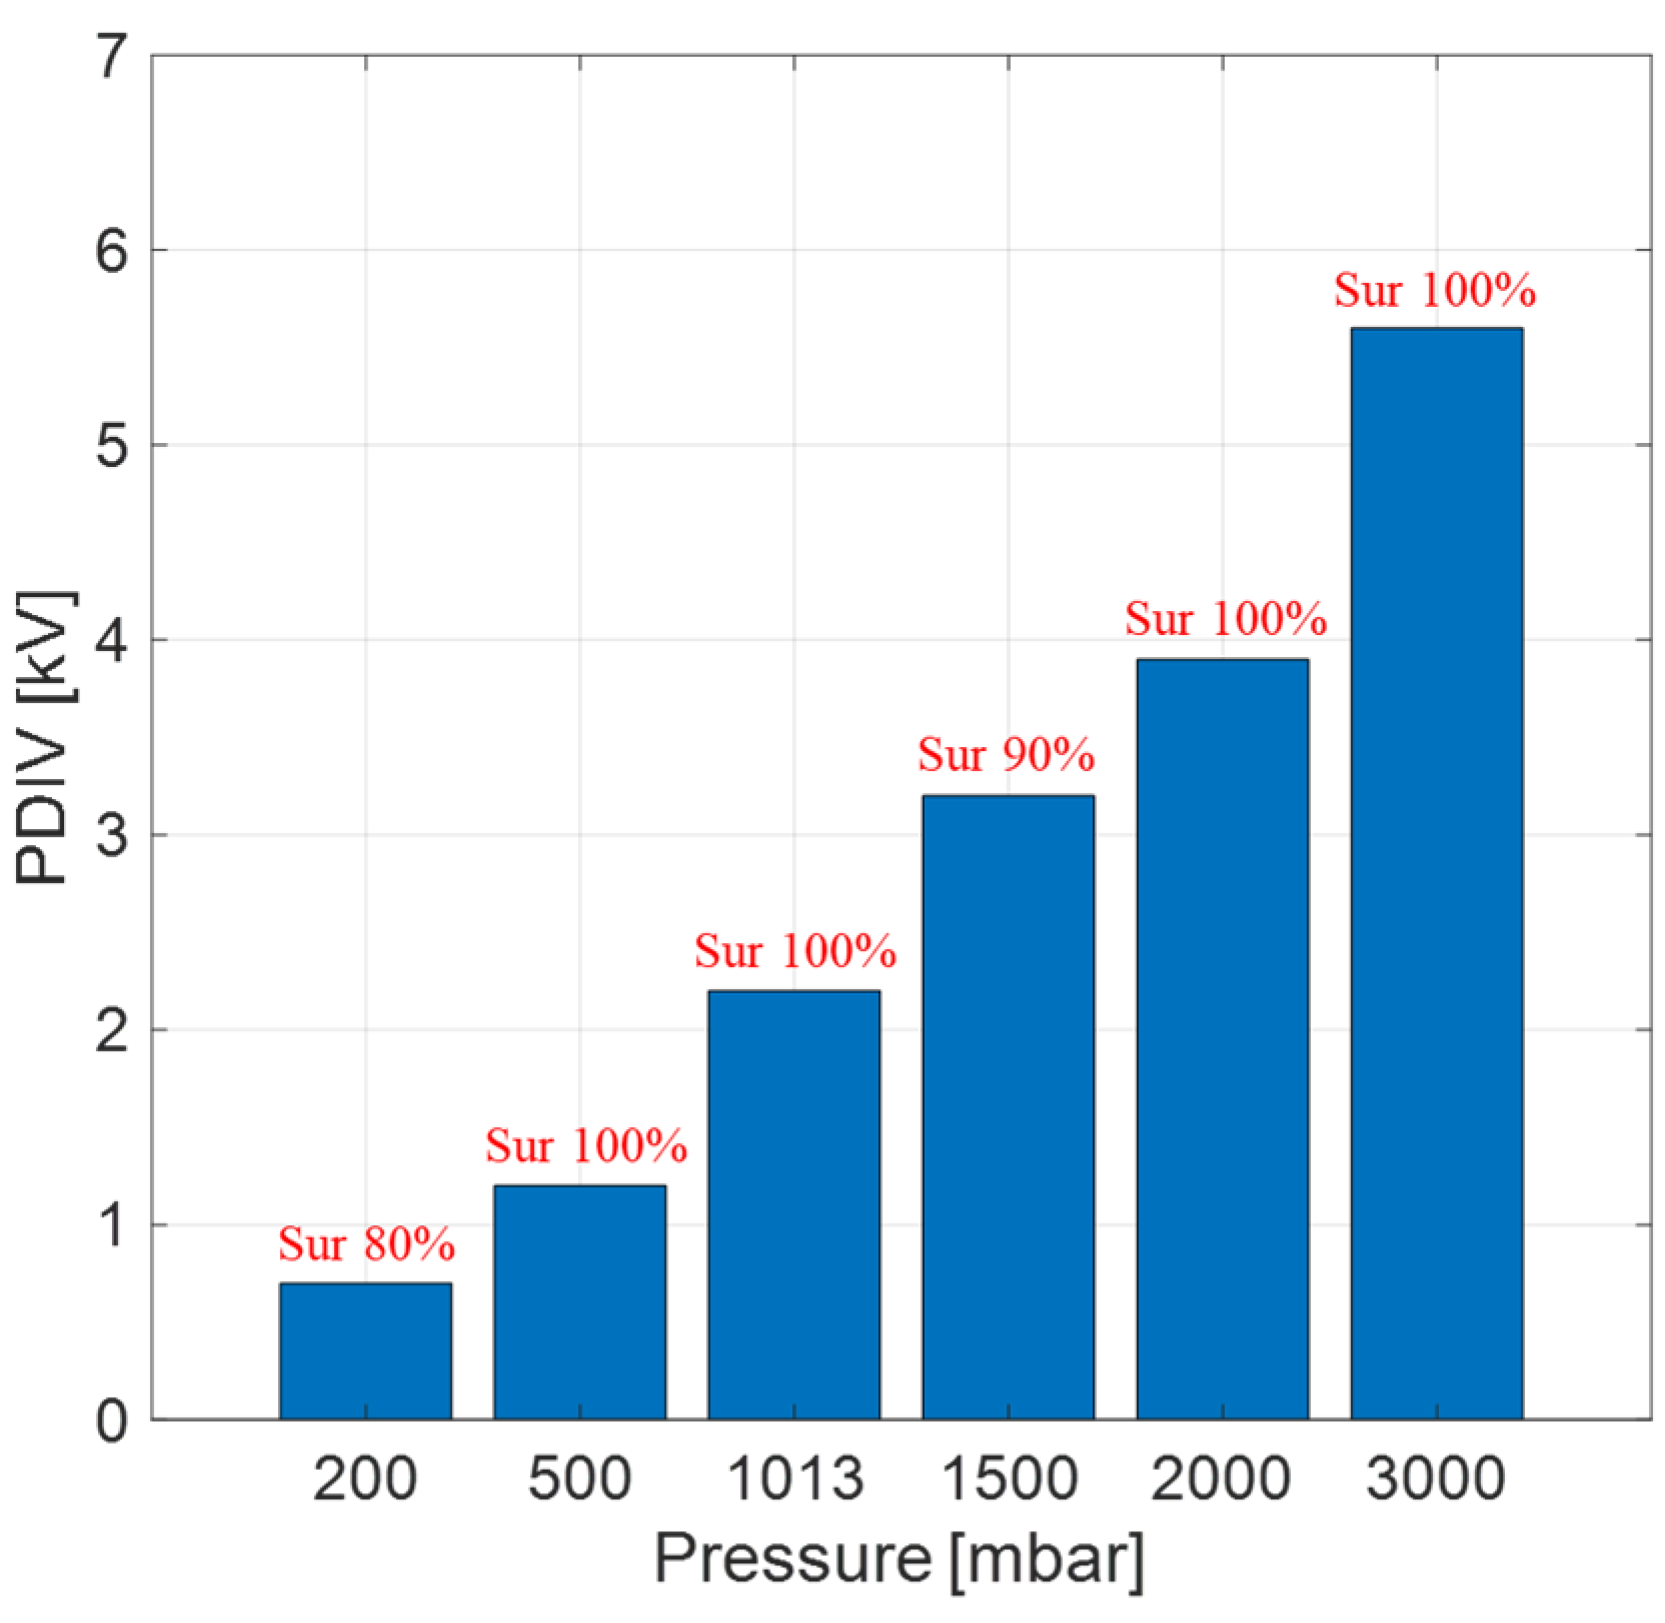
A medium voltage cable (with a rated voltage of 15 kV) was used as a test object, manufacturing a simple surface defect as in Figure 8. Surface discharges are generated at triple point A, being localized in the small insulation and air volume nearby it. The value of l in Figure 8 is 10 mm. The detailed description of the defect manufacturing is reported in [20]. The values of mean PDIV as a function of pressure are displayed in Figure 9: the identification is mostly surface discharge at any pressure. Model fitting (with surface discharge parameter values and mm) is reported in Figure 10. As for motors, estimates lie within 95% confidence intervals of experimental values, thus validating the heuristic model for cables (with surface defects). It can be speculated that the same could hold for internal defects, but tests at low pressure were not carried out.
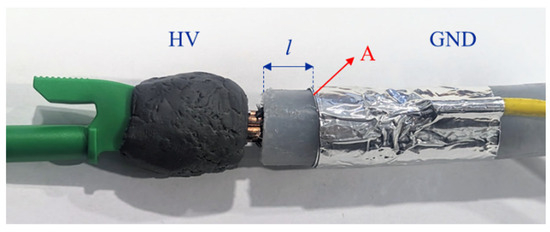
Figure 8.
Picture of the MV cable used for PDIV testing at various pressures with highlight of the artificial defect able to generate surface PD.
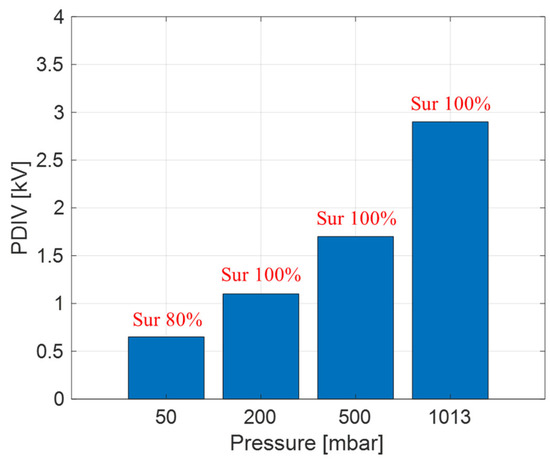
Figure 9.
Mean value of measured PDIV for a defective MV cable (artificial surface defect) at different pressure levels and identification (ID) of defect typology from the analytics software.
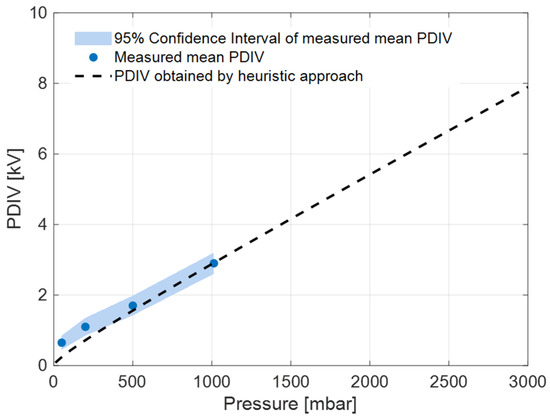
Figure 10.
Estimated surface PDIV values of the defective MV cable of Figure 8 (artificial surface defect) obtained using the heuristic model, along with measured mean PDIV and its 95% confidence interval, at different pressure levels.
3.3. MV Planar Transformer
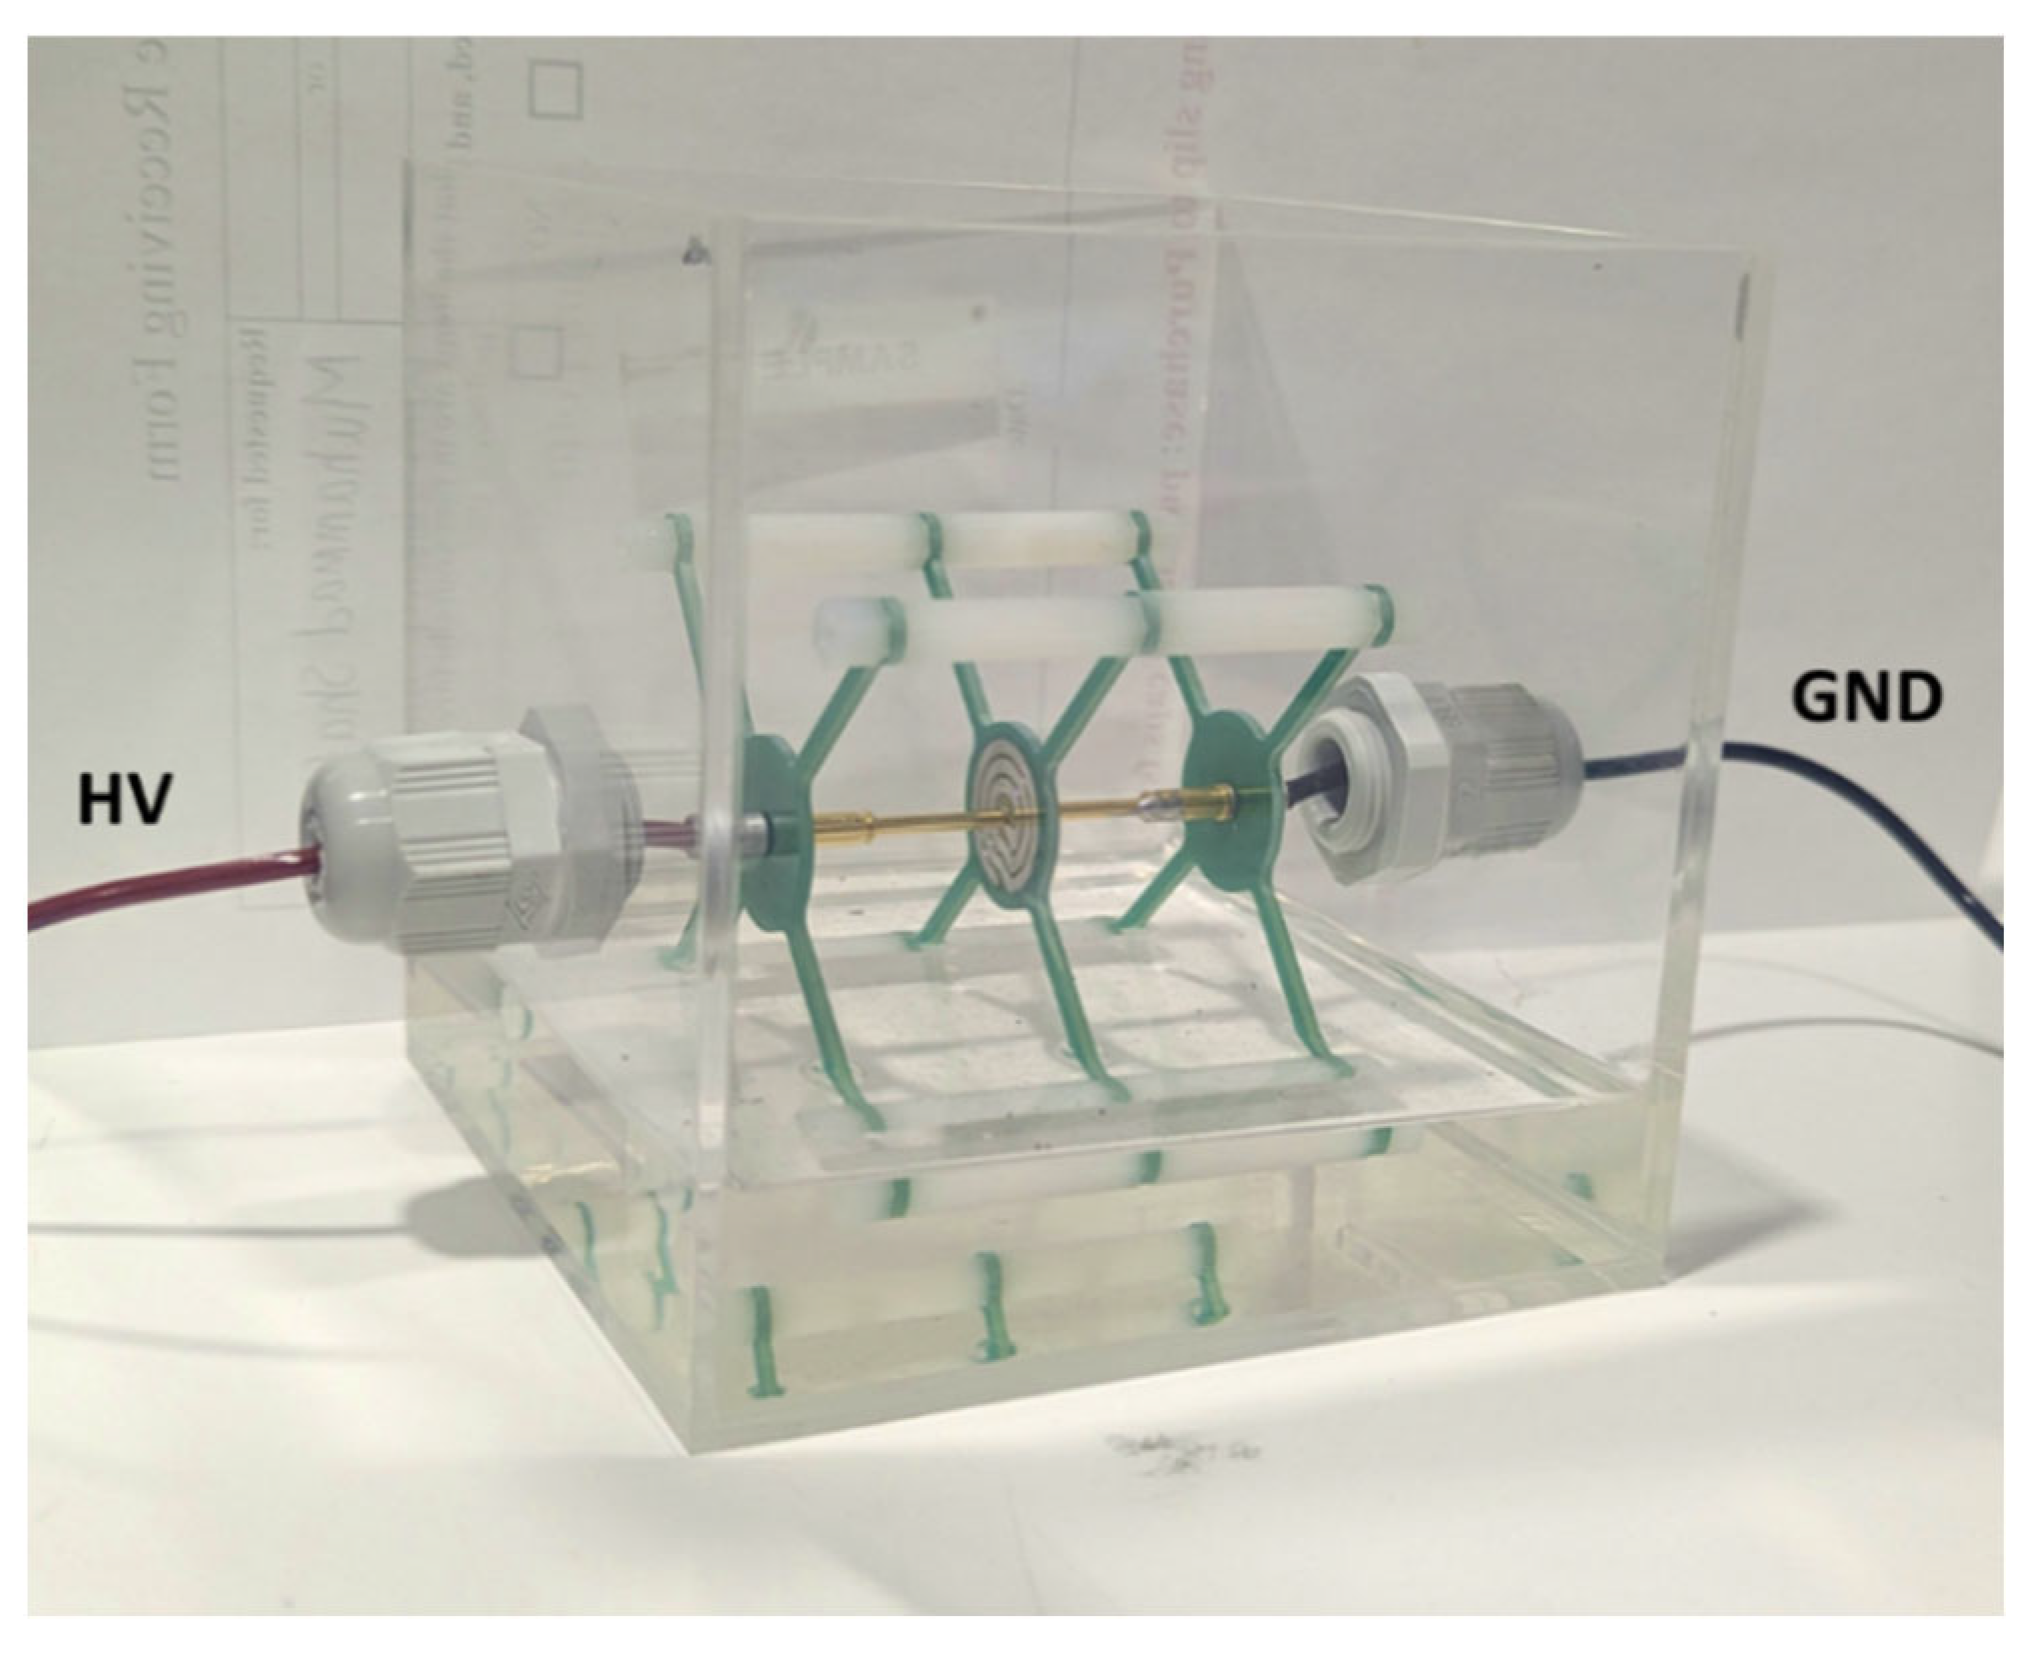
Figure 11 depicts a medium voltage PCB planar transformer that was used as a test object. A PCB planar transformer is a type of transformer built directly into a printed circuit board using flat, spiral-shaped windings instead of traditional wire-wound coils. For the present study, a planar transformer prototype was fabricated on a 1.6 mm thick FR-4 PCB substrate, with copper winding traces implemented on both the top and bottom layers without a solder mask, allowing them to be exposed to the surrounding medium. The top-layer coil serves as the primary winding, while the bottom-layer coil functions as the secondary winding. These windings are connected to the high-voltage and ground terminals, respectively, through gold-plated electrodes to ensure stable and low-resistance contacts during testing.
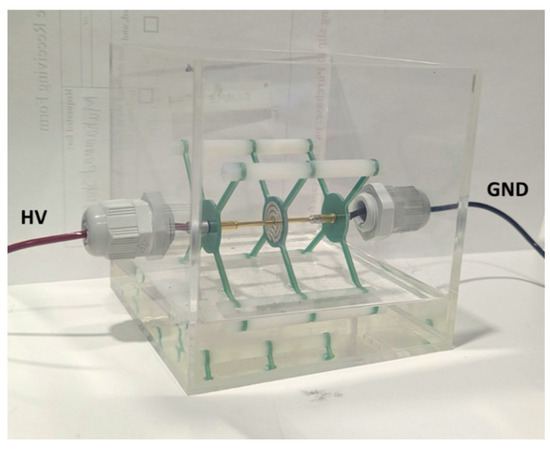
Figure 11.
Picture of the PCB planar transformer placed in the PD test cell.
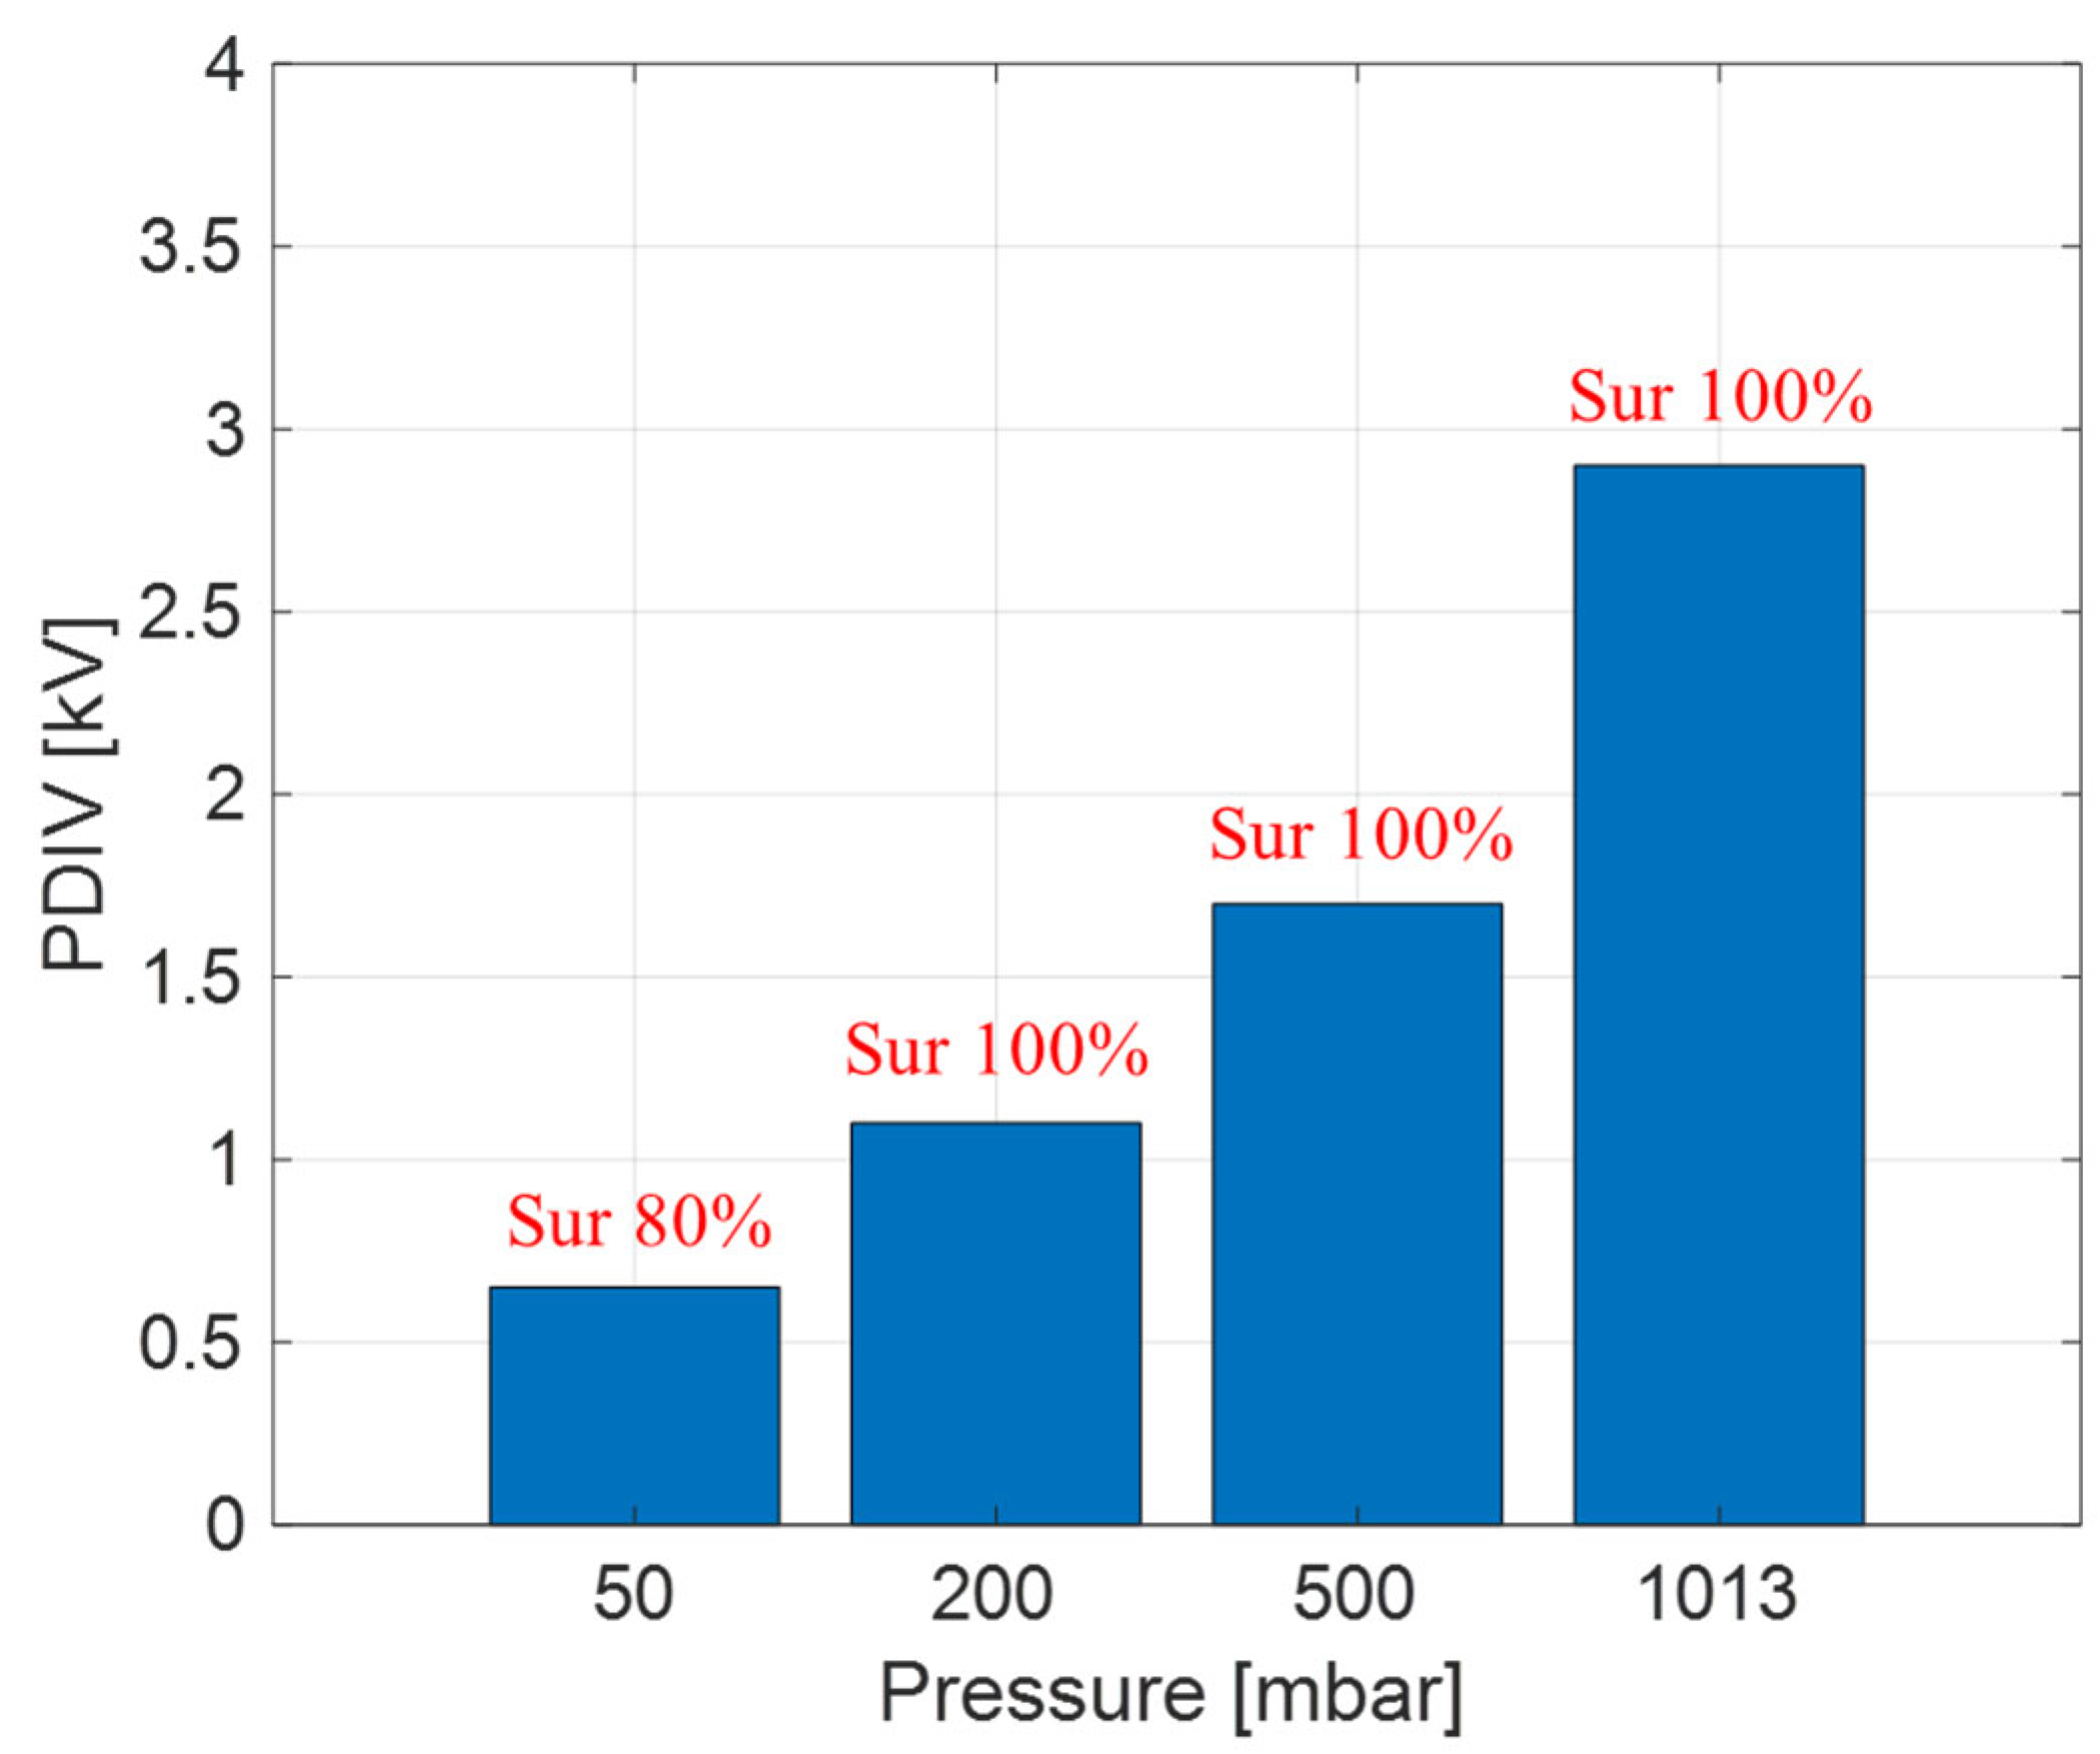
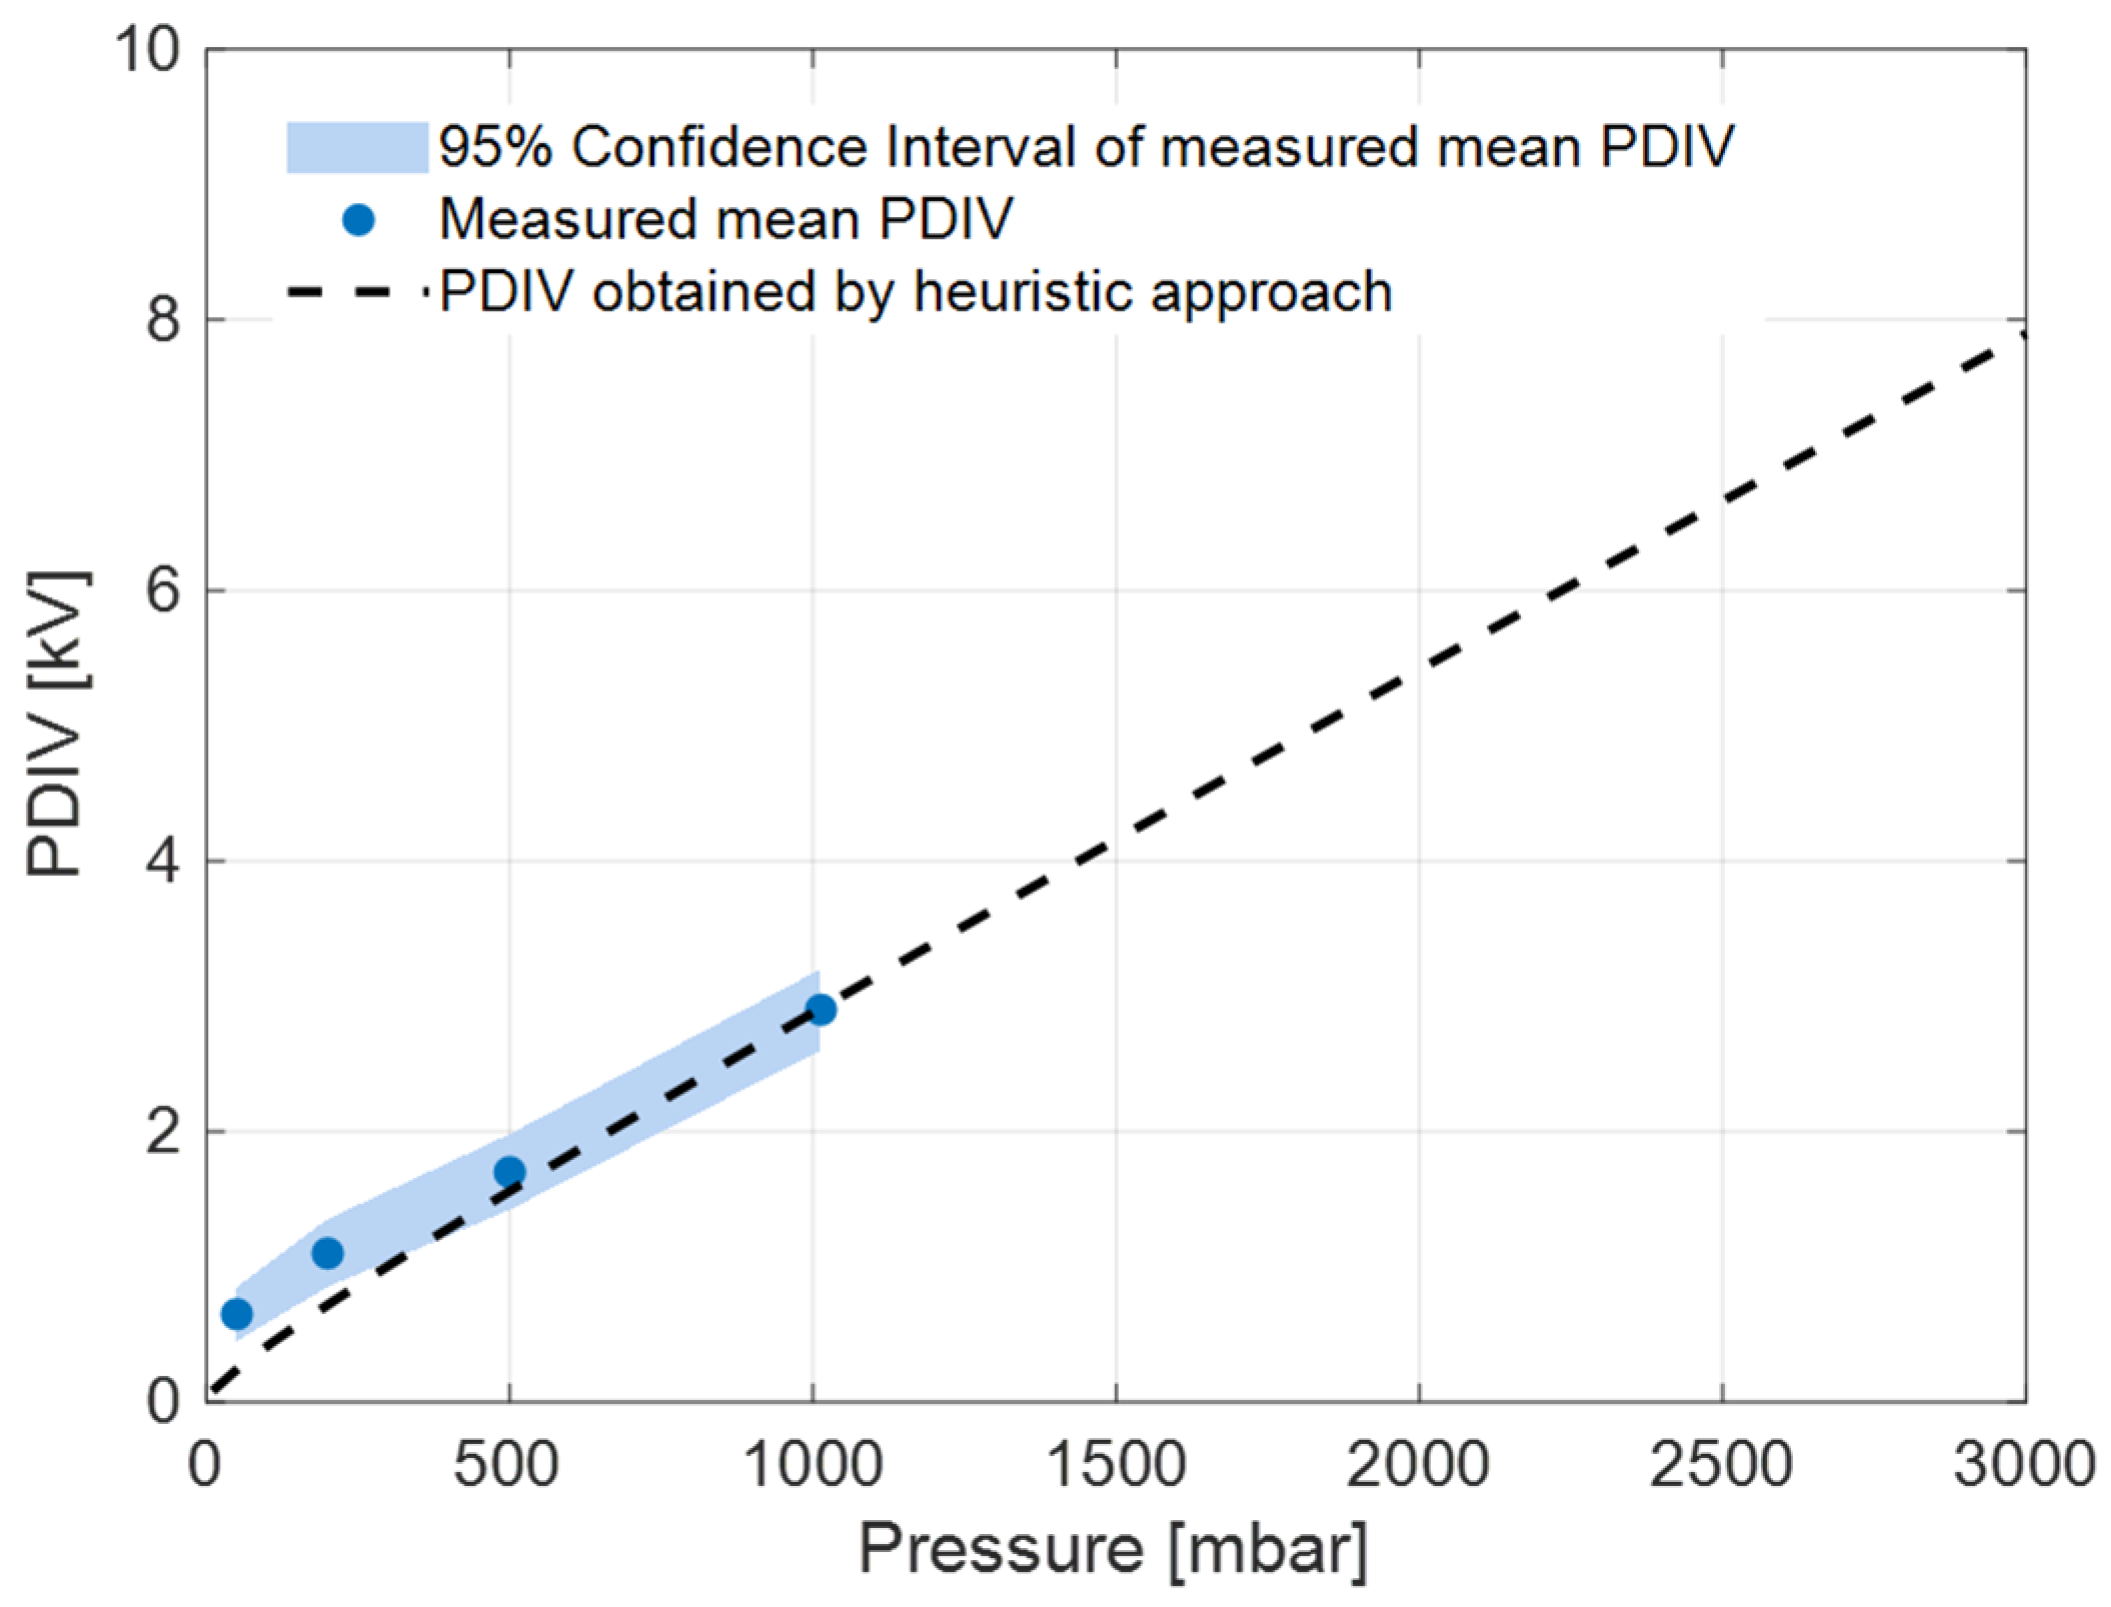
The mean PDIV values measured at different pressure levels are displayed in Figure 12, and the PD identification (ID) is noticed to be predominantly surface at all the test pressure levels. The heuristic model fitting, with surface discharge parameter values and mm, is reported in Figure 13. The estimates are noticed to be lying within 95% confidence intervals of measured PDIV values, thus validating the heuristic model in the case of planar transformers at pressure levels both higher and lower than SAP.
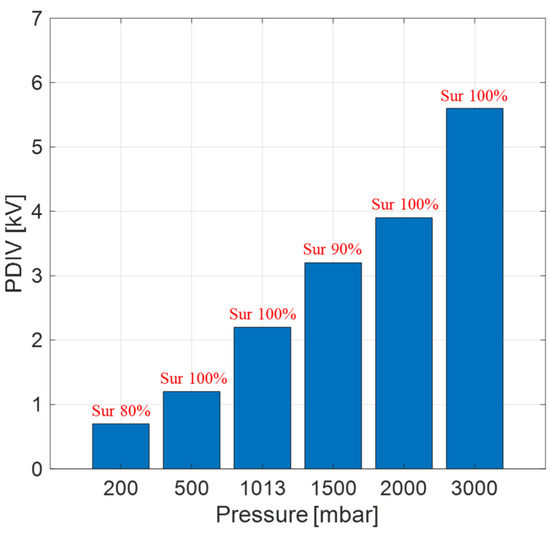
Figure 12.
Mean measured PDIV values of the planar transformer of Figure 11 at different pressure levels and PD ID from the analytics software.
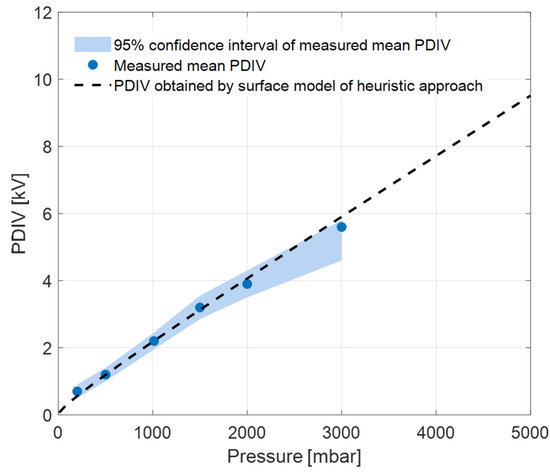
Figure 13.
Estimated PDIV values of the PCB planar transformer of Figure 11 using the heuristic model (with surface discharge parameter values), along with measured mean PDIV and its 95% confidence interval, at different pressure levels.
Also in this case the exact model, i.e., Equation (1), could not be applied, as the size and location of the defect is not known.
3.4. General Case of Ambiguous Identification
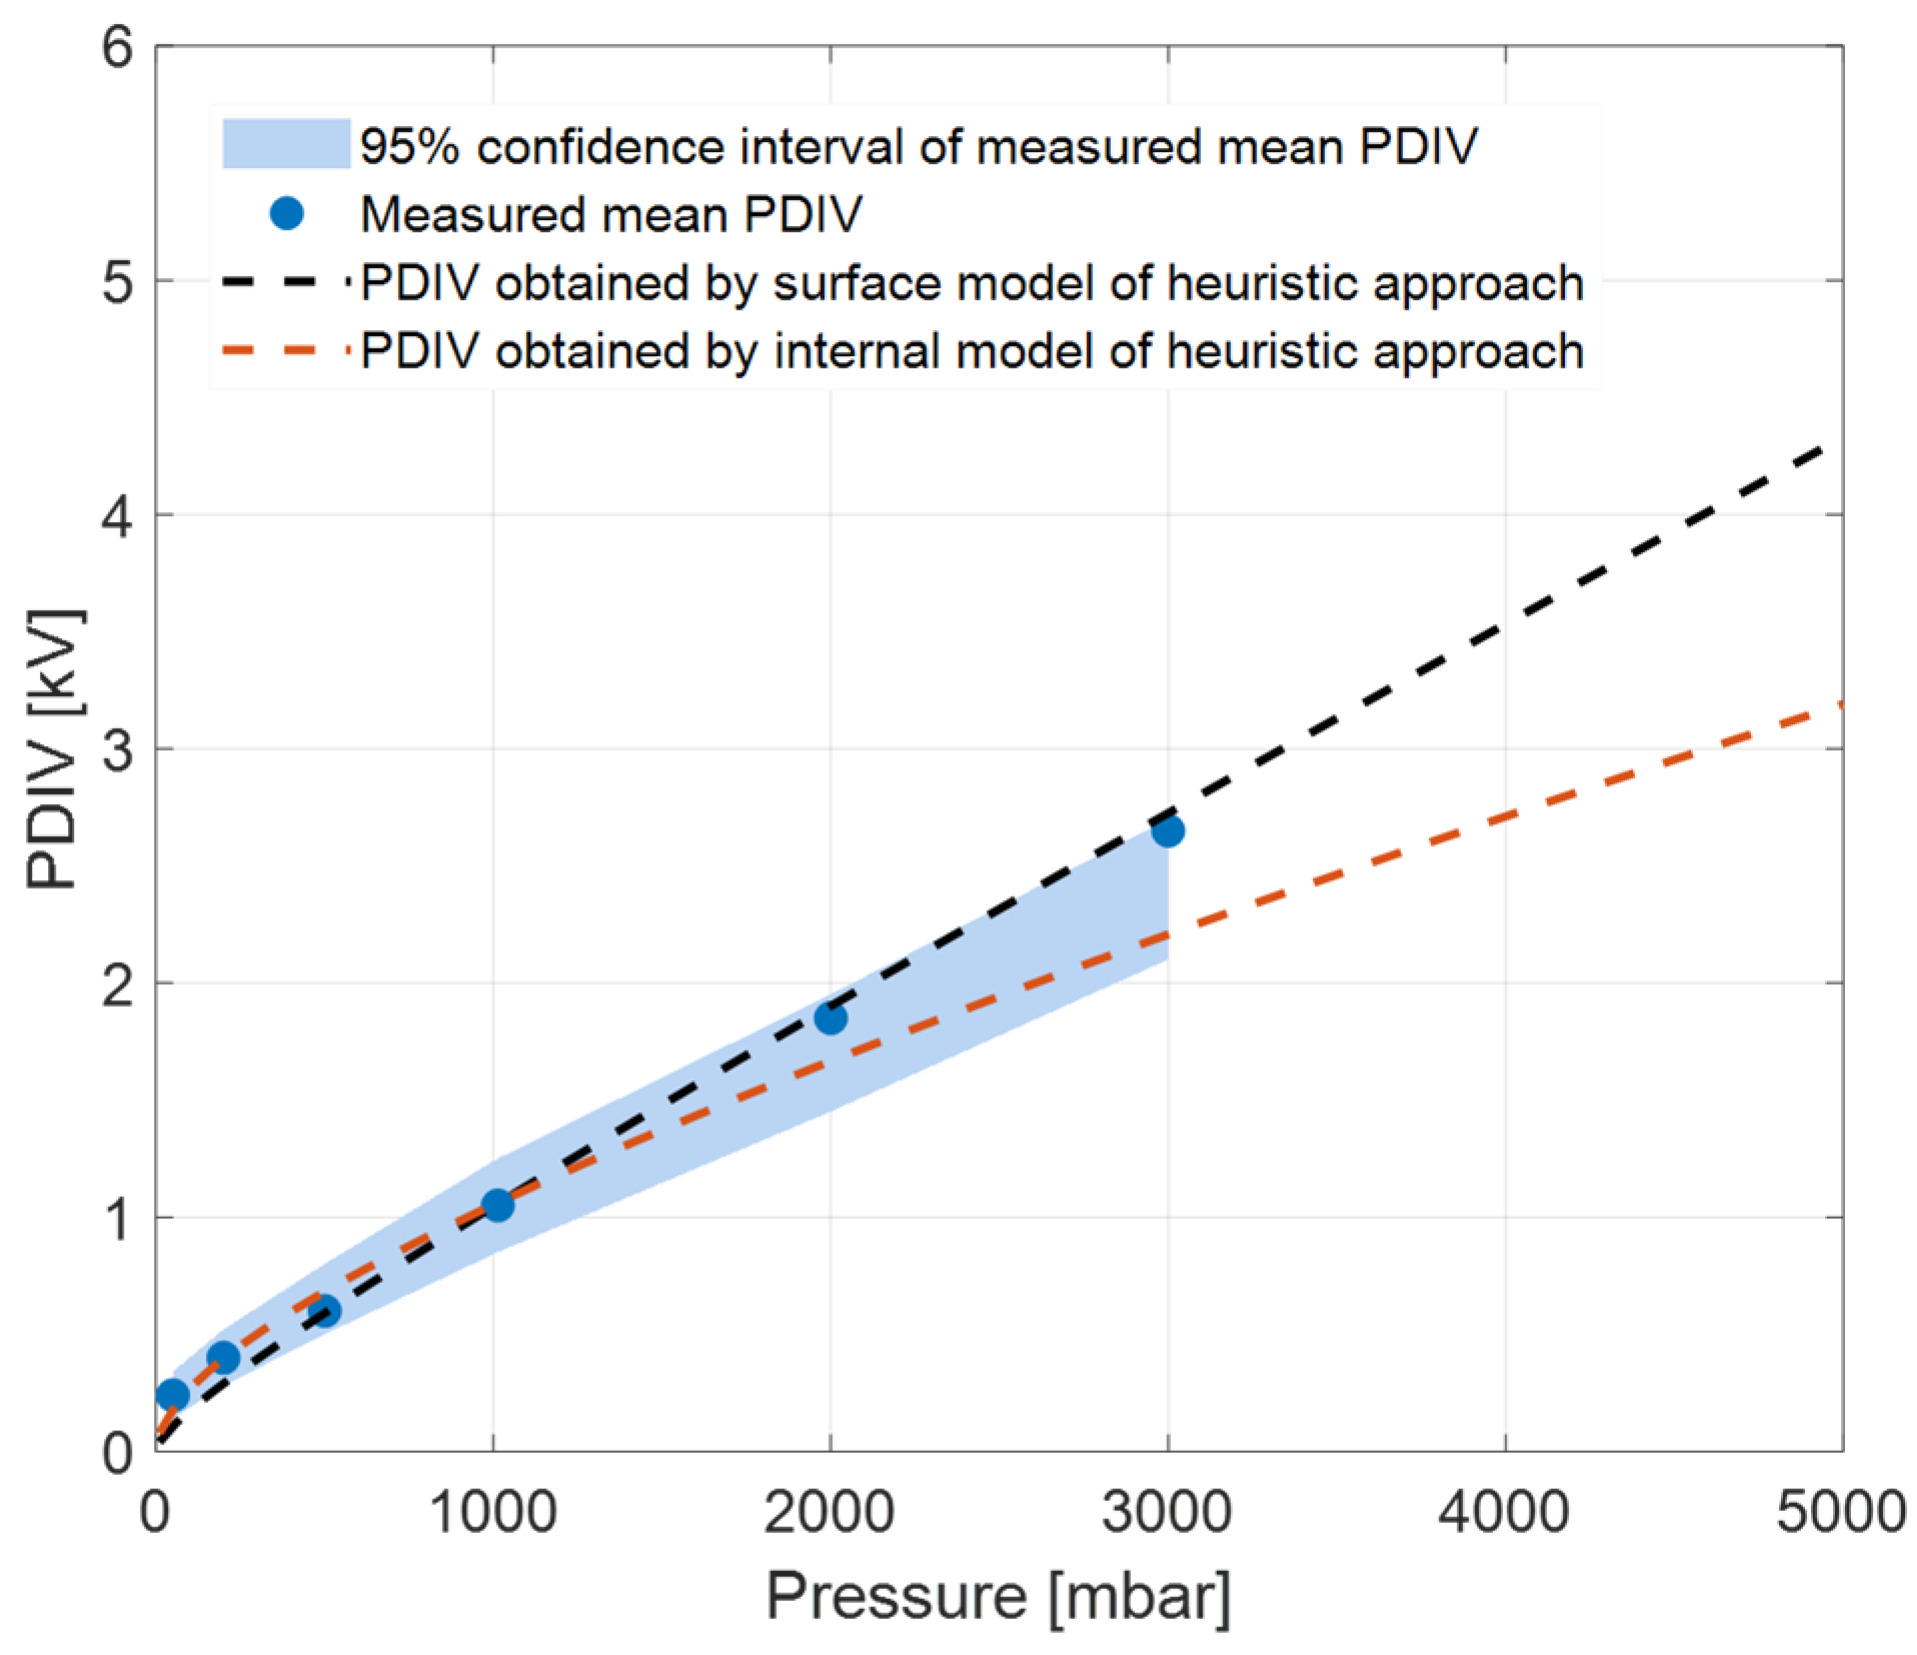
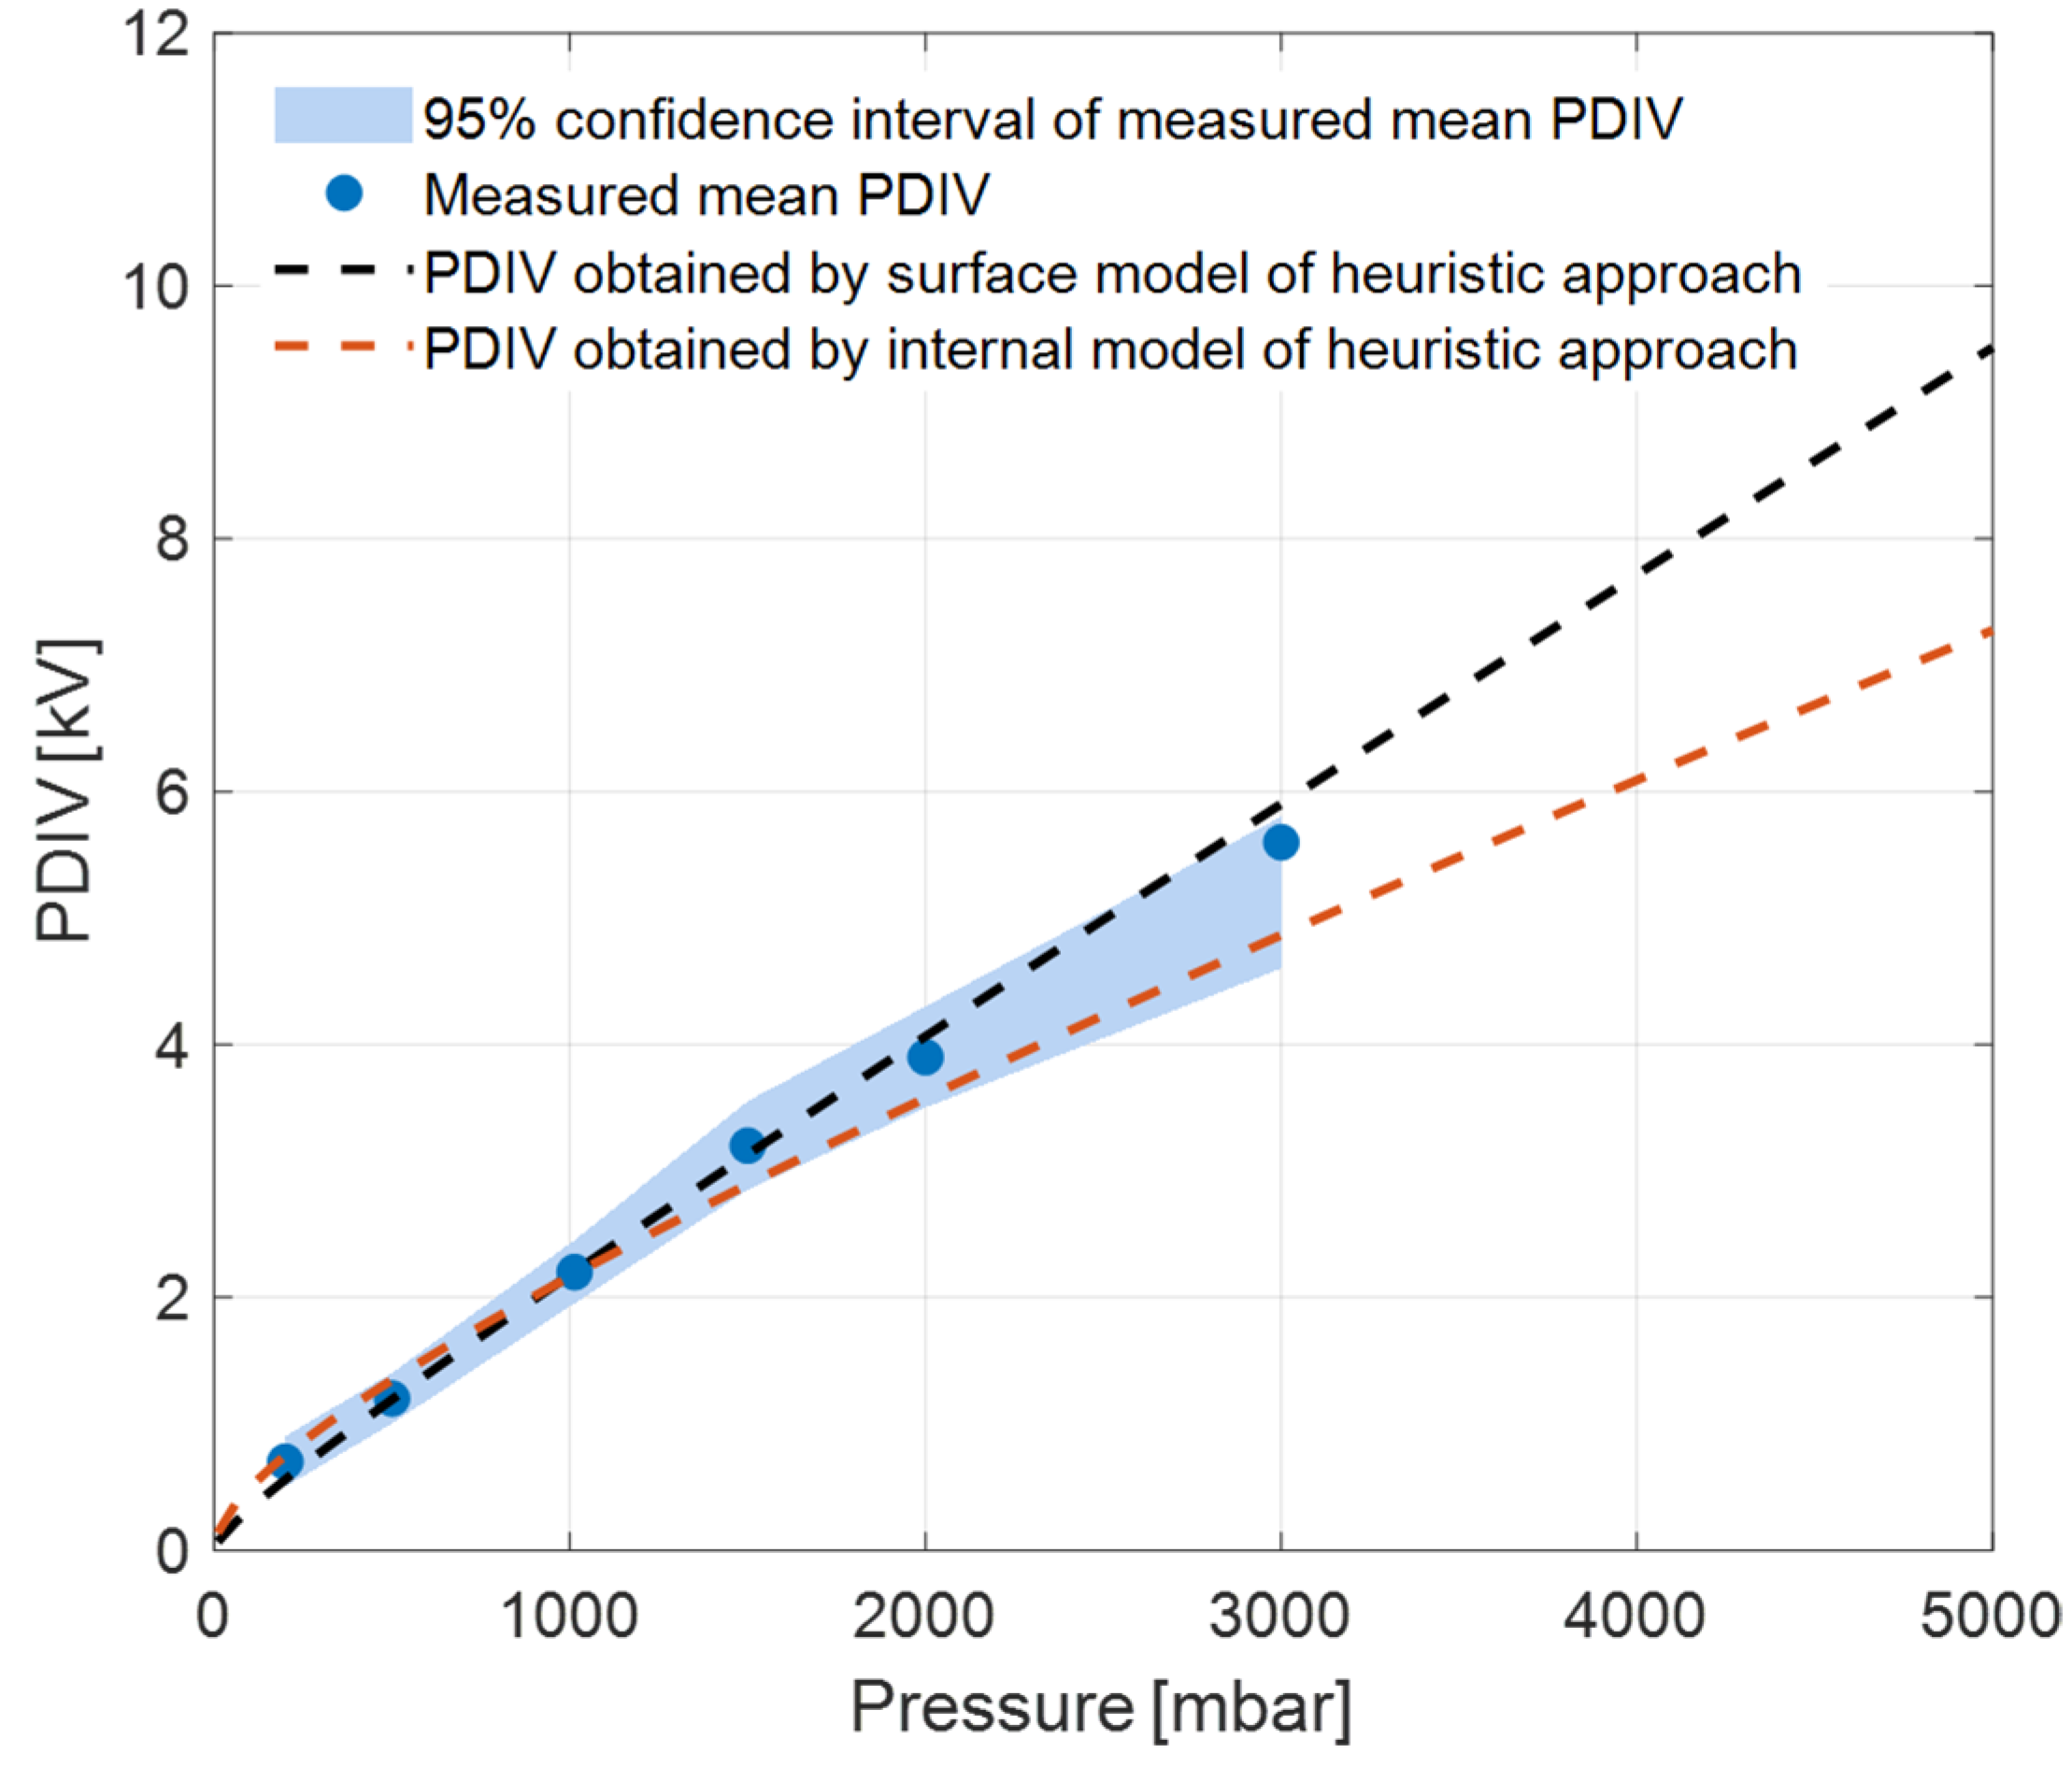
When experts or the above-mentioned automatic software would fail providing clear defect type identification, such as uncertain identification or low likelihood levels for a specific typology (e.g., 50% surface, 50% internal), it has been found that using internal model parameters (Table 1) provides conservative PDIV estimates at pressure levels higher than SAP, whereas at pressures lower than SAP the choice of model parameters does not seem too much influential (meaning that estimates are very close to each other and to experimental data). This is shown by Figure 14 and Figure 15, which display experimental mean PDIV values and confidence intervals, from Figure 4 and Figure 13, that is, for the motor and the planar transformer, compared with estimates using surface (as in Figure 4 and Figure 13) and internal model parameter values. As can be seen, the predicted PDIV values below SAP tend to match well with the measured values using both internal and surface estimates, while for pressure levels > SAP the internal model parameter estimates are lower than the experimental data, and thus yield conservative estimates as regards the design input.
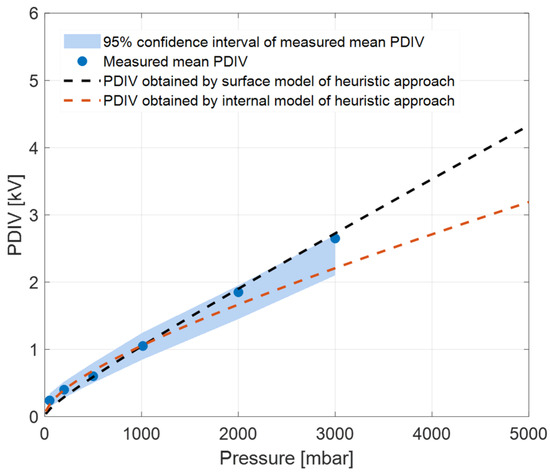
Figure 14.
Estimated surface PDIV values of stator insulation using the heuristic model with both surface (as in Figure 4) and internal discharge parameter values, along with measured mean PDIV and its 95% confidence interval, at different pressure levels.
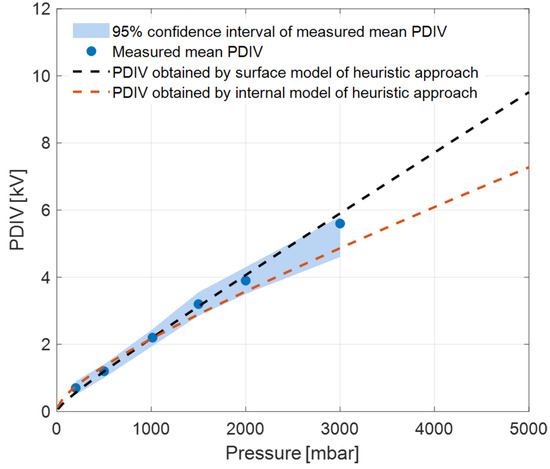
Figure 15.
Estimated PDIV values of the PCB planar transformer using the heuristic model with both surface (as in Figure 13) and internal discharge parameter values, along with measured mean PDIV and its 95% confidence interval, at different pressure levels.
4. Conclusions
Based on experimental results, the heuristic model proposed here seems to be able to successfully estimate the PDIV of various components of electrical and electronic assets which can experience positive and negative variations in pressure. This would occur at least for the test pressure range which, however, encompasses most applications of insulation systems at pressure different from SAP. Examples could be aircraft and aerospace vehicles, but also T&D, industrial, and other transportation applications (such as ships) may have components operating at pressure higher or lower than SAP. Once the model is exploited for a specific component, through fitting to a PDIV measurement at SAP (which can be performed off-line in the lab, but also on-line), or at any other pressure at which the component operates (if measurement is performed on-line), the PDIV behavior at any pressure, reasonably close to SAP (in this paper validation is between 3 and 0.05 bar) can be estimated. In this way insulation design can be optimized in order to make it PD-free through the three-leg approach. Also, quality control/condition maintenance can be properly planned since the model can provide estimations of the pressure levels at which PD may incept or disappear and for how long they can be present compared to operation life. On-field PD monitoring on operating asset components is sought to fully support the proposed model.
Author Contributions
Conceptualization, G.C.M.; methodology, G.C.M. and S.B.M.; software, S.B.M.; validation, G.C.M., S.B.M., M.S. and Z.C.; formal analysis, S.B.M., M.S. and Z.C.; investigation, G.C.M., S.B.M. and Z.C.; resources, G.C.M.; data curation, S.B.M., M.S. and Z.C.; writing—original draft preparation, G.C.M. and S.B.M.; writing—review and editing, G.C.M. and S.B.M.; visualization, S.B.M., M.S. and Z.C.; supervision, G.C.M.; project administration, G.C.M. and M.S.; funding acquisition, G.C.M. All authors have read and agreed to the published version of the manuscript.
Funding
This work was supported by U.S. Department of Energy (DOE) under Contracts DE-AC36-08GO28308 and DE-FOA-0002238.
Data Availability Statement
The original contributions presented in the study are included in the article. Further inquiries can be directed to the corresponding authors.
Conflicts of Interest
The authors declare no conflicts of interest.
Abbreviations
The following abbreviations are used in this manuscript:
| PD | Partial Discharge |
| PDIV | Partial Discharge Inception Voltage |
| PDIE | Partial Discharge Inception Field |
| SAP | Standard Atmospheric Pressure |
| PCB | Printed Circuit Board |
References
- IEC 60505; Evaluation and Qualification of Electrical Insulation Systems, 4th ed. IEC: Geneva, Switzerland, 2011.
- IEC 60034-27-1; Rotating Electrical Machines. Off-Line Partial Discharge Measurements on the Winding Insulation. IEC: Geneva, Switzerland, 2019.
- IEC 61251; Electrical Insulating Materials. A.C. Voltage Endurance Evaluation. IEC: Geneva, Switzerland, 2014.
- Starr, T.W.; Endicott, H.S. Progressive stress: A new accelerated approach to voltage endurance. IEEE Trans. Power Appar. Syst. 1961, 80, 515–522. [Google Scholar] [CrossRef]
- IEC 60216; Guide for the Determination of Thermal Endurance Properties of Electrical Insulating Materials. IEC: Geneva, Switzerland, 2013.
- Montanari, G.C.; Seri, P.; Morshuis, P.; Hebner, R. An approach to insulation condition monitoring and life assessment in emerging electrical environments. IEEE Trans. Power Deliv. 2019, 34, 1357–1364. [Google Scholar] [CrossRef]
- Kreuger, F.H. Partial Discharge Detection in High-Voltage Equipment; Butterworth-Heinemann: London, UK, 1990. [Google Scholar]
- IEC 60270; High-Voltage Test Techniques–Partial Discharge Measurements, 3rd ed. IEC: Geneva, Switzerland, 2015.
- Dissado, L.A.; Fothergill, J.C. Electrical Degradation and Breakdown in Polymers; Peter Peregrinus Press: London, UK, 1992. [Google Scholar]
- Mazzanti, G. Issues and challenges for HVDC extruded cable systems. Energies 2021, 14, 4504. [Google Scholar] [CrossRef]
- Stone, G.; Culbert, I.; Boulter, E. Electrical Insulation for Rotating Machines: Design, Evaluation, Aging, Testing, and Repair; John Wiley & Sons: Hoboken, NJ, USA, 2014. [Google Scholar]
- Morshuis, P.H.; Smit, J.J. Partial discharges at DC voltage: Their mechanism, detection and analysis. IEEE Trans. Dielectr. Electr. Insul. 2005, 12, 328–340. [Google Scholar] [CrossRef]
- Vala, S.S.; Mirza, A.B.; Emon, A.I.; Luo, F. A review of partial discharge in stator winding of rotating machines fed by voltage source PWM motor drives. IEEE Trans. Industry Appl. 2024, 60, 3790–3807. [Google Scholar] [CrossRef]
- Rui, R.; Cotton, I. Impact of low-pressure aerospace environment on machine winding insulation. In Proceedings of the IEEE International Symposium on Electrical Insulation, San Diego, CA, USA, 6–9 June 2010; pp. 1–5. [Google Scholar]
- Rumi, A.; Marinelli, J.; Barater, D.; Cavallini, A.; Seri, P. The Challenges of Reliable Dielectrics in Modern Aerospace Applications: The Hazard of Corona Resistant Materials. IEEE Trans. Transp. Electrif. 2022, 8, 4646–4653. [Google Scholar] [CrossRef]
- Jiang, J.; Zhang, B.; Li, Z.; Zhang, C.; Ranjan, P.; Zhang, X. Partial discharge investigation under low air pressure and variable frequency for more-electric-aircraft. IEEE Trans. Dielectr. Electr. Insul. 2021, 28, 1793–1801. [Google Scholar] [CrossRef]
- Elorza Azpiazu, L.; Almandoz, G.; Egea, A.; Ugalde, G.; Badiola, X. Study of partial discharge inception voltage in inverter fed electric motor insulation systems. Appl. Sci. 2023, 13, 2417. [Google Scholar] [CrossRef]
- Lowndes, R.; Cotton, I. Forecasting the partial discharge inception voltage (PDIV) of insulated busbars for future aircraft power distribution systems. In Proceedings of the IEEE Electrical Insulation Conference (EIC), Denver, CO, USA, 7–28 June 2021; pp. 189–192. [Google Scholar]
- Montanari, G.C.; Shafiq, M.; Myneni, S.B. A building block to the design of partial discharge free HV and MV cables: Modelling defects and discharge inception voltage. IEEE Access 2025, 13, 40649–40657. [Google Scholar] [CrossRef]
- Montanari, G.C.; Seri, P.; Ghosh, R.; Cirioni, L. Noise Rejection and Partial Discharge Source Identification in Insulation System Under DC Voltage Supply. IEEE Trans. Dielectr. Electr. Insul. 2020, 27, 1–6. [Google Scholar] [CrossRef]
- Niemeyer, L. A generalized approach to partial discharge modeling. IEEE Trans. Dielectr. Electr. Insul. 1995, 2, 510–528. [Google Scholar] [CrossRef]
- Cambareri, P.; Montanari, G.C. A Surface Discharge Model for the Design of Surface Components of Insulation Systems Under AC Stress in Industrial Electronics Environments. IEEE J. Emerg. Sel. Top. Ind. Electron. 2023, 4, 698–706. [Google Scholar] [CrossRef]
Disclaimer/Publisher’s Note: The statements, opinions and data contained in all publications are solely those of the individual author(s) and contributor(s) and not of MDPI and/or the editor(s). MDPI and/or the editor(s) disclaim responsibility for any injury to people or property resulting from any ideas, methods, instructions or products referred to in the content. |
© 2025 by the authors. Licensee MDPI, Basel, Switzerland. This article is an open access article distributed under the terms and conditions of the Creative Commons Attribution (CC BY) license (https://creativecommons.org/licenses/by/4.0/).

