Article

Energy Efficiency in Buildings: The Gap Between Energy Certification Methods and Real Performances

by
Niccolò Aste
,
Harold Enrique Huerto-Cardenas
*,
Claudio Del Pero
,
Fabrizio Leonforte
,
Michela Buzzetti
,
Rajendra Singh Adhikari
,
Elisa Montevecchio
and
Camille Luna Stella Blavier
Architecture, Built Environment and Construction Engineering Department, Politecnico di Milano, 20133 Milano, Italy
*
Author to whom correspondence should be addressed.
Energies 2025, 18(22), 6015; https://doi.org/10.3390/en18226015
Submission received: 17 October 2025 / Revised: 7 November 2025 / Accepted: 13 November 2025 / Published: 17 November 2025
(This article belongs to the Special Issue Performance Analysis of Building Energy Efficiency)

Abstract

In response to the pressing need to increase energy efficiency in buildings, new regulations are continually being introduced to enforce higher standards. The recent recast of the Energy Performance of Buildings Directive (EPBD IV) emphasizes the establishment of national performance standards, which will supposedly be based on the national Energy Performance Certificate (EPC). However, energy certifications across several European countries rely on a quasi-steady state approach, which fails to accurately represent real-performance conditions due to inherent limitations. This is more evident in buildings located in warm climates, where actual energy demands far exceed those predicted by energy certifications. To address these discrepancies, a shift towards dynamic performance assessment methods is pivotal. This research compares the heating and cooling energy demand of an office building using two approaches: the quasi-steady state, prescribed by the Italian standard, and the dynamic state. After calibrating the dynamic model, it was employed to perform a simulation incorporating more detailed user profiles and boundary conditions than those used in the quasi-steady state method. This approach allows the preservation of both reasonable accuracy and practical applicability. Finally, a sensitivity analysis of influential parameters seeks to elucidate the main causes of divergence between simulated and measured performance and to identify opportunities for improving EPC. The simulation outcomes indicate that, while the stationary model yields heating energy demand relatively aligned with the measured data, it shows substantial discrepancies (about 50%) in the cooling predictions. Moreover, the findings reinforce the inadequacy of the simpler approach and advocate for the integration of dynamic state simulation in energy performance assessment, aligning with the objectives of the recent EPBD.

1. Introduction

The building sector accounts for the largest share of global final energy consumption and carbon emissions, equal to about 40% and 37%, respectively, in the European Union (EU).
The decarbonisation of the building stock is one of the most important goals of sustainable development, considering the impact of buildings even on a global scale [1]. In response, the recent release of the Energy Performance of Buildings Directive (EPBD IV) [2], imposes that from 2030 all new residential buildings in Europe must be zero-emission while aiming to have the entire building stock climate-neutral by 2050.
The Energy Performance Certificate (EPC), as mandated by the EPBD, plays a pivotal role in the EU’s decarbonisation strategy. By standardizing the assessment of energy performance across Member States, EPCs enable the benchmarking and comparison of building efficiency, thus promoting energy-conscious decisions among stakeholders. Moreover, accurate and reliable energy performance assessments are essential for identifying opportunities for efficiency improvements.
Furthermore, as a priority objective, the Directive requires a reduction of more than 20% in the energy consumption of the entire building stock of each Member State by 2030. The starting point for this huge, efficiency improvement operation will therefore be the data on current consumption. In such a context, in the absence of more complete data regarding the real consumption, Member States will supposedly base their threshold on the estimation derived from energy performance certification of the existing building stock, predominantly performed with the quasi-steady state (QSS) method. It should be noted that, although this method offers a simplified and standardized approach to carry out a preliminary assessment, it fails to capture the dynamic nature of buildings’ energy performance, simulating the energy use under standard conditions and assumptions [3].
More in detail, while it seems reasonable to have a slight variation (less than 5–10%) between predictions and real data [4], the actual gap observed in QSS seems too wide to be acceptable [5,6].
The performance gap between real consumption and EPC estimation is even more exacerbated in the case of structures located in the Mediterranean area, where QSS simulations may exhibit a notable underestimation of energy need [7]. This discrepancy arises from the oversimplification of dynamic thermal behaviors inherent in constructions [8].
QSS simulations, by their nature, assume a constant and uniform thermal state, neglecting the multiple interactions between building envelope, internal heat gains, and fluctuation of weather parameters. Among the limitations of quasi-steady state methods, one major drawback lies in their inability to capture dynamic phenomena, for example, to accurately reflect short-term fluctuations, thermal capacity of the envelope, occupancy-internal heat gains patterns and system operations. Consequently, this method relies heavily on empirical or pre-calculated utilization factors, based on the thermal inertia of the building envelope and the ratio of gains/losses in heating and cooling [9], and solar shading coefficients to approximate the dynamic effects. This reliance introduces a significant degree of uncertainty and diminishes the overall transparency of the methodology [10,11].
Moreover, such method also proves inadequate for evaluating advanced and responsive technologies whose performance is highly dependent on hourly variations and interactive behaviors, such as adaptive facades, night-time ventilation strategies and systems with load-dependent efficiencies [10,11]. The dynamic nature of solar irradiation, temperature, relative humidity and occupant behavior, introduces complexities that are not adequately captured by QSS models, which systematically underestimate cooling loads [12].
For such reason, some authors pointed out that the cooling energy need should be calculated by using a different approach from that used for heating need [13]. However, among European countries, more than half of the EPCs are currently based on the QSS method (Figure 1).
This paper aims to highlight the critical limitations of the quasi-steady state approach. It emphasizes how these limitations, already significant, are likely to be exacerbated under temperature rise due to climate change, potentially leading to greater underestimation of cooling needs. On a large scale, such inaccuracies could distort national energy consumption estimates and misrepresent actual CO2 emissions [14], thus compromising both the robustness of policy decisions and the feasibility of achieving long-term decarbonisation targets.
In such respect, this paper seeks to underline the cruciality of implementing dynamic state (DS) calculation in EPC. Firstly, a comprehensive overview of the state-of-the-art on the shortcomings of EPC based on the quasi-steady state method is reported. After that, in order to underline the limitation of EPC, a comparative energy estimation analysis through both the methods of the performance of an office building case study located in Milan (Italy) is carried out.
The paper is structured as follows: Section 2 presents an overview of EPC in Europe; Section 3 shows the main limitations of the QSS simulation and makes a comparison with DS one; Section 4 offers a brief description of the case study; Section 5 outlines the energy simulation assessment, Section 6 presents the main results and discussion, while Section 7 outlines the conclusions with the main outcomes of the study.

2. Energy Performance Certificate in the EU

The EPBD EU Directive 2002/91/EC [15] and its recasts, 2010/31/EU firstly and 2018/844/EU subsequently, foresee that “Member States shall lay down the necessary measures to establish a system of certification of the energy performance of buildings. The energy performance certificate (EPC) shall include the energy performance of a building and reference values such as minimum energy performance requirements in order to make it possible for owners or tenants of the building or building unit to compare and assess its energy performance” [16].
The transposition in each national legislation gave rise to two approaches to assess and predict energy performance in EPC: QSS and DS. While both methods serve the same purpose, they differ significantly in their approaches and the level of detail they provide. The first one assumes that the building operates under steady-state conditions, meaning that internal temperatures and heat flows remain constant over time. This approach simplifies calculations by averaging energy consumption over specific periods, generally on a monthly basis. In contrast, dynamic state models consider the transient behavior of a building’s thermal environment, accounting for time-varying external and internal conditions. These models take into account changes in solar radiation, outdoor temperature fluctuations, building occupancy, and energy gains or losses during the day and night. This results in a time-dependent simulation that captures the thermal response of the building in real-time or on a fine temporal scale (hourly or sub-hourly).
In general, the simulation models used in EPC schemes in EU countries are mostly based on the quasi-steady state monthly energy balance calculations. However, in some countries, the EPC methods are based on dynamic calculations on an hourly basis [17]. More in detail, in some of them, like Hungary and Portugal, dynamic simulation is mandatory for specific typologies of buildings, while in Finland, dynamic energy calculation is mandatory only for buildings with a cooling system. Also in Spain, dynamic simulation is already part of the methodology for the EPC, even if it is still possible to officially perform a calculation with an annual balance.
In the following figure are shown the European countries which adopt a quasi-steady or a dynamic state method for the implementation of the EPC.

3. Limits of Building Energy Simulation for EPC

In this section, the main differences between quasi-steady and dynamic state simulations used for EPC are highlighted; nonetheless, the main sources of discrepancy in energy simulation are discussed.

3.1. Overview of the Main Sources of Discrepancy in Energy Simulation

First of all, regardless of the simulation method adopted, it is important to highlight the main sources of discrepancy between simulated and real data, as summarised below [6,18,19]:
  • the lack of precise information about input parameters such as the thermo-physical data of envelope components;
  • calculation limits of the tool used to describe the geometric features (e.g., in the presence of thermal bridges and a heat flow model restricted to one-dimensional flow);
  • the adoption of inaccurate or incomplete models of certain physical phenomena (e.g., the capability to model the vapour and water transfer through the building envelope components, etc.).
While the first issue is related to the availability of information during the design stage as well as to the user behavior during the building operation, the other two are strictly related to the methodology and tool adopted to carry out the simulation.

3.2. Performance Gap Comparison Between QSS and DS Methods

The QSS typically relies on average monthly climatic data and simplified boundary conditions to estimate energy needs, whereas the DS method uses an hourly calculation timestep, allowing for detailed simulations that reflect real operating conditions and climate. However, due to a common need for oversimplification of the EPC procedures, the first method, with a large number of assumptions and generic standard inputs, is a widely adopted procedure in EU countries (Figure 1).
In particular, QSS approach lacks the precision required to fully capture building performance under actual operating conditions [20]. In fact, it allows relatively quick evaluations, requiring less detailed input data compared to transient simulation approaches, making it more accessible and practical for widespread use in energy performance certification across different building types and scales. The ease of use of the QSS method is paradoxically counterbalanced by performance estimation far from real values.
Several studies have reported that the quasi-steady state approach can overestimate heating needs [21,22,23,24] and yield inaccurate results during the cooling season, especially in warm climates [3,12,25] and in buildings with high thermal inertia with intermittent heating [26].
Furthermore, key inaccuracies have been demonstrated in the QSS method for estimating thermal gains [27] due to its simplified assumptions. Using a “black body cavity” model (EN ISO 13790:2008 [28]), it overestimates solar gains through windows and underestimates those through opaque surfaces. Unlike dynamic simulations, it also neglects radiative losses and simplifies surface temperature estimations, affecting internal gains and infrared radiation calculations.
In a work that analyses buildings located in Mediterranean areas [3], the authors stated that a detailed dynamic simulation model in the form of certified software should be preferable to verify buildings’ EPC requirements [13,23]. In the comparison between the two approaches [3], the first one incorrectly estimates the energy demand in all case studies and the differences in the cooling demand varied depending on the climate and operational time.
Similarly, in a European project [29] where four types of buildings were analysed (single house, apartment block, office and school) in various European cities with QSS and DS methods, the authors stated that the main sources of discrepancy between the two approaches are the modelling differences in schedules of internal gains, air infiltration, the simplified calculation of solar gains and capacitive behavior of the building components in quasi-steady state method, which is more significant in warm climates.
Substantial differences have also been observed in a case study building located in Zagreb (Croatia) [25], which shows that, for all building geometries and uses considered in the analysis, the QSS model’s deviation reaches a value of about 30% in heating and between 11–114% for the cooling demand.
Another study [12] thoroughly analyzed the accuracy of the two approaches across a range of building types located in the centre of Italy, different envelope characteristics and climate conditions. The findings reveal that these two methods can produce annual energy requirement differences of up to 40% for heating and 18% for cooling.
Similarly, simulations conducted on six-story residential buildings in various cold climate zones in China [24] further examined the applicability and differences between QSS and DS methods. The analysis shows substantial variations in heat loss between the two approaches, with differences ranging from 16.6% to 43.8%, especially in high-altitude areas with strong solar radiation and large diurnal temperature swings. Based on these findings, the authors recommend using dynamic energy simulations rather than quasi-steady state calculations, to more accurately assess building energy demand.
A case study in Athens, Greece [14], examined the energy performance gap between both methods, revealing significant discrepancies. The authors emphasize the necessity of using DS simulation to enhance EPCs in the building sector, minimize unnecessary investments from overestimated energy efficiency measures, and improve CO2 emissions predictions, which are essential for EU energy policies in this sector.
Similarly, a case study in Naples [30] underscores the importance of dynamic simulations within the regulatory framework for energy-efficient buildings. Researchers note that the QSS method may overestimate a building’s energy class, potentially inflating expected economic savings from refurbishment measures. Comparable findings were reported for an older building in central Italy [31], where QSS simulations showed discrepancies of up to 12–14% compared to DS results.
Although the dynamic model allows for an accurate evaluation of the energy demand [10,11], in many EU countries it has not yet been implemented because it generally requires a greater amount of information and an excessive workload for the user. Moreover, it should also be adapted to the national context. For such reasons, in most of the EU countries the quasi-steady method is employed, both in winter and in summer, despite the calculation of cooling needs in the Mediterranean area has shown significant deviances if compared with the DS approach [7,32,33,34].
As highlighted in another work [35], which compared the annual energy use for space heating and cooling through QSS and DS simulations, the first method overestimates the energy need for heating and underestimates the energy need for cooling. In particular, the results show that the cooling need underestimation is higher for the Southern Italian cities (it ranges from −23% to −36%). High deviations in percentage also appear in the heating demands, especially in the warmer climates, although the result is amplified by the low energy demand.
It should be noted that the abovementioned works do not compare the results of different simulation methods with real acquired data. According to the literature analysed, few research papers deal with such topic, while most of the publications compare QSS and DS simulations.
With regard to the comparison with real data, it has been demonstrated that the heating monitored data of an nZEB in the Mediterranean context is, on average, about 35% lower than the results obtained through dynamic simulation, and about 60% lower than the ones calculated with the QSS method [31]. The authors also noted that DS simulation more accurately reflects real conditions by properly accounting for solar gains and the temperature setpoints of technical systems.
A study that used the QSS method for the assessment of some dwellings located in Cyprus [36] reveals a significant gap between calculated energy demand and actual measured consumption. In particular, the cooling loads deviation is about 150% of the real data because the method is not able to take into account the users’ habits, since in summer they activate the cooling system only in some occupied rooms. On the contrary, for heating, simulations showed good alignment (since normally the entire dwellings are heated in winter), although heating needs were still overestimated. In summary, the study highlights the importance of validating simulation models against measured data, especially for cooling, to ensure realistic energy performance assessments.
In contrast, another work [37] analyzed a nearly Zero Energy Building (nZEB) in a cold climate. According to the findings, real energy consumption monitored over a short winter period was approximately 4.5–6% higher with respect to the performance predicted by QSS and DS simulations.
In a student accommodation complex in Melbourne, Australia [38], the results show that the QSS approach overestimates heating demand and underestimates equipment and lighting use.
Furthermore, when calculations rely on simplified standard values for occupant behavior and airflow rates, as is common in EPCs, significant differences between simulated and actual energy consumption can arise, ranging from 50% to 150% [28].
Most of the studies comparing QSS and DS methods focus predominantly on buildings located in cold climates [5,12,22,37,39,40,41,42], while limited research has investigated their performance in warm or Mediterranean regions [3,36,43,44]. This geographical imbalance represents a significant gap, particularly as, due to climate change, cooling demands rise globally, but especially in areas that already have a hot climate.
The QSS method, although widely used for its simplicity and lower input data requirements, suffers from key limitations, as mentioned above. On the other hand, DS simulations offer a more accurate representation of building behavior, as confirmed by the literature that generally recognizes such models as more reliable for predicting real energy performance [11]. Moreover, in recent years, the introduction of the hourly calculation method based on EN ISO 52016-1: 2017 [45] has led to the enhancement of accessibility and transparency of such method, with the advantage of the use of similar input required by the monthly approach [46]. Such standardization efforts aim to make dynamic calculation methods more reliable and accessible. In detail, a primary goal was to handle dynamic effects without significantly increasing the burden on the end-user, keeping the extra input required from the user to a minimum compared to the monthly calculation method. Secondly, the increased complexity inherent in dynamic simulation (such as hourly operation schedules and hourly weather data) must be introduced by standards, not by the end-user. This approach enhances large-scale feasibility by mitigating the need for the user to provide highly detailed, dynamic operational data [46].
Implementing dynamic simulations on a large scale requires specialized software capable of robust and consistent calculations. A key aim of the EPB standards revision was to make procedures unambiguous and software-proof. The simplified hourly method in EN ISO 52016-1 is more advanced than its predecessor (EN ISO 13790:2008). The main difference is that the building elements are not aggregated to a few lumped parameters but are kept separate in the model. This increases transparency and makes the method more widely usable, for instance, by allowing the thermal mass of the building or building zone to be specified per building element. The drawback of this increased detail is that due to the much higher number of nodes, a robust numerical solution method (and software) is required [46,47].
In such regard, in Italy, some software companies have already started to implement this procedure in their products, although it is not yet mandatory. However, the continued widespread adoption of the QSS approach in regulatory frameworks may lead to some uncertainty for the estimation of building performance, from which greenhouse gas emissions are also derived. This study aims to address this gap by focusing on the differences between the two methods, with particular emphasis on discrepancies in cooling energy demand estimation.

3.3. The Cooling Demand Paradox

The adoption of QSS raises the paradox that it may seem that there is no need for cooling. In fact, while monthly average temperatures in European capitals during the warmest months are below the setpoint temperature (26 °C), except Athens and Cyprus, hourly daily peak temperatures often significantly exceed this comfort threshold. However, QSS models, which operate based on monthly averages, cannot consider the peaks. As a result, these models might suggest that the heating system should be turned on even on summer days. For example, considering a city like Warsaw, where the average temperature in August is around 16 °C, the heating systems might need to be turned on to achieve a comfortable temperature (considering negligible gains). However, on the hottest days of summer, hourly maximum temperatures exceed 33 °C. In such respect, the QSS could paradoxically suggest triggering the heating system despite outdoor conditions that demand cooling or ventilation instead.
As can be noted by the Table 1 shown hereafter, such a discrepancy is even more exacerbated considering countries at lower latitudes. This is a very critical issue that needs to be highlighted, as energy consumption for cooling has been growing steeply, and, according to the IEA, will continue to rise in the face of climate change.

3.4. Main Issues to Overcome

In general, the main reasons for discrepancies between QSS and DS methods can be summarized as follows:
  • different resolution of weather data (average monthly values used in the quasi-steady state method cannot capture the effects of climatic variations over time);
  • estimation of solar and thermal gains in the quasi-steady state method results in significant deviations in the building’s energy performance;
  • the dynamic properties of a building and their effect on the building’s energy performance are modelled with quasi-steady state methods using empirically determined gain utilization factors, which approximate the results of cooling energy demand;
  • a fixed air set-point temperature is used in the quasi-steady state methods for the whole calculation period, whereas intermittent heating and/or cooling is treated as continuous with adjusted set-point temperature;
  • scheduling the infiltration/ventilation rate is not possible in the quasi-steady state method.

4. Case-Study Description

To demonstrate the above, namely the inadequacy of QSS models compared to DS ones, especially about summer cooling, this paper presents a detailed analysis of an office building case study.
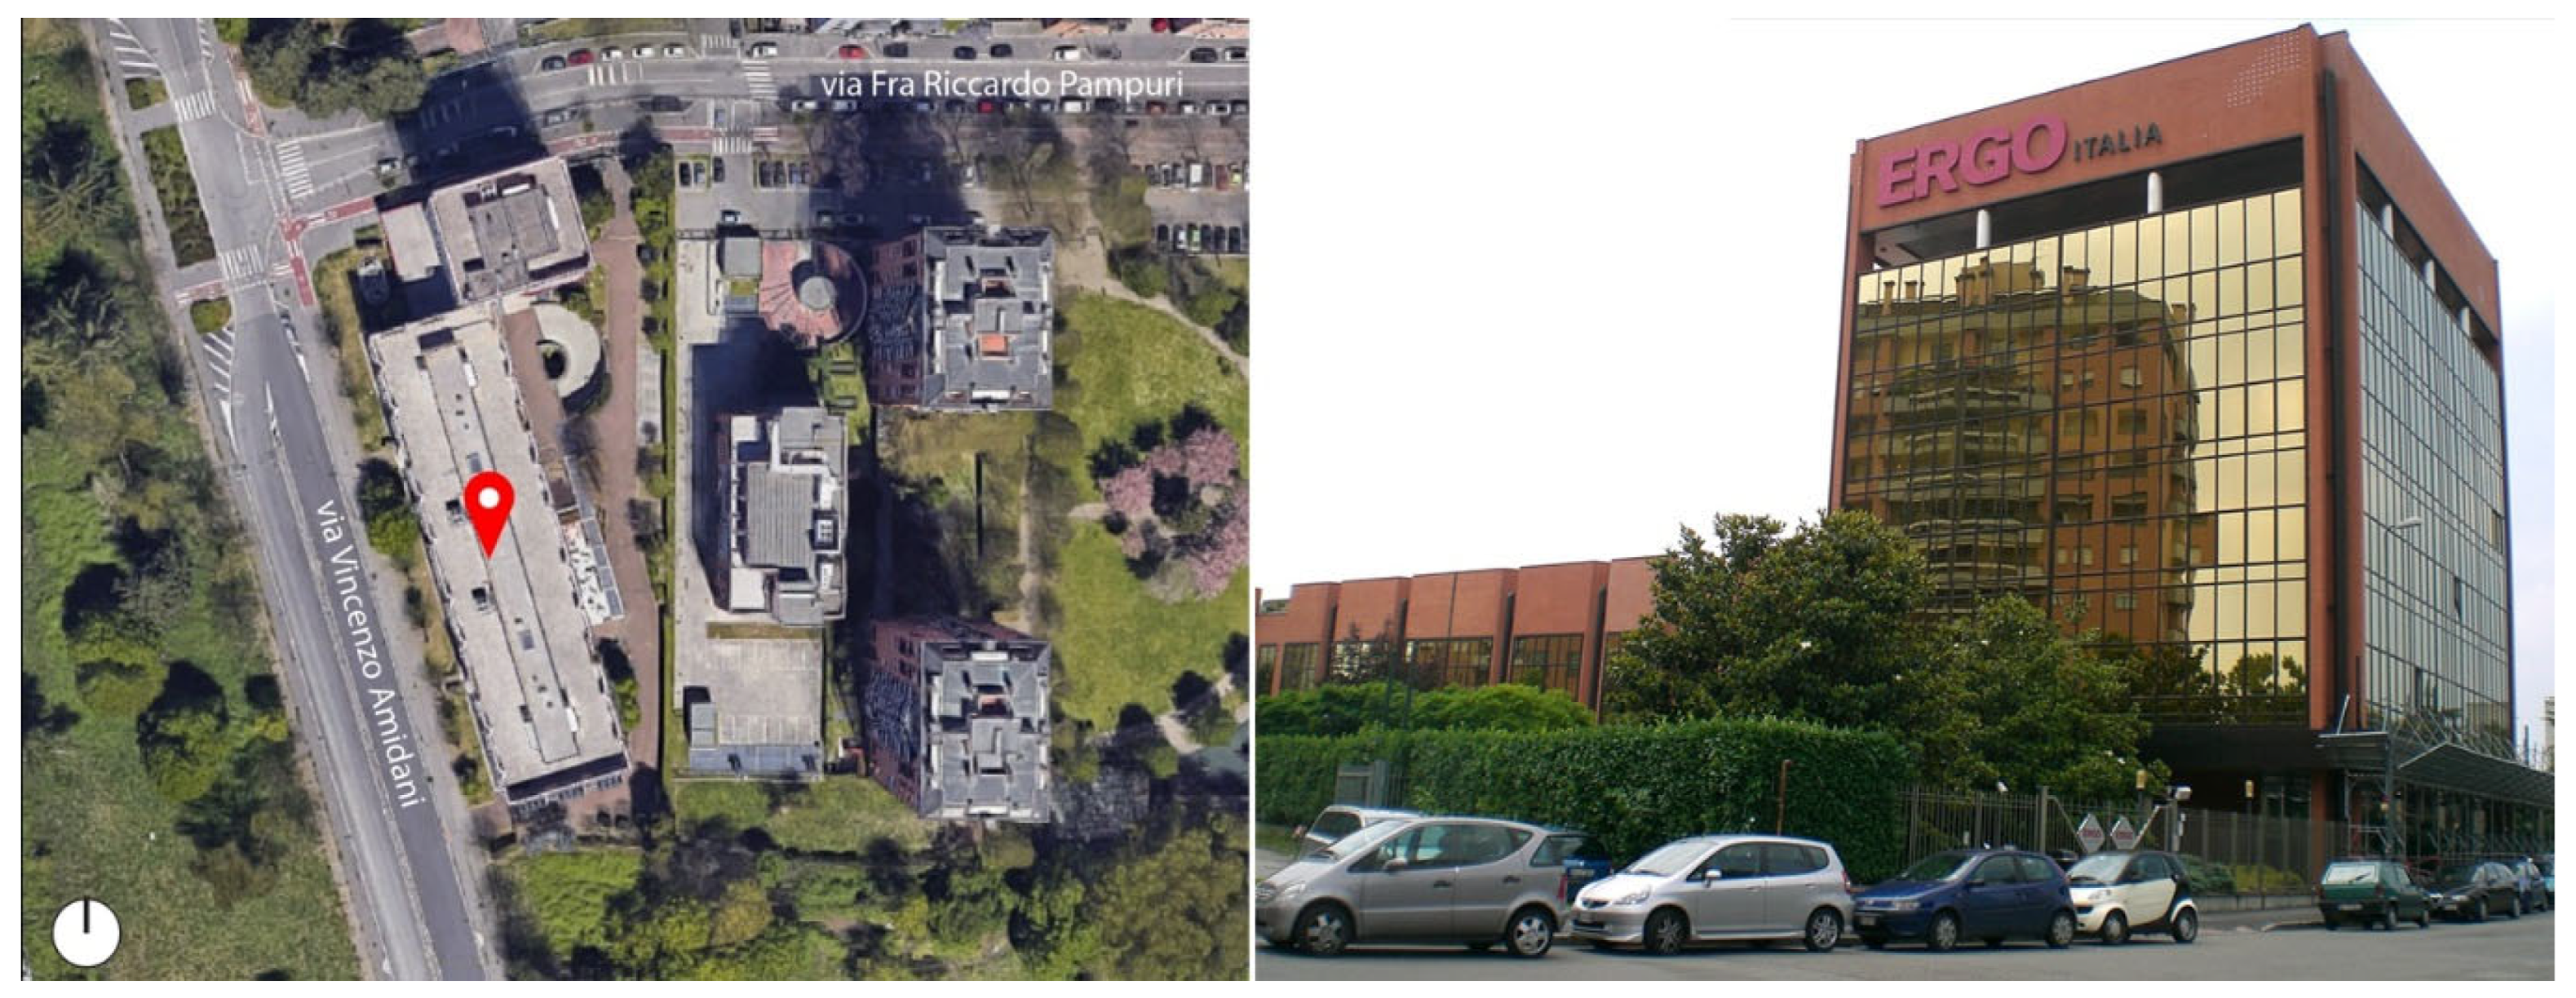
The selected building, which is the Italian headquarters of a major insurance company located in Milan, northern Italy, is highly representative because: (i) it has been the subject of several scientific studies over the last 15 years [48,49], so there is detailed and validated information and data available on it over a significant period of time; (ii) due to its size and construction characteristics, it is representative of the large number of tertiary buildings constructed in Europe in the 1980s and 1990s, which have poor energy performance and large glazed surfaces; (iii) it is located in Milan, whose climate is significant because it is characterized by fairly cold winters and hot summers, thus allowing the behavior in critical winter and summer conditions to be highlighted.
Originally constructed in 1998, it was representative of glazed office buildings of the 1990s, and it underwent an energy retrofit intervention in 2008. It consists of two rectangular blocks: a low-rise structure and a tower, with a total gross volume of 45,500 m3. The heated/cooled net volume is around 33,300 m3 (Figure 2).
The original construction quality of the building was generally poor, particularly in terms of durability, thermal insulation, and energy efficiency, which was common in Italian commercial buildings in the late 1900s. The external facades were constructed using layers of bricks with insufficient insulation and covered with clay tiles, while glazing elements were constituted by aluminium frames and outdated reflective double glazing. Some parts of the opaque facades were covered with spandrel panels, consisting of reflective glass and an insulating panel on the inner side.
Detailed features of the envelope components, as well as a detailed description of the HVAC system, are described in a previously published work [48], while the main parameters are summarized in Table 2.
Monitoring data related to the year 2006, adopted as a reference, reveals that the building was characterized by a heating and cooling energy demand equal to 50.9 kWh/m2 and 64.0 kWh/m2 respectively.
The data presented above are used as basic boundary conditions for the simulations that are described in the next section.

5. Energy Assessment Procedure

This chapter describes the procedure for energy simulation and assessment applied in this work to the above-described case study.
As an initial clarification, it must be specified that according to EN 15603:2008, two different approaches can be distinguished [50]. The first is called “standard”, which is based on conventional climate, use, surroundings and occupant-related input data, defined at the national level and adopted for EPCs; the second is called “tailored”, which is calculated with data adapted to the specific actual building and the purpose of the calculation. These two approaches were compared within three different simulation rounds, as described in detail below.
The goal of this analysis is to evaluate different simulation approaches and the related energy gap with respect to measured data, with a focus on heating and cooling services, to identify the main issues related to the proper estimation of the building energy performance. In such regard, it was decided to compare heating and cooling energy demand rather than the energy consumption or the primary energy.
However, before proceeding to show the results of the three simulations mentioned above, the DS energy model was calibrated and validated against actual data collected during the 2006 energy audit.

5.1. Calibration and Validation of the DS Energy Model

Model calibration represents a pivotal step in enhancing the accuracy of a simulation model by comparing its predicted output with measured data under identical boundary conditions [51]. In this work, calibration was performed by comparing the measured energy demand, obtained from the energy audit, with the simulated results provided by the DS energy model. The fine-tuning procedure has been done adjusting several input parameters of the model; for example, providing detailed information of the building envelope and thermal bridges, implementing internal gains due to people/artificial lighting and ACH due to infiltration/ventilation based on real conditions, creating a customized weather file for 2006 through climate data downloaded from Juvara-Milano weather station related to the ARPA (Regional Agency for Environmental Protection) database. After multiple simulation runs, the iterative refinement of input parameters provided satisfactory results. The parameters adopted in the calibrated simulation are reported in Table 3.
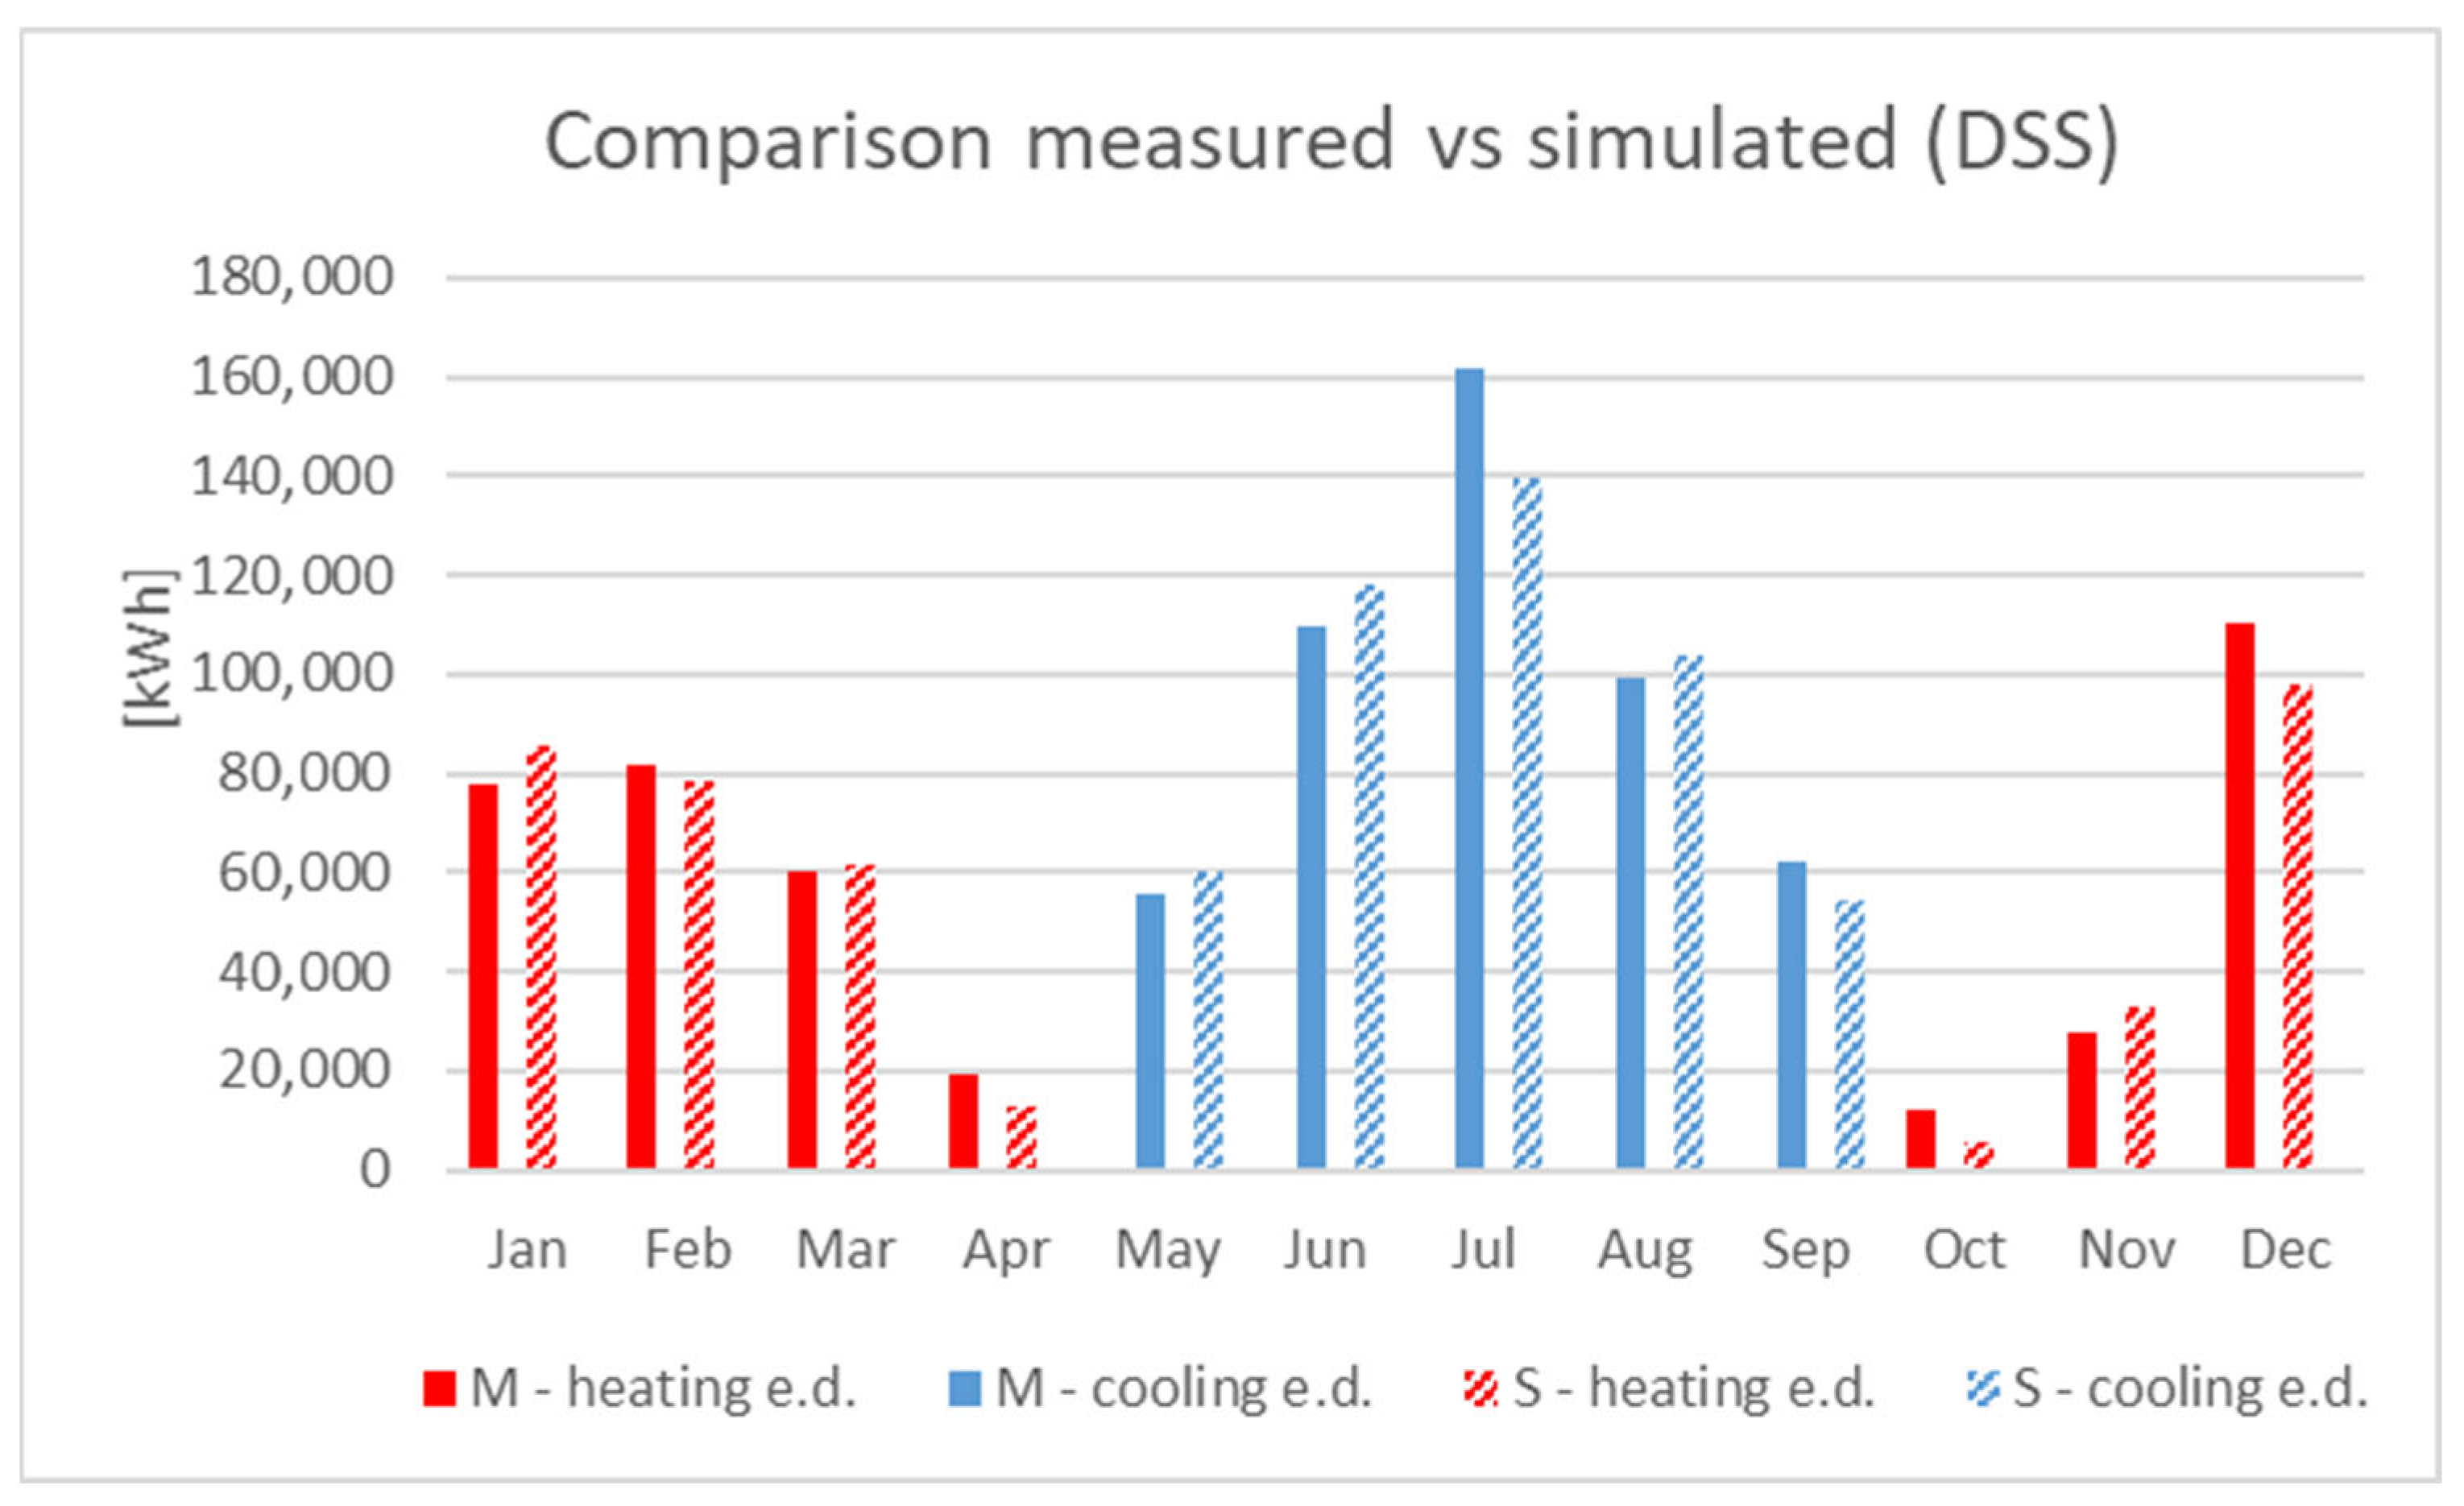
To assess the reliability of the simulation model, its accuracy has been evaluated by calculating the statistical indexes, such as the Normalized Mean Bias Error (NMBE) and the Coefficient of Variation of the Root Mean Square Error (CVRMSE), both computed with respect to the measured data. The obtained results were then compared against the threshold values recommended by ASHRAE Guideline 14 [52]. In such regard, the measured and simulated monthly energy demand (both for heating and cooling) has been compared in Figure 3, and the estimated NMBE and CVRMSE results are about 3% and 13%, respectively, which fall within the acceptable limits defined by ASHRAE Guideline 14 (NMBE ± 5% and CVRMSE < 15%).
Although the calibration and validation of the dynamic model yielded energy demand results that closely matched the measured data, it should be noted that calibration may not be an appropriate approach for the widespread implementation of dynamic simulation engines within the EPC framework. As discussed above, this method would be difficult to apply in practice and would significantly increase the time and cost associated with certificate generation. The necessity of collecting highly detailed information on building characteristics, climatic conditions, and occupancy profiles, combined with the requirement for advanced user expertise, makes this approach impractical for large-scale or routine applications.
A more feasible strategy would involve maintaining the DS simulations while employing standardized usage profiles and boundary conditions. This would preserve compatibility with dynamic modelling tools while ensuring wider applicability. For example, the use of differentiated daily profiles across building types and regions, coupled with continuously updated climatic datasets, could enhance realism without compromising practicality.
In such regard, the following Simulation B will explore an alternative procedure capable of providing results that, although less precise than those obtained through full calibration, achieve an acceptable level of accuracy when compared with the QSS procedure.

5.2. Simulation A—QSS Simulation with Standard Boundary Conditions

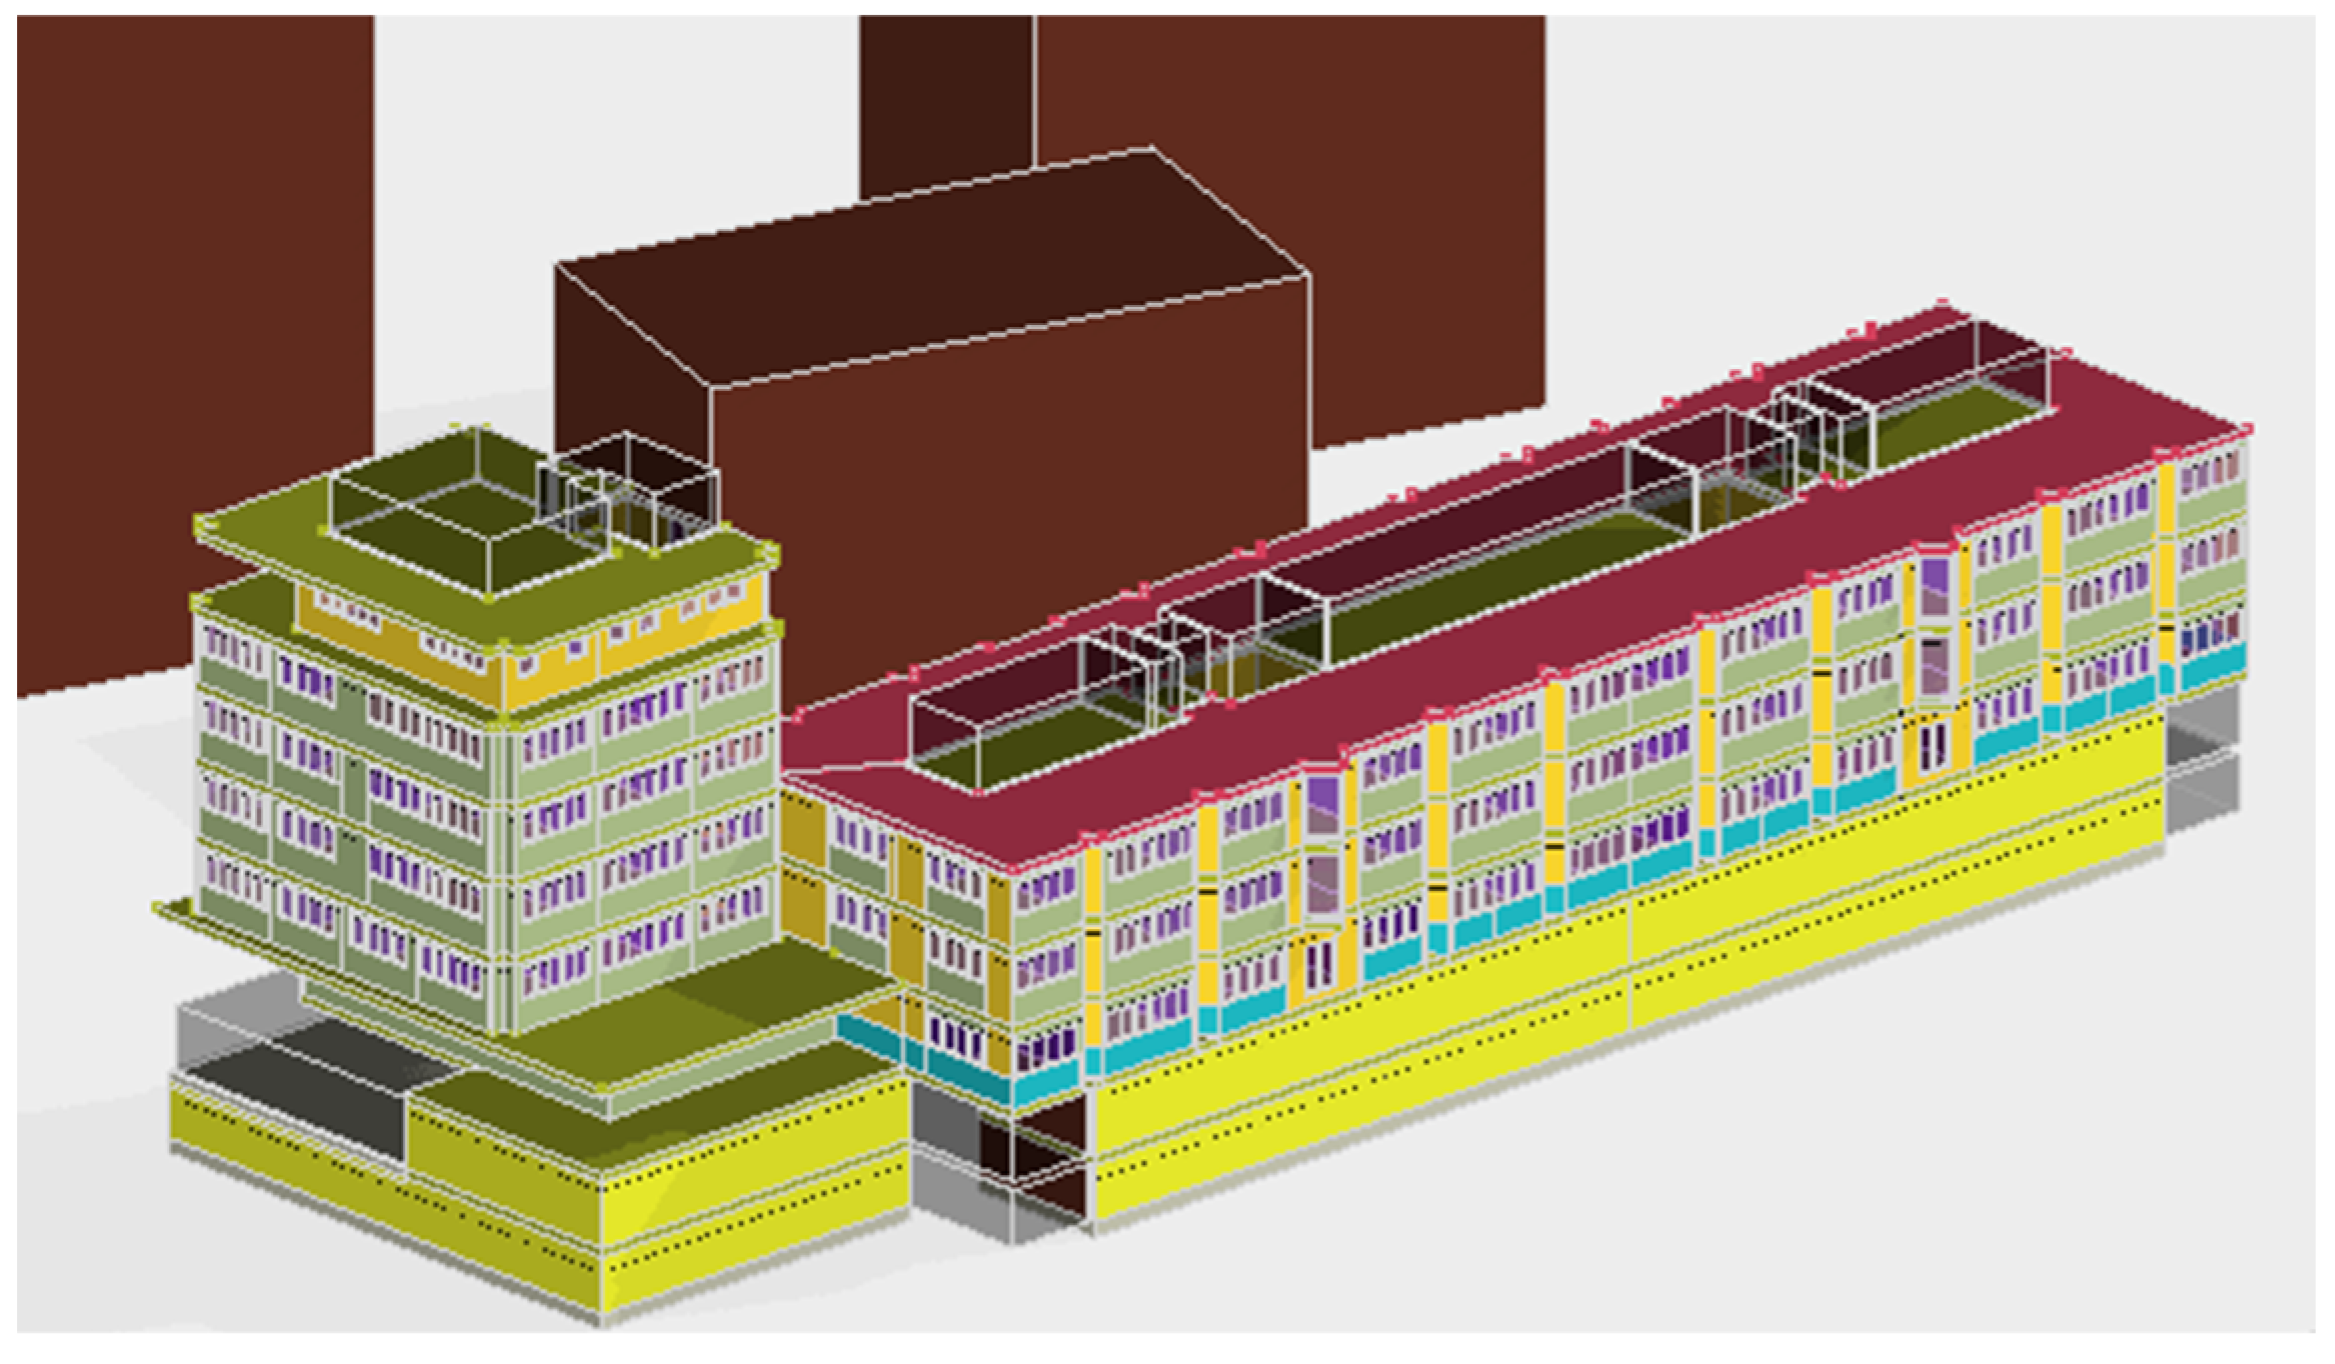
The first simulation carried out was done using the Italian protocol for EPC, a QSS calculation method in accordance with UNI TS 11300 [53], which represents the national application of the ISO 13790:2008 [28]. The latter requires the use of specific certified tools in compliance with the national procedure and building/user conditions, as summarized below in Table 3. The chosen simulation tool is Termolog [54], which is one of the most used among those formally accredited at the national level. Figure 4 shows a view of the model geometry.
The model geometry consists of 18 thermal zones (subdivided into different rooms) served by the technical system and some unheated spaces for the underground levels, the stairs, the services area, etc. The subdivision of the thermal zones has been done mainly according to the type of system that characterizes the different rooms, the function and the floor level.
About the thermal bridges, 20 elements were built for connection nodes between the wall and floor slabs, roof, windows, etc., using the Finite Element Method (FEM) module provided by Termolog software v. 2024.12 [54].
Regarding the weather data, according to the national procedure, each region in Italy can integrate the EPC regulation by adopting stricter parameters with respect to the national law and using a more accurate dataset for the climate conditions of the specific location. In such respect, data for the Lombardy region are taken from the Regional Decree 18546/2019—Annex H [55]. Such data is based on monthly average values of the following parameters: dry-bulb temperature, solar irradiation, wind speed and vapour pressure.
The calculation of latent energy demand is performed for each thermal zone based on the enthalpy of water vapour present in the zone due to air exchanges with outdoor and the vapour produced by occupants, processes and electrical equipment. In particular, the average water vapour for each square meter due to the presence of people and electrical equipment (e.g., dishwashers, etc.) is equal to 6 g/h×m2, as reported by the standard UNI 11300-1 for office spaces.

5.3. Simulation B—DS Simulation with Tailored Boundary Conditions

The second simulation model has been built using a DS calculation method through EnergyPlus v9.2 software [56]. Such a tool can be considered one of the main references for building energy analysis by the international scientific community [18]. This approach allows for defining building utilization profiles with greater flexibility and detail, enabling to replicate of real operating conditions, in contrast to the quasi-steady state method.
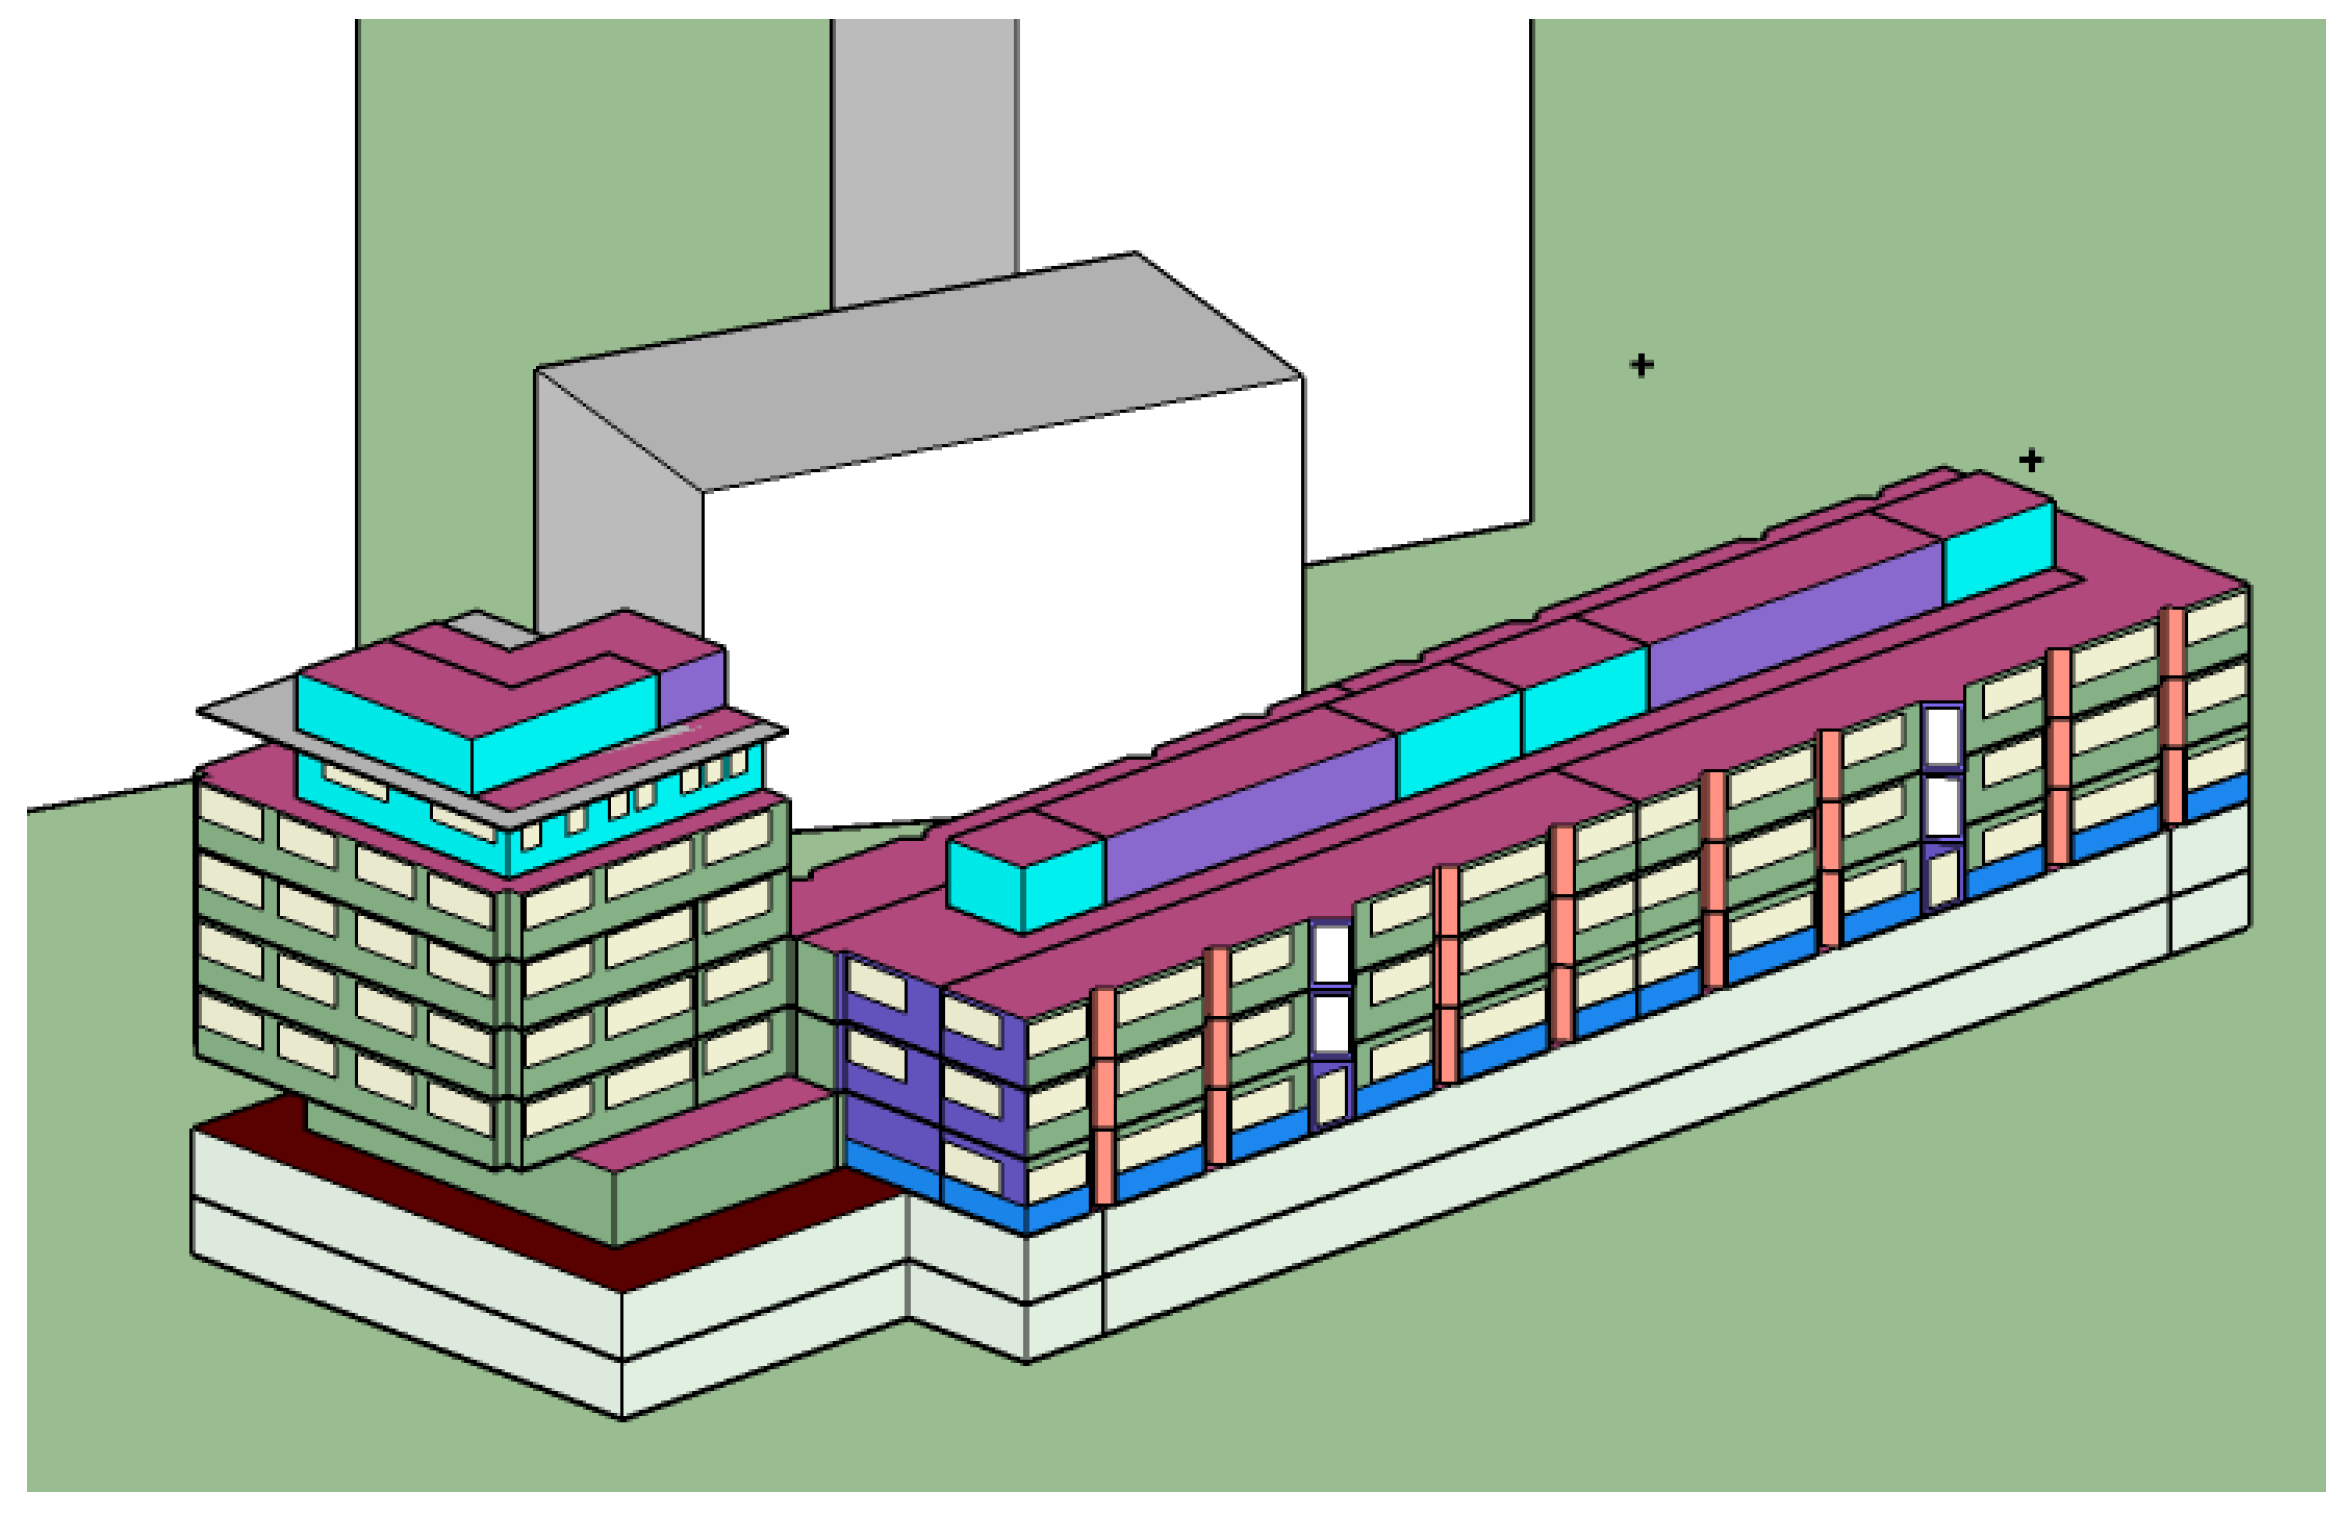
In detail, the model geometry was built by dividing the spaces into thermal zones similar to the process adopted for Simulation A. It should be noted that the floor area difference between the models made is about 1%. Such aspect is of particular importance, because it makes the comparison of the results of the two energy models possible. Figure 5 shows a view of the DS energy model.
Internal loads due to the people occupancy, electrical equipment and artificial lighting were implemented into the model by adopting a detailed profile provided by the standard UNI/TS 11300 for office spaces [53], as described in Table 3. Within the EnergyPlus environment, different alternatives are available to perform the thermal bridge calculation [18]. In this work, since the linear thermal transmittance (ψ) for about 20 thermal bridges was already calculated with Termolog software, these were used for the estimation of the modified U-value (Umod) to take into consideration the additional heat losses through thermal bridges in dynamic conditions, as suggested in [18]. The calculation of Umod involves adjusting the conductivity of one layer in the multi-layered envelope component so that its thermal transmittance matches the effective overall U-value of the envelope that includes thermal bridge effects.
Regarding weather conditions, in this analysis the TMY (Typical Meteorological Year) of Milan for the period 2000–2009 was adopted. In the dynamic simulation, latent energy demand has been calculated on an hourly basis, considering the exterior conditions from the weather file and water vapour emissions from occupants. To determine the water vapour supply, an occupancy density of 0.06 people/m2 for single office spaces [57] and a vapour production rate of 80 g/h per person (seated people with average activity level) were used according to [53].

5.4. Simulation C—DS Simulation with Standard Boundary Conditions

Finally, a performance gap analysis was also performed to identify the most influential parameters in energy simulation and quantify the gap between actual consumption and simulated values through a downgraded process of the DS model (Simulation C), as described hereafter.
In this simulation step, the same EnergyPlus model described in step B was adopted, but implementing standard boundary conditions, which are considered constant, as in the quasi-steady state method. In fact, due to the intrinsic limitations of the QSS procedure/simulation tool to vary the boundary conditions along the simulation time step, the set of constant parameters and boundary conditions adopted in the QSS approach has been applied to the DS model. In essence, for the purposes of comparative analysis the dynamic state method has been downgraded by using the conditions implemented in the Italian protocol for EPC in order to reduce the differences with the quasi-steady state model. In detail, the parameters modified in this simulation phase compared to step B are listed below.
  • weather file (WF): rather than utilizing the hourly weather file (TMY 2000–2009), the monthly average conditions are adopted as fixed values;
  • ground temperature (GT): instead of using temperature profiles provided in the EPW file related to Milano, the equivalent ground temperature estimated from the heat flow calculated through UNI EN ISO 13370 in the quasi-steady state method is adopted. It should be noted that such derived temperatures are usually higher than the one provided in the EPW used in the dynamic simulation;
  • user profile (UP): rather than using a detailed tailored profile, a fixed daily average value is applied for the whole year.
The details of the implemented conditions for Simulation A, B and C are listed in Table 3.
Table 3. Comparison of real building conditions with respect to the simulation setup adopted in the quasi-steady and dynamic state simulations (tailored and standard).
ParameterUnit of
Measure
Real Building/
Model Calibration
Simulation A:
QSS Simulation
(Standard)
Simulation B:
DS
Simulation (Tailored)
Simulation C:
DS
Simulation (Standard)
simulation tool--TermologEnergyPlusEnergyPlus
climate datavariousmeasured climatic data from 2006 (downloaded from ARPA [58])standard average monthly datahourly data from Milan TMY 2000–2009standard average monthly data
heating degree days (HDDs)-2403240422722404
cooling degree days (CDDs)-472366462366
ground temperature°C/estimated monthly profilemonthly measured profile provided in the weather fileestimated monthly profile
internal gains due to people,
electrical equipment and artificial lighting
W/m2
h/day
days/year
19.7
14
261
(1.3–2.7 W/m2 for the remaining time)
6
24
365
20
10
261
(2 W/m2 for the remaining time)
6
24
365
infiltration + ventilationh−10.90.720.720.72
h/day14888
days/year365365365365
heating°C20202020
h/day24242424
days/year15 October to 15 April15 October to 15 April15 October to 15 April15 October to 15 April
cooling°C
h/day
days/year
26
depending on the space request
26
depending on the space request
26
depending on the space request
26
depending on the space request
Subsequently, a comparison of energy demand from measured data and the values calculated with Simulations A, B and C has been carried out and discussed in the following section.

6. Results and Discussion

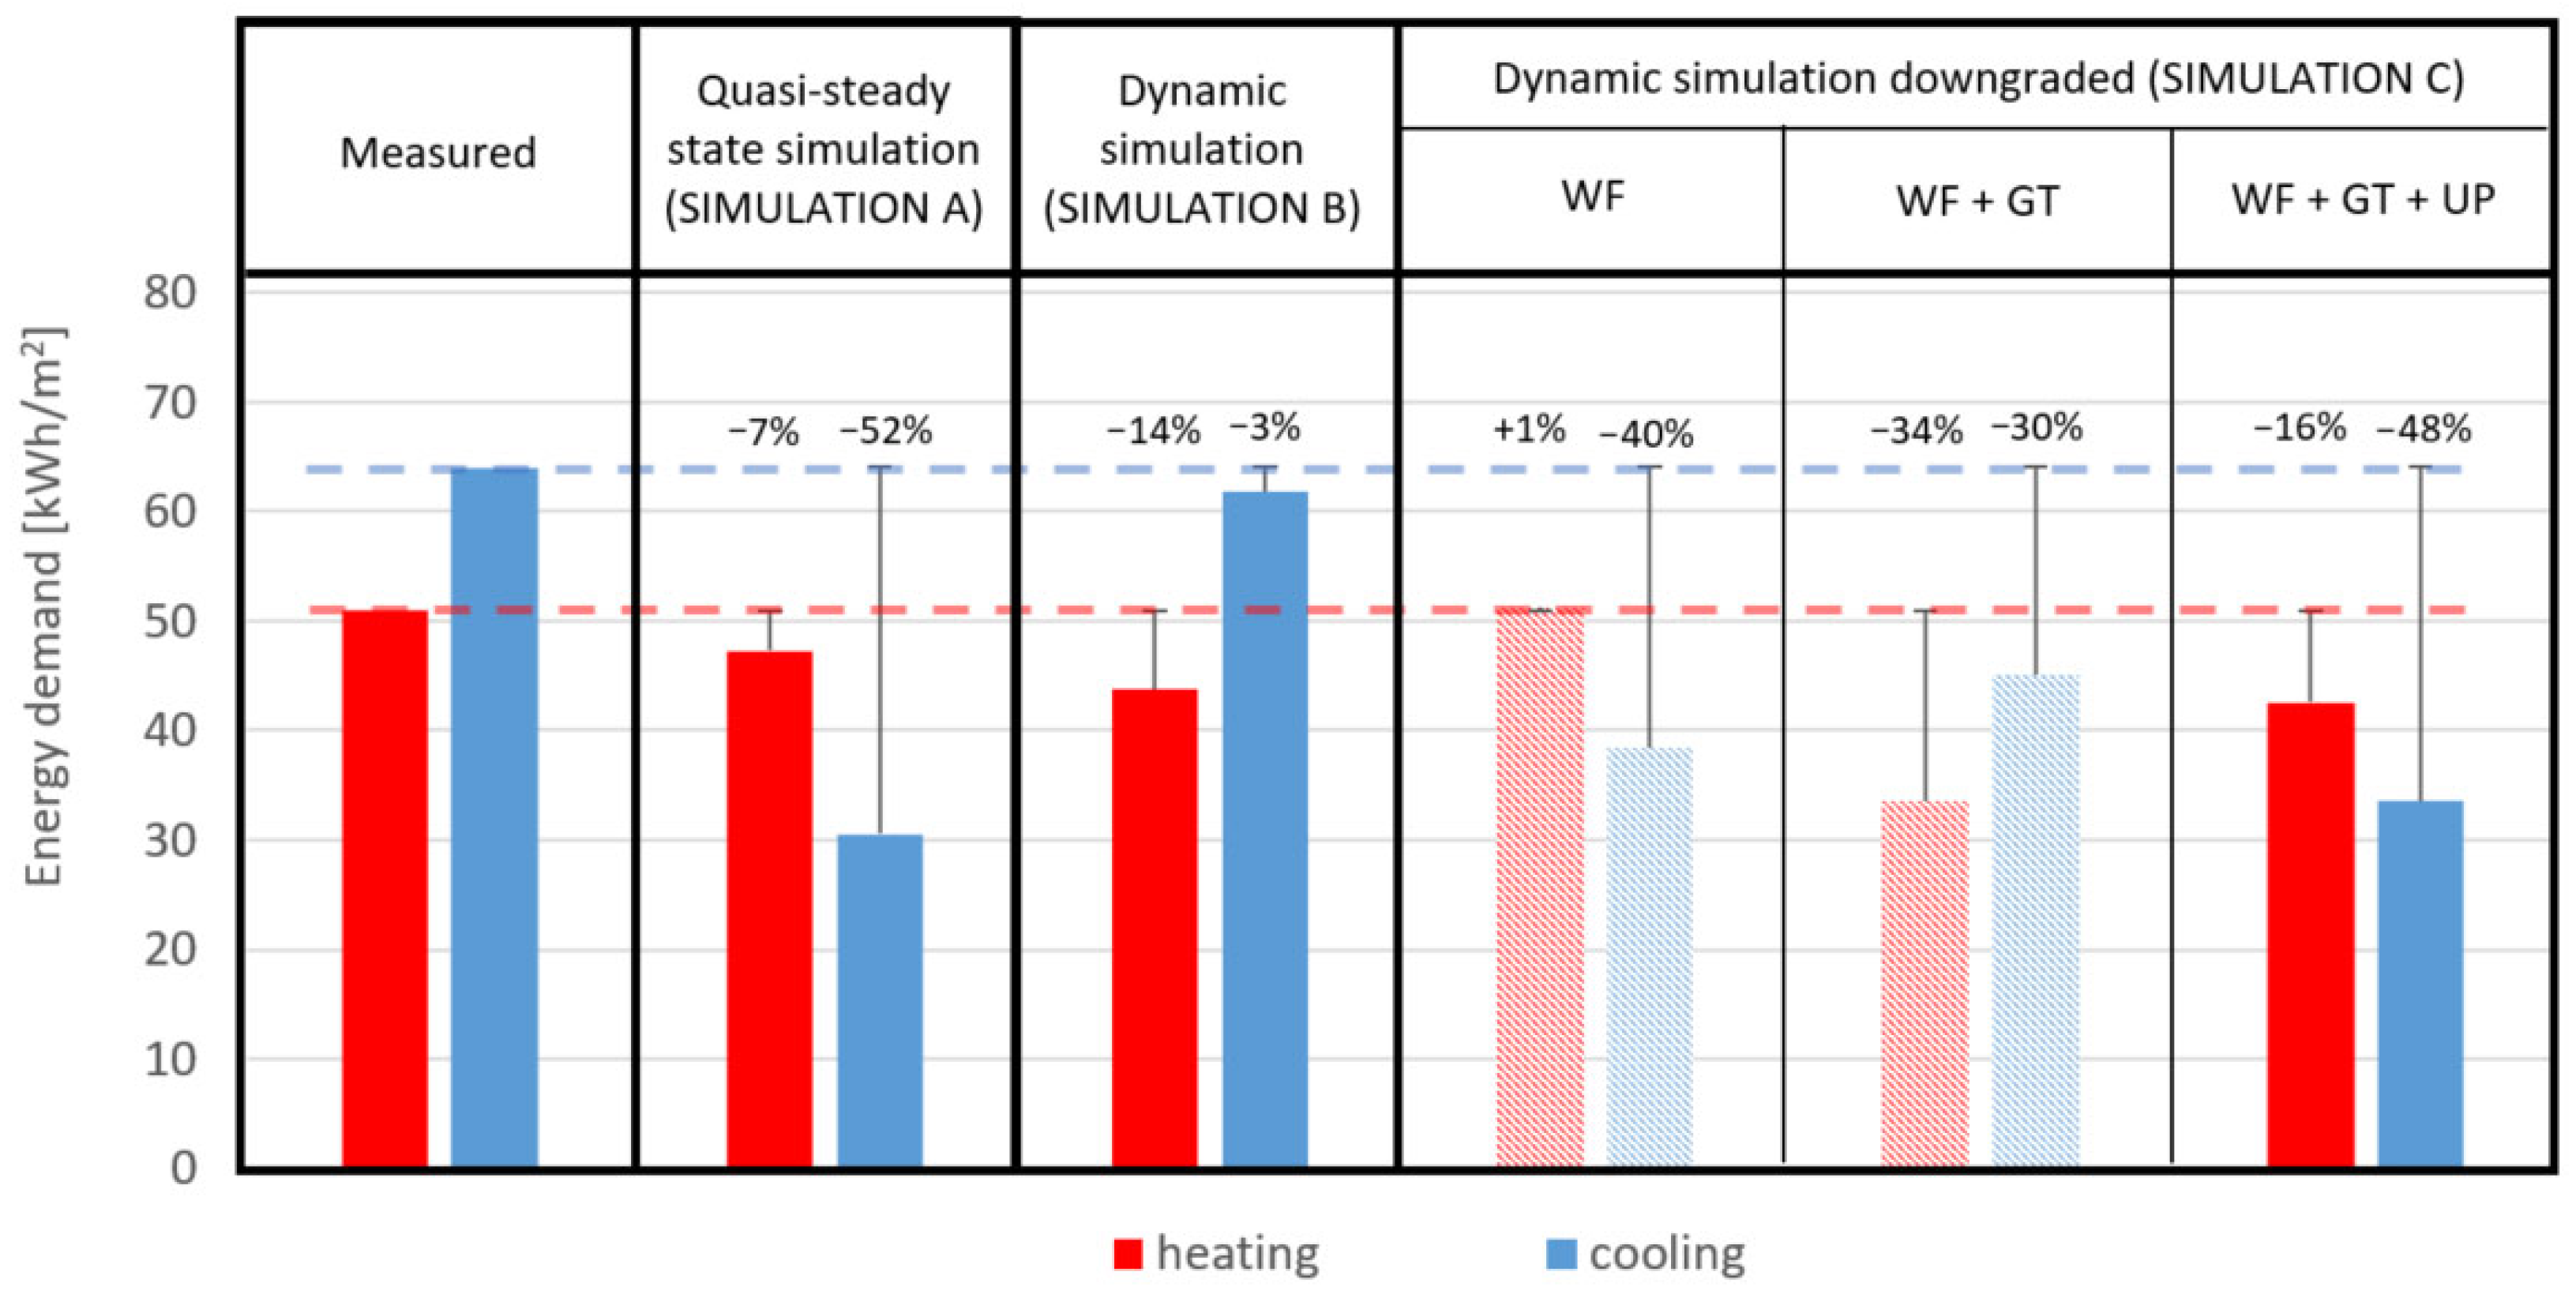
The simulation results were compared with the actual energy demand, as reported in Figure 6. It must be noted that the results of Simulation C are split to highlight the influence of the change of different parameters, as described above in Section 5.
In particular, as already reported, the energy demand for heating and cooling determined according to monitored data is about 50.9 kWh/m2 and 64.0 kWh/m2, which corresponds to a primary energy for heating and cooling equal to about 91.6 kWhEP/m2 and 90.3 kWhEP/m2, respectively. The primary energy factors adopted for the conversion from consumption to primary energy are, respectively, equal to 1.05 and 2.42 for natural gas and grid electricity [55].
Regarding simulation results, the quasi-steady state (Simulation A) provides 47.3 kWh/m2 for heating and 30.6 kWh/m2 for cooling energy demand, with an underestimation compared to measured data of about 7% and 52%, respectively. The dynamic simulation with tailored boundary conditions (Simulation B) instead provides 43.7 kWh/m2 for heating and 61.8 kWh/m2 for cooling, with an underestimation of about 14% and 3%, respectively.
As is noticeable, in the quasi-steady state simulation, there is a considerable underestimation of cooling energy demand. Hereafter, some of the factors that could contribute to this discrepancy in compliance with the literature review are discussed.
One of the primary causes of this discrepancy can be attributed to the average monthly temperatures used in the quasi-steady state simulation. In fact, the average temperatures assumed in the simulation range from 3.5 °C in December to 24.5 °C in July. These conditions do not account for temperature peaks, resulting in an underestimation of energy needs, particularly during the summer period. Indeed, the maximum exterior average temperature is 24.5 °C, while the analysed TMY outdoor temperatures exceeded 30 °C several times during the summer months.
Regarding winter conditions, the estimated HDD of the QSS weather file is 2404, which closely matches the value for the reference year (2006) based on measured data (see Table 3. In contrast, the DS simulation used a weather file (TMY 2000–2009) with a lower HDD value, equal to 2272. This difference may explain why the dynamic state simulation (tailored conditions) predicts lower heating energy consumption compared to the quasi-steady state simulation.
A second contributing factor could be the underestimation of internal loads (due to people, electrical equipment and lighting) compared to the actual building profile. In accordance with the quasi-steady state method specified in the UNI/TS 11300 standard, a constant average value of 6 W/m2 has been assigned. However, this value significantly diverges from the real internal loads estimated through comprehensive energy audits, which reveal 19.7 W/m2 for electrical equipment and lighting, operating for 14 h daily. This disparity in internal load estimations may result in an overestimated heating energy consumption during winter in the quasi-steady state simulation. However, its more significant impact lies in the notable underestimation of cooling energy consumption during summer.
In contrast, the DS simulation shows results closely aligned with measured energy consumption, due to the similarity in the internal loads used in the detailed tailored dynamic state simulation.
Furthermore, the enhanced reliability of the results is due to the adoption of a more detailed heat load profile for occupants, equipment and lighting through the use of an hourly profile. The implementation of a comprehensive load profile is a standard practice in dynamic simulations, allowing for the definition of realistic conditions across all seasons. This profile closely aligns with parameters defined in energy audits, resulting in outcomes that closely correspond to measured data.
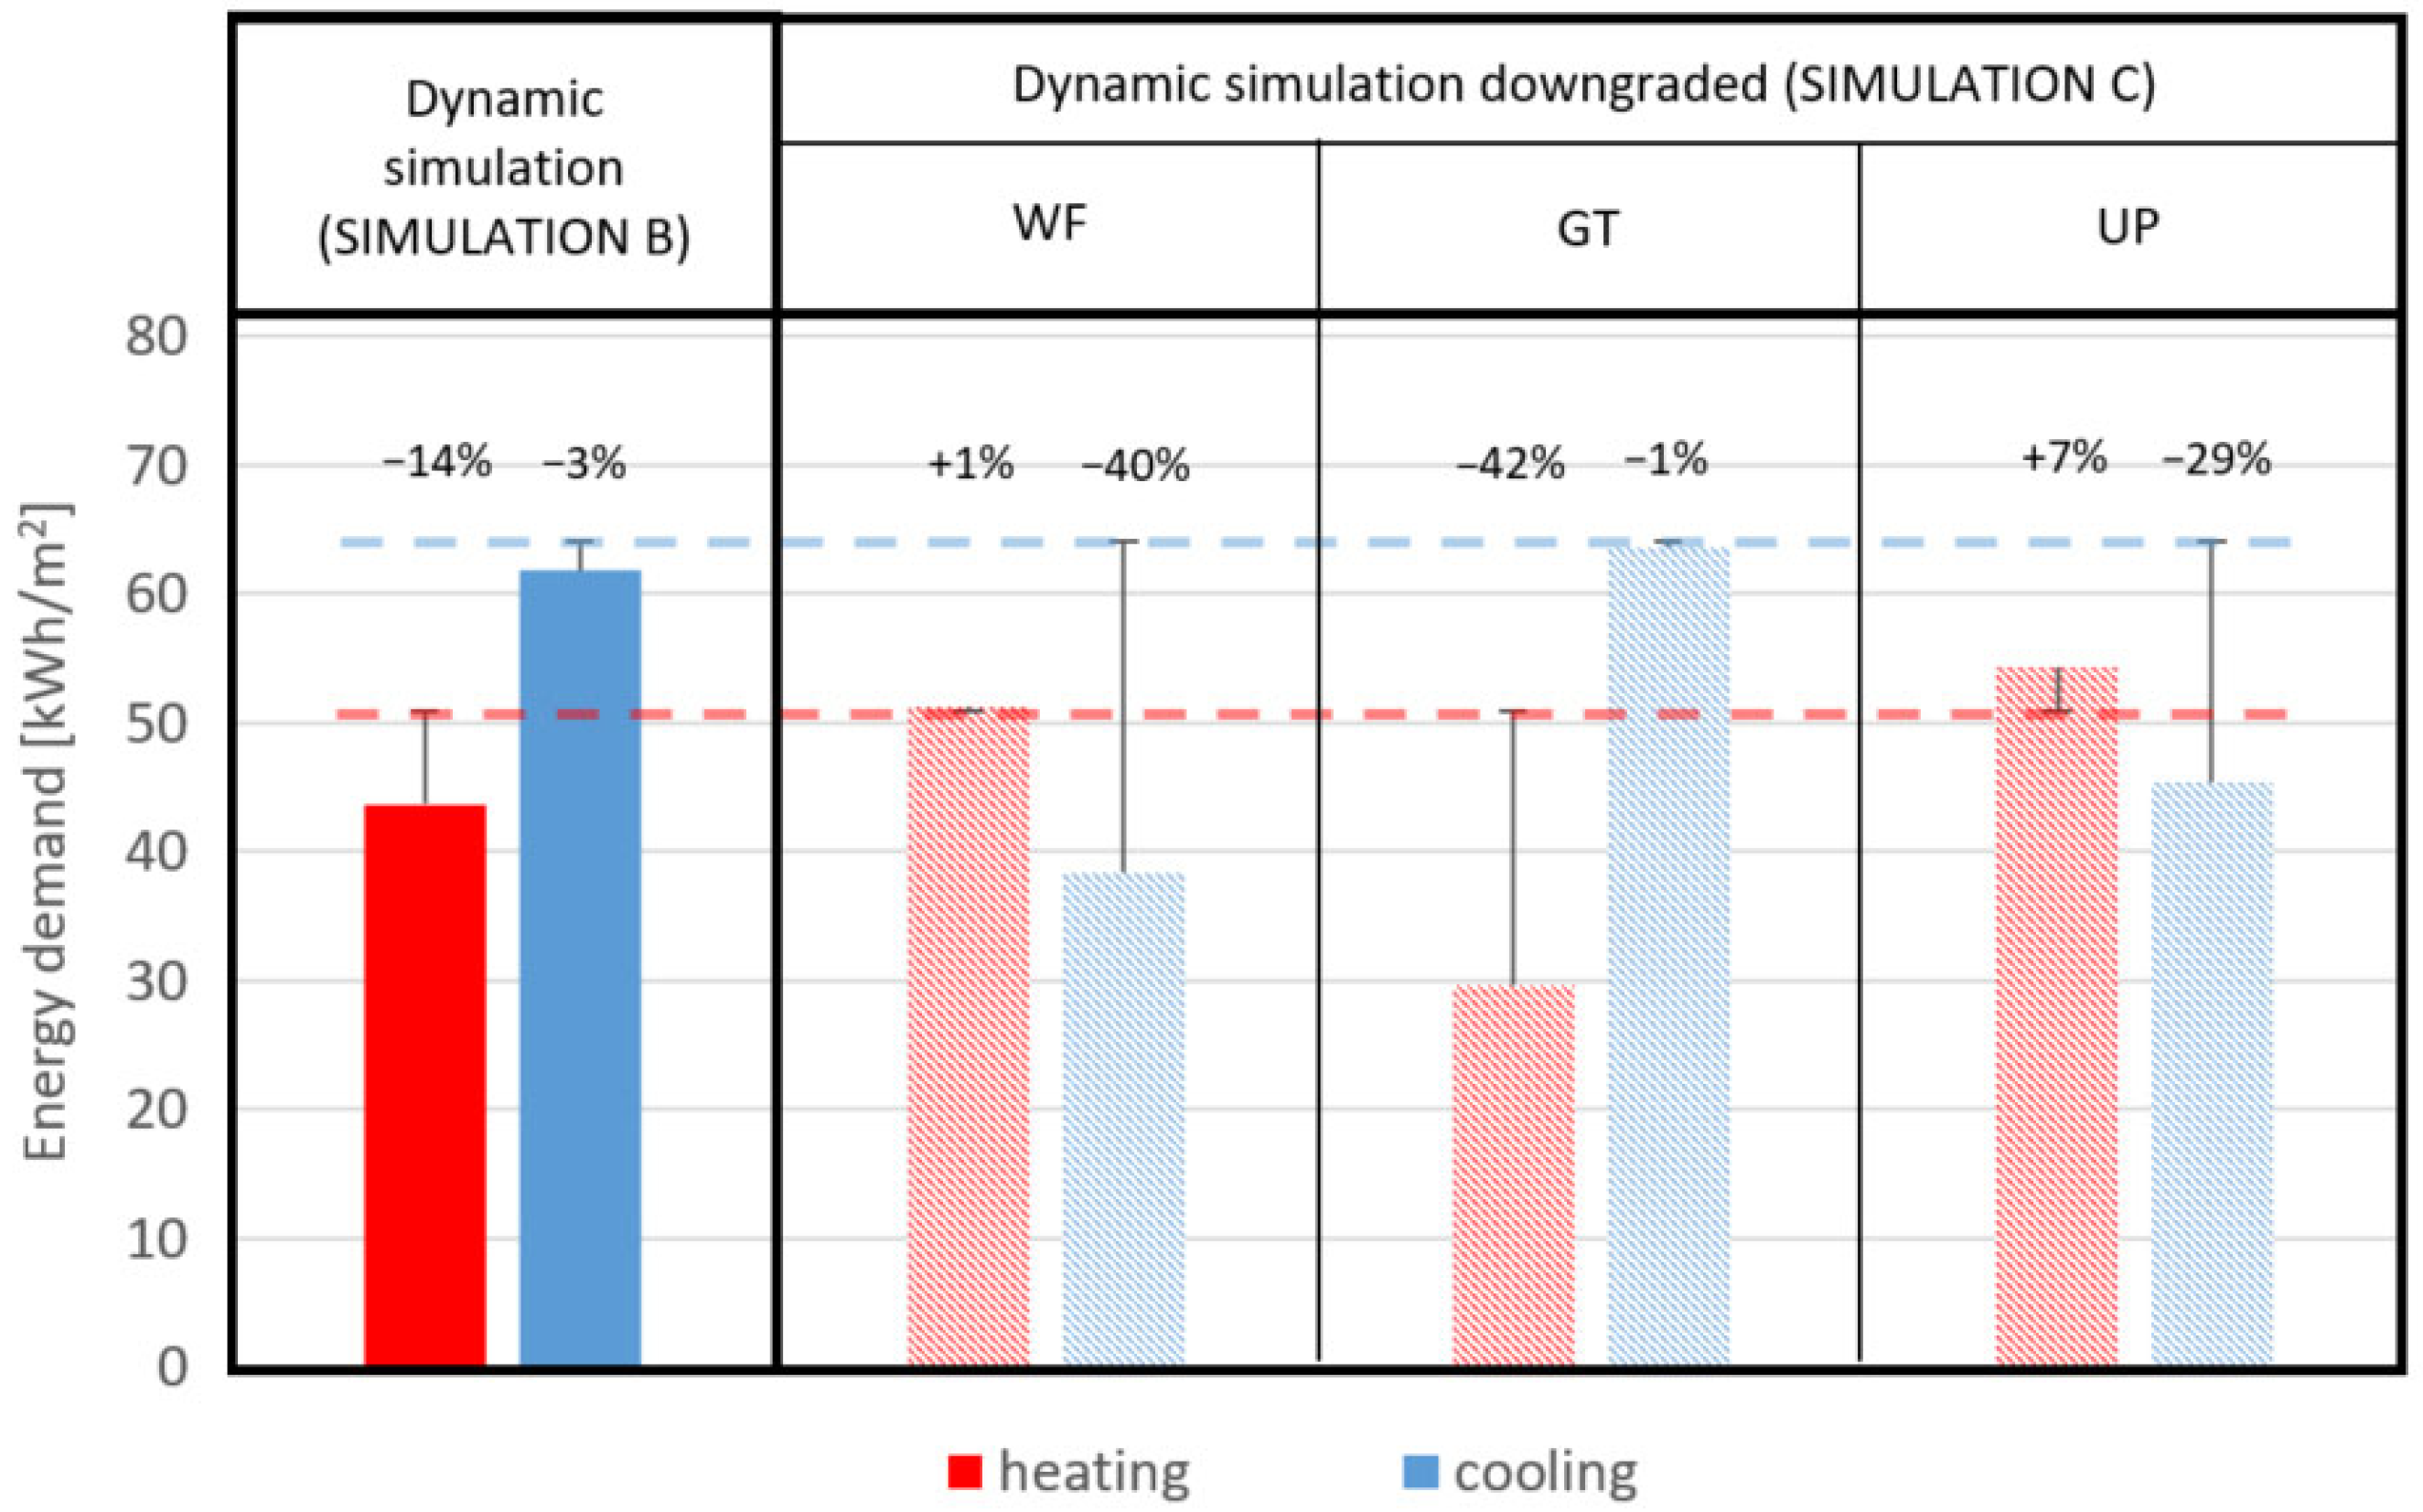
More in detail, results obtained by Simulation C help to better assess the influence of the above-mentioned parameters. In such respect, the results of Simulation C in Figure 6 show the downgraded simulations with the progressive effects of the different parameters analysed, while Figure 7 shows the results of the influence of each parameter taken individually. It must be noted that in both figures, the estimated error % is calculated with respect to the measured data.
As evidenced by the results of Simulation C (WF), the adoption of average monthly conditions instead of hourly data has a sensitive effect on heating (15% difference) due to the higher HDD of the average monthly temperatures adopted by the energy standard with respect to the TMY weather file used in DS simulation and given that QSS models do not consider the temperature peaks. Furthermore, it significantly impacts cooling, leading to a 37% underestimation compared to the initial simulation.
The simulation carried out with the adjusted ground temperatures, Simulation C (GT), shows a notable reduction in heating energy demand by approximately 28% and a corresponding 2% increase in cooling energy demand compared to the initial simulation. This outcome is primarily attributed to the adoption of higher derived ground-temperatures than those employed in the DS model. Such a discrepancy can be especially pronounced in buildings with a considerable floor area exposed to the ground, as observed in the case study.
Finally, one of the parameters that significantly influences the simulation results and therefore carries significant weight in estimating the energy consumption of buildings is the user profile of internal loads Simulation C (UP). The adoption of a constant and average value throughout the year provides an overestimation of heating by 21% (due to lower internal gains) and an underestimation of cooling by 26%. This outcome is particularly evident in buildings where internal loads may consistently deviate from the standard values adopted in energy certification, as typically occurs in office buildings.
The simulation that combined the average monthly weather file and the adjusted ground temperatures (WF + GT) shows a notable reduction both in heating and cooling energy demand by approximately 34% and 30%, respectively, compared to the measured data, for the same reasons discussed above.
Finally, incorporating the weather file featuring average temperatures, adjusted ground temperatures and average internal loads constant for the whole year, Simulation C (WT + GT + UP), led to a 16% and 48% underestimation in energy demand for heating and cooling, respectively, compared to the measured data.
It is important to highlight that the outcomes derived from the DS model, incorporating the conditions usually adopted in the QSS method, show heating and cooling values consistent with those estimated from the effective quasi-steady state simulation for the EPC (Simulation A).
This underscores the notion that when a dynamic simulation model is run with simplified and poorly detailed input data, it produces results that closely align with the quasi-steady state ones. It should be noted that the remaining discrepancy between the results of the two models can be correlated to the different calculation methodologies employed by the two software, with specific reference to the dynamic behavior of the building due to its thermal mass. In the specific analysed case, since the building has a large, glazed fraction and walls with low thermal inertia, the influence of its thermal mass, especially on the cooling performance is limited and thus the error introduced by the quasi-steady state method is not so relevant.
It must be noted that the results obtained for the Milan case study may be compared with similar buildings in the Mediterranean region. In fact, from a comparison of the average and the maximum temperatures presented in Table 3, it can be depicted that average and maximum temperatures in other cities in the Mediterranean area, such as Madrid (Spain) and Athens (Greece), exceed those of Milan. These differences suggest that the potential gap in the QSS simulation for the case of Milan, especially for cooling, could be even more pronounced in warmer cities.
Finally, it must be highlighted that, although the selected case study building is highly representative, as better explained in Section 4, the considerations outlined in this paper are based on the analysis of a single building. Therefore, in order to strengthen the results obtained, it will be necessary to extend the analysis methodology to other buildings in the continuation of the research.

7. Conclusions

The current reliance on QSS simulations in EPC, due to a significant uncertainty and, in particular, to an underestimation of the consumption for cooling in warm climates, allowed a disproportionate spread of buildings characterized by high efficiency class rating, but also high actual consumption.
The future scenario is even worse from a social point of view: since the EU member state will define the new energy consumption thresholds based on EPC values of existing buildings (carried out mainly with QSS procedure) and, contextually, the dynamic energy simulation will be adopted as the main EPC procedure, to reach the new energy requirements will become challenging. This is because the reference basis will be the previous overly optimistic calculations.
This research, hence, emphasizes the shortcomings of the QSS energy certification method and the pivotal need to embrace DS energy calculation techniques to carry out EPC, with a special reference to assessing buildings’ performance in warm climates.
Moreover, considering the obtained outcomes, the following recommendations for carrying out reliable EPC can be outlined:
  • adopting DS simulation makes it possible to account for the mutual interactions between the building, occupants and the external boundary conditions;
  • from the perspective of increasing temperatures due to climate change, there is a preference in the use of dynamic simulations and to update the reference weather file for estimating energy consumption, avoiding the use of weather data that includes too outdated climate datasets;
  • providing more detailed user profiles for appliances, lighting and occupancy, instead of relying on constant average values throughout the year, enables obtaining a more precise estimation of energy demand (and thus energy consumption);
  • the DS method offers superior capabilities in accounting for building envelope properties, such as heat capacity, and their impacts on energy performance. In contrast, the QSS method approximates these effects through utilization factors, resulting in less accurate results;
  • in recent years, the introduction of new standards based on the hourly calculation method has improved the accessibility, transparency and reliability of dynamic simulations by minimizing user input while shifting complexity to standardized procedures and robust software capable of detailed, consistent calculations;
  • although model calibration enhances the accuracy of dynamic simulations, its application within large-scale EPC frameworks is impractical due to excessive data requirements, computational costs and user expertise demands. A more viable approach involves employing dynamic simulations with standardized and tailored boundary conditions and usage profiles, which maintain methodological consistency and realism while ensuring scalability and operational feasibility.
In conclusion, ensuring increasingly accurate results in energy certification is pivotal for effectively assessing the energy consumption and environmental impact of the building sector. The latest EU directive aligns with this goal; however, there is a critical need for Member States to not only embrace but also expedite the integration of dynamic calculation tools and methods into their established national EPC procedures, especially in warm climates. Moreover, it may be necessary to reassess the current minimum energy performance requirements for buildings, which are currently based on the QSS calculation method.

Author Contributions

N.A.: Supervision, Methodology, Review & editing. H.E.H.-C.: Investigation, Modelling, Data analysis, Writing. C.D.P.: Conceptualization, Investigation, Methodology, Writing—review & editing. F.L.: Data curation, Investigation, Writing—original draft preparation. M.B.: Resources, Investigation. R.S.A.: Data curation, Supervision. E.M.: Software, Modelling. C.L.S.B.: Formal analysis, Investigation. All authors have read and agreed to the published version of the manuscript.

Funding

This research received no external funding.

Data Availability Statement

The data presented in this study are available on request from the corresponding author.

Conflicts of Interest

The authors declare no conflicts of interest.

Abbreviations

EPBDEnergy Performance of Buildings Directive
EPCEnergy-Performance Certificate
QSSQuasi-steady state
DSDynamic state
TMYTypical Meteorological Year
U-valueThermal transmittance
UmodU-value modified
SHGCSolar Heat Gain Coefficient
τvVisible Transmittance
ACHAir Changes per Hour
HDDsHeating Degree Days
CDDsCooling Degree Days
NMBENormalized Mean Bias Error
CVRMSECoefficient of Variation of the Root Mean Square Error
ARPAAgenzia Regionale per la Protezione dell’Ambiente
TaverageAverage exterior temperature
TmaxMaximum exterior temperature

References

  1. Berardi, U. A Cross-Country Comparison of the Building Energy Consumptions and Their Trends. Resour. Conserv. Recycl. 2017, 123, 230–241. [Google Scholar] [CrossRef]
  2. European Parliament and the Council of the Union Directive 2023/1791 of the European Parliament and of the Council of 13 September 2023. Off. J. Eur. Union 2023, 231, 1–111. Available online: https://data.europa.eu/eli/dir/2023/1791/oj (accessed on 8 November 2024).
  3. Ballarini, I.; Primo, E.; Corrado, V. On the Limits of the Quasi-Steady-State Method to Predict the Energy Performance of Low-Energy Buildings. Therm. Sci. 2018, 2018, 1117–1127. [Google Scholar] [CrossRef]
  4. Pretelli, M.; Fabbri, K. Historic Indoor Microclimate of the Heritage Buildings, Pretelli, M. ed; Springer: Cham, Swizerland, 2018; ISBN 978-3-319-60341-4. [Google Scholar]
  5. Menezes, A.C.; Cripps, A.; Bouchlaghem, D.; Buswell, R. Predicted vs. Actual Energy Performance of Non-Domestic Buildings: Using Post-Occupancy Evaluation Data to Reduce the Performance Gap. Appl. Energy 2012, 97, 355–364. [Google Scholar] [CrossRef]
  6. De Wilde, P. The Gap between Predicted and Measured Energy Performance of Buildings: A Framework for Investigation. Autom. Constr. 2014, 41, 40–49. [Google Scholar] [CrossRef]
  7. Bruno, R.; Bevilacqua, P.; Arcuri, N. Assessing Cooling Energy Demands with the EN ISO 52016-1 Quasi-Steady Approach in the Mediterranean Area. J. Build. Eng. 2019, 24, 100740. [Google Scholar] [CrossRef]
  8. Domjan, S.; Arkar, C.; Begelj, Ž.; Medved, S. Evolution of All-Glass Nearly Zero Energy Buildings with Respect to the Local Climate and Free-Cooling Techniques. Build. Environ. 2019, 160, 106183. [Google Scholar] [CrossRef]
  9. Corrado, V.; Enrico, F. Il Significato del Fattore di Utilizzazione Nel Calcolo Semplificato del Fabbisogno Termico degli Edifici: Aspetti Teorici e Applicativi; AICARR: Bologna Italy; Torino, Italy; Napoli, Italy, 2008. [Google Scholar]
  10. Van Dijk, D.; Spiekman, M. EN ISO 52016 and 52017: Calculation of the building’s energy needs for heating and cooling, internal temperatures and heating and cooling load. REHVA J. 2016, 53, 27–30. Available online: https://www.rehva.eu/rehva-journal/chapter/en-iso-52016-and-52017-calculation-of-the-buildings-energy-needs-for-heating-and-cooling-internal-temperatures-and-heating-and-cooling-load (accessed on 8 November 2024).
  11. Van Dijk, D. EPB standards: Why choose hourly calculation procedures? REHVA J. 2018, 55, 6–12. Available online: https://www.rehva.eu/rehva-journal/chapter/epb-standards-why-choose-hourly-calculation-procedures (accessed on 8 November 2024).
  12. Zakula, T.; Bagaric, M.; Ferdelji, N.; Milovanovic, B.; Mudrinic, S.; Ritosa, K. Comparison of Dynamic Simulations and the ISO 52016 Standard for the Assessment of Building Energy Performance. Appl. Energy 2019, 254, 113553. [Google Scholar] [CrossRef]
  13. Beccali, M.; Mazzarella, L.; Motta, M. Simplified Models for Building Cooling Energy Requirement; International Building Performance Simulation Association: Rio de Janeiro, Brazil, 2001; Volume 7, pp. 295–302. [Google Scholar]
  14. Kotarela, F.; Kyritsis, A.; Agathokleous, R.; Papanikolaou, N. On the Exploitation of Dynamic Simulations for the Design of Buildings Energy Systems. Energy 2023, 271, 127002. [Google Scholar] [CrossRef]
  15. European Parliament and the Council of the Union. Directive 2002/91/EC of the European Parliament and of the Council of 16 December 2002 on the Energy Performance of Buildings. Off. J. Eur. Union 2002. Available online: http://data.europa.eu/eli/dir/2002/91/oj (accessed on 8 November 2024).
  16. Recast, E. Directive 2010/31/EU of the European Parliament and of the Council of 19 May 2010 on the Energy Performance of Buildings (Recast). Off. J. Eur. Union 2010, 18, 2010. Available online: http://data.europa.eu/eli/dir/2010/31/oj (accessed on 8 November 2024).
  17. Jenkins, D.P.; Sayfikar, M.; Gomez, A.; Fueyo, N. A Comparative Study of Energy Performance Certificates across Europe. Buildings 2024, 14, 2906. [Google Scholar] [CrossRef]
  18. Akkurt, G.G.; Aste, N.; Borderon, J.; Buda, A.; Calzolari, M.; Chung, D.; Costanzo, V.; Del Pero, C.; Evola, G.; Huerto-Cardenas, H.E.; et al. Dynamic Thermal and Hygrometric Simulation of Historical Buildings: Critical Factors and Possible Solutions. Renew. Sustain. Energy Rev. 2020, 118, 109509. [Google Scholar] [CrossRef]
  19. Macdonald, I.A. Quantifying the Effects of Uncertainty in Building Simulation. Ph.D. Thesis, University of Strathclyde, Glasgow, UK, 2002. [Google Scholar]
  20. van Dronkelaar, C.; Dowson, M.; Spataru, C.; Mumovic, D. A Review of the Regulatory Energy Performance Gap and Its Underlying Causes in Non-Domestic Buildings. Front. Mech. Eng. 2016, 1, 17. [Google Scholar] [CrossRef]
  21. Costantino, A.; Ballarini, I.; Fabrizio, E. Comparison Between Simplified and Detailed Methods for the Calculation of Heating and Cooling Energy Needs of Livestock Housing: A Case Study; Free University of Bozen Bolzano: Bolzano, Italy, 2017. [Google Scholar]
  22. Van der Veken, J.; Saelens, D.; Verbeeck, G.; Hens, H. Comparison of Steady-State and Dynamic Building Energy Simulation Programs; ACEEE: Washington, DC, USA, 2004. [Google Scholar]
  23. Corrado, V.; Ballarini, I.; Dirutigliano, D.; Murano, G. Verification of the New Ministerial Decree about Minimum Requirements for the Energy Performance of Buildings. Energy Procedia 2016, 101, 200–207. [Google Scholar] [CrossRef]
  24. Zhang, S.; Liu, Y.; Yang, L.; Liu, J.; Hou, L.Q. Applicability of Different Energy Efficiency Calculation Methods of Residential Buildings in Severe Cold and Cold Zones of China. IOP Conf. Ser. Earth Environ. Sci. 2019, 238, 012029. [Google Scholar] [CrossRef]
  25. Evangelisti, L.; Battista, G.; Guattari, C.; Basilicata, C.; de Vollaro, R.L. Analysis of Two Models for Evaluating the Energy Performance of Different Buildings. Sustainability 2014, 6, 5311–5321. [Google Scholar] [CrossRef]
  26. Schito, E.; Testi, D.; Conti, P.; Grassi, W. Validation of Seas, a Quasi-Steady-State Tool for Building Energy Audits. Energy Procedia 2015, 78, 3192–3197. [Google Scholar] [CrossRef]
  27. Pernigotto, G.; Gasparella, A. Quasi-Steady State and Dynamic Simulation Approaches for the Calculation of Building Energy Needs: Part 2 Thermal Gains; Bozen-Bolzano University Press: Bolzano, Italy, 2013. [Google Scholar]
  28. EN ISO 13790:2008; Energy Performance of Buildings—Calculation of Energy Use for Space Heating and Cooling. European Committee for Standardization (CEN): Brussels, Belgium, 2008.
  29. Zangheri, P.; Armani, R.; Pietrobon, M.; Pagliano, L.; Fernandez Boneta, M.; Müller, A. Heating and Cooling Energy Demand and Loads for Building Types in Different Countries of the EU; D2.3. of WP2 of the Entranze Project; Polytechnic University of Turin: Turin, Italy, 2014; p. 86. [Google Scholar]
  30. Calise, F.; Cappiello, F.L.; Cimmino, L.; Vicidomini, M. Semi-Stationary and Dynamic Simulation Models: A Critical Comparison of the Energy and Economic Savings for the Energy Refurbishment of Buildings. Energy 2024, 300, 131618. [Google Scholar] [CrossRef]
  31. Magrini, A.; Lentini, G. NZEB Analyses by Means of Dynamic Simulation and Experimental Monitoring in Mediterranean Climate. Energies 2020, 13, 4784. [Google Scholar] [CrossRef]
  32. Bruno, R.; Arcuri, N.; Carpino, C. Cooling Energy Needs in Non-Residential Buildings Located in Mediterranean Area: A Revision of the Quasi-Steady Procedure; Universita Della Calabria: Arcavacata, Italy, 2017. [Google Scholar]
  33. Bruno, R.; Arcuri, N.; Carpino, C. Study of Innovative Solutions of the Building Envelope for Passive Houses in Mediterranean Areas. Energy Procedia 2017, 140, 80–92. [Google Scholar] [CrossRef]
  34. Detommaso, M.; Evola, G.; Gagliano, A.; Marletta, L.; Nocera, F. Thermal Performance of Innovative Building Envelope Systems in Mediterranean Climate. In Proceedings of the Building Simulation Applications BSA 2017; Bolzano University Press: Bolzano, Italy, 2017; pp. 77–85. [Google Scholar]
  35. Corrado, V.; Ballarini, I.; Paduos, S.; Primo, E. The Energy Performance Assessment of nZEBs: Limitations of the Quasi-Steady State Approach; Aalborg University: Copenhagen, Denmark, 2016. [Google Scholar]
  36. Fokaides, P.A.; Maxoulis, C.N.; Panayiotou, G.P.; Neophytou, M.K.-A.; Kalogirou, S.A. Comparison between Measured and Calculated Energy Performance for Dwellings in a Summer Dominant Environment. Energy Build. 2011, 43, 3099–3105. [Google Scholar] [CrossRef]
  37. Zavrl, M.Š.; Stegnar, G. Comparison of Simulated and Monitored Energy Performance Indicators on NZEB Case Study Eco Silver House. Procedia Environ. Sci. 2017, 38, 52–59. [Google Scholar] [CrossRef]
  38. Kang, Y.; Ma, N.; Bunster, V.; Chang, V.W.; Zhou, J. Optimizing the Passive House Planning Package Simulation Tool: A Bottom-up Dynamic Approach to Reduce Building Performance Gap. Energy Build. 2022, 276, 112512. [Google Scholar] [CrossRef]
  39. Kokogiannakis, G.; Strachan, P.; Clarke, J. Comparison of the Simplified Methods of the ISO 13790 Standard and Detailed Modelling Programs in a Regulatory Context. J. Build. Perform. Simul. 2008, 1, 209–219. [Google Scholar] [CrossRef]
  40. Wauman, B.; Breesch, H.; Saelens, D. Evaluation of the Accuracy of the Implementation of Dynamic Effects in the Quasi Steady-State Calculation Method for School Buildings. Energy Build. 2013, 65, 173–184. [Google Scholar] [CrossRef]
  41. Jradi, M. Dynamic Energy Modelling as an Alternative Approach for Reducing Performance Gaps in Retrofitted Schools in Denmark. Appl. Sci. 2020, 10, 7862. [Google Scholar] [CrossRef]
  42. Simanic, B.; Nordquist, B.; Bagge, H.; Johansson, D. Predicted and Measured User-Related Energy Usage in Newly Built Low-Energy Schools in Sweden. J. Build. Eng. 2020, 29, 101142. [Google Scholar] [CrossRef]
  43. Palladino, D.; Iatauro, D.; Signoretti, P. Application of Hourly Dynamic Method for nZEB Buildings in Italian Context: Analysis and Comparisons in National Calculation Procedure Framework. E3S Web Conf. 2021, 312, 02006. [Google Scholar] [CrossRef]
  44. Oliveti, G.; Arcuri, N.; Bruno, R.; De Simone, M. An Accurate Calculation Model of Solar Heat Gain through Glazed Surfaces. Energy Build. 2011, 43, 269–274. [Google Scholar] [CrossRef]
  45. EN ISO 52016-1:2017; Energy Performance of Buildings-Energy Needs for Heating and Cooling, Internal Temperatures and Sensible and Latent Heat Loads. European Committee for Standardization (CEN): Brussels, Belgium, 2017.
  46. Van Dijk, D.; Spiekman, M.; Orshoven, D.V.; Plokker, W. Subset of EPB Standards on the Energy Use and the Thermal Performance of Buildings and Building Elements. REHVA J. 2015, 52, 6–16. Available online: https://www.rehva.eu/fileadmin/REHVA_Journal/REHVA_Journal_2015/RJ_issue_1/P.06/06-16_RJ1501_WEB.pdf (accessed on 8 November 2024).
  47. Van Dijk, D.; Spiekman, M.; Van Oeffelen, L.H. EPB Standard EN ISO 52016_Calculation of the Building’s Energy Needs for Heating and Cooling, Internal Temperatures and Heating and Cooling Load. REHVA J. 2016, 53, 18–22. Available online: https://www.rehva.eu/rehva-journal/chapter/epb-standard-en-iso-52016-calculation-of-the-buildings-energy-needs-for-heating-and-cooling-internal-temperatures-and-heating-and-cooling-load (accessed on 8 November 2024).
  48. Aste, N.; Del Pero, C. Energy Retrofit of Commercial Buildings: Case Study and Applied Methodology. Energy Effic. 2013, 6, 407–423. [Google Scholar] [CrossRef]
  49. Aste, N.; Adhikari, R.S.; Del Pero, C.; Tagliabue, L.C. Energy Retrofit of Commercial Buildings: A Case Study on ERGO Building. In Proceedings of the 7th International Conference on Energy Efficiency in Commercial Buildings IEECB’12, Frankfurt, Germany, 18–19 April 2012; pp. 392–401. [Google Scholar]
  50. EN 15603:2008; Energy Performance of Buildings—Overall Energy Use and Definition of Energy Ratings. iTeh Standards: Brussels, Belgium, 2008.
  51. Huerto-Cardenas, H.E. Validation of Historical Buildings Energy Models: A Method Based on Microclimatic Control Parameters. Ph.D. Thesis. Politecnico di Milano, Milan, Italy, 2020. [Google Scholar]
  52. Hargan, M.R. ANSI/ASHRAE ASHRAE Guideline 14-2002 Measurement of Energy and Demand Savings; ASHRAE: Peachtree Corners, GA, USA, 2002; p. 170. [Google Scholar]
  53. UNI/TS 11300-1:2014; Prestazioni Energetiche degli Edifici—Parte 1: Determinazione DEL Fabbisogno di Energia Termica Dell’edificio per la Climatizzazione Estiva Ed Invernale. Ente Nazionale Italiano di Unificazione (UNI): Milano, Italy, 2014.
  54. Logical Soft Termolog. Available online: https://logical.it/software-termotecnica (accessed on 8 November 2024).
  55. Regione Lombardia, D.d.u.o. 18 Dicembre 2019—n.18546. Aggiornamento Delle Disposizioni per l’efficienza Energetica degli Edifici Approvate Con Decreto n. 2456 Del 8 Marzo 2017. 2019. Available online: https://www.anit.it/wp-content/uploads/2020/01/Decreto_18546-2019.pdf (accessed on 8 November 2024).
  56. U.S. Department of Energy. EnergyPlus Essentials 2021. Available online: https://www.energy.gov/eere/buildings/articles/energyplus (accessed on 8 November 2024).
  57. UNI 10339:1995; Impianti Aeraulici al Fini Di Benessere. Generalità, Classificazione e Requisiti. Regole per La Richiesta d’offerta, l’offerta, l’ordine e la Fornitura. Ente Nazionale Italiano di Unificazione (UNI): Milano, Italy, 1995.
  58. ARPA. Richiesta Dati Misurati; ARPA Lombardia: Milano, Italy, 2020. [Google Scholar]
Figure 1. European countries which adopt a QSS or DS method for the implementation of the EPC.
Energies 18 06015 g001
Figure 2. Plan and street view of the case study building in the pre-retrofit status.
Energies 18 06015 g002
Figure 3. Comparison of monthly heating and cooling energy demand measured and simulated.
Energies 18 06015 g003
Figure 4. View of the quasi-steady state energy model.
Energies 18 06015 g004
Figure 5. View of the EnergyPlus dynamic energy model.
Energies 18 06015 g005
Figure 6. Space heating and cooling energy demand comparison between measured data, quasi-steady state (Simulation A), dynamic state (Simulation B) and dynamic state downgraded with the combined effects of the parameters (Simulation C). The light colors of the bars in Simulation C indicate the intermediate steps. The estimated error % for each step is calculated with respect to the measured data.
Energies 18 06015 g006
Figure 7. Space heating and cooling energy demand comparison between the dynamic state (Simulation B) and the dynamic state downgraded, with the individual effect of each parameter analysed (the light colors of the bars in Simulation C). The estimated error % for each step is calculated with respect to the measured data.
Energies 18 06015 g007
Table 1. Average and maximum temperatures for different European capitals.
CountryCapital CityTmax [°C]Taverage [°C]Latitude
AustriaVien31.4021.8248.19
BelgiumBrüssel30.5017.8350.90
BulgariaSofia37.0020.4342.69
CroatiaZagreb37.1022.5945.81
Republic of CyprusNicosia42.1030.1335.15
Czech RepublicPrague31.8019.0950.06
DenmarkKopenaghen27.9016.9355.61
EstoniaTallin27.0016.1159.41
FinlandHelsinki23.6017.4760.17
FranceParis32.3020.0348.82
GermanyBerlin28.5017.8952.46
GreeceAthen38.0027.6137.91
HungaryBudapest30.0020.0947.51
IrelandDublin21.9015.2653.42
ItalyRome31.8024.2441.90
LatviaRiga27.4017.1656.95
LithuaniaVilnius29.7017.2154.63
MaltaLa Valletta27.6025.7935.85
NetherlandsAmsterdam26.1017.7952.31
PolandWarsaw33.2016.6052.25
PortugalLisbon34.7022.8838.71
RomaniaBucharest37.0023.9844.41
SlovakiaBratislava33.6022.0748.16
SloveniaLjubjana35.5020.7746.06
SpainMadrid39.2025.5940.45
SwedenStockholm29.5018.2059.35
Table 2. Main parameters of the selected case study in the pre-retrofit status.
Main Building Information
average U-value Light walls|Massive walls|Roof0.47 W/m2K|0.94 W/m2K|0.48 W/m2K
glazing U-value|SHGC|τv1.8 W/m2K|0.35|0.28
thermal heat load for electrical equipment|artificial lighting10.3 W/m2|9.4 W/m2
Air Changes per Hour (ACH)0.9 h−1 for 14 h per day
Technical System Efficiencies
summer periodwinter period
emission average efficiency0.850.85
control average efficiency0.900.90
distribution average efficiency0.950.95
generation average efficiency/COP2.530.85
global average seasonal efficiency/COP1.840.62
Disclaimer/Publisher’s Note: The statements, opinions and data contained in all publications are solely those of the individual author(s) and contributor(s) and not of MDPI and/or the editor(s). MDPI and/or the editor(s) disclaim responsibility for any injury to people or property resulting from any ideas, methods, instructions or products referred to in the content.