Abstract
The global transition toward sustainable mobility and renewable energy integration demands intelligent energy management frameworks capable of coupling electric mobility, distributed generation, and energy storage. This study presents a comprehensive evaluation of the SIMA Project (Sistema Inteligente Multimodal da Amazônia), an innovative mobility pilot implemented at the Federal University of Pará, Brazil. The SIMA consists of the monitoring building, photovoltaic systems, lithium-based energy storage systems, and electric transportation modes (including urban and intercity buses, as well as a solar-powered catamaran), all interconnected within a microgrid. Field monitoring, data processing, and simulation analyses were conducted to assess energy performance, consumption patterns, and the operational feasibility of these electric systems under Amazonian conditions. The results indicate that the PV systems supply most of the SIMA’s demand, with the laboratory building accounting for 70% of total consumption and electric vehicles for 30%. Simulated full operation scenarios reveal the potential for near net-zero energy balance when energy management strategies are applied to generation, storage and charging. The findings demonstrate the technical viability of integrated mobility–energy systems in tropical contexts and provide practical insights for future low-carbon transport infrastructures in isolated or city-scale networks.
1. Introduction
1.1. General Considerations
Decarbonizing the transportation sector has become a global priority, aligning directly with the Sustainable Development Goals (SDGs) and the targets of the Paris Agreement [1]. Over the past few years, rapid advances in Photovoltaic (PV) generation and Energy Storage System (ESS) technologies, as well as electric mobility, have opened up new pathways towards cleaner, more distributed, and more resilient energy systems. However, these transitions pose operational and regulatory challenges, especially in developing regions with weak or geographically isolated electric infrastructures [2].
Integrating PV generation with Electric Vehicles (EVs) and ESS is an increasingly relevant strategy for overcoming these challenges. ESS mitigates intermittency, enhances grid flexibility, and enables advanced energy management schemes, such as Vehicle-to-Grid (V2G) and Vehicle-to-Building (V2B) [2,3,4]. Recent studies have emphasized the synergies between behind-the-meter storage, distributed PV, and intelligent charging coordination to improve system reliability and reduce peak demand [5,6].
In the Amazon region, where access to reliable energy is limited and diesel generation is prevalent, sustainable mobility projects are critical for promoting social inclusion and regional development. In this context, the SIMA project was conceived as a multidisciplinary initiative combining renewable energy, electric mobility, and real-time monitoring to create a replicable framework for low-carbon transportation in tropical and remote regions. This article evaluates the energy performance, operational behavior, and scalability potential of the SIMA project by integrating technical measurements and simulation-based scenarios.
Recent literature shows sustained progress in integrating distributed Energy ReSources (DERs) and flexibility mechanisms, both from technical and regulatory perspectives. The report [7] compiles international experiences and regulatory frameworks in which demand-side flexibility and distributed resources have begun to provide ancillary services to power systems. This document highlights the importance of establishing clear standards for load aggregation and flexibility product definitions, as well as transparent settlement and pricing mechanisms linking wholesale and local markets, particularly in systems with high renewable penetration. In parallel, ref. [8] introduces a hierarchical model that combines robust optimization and reinforcement learning to coordinate the operation of multiple microgrids under uncertainty. Its distributionally robust optimization framework mitigates risk by considering deviations in probabilistic distributions of renewable generation and demand. This represents a methodological evolution beyond traditional stochastic programming, as it explicitly incorporates risk aversion and uncertainty in system-level coordination. The study in [9] further expands on medium-term energy planning under variable renewable conditions, proposing a deep reinforcement learning–based framework that links storage decisions with short-term operational profitability in cascaded hydropower systems.
Similarly, the research on [10] presents a comprehensive review of peer-to-peer (P2P) energy trading and local energy market architectures, emphasizing the transition from purely economic exchanges to hybrid frameworks that embed physical network constraints and congestion management. Building on this, authors in [11] propose decentralized trading algorithms that respect network flow and voltage limits, bridging the long-standing gap between economic optimality and electrical feasibility in distributed market coordination. The paper in [12] further advances this integration through its Floating Real-Time Pricing (FRTP) mechanism, which couples local energy markets (LEMs) with Day-Ahead Market (DAM) signals. By enabling price arbitrage and shared storage coordination through a Stackelberg game formulation, this study illustrates a “price-aware PV” concept in which PV and ESS dynamically adapt power flows based on market signals, reducing operational costs and carbon emissions.
In the domain of electric mobility, ref. [13] offers a thorough overview of battery storage technologies and Battery Management Systems (BMS), including cell balancing, thermal safety, and degradation models. This technical synthesis provides a foundation for understanding the operational limits that must be respected when integrating EV fleets within microgrids, especially under bidirectional strategies such as V2G or V2B.
Complementarily, the study in [14] develops a cooperative Nash bargaining framework to coordinate energy exchanges between an Integrated Energy System (IES) and EV charging stations, demonstrating that collaborative strategies among heterogeneous agents can simultaneously increase Electric Vehicle Charge Station (EVCS) profits and reduce system-wide costs. Such cooperative, privacy-preserving negotiation schemes are particularly suitable for university or industrial campuses where multiple consumer and generation units coexist.
From a planning perspective, ref. [15] extends uncertainty modeling through stochastic programming with Conditional Value-at-Risk (CVaR) measures and explicit carbon constraints. The study underscores the importance of internalizing risk aversion and environmental objectives into long-term expansion planning and P2P energy trading, employing distributed coordination methods such as ADMM to manage intertemporal cooperation between microgrids. Finally, ref. [16] combines Monte Carlo demand scenario generation with a bi-level optimization model that designs optimal Time-of-Use (TOU) tariffs at the upper level and evaluates network hosting capacity via Optimal Power Flow (OPF) with SOCP relaxation at the lower level. This approach demonstrates that dynamic, price-based tariffs can substantially improve daily minimum voltage stability and reduce operational costs—reinforcing the value of price-aware management in intelligent microgrids.
Collectively, these studies demonstrate the main approaches to modeling uncertainty, ranging from robust and distributionally robust optimization to stochastic programming with explicit risk measures, alongside strategies for integrating price responsiveness into microgrid operation. Robust formulations emphasize resilience to extreme deviations, while stochastic models capture probabilistic variations in demand, generation, and prices. Price-aware frameworks, such as those in [12,16], further show that dynamic price adaptation can lower operating costs, mitigate emissions, and increase renewable hosting capacity.
Within this context, the present work offers a complementary and applied contribution by transferring these methodological advances to a real-world operating environment. Unlike previous studies based solely on simulations, this paper integrates empirical measurements of photovoltaic generation, energy storage, and electric mobility within an actual university microgrid, applying price-aware control and coordinated management to optimize energy flow and asset utilization. The study demonstrates, through operational data, how integrated PV–ESS–EV management can approach near net-zero balance under real climatic and operational conditions, providing empirical validation for theoretical frameworks on hierarchical control, robust optimization, and dynamic price coordination. Furthermore, this work highlights the potential to extrapolate such strategies to other campuses or isolated communities across Latin America, contributing to the design of intelligent microgrids that combine economic efficiency, operational flexibility, and environmental sustainability.
1.2. Motivations and Contributions
Despite global advances in renewable integration, most electric mobility initiatives still depend on fossil-based energy or centralized grids. In Brazil’s northern region, this dependency is intensified by logistical constraints and the absence of coordinated infrastructure for electric transport. The SIMA project aims to overcome these barriers by demonstrating a technically and economically viable solution for cities and community-scale transport based on local renewable resources.
The specific motivations of this study include:
- The need to assess the operational feasibility of electric mobility under tropical and isolated conditions;
- The opportunity to utilize PV generation and battery energy storage to supply autonomous electric transport systems;
- The importance of developing monitoring and data acquisition tools that integrate heterogeneous devices and platforms;
- The potential to create replicable models for sustainable transport in the Amazon and other developing regions.
Accordingly, the main objectives of this article are:
- To characterize the energy architecture of the SIMA project, encompassing PV generation, energy storage systems, and electric mobility modes.
- To analyze operational and simulated data from electric buses, the CEAMAZON hybrid microgrid, and the electric catamaran.
- To evaluate and compare the real and estimated energy balances of the system, identifying periods of surplus or deficit and quantifying the overall renewable contribution.
- To assess the project’s overall energy efficiency and propose strategies, such as PV capacity expansion or module upgrading, to ensure long-term sustainability.
2. State of the Art
2.1. Energy Storage Systems
The rapid growth of PV systems around the world has brought significant challenges to the stability and flexibility of electrical systems, especially since it is an intermittent and non-dispatchable energy source. In this scenario, ESS are emerging as strategic solutions to mitigate generation fluctuations, maximize self-consumption, ensure continuity of supply, and enable coupling with new forms of consumption, such as electric vehicles [17].
The global adoption of storage systems, primarily those employing lithium-ion batteries, has demonstrated robust growth. For instance, China witnessed a 55% surge in its installed capacity in 2023, reaching approximately 23 GW. The United States, the second-largest market, exceeded 8 GW in the same year, with growth concentrated in large renewable power plants and grid support projects. In the European Union, the most notable development was the proliferation of “behind the meter” storage, which constituted approximately 90% of newly installed systems, particularly in Germany and Italy. This phenomenon can be attributed to the confluence of high energy prices and government incentives, such as subsidies, exemptions, and financing, which have encouraged the integration of solar generation and domestic storage [17,18].
In addition to addressing the intermittent nature of renewable generation, the global drive towards electric mobility has led to a significant demand for robust storage solutions to increase the range and energy efficiency of vehicles [7,8,9]. The synergy between photovoltaic systems and batteries is regarded as one of the most promising in the context of smart buildings, microgrids, and vehicle charging infrastructure [19].
This expansion has been further driven by the continuous decline in battery costs, particularly lithium-ion systems, whose price per kilowatt-hour decreased by more than 85% between 2010 and 2022, according to [20]. The resulting economic feasibility has stimulated the adoption of battery systems across residential, commercial, and industrial sectors, enabling new forms of consumer participation in the power system as prosumers.
From an operational perspective, ESS and EV-related applications can be implemented under different configurations:
- Centralized systems, where control is exercised by system operators, utilities, or independent aggregators;
- Plant-integrated systems, coupled with generation units to smooth production profiles and regulate power injection;
- Behind-the-meter systems, located close to the load and directly managed by end users within the distributed generation domain.
As illustrated in Figure 1, the potential applications of ESS span a wide range, including backup supply, increased self-consumption, peak demand reduction, and energy arbitrage.
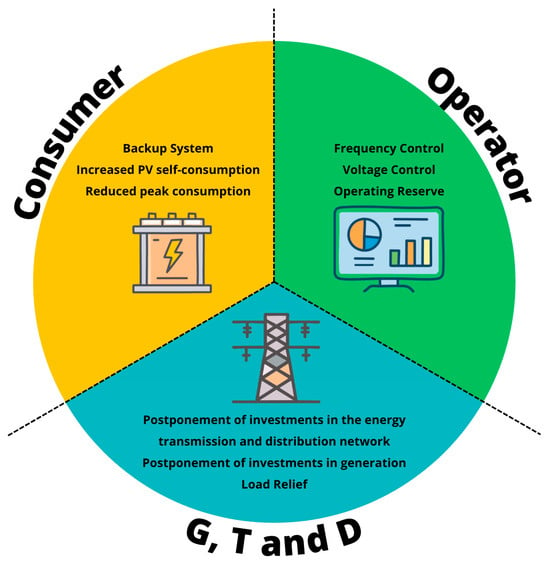
Figure 1.
Applications for energy storage systems.
The present study focuses on the behind-the-meter configuration, in which the storage system operates directly with the local PV generator and the facility’s electrical loads. This architecture is particularly relevant for:
- Ensuring continuity of supply during grid outages;
- Optimizing the utilization of locally generated solar energy;
- Reducing peak demand and associated tariff costs; and
- Providing operational flexibility in energy use throughout the day.
In the context of the Amazon region, where isolated infrastructure and seasonal solar generation are prevalent, storage systems that operate behind the meter are of particular importance. These systems must be autonomous and resilient to meet the unique needs of the region. Within the scope of the SIMA Project, the practical implementation of these applications is demonstrated in electric vehicles, charging stations, and hybrid microgrids, integrating renewable energy, sustainable mobility, and smart management.
2.2. Behind-the-Meter Storage System
Given the temporal variability inherent to renewable sources, particularly solar and wind energy, the utilization of behind-the-meter storage systems is emerging as a pivotal technical solution to ensure the reliability of local energy supply [21]. This configuration enables direct coupling between the generator and the load, thereby circumventing the need for exclusive reliance on the public grid and conferring greater autonomy upon consumers.
The following benefits have been observed in this modality:
- The ability to maintain supply during power outages is imperative.
- The objective is to optimize the self-consumption of photovoltaic energy, with the subsequent storage of surplus energy for subsequent use.
- A decline in demand was observed during peak tariff hours.
The potential for energy arbitrage, defined as the utilization of stored energy during periods of elevated cost, has been a subject of considerable research [19].
Despite the technical and economic advantages, the implementation of this solution is predominantly observed in countries with a high degree of distributed photovoltaic generation and public stimulus policies. In 2023, global installed behind-the-meter storage capacity exceeded 15 GW, with a forecast to double by 2030 [17]. This growth has been driven by regulatory incentives (subsidies, tariff discounts, tax credits), high volatility of electricity prices and growing adoption of solar systems in residential and commercial buildings [17].
Several studies have demonstrated that behind-the-meter storage systems have a pivotal role in the decarbonization of the building sector and in the development of electric vehicle charging infrastructure [22,23]. Hybrid systems that integrate solar generation, storage, and bidirectional charging (V2G) have been proposed as viable solutions to reduce grid overload, improve local energy efficiency, and extend the autonomy of facilities.
In the Brazilian context, particularly in the Legal Amazon, the adoption of behind-the-meter storage systems is of particular strategic importance. The isolated nature of many communities, in conjunction with logistical challenges and the unreliability of local fossil fuel sources (e.g., diesel), renders these systems optimal for ensuring energy resilience, reducing emissions, and promoting socioeconomic inclusion.
2.3. Storage Systems in Electric Vehicles
The selection of the most suitable storage technology is contingent upon the specific requirements of each application, including but not limited to energy density, recharge time, depth of discharge, operational safety, service life, and cost per cycle [18,19]. In the context of distributed generation, where there is strong penetration of PV systems, storage solutions must be optimized to interact efficiently with solar intermittency and end-user load profiles.
The most widely used technologies include lithium-ion, sodium-ion, solid-state, and lithium-sulfur batteries, each with technical advantages and limitations.
Lithium Iron Phosphate (LFP) batteries have demonstrated notable advantages in the distributed generation market, characterized by their extended service life, thermal safety, and cost-effectiveness. These characteristics render them particularly well-suited for behind-the-meter applications and integration with electric vehicles, especially in markets characterized by high temperatures or demanding operating environments [24].
At the same time, emerging technologies such as solid-state and lithium-sulfur batteries are receiving significant attention in research centers and companies in the sector. These technologies are promising higher energy density, intrinsic safety, and reduced environmental impacts. Nevertheless, these technologies continue to encounter substantial technical and economic impediments to large-scale commercialization.
The progressive adoption of less critical materials, such as sodium, is also gaining relevance in light of the environmental and geopolitical pressures associated with the mining of metals such as cobalt and lithium. Sodium-ion batteries hold considerable promise for stationary storage systems, despite their comparatively lower energy density and their present status as nascent industrial development.
Consequently, the prevailing circumstances indicate a technological coexistence between established solutions (LFP, NCM) and emerging alternatives (sodium, solid state). The onus falls upon the technical designer to assess the optimal compromise between performance, cost, and the specific operational requirements of the application.
In the context of this study, the storage system under analysis is a modular lithium-ion type, employing a BYD B-Box 13.8 battery, connected to a hybrid inverter, and coupled to a photovoltaic system with monitoring and programmable operating logic.
2.4. Electric Vehicles
The global energy transition has brought profound transformations to the transportation sector, particularly through the progressive replacement of internal combustion engine vehicles with EVs. Beyond constituting a technological revolution, this shift reflects a multidimensional response to environmental, economic, and energy challenges that are driving governments and industries to adopt cleaner, smarter, and more efficient mobility solutions [17,25].
China stands as the primary driver of this transformation. In 2021, the country tripled its electric vehicle (EV) sales compared to the previous year, reaching approximately 3.3 million units. By 2023, this figure had surged to 8.1 million, consolidating China’s leadership in the global EV market. The European Union and the United States have also recorded significant progress. Figure 2 illustrates the evolution of global EV sales, highlighting the growing share of electric vehicles in total automobile sales.
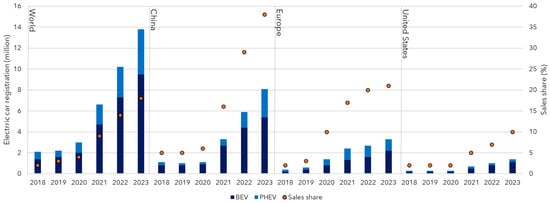
Figure 2.
Global Electric Vehicle Sales. Source: [17].
In Brazil, although progress has occurred at a more moderate pace, the figures are also encouraging. According to the Brazilian Electric Vehicle Association (ABVE), electric vehicle sales increased by 88% in the first four months of 2024 compared to the same period in 2023 [26]. This trend has encouraged consumers to adopt distributed generation models to supply their vehicles with renewable energy, particularly solar photovoltaic power, thereby contributing to the decentralization of the electric sector.
However, the widespread adoption of EVs also poses substantial challenges to the power infrastructure. One of the main issues is the increase in energy demand during specific periods, which may cause load peaks, grid overloading, and the need for reinforcement of urban electrical infrastructure. On the other hand, with intelligent charging management, this demand can be efficiently distributed throughout the day, including through the use of time-differentiated tariffs, thereby reducing stress on the power system [27,28].
Another relevant aspect is the potential of electric vehicles to operate as active elements within the energy system through Vehicle-to-Grid (V2G) technologies. In this configuration, vehicles can not only consume energy but also supply it back to the grid, acting as distributed storage units. This bidirectional capability creates opportunities for balancing intermittent renewable generation and enhances the overall resilience of the power system [29].
In addition, electric mobility represents a key vector for reducing global emissions. In 2019, the transportation sector accounted for approximately 8.4 GtCO2e, corresponding to 17.5% of total global greenhouse gas emissions [30]. The replacement of conventional vehicle fleets with electric vehicles powered by renewable sources can therefore play a central role in achieving the decarbonization targets established under the Paris Agreement.
Finally, it is essential to highlight that charging infrastructure constitutes a critical component of this ecosystem. Figure 3 shows the number of public charging stations available worldwide. The expansion of these facilities is vital to ensure user convenience, confidence, and the technical feasibility of large-scale electric mobility.
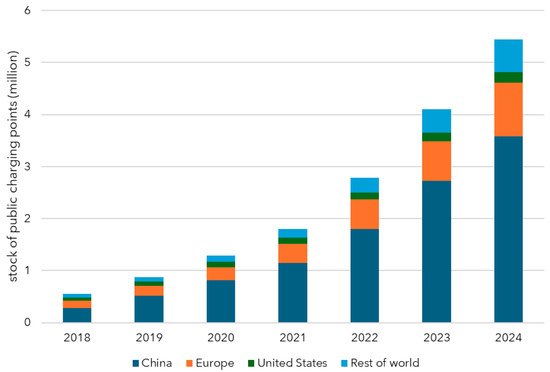
Figure 3.
Number of public charging stations worldwide. Source: [5].
2.4.1. Charging Stations
Charging infrastructure is an essential element for the consolidation of electric mobility, acting as the link between the energy matrix and the growing demand for EVs. The diversity of vehicle models, usage profiles, and technical specifications requires an infrastructure compatible with different power levels, connectors, and operating standards [31,32].
Charging stations are classified according to their charging power levels, which directly influence both the recharging time and the connection profiles. In this work, the classification into Levels 1, 2 and 3 follows the SAE J1772 standard [33], widely used in North American literature. The main categories are described below:
- Level 1: Slow charging up to 2 kW, typically with 120 V AC outlets; full charge in 8–14 h.
- Level 2: Intermediate charging between 208 and 240 V AC and up to 20 kW; full charge in 4–8 h. This level is suitable for both residential and public charging.
- Level 3: Fast charging using DC at 400 V or higher, with power above 60 kW; 80% charge in 15–30 min.
It is important to note that international standards IEC 61851 and IEC 62196 define four charging modes (Modes 1 to 4), which differ slightly from the SAE classification. In these standards, Modes 1–3 refer to AC charging with increasing levels of control and safety, while Mode 4 corresponds to DC fast charging.
The diversity of charging connectors reflects ongoing regional and international standardization efforts, as well as technical requirements related to safety, efficiency, and compatibility. In Brazil, ANEEL Normative Resolution No. 1000 reinforces the need for interoperability between vehicle models and charging infrastructure, promoting electrical safety and user protection [34].
In this context, it is essential that the expansion of electric mobility takes place in coordination with the modernization of the power grid, the integration of energy storage systems, and the intelligent management of charging processes, topics that are further explored in the following sections.
2.4.2. Charging Management
The management of electric vehicle (EV) charging is one of the strategic pillars for ensuring the efficiency and sustainability of electric mobility. As the number of EVs connected to the grid increases, challenges arise related to concentrated demand, the available electrical infrastructure, and the costs associated with peak-hour consumption. In this context, smart charging systems become essential to mitigate grid impacts and economically optimize energy utilization [35,36].
Charging during peak hours, for instance, tends to be more costly both for users and for the power system as a whole. Time-of-use (TOU) and seasonal tariff models have been implemented to encourage the shifting of charging demand to off-peak periods, when the grid is less loaded [19]. In addition, public charging stations may adopt their own pricing schemes based on dwell time, charging power, or subscription-based models.
In this context, different charging management strategies have emerged, combining control algorithms, demand forecasting, energy storage, and integration with renewable sources, particularly solar photovoltaics.
Figure 4 illustrates the operating mode of a hybrid system, in which energy flows from the photovoltaic system to the storage system. Figure 5 shows the charging mode of the storage system through the power flow from the AC grid. In Figure 6, it is possible to observe the charging of the storage system through the combined energy flow from the photovoltaic generation system and the AC power grid. Figure 7 depicts a photovoltaic system injecting electric power into the AC grid, similar to a grid-connected PV configuration, while Figure 8 presents the power injection from the storage system into the grid.
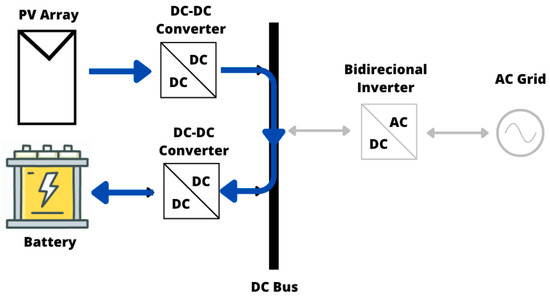
Figure 4.
Operating mode: the ESS is charged via the PV system.
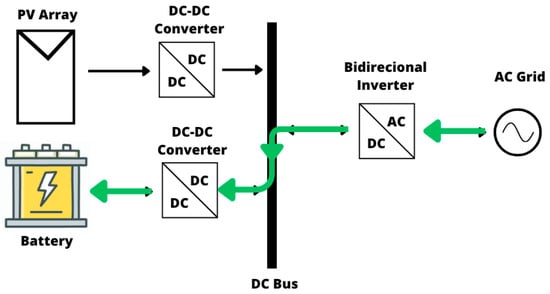
Figure 5.
Operating mode: the ESS is charged via the electrical grid.
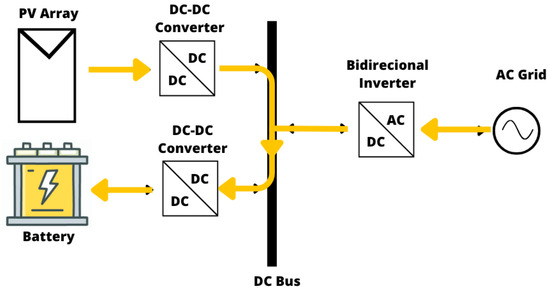
Figure 6.
Operating mode: the ESS is charged using a hybrid charging method.
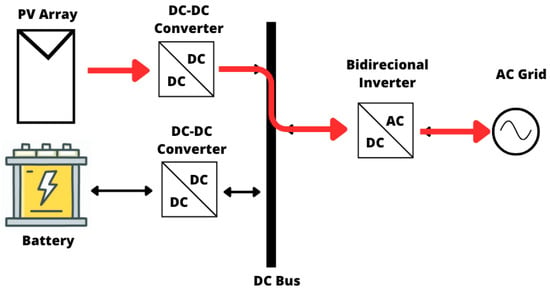
Figure 7.
Operating mode: the electrical grid is supplied with power by the PV system.
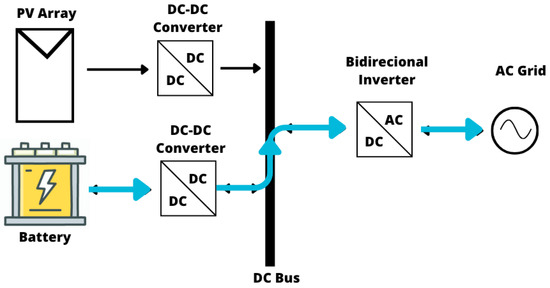
Figure 8.
Operating modes: the electrical grid is supplied with power by the ESS.
To maximize the efficiency of these energy flows, centralized controllers connected to DC–DC and DC–AC converters have been implemented. These operate autonomously based on variables such as:
- the State of Charge (SoC) of the battery;
- the available solar energy;
- the electricity price on the grid;
- the demand profile of the building or facility.
These approaches are aligned with the concepts of smart charging and Vehicle-to-Everything (V2X), which foster the active participation of electric vehicles as demand response resources and as support elements for the power system. Intelligent charging management not only reduces user’s operational costs but also enhances power system flexibility by mitigating peak loads and reducing the need for costly grid expansion [17].
Applied studies have demonstrated the benefits of integrating renewable energy sources, energy storage systems, and charging stations within microgrids.
In [37], a microgrid was modeled incorporating a photovoltaic system, battery storage, diesel generators, and an electric vehicle charging station, achieving a 58% reduction in daily energy costs through the implementation of a centralized controller. In another study conducted in the city of Belém, in the state of Pará (Brazil) [2], researchers analyzed the energy management of a hybrid system consisting of three photovoltaic plants, energy storage, and diesel generation integrated into a building. The optimized operation enabled a reduction in contracted demand and the use of energy credits to offset electric vehicle charging during peak hours.
Other similar studies, such as those presented in [38,39], reinforce the technical and economic potential of hybrid systems with intelligent control for managing vehicle charging and supporting the power grid.
From a regulatory perspective, ANEEL Normative Resolution No. 1000 emphasizes the importance of efficient electricity management and encourages solutions that promote the rational use of energy, such as scheduled and controlled EV charging.
3. Subject of Study: SIMA Project
The SIMA project is an initiative to develop a feasible, energy-efficient, and sustainable solution for multimodal transportation involving electric buses (EBs) and boats, using electric mobility technologies. This initiative involves the implementation of a pilot project for the Guamá Campus of the Federal University of Pará, in Belém, PA, to generate models for subsequent economic use in other locations with similar characteristics.
In this project, the proposed solution involved using commercially available electric buses for urban and highway use, as well as an electric boat with its own photovoltaic power generation system, which was designed and built during the project’s implementation. This system is one of the innovations generated by the project. In addition to this initiative, energy infrastructure was developed to support these modes of transport, as well as the design and implementation of PV generation systems, ESS, and electric charging stations. Furthermore, a real-time monitoring system for the operation of the modes of transport was developed to enable business models based on the operation of this system. This system involves the acquisition of data from the modes of transport, the transmission and processing of this data in the cloud, and the availability of this information to managers.
This issue introduces a new dimension to the initial problem of the modes, which is the acquisition of parameters via sensors to facilitate the efficient operation of the system. The acquisition of data on electrical variables, such as current, voltage, and power at specific points, such as PV generation, energy storage, electric bus batteries, charging stations, and electric boats, was carried out by data collection/acquisition modules developed by the project. These modules were customized for specific applications. Consequently, this data facilitated the development and implementation of management software designed to oversee and monitor the operational processes of the transportation modes. As illustrated in Figure 9, the project implementation methodology is delineated in graphical form.
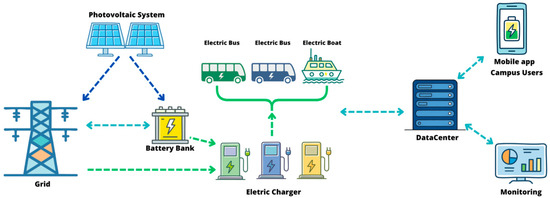
Figure 9.
Graphical description of the SIMA project implementation methodology.
3.1. Mirante Do Rio
The photovoltaic system at the Mirante do Rio building, which is part of the University Federal of Pará (UFPA), has a 59.295 kWp photovoltaic generator, consisting of a total of 177 modules of 335 W, and a 60 kW inverter. The system is grid-connected and linked to the university’s grid via the electrical circuit of the Mirante do Rio building. Figure 10 shows a top view of the photovoltaic system at Mirante do Rio.
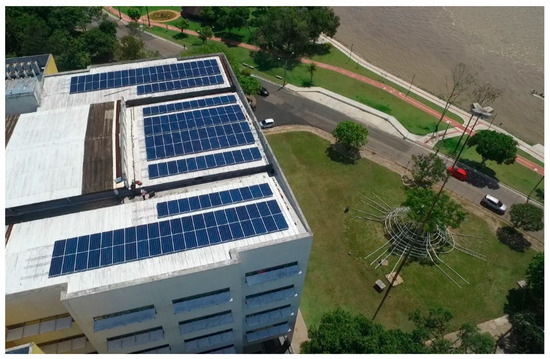
Figure 10.
Top view of the photovoltaic system at Mirante do Rio.
In addition to its role in generating energy for the SIMA project, the Mirante do Rio photovoltaic system contributes to the energy balance of the building, thereby classifying it as an NZEB (Near Zero Energy Building).
3.2. CEAMAZON Hybrid Mini-Grid
The CEAMAZON mini-grid comprises power generation systems, a storage system, an energy management system, and loads. The generation systems primarily comprise photovoltaic technology, with a biodiesel generator serving as a backup in extreme cases. The storage system utilizes lithium-ion battery technology.
The photovoltaic system at the CEAMAZON building is a hybrid system consisting of 234 photovoltaic modules, each with a power output of 335 Wp. The system in question consists of three photovoltaic systems. Two of these systems are connected to the grid; one uses a 50 kW inverter, while the other uses a 15 kW inverter. The third system is connected directly to a charge controller, which operates on direct current (DC). Finally, the management system has a 60 kVA system, which facilitates the interaction of the photovoltaic systems and the battery storage system.
Among the SFCRs, the 50 kW inverter system is connected to the UFPA grid that reaches CEAMAZON, but it is connected outside the mini-grid, and its operation is linked to the operation of the external grid. The 15 kW inverter system, on the other hand, is connected to the internal grid of the mini-grid, so its operation is linked to the operation of the mini-grid. The isolated photovoltaic system is connected to the direct current busbar of the Storage System.
The storage system consists of eight LiFePo batteries connected in parallel, which together provide a total storage capacity of 110.4 kWh and a load capacity of 2160 Ah. The programming of the Storage System follows the manufacturer’s recommendations to maintain a depth of discharge of 80% while respecting the lower charge limit of 20%. If this limit is exceeded, the biodiesel generator can be activated.
This management system consists of six interconnected inverter controllers, two per phase, which control the power flow, whether alternating or direct current systems, managing the isolated system, grid-connected system, storage system, and loads.
3.3. Electric Mobility
SIMA offers three modes of electric transportation that serve the UFPA university community, divided into land and water modes. Among the land modes, one is the BYD (Build Your Dreams, State of São Paulo, Brazil) D9F-20410 Marcopolo Viaggio 1050 Bus (Marcopolo, State of São Paulo, Brazil), Figure 11, with some specifications regarding the engine, steering system, battery, and charging. This bus, operating from Monday to Friday, travels from the UFPA Belém campus to Castanhal, approximately 75 km, in the morning and returns in the afternoon, to meet the transportation demand of the academic community at UFPA.

Figure 11.
Intercity Electric Bus, responsible for transportation between the Guamá and Castanhal campuses of UFPA.
In addition to the highway bus, there is the BYD Low Floor Electric City Bus with D9W 20410 chassis and Marcopolo Torino-E body, Figure 12. This bus, also operating from Monday to Friday, transports the academic community within the UFPA campus, starting at 7 a.m. until 6–7 p.m., approximately 12 h a day.
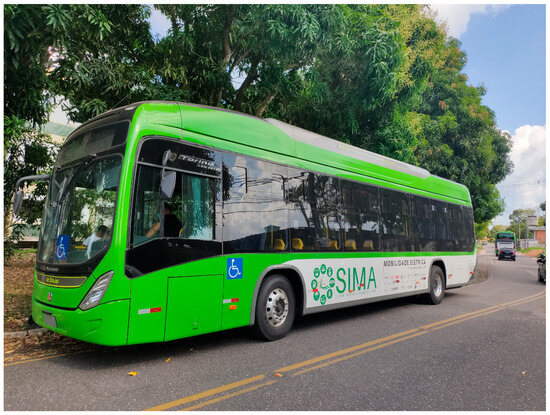
Figure 12.
Urban Electric Bus, responsible for transporting the academic community within the Guamá campus.
For water transport, an electric catamaran-type boat was built to carry up to 20 passengers. The boat will have a photovoltaic system for power generation and can be recharged on land using an electric charging station. Figure 13 shows the electric boat docked at a pier near the city of Belém.
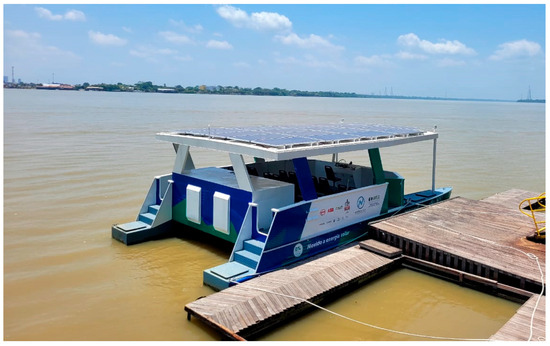
Figure 13.
Electric boat developed by the multimodal project.
The boat is equipped with 20 photovoltaic modules, comprising two arrays of five modules in series for each of the two DC-DC step-down converters. This configuration achieves a maximum generation power of 6.7 kWp, utilizing polycrystalline silicon technology. The converter is connected to a battery bank, which consists of three packs of 24 cells, with a total discharge capacity of 615 Ah.
The propulsion system utilizes two DC-AC inverters to supply power from the battery to two 12 kW squirrel cage motors operating at a nominal voltage of 51 V. Additionally, two AC-DC converters are employed to recharge the batteries when the boat is on land. As illustrated in Figure 14, the electric boat is depicted in a schematic representation.
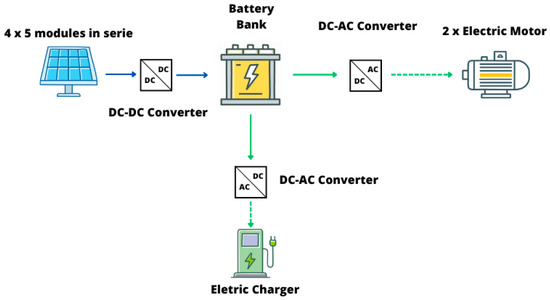
Figure 14.
Simplified schematic of the electric boat project.
4. Methodology
The methodology of this study was structured in such a manner as to integrate field monitoring, data processing based on general monthly values, and computer simulations. The primary objective of this study is to evaluate the energy performance of the SIMA Project systems in actual operation. Additionally, the study will model operating scenarios for the modes currently being implemented.
The energy balance expressions are presented in Equation (1), which mathematically represents the Campus Monthly Energy Balance, while Equation (2) presents the Monthly Net Balance. All values are obtained monthly, expressed by the subscript m.

Table 1.
Network interpretive variables and electricity generation.
: Energy generated by the photovoltaic system in kWh
: Energy consumed by the building in kWh
: Energy consumed by electric buses in kWh.
: Energy consumed by the electric boat in kWh.
: Electricity exchange with the grid in kWh.
: Monthly net balance in kWh.
For the purpose of monitoring, software was developed within the scope of the project. This was necessary because the commercial programs available are mostly proprietary to manufacturers and do not allow the integration of multiple devices from different brands. This limitation renders unified analyses in complex projects unfeasible, necessitating the use of several platforms in parallel. The programs developed by SIMA overcome this challenge by facilitating integrated monitoring of photovoltaic systems, storage systems, electric vehicles, and the monitored building.
In this study, data from electric vehicles (both land and water-based) and an educational building are analyzed, with these considered as the primary electrical loads supplied by the PV and storage systems. Furthermore, a unified program is being developed that will integrate existing monitoring modules, including specific data from electric vehicles, in order to provide strategic information for energy management in electric mobility projects.
Figure 15 shows the methodology of the work organized into linked stages: (i) development of software for integrated monitoring; (ii) data collection from the three types of systems: PV, EVs, and buildings; (iii) processing and filtering; (iv) simulation of the electric boat; (v) calculation and analysis of energy performance indicators.
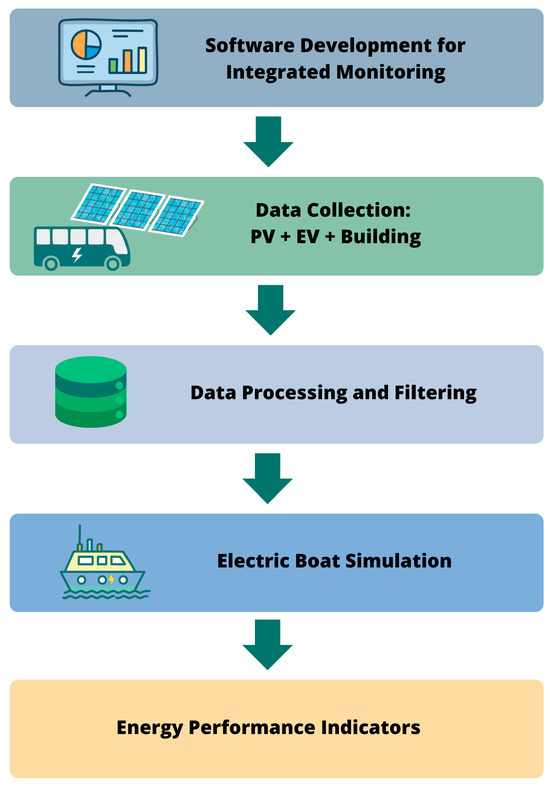
Figure 15.
Flowchart of the study methodology.
4.1. Data Collection and Processing Analysis
The collection of data was conducted in a continuous manner within the photovoltaic systems, CEAMAZON and Mirante do Rio, as well as in electric vehicles that were in operation. The following variables were monitored:
- Photovoltaic Systems: Variables related to voltage, current, and generation power are correlated with environmental data (irradiance and temperature) to analyze performance during dry and rainy periods in the Amazon.
- The following variables were measured in the study: distance traveled, energy consumed per trip, and number of days of operation. The latter two variables were measured in EBs. The monitoring process encompassed the two models in operation on the campus: the highway model (Belém-Castanhal) and the urban model. Equation (3) shows the expression used to calculate the autonomy of buses.
- The present study investigates the energy consumption of the CEAMAZON Building, with a view to integrating this with photovoltaic generation and storage. Furthermore, the study assesses the seasonality of demand associated with the UFPA academic calendar.
The data was collected using acquisition modules developed by the project, which integrate data from equipment from different manufacturers into a single supervision platform.
The data were filtered to remove atypical records, such as measurement errors or periods of operational unavailability. The analysis aimed to identify the following aspects:
- Variations in EBs energy consumption according to the academic calendar and route type;
- The impact of Amazonian seasonality on the performance of the PV systems;
- Energy demand patterns of the CEAMAZON building; and
- Strategies for using the ESS to reduce costs and enhance reliability.
Comparative scenarios were developed between periods of high and low modal utilization, as well as between energy generation and consumption levels.
4.2. Electric Boat Simulation
The electric boat was inaugurated in 2024; however, regular operation has not yet commenced due to the absence of adequate waterway infrastructure at UFPA. According to [40], the boat requires approximately 75.43 kWh for full operation, of which 28.2 kWh are provided by the PV array installed on the catamaran’s upper deck. The system features the following main components:
- Onboard photovoltaic generation;
- A 615 Ah battery bank; and
- A propulsion system composed of two 12 kW squirrel-cage induction motors.
A dynamic simulation was conducted to estimate the boat’s daily energy consumption and operational performance under different load profiles and environmental conditions. These simulations serve as a preliminary benchmark for future validation once real operational data becomes available.
The experimental and simulated analyses were subsequently integrated into the project’s overall energy balance, which considered PV generation, measured consumption from the EBs and the CEAMAZON building, and the estimated demand of the electric boat. This comprehensive assessment enabled:
- Evaluation of the actual energy performance of the transportation modes and the building;
- Estimation and comparison of the boat’s consumption through simulation; and
- Identification of months in which total energy demand could potentially exceed generation.
5. Results and Discussion
5.1. Electric Bus
Electric buses demonstrated significant variations during the data collection period for this study, as evidenced by Figure 16, which illustrates the consumption of electric buses from 2021 to 2024. The observed variation can be attributed to the inconsistent utilization of buses over time. The suspension of bus operations was due to several factors, primarily: frequent scheduled and unscheduled maintenance stops, protracted delays in updating bus circulation documentation, and stops due to flooding of the campus during high tide.
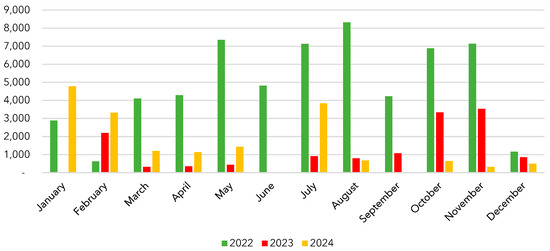
Figure 16.
Monthly energy consumption of electric buses in the SIMA project in kWh.
In this context, it is essential to highlight the importance for managers and technical staff to understand the operational costs, existing gaps in the service provision chain, and the specific characteristics of the routes to be operated, already during the project development phase. The adoption of this technology in mobility projects without a comprehensive prior assessment may lead to frustration or even complete project infeasibility.
In the case of UFPA, the operational interruptions of the EBs had a limited impact on service provision, since the routes were temporarily covered by conventional combustion buses, a flexibility that may not be available in other projects. However, such substitution resulted in higher emission indices and increased energy costs for the university.
Within the SIMA project, the intercity electric bus began operation in January 2022, while the urban model started in March 2022. During that year, both buses consumed approximately 60.9 MWh. In subsequent years, however, the number of operational days dropped drastically by around 70% compared to 2022, with total consumption of 15.8 MWh in 2023 and 19.7 MWh in 2024.
During periods when the urban bus was out of service and only the intercity bus was operational, transport within the Guamá Campus was prioritized. Consequently, the intercity bus was frequently reassigned to perform the internal campus route, leaving the Belém–Castanhal line inactive. This reassignment significantly affected the data analysis, as the operational profile of one vehicle often changed completely to assume the function of the other. No instance was identified in which the urban bus performed the intercity route.
The interruptions and changes in vehicle operation generated considerable data noise. Therefore, for analytical purposes, only consumption records from days meeting predefined reliability criteria were used.
The data-filtering process for the intercity bus considered the full 140 km round trip between the Belém and Castanhal campuses; thus, days with recorded distances below that threshold were excluded. A similar approach was applied to the urban bus. However, since it does not perform a fixed number of laps within the campus, the minimum distance observed for a full day of operation (from 7:00 a.m. to 6:30 p.m.)—approximately 115 km—was adopted as the reference limit.
The number of working days of EBs operation, by period, is shown in Table 2, which summarizes the distribution of operating days for both EBs from 2022 to 2024. The table also provides a simplified representation of the variations in the university’s academic calendar, with four academic periods per year: two intensive semesters and two extensive semesters. In 2024, there was a strike period between 15 April and 29 June, indicated in yellow, during which transportation services were reduced or suspended. In addition, between August and early November 2024, there was an overlap of intensive and extensive periods, as a way to correct the academic calendar in the future, during which both periods coexisted in the academic calendar. It is worth noting that, due to the filtering and exclusion criteria for atypical data that could compromise the analysis, combined with maintenance interruptions, some months did not have any operational days.

Table 2.
Distribution of bus operating days according to the period.
Based on the filtered data, the monthly average daily energy consumption of each EBs was calculated using Equation (4). This equation defines the calculation of the average daily energy consumption, where CMD represents the Average Daily Consumption, corresponds to the number of operational days in the month, and refers to the daily electrical energy consumption on day x ().
Figure 17 and Figure 18 present the average daily consumption values for the years 2022, 2023, and 2024 for the intercity and urban electric buses, respectively. Although the results for both buses are relatively similar, the urban bus exhibited a higher CMD in most months. This difference can be explained by the fact that the intercity bus covers an average distance of approximately 150 km per day, whereas the urban bus travels around 140 km per day. Another factor that may influence efficiency, and consequently energy consumption, is the driving speed, since the urban bus operates at speeds of up to 50 km/h, while the intercity bus reaches about 90 km/h. However, this aspect is not discussed in detail in the present analysis.
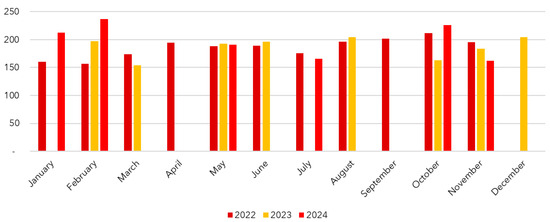
Figure 17.
Average daily electric energy consumption of the intercity bus in kWh.
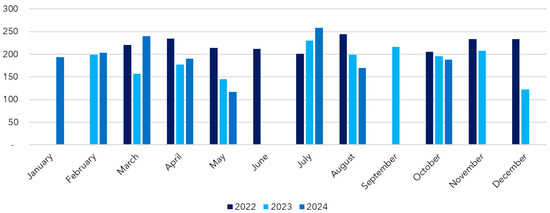
Figure 18.
Average daily electric energy consumption of the urban bus in kWh.
Due to the limited number of operational days of the EBs in 2022 and 2023, the available energy consumption data were insufficient to reliably characterize monthly or seasonal trends. Therefore, to analyze the variation in average daily consumption (CMD) throughout the year, only data from 2022 were considered. Figure 18 presents the variation trend of CMD relative to the annual average and highlights in green the university’s intensive academic periods and in blue the extensive periods for the same year.
From Figure 19, it can be seen that the lowest consumption levels occurred in January, February, and July, which correspond to the intensive academic periods (in green), while the highest values were recorded in March and October, during the extensive periods (in blue). Since all courses are in regular session during the extended period, it is assumed that a larger number of users depend on electric buses. On the other hand, during intensive periods, many programs reduce their academic activities, resulting in lower demand for local transportation. These characteristics emphasize the influence of low- and high-demand academic periods on the energy planning of electric mobility projects.
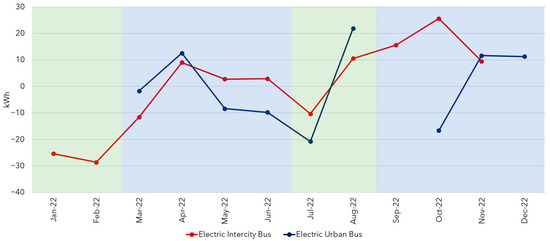
Figure 19.
Variation in the average daily consumption (ADC) relative to the annual mean.
Despite the limited availability of data for developing a full annual consumption plan, an estimated monthly consumption was calculated for each electric bus from 2022 to 2024. The estimation was obtained by multiplying the annual average daily consumption of each bus by the number of operational days in each month, according to the academic calendar. Figure 20 presents both the measured and estimated annual consumption for the EBs.
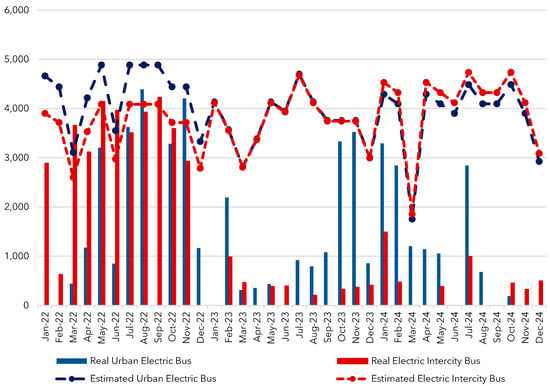
Figure 20.
Historical record of actual and estimated energy consumption of the electric buses.
In addition, by analyzing energy consumption, it is possible to calculate the energy autonomy of buses based on the distance/energy ratio over the study period. Table 3 shows the annual values for 2022, 2023, and 2024, as well as the average for the period.

Table 3.
Efficiency of road buses km/kWh.
For urban bus, the efficiencies observed in 2022–2023 (0.63–0.66 km/kWh) are lower, which is consistent with the urban operating profile: internal traffic, short distances and multiple stops, low average speed, high occupancy, and, consequently, greater use of the air conditioning system. In 2024, there was a jump to 0.84 km/kWh, possibly associated with operational changes, i.e., more fluid routes, fewer stops, and lower occupancy, due to a sudden change in the academic calendar.
For intercity bus, consistently higher values (0.75–0.82 km/kWh) can be observed, consistent with more stable speed profiles and longer distances, resulting in better energy efficiency.
5.2. Electric Boat
In September 2024, the electric boat was inaugurated; however, it is not yet in regular operation because the docking pier infrastructure at UFPA is still under construction. Therefore, for the development of this study, a simulation was carried out for the boat. Based on the developed model, it was possible to estimate the electric boat’s energy consumption for a typical day of operation, even before its full deployment.
According to [40] considering the boat’s operational characteristics, full operation requires a total of 75.43 kWh, of which 28.2 kWh are generated by the photovoltaic system installed on the catamaran’s surface.
The boat operates according to UFPA’s academic calendar, and for 2024, 65 operating days were scheduled following its inauguration. For this period, the estimated total energy drawn from the grid was 18,419.7 kWh. Table 4 presents the distribution of the boat’s operating days per month along with the corresponding estimated electricity consumption, while Figure 21 graphically illustrates the relationship between the operating period and the estimated energy consumption over the last four months of 2024.

Table 4.
Operating days and estimated energy consumption of the electric boat.
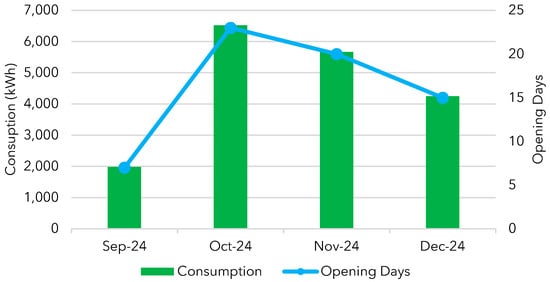
Figure 21.
Estimated energy consumption and operating days of the electric boat.
5.3. SIMA Project
5.3.1. 1º Case: Real Scenario at UFPA
Since the SIMA project began operation, the connected loads have consumed a total of 369.67 MWh, with 70% used to supply the CEAMAZON facilities and the remaining 30% consumed by EVs. When considering the projected EVs consumption within the SIMA system, the expected proportion shifts to 49% for CEAMAZON and 51% for EVs. However, the increased demand from CEAMAZON, the non-operation of the electric boat, and the reduced operating days of the buses contributed to the current distribution.
Figure 22 presents the energy balance of the SIMA project, showing that the actual loads remain well below the total energy generated by the photovoltaic systems. Nevertheless, when the estimated consumption of the EV loads is taken into account, the 2024 scenario no longer exhibits the same level of comfort observed during the project’s initial years. In several months, the estimated monthly consumption exceeds the monthly generation, indicating the need for energy supply from the grid.
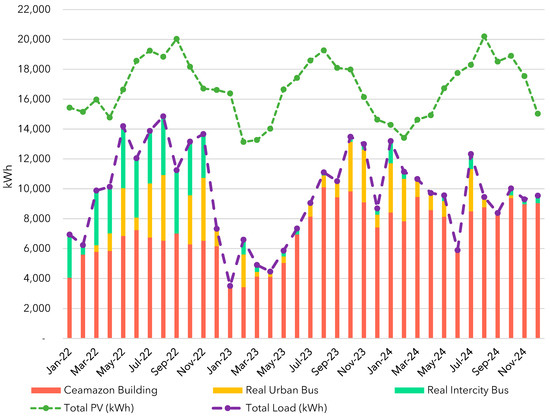
Figure 22.
Energy balance of the SIMA project under the real operating scenario.
Although the estimated scenario for 2024 is less favorable, the total estimated load for the project does not surpass the cumulative energy generation, due to extended periods when generation exceeded consumption, thus creating an energy credit for the system. However, as this remains a projected scenario, it serves as an early warning for the project’s future, when all electric vehicles are expected to reach full operational capacity over consecutive years.
In the energy efficiency analysis of the project, the first case is presented in Figure 23, where it can be observed that the energy generation exceeds the system’s load consumption for all months across all years. All values are positioned above the orange line, which represents the balance point between generation and consumption. Therefore, the farther above this line the values are, the greater the monthly energy surplus.
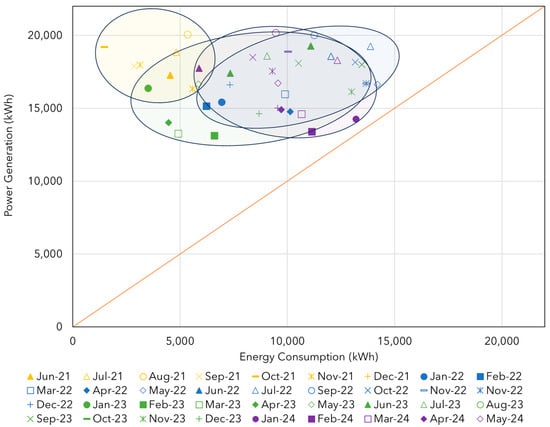
Figure 23.
Energy efficiency of the SIMA project under the real operating scenario.
The worst-case scenario occurred in December 2024, when the ratio between generation and consumption was 1.1 times, whereas the best-case scenario was observed in January 2023, when generation was approximately 4.68 times higher than consumption. Overall, energy generation exceeded consumption in both cases, resulting in a renewable energy surplus of 364.925 MWh supplied to the university.
5.3.2. 2º Case: Estimated Scenery
In the scenario where the EV loads are calculated according to the academic calendar, the project’s total load is expected to reach approximately 713 MWh, with 36% used to supply CEAMAZON and 64% consumed by the EVs.
Figure 24 presents the energy balance of the SIMA project based on the theoretical operating model, which excludes project implementation setbacks and possible technical or communication issues. Overall, it can be observed that the project loads exceed the photovoltaic system generation in most months. However, some exceptions stand out—for example, in June 2024, when generation surpassed load by 4224.76 kWh, and in October 2024, when load exceeded generation by 25,043.52 kWh. In several months, the estimated monthly consumption exceeds the monthly PV generation, indicating the need for energy supply from the grid.
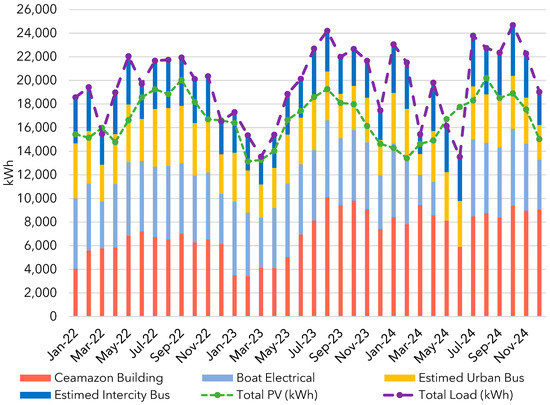
Figure 24.
Energy balance of the SIMA project under the estimated operating scenario.
The 2024 scenario is the most unfavorable in terms of energy balance, as negative differences between generation and consumption were identified: 83,930 kWh in 2022, 111,423.04 kWh in 2023, and 181,467.89 kWh in 2024. It is important to highlight that the implementation of the “Ubiratan” Cluster in 2023 was the main factor responsible for the increase in CEAMAZON’s load curve. As this is an estimated scenario, it serves as a warning for the project’s future, indicating the need to increase photovoltaic generation capacity, either through system expansion or by upgrading the PV modules’ nominal power, which are currently rated at 335 Wp.
In the project’s energy efficiency analysis, the second case is presented in Figure 25, where it can be seen that energy consumption exceeded energy generation during the last three years of the project, since during half of the first year, the modes were not in operation, demonstrating a large energy consumption source. These scenarios can be evaluated based on the orange line, which represents the break-even point between generation and consumption. Similarly to the first case, values below the orange line indicate that energy consumption exceeds energy generation.
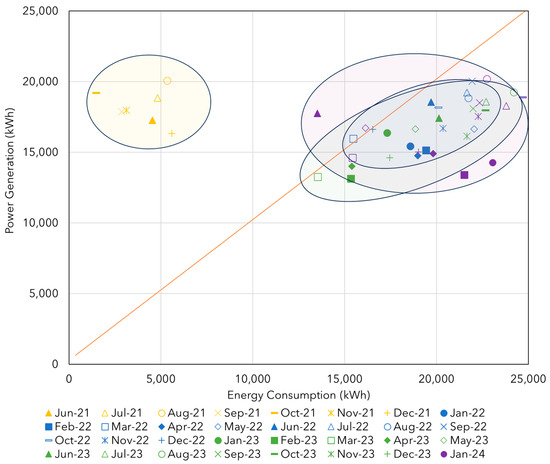
Figure 25.
Energy efficiency of the SIMA project in the estimated case.
The worst-case scenario occurred in January 2024, when the ratio between generation and consumption was 0.62, while the best-case scenario was observed in June 2024, when generation was approximately 1.31 times higher than consumption. Overall, the energy balance demonstrated that during the four years of SIMA project operation, energy generation surpassed consumption, resulting in a renewable energy surplus of 65,024.61 kWh.
6. Conclusions
This study evaluated the integrated energy and operational performance of the SIMA Project, an innovative Amazonian pilot that combines photovoltaic systems, lithium-ion storage, and electric mobility. The results confirm the technical feasibility of achieving a near net-zero energy balance at the campus scale when renewable generation, storage, and intelligent charging management are properly integrated.
In the real operating scenario, total consumption reached 369.67 MWh, with 70% corresponding to CEAMAZON and 30% to electric vehicles. Photovoltaic generation exceeded the load in most months, resulting in a renewable energy surplus of 364.93 MWh. In contrast, the estimated scenario, which considered full EV operation according to the academic calendar, projected a total load of 713 MWh, with 36% attributed to CEAMAZON and 64% to electric vehicles. Annual energy deficits of 83.93, 111.42, and 181.47 MWh were identified for 2022, 2023, and 2024, respectively. These findings highlight the need to expand the photovoltaic system or replace the existing 335 Wp modules to maintain a positive energy balance as transportation demand increases.
Overall, the project demonstrated that local renewable generation, supported by intelligent energy management and properly sized storage systems, can effectively sustain multimodal electric transport under tropical conditions. The SIMA initiative serves as a replicable reference model for low-carbon mobility and microgrid integration in isolated or developing regions, contributing to national strategies for energy transition, carbon neutrality, and sustainable development in the Amazon.
The results presented in this study demonstrate the need for integration between energy planning and sustainable transportation, since the more robust use of electric modes of transport causes an increase in the energy demand profile used by the campus. The operation of electric buses under tropical conditions showed that energy efficiency depends heavily on intelligent load management and the resilience of the system in the face of climate variations and even the quality of the network provided by the utility company.
The project highlights the potential for replicating decentralized electric mobility solutions in the Amazon region, where challenges related to infrastructure, logistics, and electrical connectivity are still critical for some subregions. Experiences such as the SIMA project can encourage regional plans for the electrification of public transport, promote decentralized energy transition programs, and guide policies to incentivize local renewable energy production.
Author Contributions
B.S.d.A. conceived the study and, together with A.L.L.d.N., developed the methodology, conducted the investigation, acquired and curated the data, performed the formal analyses, validated the results, and prepared the visualizations. B.S.d.A. and A.L.L.d.N. drafted the manuscript and led the editing. J.M.T. participated in the methodological design and investigation and contributed to the original draft—specifically the introduction and conclusion—and assisted with revisions. M.E.d.L.T., U.H.B., and C.C.M.d.M.C. contributed to the methodological design, provided resources, supervised the research activities, and oversaw project administration. All authors have read and agreed to the published version of the manuscript.
Funding
This study was supported by Norte Energia S.A., and funding was provided by Pró-Reitoria de Pesquisa e Pós-Graduação–PROPESP at the Federal University of Pará.
Data Availability Statement
The raw data supporting the conclusions of this article will be made available by the authors on request.
Acknowledgments
The authors would like to thank the support of the Pró-Reitoria de Administração (PROAD/UFPA), Projeto Gestão de Energia Elétrica (SISGEE/UFPA), Programa de Pós-Graduação em Engenharia Elétrica (PPGEE-UFPA), Centro de Excelência em Eficiência Energética da Amazônia (CEAMAZON), Coordenação de Aperfeiçoamento de Pessoal de Nível Superior (CAPES) and Norte Energia S.A., which made this work possible. ChatGPT 5.0 (OpenAI) was used solely to support translation and text revision. All technical content in the article was fully developed by the authors.
Conflicts of Interest
The authors declare no conflicts of interest. The authors declare that this study was supported by Norte Energia S.A. The funder was not involved in the study design, collection, analysis, interpretation of data, the writing of this article or the decision to submit it for publication.
References
- United Nations. Cumbre de las Naciones Unidas Sobre el Desarrollo Sostenible Naciones Unidas; United Nations: Rome, Italy, 2015.
- Tabora, J.M.; Paixão Júnior, U.C.; Rodrigues, C.E.M.; Bezerra, U.H.; Tostes, M.E.d.L.; Albuquerque, B.S.d.; Matos, E.O.d.; Nascimento, A.A.d. Hybrid System Assessment in On-Grid and off-Grid Conditions: A Technical and Economical Approach. Energies 2021, 14, 5284. [Google Scholar] [CrossRef]
- Chong, L.W.; Wong, Y.W.; Rajkumar, R.K.; Rajkumar, R.K.; Isa, D. Hybrid Energy Storage Systems and Control Strategies for Stand-Alone Renewable Energy Power Systems. Renew. Sustain. Energy Rev. 2016, 66, 174–189. [Google Scholar] [CrossRef]
- Tabora, J.M.; Daniel Melgar-Dominguez, O.; Amador, H.; de Lima Tostes, M.E.; de M.C., C.C.M.; Bezerra, U.H.; Soares, T.M. Energy Flexibility: A Systematic Review with a Perspective from Latin America. In Proceedings of the 2024 IEEE 42nd Central America and Panama Convention (CONCAPAN XLII), San Jose, Costa Rica, 27–29 November 2024; pp. 1–6. [Google Scholar]
- International Energy Agency. Global EV Outlook 2025—Analysis; IEA: Paris, France, 2025.
- Lobato, E.; Prazeres, L.; Medeiros, I.; Araujo Felipe and Rosario, D.; Cerqueira, E.; Tostes, M.; Bezerra, U.; Fonseca, W.; Antloga, A. A Monitoring System for Electric Vehicle Charging Stations: A Prototype in the Amazon. Energies 2023, 16, 152. [Google Scholar] [CrossRef]
- 4E Technology Collaboration Program of the International Energy Agency. Product Policy Framework for Demand Side: Case Studies; IEA: Paris, France, 2025.
- Zhang, S.; Hu, W.; Du, J.; Cao, X.; Bai, C.; Liu, W.; Wang, D.; Chen, Z. Hierarchical Distributionally Robust Scheduling Strategy for Distributed Energy Systems in the Energy-Sharing Environment. Appl. Energy 2025, 388, 125639. [Google Scholar] [CrossRef]
- Chen, X.; Liu, Y.; Fan, N.; Wu, L. An Operating Profit-Oriented Medium-Term Planning Method for Renewable-Integrated Cascaded Hydropower. Energy 2025, 338, 138686. [Google Scholar] [CrossRef]
- Tariq, A.H.; Amin, U. Peer-to-Peer Multi-Energy Trading in a Decentralized Network: A Review. Renew. Sustain. Energy Rev. 2025, 208, 114969. [Google Scholar] [CrossRef]
- Wang, L.; Wang, Z.; Li, Z.; Yang, M.; Cheng, X. Distributed Optimization for Network-Constrained Peer-to-Peer Energy Trading among Multiple Microgrids under Uncertainty. Int. J. Electr. Power Energy Syst. 2023, 149, 109065. [Google Scholar] [CrossRef]
- Wang, D.; Fan, R.; Yang, P.; Du, K.; Xu, X.; Chen, R. Research on Floating Real-Time Pricing Strategy for Microgrid Operator in Local Energy Market Considering Shared Energy Storage Leasing. Appl. Energy 2024, 368, 123412. [Google Scholar] [CrossRef]
- Hasan, M.K.; Mahmud, M.; Ahasan Habib, A.K.M.; Motakabber, S.M.A.; Islam, S. Review of Electric Vehicle Energy Storage and Management System: Standards, Issues, and Challenges. J. Energy Storage 2021, 41, 102940. [Google Scholar] [CrossRef]
- Wang, Y.; Wang, X.; Shao, C.; Gong, N. Distributed Energy Trading for an Integrated Energy System and Electric Vehicle Charging Stations: A Nash Bargaining Game Approach. Renew. Energy 2020, 155, 513–530. [Google Scholar] [CrossRef]
- Wang, Z.; Hou, H.; Zhao, B.; Zhang, L.; Shi, Y.; Xie, C. Risk-Averse Stochastic Capacity Planning and P2P Trading Collaborative Optimization for Multi-Energy Microgrids Considering Carbon Emission Limitations: An Asymmetric Nash Bargaining Approach. Appl. Energy 2024, 357, 122505. [Google Scholar] [CrossRef]
- Yang, X.; Zhou, F.; Xu, R.; Zhong, Y.; Yu, J.; Yang, H. Optimal Guidance Mechanism for EV Charging Behavior and Its Impact Assessment on Distribution Network Hosting Capacity. Processes 2025, 13, 3107. [Google Scholar] [CrossRef]
- International Energy Agency. Global EV Outlook 2024; IEA: Paris, France, 2024.
- Díaz-González, F.; Sumper, A.; Gomis-Bellmunt, O.; Villafáfila-Robles, R. A Review of Energy Storage Technologies for Wind Power Applications. Renew. Sustain. Energy Rev. 2012, 16, 2154–2171. [Google Scholar] [CrossRef]
- Luo, X.; Wang, J.; Dooner, M.; Clarke, J. Overview of Current Development in Electrical Energy Storage Technologies and the Application Potential in Power System Operation. Appl. Energy 2015, 137, 511–536. [Google Scholar] [CrossRef]
- BloombergNEF. Energy Storage Investments Boom as Battery Costs Halve in the Next Decade. Available online: https://about.bnef.com/insights/clean-energy/energy-storage-investments-boom-battery-costs-halve-next-decade/ (accessed on 18 October 2025).
- AL Shaqsi, A.Z.; Sopian, K.; Al-Hinai, A. Review of Energy Storage Services, Applications, Limitations, and Benefits. Energy Rep. 2020, 6, 288–306. [Google Scholar] [CrossRef]
- Dixon, J.; Bukhsh, W.; Bell, K.; Brand, C. Vehicle to Grid: Driver Plug-in Patterns, Their Impact on the Cost and Carbon of Charging, and Implications for System Flexibility. eTransportation 2022, 13, 100180. [Google Scholar] [CrossRef]
- Moreira, G.A.M.; Dos Reis, J.V.A.; Tabora, J.M.; De Vasconcelos, F.M.; Bezerra, U.H.; De Lima Tostes, M.E. Vehicle to Grid for Demand Response Optimization: A Case Study. In Proceedings of the 2024 IEEE International Humanitarian Technologies Conference (IHTC), Bari, Italy, 27–30 November 2024; pp. 1–6. [Google Scholar]
- International Energy Agency. Batteries and Secure Energy Transitions; International Energy Agency: Paris, France, 2024.
- Egbue, O.; Long, S. Barriers to Widespread Adoption of Electric Vehicles: An Analysis of Consumer Attitudes and Perceptions. Energy Policy 2012, 48, 717–729. [Google Scholar] [CrossRef]
- Associação Brasileira do Veículo Elétrico ABVE Data. Available online: https://abve.org.br/abve-data/ (accessed on 9 November 2025).
- Lunz, B.; Yan, Z.; Gerschler, J.B.; Sauer, D.U. Influence of Plug-in Hybrid Electric Vehicle Charging Strategies on Charging and Battery Degradation Costs. Energy Policy 2012, 46, 511–519. [Google Scholar] [CrossRef]
- Sovacool, B.K.; Axsen, J.; Kempton, W. The Future Promise of Vehicle-to-Grid (V2G) Integration: A Sociotechnical Review and Research Agenda. Annu. Rev. Environ. Resour. 2017, 42, 377–406. [Google Scholar] [CrossRef]
- Breetz, H.; Mildenberger, M.; Stokes, L. The Political Logics of Clean Energy Transitions. Bus Polit 2018, 20, 492–522. [Google Scholar] [CrossRef]
- Climate Watch. Historical GHG Emissions. Available online: https://www.climatewatchdata.org/ghg-emissions (accessed on 18 October 2025).
- Sprei, F. Disrupting Mobility. Energy Res. Soc. Sci. 2018, 37, 238–242. [Google Scholar] [CrossRef]
- Funke, S.Á.; Sprei, F.; Gnann, T.; Plötz, P. How Much Charging Infrastructure Do Electric Vehicles Need? A Review of the Evidence and International Comparison. Transp. Res. Part D Transp. Environ. 2019, 77, 224–242. [Google Scholar] [CrossRef]
- SAE J1772_201710; SAE Electric Vehicle and Plug in Hybrid Electric Vehicle Conductive Charge Coupler. SAE International: Warrendale, PA, USA, 2017.
- Agência Nacional de Energia Elétrica (ANEEL). Resolução Normativa No 1.000/2021; ANEEL: Bangalore, India, 2021.
- Lopes, J.A.P.; Soares, F.J.; Almeida, P.M.R. Integration of Electric Vehicles in the Electric Power System. Proc. IEEE 2011, 99, 168–183. [Google Scholar] [CrossRef]
- Fachrizal, R.; Shepero, M.; Meer, D.; Munkhammar, J.; Widen, J. Smart Charging of Electric Vehicles Considering Photovoltaic Power Production and Electricity Consumption: A Review. eTransportation 2020, 4, 100056. [Google Scholar] [CrossRef]
- Bhatti, A.; Salam, Z.; Ashique, R. Electric Vehicle Charging Using Photovoltaic Based Microgrid for Remote Islands. Proc. Energy Procedia 2016, 103, 213–218. [Google Scholar] [CrossRef]
- Mohammad, A.; Zamora, R.; Lie, T.T. Integration of Electric Vehicles in the Distribution Network: A Review of PV Based Electric Vehicle Modelling. Energies 2020, 13, 4541. [Google Scholar] [CrossRef]
- Costa, T.S.; Villalva, M.G. Technical Evaluation of a PV-Diesel Hybrid System with Energy Storage: Case Study in the Tapajós-Arapiuns Extractive Reserve, Amazon, Brazil. Energies 2020, 13, 2969. [Google Scholar] [CrossRef]
- Albuquerque, B.S.d.; Tostes, M.E.d.L.; Bezerra, U.H.; Carvalho, C.C.M.d.M.; Nascimento, A.L.L.d. Use of Distributed Energy Resources Integrated with the Electric Grid in the Amazon: A Case Study of the Universidade Federal Do Pará Poraquê Boat Using a Digital Twin. Machines 2024, 12, 803. [Google Scholar] [CrossRef]
Disclaimer/Publisher’s Note: The statements, opinions and data contained in all publications are solely those of the individual author(s) and contributor(s) and not of MDPI and/or the editor(s). MDPI and/or the editor(s) disclaim responsibility for any injury to people or property resulting from any ideas, methods, instructions or products referred to in the content. |
© 2025 by the authors. Licensee MDPI, Basel, Switzerland. This article is an open access article distributed under the terms and conditions of the Creative Commons Attribution (CC BY) license (https://creativecommons.org/licenses/by/4.0/).