1. Introduction
Distribution networks, as a vital component of power systems, play a crucial role in ensuring electricity supply. Rapid and effective fault location techniques for distribution networks are essential for enhancing operational maintenance standards, accelerating fault repair and restoration, and minimizing outage duration, frequency, and impact scope [
1]. Typical fault location methods include impedance-based techniques, traveling wave methods [
2], signal injection approaches, and various combinations thereof. Among these, the traveling wave method is unaffected by factors such as system parameters, compensation capacitors, line asymmetry, and transformer variations, and has been widely adopted in transmission grids.
However, traveling waves exhibit reflection phenomena at points of wave impedance discontinuity—such as fault locations and busbars—complicating propagation and making wavefront calibration challenging [
3]. To address this, Reference [
4] proposes a wavefront calibration method based on the HHT transform; Reference [
5] proposed a wavehead calibration method combining CEEMD and TEO operators; Reference [
6] introduced a wavehead calibration method based on the discrete wavelet transform. All these methods calibrate traveling waveheads. However, due to the weak characteristics of traveling waveheads and their susceptibility to noise interference and signal distortion, the positioning accuracy and algorithm robustness of the aforementioned methods are relatively poor.
Therefore, to address the shortcomings of the aforementioned methods, a Wave Energy Calculator (WEC) approach is proposed. This method extracts the overall energy variation characteristics of the traveling wave signal, calibrates the moment when its cumulative energy reaches a maximum, and thereby determines the arrival time difference of the traveling wave between the two end measurement points. Unlike traditional positioning methods that rely on wavefront calibration, this algorithm effectively circumvents issues of noise interference and signal distortion inherent in wavefront identification. Given the wave energy’s inherent characteristics of strong integrity and high interference resistance during propagation, the calibration method based on cumulative energy maxima offers superior robustness and accuracy, maintaining promising applicability even under complex operational conditions.
2. Algorithmic Principles
This paper employs Clarke transformation to decouple fault current signals collected at both ends of the line [
7], followed by analysis of the resulting traveling wave line mode components of the fault current.
2.1. VMD Optimization Algorithm
Variational Mode Decomposition (VMD) is a novel adaptive time-frequency analysis method developed in recent years [
8], primarily used to decompose complex non-stationary signals into multiple narrowband intrinsic mode functions (IMFs). VMD represents a significant advancement over Empirical Mode Decomposition (EMD). It not only possesses rigorous mathematical derivation but also demonstrates superior noise resistance and decomposition stability. Consequently, it finds extensive application in mechanical fault diagnosis, signal processing, seismic signal analysis, and financial data research.
The fundamental concept of VMD involves decomposing a signal into multiple sub-signals, each with finite bandwidth in amplitude-frequency characteristics and centered around a specific central frequency. Unlike EMD, which employs empirical filtering and envelope fitting, VMD transforms the decomposition problem into a variational optimization problem. It directly solves for the modes and center frequencies through mathematical optimization [
9], thereby reducing the effects of noise, endpoint effects, and mode overlap. The method for processing the mode components of fault-induced power line traveling waves is as follows.
- 1.
The VMD optimization model is:
and satisfy the optimization conditions:
In the equation: K denotes the number of modal decompositions; k denotes the index of the modal component; f(t) represents the modal component signal of the fault-induced traveling wave; uk denotes the kth modal component after decomposition; ωk denotes the center frequency of the kth modal component after decomposition; δk denotes the Dirac delta function; ∗ denotes the convolution operation symbol.
- 2.
To address the optimization problem, VMD employs the Lagrange multiplier method to transform constraints into unconstrained form. By introducing the Lagrange multiplier λ(t) and a quadratic penalty factor α, an augmented expression is obtained, namely:
- 3.
Perform a second optimization using the alternating direction method with the multiplication operator, transforming uk, ωk, and λ to the frequency domain for alternating iterations, namely:
Terminate iteration when Equation (7) is satisfied to obtain the optimal solution:
In the equation: s denotes the iteration count; represents the Wiener filter for the modal component; is the Fourier transform of ; is the Fourier transform of ; denotes the center frequency after modal component Wiener filtering; represents the updated Lagrange operator; is the update parameter for the Lagrange operator; is the convergence accuracy, set to 0.01.
The optimized VMD results are shown in
Figure 1. In
Figure 1a, the three-dimensional plot illustrates the amplitude distribution of the decomposed signal components over time. The VMD separates the original waveform into several intrinsic mode functions (IMFs) and a residual term, each corresponding to specific frequency characteristics. As shown in
Figure 1b, the high-frequency IMF captures the transient oscillations generated by the fault inception, while the residual represents the low-frequency trend of the original signal. The clear separation between these components demonstrates the effectiveness of VMD in isolating fault-related features, which provides a solid basis for subsequent time–frequency analysis and fault location.
2.2. Basic Principles of the WEC Algorithm
Traditional traveling wave localization methods heavily rely on the precise calibration of wavefront arrival times [
10]. However, due to factors such as small wavefront amplitudes, noise, and multipath propagation, their positioning accuracy and robustness remain inadequate. To overcome these limitations, this paper proposes a novel fault location method based on cumulative energy feature analysis—the Wave Energy Calculator (WEC) algorithm. This approach processes the square-sum sliding window integral of the line-mode component signal from the power line traveling wave to derive a stable cumulative energy variation curve, enabling precise fault location.
The core concept of the WEC algorithm is to construct an energy accumulation curve by utilizing the energy jump characteristics of the line mode component of the electric wavefront after excitation at the fault point, thereby achieving fault location through inflection point analysis.
WEC consists of the following two steps:
- 1.
To enhance the amplitude characteristics of the line-mode component signal in the electrical current and eliminate the influence of polarity, the current line-mode component iTW is squared to obtain the amplitude characteristic signal s(t):
Following this change, the transient fluctuations in the traveling wave signal transform into more pronounced amplitude changes, facilitating subsequent energy feature extraction.
- 2.
Perform sliding window integration on the square-of-the-amplitude waveform signal s(t) to obtain the cumulative energy curve of the line-mode component of the current waveform. Select an appropriate window size T, with the integration step size being the sampling interval Δt. The cumulative energy at time t is then:
In the discrete case, if the sampling rate is
fs and the window size is
N samples, the expression for the energy signal is:
This energy signal exhibits a distinct step change when the traveling wave signal fully passes through the measurement point, representing the peak of energy accumulation.
This approach replaces traditional methods for calibrating traveling wavefronts, thereby circumventing issues where wavefront identification is susceptible to noise interference and signal distortion. It enhances the algorithm’s resistance to interference and improves its universality.
3. Principles of Dual-End Traveling Wave Ranging
Traveling wave positioning methods are generally categorized into single-end, dual-end, and triple-end approaches [
11]. Among these, the single-end method is susceptible to refraction and reflection effects and struggles to distinguish the second arrival time of the wavefront. While the triple-end method incorporates an additional measurement unit, it incurs higher clock synchronization costs with only marginal improvements in accuracy [
12]. Therefore, this paper selects the dual-end traveling wave positioning method for investigation, as it is the most widely applied and universally applicable.
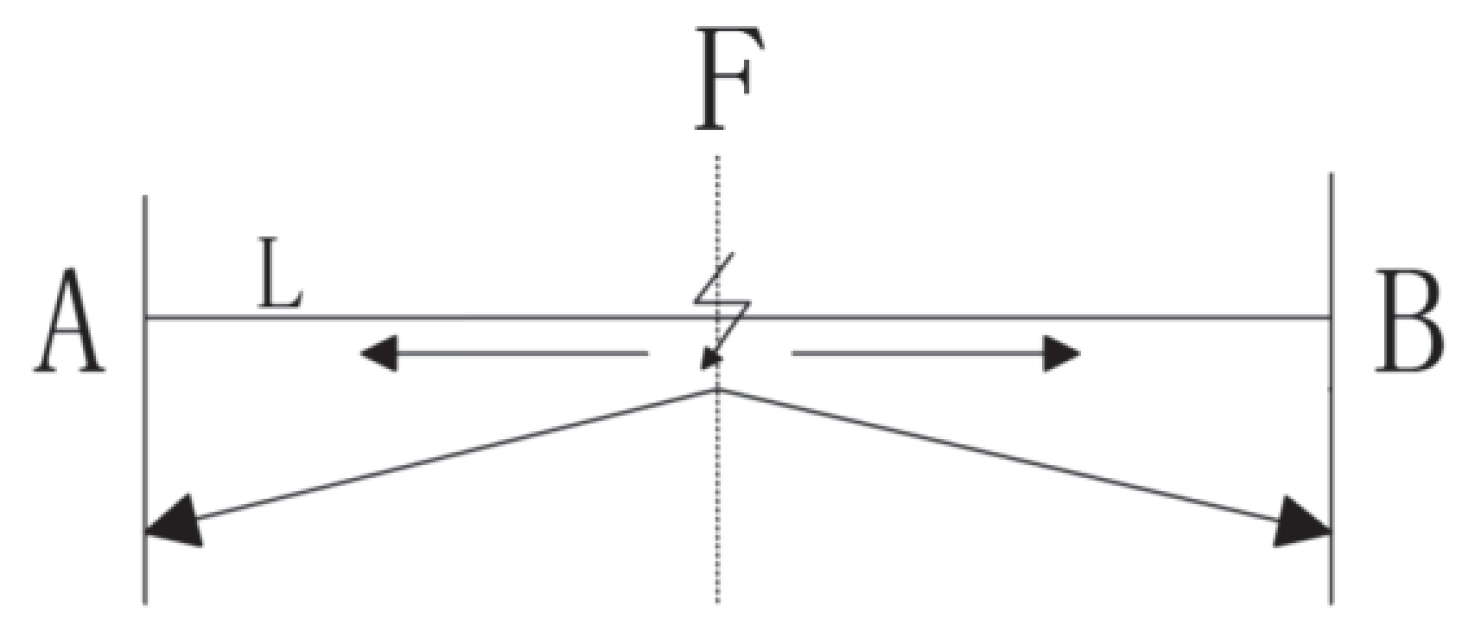
Figure 2 illustrates the principle diagram of the double-ended traveling wave fault location method. Points A and B represent the two ends of the line, where the measuring units are installed. F denotes the fault location, and L is the length of the power distribution line. When a fault occurs at point F, a fault traveling wave is generated at the fault point F and propagates along the line toward points A and B. Let
TFA and
TFB denote the times taken for the traveling wave to reach measurement points A and B, respectively, at the same propagation speed
v [
13]. When the fault occurs between A and B, the distance measurement formula is:
As shown in Equation (11), the double-ended traveling wave distance measurement method requires only the time difference between the first arrival of the fault traveling wave at the two measurement terminals to calculate the distance from the fault point to both terminals. Traditional traveling wave localization methods typically rely on precisely calibrating the time of the traveling wave front’s first arrival at both measurement terminals to determine the time difference. However, due to the small amplitude and indistinct characteristics of the traveling wave front, coupled with its susceptibility to noise and system disturbances in complex power system environments, traditional localization methods face significant challenges in practical engineering applications.
To address these issues, a dual-terminal distance measurement method based on wave body energy localization is proposed. This approach calculates the cumulative energy of the entire traveling wave and identifies the point where cumulative energy reaches its maximum as the wave’s arrival time at the measurement terminal. This yields the time difference between the two terminals, replacing the wavefront time difference used in traditional localization methods. Unlike traditional positioning methods that rely on calibrated wavefront algorithms, wave body energy positioning fully leverages the stable overall characteristics of traveling wave signals. The process flow of the traveling wave distance measurement method for distribution network lines proposed in this paper is shown in
Figure 3. This approach significantly enhances ranging accuracy, providing reliable support for precise fault location in complex operational conditions.
4. Case Study Analysis
4.1. Simulation Model
A fault model for a 10-km overhead distribution line operating at 10 kV was constructed in the MATLAB/Simulink simulation platform, as shown in
Figure 4. The simulation was set to start at 0 s, run for 0.22 s, with a sampling frequency of 1 MHz and a fault duration of 0.003 s. Distribution line distributed parameters are shown in
Table 1.
4.2. Simulation Analysis
During simulation, the fault type was set as a Phase A ground fault with a ground resistance of 100 Ω. The fault location was set 3 km from the front end, with a fault duration of 0.85 to 0.88 s. The traveling wave velocity was 2.8994 × 10⁵ km/s.
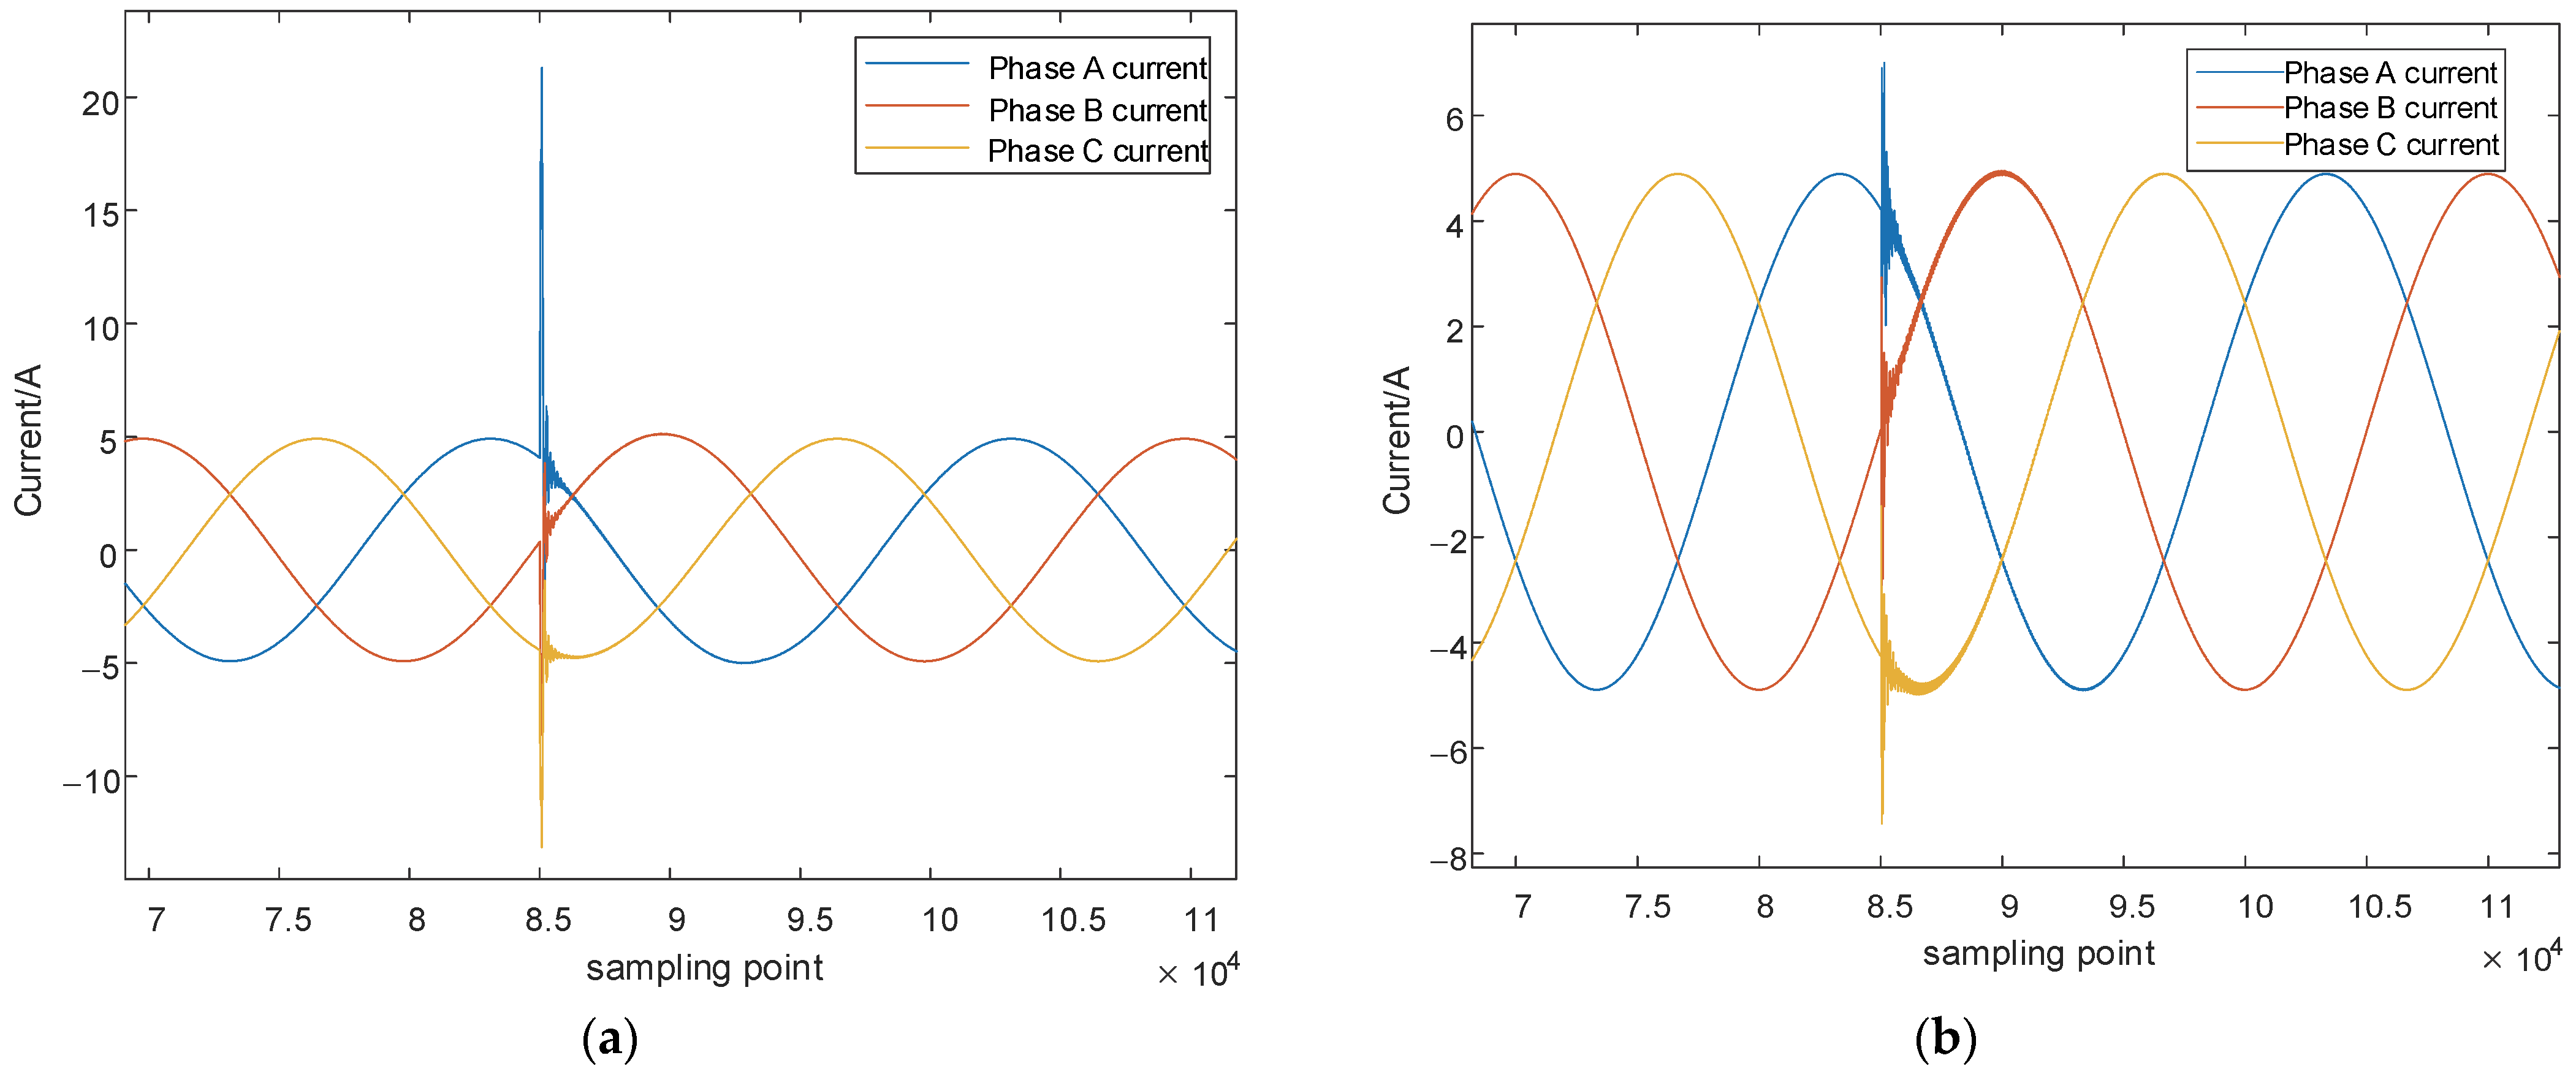
At both measurement terminals, three-phase current and voltage fault waveforms can be obtained. Since voltage traveling waves experience significant attenuation during propagation and are difficult to measure in practical engineering scenarios, while current traveling waves exhibit amplification during transmission, current traveling waves are commonly analyzed in traveling wave distance measurement.
Figure 5 shows the three-phase current waveforms at both terminals when a ground fault occurs on Phase A.
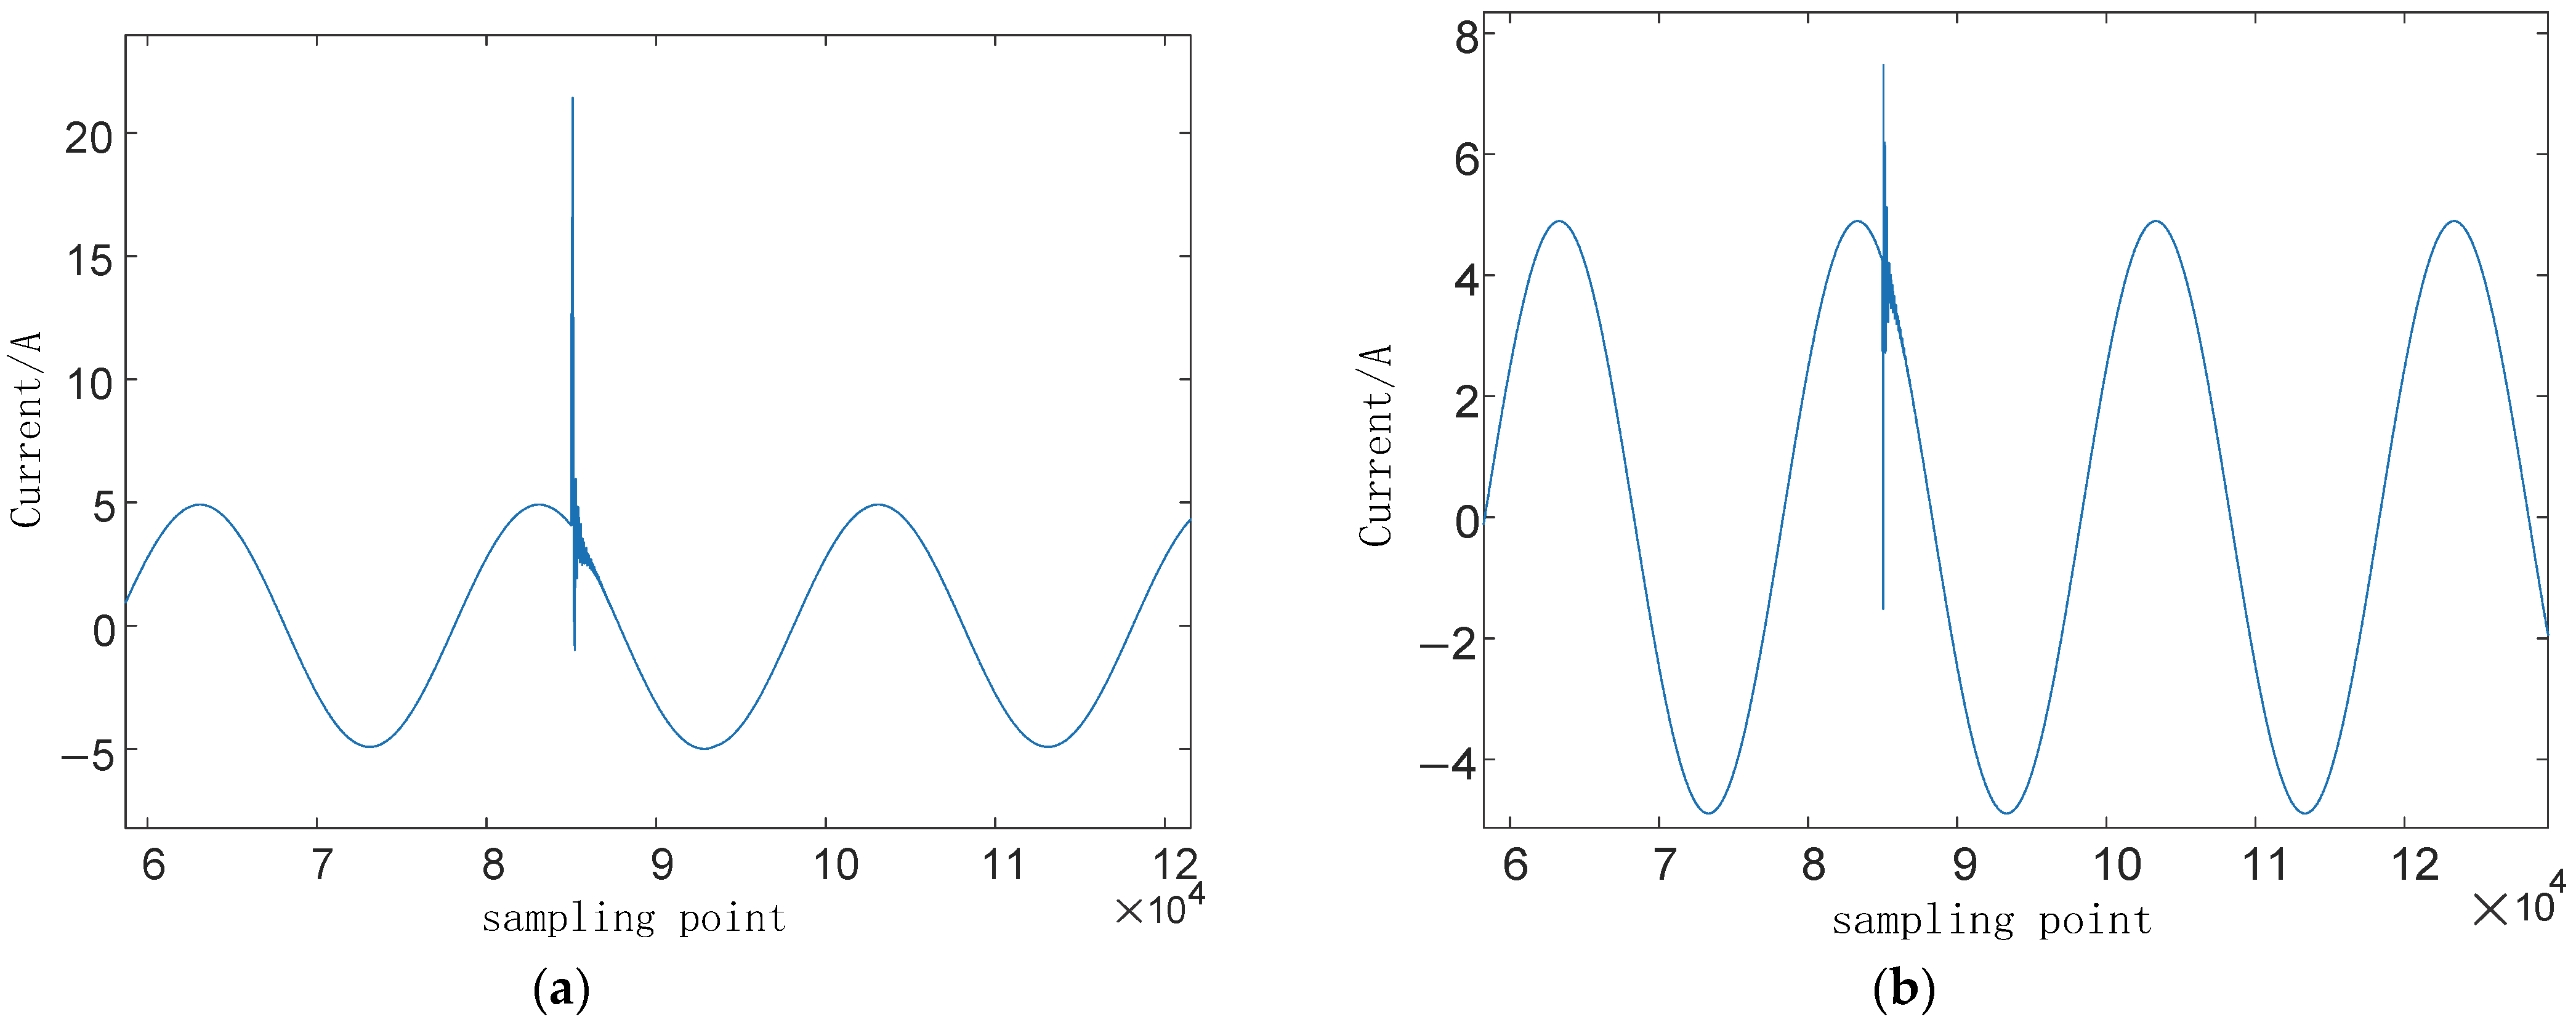
Figure 6 displays the line-model current signals at both terminals after Clarke transformation.
First, the low-frequency components of the line-mode current signals at both ends were removed using VMD, yielding the IMF1 component results shown in
Figure 7.
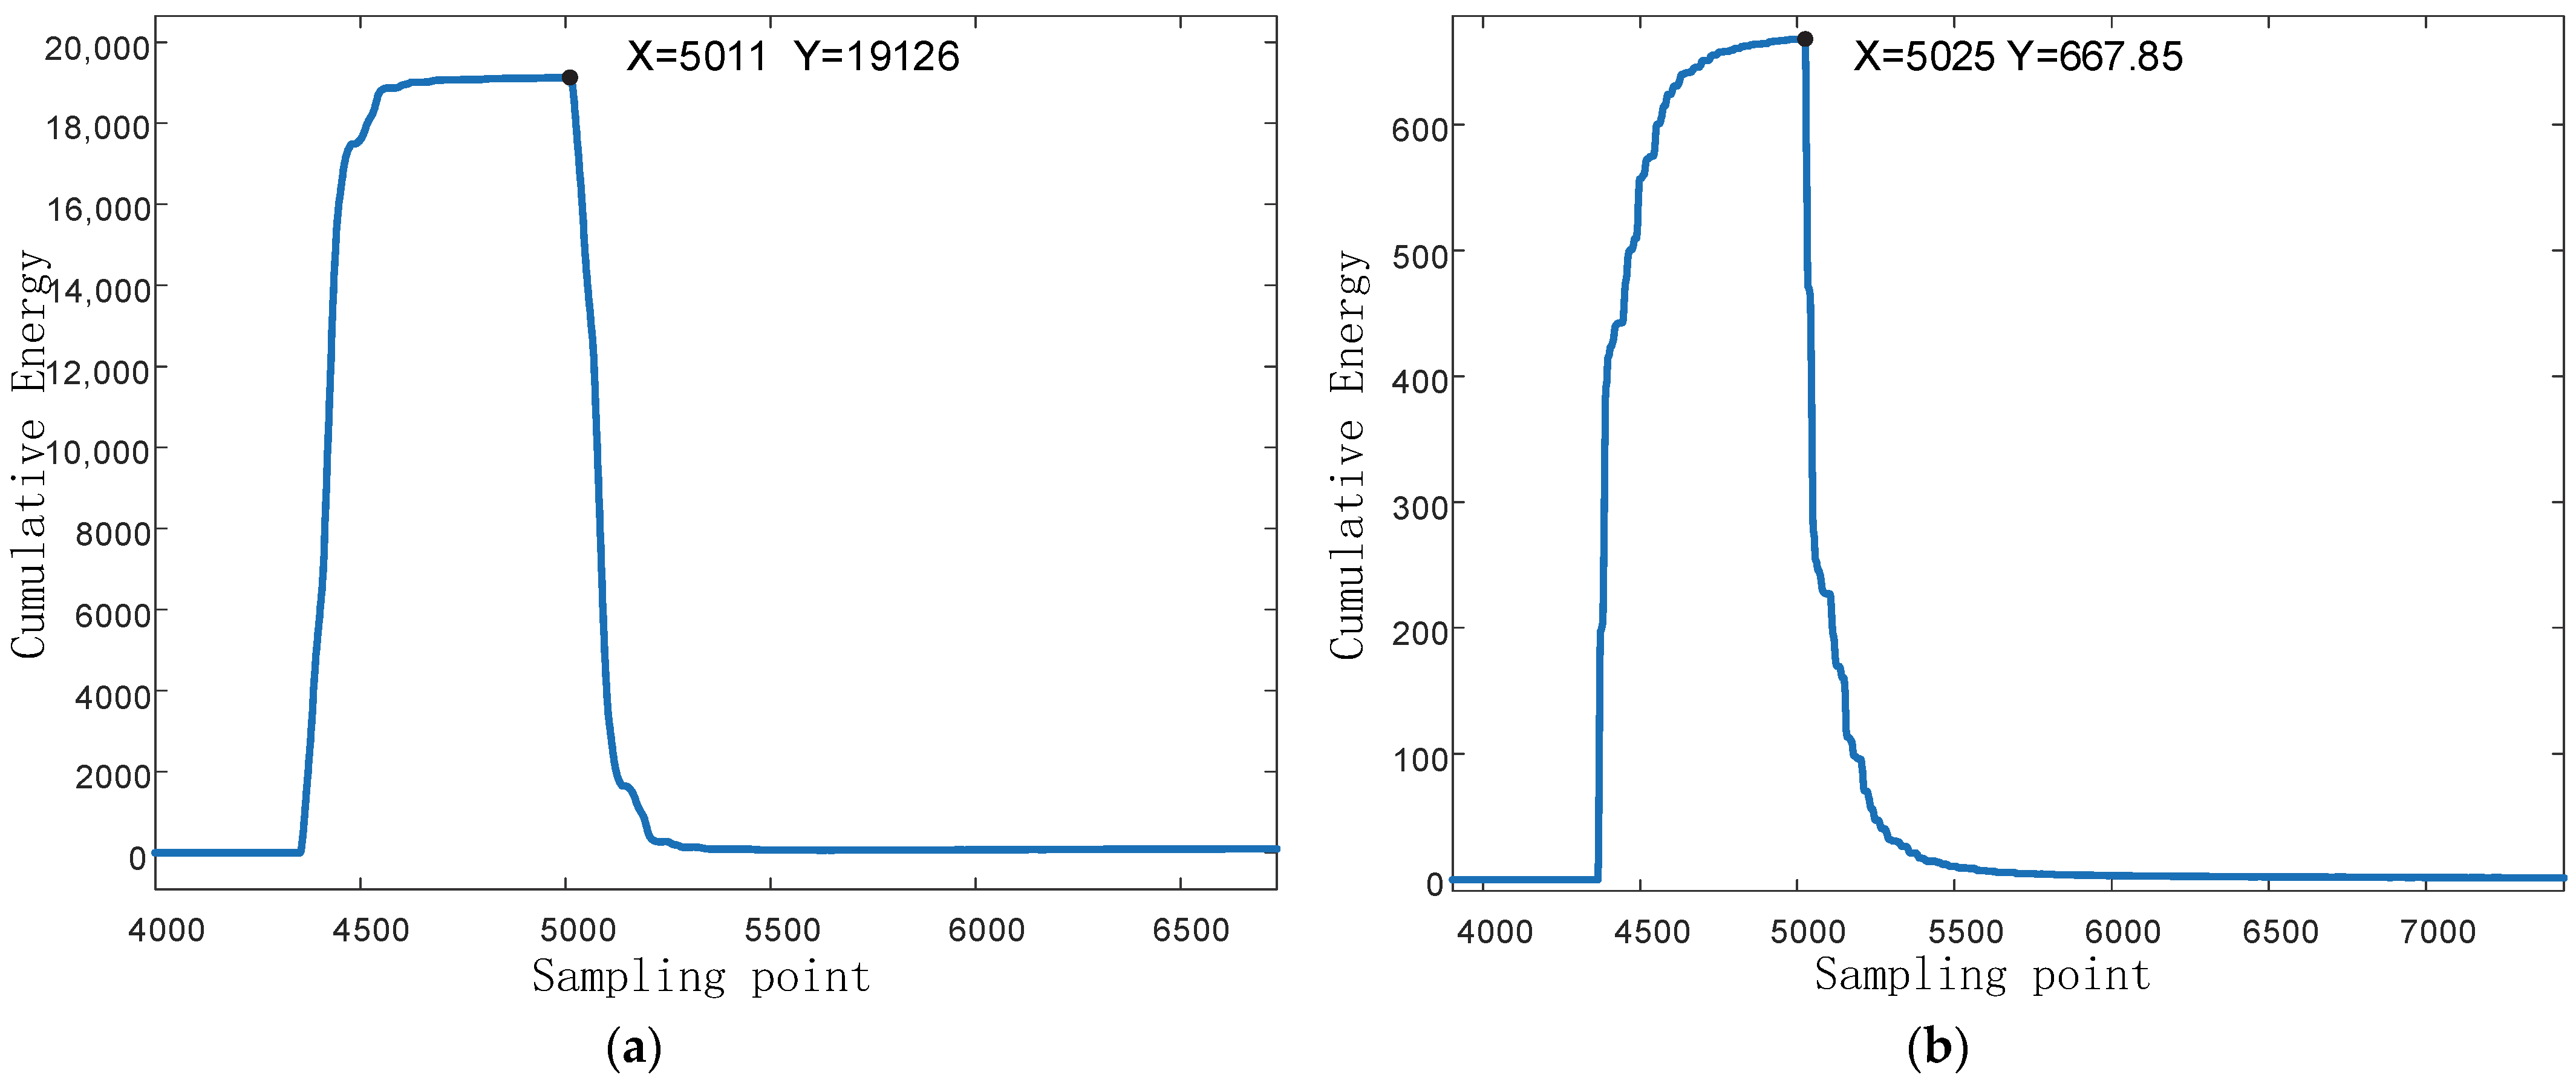
The IMF1 signal obtained after processing the two-end line model signal through VMD is calibrated using the WEC method to determine the instant of maximum cumulative energy when the traveling wave reaches the two measurement points. This replaces the traditional traveling wave ranging method for calibrating the wavefront. As shown in
Figure 8, the specified sampling points correspond to the moment when the cumulative energy curve reaches its peak growth rate, indicating the arrival of the initial traveling wave at each terminal. Substituting these detected arrival times into the two-terminal traveling wave ranging equation yields the final fault location results.
To analyze the reliability of the proposed traveling wave fault location method, the relative error e is introduced to describe the discrepancy between the location result
D and the actual fault distance
LAF. The formula for calculating the relative error e is:
Under this simulation result, with L = 10 km, Equation (12) yields e = 0.2958%. The aforementioned experimental results validate the effectiveness of the proposed method.
4.3. Impact of Fault Conditions on Positioning Results
To validate the universality of the proposed traveling wave fault location method, simulation analyses were conducted under different fault conditions while keeping other parameters constant.
- 1.
Impact of Phase Angle on Fault Location During Fault Occurrence.
Consider a single-phase 100 Ω ground fault occurring 3 km from the line’s starting point with initial phase angles close to 0°, 30°, 60°, and 90°. The location results under different phase angles are shown in
Table 2.
- 2.
Impact of Fault Type on Location Results.
Consider a single-phase ground fault (AG), two-phase ground fault (ABG), phase-to-phase fault (AB), and three-phase short circuit (ABC) occurring 3 km from the line’s starting point. For ground faults, the ground resistance is 100 Ω. The location results for different fault types are shown in
Table 3.
- 3.
Impact of Grounding Resistance on Location Results.
Assuming a single-phase ground fault occurs 3 km from the line’s starting point, with grounding resistances of 0 Ω, 100 Ω, 300 Ω, 500 Ω, and 1000 Ω. The location results under different grounding resistances are shown in
Table 4.
- 4.
Impact of Fault Location on Location Results.
Consider single-phase ground faults with a ground resistance of 100 Ω occurring at distances of 2 km, 3 km, 4 km, and 5 km from the line’s starting point. The location results for different fault positions are shown in
Table 5.
As shown in
Table 2,
Table 3,
Table 4 and
Table 5, the proposed method is largely unaffected by initial phase angle, fault type, and ground resistance. While it exhibits sensitivity to changes in fault location, the relative error remains within an acceptable range of 1.5%. This translates to a positioning error of less than 150 m for a 10-km-long line.
4.4. Method Comparison
To validate the practicality and feasibility of the proposed method, simulations were conducted comparing it with the traditional EMD + TEO operator approach under different fault distances and fault types, while maintaining a constant ground resistance of 1000 Ω. The distance measurement results are shown in
Table 6.
The above experiments demonstrate that the proposed method achieves higher localization accuracy when used for fault location.
5. Conclusions
To address the weak traveling wave front characteristics commonly observed in distribution lines, this study proposes a novel fault location method based on traveling wave bodies rather than wavefronts. The proposed methodology combines Variational Mode Decomposition (VMD) with Wavelet Energy Calibration (WEC) to accurately extract the characteristic component of the traveling wave and identify the arrival instant at both terminals. By focusing on the traveling wave body, the method effectively avoids the instability of traditional wavefront detection, thereby improving detection reliability and simplifying signal processing.
Simulation and experimental results demonstrate that the proposed approach achieves high fault-location accuracy under various conditions, including different fault distances, initial phases, grounding resistances, and fault types. Compared with traditional wavefront-based methods, the proposed technique shows superior robustness and lower sensitivity to noise and waveform distortion, as evidenced by the comparative analysis presented in the tables. These findings confirm the method’s strong practicality and engineering applicability, providing a promising alternative for accurate fault location in modern distribution networks.
Author Contributions
Conceptualization, S.H. and Z.Z.; methodology, S.H.; software, Z.Z.; validation, S.H. and Z.Z.; formal analysis, S.H.; investigation, Z.Z.; resources, S.H. and Z.Z.; data curation, Z.Z.; writing—original draft preparation, S.H. and Z.Z.; writing—review and editing, Z.Z. and X.S.; visualization, Z.Z. and X.S.; supervision, S.H.; project administration, S.H.; funding acquisition, S.H. All authors have read and agreed to the published version of the manuscript.
Funding
This work was supported by State Grid Shanxi Electric Power Company: Research on fault type identification and localization technology of distribution network based on multi-dimensional features, grant number 5205MM0230008.
Data Availability Statement
The original contributions presented in this study are included in the article. Further inquiries can be directed to the corresponding author.
Conflicts of Interest
The authors declare that this study received funding from State Grid Shanxi Electric Power Company. The funder was not involved in the study design, collection, analysis, interpretation of data, the writing of this article, or the decision to submit it for publication. The authors declare no conflicts of interest.
References
- Hou, S.-Z.; Guo, W.; Wang, Z.-Q.; Liu, Y.-T. Deep-Learning-Based Fault Type Identification Using Modified CEEMDAN and Image Augmentation in Distribution Power Grid. IEEE Sens. J. 2022, 22, 1583–1596. [Google Scholar] [CrossRef]
- Banerjee, T.; Miao, Z.; Fan, L. Traveling Wave Based Fault Location Methods: Review and Demonstration. In Proceedings of the 2023 North American Power Symposium (NAPS), Asheville, NC, USA, 15–17 October 2023; pp. 1–6. [Google Scholar]
- da Silva França, R.L.; da Silva Júnior, F.C.; Honorato, T.R.; Ribeiro, J.P.G.; Costa, F.B.; Lopes, F.V.; Strunz, K. Traveling wave-based transmission line earth fault distance protection. IEEE Trans. Power Deliv. 2020, 36, 544–553. [Google Scholar] [CrossRef]
- Guo, X.; Tao, C.; Li, T.; Zhuo, Q.; Bai, X. Fault Location of Multi-Point Hybrid Transmission Line Based on HHT. J. Appl. Sci. Eng. 2023, 26, 1731–1738. [Google Scholar]
- Tian, S.; Zhou, L.; Sun, Y. A Power Cable Fault Location Method Based on CEEMD and TEO. Meas. Control. Technol. 2022, 2022, 113–117. (In Chinese) [Google Scholar] [CrossRef]
- Jimenez-Aparicio, M.; Reno, M.J.; Hernandez-Alvidrez, J. Fast traveling wave detection and identification method for power distribution systems using the discrete wavelet transform. In Proceedings of the 2023 IEEE Power & Energy Society Innovative Smart Grid Technologies Conference (ISGT), Washington, DC, USA, 16–19 January 2023; pp. 1–5. [Google Scholar]
- Dobrucky, B.; Benova, M.; Spanik, P. Using complex conjugated magnitudes-and orthogonal park/clarke transformation methods of dc/ac/ac frequency converter. Elektron. Elektrotechnika 2009, 93, 29–34. [Google Scholar]
- Oliveira, A.P.; Moreira, F.A.; Picanço, A.F. Accuracy analysis using the EMD and VMD for two-terminal transmission line fault location based on traveling wave theory. Electr. Power Syst. Res. 2023, 224, 109667. [Google Scholar] [CrossRef]
- Lu, Z.; Wang, Z.; Yan, X. Research Progress in Application of Variational Mode Decomposition Method in Bearing Fault Diagnosis. Lubr. Eng. 2024, 49, 178–190. (In Chinese) [Google Scholar]
- Li, Z.; Mao, J.; Luo, C.; Sun, Y.; Zheng, C.; Chen, Z. Teager–Kaiser Energy Operator-Based Short-Circuit Fault Localization Method for Multi-Circuit Parallel Cables. Energies 2025, 18, 2432. [Google Scholar] [CrossRef]
- Mosavi, M.R.; Tabatabaei, A.; Farajiparvar, P. Stability comparison of fault location techniques against faulty GPS time tagging for three-terminal lines. Arab. J. Sci. Eng. 2017, 42, 2739–2749. [Google Scholar] [CrossRef]
- Cao, W.; Zhang, F.; Chen, X.; Zhang, B.; Li, J.; Xu, M. A Study on Fault Localization Method of Three-Terminal Multi-Section Overhead Line–Cable Hybrid Line Using MEEMD Combined with Teager Energy Operator Algorithm. Processes 2024, 12, 1360. [Google Scholar] [CrossRef]
- Wang, H.; Qi, Z.; Chen, B.; Zhang, K.; Li, W.; Dong, Q.; Dong, X. Eliminating the dependence of GPS or communication latency estimation in traveling wave based double-terminal fault location. IEEE Trans. Power Deliv. 2023, 38, 3792–3803. [Google Scholar] [CrossRef]
| Disclaimer/Publisher’s Note: The statements, opinions and data contained in all publications are solely those of the individual author(s) and contributor(s) and not of MDPI and/or the editor(s). MDPI and/or the editor(s) disclaim responsibility for any injury to people or property resulting from any ideas, methods, instructions or products referred to in the content. |
© 2025 by the authors. Licensee MDPI, Basel, Switzerland. This article is an open access article distributed under the terms and conditions of the Creative Commons Attribution (CC BY) license (https://creativecommons.org/licenses/by/4.0/).


